an initial field trial of an instrument for measuring ... · learning. leading.® an initial field...
TRANSCRIPT
Listening. Learning. Leading.®
An Initial Field Trial of an Instrument for Measuring
Learning Strategies of Middle School Students
Ou Lydia Liu
Teresa Jackson
Guangming Ling
February 2008
ETS RR-08-03
Research Report
An Initial Field Trial of an Instrument for Measuring
Learning Strategies of Middle School Students
Ou Lydia Liu, Teresa Jackson, and Guangming Ling
ETS, Princeton, NJ
February 2008

As part of its educational and social mission and in fulfilling the organization's nonprofit charter
and bylaws, ETS has and continues to learn from and also to lead research that furthers
educational and measurement research to advance quality and equity in education and assessment
for all users of the organization's products and services.
ETS Research Reports provide preliminary and limited dissemination of ETS research prior to
publication. To obtain a PDF or a print copy of a report, please visit:
http://www.ets.org/research/contact.html
Copyright © 2008 by Educational Testing Service. All rights reserved.
ETS, the ETS logo, and LISTENING. LEARNING. LEADING. are registered trademarks of Educational Testing Service (ETS).

Abstract
Learning strategies have been increasingly recognized as a useful tool to promote effective
learning. In response to the lack of available learning strategies measures for middle school
students, this study designed an instrument for these students, assessing behavioral, cognitive,
and metacognitive strategies. This instrument, the Middle School Learning Strategies (MSLS)
scale, is examined in terms of factorial structure, reliability, and correlates. Three factors emerge
from the analyses: effective strategies, help seeking, and bad habits. The subscales displayed a
reasonable reliability, ranging from .70 to .87. Student grades in language arts, social studies,
math, and science were collected as criterion variables. As expected, grades in these four
subjects correlated positively with both effective strategies and help seeking, yet negatively with
bad habits. As a pilot measure, this instrument has demonstrated promising features as a useful
tool for students to evaluate and enhance their learning strategies.
Key words: Learning strategies, factor analysis, parallel analysis, middle school students
i

Acknowledgments
We would like to thank the following colleagues who were involved in instrument development,
data collection, data analyses, or provided valuable suggestions and comments on an earlier draft
of this paper: Malcolm Bauer, Dan Eignor, Nan Kong, Patrick Kyllonen, Jihyun Lee, Madeline
Goodman, Margaret Redman, Lazar Stankov, and Larry Stricker. We also gratefully thank Kim
Fryer for her editorial assistance.
ii
Table of Contents
Page
Introduction..................................................................................................................................... 1
Definition and Taxonomies of Learning Strategies.......................................................... 1
The Link Between Strategy Use and Learning Outcomes ............................................... 3
Assessing Learning Strategies: Available Measures........................................................ 4
Objectives of This Study .................................................................................................. 5
Method ............................................................................................................................................ 5
Instrument Development .................................................................................................. 5
Procedure........................................................................................................................ 10
Participants ..................................................................................................................... 10
Analyses ......................................................................................................................... 10
Results........................................................................................................................................... 11
Dimensionality Investigation.......................................................................................... 11
Correlation With Course Grades .................................................................................... 13
Gender and Grade Differences in Strategy Use ............................................................. 14
Conclusion and Discussion ........................................................................................................... 14
References..................................................................................................................................... 17
iii
Introduction
The relatively poor performance of U.S. students in international studies (e.g., Trends in
International Mathematics and Science Study (TIMSS; Beaton et al., 1996; Mullis et al., 1997),
Programme of International Student Assessment (PISA; Organization for Economic Co-
operation and Development [OECD], 2000, 2004) has signaled the need to improve the academic
achievement among middle school students. Efforts to cultivate effective and strategic learners
have received heightened levels of attention. The practice of appropriate learning strategies has
shown a positive impact on various academic outcomes (Hong, Sas, & Sas, 2006; McInerney,
McInerney, & Marsh, 1997; Williams & Worth, 2003). Therefore, it is critical to develop tools
that provide valid and reliable measurement of learning strategies that may enhance the way
students process new information and acquire new knowledge. However, among the available
instruments for learning strategies, very few have been created to understand the learning
processes and strategy use of middle school students. Early recognition of weaknesses and
strengths in learning strategy use is likely to increase student learning awareness and provide
opportunities for educators to emphasize learning strategies in instruction. In response to this
need, this study developed an instrument to measure the multiple aspects of learning strategies
for middle school students. This instrument was pilot tested with 240 middle school students.
The present paper documents the design and development of this instrument, and the initial
investigation of the psychometric properties of the pilot tested items.
Definition and Taxonomies of Learning Strategies
Learning strategies have been a well-documented and extensively discussed topic in the
literature. Learning strategies refer to the activities that students use to best approach new
information and maximize experiences in their own learning style. These strategies include
tactics such as organizing, transforming, rehearsing, memorizing, goal setting, planning, record
keeping, monitoring, help seeking, and reviewing academic material (Zimmerman & Martinez-
Pons, 1990)
Some broad taxonomies have been proposed to capture the many dimensions of learning
strategies. Theories of learning agree that students actively promote their academic achievement
in cognitive, noncognitive, metacognitive, and behavioral ways; selecting learning strategies
based on their perceptions of self-efficacy. Students closely monitor the learning process and
adjust their approach to learning on the basis of subject manner, efforts, and behavioral outcomes
1

(Zimmerman & Martinez-Pons, 1990). These taxonomies are not expected to uniquely define
each learning strategy, as one strategy could overlap into another category.
Cognitive strategies include activities that aid in the memorization and rehearsal of newly
acquired things, assist in the application of new knowledge to situations that are most
appropriate, help with the organization of discrete pieces of information, and translate
information into a system that is conducive to understanding (Hong et al., 2006; Kitsantas,
2002). Noncognitive strategies include using characteristics such as self-motivation, self-
discipline, self-efficacy, and attribution to assist in learning. Studies have demonstrated that
noncognitive strategies may have a profound impact on student achievement outcomes
(Duckworth & Seligman, 2005; Eshel & Kohavi, 2003; Wolters, 1999). Metacognitive strategies
include activities that involve self-monitoring of the learning process, evaluation of learning
strengths and weaknesses, and use of self-reflection at the end of the learning process (May
1994). The importance of metacognitive strategies is highlighted by their ability to enable
learners to evaluate and adjust their own learning strategies accordingly (Oster, 2001). Although
cognitive and metacognitive skills are imperative to successfully complete a task, it is important
to note a striking difference between the two. Indeed, cognitive skills are necessary for task
improvement; however, the metacognitive piece enables an understanding of how a task was
performed (Schraw, 1998). Thus, metacognitive strategies enable learners to regulate and
improve performance, enhance strategies and resources, and increase learning awareness
(Schraw, 1998). Finally, behavioral learning strategies include activities such as taking notes in
class, developing mechanisms to ensure homework completion, controlling and adjusting the
environment for better engagement, and actively help seeking when encountering difficulties in
cognitive processing.
Although the taxonomies have distinct features, each is frequently integrated with another
for utility. Behavioral strategies, such as environmental control, have been found to be
significantly correlated with cognitive (i.e., rehearsal, elaboration) and metacognitive (i.e.,
monitoring and planning) strategies (Wolters, 1999). The relationship between the various
learning strategies may be an indication of the complex nature of academic challenges—usually
more than one strategy is needed to achieve a certain learning goal.
2
The Link Between Strategy Use and Learning Outcomes
Previous studies have attempted to establish the link between strategy use and
achievement outcomes. It has been found that students who implement appropriate learning
strategies to sustain and increase their efforts and persistence in academic tasks are able to
identify their learning goals and work effectively (Harrison, Andrews, & Saklofske, 2003). For
instance, use of cognitive strategies, such as organizing and rehearsing, was reported to have
significant positive correlations with math achievement (Eshel & Kohavi, 2003). The impact of
strategy use on student academic performance is reflected through the differentiation between
high and low achievers; that is, these groups usually rely on different strategies for higher level
tasks. To achieve academic goals, successful students usually use a repertoire of effective
learning strategies, such as taking control of their learning environment, remaining engaged, and
managing motivation throughout the learning process (McCann & Turner, 2004). Competent
users of learning strategies assess and utilize the environment to their advantage, readily
selecting the strategies that are most effective for a particular task (Zimmerman & Martinez-
Pons, 1990). High-achieving students are more able to accommodate their surroundings, manage
time effectively, and seek help more frequently than low achievers. High achievers are also more
likely to engage in strategies such as reviewing, problem-solving, note-taking, and managing the
study environment (Hong et al., 2006).
Zimmerman and Martinez-Pons (1990) conducted a study on strategy use among 90
gifted and 90 nongifted 5th, 8th, and 11th grade students. Compared with nongifted students, the
gifted students tended to rely on learning strategies such as organizing, transforming, regulating
behaviors, seeking help from peers and parents, and reviewing notes. Similarly, Hau and Hui
(1996) found that high achievers, in a sample of 194 Chinese 7th grade students, were more
inclined to use learning strategies that involved deep understanding, rather than rely on simplistic
and surface strategies such as memorization. Other researchers have echoed these findings,
noting that high achieving students are more likely to review and compare notes, partake in self-
quizzing, goal-set, organize and transcribe notes, seek help, and use deductive reasoning
(Kitsantas, 2002; Parham, 1997). Low achievers tend to fixate on rehearsal strategies, avoiding
the more advanced, elaborative, and organizational strategies (Kitsantas). High achieving
students tend to take time to think about and evaluate the strategies they use, while low achieving
3

students are unable to discriminate between strategies and tend to focus on limited techniques
(Pokay & Blumenfeld, 1990; Schoenfeld, 1985).
Assessing Learning Strategies: Available Measures
Self-report questionnaires are the most widely adopted format for measuring learning
strategies. These instruments focus on student use of cognitive (Niemivirta, 1998; Weinstein &
Palmer, 2002; Weinstein, Schulte, & Palmer, 1987), noncognitive (Niemivirta), metacognitive
(Pintrich, Smith, Garcia, & McKeachie, 1991; Schraw & Dennison, 1994; Weinstein & Palmer)
and behavioral strategies (Pintrich et al.). College students are often the target population for
these measures. Some of the most popular self-report measures on learning strategies include the
Learning and Study Strategies Inventory (LASSI; Weinstein & Palmer; Weinstein et al.), the
Motivated Strategies for Learning Questionnaire (MSLQ; Pintrich, et al.), and the Self-Regulated
Learning Inventory (SRLI; Gordon, Lindner, & Harris, 1996; Lindner & Harris, 1991).
The LASSI aims to assess 10 different aspects of learning strategies: attitude, motivation,
time organization, anxiety, concentration, information processing, main idea selection, use of
techniques and support materials, self-assessment, and testing strategies (Weinstein et al., 1987).
For this instrument, the coefficient alpha ranges from .60 to .88 for the 10 subscales; the test
retest reliability is .88 for the total instrument. The MSLQ measures motivation and the use of
learning strategies. The learning strategies component includes cognitive strategies (i.e.,
rehearsal, elaboration, organization), metacognitive strategies (i.e., critical thinking,
metacognition), and resource management (i.e., time and place of study, effort regulation, peer
learning, and help seeking). The scale reliability ranges from .52 to .80 for the 9 learning strategy
scales. Another instrument, the SRLI, was developed to measure five learning-related
components: metacognition, learning strategies, motivation, contextual sensitivity, and
environmental control. The reliability coefficients for this measure ranged from .59 to .77
(Lindner & Harris, 1991). However, the five-factor model has not been confirmed by empirical
data. Further studies (i.e., Gordon et al., 1996) have recommended a four-factor solution:
executive processing, cognitive processing, motivation, and environment control/utilization.
These subscale reliabilities ranged from .78 to .83 (Gordon et al.).
Although most subscales contained in these high school and college aged instruments are
reasonably reliable, there is room for improvement in terms of internal consistency (i.e., r =.52
for one of the LASSI scales). The consensus on the factor structure of some of the instruments
4
has been problematic. Therefore, it is not uncommon that subsequent studies fail to replicate the
findings using the same instruments. For instance, Melancon (2002) has reported that the LASSI
may not empirically measure the 10 scales purported by the original design.
Research on middle school instruments has also been met with mixed results. The
Metacognitive Awareness of Reading Strategies Inventory (MARSI; Mokhtari & Reichard,
2002) is one of the few instruments designed to measure learning strategy use among middle
school students. It focuses on measuring adolescent awareness and perceived use of learning
strategies. The MARSI has demonstrated valid evidence; however, it is subject specific and
focuses solely on reading strategies. For effective learning, students need a set of strategies and
skills to monitor their learning in a variety of contexts.
Objectives of This Study
The primary purposes of this study are to (a) devise a self-report instrument, the Middle
School Learning Strategies (MSLS) scale, to help middle school students understand the learning
skills and strategies they use in their knowledge inquiry process; and (b) collect validity evidence
for the MSLS scale in terms of factor structure, reliability, and correlations to academic
achievement. It is hoped that the MSLS scale can remediate the lack of measures for students to
reflect on their strategy use from cognitive, behavioral, and metacognitive perspectives. In
addition, the strategies captured in the MSLS scale are designed to be generalizable to multiple
disciplines in middle school.
Method
Instrument Development
The development of the MSLS measure was guided by an extensive literature review on
learning strategies and relevant measures (e.g., Niemivirta, 1998; Pintrich et al., 1991; Weinstein
& Palmer, 2002; Weinstein et al., 1987; Zimmerman & Martinez-Pons, 1990; Zimmerman &
Schunk, 1989). The initial instrument was designed to capture student strategy use in cognitive,
behavioral, and metacognitive aspects. Note that noncognitive strategies are another important
component of learning strategies. The reason that noncognitive items are not considered in this
pilot study is that instruments on noncognitive strategies have been developed in other studies
undertaken by staff at ETS. For example, the time management scale measures student ability to
maximize the use of time to achieve effective learning. Therefore, this study focused on
5

6
cognitive, behavioral, and metacognitive strategies. Each aspect includes specific strategies that
can be applied in a variety of learning situations. Cognitive strategies include activities such as
planning, rehearsing, organizing, and prioritizing. Behavioral strategies describe actions such as
help seeking, environmental control, and notetaking. Metacognitive strategies reflect the process
of self-monitoring, checking, and reflection. It is worth mentioning that these categories
represent only a generic notion to encompass a set of skills and strategies that students
commonly use. A strategy in one category could relate closely to a strategy in another category.
For instance, help seeking, a behavioral strategy, could be an immediate follow-up to a student
self-monitoring session, a metacognitive strategy. Therefore, the categories cannot be strictly
delineated from one another.
When selecting items, we followed three general principals. First, the context in which
the items are situated needed to be aligned with middle school students’ academic activities. All
of the items describe activities related to receiving classroom instruction, finishing homework
assignments, acquiring new knowledge, or taking tests. Second, the items were selected to reflect
a balanced combination of general strategies that can be applied to various subjects and a few
highlighted strategies for core disciplines such as math, reading, and writing. Last, the items
needed to capture the interaction between students and other potential resources (e.g., teachers).
As middle school students are not as independent and as sophisticated learners as adults, it is
critical for them to realize the importance of seeking help and guidance when necessary. In
addition, some negatively framed items were also included describing ineffective strategies. It
was hoped that these items could increase student awareness of avoiding bad strategies.
The items were subject to review by a panel of content experts, measurement experts, and
general education researchers. The items were examined and revised based on considerations of
text clarity, age appropriateness, content coverage, and response format. As a result, 52 items
from the MSLS measure were pilot tested. These items were represented by two response
formats. Some items asked for information regarding the frequency of student use of certain
strategies, while others asked about the degree to which a student endorses the statement. For the
former, the response categories included hardly ever, sometimes, often, and almost always. For
the latter, the responses ranged from strongly disagree, disagree, agree, to strongly agree. All
items were scored on a 4-point Likert scale. The item statements, means, and standard deviations
are included in Table 1.

Table 1
Principal Axis Factor Analysis: Pattern Matrix Loading, Mean, and Standard Deviation
Item C F1 F2 F3 Mean SD
14 For writing assignments, I pre-write by drawing a diagram. Cogn .6 0 -.2 1.92 .92
11 For writing assignments, I pre-write by making an outline. Cogn .6 -.1 0 2.26 .97
6 I use my textbook to add to my class notes. Cogn .6 -.1 .1 2.10 .97
2 I summarize what I have learned after a class. Meta .6 0 -.1 1.94 .86
1 I outline what I read. Cogn .5 -.2 .1 1.79 .85
41 I try to figure out how new things I learn in class relate to things I already know. Meta .5 .2 0 2.50 .98
40 After I read something for class, I put it in my own words. Cogn .5 0 0 2.34 .91
38 When I do my homework, I check to see whether I understand the material. Meta .5 .1 .2 3.12 .67
27 When I’m working on a math problem, I draw a diagram to make it clearer. Cogn .5 .1 -.1 2.05 .91
24 I take notes in class, and I read them over later. Beha .5 0 .2 2.49 .96
20 When I read over my class notes, I put the teacher’s lesson into my own words. Cogn .5 .1 0 2.61 .75
7 I have strategies I use when taking notes so that I can understand them when I look
at them again.
Beha .5 0 .2 2.88 .79
21 I use the KWL method (what you already Know, what you Want to know, what
you have Learned).
Meta .4 0 -.1 1.65 .86
19 I use headings when I’m taking notes so that I can find information when I look
through them again.
Beha .4 .1 .2 3.06 .82
7
Table continues
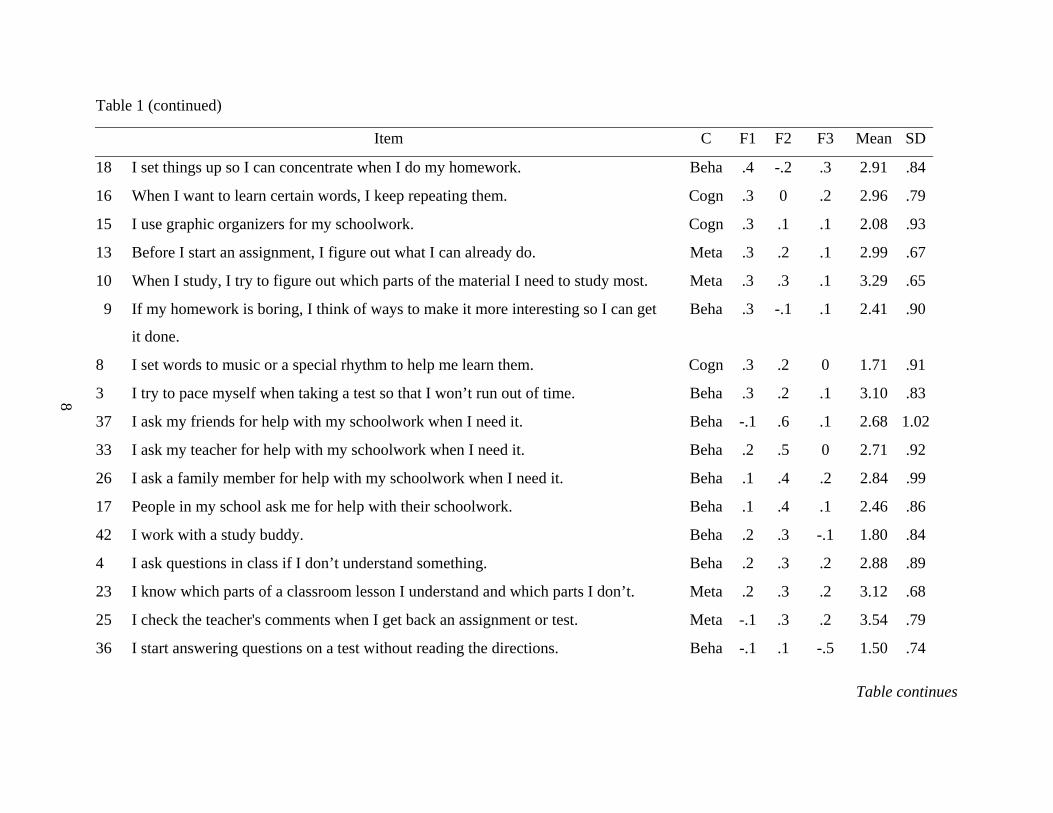
Table 1 (continued)
Item C F1 F2 F3 Mean SD
18 I set things up so I can concentrate when I do my homework. Beha .4 -.2 .3 2.91 .84
16 When I want to learn certain words, I keep repeating them. Cogn .3 0 .2 2.96 .79
15 I use graphic organizers for my schoolwork. Cogn .3 .1 .1 2.08 .93
13 Before I start an assignment, I figure out what I can already do. Meta .3 .2 .1 2.99 .67
10 When I study, I try to figure out which parts of the material I need to study most. Meta .3 .3 .1 3.29 .65
9 If my homework is boring, I think of ways to make it more interesting so I can get
it done.
Beha .3 -.1 .1 2.41 .90
8 I set words to music or a special rhythm to help me learn them. Cogn .3 .2 0 1.71 .91
3 I try to pace myself when taking a test so that I won’t run out of time. Beha .3 .2 .1 3.10 .83
37 I ask my friends for help with my schoolwork when I need it. Beha -.1 .6 .1 2.68 1.02
33 I ask my teacher for help with my schoolwork when I need it. Beha .2 .5 0 2.71 .92
26 I ask a family member for help with my schoolwork when I need it. Beha .1 .4 .2 2.84 .99
17 People in my school ask me for help with their schoolwork. Beha .1 .4 .1 2.46 .86
42 I work with a study buddy. Beha .2 .3 -.1 1.80 .84
4 I ask questions in class if I don’t understand something. Beha .2 .3 .2 2.88 .89
23 I know which parts of a classroom lesson I understand and which parts I don’t. Meta .2 .3 .2 3.12 .68
25 I check the teacher's comments when I get back an assignment or test. Meta -.1 .3 .2 3.54 .79
36 I start answering questions on a test without reading the directions. Beha -.1 .1 -.5 1.50 .74
8
Table continues

9
Table 1 (continued)
Item C F1 F2 F3 Mean SD
39 I do my homework in a place where it is hard to concentrate. Beha -.1 .1 -.5 1.55 .79
5 I copy someone else’s work if I don’t understand how to do an assignment. Beha .1 .1 -.5 1.40 .69
29 I complete an assignment or a test without checking to see if I have made mistakes
on it.
Meta -.2 0 -.5 1.76 .91
30 My school papers are disorganized. Cogn 0 -.1 -.5 1.75 .89
35 I wait until the last minute to start assignments. Beha -.2 .2 -.5 1.78 .90
31 When I do an assignment, I am confused about what to do first. Meta -.1 -.1 -.4 1.78 .72
32 I ignore the teacher's corrections on my homework when I get it back. Cogn 0 -.1 -.4 1.39 .69
28 I work harder on my free-time activities than I do on my homework. Beha -.1 .2 -.4 2.33 .95
34 If I finish a test early, I stop working on it. Beha -.2 -.1 -.4 1.91 .94
12 When I try to study from my notes, I can’t seem to make sense of them. Beha -.1 -.1 -.3 1.89 .77
22 I don’t find it helpful to take notes in class. Beha -.4 0 -.3 1.84 .84
Note. N = 238. C = category, Beha = behavioral strategies, Cogn = cognitive strategies, Meta = metacognitive strategies, F1 =
effective strategies, F2 = help seeking, F3 = bad habits.
Procedure
Data were collected during the fall semester of the 2006 school year. The students were
given 20 minutes to fill out the questionnaires, using class time. Students received explicit
directions and were clearly informed that there was no best answer, and were reminded that they
should select the option that best describes their situation. Information was also collected on
student gender, ethnicity, parental education, home computer resources, etc. Students were also
asked to honestly report their most recent grades in language arts, math, science, and social
studies. Teachers were involved in the collection of the questionnaires from the students. The
survey contained no identifying information in order to prevent the linkage of responses to
individual students.
Participants
Data were collected from 238 middle school students from three schools in the Princeton,
New Jersey area. The student sample consisted of 6th graders (N = 93), 7th graders (N = 57), and
8th graders (N = 88). Thirty-nine percent of the participants reported being female, 42% reported
being male, and the remaining 19% left gender status unidentified. In terms of ethnicity, 40%
reported being White, 4% African American, 44% Asian, 6% Hispanic, and about 6% indicated
other as their ethnicity. Data was also collected on parental education. According to the students’
reports, 85% of their mothers and 86% of their fathers obtained college level degrees or higher.
Ninety-nine percent of the students indicated that they had a home computer and Internet access.
Analyses
Dimensionality investigation. To investigate the factor structure, a principal axis factor
(PAF) analysis with promax rotation was performed, using SPSS version 13.0. The PAF was
preferred to the principal component analysis (PCA) since PCA does not differentiate between
common and unique variance. PCA accounts only for the variance in the observed variables,
ignoring the correlations among the variables (Brown, 2006; Fabrigar, Wegener, MacCallum, &
Strahan, 1999).
Parallel analysis was used to determine the number of factors. Studies have documented
the superior accuracy of parallel analysis as a factor retention criterion when compared to other
criteria such as the Kaiser-Guttman rule (i.e., eigenvalues larger than one) and the scree test
(Eaton, Velicer & Fava, 1999; Humphreys & Montanelli, 1975; Silverstein, 1987; Velicer,
10
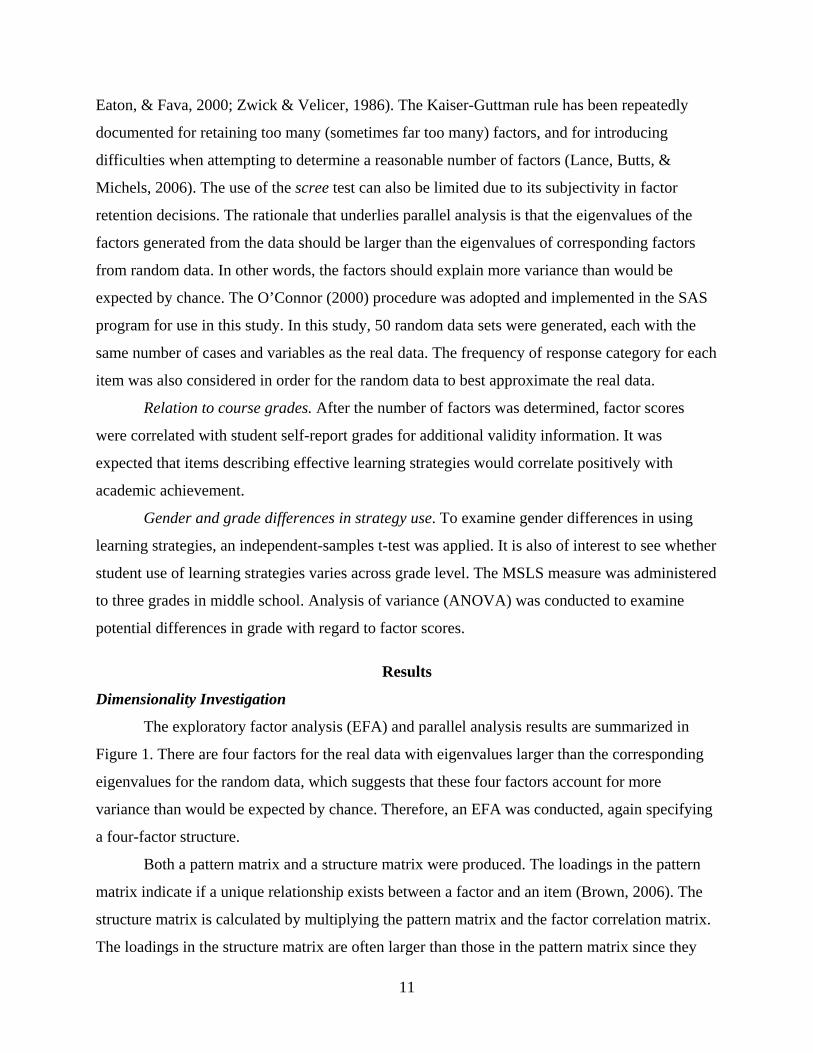
Eaton, & Fava, 2000; Zwick & Velicer, 1986). The Kaiser-Guttman rule has been repeatedly
documented for retaining too many (sometimes far too many) factors, and for introducing
difficulties when attempting to determine a reasonable number of factors (Lance, Butts, &
Michels, 2006). The use of the scree test can also be limited due to its subjectivity in factor
retention decisions. The rationale that underlies parallel analysis is that the eigenvalues of the
factors generated from the data should be larger than the eigenvalues of corresponding factors
from random data. In other words, the factors should explain more variance than would be
expected by chance. The O’Connor (2000) procedure was adopted and implemented in the SAS
program for use in this study. In this study, 50 random data sets were generated, each with the
same number of cases and variables as the real data. The frequency of response category for each
item was also considered in order for the random data to best approximate the real data.
Relation to course grades. After the number of factors was determined, factor scores
were correlated with student self-report grades for additional validity information. It was
expected that items describing effective learning strategies would correlate positively with
academic achievement.
Gender and grade differences in strategy use. To examine gender differences in using
learning strategies, an independent-samples t-test was applied. It is also of interest to see whether
student use of learning strategies varies across grade level. The MSLS measure was administered
to three grades in middle school. Analysis of variance (ANOVA) was conducted to examine
potential differences in grade with regard to factor scores.
Results
Dimensionality Investigation
The exploratory factor analysis (EFA) and parallel analysis results are summarized in
Figure 1. There are four factors for the real data with eigenvalues larger than the corresponding
eigenvalues for the random data, which suggests that these four factors account for more
variance than would be expected by chance. Therefore, an EFA was conducted, again specifying
a four-factor structure.
Both a pattern matrix and a structure matrix were produced. The loadings in the pattern
matrix indicate if a unique relationship exists between a factor and an item (Brown, 2006). The
structure matrix is calculated by multiplying the pattern matrix and the factor correlation matrix.
The loadings in the structure matrix are often larger than those in the pattern matrix since they
11

are inflated by the correlations in the factors. Therefore, the loadings in the pattern matrix were
used to determine the factor structure. Using .30 as the cutoff point for the pattern matrix
loading, only two items had salient loadings on the fourth factor. There was no apparent relation
between these two items (When I start an assignment, I jump right in and begin to answer, and If
my homework is boring, I think of ways to make it more interesting so I can get it done) The
eigenvalue of the fourth factor from the real data is very close to the eigenvalue of the
corresponding factor from the random data. For the benefit of model parsimony and substantive
interpretation, a three-factor solution was selected for further confirmatory analysis. Among the
52 pilot-tested items, 10 items did not load saliently (loading < .30) on any of the three factors.
An EFA was conducted for these 10 items and no clear factor pattern was revealed. Among the
42 retained items, 22 items loaded saliently on the first factor, 8 items on the second factor, and
12 items on the third factor. Table 1 summarizes the pattern matrix loading and texts of these 42
items.
0.00
1.00
2.00
3.00
4.00
5.00
6.00
7.00
8.00
9.00
10.00
1 3 5 7 9 11 13 15 17 19 21 23 25 27 29 31 33 35 37 39 41 43 45 47 49 51Component
Eige
nval
ues
Random DataReal Data
Figure 1. Results of parallel analysis.
Examination of the items on the first-factor reveals that the items cover strategies from
each of the three categories: behavioral, cognitive, and metacognitive strategies. A common
characteristic of these first-factor items is that they all describe useful strategies that are expected
to facilitate learning (i.e., planning, organizing, rehearsal, etc.). This scale can be regarded as the
12
general effective learning strategy scale. Most of the second-factor items deal with help-seeking
strategies; including requesting assistance from teachers, family members, and peers when
encountering difficulties in school work. All of the third-factor items describe disengagement,
ineffective behaviors, or negative attitudes regarding strategy use. Therefore, the three scales
were titled effective strategies, help seeking, and bad habits, respectively, on the basis of the
common item features.
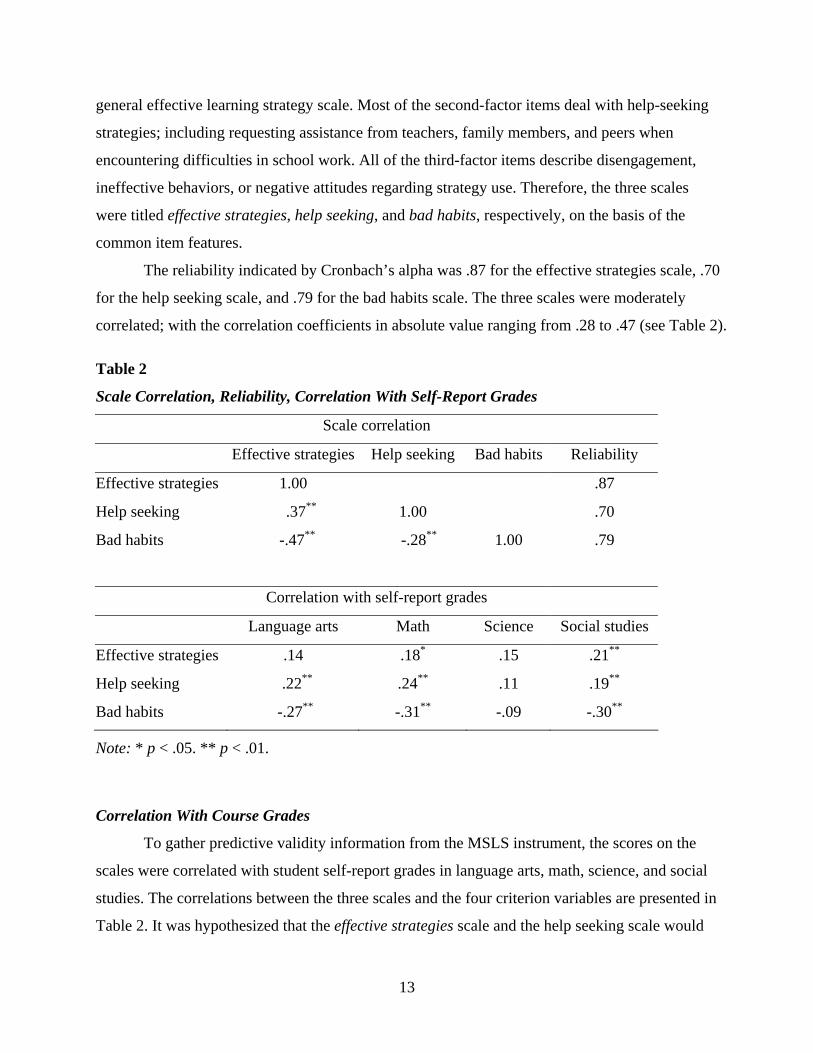
The reliability indicated by Cronbach’s alpha was .87 for the effective strategies scale, .70
for the help seeking scale, and .79 for the bad habits scale. The three scales were moderately
correlated; with the correlation coefficients in absolute value ranging from .28 to .47 (see Table 2).
Table 2
Scale Correlation, Reliability, Correlation With Self-Report Grades
Scale correlation
Effective strategies Help seeking Bad habits Reliability
Effective strategies 1.00 .87
Help seeking .37** 1.00 .70
Bad habits -.47** -.28** 1.00 .79
Correlation with self-report grades
Language arts Math Science Social studies
Effective strategies .14 .18* .15 .21**
Help seeking .22** .24** .11 .19**
Bad habits -.27** -.31** -.09 -.30**
Note: * p < .05. ** p < .01.
Correlation With Course Grades
To gather predictive validity information from the MSLS instrument, the scores on the
scales were correlated with student self-report grades in language arts, math, science, and social
studies. The correlations between the three scales and the four criterion variables are presented in
Table 2. It was hypothesized that the effective strategies scale and the help seeking scale would
13
be positively correlated with grades in these four subject areas, and the bad habits scale would be
negatively correlated with these scales. The hypothesis was confirmed by the results. The
effective strategies scale showed the highest positive correlation with social studies grades (r =
.21), the help seeking scale showed the highest positive relationship with math grades (r = .24),
and the bad habits scale showed the strongest negative relationship with math grades (r = -. 31).
Gender and Grade Differences in Strategy Use
Gender differences analysis revealed no significant differences in using effective
strategies and bad habits. However, males and females reported significant differences in help-
seeking use. Females used this strategy more frequently than males (p < .01). For grade
differences, ANOVA results indicated no significant difference in the use of effective strategies
(p = .62) and help seeking (p = .95) among the 6th, 7th, and 8th graders. However, there was a
significant difference in terms of ineffective strategies use for students in the three grades. The
Bonferroni post hoc test showed that the 6th graders reported having more bad habits than
students in the 7th and 8th grades. This difference was significant for 8th graders (p = .03), and
insignificant for 7th graders (p = .99).
Conclusion and Discussion
The link between strategy use and academic achievement has been extensively
documented and discussed in the literature. Additionally, the importance of learning strategies
has been increasingly recognized, as evidenced by the fact that many domestic and international
studies (e.g., NAEP, TIMSS, PISA) place a focus on learning strategies in background surveys.
Although many instruments have taken the first steps to include learning styles and strategies
items into existing measures, they tend to target the population beyond middle school students.
To add to the existing assessments on learning strategies, this study designed a learning strategy
instrument, the MSLS, for middle school students. We comment on two interesting findings that
emerged from the pilot investigations.
First, help seeking has been identified as a distinct dimension of learning strategies and
has demonstrated significant correlations with course grades. Many of the currently available
inventories do not emphasize help seeking in the learning process (e.g., LASSI, MARSI) or have
relatively low reliability for the help seeking scale (e.g., MSLQ). This is unfortunate as it is
important for students to have access to resources and individuals to turn to when they encounter
14
difficulties in knowledge acquisition. In the case of middle school students, this is especially
relevant as they are not as advanced or independent in their learning as high school and college
students. Appropriate levels of assistance and guidance are critical to facilitate the student’s
ability to build a repertoire of knowledge and in connecting existing skills with new information.
The help seeking scale in the MSLS instrument focuses on three sources of help: teachers,
parents, and peers. Interactions between teachers and students complement the traditional way of
teacher-centered instruction. Teachers will have more opportunities to understand student
misconceptions, and revamp instructions accordingly. Peer assistance addresses another
important aspect of learning strategies. Peer-assisted learning strategies have received
incremental attention for being an effective tool among students and for demonstrating promise
as a feasible classroom approach (McMaster, Fuchs, & Fuchs, 2007). Parental support is another
core component of help seeking for middle school students. Research has shown that parental
support has been a significant source affecting student attitudes towards learning, and directly
influences learning outcomes, especially for extrinsically motivated students (e.g., Knollmann &
Wild, 2007; Tocci & Engelhard, 1991).
Second, we found that the 6th graders reported using ineffective strategies significantly
more than the 8th graders in this study. These strategies have been shown to be negative
predictors for course grades in all of the four subjects examined. This finding further signals the
importance of providing students with a tool that can increase their awareness about avoiding
ineffective strategies. It is highly likely that younger students are unable to distinguish between
beneficial and potentially harmful strategies as well as older students. The information gathered
from the responses to the MSLS scale enables the students to evaluate their own strategy use and
helps them recognize their learning strengths and weaknesses.
As promising as the pilot results appear, this study has some potential limitations. First,
demographic data revealed that most of the participants were from a socio-economically upper-
class neighborhood. Therefore, the findings reported in this paper may not to be able to be
generalized to middle school students in urban or inner city schools, as student learning is likely
to be influenced by the school and home environment. For instance, parental education may
substantially affect the degree of parental involvement and their ability to provide help and
guidance to their children. In addition, the amount of available resources may also change
students’ use of certain strategies. For future research, confirmatory analysis should be
15
conducted to further investigate the factor structure of the MSLS scale. For instance, it is
important to examine whether the three-factor structure still holds for a more representative
sample when compared to alternative models, such as models based on cognitive, noncognitive,
and metacognitive strategies, or models based on positive strategies versus negative strategies.
A second limitation is that the formal documentation of student academic performance
was not available at the time the data was collected. Instead, the student’s self-reported grades
were used as a criterion variable. Students may have over or understated their school
performance due to self-esteem, peer pressures, or evaluation concerns. They also may have
indicated inaccurate scores due to forgetfulness. For future studies, it is important to obtain
school documented GPAs or teacher ratings as criterion measures. Given these limitations, the
next step would be to administer the MSLS scale to a nationally representative sample and
evaluate whether the findings can be replicated. Additional validity evidence should be gathered
for triangulation purposes.
Nonetheless, as a pilot scale, the MSLS scale has demonstrated some promising features.
It can serve as a useful tool to promote effective learning for middle school students. First, it can
be used as a diagnostic measure to help increase student awareness of their use of effective
strategies and increase avoidance of counterproductive strategies. This would be a first step for
students to reflect upon the way they process new information and establish connections between
newly acquired and existing knowledge. Second, the MSLS scale can help teachers identify the
unique ways in which students learn. Informed by item level responses, teachers can incorporate
meaningful learning strategies into classroom practice and create instruction according to the
prevalent learning styles of their students. Finally, the MSLS scale has the potential to serve as
an evaluation tool for intervention programs that aim to improve strategy use. It can be used as a
pre-post measure to gauge the successfulness of the intervention effort. As learning strategies are
not systematically taught in classes, it is hoped that the MSLS scale, and instruments of similar
intent, can help middle students better prepare for the rigors and challenges of further education.
16

References
Beaton, A.E., Mullis, I.V.S., Martin, M.O., Gonzalez, E.J., Kelly, D.L., & Smith, T.A. (1996).
Mathematics achievement in the middle school years. IEA's Third International
Mathematics and Science Study. Chestnut Hill, MA: Boston College.
Brown, T.A. (2006). Confirmatory factor analysis for applied research. New York: Guilford
Press.
Duckworth, A.L., & Seligman, M.E.P. (2005). Self-discipline outdoes IQ in predicting academic
performance of adolescents. Psychological Science, 16, 939-944.
Eaton, C. A., Velicer, W. F., & Fava, J. L. (1999). Determining the number of components: An
evaluation of parallel analysis and the minimum average partial correlation procedures.
Unpublished manuscript.
Eshel, Y., & Kohavi, R. (2003). Perceived classroom control, self-regulated learning strategies,
and academic achievement. Educational Psychology, 23, 249-260.
Fabrigar, L.R., Wegener, D.T., MacCalllum, R.C., & Strahan, E.J. (1999). Evaluating the use of
exploratory factor analysis in psychological research. Psychological Methods, 4, 272-
299.
Gordon, W. I., Lindner, R.W., & Harris, B. R. (1996, April). A factor analytic study of the Self-
Regulated Learning Inventory. Paper presented at the annual conference of the American
Educational Research Association, New York.
Harrison, G., Andrews, J., & Saklofske, D. (2003). Current perspectives on cognitive and
learning styles. Education Canada, 43, 44-47.
Hau, K.T., & Hui, H.F. (1996, August). Theories of intelligence, achievement goals, and
learning strategies of Chinese students. Paper presented at the annual meeting of the
American Psychological Association, Toronto, Ontario, Canada.
Hong, E., Sas, M., & Sas, J.C. (2006). Test-taking strategies of high and low mathematics
achievers. The Journal of Educational Research, 99, 144-155.
Humphreys, L. G., & Montanelli, R. G. (1975). An investigation of the parallel analysis criterion
for determining the number of common factors. Multivariate Behavioral Research, 10,
193-206.
Kitsantas, A. (2002). Test preparation and performance: A self-regulatory analysis. The Journal
of Experimental Education, 70, 101-113.
17
Knollmann, M., & Wild, E. (2007). Quality of parental support and students' emotions during
homework: Moderating effects of students' motivational orientations. European Journal
of Psychology of Education, XXII, 63-76.
Lance, C.E., Butts, M.M., & Michels, L.C. (2006). The sources of four commonly reported
cutoff criteria: What did they really say? Organizational Research Methods, 9, 202-220.
Lindner, R. W., & Harris, B. R. (1991, October). Developing a self-regulated learning inventory:
A preliminary report and analysis. Paper presented at the Annual Conference of The
Mid-Western Educational Research Association, Chicago, IL.
May, F.B. (1994). Reading as communication (4th ed.). New York: McMillan Publishing
Company.
McCann, E.J., & Turner, J.E. (2004). Increasing student learning through volitional control.
Teachers College Record, 106, 1695-1714.
Mclnerney, V., Mclnerney, D.M., & Marsh, H.W. (1997). Effects of metacognitive strategy
training within a cooperative group learning context on computer achievement and
anxiety: An aptitude-treatment interaction study. Journal of Educational Psychology, 89,
686-695.
McMaster, K.L., Fuchs, D., & Fuchs, L.S. (2007). Promises and limitations of peer-assisted
learning strategies in reading. Learning Disabilities: A Contemporary Journal, 5, 97-112.
Melancon, J. G. (2002). Reliability, structure, and correlates of learning and study strategies
inventory scores. Educational and Psychological Measurement, 62, 1020-1027.
Mokhtari, K., & Reichard, C.A. (2002). Assessing students’ metacognitive awareness of reading
strategies. Journal of Educational Psychology, 94, 249-259.
Mullis, I.V.S., Martin, M.O., Beaton, A.E., Gonzalez, E.J., Kelly, D.L., & Smith, T.A. (1997).
Mathematics achievement in the primary school years: IEA's Third International
Mathematics and Science Study (TIMSS). Chestnut Hill, MA: Boston College.
Niemivirta, M. (1998). Individual differences in motivational and cognitive factors affecting self-
regulated learning: A pattern-oriented approach. In P. Nenniger, R.S. Jager, & M.
Wosnitza (Eds.), Advances in motivation (pp. 32-42). Landau, Germany: Verlag
Empirische Padagogik.
18
O'Connor, B. P. (2000). SPSS and SAS programs for determining the number of components
using parallel analysis and Velicer's MAP test. Behavior Research Methods,
Instrumentation, and Computers, 32, 396-402.
Organisation for Economic Co-operation and Development. (2000). Knowledge and skills for
life: First results from PISA 2000. Paris: Author.
Organisation for Economic Co-operation and Development. (2004). Learning for tomorrow’s
world: First results from PISA 2003. Paris: Author.
Oster, L. (2001). Using the think aloud for reading instruction. The Reading Teacher, 55, 64-69.
Parham, S. D. (1997). The relationships between test-taking strategies and cognitive ability test
performance. Dissertation Abstracts International: The Physical Sciences and
Engineering, 57, 7260.
Pintrich, P. R., Smith, D., Garcia, T., & McKeachie, W. J. (1991). Reliability and predictive
validity of the Motivated Strategies for Learning Questionnaire (MSLQ). Educational
and Psychological Measurement, 53, 801-813.
Pokay, P., & Blumenfeld, P.C. (1990). Predicting achievement early and late in the semester:
The role of motivation and use of learning strategies. Journal of Educational Psychology,
82, 41-50.
Schoenfeld, A. (1985). Mathematical problem solving. Orlando, FL: Academic Press.
Schraw, G. (1998). Promoting general metacognitive awareness. Instructional Science, 26, 113-
125.
Schraw, G., & Dennison, R. S. (1994). Assessing metacognitive awareness. Contemporary
Educational Psychology, 19, 460-475.
Silverstein, A. B. (1987). Note on the parallel analysis criterion for determining the number of
common factors or principal components. Psychological Reports, 61, 351-354.
Tocci, C. M., & Engelhard, G. (1991). Achievement, parental support, and gender differences in
attitudes toward mathematics. Journal of Educational Research, 84, 280-286.
Velicer, W. F., Eaton, C. A., & Fava, J. L. (2000). Construct explication through factor or
component analysis: A review and evaluation of alternative procedures for determining
the number of factors or components. In R. D. Goffin & E. Helmes (Eds.), Problems and
solutions in human assessment: Honoring Douglas N. Jackson at seventy. Norwell, MA:
Kluwer Academic.
19

Weinstein, C. E., & Palmer, D. R. (2002). Learning and Study Strategies Inventory (LASSI):
User's manual (2nd ed.). Clearwater, FL: H& H Publishing.
Weinstein, C. E., Schulte, A. C., & Palmer, D. R. (1987). Learning and Study Strategies
Inventory. Clearwater, EL: H & H Publishing Co.
Williams, R. L., & Worth, S. L. (2003). Thinking skills and work habits: Contributors to course
performance. The Journal of General Education, 51, 201-226.
Wolters, C. A. (1999). The relation between high school students, motivational regulation and
their use of learning strategies, effort, and classroom performance. Learning and
Individual Differences, 3, 281-299.
Zimmerman, B. J., & Martinez-Pons, M. (1990). Student differences in self-regulated learning:
Relating grade, sex, and giftedness to self-efficacy and strategy use. Journal of
Educational Psychology, 82, 51-59.
Zimmerman, B. J., & Schunk, D. H. (Eds.). (1989). Self-regulated learning and academic
achievement: Theory, research and practice. New York: Springer-Verlag.
Zwick, W. R., & Velicer, W. F. (1986). Factors influencing five rules for determining the
number of components to retain. Psychological Bulletin, 99, 432-442.
20