an informatics approach to chronic disease …
TRANSCRIPT

AN INFORMATICS APPROACH TO CHRONIC DISEASE MANAGEMENT
IN PRIMARY CARE: BLENDING BUSINESS INTELLIGENCE
AND CARE PROCESS MODELS
by
John Chapin Wadsworth
A thesis submitted to the faculty of The University of Utah
in partial fulfillment of the requirements for the degree of
Master of Science
Department of Biomedical Informatics
The University of Utah
May 2013

iv
Copyright © John Chapin Wadsworth 2013
All Rights Reserved

iv
T h e U n i v e r s i t y o f U t a h G r a d u a t e S c h o o l
STATEMENT OF THESIS APPROVAL
The thesis of John Chapin Wadsworth
has been approved by the following supervisory committee members:
Stanley M. Huff , Chair 03/26/2012
Date Approved
Lucy A. Savitz , Member 03/23/2012
Date Approved
Scott P. Narus , Member 03/16/2012
Date Approved
and by Joyce Mitchell , Chair of
the Department of Biomedical Informatics
and by Donna M. White, Interim Dean of The Graduate School.

iv
ABSTRACT
Asthma, diabetes, and depression are chronic diseases managed through the
Primary Care Clinical Program at Intermountain Healthcare. Primary Care Providers
(PCPs) receive monthly reports on their patients with these conditions. The reporting
paradigm focuses on individual diseases. PCPs have asked for a consolidated view of
chronic disease, one that is patient-centric rather than disease-centric.
A clinical decision support tool was developed using data from Intermountain’s
enterprise data warehouse. A cube was built to report on asthma, diabetes, and
depression patients simultaneously. 183, 000 patients were included in the study. The
tool measures PCP’s adherence to best practices for chronic disease management. It also
allows ad-hoc analysis of large data sets as well as actionable reports for PCPs to identify
gaps in adherence to best practices.
Primary care providers can view their patient populations with asthma, diabetes
and depression in a consolidated report. The decision support tool was successfully built
as a prototype for chronic disease management. The tool has the potential to scale and
include many chronic conditions for reporting. It was demonstrated to executives,
directors, and PCPs at Intermountain.
Chronic disease management should be done with a patient focus rather than a
disease focus. Information technology has an important role to play in the support of

iv
primary care and the medical home. Clinical decision support tools can be built to
improve population-level and patient-level chronic disease management.

51
This thesis is dedicated to my wife, Kristine Barnett Wadsworth,
for believing in my dream.
Yes, I believe in blue suns.
To my children, Samuel, Benjamin, Cora, and Rachel, you’re my inspiration.

TABLE OF CONTENTS
ABSTRACT ....................................................................................................................... iii
LIST OF FIGURES ......................................................................................................... viii
LIST OF ABBREVIATIONS ............................................................................................ ix
ACKNOWLEDGMENTS ...................................................................................................x INTRODUCTION ...............................................................................................................1
The Problem .........................................................................................................................1 A Proposed Solution ............................................................................................................3 The Thesis Layout................................................................................................................5
BACKGROUND .................................................................................................................6 General Concepts .................................................................................................................6 Chronic Disease Management .............................................................................................6 Wagner Chronic Care Model ...............................................................................................7 Enterprise Data Warehouse ..................................................................................................9 Intermountain Healthcare Context .....................................................................................28
METHODS ........................................................................................................................38 Tools and Technologies .....................................................................................................38 Cohort Identification ..........................................................................................................38 Care Process Model Definitions ........................................................................................43 Patient Provider Mapping ..................................................................................................44 Extract Transform Load Process ........................................................................................45 Dimensionally Modeling Chronic Disease Management ..................................................47 Cubes..................................................................................................................................48 Cube Calculations ..............................................................................................................48 Accessing the Chronic Conditions Cube ...........................................................................49

RESULTS
CCMT ................................................................................................................................50 ETL Scripting.....................................................................................................................50 Chronic Conditions Dimensional Model ...........................................................................50 Chronic Conditions Management Cube .............................................................................54 Reporting Against the Chronic Conditions Cube ..............................................................55
DISCUSSION
Tools and Technologies .....................................................................................................62 Cohort Identification ..........................................................................................................63 Care Process Model Definitions ........................................................................................66 Patient Provider Mapping ..................................................................................................68 Extract Transform Load Process ........................................................................................69 Dimensionally Modeling Chronic Conditions ...................................................................70 Cube Calculations ..............................................................................................................72 Access and Reporting ........................................................................................................74 Ad-hoc Analysis Within Cubes .........................................................................................76 CCMT Data Validation ......................................................................................................77 CCMT Face Validity..........................................................................................................78 Potential for Improved Business Intelligence and Reporting at Intermountain ................................................................................................81 Potential for Usability at Intermountain ............................................................................83 Potential Portability to Other Health Care Organizations..................................................84
SIGNIFICANCE ................................................................................................................86 FUTURE RECOMMENDATIONS ..................................................................................89
CONCLUSION ..................................................................................................................91
APPENDICES A: DATA MODELS ..........................................................................................................93
B: SCRIPTING ..................................................................................................................99
REFERENCES ................................................................................................................122
vii

LIST OF FIGURES
Figure Page 1. Wagner Chronic Care Model .....................................................................................8
2. Enterprise Data Warehouse Model ............................................................................11
3. Chronic Conditions Dimensional Model ...................................................................26
4. Intermountain Diabetes Registry ...............................................................................41
5. Chronic Conditions ETL Flow diagram ....................................................................47
6. Chronic Conditions Dimensional Model ...................................................................51
7. Asthma CPM Compliance Rate Graph example .......................................................55
8. Chronic Conditions Patient Detail Report example ...................................................57
9. Chronic Conditions Pivot Table.................................................................................58
10. Chronic Conditions Provider Report .........................................................................60
11. Chronic Conditions Region Report ............................................................................61

LIST OF ABBREVIATIONS
AAP American Academy of Pediatrics ACO Accountable Care Organization BI Business Intelligence BIDS Business Intelligence Development Studio BO Business Objects CPM Care Process Model DSS Decision Support System EDW Enterprise Data Warehouse ETL Extract Transform Load IT Information Technology PCCP Primary Care Clinical Program PCMH Patient Centered Medical Home PCP Primary Care Provider or Primary Care Physician QI Quality Improvement SQL Structured Query Language SSAS SQL Server Analysis Services SSRS SQL Server Reporting Services WHO World Health Organization

ACKNOWLEDGMENTS
Thank you, Stan Huff, for taking me on as a student. I am grateful for your kind
and patient mentoring. Thank you, Lucy Savitz, for your attention to detail. Thank you,
Scott Narus, for not letting anything slip by you.

51
INTRODUCTION
The Problem
Chronic disease affects a significant percentage of the world and US populations
(1,2). Some chronic conditions may be difficult for Primary Care Providers (PCP) to
manage, such as asthma, diabetes, and depression. When a patient presents in a clinic,
PCPs tend to focus on the chief complaint of the visit. As patients with chronic disease
present at the clinic, providers should certainly address the chief complaint, but they
should also be aware of any chronic conditions the patient may have. With the patient in
the clinic, care providers have the opportunity to better manage chronic conditions by
checking progression and status of the conditions. For decades, chronic disease
management has had a disease focus rather than a patient focus. Time constraints,
financial incentives, and incomplete patient data are contributing factors that emphasize
disease focus, rather than a holistic patient focus.
At Intermountain Healthcare (“Intermountain”), an integrated health care delivery
system based in Utah, PCPs receive monthly reports on their patients with the chronic
conditions asthma, diabetes, and depression. Each month, they receive an asthma report
with all their patients who have asthma. They also receive diabetes and depression
reports for their respective diabetic and depressed populations. This model of chronic
disease reporting has been in use for over a decade. Patients who have multiple chronic
conditions appear on multiple reports sent out to providers. The PCP is left to determine

2
which patients have multiple conditions and how to assimilate pertinent clinical
information across the reports. The reporting paradigm is flawed. Each report is disease-
centric, rather than patient-centric. PCPs have asked for one report that combines these
chronic conditions.
Reporting on chronic disease management at a population level across an
enterprise is a challenge. The complexity of the data architecture with multiple data
sources available to analysts tasked with building reports often leads to inconsistencies in
reporting. What one analyst from a particular department reports may not be congruent
with findings from another analyst. The resulting discrepancies may leave clinicians and
executive management skeptical of reports and unsure of an appropriate course of action.
In this case, a consistent representation of clinical data is needed so clinicians,
administrators, and executives can rely on trusted information to help them consistently
make correct decisions.
Another challenge in chronic disease management is adherence to Care Process
Models (CPM) for given chronic conditions. A care process model is a high-level
mapping of the patient care continuum for a given disease. The mapping will include
best practices for preventive, ambulatory, acute and invasive care on along the disease
continuum. Some PCPs may do quite well in managing their diabetic patients. They
may follow the diabetic CPM to the letter. However, those same PCPs may struggle to
some degree with the asthma CPM and/or with the depression CPM. At Intermountain,
the advent of data transparency and public reporting on PCPs has led to heated debate
among PCPs who complain that their patient populations are sicker and less compliant
than other PCPs whose patients may appear to have better outcomes. To date, PCP-to-

3
PCP population comparisons are difficult, awkward, and nonstandard. However, quality
improvement theory allows us to examine unnecessary variation in order to identify
opportunities for improved quality and efficiency. Intermountain has a vested interest in
identifying PCPs and clinics that excel in managing their patients with chronic disease
(i.e., improved clinical outcomes) so that best practices may be identified, understood,
and disseminated across the enterprise. Historically, the outcomes focus has been on
individual disease silos. Clearly, there is value in tracking patient outcomes, but these are
not the only outcomes of value. What drives these outcomes? Is it patient compliance to
care and medical advice? Is there not also a PCP component of adherence to prescribed
best practices which have been captured in CPMs for chronic disease? The answer is yes.
Pathman et al. (65) proposed an awareness-to-adherence model that suggests both
providers and patients have responsibilities for compliance. In this study, it was
recognized that the patient has responsibility for some levels of compliance: however,
measuring and enhancing provider adherence to CPMs is the focus of this study. At
Intermountain, no framework exists that could be used to measure PCP adherence to
chronic disease CPMs simultaneously across multiple chronic conditions.
A Proposed Solution
Over the last two decades, tremendous advances have been made in the field of
health care information technology. A few examples include electronic medical records,
data warehouses, reporting tools, data modeling techniques, and business intelligence.
Today, many of these technologies are employed to support health care delivery and
disease management.

4
I propose a unique approach to support chronic disease management. PCPs
within the Primary Care Clinical Program at Intermountain Healthcare requested a
consolidated report that included asthma, diabetes, and depression while maintaining a
patient focus. To date, no such report exists. As I considered building the consolidated
report for my MS project, I felt that the development of such a report alone was
insufficient for an MS project. While a consolidated report could add value to the
Primary Care Clinical Program, there was no novel informatics contribution inherent in
building a complex disease report. The idea then came to me to architect a framework. I
wanted to build a chronic disease management tool, a veritable amalgamation of
information technology and clinical care process models. I call it the chronic conditions
management tool (CCMT). The CCMT would be a clinical decision support tool. The
CCMT would certainly meet the PCPs’ request for a consolidated, actionable patient
report, though reporting would be just one component of the model.
The model would leverage an enterprise data warehouse, necessary for data
capture and consolidation. It would include dimensional modeling techniques to
optimize reporting. It would also include cube technology, needed to aggregate and slice
through millions of rows of data. Finally, a reporting solution would be connected to the
cube to allow the end users (PCPs, clinical staff, managers, executives, and analysts)
novel, self-service views of chronic disease management across the enterprise and across
PCP patient populations.

5
The Thesis Layout
This project evolved into a data journey of chronic disease management. There
are many moving parts and pieces. To help the reader understand the necessary
components of the CCMT, I have outlined each component in the Background chapter of
the thesis. The Background provides details on CPMs. Information technology
components of the model are also outlined and explained in the Background chapter. The
Methods chapter walks through the ways the individual components were employed in
the CCMT. The Results chapter follows the Methods. The Discussion chapter delves
into the value of each component and the contributions each makes in the model. Where
possible, limitations of the components are discussed.
The purpose of the project was to architect and build the CCMT, not to implement
it. I set out to build a novel approach to chronic disease reporting by blending
information technology and care process models. The real result of the MS project is the
resultant, working prototype. The paper ends with the Conclusion chapter, along with
future recommendations for logical next steps with the model and other possible research
that could come out of the CCMT.

51
BACKGROUND
General Concepts
The background chapter is broken down into sections. Each section will cover a
topic relevant to the overall master’s project. First, I cover general concepts such as
chronic disease management and a data warehouse. Later in the Background chapter, I
cover more in depth the Intermountain Healthcare adoption of the general concepts to
establish a contextual framework for the reader.
Chronic Disease Management
Chronic disease affects a significant percentage of the US population. Among the
most pervasive diseases are congestive heart failure, diabetes, asthma, and depression.
Over 24 million Americans have diabetes (1). Nearly one in five Americans over 60 has
diabetes and it is estimated that one in three Americans born in 2000 will develop
diabetes over their lifespan (2). The financial burden of chronic disease is staggering.
One in five health care dollars is spent on caring for someone with diabetes and one in
ten dollars spent on health care can be attributed to diabetes and its complications (3).
Americans spent $18 billion treating asthma in 2008 (4), though cost to society through
lost productivity estimates true cost at $56 billion (5). As sobering as these statistics may
be, the effects of depression are almost overwhelming. In 2009, depression was
considered to be the largest cause of disability on a global scale by 2010 (6). Long-term

7
costs of those with psychological problems during childhood include diminished
educational opportunities, reduced incomes, and reduced likelihood of marriage along
with an overall estimated cost of $300,000 in lost family income over a lifetime. Total
lifetime economic cost for those affected is $2.1 trillion (7). Treatment of chronic disease
within the Primary Care setting continues to rise, currently accounting for 35% of all
Primary Care Physician (PCP) visits (8). By 2051, 50% of people over 50 will have a
chronic condition (9). Managing patients with multiple chronic conditions is possibly the
greatest challenge for today’s PCP (10-14).
Wagner Chronic Care Model
Chronic disease is no respecter of persons. It affects young and old, rich and
poor. It affects people from all races and all walks of life. The varied nature of chronic
disease requires a multifaceted approach to manage disease progression. As a result,
models of chronic disease management address several components of disease
management, including organizational factors (15-21), the medical home concept (22-
23), payment models and reform (24-26,27), Care Process Model (CPM) development
(28-29), decision support systems (DSS) (30-32), and information technology (IT) (33-
37).
One model of chronic disease management has been adopted more than any other.
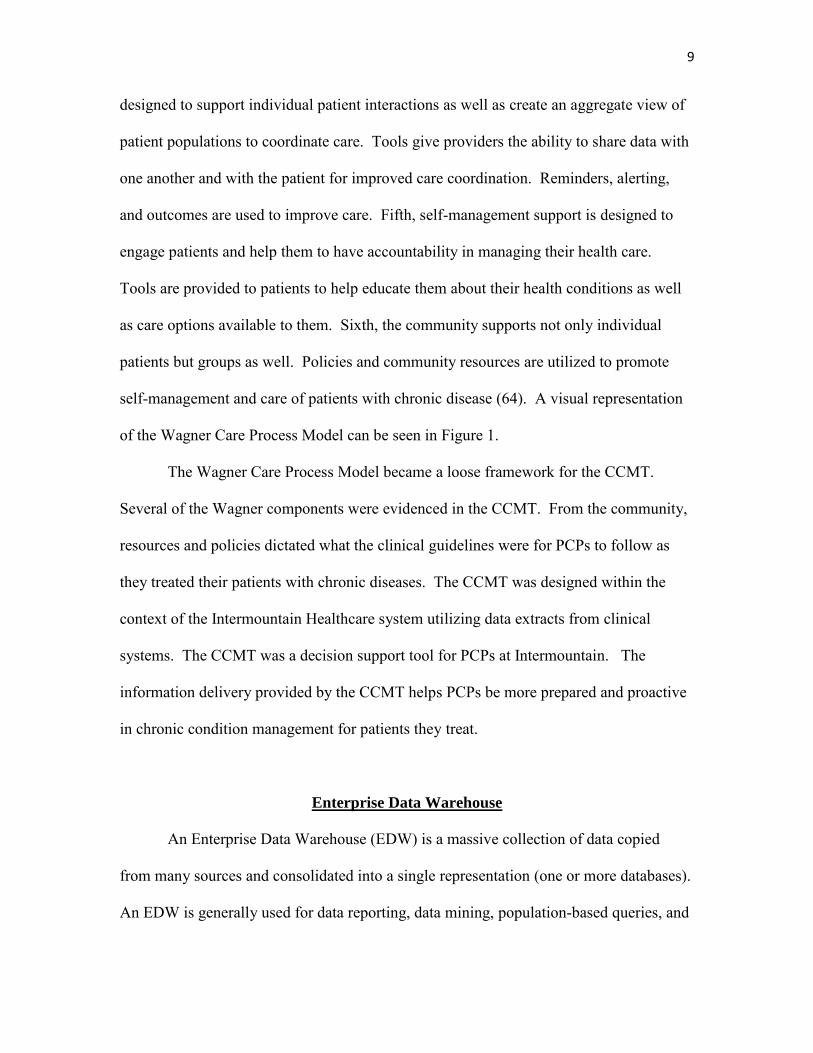
It is the Wagner Chronic Care Model. See Figure 1. The model provides a framework of
core elements to guide tools or programs designed to address chronic disease
management. There are six core elements. First, the health care system is responsible for
promoting safe, quality care. This initiative must be driven at all levels within an

8
organization, from executives, to clinical staff, to support services with the end goal of
improving and coordinating care. Second, delivery system design seeks to promote
effective and efficient clinical care. Appropriate interventions, reminders, and systematic
follow-up are built into care delivery. Third, decision support is delivering the best care
according to best protocols. Evidence-based guidelines are understood and consistently
applied across the health care system. All members of clinical staff have access to and
are continually trained in best practices. Fourth, clinical information systems are
Figure 1. The Wagner Chronic Care Model.
.components.
Improved
Outcomes
Informed, Activated Patient
9
designed to support individual patient interactions as well as create an aggregate view of
patient populations to coordinate care. Tools give providers the ability to share data with
one another and with the patient for improved care coordination. Reminders, alerting,
and outcomes are used to improve care. Fifth, self-management support is designed to
engage patients and help them to have accountability in managing their health care.
Tools are provided to patients to help educate them about their health conditions as well
as care options available to them. Sixth, the community supports not only individual
patients but groups as well. Policies and community resources are utilized to promote
self-management and care of patients with chronic disease (64). A visual representation
of the Wagner Care Process Model can be seen in Figure 1.
The Wagner Care Process Model became a loose framework for the CCMT.
Several of the Wagner components were evidenced in the CCMT. From the community,
resources and policies dictated what the clinical guidelines were for PCPs to follow as
they treated their patients with chronic diseases. The CCMT was designed within the
context of the Intermountain Healthcare system utilizing data extracts from clinical
systems. The CCMT was a decision support tool for PCPs at Intermountain. The
information delivery provided by the CCMT helps PCPs be more prepared and proactive
in chronic condition management for patients they treat.
Enterprise Data Warehouse
An Enterprise Data Warehouse (EDW) is a massive collection of data copied
from many sources and consolidated into a single representation (one or more databases).
An EDW is generally used for data reporting, data mining, population-based queries, and

10
research (47). An EDW does not generally create data; rather, it copies existing data
from one or more transaction systems (sources) and stores a local copy that permits
longitudinal and relational views of the data, transforming data to information.
Figure 2 shows components found in a typical health care EDW. On the left of
the diagram are examples of source systems that may feed into an EDW. The center of
the diagram shows the EDW proper. Before any data are ready for use in the EDW, they
need to go through a preparatory process. First, the data are pulled into a staging area in
raw form. Next, data are cleansed and finally, if deemed appropriate (by the business),
data are summarized into logical groupings. The purpose of cleansing data is to ensure
that data in the EDW consistently represent the source systems, and equally important,
that EDW data consistently represent business rules. One of the natural consequences of
data cleansing in the EDW is that it surfaces bad data captured in source systems.
Generally, rules or constraints exist on source systems that dictate the method of data
capture. When rules are ambiguous or not enforced, data entry on source systems may
allow the capture of incomplete or erroneous information. For example, a laboratory
system may require each of the following fields to have a value entered before the
program will complete a transaction: the patient account number, the lab test, the nurse
ID, the location of the lab draw, and the date and time the lab result was completed.
However, suppose the data collection/storage program only required that some value, any
value, be entered into each field. The person entering data in theory could enter gibberish
into each field and the system would accept the transaction. This type of erroneous data
is exposed when reporting against the EDW is instituted. As erroneous data are surfaced
through the EDW, the business needs to come up with rules for how to deal with bad or

51
Figure 2. An example of enterprise data warehousing components. Related data are grouped into data marts. Reporting is built off the EDW.
11
management
analyst
Clinical staff

51
incomplete data (e.g., do they include it or not?). These issues of data quality are often
addressed in the process of data staging, data cleansing, and data summarization. It
should be noted that data staging and cleansing could also be done as part of the extract,
transform, load (ETL) process. Vended ETL tools typically offer these features.
Reporting against the EDW is represented in the far right portion of Figure 2.
Reporting is a crucial part of data warehousing. It is the public-facing component for
most users who consume data from the EDW. The concept of reporting against the EDW
is explored in detail in the background section, Reporting Against an EDW.
The advent of data warehouses was driven by a need to do analysis over
extremely large data sets and got its start at IBM with Barry Devlin and Paul Murphy
(48). They coined the term ‘information warehouse’. The practicality of data
warehousing took hold in 1991 when W.H. “Bill” Inmon published his book, “Building a
Data Warehouse” (John Wiley and Sons). Today data warehousing is present in many
industries, including banking, airlines, retail, manufacturing, and health care. Sources that
feed into an EDW are usually transaction systems designed to process individual
transactions and focused queries. Examples of transactions within transaction systems
may include a pharmacy order for a patient, a withdrawal from a bank account, or
perhaps a retail purchase. These systems are referred to as Online Transaction Processing
(OLTP) systems. They are optimized to quickly perform many individual transactions
almost simultaneously. However, OLTP systems are generally poor at performing large
population queries that may include multiple transactions in aggregate. In fact, running
large queries against a transaction system can bring performance to a halt; hence the need
for an EDW.
12 12

13
In a data warehouse, data are organized and often tuned to allow large reports
(queries) to run. By making copies of data and moving the data to a separate, physical
environment, queries run against the copied data in the EDW will have no effect on the
original source system(s).
The process of extracting, transforming, and loading (ETL) data into an EDW
takes place at periodic intervals. This process requires a connection between the EDW
and the source system(s) of interest. Once the connection is established, data are pulled
from the source system into the data warehouse. The connections can be manually built
with computer programming languages or they can be automated and scheduled using
tools available to IT professionals. IBM and Microsoft are two mainstream vendors of
ETL tools: DataStage and SQL Server Integration Services, respectively. After the data
pull is complete, the connection between the EDW and the data source is severed. The
ETL process is repeated at intervals set by the business requirements. Many source
systems have stringent uptime requirements. For ETL processes to be effective, they
need to minimize the impact they may have on the source systems. Consequently, the
time of day for ETL is important. If the source system is busy during normal business
hours (9-5), then the load needs to take place outside of these hours. Ideally, the load
would take place as close as possible to the start of business hours. That way, even
though data are loaded daily, the visible data in the EDW are not actually 24 hours old. If
the ETL process ran at 6:00 AM and finished by 6:30, then the EDW data used for
analysis that same day would never be more than 10.5 hours old, assuming the work day
ends at 5:00 PM. This may seem a trivial detail but is actually quite important to users
consuming data from the EDW.

14
Another consideration for loading the data is the method of loading. How much
data need to be pulled from the source system each night? The answer to this question
lies in the business needs for data analysis from the EDW, the size of the source system
data source, and the tax of the ETL process on the source system when loading. If the
need for the most up-to-date data is paramount to all other business requirements, then
the load needs to be sure to capture the most recent data changes with row-level
(transaction-level) precision. This is the most complex type of data load. The reason for
the complexity is the potential transient nature of the data on the source system. It is not
uncommon for some records to change, particularly within a high-volume system. When
a record is copied from a source system and written into the EDW, the EDW record
represents a set of values on that record that were present at the time of the ETL process.
However, a record can, and sometimes does, change on the source system after the ETL
process has already taken place. Changes made to source records that were previously
pulled into the EDW lead to inconsistencies between the EDW and the source system. If
not reconciled, the EDW data will not be trusted and users will revert to pulling their
reports from source systems, defeating the purpose of the EDW, and consequently,
putting an undue reporting burden on the transaction system. The EDW needs to have a
robust, proven method for identifying changes on copied rows and ensure high data
integrity through automation and auditing.
Considering the size of the source systems is important. Many tables that are
copied to the EDW are reference or look-up tables. That is, they contain key values that
are referenced by activity tables to record events. An example of a reference table may
be a list of all laboratory tests a laboratory is able to perform. The table may contain the

15
full medical name, an acronym for the test, and the type of test (blood draw, saliva, swab,
stool, etc.). Reference tables as a general rule do not contain many rows (thousands)
when compared to activity tables (tens of millions). For this reason, reference tables are
good candidates for a full refresh method, meaning the copied data in the EDW version
of the table are deleted each night and then completely reloaded from the source system,
guaranteeing the EDW and source system stay synchronized. Activity tables, on the
other hand, are quite large and cannot practically be copied in their entirety each night.
ETL processes against these tables are usually done in an incremental method,
identifying only those rows which do not already exist in the EDW and pulling them into
the EDW. An additional step in the ETL process may look for rows that were copied
already but have since been changed on the source system, and the changes are pulled
into the EDW and updated on the existing rows. The Data Architect responsible for the
incremental ETL process needs to understand how far back changes could be made on
source system rows. Otherwise, changes will be missed. Some source systems could
have changes on rows which are months old, a common practice in the adjudication
process on claims systems.
One final consideration for ETL is the tax imposed on the source system by the
data pull. If the burden is heavy and the source system cannot support the weight, an
EDW solution may require an intermediate step called an operational data store (ODS)
that is nothing more than a scaled-down copy of the source database. In an ODS,
transaction records are posted twice for each record with one row writing to the
transaction system and another row being written to the ODS. This way, reporting can be
done against real or near real-time data in the ODS without affecting the source system.

16
Data can then be pulled from the ODS to the EDW without any imposition. Within an
ODS, copied data are generally stored for a period of up to the one year before being
purged. Advancements in database systems commonly found in data warehousing today
usually operate with such efficiency that the ETL burden is quite manageable. Data in
the EDW may be stored for years.
EDWs are used to support chronic disease management using disease registries or
data marts (16) with aggregate and individual patient data and Continuous Quality
Improvement initiatives (12,35). Reporting from EDWs has been used to study payment
reform and cost-savings of chronic disease management (25). Furthermore, the
effectiveness of the medical home (see the Patient Centered Medical Home background
section) is often analyzed and measured using EDW source data (11,44). EDWs are
central to the study of the aforementioned topics, none of which could effectively be done
against transaction systems. More virtues of an EDW are explored in the following
background sections, Disease Registries, Data Sources, and Reporting Against an EDW.
An EDW is a tremendous asset for an organization if implemented properly.
Copying the data into the EDW is an essential first step in adding value. With data
copied and consolidated into a massive, central data store, previously unrelated data can
now be grouped together. This grouping makes it possible to view events, transactions,
or even patient care with a more holistic view. One such application of data warehousing
technology is evident in health care, particularly in chronic disease management by
building disease registries.

17
Disease Registries
Health care organizations that use EDWs to support chronic disease management
often develop disease registries within their EDWs (15,27,67). A disease registry is used
to identify patients with a given disease, track clinical indicators, and follow disease
progression over time. Reports against these registries provide decision support to alert
clinicians when patients are due for care according to Clinical Practice Guidelines
(CPGs) (67) for a given disease. Generally, disease registries focus on one particular
disease, though an EDW may house many disease registries (see Figure 2).
Diabetes is a chronic condition which affects the body’s ability to manage blood
glucose levels. If not managed, diabetes can lead to blindness, amputation of extremities,
and even death (1-3). Three types of diabetes exist. Type I is the body’s inability to
produce insulin. This is often referred to as juvenile diabetes as it is generally discovered
in young children. With Type II diabetes, the body does not produce enough insulin or
cells ignore insulin. This is generally a later onset than Type I. Gestational diabetes
occurs in some women around 28 weeks of pregnancy where blood sugar levels may
deviate from the mother’s normal range (high/low). These definitions are simple enough
to understand when described verbally, using natural language such as English. It is also
possible to represent or describe diabetes as a disease using the language of information
technology.
Instead of combining words to represent diabetes, medical informaticists use
combinations of medical coding values for specific doctor visits, laboratory data, and
other codes to identify features which are characteristic of diabetes. For example, with
Type II diabetes, blood sugar levels tend to be elevated. Therefore, laboratory tests

18
indicative of blood sugar levels and related factors could be used to identify patients with
diabetes. Furthermore, the values of the tests could be used as indicators of the disease
progression. Hemoglobin A1C, Microalbumin, high-density lipoprotein (HDL), and low-
density lipoprotein (LDL) tests are lab values used by health care institutions to track
diabetes progression in their diabetic population, though some variation may exist.
The diabetes laboratory tests described above provide a means of clinical data
abstraction to logically represent the presence (or absence) of diabetes in a patient. For
example, if a patient had an HBA1C > 9, that could be an indicator that the patient has
diabetes. This lab result, along with other clinical indicators (HDL, Microalbumin) could
lead a clinician to diagnose the patient with diabetes.
Laboratory Information Systems (LIS) track lab orders and results for patients.
An LIS is a good example of a source system that can be used to feed into an EDW.
Using clinical data captured by an LIS coupled with knowledge of CPGs for a given
disease, such as diabetes, may be logically grouped together to represent a disease in
what is known as a disease registry (see Figure 2).
This logical representation of disease may reside within an EDW. It makes sense
for registries to live in a data warehouse. Data from disparate data systems, (e.g., an LIS,
an EMR, and a medical insurance claims system) can be logically and physically grouped
together to identify patients who meet the health care organization’s definition of a
disease. Once patients are identified in a given disease registry, clinically relevant data
are captured and analyzed over time. The data may also be used to track disease
progression on patients, thus providing clinicians the potential for a more complete view
of the disease than is available by tracking patients on the individual source systems. The

19
clinical data (or lack thereof) can also be used to measure care delivered by providers.
Data can also be used to track providers’ compliance with established protocols for best
practices of disease management.
The process of logically grouping data within an EDW is called a data mart.
Referring back to Figure 2, note that data marts surround the registries found in the
EDW. A data mart can hold any number of registries, though the intent is generally to
group like data together so it would be odd to have registries not related to one another to
reside in the same data mart. From these logical groupings emerge disease registries.
Data Sources
Many data sources can and often do feed into a data warehouse (43). Figure 2
showed data sources as the foundation of the ETL process. Data sources can come in a
variety of forms. They can be spreadsheets, delimited file structures, or databases.
Typically, a data source is the database behind a transaction system. Within a source
(database), there may be many tables required to support the front-end application. Not
all tables in a source database need to be copied into the data warehouse. Ideally, if a
source system is well documented, a vendor may include a data model, making the ETL
process much easier. The data model helps to clarify which tables contain data of interest
to pull into the EDW. Reference tables are easier to identify as well. Unfortunately,
few vendors provide support or documentation on their underlying data model. This
makes the ETL process a serious chore to make sense of undocumented and often poorly
named tables.

20
Source systems are built for a specific purpose. For example, a billing system
will document everything needed to generate a complete bill for a client. A hospital
scheduling system will capture all that is needed to set up an appointment, to register a
patient upon arrival, to transfer, and to discharge a patient. An electronic medical record
system will have the ability to capture clinical information about a patient. Each of these
source system examples could contribute data to create an EDW rich with information.
In the health care industry OLTP, sources of data regularly include financial data
(billing), insurance claims (Medicare, Medicaid, private insurance, etc.), as well as
electronic medical records (EMR).
Two challenges arise in the process of building accurate and dependable disease
registries. The first challenge lies in identifying which data elements are representative
of the disease in question. Data architects need to work closely with those who
understand well the process of clinical flow with its accompanying documentation in the
source systems. This cooperative approach will greatly improve the odds of accurately
capturing relevant coding and will ensure that the disease registry accurately identifies
those patients with the chronic disease in question. The second challenge that surfaces
when trying to build a disease registry lies in rich, overlapping data sets. The risk here is
to not over-represent data elements on a patient by combining all feeding sources into one
source of truth while not omitting key elements which could preclude patients from being
included in a registry.

21
Reporting Against an EDW
With source systems identified, connected to, and feeding into a data warehouse
and with data logically grouped into data marts and registries, an EDW is well prepared
to support reporting needs. A data warehouse may hold tremendous value for an
organization (43), but the value is not in simply having stored terabytes of data. The real
value of the EDW is getting information out of data. This is best evidenced via the
process of reporting.
Figure 1 showed that the final stage of an EDW is the reporting process. The
reporting aspect of an EDW is how most people will interact with an EDW. Reports can
be created, scheduled, automated, and delivered to thousands of information consumers
internal or external to an organization. Vended systems support a host of reporting needs,
from simple, one-time reports to incredibly complex enterprise dashboards. Some of the
biggest reporting vendors today are Cognos (IBM), Business Objects (BO), Oracle, and
Microsoft (SQL Server Reporting Services (SSRS) and their BI stack). Daily business
and operations thrive on timely data and reports and many of these reports stem from a
data warehouse.
Reporting Challenges
Reporting against an EDW is difficult. The burden of report development
typically falls within a data analyst role. A successful data analyst tasked with report
development must acquire a suite of technical skills (52). S/he must have the ability to
directly query a database, most often using a computer language called Structured Query
Language (SQL). S/he must be able to relate data from different tables to one another in

22
meaningful ways. S/he must understand how data are structured within a database and
how to interpret data models and database documentation. S/he must be able to create
reports using some form of reporting tool (Excel, Cognos, BO, Oracle, or SSRS) and
deliver the data to those who need the data in a timely, secure manner. Developing this
skill set can take years to become truly proficient. The learning curve in each of these
areas is steep. Consequently, relatively few people actually have direct interaction with
an EDW. Generally, a data warehousing team composed of data architects and data
analysts (or IT equivalent) along with some departmental analysts have security clearance
to directly query the EDW. The overwhelming majority of people within an organization
know their EDW only through reports they receive from a vended product (Excel, BO,
Cognos, SSRS, etc.) or from a report portal on an internal website.
Consistently reporting information across an enterprise is a desirable asset for any
organization (43). Consistent representation of data is a second challenge which arises
when reporting against an EDW. The challenge is magnified when attempting to
aggregate and report on data to all levels of management within the organization.
Developing a consistent version of the truth is a tremendous undertaking (43). The
availability of multiple, overlapping data sources within an EDW can lead to
inconsistencies in reporting (43,35). It is not uncommon for personnel to spend as much
as 70 percent of their time searching for and reconciling information (45). This is both
frustrating and terribly inefficient. Furthermore, managers and executives are frustrated
by inconsistencies in reporting. What one analyst reports may not necessarily agree with
what another analyst reports. This issue is not unique to Intermountain. Executive

23
mistrust in data is an unfortunate commonality among many organizations and industries
(45).
Clinical Practice Guidelines
Most diseases have specific guidelines of care. To aid physicians in the
management and treatment of disease, clinical guidelines and protocols have been
developed. These are known as Clinical Practice Guidelines (CPGs). They are based on
clinical evidence and leading experts in the field to establish recommendations for
diagnosis, treatment, and management of diseases (46). The guidelines help to establish
standards of care (47). When followed, they can improve the quality of care delivered to
the patient (47,49). Traditionally, CPGs typically focus on one disease (50). When
patients have multiple comorbidities, it is difficult for PCPs to follow CPGs because at
times, different CPGs may contradict one another or collectively become too burdensome
and/or complex for the patient to follow (51).
In this study, primary care physicians are held accountable for their level of
adherence to CPGs for three chronic conditions.
Patient-Centered Medical Home
Over the last few years, the Primary Care Clinical Program at Intermountain
Healthcare has engaged in considerable dialogue around the concept of the patient
centered medical home (PCMH). A medical home is a physician-directed, patient-
centered team approach to health care delivery with the purpose of improving and
coordinating referrals and medical services (23,53). The American Academy of

24
Pediatrics (AAP) first introduced the idea of the “medical home” in 1967 as a means of
improving the care of children who had special health care needs (54). In 1978, the
World Health Organization (WHO) recognized the pivotal role of primary care stating it
“is the first level of contact of individuals, the family and community within the national
health system bringing health care as close as possible to where people live and work,
and constitutes the first element of a continuing care process” (55). The PCMH is viewed
as a key element of health reform, specifically to improve patient outcomes and to lower
costs in primary care (56-62). States with greater reliance on primary care services tend
to have lower Medicare spending, lower resource use, lower utilization rates, and higher
quality of care (57).
The chronic conditions management tool (CCMT) developed in this study is
intended to be used by PCMH staff (and other audiences). PCPs, nurses, and office staff
may find that the CCMT supports coordination of care by alerting clinical staff to gaps in
CPG adherence on patients with chronic disease.
Dimensional Modeling
Key to the CCMT is a method of data modeling called dimensional modeling. A
dimensional model gets its name from the central table (fact table) that identifies the
subject to be measured. Surrounding the fact table(s) are additional tables called
dimensions (such as patient, provider, and reporting period). The primary key on the fact
table includes the foreign keys from the surrounding dimensions. This enables quick
look-ups when querying the cube. A cube is aggregated view of data that may be

25
analyzed along multiple dimensions. The dimensional data model underlying the CCMT
can be seen in Figure 3.
When viewing the data stored in a cube, browsing takes place along the fact via
one or more dimensions. For example, you may want to see compliance rates for asthma
CPMs such as PFT and controller, and view these measures by reporting period and by
provider. The ‘by provider’ and ‘by reporting period’ are dimensions and they allow you
to slice through the fact table data/measures in meaningful ways. Data that can be
aggregated into natural hierarchies are ideal for cube technologies. Measures can be
categorized into groups and rolled up or aggregated into hierarchies, such as by product,
by store, by city, by state, by country, etc. Financial data lends itself well to hierarchical
organization. Time components are well suited to cubes as well (e.g., hour, day, month,
quarter, and year). Clinical data may also be represented via cube technology, though not
without some element of transformation to categorize and/or establish hierarchical
organization conducive to cubes.
Cubes
Microsoft acquired its cube technology from Isreali-based Panorama Software in
1996. A couple years later, Microsoft released OLAP services as part of SQL Server 7.
Since then, major advancements have been made in cube technology. A cube is roughly
analogous to an Excel pivot table, though far more powerful. Today’s cube technology is
housed within a robust database engine that allows people to sort, arrange, filter, and
aggregate tens of millions of rows of data with subsecond response time. Furthermore,
browsing the cube can be done by someone who is not technically adept. Data can be

51
Figure 3. An example of dimensionally modeled data. Dimensions can relate to more than one fact table, as is the case in this example.
27
Chronic Conditions Dimensional Model
26

27
viewed across multiple dimensions simultaneously. Cubes allow nontechnical people to
do much of their own analysis on data from an EDW without having to rely on an analyst
to extract data from the data warehouse. Using the data tab in Excel 2007, a direct
(OLAP) connection is made to the cube. In this manner, Excel acts as a viewer for the
back-end data. Other tools such as ProClarity, Tableau, and PowerPivot can also be used
to connect to and browse cubes.
The tool used to design and build a cube is a Microsoft product called the
Business Intelligence Developer Studio (BIDS). It is a Visual Studio application. The
cube design is managed at the desktop level through BIDS. SQL Server Analysis
Services (SSAS) is the name of the Microsoft technology used to process data within
cubes. When the cube is ready to be processed, it is deployed to the server hosting the
SQL Server Analysis Services engine. After deployment, the cube must be processed by
the SSAS engine. That means, it creates every possible, valid relationship for all
dimensions and fact in the model. In this way, the cube knows exactly what data to
render for viewing when a user using Excel (or some other cube-browsing tool) chooses
specific dimensions and measures for data analysis.
SSAS requires the underlying data model of a cube to be dimensionally modeled.
SSAS cannot process a relational model. SSAS will evaluate and pull in the dimensional
model to create relationships across all (requested) dimensions through the fact table.
Any hierarchies within the dimensions of the dimensional model can also be pulled in to
the cube.

51
Intermountain Healthcare Context
The context for this study was the Intermountain Healthcare system.
Intermountain Enterprise Data Warehouse
At Intermountain Healthcare, data are pulled into the EDW on a daily basis with
the bulk of ETL jobs running between midnight and 5:00 AM. All data used in CCMT
came from Intermountain’s EDW. The EDW is built on an Oracle platform, version 10g.
There are roughly 10 terabytes of data in the Intermountain EDW.
Intermountain Disease Registries
At Intermountain Healthcare, much focus and effort has been put into chronic
disease management. Congestive heart failure, coronary obstructive pulmonary disorder,
asthma, diabetes, and depression are a few diseases actively managed at Intermountain.
For this study, only three diseases were included in the CCMT: asthma, diabetes, and
depression. Management of these three diseases falls predominately to the Primary Care
Clinical Program (PCCP). The PCCP is explained in the Primary Care Clinical Program
background section.
Similar to other health care organizations, Intermountain relies on its EDW to
support chronic disease management. Clinical data elements are drawn from
representative data sources to effectively represent diseases. For example, within the
diabetes registry at Intermountain, Hemoglobin A1C, Microalbumin, HDL, and LDL lab
test values are used to track diabetes progression in their diabetic population. At
Intermountain, the most common method of using data to classify someone as diabetic is
28

29
found in the type of office visit billed. For a provider to be reimbursed for work done
during a patient visit, the provider fills out specific forms with detailed billing codes and
these are used as proof of work done to reimburse the clinical staff. Examples of a
diabetic office visit type could be a 15-minute diabetes wellness check-up or an
emergency room visit for diabetes complications. Using data captured in electronic
medical records, electronic billing systems, and electronic claims systems, patients with
diabetes and other chronic conditions can be identified. At Intermountain Healthcare,
many data-rich sources exist from which disease definitions may be extrapolated (32).
At Intermountain Healthcare, clinical programs have been developed around
business lines. Women and Newborn, Pediatrics, and Primary Care are a few examples.
These clinical programs rely heavily on the EDW to help them better understand
processes of care, efficiencies, quality improvement, and outcomes. Intermountain uses
the EDW for research purposes as well.
It is worth noting some unique features of Intermountain’s diabetes, asthma, and
depression registries. The diabetes registry is biased toward patients covered by
SelectHealth (the insurance division of Intermountain Healthcare) and focuses primarily
on outpatient treatment with little emphasis on inpatient and/or emergency room visits.
The bias from SelectHealth is significant because it illustrates how disease registries vary
from one institution to another. Intermountain’s definition of diabetes, as represented in
the diabetic registry, excludes patients who are only identified and treated for diabetes
while in an inpatient setting. Oddly, the registry does not distinguish between type I and
type II diabetes. The reason behind these peculiarities reflects the fact that the diabetes

30
registry was initially designed as a HEDIS (insurance accreditation) reporting system
rather than a decision support tool.
There are financial incentives for providers in the Medical Group to manage their
diabetic populations. Only PCPs are eligible for the SelectHealth-driven financial
incentive. SelectHealth wants to reward its PCPs who manage well their covered diabetic
population. The philosophy is that if the patient with diabetes is not being treated within
the Intermountain primary care network, then they are not the responsibility of the
Primary Care Clinical Program for ongoing diabetes management.
The asthma registry has an even greater SelectHealth bias. Only patients covered
by SelectHealth are included. This is in consequence of the way Intermountain has
chosen to manage its asthmatic patients, namely tracking use of medications of its
patients with asthma. Furthermore, this measure of filled prescriptions is required for
HEDIS reporting. The only patients on whom Intermountain has a nearly complete view
of pharmacy orders and fills is on those patients Intermountain both treats and insures.
The consequence here is that many patients who are treated for asthma and who could be
easily included in the asthma registry are excluded because Intermountain does not yet
have a good way to track pharmacy fills for non-SelectHealth patients.
The depression registry is the most inclusive of these three registries. It is also the
least influenced by SelectHealth initiatives. Some of the disease definitions for
identifying patients with depression were influenced by SelectHealth. However, all
patients regardless of insurance coverage are identified and included in the depression
registry. Included are patients who were identified with depression in an outpatient

31
environment as well as those identified with diagnosed depression in an inpatient/ER
setting.
Intermountain Data Sources
Although source systems support specific and varied business needs, sometimes
the data from source systems may overlap in content. For example, a patient treated
within Intermountain’s integrated health care system may be treated for diabetes at one of
the Intermountain clinics. A bill will be processed and generated for care provided.
Medical coding standards have developed over the years to identify what was done to the
patient, by whom, and when it was performed. These coding standards exist in most
health care systems. Clinicians are paid based on what was documented in the billing for
the visit. They have a vested interest to code appropriately to ensure proper payment.
Two common medical coding standards are CPT and ICD-9/10 standards. Current
Procedure Terminology (CPT) codes are used for physician billing by documenting
exactly what was done on the patient and by whom. International Classification of
Disease, Version 9 (ICD-9) and Version 10 (ICD-10) codes are standard codes
classifying diseases and these are also used for billing purposes.
If the diabetic patient from the preceding example happened to be insured by
SelectHealth (Intermountain’s wholly owned payer), records would exist in the claims
system documenting what was done to the patient during the visit. The same CPT and
ICD-9/10 codes would likely exist in the claims and billing systems to document the
diabetic visit. Within the EDW, the billing and claims systems overlap in their
documentation for this patient visit even though claims and billing serve two very

32
different purposes. At Intermountain, the diabetes visit would have also been recorded in
detail within the EMR, thus creating an additional source of record for the diabetes care
received by the patient. Independently, the source systems which captured pertinent
information to document the diabetic visit would have no overlap. Within the data
warehouse, the combination of multiple data sets presents this unique and overlapping
perspective on the patient care.
As stated earlier, one of the challenges of disease representation within an EDW
is to not over-represent combined data elements coming from multiple source systems.
An example of over-counting could happen as follows. Within Intermountain’s EDW,
the definition of depression is represented through a number of rules. One of these rules
states that if a patient has two or more outpatient visits with a diagnosis of depression
during a one-year period, then a patient would qualify to be in the depression registry.
Suppose that a patient is covered by SelectHealth and this patient goes to her PCP for
depression-related treatment. Her PCP treats the patients for mild depression. Three
weeks later, the depression appears to have gone into remission. Assume the patient had
no other depression-related visits for the rest of the year. The PCP will bill SelectHealth
to reimburse the provider for care given. SelectHealth will generate a claim on the
patient visit.
In the example given above, if the patient had only one documented visit for
depression and no other depression rule was met during that year, then the depression
registry rules mandate the patient should not be included in the depression registry. This
scenario becomes interesting within the EDW. Data from billing and from claims are
brought into the data warehouse. Copies of the depression visit from both sources would

33
be included in the primary care data mart. If the data architect did not recognize that the
documented depression visit was represented in both claims and billing, and s/he used
both billing and claims as sources to feed the depression registry, s/he could erroneously
count the visit twice and consequently put the patient into the depression registry. The
ETL process requires that data architects understand how data from different source
systems can be related and how they may not be related. The risk here is to not over-
represent data elements (false positive) on a patient by combining all feeding sources into
one source of truth while at the same time not omitting key data elements (false negative)
which could preclude qualified patients from being included in a registry.
Reporting Against Intermountain’s EDW
In 1999, the first version of the diabetes registry was built at Intermountain
Healthcare. The asthma registry was built a year later. In 2005, the first depression
registry was built. Much of the value from the registries surfaced through reports built on
data found in the registries. For the first time, PCPs could get a population view of their
patients suffering from chronic disease. From 2000 – 2008, PCPs received a quarterly
report for the diabetes and asthma registries. A robust algorithm was developed to map
patients to a PCP each reporting period. All patients mapped to a provider would show
up on his/her diabetes or asthma report (or both) at the end of each quarter.
Included in the reports were patient demographics such as name, age, and hospital
account numbers plus a host of clinical indicators. Over the years, the reports became
more sophisticated to help providers better manage their patients. For example, patients
were tiered into low, medium, and high-risk groupings. High-risk patients appeared at

34
the top of the report. Medium-risk patients were in the middle and low-risk patients
appeared at the bottom. The most recent lab values for some labs were displayed at the
patient level, allowing providers to get a feel for disease progression. For nearly a
decade, this model of disease reporting was refined and met many of the reporting needs
within Intermountain’s Primary Care Clinical Program. Nearly a thousand providers
received this quarterly report on their patients. In late 2009, reporting moved from a
quarterly basis to a monthly basis for asthma and diabetes. In 2009, the depression
registry was completely overhauled and the first depression report went out to PCPs with
their respective depressed patients. Since 2009, diabetes, asthma, and depression are
reported to PCPs on a monthly basis.
Ironically, the advent of the new depression registry presented new challenges for
PCPs. Adding one more disease-focused report seemed unsupportable to PCPs in the
Primary Care Clinical Program. PCPs became frustrated with the disease-reporting
paradigm. The common co-existence of diabetes and depression in patients was surfaced
through reporting on patients who had multiple comorbidities. PCPs had to manually
compare conditions of individual patients across multiple reports. These providers were
faced with the challenge of assimilating information on the same patient across two,
sometimes three, reports and the process of report comparison was disruptive to clinical
work flow.
Intermountain’s EDW has thousands of scheduled reports which run on a daily
basis, not to mention the thousands of ad-hoc daily queries run against the warehouse as
well.

35
Reporting Challenges at Intermountain
Intermountain’s approach to EDW accessibility has been to give appropriate
access to those (generally analysts) who need to use data to perform their core job
function. Database roles are created and given read-only rights on tables within the
EDW. People who are approved to access Intermountain’s EDW are added to these
database roles to access the data they need. Analysts at Intermountain write reports
against the EDW. Additionally, they have the ability to do ad-hoc queries against the
EDW. Quality improvement and research efforts at Intermountain drive analysts to
spend significant time writing ad-hoc queries against the EDW. Hundreds of employees
have access to query thousands of tables within the EDW. The rich data sources feeding
the EDW are a blessing and a curse. Analysts who do not understand overlapping
systems of record within the EDW run the risk of building reports which are incomplete
or inaccurate.
Operationalizing Clinical Practice Guidelines
Intermountain has adopted CPGs for chronic disease management. At
Intermountain, the process of operationalizing CPGs is referred to as a Care Process
Model (CPM). This nomenclature is a peculiar adaptation because outside of
Intermountain, a CPM refers to a framework or model of care, such as Wagner’s Chronic
Care Model (65). For the purposes of this study, any reference to a CPM will be within
the Intermountain context. Intermountain has developed CPMs around asthma, diabetes,
depression, and many other diseases. Several CPMs exist within the Primary Care
Clinical Program at Intermountain Healthcare. For example, the diabetes CPM

36
recommends that each year, the patient receives the following care: eye exam, foot exam,
blood pressure testing, Hemoglobin A1C, Microalbumin urine test, and HDL/LDL
testing. For asthma, the CPM mandates that the patient have a pulmonary function test
and that the patient be on a prescribed controller.
Primary Care Clinical Program
The Primary Care Clinical Program (PCCP) is one of several clinical lines
developed at Intermountain Healthcare . Others clinical programs include Pediatrics and
Women and Newborn. Clinical support services also exist, such as laboratory and
radiology. The purpose of clinical programs at Intermountain is to strategically align
business and clinical practices and to develop and disseminate best practices of care
along each clinical line. The PCCP holds a monthly meeting for regional directors and
their staff to attend. During this meeting, issues related to primary care are discussed and
resolved. CPMs are evaluated and refined within workgroups. Clinical outcomes are
often evaluated as well. This is a collaborative forum of collective discovery and
knowledge dissemination.
The PCCP is geographically diverse as Intermountain Healthcare provides care
across the entire state of Utah and some portions of Idaho. For practical purposes, the
PCCP is broken down into regions. PCPs within a given region report to a PCP acting as
a regional director. The regional director is responsible for ensuring that information
shared at the monthly PCCP meeting is made available to all who practice within the
region. It should also be noted that not all PCPs within the PCCP are employed by
Intermountain Healthcare. Some PCPs and clinics have business agreements with

37
Intermountain to align themselves with Intermountain in order to gain access to the many
resources available from an integrated system (such as an EMR, billing, labs, Rx orders,
etc.). These nonemployed PCPs are referred to as affiliated physicians. Regional
directors are responsible to ensure that affiliated PCPs and clinics also have access to the
information coming out of the PCCP.

51
METHODS
Tools and Technologies
All data used in this research came from Intermountain Healthcare’s EDW. The
EDW is built on an Oracle database platform, version 10g. Connections to the EDW for
querying purposes were done using Oracle’s freeware SQLDeveloper. The process of
extracting, transforming, and loading (ETL) data into the model was done completely
through hand-written, SQL scripts using SQLDeveloper. Scripting for table creation,
staging data, and ETL can be found in the scripting appendix. After data had been staged
and loaded into the final dimensional model, Microsoft’s Business Intelligence Developer
Studio (BIDS) was used to design the structure of the cube. SQL Server Analysis
Services (SSAS) was used to process the chronic-conditions cube. Microsoft SQL Server
2005 was the database platform for the back-end database where the cube was hosted.
Excel 2007 was used as the cube-viewing tool for this research.
Cohort Identification
All patients for this research were identified from the three chronic disease
registries within the Primary Care Clinical Program, namely asthma, diabetes, and
depression. Not all patients from the registries were included. Only patients that

39
appeared in at least one of the disease registries between 01-Jul-2009 and 28-Feb-2011
were included in this research.
Patients identified in the diabetes registry are 18 or older. Patients with any payor
type are included in the diabetes registry. A patient diagnosed with diabetes stays in the
diabetes registry until the patient moves away or dies. The asthma registry includes only
patients >= 18 years of age. Furthermore, only patients covered through SelectHealth
(Intermountain’s insurance arm) are included in the asthma registry. Asthma patients
must meet clinical definitions for asthma each reporting period or they fall out of the
registry and must qualify in a future reporting period. Patients from the depression
registry include all ages and payor types. A patient in the depression registry stays active
within the registry for one year at a time. If one or more rules qualify the patient to stay
in the registry, the most recent rule qualifies the patient to stay in the registry for another
year.
No attempt was made to challenge any of the rules of registry qualification for
any of the diseases. The model simply accepted the definitions of disease adopted by
Intermountain Healthcare. Mapping algorithms for the three disease registries differ in
their approaches to assigning patients to a PCP. The differences were acknowledged
though not challenged in this research.
The patient_classified table is the pivotal table for the diabetes registry. It
contains unique identifiers for each diabetic patient. Additional patient demographic
information is also captured. The tables surrounding patient_classified are supplemental
tables providing needed information, such as medications, results from laboratory and/or
clinical tests, and which PCP the patient belongs to for a given reporting period.

40
Figure 4 gives a visual representation of the organizational structure of the data
for the diabetes registry. It does not show logic or data elements behind the tables.
Payer information is captured in the pt_enrlmnt_hstry table. The table on the far
right of the diagram is the pt_dbts_test_smry table. It is the outward facing, visible
diabetes table that drives the monthly PCP diabetes report. One row in the
pt_dbts_test_smry table represents one patient for a given report period. The
pt_dbts_test_smry table is loaded monthly. Consequently, if a patient had diabetes for
the entire year of 2010, there would be 12 rows of data for the patient.
Appendix A shows the coding and logic used to identify patients with diabetes. It
also shows codes for clinical values of interest to help providers better manage their
diabetic patient populations respectively. Asthma and depression follow the same pattern
though similar registry diagrams and patient identification code examples are not
included in this paper.
Referring to Appendix A, the first page begins with documentation of the
primcare.patient_classified table. On the left of the model are source systems
(transaction OLTP) of record. Four primary sources are used to identify patients with
diabetes. They are Health Plans claims data, outpatient billing (IDX), CDR (Clinical
Data Repository, the database behind the electronic medical record) database, and
Sunquest Lab data. Additionally, pharmacy data are used as a source of exclusion criteria
to keep patients who have polycystic ovarian disease out of the diabetes registry.
Appendix A lists codes used to identify diabetic events. The combinations of
these data elements qualify patients for inclusion in the diabetes registry. Standardized

51
Figure 4. Key components of the data model for the Intermountain diabetes registry.
Intermountain Diabetes Registry
Intermountain Diabetes Registry
41

51
coding such as CPT, ICD-9, DRG, UB92, and NCID were used to identify diabetic
events from source systems. English definitions for each rule used to identify a diabetic
patient are documented as metadata in Appendix A. The rules for inclusion in the
registry were determined by the Primary Care Clinical Program (PCCP) leadership.
Appendix A lays the foundation for the diabetic registry by first identifying the
cohort of interest for a given time period. The remainder of Appendix A documents
additional attributes of interest for diabetic patients, such as blood pressure values and
dates, HBA1C values and dates, etc. All elements in the diabetic registry were defined
by the PCCP composed of clinical leadership.
The asthma and depression registries in the EDW follow a similar pattern as that
of diabetes. Each registry first identifies the cohort of interest for the current reporting
period, then captures supplemental attributes for the newly identified cohort. As asthma
and depression follow similar patterns to diabetes, they are not documented in Appendix
A.
Care Process Model Definitions
The Care Process Models (CPMs) used in this research were taken from those
adopted by the PCCP at Intermountain Healthcare for asthma, diabetes, and depression.
The asthma CPM is outlined in Table 1. For the diabetes CPM, see Table 2. For the
depression CPM, see Table 3.
42

43
Table 1. Identifies CPM components within the asthma data
mart at Intermountain.
Disease CPM Component
Asthma Pulmonary Function Test < 12 months Asthma Fill controller Rx < 12 months
Disease CPM Component
Diabetes Hemoglobin A1C tested < 12 months Diabetes LDL tested < 12 months Diabetes Microalbumin urine test < 12 months Diabetes Blood pressure tested < 12 months Diabetes Diabetes
Eye exam < 24 months Foot exam < 12 months
Disease CPM Component
Depression PHQ9 tested <12 months Depression F/U visit with PCP < 31 days after Inpt/ER visit Depression F/U visit with PCP < 46 days after PHQ9 >14
The tables above document the written English definition of CPM components for
asthma, diabetes, and depression. The data used to identify the CPMs come from
supplemental tables surrounding the aforementioned cohort table (patient_classified).
Using diabetes once more as an example, refer to Appendix A. The section labeled
primcare.test_result captures all laboratory tests/results relevant to diabetic management.
Specifically, the PCCP leadership tracks HBA1C, microalbumin, HDL/LDL, foot exam,
and eye exam data.
Table 2. Identifies CPM components within the diabetes data
mart at Intermountain.
Table 3. Identifies CPM components within the depression data
mart at Intermountain.

44
Within Appendix A in the primcare.test_result section, all source systems used in
the ETL process are identified. They are IDX, CDR, LabCorp, Sunquest, and
HealthPlans claims systems. Metadata for each value of interest within the
primare.test_result section is documented. The metadata definitions were determined by
PCCP leadership.
No attempt was made to challenge the validity of CPMs adopted by Intermountain
to manage their patients with diabetes, asthma, or depression. Existing metadata from the
asthma, diabetes, and depression registries, along with supplemental attributes, were
accepted and included in this work.
Patient Provider Mapping
At the time of this study, the Intermountain asthma, diabetes, and depression
registries are loaded on a monthly basis. For each reporting period, patients’ clinical
information is run through algorithms in an attempt to determine which PCP is most
likely responsible for a patient’s care. If a PCP can be identified, then the patient is
mapped to a provider. For this study, patients were mapped to PCPs using algorithms
already in place on each of the registries. Diabetes is the oldest, most trusted registry for
mapping patients to a provider. The priority of mapping for the CCMT went as follows:
1) if the patient has diabetes, use the provider to whom the patient was mapped for the
given reporting period; 2) If no mapping exists (these patients are referred to as
orphaned), check to see if the patient also has asthma for the same reporting period and
use that provider mapping; 3) If no mapping exists at the asthma level, move to the
depression registry and search for a patient/provider mapping during that reporting

45
period; 4) If no prior mapping exists, the patient is assigned to the orphaned group and
still counted in the study. For this study, an attempt was made to map patients to PCPs
for each reporting period.
Extract Transform Load Process (ETL)
Data elements used to represent the Care Process Model (CPM) logic for each
disease are embedded within the ETL process of each disease registry. CPMs are not
used for cohort identification. A CPM has applicability only after the disease cohort has
been identified. In other words, CPMs have a dependency on an already established
patient cohort.
For example, one component of the diabetes CPM requires that an HBA1C lab
test be run at least annually. A number of data sources in the EDW supply the data
needed to determine whether a component of the diabetes CPM was met or not. In the
claims data, there may be a specific CPT code indicating that an HBA1C test was
performed. Billing data may also contain that information using the same, standard CPT
code to identify the lab test. The EMR could also serve as source of the data. In this case,
it would not be represented using a CPT code. Rather, a unique code, called a numeric
concept identifier (NCID) specific to the health data dictionary and the CDR (back-end
database behind Intermountain’s EMR) could represent the HBA1C event. For a
complete listing of all coding, data elements, and sources for the diabetes registry, see
Appendix A.
To consolidate the potentially overlapping data sources needed to capture data
elements representing each of the CPM components, intermediate staging tables were

46
created. In Appendix A, referring to HBA1C identification in the primcare.test_result
section, the table test_result is one example of a staging table. Logic in the ETL process
consolidates overlapping copies of the same clinical event so that the complete event is
represented faithfully in the downstream, pt_dbts_test_smry table. A consistent, single
representation of the CPM elements emerges from the staging tables to the summary or
reference tables.
The ETL process above described the data flow from source systems into the
EDW and into the disease registries. Similarly, for this research, I created an ETL
process except that instead of pulling data from the original systems (claims, billing,
CDR, etc.), I used the existing asthma, diabetes, and depression registries as my sources
to feed the chronic conditions management model. No new data were brought into the
EDW for the CCMT. Additional tables within the EDW were included to support the
CCMT. Master reference tables were used to supplement characteristics for patients,
provider, clinics, and regions. The data flow for the CCMT is shown in Figure 5.
With all staging and reference tables loaded, the ETL process ran once for each
reporting period starting with 01-Jul-2009. Included in the loading of the dimensional
model is a patient-provider mapping for each reporting period.
The CCMT model required the ability to query large databases, extract data, and
write it out to staging and summarized tables. The EDW team granted me access to build
the CCMT within the EDW-DEV environment. I ran the ETL in EDW-DEV and was
able to populate the dimensional model in EDW-DEV as well.

47
Dimensionally Modeling Chronic Disease Management
The aforementioned Figure 3 shows the chronic conditions dimensional model. It
is made up of two fact tables, namely cpm_compliance_fact and dim_chronic_detail.
They are surrounded by three dimensions, namely dim_provider, dim_patient and
dim_rpt_period. The primary keys on the dimension tables are foreign keys in the two
fact tables to enable quick lookups. In the cpm_compliance_fact table, all components of
the asthma, diabetes, and depression CPM are captured as facts. The facts are tied to
providers and reporting periods to facilitate trending over time when the model is
consumed by a cube. Figure 5 shows the logical flow of data captured in the chronic
conditions dimensional model.
Diabetes
Depression
Chronic Condition Patients STAGE
Data are pulled from each disease registry for the same reporting period
and staged in the chronic conditions.
ETL
Patients mapped to providers and
providers to clinics for each
reporting period.
Chronic Conditions
Dimensional Model
Dimensional model created and
processed into a cube using SQL Server Analysis Services.
Mapping
Provider
Asthma
Clinic
Chronic Conditions
Cube
Reporting and analysis can run
through the cube or hit the dimensional
model directly.
Chronic Conditions ETL Flow Diagram
SSAS
Figure 5. Highlights key components within the chronic conditions data mart.

48
The dim_chronic_detail fact table captures data at the most detailed level. It includes
supporting attributes for related metrics. For example, in the cpm_compliance_fact table,
we could see whether or not a patient had an A1C test done during a given reporting
period. The dim_chronic_detail table includes more granular data by including the A1C
test date along with the resultant A1C value.
Cubes
The chronic conditions cube was built on top of the chronic conditions
dimensional model. It was hosted within the Intermountain EDW on an instance of SQL
Server 2005. The cube was processed using Microsoft’s SQL Server Analysis Services
(SSAS).
Cube Calculations
Within the CCMT, PCPs’ adherence to CPMs is captured and measured for their
respective patient populations. Rates of compliance to the CPMs were calculated within
the cube structure using Microsoft’s SQL Server Analysis Services (SSAS). The rates
were calculated at the individual PCP level for each CPM component (LDL tested, A1C
tested, etc.). To be included in the denominator for each CPM measurement, a patient
was required to have the disease pertaining to the CPM. To calculate compliance to the
diabetes CPM for eye exam testing, the calculation would be:

49
(Sum the number of eye exams for patients mapped to provider for given report
period)/
(Sum the number of patients with diabetes mapped to provider for given report
period)
The same calculation format was done for each component of each CPM (asthma,
diabetes, and depression). Rates were expressed as percentages within the cube. Excel
2007 was the tool chosen to view the chronic conditions cube. It is not uncommon for
patients to see more than one PCP during a reporting period so it is possible that credit
for CPM compliance may be given to a PCP when in reality, the measure was met by
another provider. This was acknowledged but not changed across the population.
Accessing the Chronic Conditions Cube
Excel 2007 was the cube viewing tool. Microsoft enhanced Excel 2007 to
seamlessly integrate with SSAS. Connecting to the cube requires a few simple steps.
After a connection was made, I saved and re-used the connection with future
connections/cube viewing. The chronic conditions cube did not attempt to tie in AD
security permissions.

50
RESULTS
CCMT
The Chronic Conditions Management Tool is the resultant product for this
project. 183,665 patients were included in the model between 01-Jul-2009 and 28-Feb-
2011. Four components constitute the CCMT. They are ETL, the chronic conditions
dimensional model, the chronic conditions management cube, and reporting against the
chronic conditions management cube.
ETL Scripting
All ETL coding may be found in Appendix A, including scripts for table creation,
data staging, and data loading into the dimension and fact tables.
Chronic Conditions Dimensional Model
The CCMT dimensional model contains a chronic conditions fact table, a patient
detail fact table, a patient dimension, a reporting-period dimension, and a provider
dimension. A diagram of the chronic conditions dimensional model is shown in Figure 6.
The CPM for each disease was logically represented within the dimensional model and
captured as non-key attributes (columns) on the fact tables. Two fact tables exist within
the dimensional model, namely dim_chronic_detail and cpm_compliance_fact.

51
Figure 6. Three dimensions and two fact tables are included in the chronic conditions dimensional model. All three dimensions relate to each fact table.
Chronic Conditions Dimensional Model
51
51

51
The grain (a row) of the pt_detail fact table uniquely identifies a patient mapped
to a provider for a given report period and includes the resultant lab values and dates for
care delivered over a given disease. The dim_chronic_detail fact table is the basis for
actionable, patient-detail reporting requested by PCPs. It captures data at the most
granular level of the reporting, that is, by patient and by reporting period. Every aspect
of each CPM is represented in the dim_chronic_detail table. Non-key attributes include
such data elements as, a diabetes flag (indicating whether or not a patient has diabetes),
an asthma flag, a depression flag, the last hemoglobin A1C result and date, along with all
other data elements captured to represent each disease CPM.
The grain of the cpm_compliance_fact table uniquely identifies a patient mapped
to a provider for a given report period columns representing all components of each CPM
for asthma, diabetes, and depression. No clinical values or dates were included in the
cpm_compliance_fact table. To represent compliance to the CPM for a given disease,
each component of the CPM was expressed as follows. If the CPM was met for a given
measure, a 1 was entered on the column; otherwise, a 0 was entered. For example, if a
patient had asthma during the 01-Jan-2010 report period, the asthma CPM requires that
the patient receive a pulmonary function test (PFT). If the patient had a PFT done during
the reporting period, a 1 would be entered on the PFT column. Otherwise, a 0 would be
entered. Nulls were not allowed on any measure field for any of the CPMs.
The model required that a patient have at least one chronic condition during a
given report period to have a row in either fact table. Sometimes, patients had multiple
comorbidities during a report period. Each fact table had a column to represent each
disease that a patient may have. For example, if a patient had diabetes and depression but
52

53
not asthma during the 01-Jan-2010 report period, then there would be a 1 in the diabetes
and depression columns on each fact table for that patient. However, there would be a 0
in the asthma columns for the same patient.
Three dimensions surround the two fact tables. They are dim_provider,
dim_patient, and dim_rpt_period. Dimensions are related to fact tables through foreign-
key relationships. The primary keys from the dimension tables constitute the primary
keys on the fact tables. The primary key on the dim_provider table is a surrogate,
identity key generated by the Oracle database. The dim_patient and dim_rpt_period
tables each have surrogate primary keys generated by Oracle, following the same pattern
as the dim_provider table. These surrogate keys comprise the primary keys on the
dim_chronic_detail and cpm_compliance fact tables. See Figure 5 to see the primary
key columns on the fact tables and their relationships to the dimensional tables.
The dim_provider table contains information about each clinician. It contains the
provider_id, to whom the provider reports (Medical Director), the provider’s last name,
and the primary clinic where the provider practices medicine.
The dim_patient table contains several demographic attributes on patients.
Gender, birth date, and age bracket were included to allow grouping of patients according
to gender and age. City, state, and other attributes were included as well.
The dim_rpt_period captured all the valid reporting periods for the course of this
study. This captured the start and end dates for each reporting period. These date
attributes allow all fact table measures to be viewed over time.
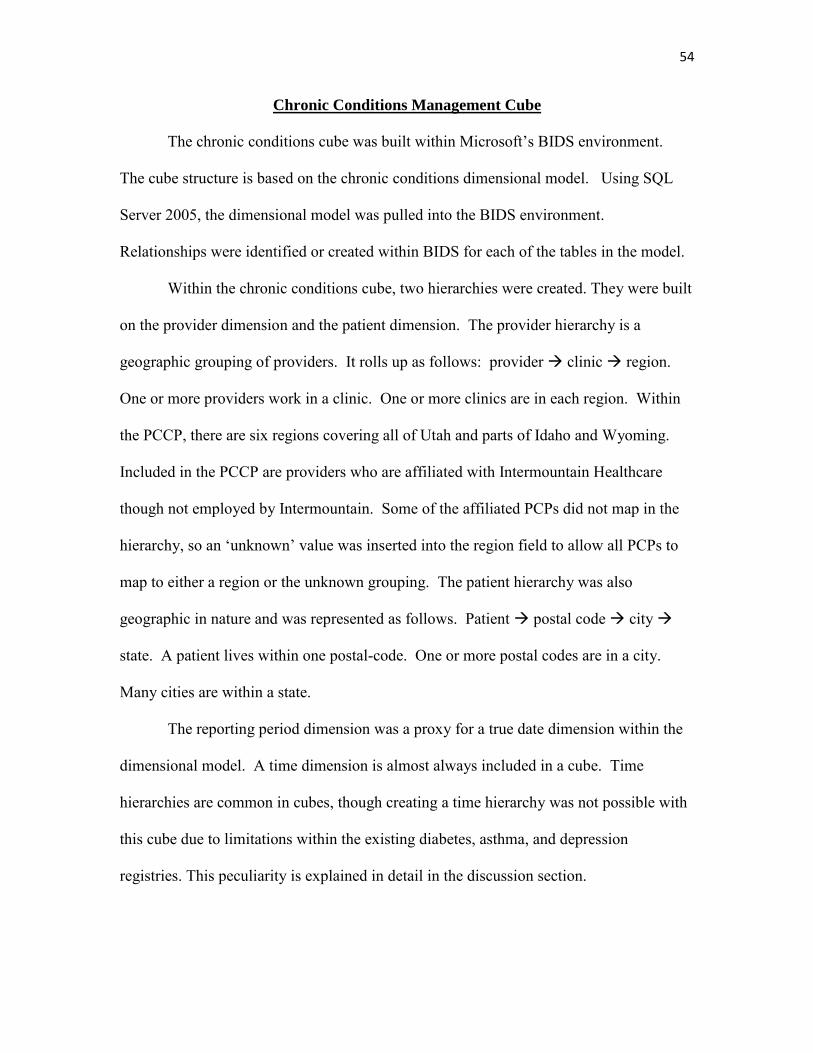
54
Chronic Conditions Management Cube
The chronic conditions cube was built within Microsoft’s BIDS environment.
The cube structure is based on the chronic conditions dimensional model. Using SQL
Server 2005, the dimensional model was pulled into the BIDS environment.
Relationships were identified or created within BIDS for each of the tables in the model.
Within the chronic conditions cube, two hierarchies were created. They were built
on the provider dimension and the patient dimension. The provider hierarchy is a
geographic grouping of providers. It rolls up as follows: provider clinic region.
One or more providers work in a clinic. One or more clinics are in each region. Within
the PCCP, there are six regions covering all of Utah and parts of Idaho and Wyoming.
Included in the PCCP are providers who are affiliated with Intermountain Healthcare
though not employed by Intermountain. Some of the affiliated PCPs did not map in the
hierarchy, so an ‘unknown’ value was inserted into the region field to allow all PCPs to
map to either a region or the unknown grouping. The patient hierarchy was also
geographic in nature and was represented as follows. Patient postal code city
state. A patient lives within one postal-code. One or more postal codes are in a city.
Many cities are within a state.
The reporting period dimension was a proxy for a true date dimension within the
dimensional model. A time dimension is almost always included in a cube. Time
hierarchies are common in cubes, though creating a time hierarchy was not possible with
this cube due to limitations within the existing diabetes, asthma, and depression
registries. This peculiarity is explained in detail in the discussion section.

55
Reporting Against the Chronic Conditions Cube
Reporting against the chronic conditions management cube was done using Excel
2007. An Excel file was emailed or directly installed on a PCP’s desktop to allow
him/her to connect to the cube. Five tabs were included in the Excel file. They were
named as follows: Asthma CPM, Diabetes CPM, Depression CPM, Patient Detail, and
Ad-hoc. The first four tabs included prepopulated tables and graphs. For a PCP to view
his/her compliance rates for the most recent reporting period on each tab, s/he would
select his/her PCP user-id from a drop-list and the table and graphs would be updated.
An example of the first tab for provider 29788 is shown Figure 7.
0.00%
20.00%
40.00%
60.00%
80.00%
100.00%
29778
Asthma CPM Compliance Rates Provider ID: 29778
01-Jan-2010 --> 31-Dec-2010
Controller Rate Pft Tested Rate
Figure 7. Provider example shows 100% compliance on controller rates and <40% compliance on pulmonary function tests.

56
The graph in Figure 7 indicates that provider 29778 was 100% compliant with the
asthma CPM for his/her asthmatics being on a controller medication during between 01-
Jan-2010 and 31-Dec-2010. The graph also shows that provider 29778 provided < 40%
of his/her asthmatic patients with the pulmonary function test. The diabetes and
depression tabs had similar graphs included as well, each showing levels of compliance
for each CPM component.
The Patient Detail tab within the Excel file gave providers actionable information
on their patient population only for the most recent reporting period. An example of the
Patient Detail tab is given in Figure 8. Blue columns highlight the three diseases
represented in the model. A red box indicates a component of the CPM that was missed
by the provider. A yellow-highlighted field indicates that a patient is within one month
of falling out of compliance for a given component of the CPM.
Figure 9 is an example of the ad-hoc analysis tab. This tab in the Excel file
allowed PCPs to explore the cube and do their own analysis. Highlighted are three key
sections. The section highlighted in red is where the measures are displayed. The values
rendered are a function of the other two highlighted areas. In the green highlighted
section, measures and dimension values are chosen to filter the selection. In this
example, both fact tables from the model are visible, namely cpm_compliance_fact and
dim_chronic_detail. The patient, provider, and report period dimensions are also visible.
The [+] sign next to each of the facts and dimensions indicate that each can be expanded
to reveal measures within the fact tables and attributes of the dimensions. The yellow
highlighted section shows the current selections from the facts and dimensions in the
green highlighted section.

51
Figure 8. Sample chronic conditions report for a provider at Intermountain. Diseases in the model are highlighted in blue with corresponding CPM elements in the columns that immediately follow each disease.
57
Chronic Conditions Patient Detail Report
57

51
Figure 9. Sample pivot table from the chronic conditions cube focused on provider ID 168.
Chronic Conditions Pivot Table
58
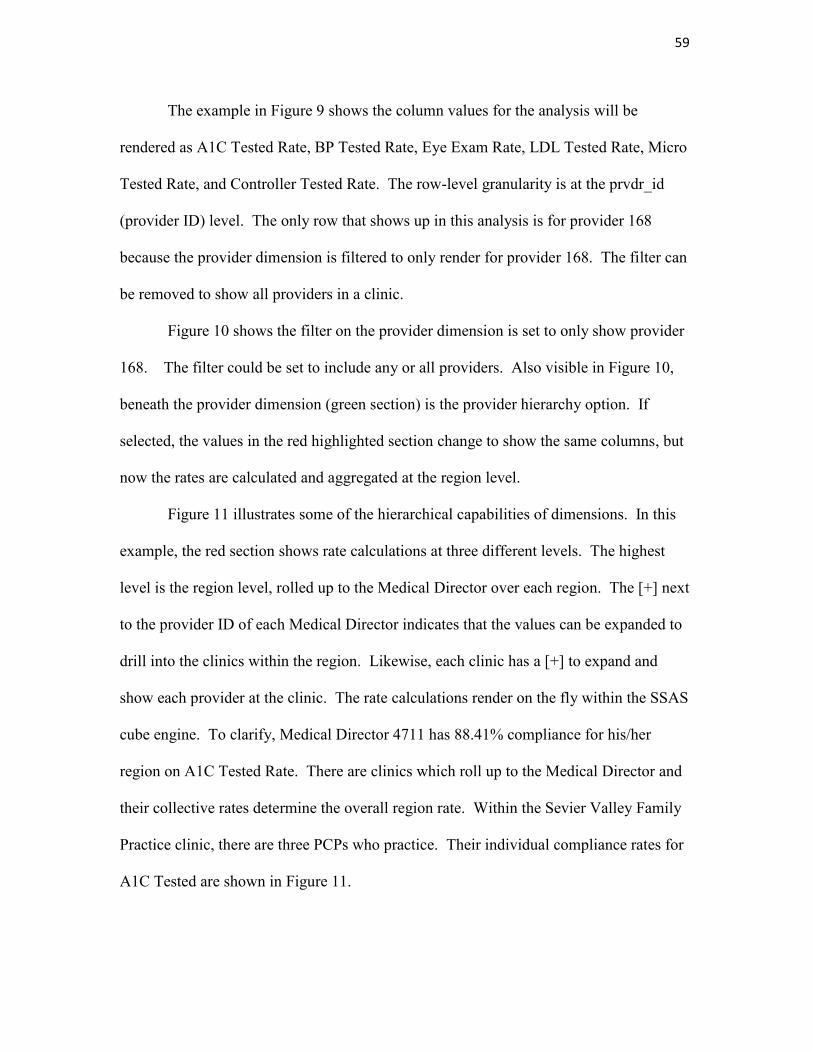
51
The example in Figure 9 shows the column values for the analysis will be
rendered as A1C Tested Rate, BP Tested Rate, Eye Exam Rate, LDL Tested Rate, Micro
Tested Rate, and Controller Tested Rate. The row-level granularity is at the prvdr_id
(provider ID) level. The only row that shows up in this analysis is for provider 168
because the provider dimension is filtered to only render for provider 168. The filter can
be removed to show all providers in a clinic.
Figure 10 shows the filter on the provider dimension is set to only show provider
168. The filter could be set to include any or all providers. Also visible in Figure 10,
beneath the provider dimension (green section) is the provider hierarchy option. If
selected, the values in the red highlighted section change to show the same columns, but
now the rates are calculated and aggregated at the region level.
Figure 11 illustrates some of the hierarchical capabilities of dimensions. In this
example, the red section shows rate calculations at three different levels. The highest
level is the region level, rolled up to the Medical Director over each region. The [+] next
to the provider ID of each Medical Director indicates that the values can be expanded to
drill into the clinics within the region. Likewise, each clinic has a [+] to expand and
show each provider at the clinic. The rate calculations render on the fly within the SSAS
cube engine. To clarify, Medical Director 4711 has 88.41% compliance for his/her
region on A1C Tested Rate. There are clinics which roll up to the Medical Director and
their collective rates determine the overall region rate. Within the Sevier Valley Family
Practice clinic, there are three PCPs who practice. Their individual compliance rates for
A1C Tested are shown in Figure 11.
59

51
Figure 10. Sample page from chronic conditions cube pivot table highlighting ability to analyze by any provider.
Chronic Conditions Provider Report
60

61
Figure 11. Sample report from chronic conditions cube. Results are aggregated at provider, facility, and region levels.
Chronic Conditions Region Report
61

51
DISCUSSION
Tools and Technologies
Intermountain has consistently chosen ‘best of breed’ tools for Business
Intelligence according to Gartner’s quadrants for BI tools (63). Cognos is used for
reporting. IBM’s DataStage is used for ETL. Oracle is used for the EDW database
platform. Other tools exist which could have met the requirements of this study. For
example, Microsoft has an entire BI stack which is gaining traction in the health care IT
market (63). The Microsoft stack would have allowed some seamless integration from
ETL to modeling and cube processing that was not available using the tools at my
disposal.
I did not have access to Intermountain’s license for Datastage; consequently, I
built all ETL for the CCMT using SQLDeveloper. It is freeware and was readily
available. Additionally, many of the EDW data architects use SQLDeveloper as a tool to
quickly script out SQL queries and/or ETL. For this reason, when I showed my queries to
EDW architects during design reviews, they were familiar with the environment.
Querying EDW-PROD and writing ETL to EDW-DEV worked fine. I ran into
problems when I attempted to process the dimensional model into the SSAS
environment. At that point, Intermountain’s security model prevented me from being
able to process the chronic conditions cube. The security model prevented data on EDW
DEV from being processed within their production SSAS environment. There was no

63
SSAS DEV environment in which to build. It became clear to EDW team management
that unless I had access to write data out to EDW-PROD, the EDW’s implementation of
SSAS would not allow my model to be processed and the study would halt.
After some deliberation, EDW management agreed to give me a ‘sandbox’ area
within EDW-PROD to allow me to build my model. All staging and summary tables
were rebuilt on EDW-PROD, including the dimensional model. The ETL processes were
modified to run against EDW-PROD. This required a significant amount of rework.
The CCMT is a novel assembly of existing technologies at Intermountain. Each
component provides a vital function within the overall model. The components needed
for the model to work are an EDW, chronic disease registries, CPMs around the chronic
diseases, dimensional modeling, cube technology (SSAS), and a cube viewer (Excel or
other). I did not have an approved budget to purchase additional tools for the study, so I
used what was available and free. Excel 2007 was used as the cube viewing tool due to
the wide-spread adoption of Excel on personal computers within Intermountain
Healthcare and because it did not cost anything to implement for this research.
Furthermore, I wanted to make use of tools that would be largely available to others
outside of Intermountain doing similar work.
Cohort Identification
All patients for this study came from the asthma, diabetes, and depression
registries, though not all patients in the registries were included. Inclusion criteria for
patients within the CCMT went as follows. Prior to 01-Sep-2009, these registries were
loaded on different reporting periods. Asthma and diabetes ran quarterly each year and

64
depression ran monthly. The first time all three registries ran on a consistent reporting
timeframe was 01-Sep-2009. The lack of consistent reporting periods on the registries
particularly influenced CCMT design at the dimensional modeling stage. Within a
dimensional model intended to be consumed by a cube, all rows in the fact table must be
at the same ‘grain.’ That means that every row represents the same consistent level of
whatever is being measured. If two of the registries were represented with rows
aggregated at a quarterly level and one registry was represented by rows aggregated at a
monthly level, we would be representing data at different levels of aggregation (grains).
The lowest common grain among the three registries was not introduced until all
registries ran on a monthly basis. That alignment did not happen until 01-Sep-2009, so
all patients in the registries prior to that time who were not still in the registries after 01-
Sep-2009 were not included in the model. The registry most affected by this limitation
was the depression registry. Depression as a disease is still debated within the behavioral
health care community as to the nature of the disease being chronic or transient or
somewhere in between. Additionally, the number of patients in the disease registry is
nearly five times the size of the diabetes registry and nearly fifteen times the size of the
asthma registry by patient population.
Disease definitions for this model were adopted from Intermountain’s definitions
of asthma, diabetes, and depression captured in the logical rules of existing registry
qualification. There were some semantic drawbacks uncovered by digging into the
disease definitions. Asthma and diabetes reflect a business bias rather than a true disease
focus. This is evidenced by the fact that only SelectHealth patients appear within the
asthma registry, though many patients with asthma are treated at Intermountain facilities

65
that are not covered by SelectHealth. Those patients (non-SelectHealth) are not
represented within the asthma registry. The diabetes registry is limited in its definition of
the disease because within, there is no distinction made between Type I and Type II
diabetes. There would be clinical value in making the distinction, though to date, no such
distinction exists.
In doing the study, I was well aware of these types of semantic limitations within
the data, and no attempt was made to change/challenge the disease definitions. Doing so
was outside the scope of this project. Recognizing these limitations ironically surfaces
one of the virtues of the chronic disease model. It does not matter how Intermountain has
chosen to represent disease definitions. A key tenet of the CCMT lies in the CPMs
surrounding the diseases within the model. As long as CPMs within an organization can
be defined, can be measured, and can be logically expressed with data, the tool works.
The implication here is important to note. Other systems of care that have chosen to
represent diabetes, asthma, and other chronic conditions with definitions that may differ
from Intermountain’s definitions can still adopt this chronic conditions model using their
own versions of CPMs surrounding chronic disease. Theoretically, the model is portable;
that is of course, as long as the adopting institution has all of the other needed
components of the CCMT in place.
Despite the cohort limitations, the decision support tool captured enough of a
representative sampling to build a functioning prototype. 183,665 patients were included
in the model between 01-Jul-2009 and 28-Feb-2011.

66
Care Process Model Definitions
Definitions for each CPM were listed in Tables 1, 2, and 3. The CPMs for asthma
and diabetes and depression vary in the manner of representation. For asthma and
diabetes, the CPMs included in the CCMT are expressed in positive terms or measures.
For example, part of the diabetes CPM mandates that every patient with diabetes should
have A1C, LDL, and Microalbumin tests done annually. The model expresses what
should be done on each and every patient within the registry. At every level of the
asthma and diabetes CPMs, it is desirable to get the highest possible rates of adherence
reflected with a high percentage for each and every measure (meaning most if not all
patients received the CPM component).
Within the depression registry, there exists a different representation of a CPM
measure. Not all patients with depression will receive all components of the depression
CPM. For example, for depression patients who end up in the ER, a PCP follow-up visit
should take place within 30 days of discharge. A significant though small percentage of
patients with depression end up in the ER, though most do not. It is interesting to
observe how the Primary Care Guidance Council and the EDW team chose to model this
data element in the depression registry. The rule is represented through negative logic.
Patients who end up in the ER and who did not receive a follow-up visit with their PCP
are flagged with a binary field (0,1). Aggregating over this column will identify the
number of times a provider should have followed-up with a patient yet failed to do so. I
am not sure of the reason behind this kind of representation. By only identifying those
who should have received care but did not receive it, the ability to measure those who
needed care and received it cannot be measured. With this implementation, the CCMT

67
cannot show PCPs how well they are doing in managing that aspect of the depression
CPM. Instead, it can only render the percentage of patients who should have received
care and did not get it. Therefore, in the CCMT, a low rate for this component of the
depression CPM is desirable rather than a high rate. A high rate would indicate the PCP
is missing many follow-up visits. The CCMT made visible the inconsistency of logical
representation of the depression CPM.
Within the logical representation of the depression CPM, positive rules of
implementation also exist. One such rule is that every patient with depression should
have a PHQ9 annually. For this CPM component, a PCP would want to have a high rate,
indicating a consistent level of compliance with the depression CPM.
The CCMT has no problem making use of both methods of CPM logical
representation (positive or negative logic). However, having both types of logical
representation does present a challenge at the data presentation layer. This is evident in
the cube where for some components, low rates are desirable while for other CPM
components, high rates are desirable. Representing both of these paradigms in the same
graph and/or table is potentially confusing. Consistently representing all CPM definitions
as positives rates of compliance would remove some confusion that now exists when
reporting over the depression CPM. Consideration should be given to changing the
CPMs in the depression registry to be consistently represented using positive logic. It
would take a fair amount of rework to make this change within the existing depression
registry. This suggestion was shared with the current data architect responsible for the
depression registry at Intermountain.

68
Patient Provider Mapping
The mapping of patients to providers followed the methods of assignment which
exist in the current registries as previously outlined. Patients who had no assignment to a
PCP for a given chronic condition were still included in the model. In the disease
registries, these patients are referred to as orphaned patients. I chose to include these
patients for two reasons. First, by including the orphaned population, the CCMT
provides a more complete perspective on how well Intermountain is doing with CPM
adherence for chronic disease management. Second, comparative analysis can be done
on these patients and those who are assigned to compare outcomes in future studies.
The patient provider mapping allows a natural hierarchy to develop within the
model. It goes as follows: Patients Providers Clinics Regions. By mapping
patients to providers, structures can be built into the cube (called hierarchies) to
accommodate levels of aggregation at the provider level, the clinic level, the region level,
and the enterprise level (all patients). The hierarchy affords a powerful view into the
study population to identify which regions are performing better than others with CPM
adherence or which clinics are outperforming other clinics (at the region level, etc.).
Comparisons can also be done at the provider level. The cube makes it easy to identify
those PCPs, clinics, or regions that are outpacing the rest in terms of adherence to CPMs.
This identification provides opportunities to identify processes and/or methods of
implementation that may differ from the majority of providers. These can be studied and
shared across Intermountain to more quickly disseminate knowledge and best practices
across the enterprise.

69
Within the study population, the majority of patients are assigned PCPs employed
by Intermountain Healthcare. There are also dozens of PCPs who are not employed by
Intermountain and consequently, these affiliated PCPs are not assigned to a region. The
hierarchy of patients providers clinics regions still works for patients of
affiliated PCPs by mapping affiliated PCPs to an ‘unknown’ region and grouping them
all together in the model.
One potential enhancement for mapping patients to providers who are not
employed by Intermountain could be to use zip codes for clinic locations to create a
proxy for the region level for affiliated providers.
Extract Transform Load Process
The scalability of the chronic conditions model to support the addition of future
chronic diseases is manifest in the ETL process to stage all conditions for every patient.
Using Oracle’s MERGE function, all chronic conditions for each patient and reporting
period are flattened into one row of the chronic conditions fact table. The MERGE
option allows a simple and elegant solution to updating columns where a patient has the
given condition and does nothing to update columns if the condition is not present on the
patient. See Appendix A to see code logic for creating tables, loading dimension, and
fact tables included in the CCMT. Appendix A also includes ETL logic for the staging
tables used in the model.
One limitation of the study is the assumption of scalability which has not been
stress-tested. I make the assertion that the CCMT can scale because of my experience as
a data architect for the last 8 years. I have created and maintained dimensional models

70
with multiple fact tables, many dimensions (>10), and tens of millions of rows to be
processed by the cube. These have scaled well using partitioning methods available
within the SSMS environment.
The CCMT only contains three chronic conditions. Dimensional models that I
have built over the years are much larger and difficult to maintain. The CCMT could
include many chronic conditions. However, I do not know how the cube would respond if
the CCMT had 20 chronic diseases and hundreds of CPMs. I suspect that considerable
work would need to go into maintenance of partitions for cube performance to be
acceptable. Future work could be done to improve the ETL process by inserting scripts
into a robust ETL tool. Indexing would also need to be addressed at the database level
for such a large dimensional model.
Dimensionally Modeling Chronic Conditions
The CCMT makes use of existing chronic disease registries (asthma, diabetes,
depression). Each of these registries was modeled previously as relational models.
Within Intermountain’s Primary Care Clinical Program, historical and current disease
reporting is driven off of summary tables, almost exclusively in the context of a relational
model. Upstream from the summary tables, components of the summary tables are
staged into many tables (labs, visits, pharmacy data, etc.) then coalesced into one
summary table for a given reporting period. This approach of relational modeling has
served the PCCP for over a decade. However, relational data model will not work with
the chronic conditions care model.

71
For this study, I represented the summarized data through a dimensional model
(see Figure 6) for the chronic conditions cube to work as previously outlined. The two
fact tables and their related dimensions allow aggregate and detailed reporting to happen
across dimensions. The reason two fact tables can work within the same dimensional
model is made possible by using shared dimensions across both fact tables (see Figure 6).
The chronic_conditions_fact table contains many more rows than the
patient_detail_fact table. It contains history of CPM compliance and mapping to PCPs
going back to 01-Jul-2009. The patient_detail_fact table only contains rows from the
latest reporting period. This is intentional. Data in the patient_detail_fact table need to
be actionable. It makes sense then that only the most current reporting period would be
needed if PCPs are to take action. Consequently, this fact table is truncated and
repopulated every time the ETL load runs with only data from the latest reporting period.
Nearly all dimensional models have a date dimension. A date dimension allows
you to slice fact table data in aggregate time levels, depending on the grain of the fact
table. In this study, the grain level was at a month level so I could not get any more
granular than a month within the fact table. As a consequence, I could not create
meaningful date hierarchies using a time dimension. In fact the only time component in
the model is found in the reporting period dimension. A reporting period in the CCMT
covers an entire year period. The ETL process runs monthly and it always looks back
over one year. For example, the January 2010 (start date) load would cover everything
between 01-Jan-2010 and 31-Dec-2010. The next month, the reporting period (start date)
would cover everything between 01-Feb-2010 and 31-Jan-2011. It was not possible to
have a date dimension in this model because of the data representation within the

72
registries. A row in any of the registries depicts one patient for a given reporting period
(covering 12 months).
The lack of a date dimension did not prevent the model from being represented
nor deployed. In fact, slicing by reporting period is something Intermountain PCPs are
familiar with, so the lacking date dimension was not a deterrent for PCPs who have seen
the model. The lack of a true date dimension is a natural consequence of the data
granularity found in the existing disease registries. The missing date dimension surfaced
yet another virtue of the chronic conditions model. That is, to some extent, it is flexible,
even to accommodate nonstandard, date-dimension representation.
Cube Calculations
Rate calculations in the cube may be viewed using Excel 2007. In this model,
under the measure pick-list, there are counts and rates. There are two ways that these
could be captured within the chronic conditions model. The first option would be to add
a column to the fact table for each calculation or measure. The second option would be
to build the calculations within the cube itself.
Option one is a simplistic approach but could become unwieldy if the model is to
include many future chronic diseases and CPMs. That would mean many columns would
continue to grow, making the table wide. Furthermore, adding columns for each
calculation would unfortunately have many rows with null values on many columns as
not all patients are going to have every disease added to the model. At some point, the
cost of maintaining such a large table needs to be considered for indexing and
partitioning schemes to improve query performance.

73
The second option, that is, building calculations in the cube, seemed the more
sustainable approach for this study. It lends itself to scalability. To build the
calculations, no changes would need to be made on the fact tables. Furthermore,
calculations built within the cube do not actually store data. The cube stores the pointers
needed for each legitimate calculation and the calculated data are rendered at run time.
This could become a cost which needs to be considered after many chronic diseases are
added to the model, but was not an issue for this model. Query performance within the
cube could suffer if partitioning within the cube is not well managed. Partition
management for the cube takes place within the Microsoft Business Intelligence
Development Studio (BIDS) environment. Doing this properly required some study and
some trial and error. Cubes require a good deal of work to be designed and implemented
properly.
A potential drawback with option two is that in order to build calculations, I had
to learn some basic Multi-Dimensional Expression (MDX) coding, which is cube
language. The learning curve becomes quite steep for any calculations beyond those that
are quite basic. I had to verify results in the cube were consistent with the same
calculations I got using disease registries and the dimensional model by using Structured
Query Language (SQL). MDX presents quite a challenge for IT professionals.
Given the amount of effort it took me to learn sufficient MDX to build the
calculations, it was worth the investment. It allowed me to create a clean data model on
the fact tables by not having multiple columns with many potential nulls. Doing so
would have been poor data modeling and would certainly affect cube performance as the
cube would be creating many unnecessary relationships across many columns that were

74
sparsely populated. Additionally, if I had created the calculations within the fact table,
the ETL used to populate the fact tables would have, of necessity, become much more
complicated. I recommend building all cube calculations within the cube.
Access and Reporting
For this study, I chose to use Excel 2007 as the cube viewing tool. Some
compelling reasons drove that decision. First, every Intermountain employee who has a
need for Microsoft Office to be installed on their computer has a copy of Excel 2007.
Intermountain’s Computer Support office confirmed this fact. Therefore, no additional
expense would need to be incurred to purchase a tool for cube rendering of the data.
Second, Microsoft has built their BI stack with seamless integration. Excel 2005 had
some cube viewing capabilities, though not nearly as seamless as Excel 2007.
Connecting to the cube requires a few simple steps. Once a connection is made, it can be
saved and re-used in future connections/cube viewing. Third, Excel is a simpler
alternative than other reporting tools such as Crystal Reports or Cognos, though it still
requires some learning to become comfortable with the tool. For the chronic conditions
model to add value to Intermountain PCPS, clinics, and mid/senior management, the
viewing tool needs to be as simple and user-friendly as possible. Excel seemed a
reasonable entry point for the majority of users who simply want reports to render for
them when they open it. Fourth, the chronic conditions model was built with intended
(future) portability to be able to share with other health care organizations. Excel is a
tool which is quite familiar to analysts at Intermountain and it seems plausible that this

75
would be a tool familiar to analysts at other institutions for health care delivery. Using
Excel seems to support the notion of portability.
Data security can be handled at the cube level. Groups may be created with
varying levels of access to the cubes to secure the data. I recognized the need for cube
security to be addressed; however, creating and implementing a security model was
outside the scope of this project. I implemented no such security model.
Making reports available to PCPs, staff, and management within Intermountain is
another area which deserves real scrutiny and planning prior to implementation. For this
study, I was able to demonstrate that an Excel file could be created and emailed to a
provider, who then could save the attachment to a desktop. The provider could open the
attached Excel file, enter appropriate login credentials, and connect to the cube. An
appealing feature of the Excel 2007 viewer is the ability to save a copy of the ad-hoc
analysis, close the file, and re-open it later to continue working on a model. I
demonstrated this functionality to each of the PCPs to whom CCMT was shown. Saving
analysis and re-opening the file at a later date appealed to each provider who saw the
tool.
As a future recommendation for security within cubes, I recommend using Active
Directory (AD) authentication. Using AD authentication, each user would only have
access to browse data granted under the security policy. Furthermore, with AD as the
form of authentication used against the cube, when the user connects to the cube, Active
Directory could pass along credentials of the person logged on to the terminal as a
parameter and reporting template could render data-based AD credentials. Yet another
option would be for central computer support to push out a standard Excel file to each

76
desktop on a scheduled basis. This option holds appeal because it could be a way to push
out new cube versions with updated features as enhancements are made and released.
Cube viewing and ad-hoc analysis of cubes would require some training for most
users. Herein lays a limitation of the study. Each of the PCPs who saw the CCMT
commented on the process of accessing the information. Unanimously, the stated
preferred method for report delivery at Intermountain would be via the intranet. Links
could be sent out to PCPs to take them to a cube link on the intranet, but that was beyond
the scope of this project.
Ad-hoc Analysis Within Cubes
The notion of PCPs being able to do ad-hoc analysis on their patient populations
via the cube was an intriguing concept. The idea was consistent with Intermountain’s
push to create self-service reporting tools to make data more accessible to nontechnical
audiences. However, it was clear that simply having access to the data did not mean that
all PCPs would take advantage of the ad-hoc capability. The director of quality
improvement for SelectHealth along with the director of the Primary Care Clinical
Program each told me that the majority of PCPs at Intermountain are content to receive a
canned report tailored to their practice and their patient population to let them know how
well they are managing their chronic disease populations. Both believed that very few
providers would actually take time to learn the tool and do their own analysis.
PCPs are financially incentivized to maximize their patient workflow. Taking
time to do their own analysis on their patient populations would mean cutting into
potential time with patients or doing analysis outside of normal business hours. I asked

77
each PCP who saw the tool if they saw themselves using a tool like the CCMT to study
their population. Only one answered yes without hesitation. All others said they were
intrigued by the possibility but did not realistically see themselves taking time to learn the
tool to study their populations.
The majority of PCPs within the Primary Care Clinical Program will likely not do
ad-hoc analysis on their patient populations. I suspect that existing resource constraints
on providers would keep most from learning to browse cubes. For the few providers who
will want to do some ad-hoc analysis, the last tab in the Excel file allows them to explore
the cube. Examples of ad-hoc analysis are found in Figure 9, Figure 10, and Figure 11.
CCMT Data Validation
My decision support tool is a prototype. Nevertheless, there was a significant
amount of quality assurance processing done to validate data. I spent roughly 20 hours
doing comparative analysis between results from the CCMT reporting both in aggregate
and individual patients against the existing traditional clinical reports for diabetes,
asthma, and depression. I researched reports from a dozen Primary Care Providers. The
results from CCMT reporting aligned perfectly with the existing, stand-alone reports.
Two seasoned analysts from the Institute for Healthcare Delivery and Research
spent some several hours validating the tool by doing their own comparative analysis
against the CCMT and the existing reporting. Their findings were consistent with my
own quality assurance findings.

78
CCMT Face Validity
Face validity for the CCMT was accomplished by demonstrating the tool to key
Intermountain employees, hand-picked by me. I chose the employees based on existing
relationships that I had from my former employment with Intermountain as well as my
experience supporting the Primary Care Clinical Program. These key users are described
in detail below.
This chronic conditions management tool and cube was demonstrated to people in
the following positions within Intermountain Healthcare: two Clinical Program Directors,
namely the Primary Care Clinical Program and the Medical Home division; the Director
of Quality Improvement for SelectHealth; two Consultant Analysts within the Institute
for Healthcare Delivery and Research; and three Primary Care Providers. Additionally, a
working prototype was demonstrated at the American College of Mental Health
Administration 2011 Summit in New Orleans.
I sat down with the Directors of Primary Care and the Medical Home and
members of their staff to demonstrate the prototyped CCMT. We met for one hour.
During that time, I walked them through the CCMT framework. Then, I spent a
significant portion of the hour getting them familiar with the cube and doing ad-hoc
analysis. I showed them how analysis could be done through multiple dimensions
simultaneously. I demonstrated the hierarchical groupings in the provider and patient
dimensions. I demonstrated how canned reports with template reports could be opened
from a desktop icon and how PCPs could see their CPM compliance by simply selecting
their provider IDs from a drop menu. Last of all, they were shown how gaps in
adherence were reported by the provider through an actionable, detailed work list. Prior

79
to our meeting, none in the room had ever heard of cubes and few had seen pivot tables.
Only one person (an analyst) had experience with pivot tables.
There was genuine interest and enthusiasm from the Primary Care Clinical
Program and the Medical Home division. When asked what potential value the model
could hold for their respective programs, they responded with three areas of potential
value. First, nontechnical people could do ad-hoc analysis within Excel. Managers and
nontechnical staff often had dependencies on analysts to pull data sets for analysis.
Analysts are extremely busy at Intermountain. This makes turnaround time for report
requests a long process. It is not uncommon for a report to take weeks if not months to
produce a first draft. Diminishing the dependency on analysts where appropriate and
where possible appealed to leadership for the Primary Care Clinical Program as well as
the Medical Home Division. Each of the directors expressed interest in learning how to
use the cubes to do their own analysis. In my four years as a data architect supporting the
PCCP for Intermountain Healthcare, I had never before heard a director ask for direct
access to data for the purpose of doing his/her own analysis.
Second, the CCMT allowed actionable reporting for PCPs on their respective
patients in one consolidated view. PCPs could quickly identify gaps in CPM adherence
without having to look across multiple reports as is the current process for diabetes,
asthma, and depression. They liked the whole-patient focus of the CCMT rather than
emphasis on individual disease management. Each of the three PCPs naturally gravitated
to gaps in CPM adherence as reported in the cube. One of them opened the EMR to
verify a missed gap and was disappointed to discover the finding was confirmed.
However, the confirmation bolstered confidence in the cube data and the PCP

80
commented that it would be great to have a trusted, consolidated view of CPM
compliance for his patients with chronic disease. He then commented that the CCMT fell
short in not showing actual clinical values for current outcomes, such as the last A1C
value, last HDL value, and/or last blood pressure value. I agree that there would be
clinical utility in seeing the clinical indicators for disease progression, but made the
contention that including the individual clinical values was outside the scope of my
project.
Third, the CCMT supported the missions of both the Primary Care Clinical
Program and the Medical Home programs by making available aggregate views of
chronic disease management at multiple levels of reporting. These directors seem to have
a population focus on chronic disease management. The ability to drill-up and drill-down
multiple hierarchies was an attractive feature of the model. The aggregate reported
values from the CCMT addressed the directors’ needs to report to executives on how well
the enterprise was doing in managing chronic disease via adherence to best practices.
Furthermore, the directors could drill into the hierarchies based on those regions, clinics,
or providers who consistently had the higher/lower rates to identify outliers. The good
outliers could be further scrutinized to potentially understand best practices of chronic
disease management that could possibly be shared more quickly across the enterprise.
Both directors agreed that the CCMT was a tool that showed potential in supporting the
missions of their clinical programs.

81
Potential for Improved Business Intelligence
and Reporting at Intermountain
Analysts at the Institute for Healthcare Delivery and Research expressed interest
in the CCMT model. I asked them to describe how this model could add value to better
management of chronic disease at Intermountain. They gave me three areas in which the
CCMT could add value. First, both analysts agreed that enabling nontechnical managers
and executives to do ad-hoc analysis was quite valuable. This was a step toward self-
service Business Intelligence and could potentially remove some of the burden of
reporting from the analysts. They felt they were often asked the same question by
different people and had to repeatedly create the same report with different parameters to
meet the needs of the business. By introducing the means of self-service analysis into the
hands of managers and executives, analysts could make better use of their time by
leveraging their technical expertise on more complex reporting and analysis. Of course,
this assumes that managers and executives could learn to be self-sufficient in browsing
the cube within the Excel environment.
The second area in which the CCMT could add value may be found in putting
real data into the hands of management. They felt this could improve the overall
reporting process. The analysts explained that the process of report development is
iterative in nature, sometimes unnecessarily so. In the current reporting paradigm,
management tasks an analyst to write a report to address a specific question. Weeks may
pass before the analyst returned with the first draft of the report. Together, they review
the report and often management refines the criteria and the reporting cycle repeats itself.
The cycle can go on for months before the report is truly addressing what management

82
set out to understand. The analysts felt that this model could refine the requirement
gathering process by allowing managers and executive to view real-world data prior to
making requests. Additionally, the iterative lifecycle of report development may be
shortened because managers may be able to better articulate their reporting needs by
doing some of the analysis themselves.
One of the analysts pointed out a third area of potential value in the model. He
felt there was benefit in letting clinic managers take more accountability by doing a
portion of their own reporting and analysis. Not all clinics within Intermountain are the
same. Clinics vary by patients they serve, by location (rural vs. urban setting), and by
staffing. These differences make a one-size-fits-all approach to reporting difficult to
support. He explained that clinics will have varying results in CPM adherence and
patient outcomes which are influenced by variations in clinics throughout Intermountain.
The idea of collective knowledge discovery and dissemination across the enterprise could
have merit by letting clinics scrutinize outcomes at the patient, provider, and clinic levels.
Self-service BI could help each clinic discover better what works to improve clinic,
provider, and patient outcomes. Some of this knowledge discovery could be
generalizable to similar clinics throughout Intermountain. Rather than trying to force a
one-size-fits-all solution from many dissimilar clinics, multiple models could emerge
depending on clinic type, clinic staffing, patient demographics and the clinic setting.

83
Potential for Usability at Intermountain
I met for an hour with the Director of Quality Improvement for SelectHealth. His
interest in the CCMT focused on the consolidated, centralized view of disease
management. SelectHealth offers financial incentives to PCPs on their panel for
adherence to best practices. The CCMT made PCP CPM compliance more transparent,
thus aligning itself well with existing SelectHealth needs and incentives. The Director
was quite familiar with pivot table functionality within Excel and it appeared that this
familiarity made it easy for him to grasp the visualization of the data. He said the model
was limited by its lack of clinical outcomes data on patients. He suggested this as logical
next step for future research in chronic disease management.
I met with three practicing Primary Care Providers to walk them through the
model. Each one expressed interest in the actionable component of the model (Figure 5).
The consolidated view of CPM compliance across multiple chronic diseases held their
interest. Each of them commented that the detailed, actionable list could become a
patient work-list for them and their office staff to get patients compliant with care. A
patient work-list is a report for a PCP which shows some level of action that needs to be
done for patients. Providing a PCP with a consolidated view of multiple chronic
conditions could make his/her work-list more meaningful and efficient by possibly
catching more of the actions that need to be done.
Despite the appeal of the model, each PCP expressed frustration in having to
leave the HELP2 (Electronic Medical Record) application to connect to the chronic
conditions cube using a separate, stand-alone application. All of them wanted the chronic
conditions model functionality embedded within HELP2. Switching among applications

84
was disruptive to clinical work-flow. Consequently, none of the PCPs would likely use
the application during a patient visit; rather, they, or their staff, would use the actionable
components of the model (Figure 5) to identify which patients were lacking care but
would rely solely on HELP2 for clinical documentation once the patient was in the exam
room with the provider.
When asked whether they would do ad-hoc analysis on their patient populations
using the model, one of the three PCPs said yes. Each provider said s/he is pressed for
time and that s/he would not have the time needed to do their own population analysis.
The canned reports tailored to their practice would meet their basic reporting needs.
There also seemed to be an aversion to learning pivot tables within Excel.
Potential Portability to Other Health Care Organizations
On March 17th, I presented the Chronic Conditions Management Model at the
American College of Mental Health Administration 2011 Summit, held at the Royal
Sonesta Hotel in New Orleans, Louisiana. ACMHA was founded in 1979. It is a
behavioral health leadership member organization with representation from “public and
private administrators of services; national, state, and county government; mental health
and addiction recovery professional organizations; consumer and family advocacy
organizations; the provider treatment community; managed behavioral health care
organizations; research and academia; insurers; and other stakeholders” (64). The
ACMHA 2011 Summit provided me with a good opportunity to demonstrate the model to
a broad representation of health care organizations and affiliates from around the country,
particularly for low-income and Federally Qualified Health Centers.

85
One night of the conference was a dedicated poster session. For nearly three
hours, I presented the logical design of the CCMT to people in attendance. More than
forty people stopped at my poster where they had the CCMT explained to them and they
also watched a working prototype of the model. One of the virtues of SSAS (cube)
technology is the ability to save a portable version of a cube to a local computer. I pulled
down a copy of the chronic conditions cube onto my laptop in order that I might show a
functioning prototype to people attending the poster session. Next to my poster I set up a
small table with my laptop opened on top. Prior to the poster session, I used Excel to
establish a connection to the local copy of the cube on my laptop and I created canned
reports (Figure 4 and Figure 5) to run against the local cube copy. As groups listened to
my poster presentation, I drew their attention to the laptop and then demonstrated for
them how the graphs on each tab would dynamically change as I selected different
provider IDs. Next, I would do ad-hoc analysis against the cube.
Those attending the Summit were typically director-level or executive-level
medical professionals. Feedback from this group echoed that of the directors at
Intermountain, specifically, that there was real value in looking at patients holistically
rather than focusing on individual disease models. The aggregate views of CPM
adherence rates at the enterprise, regional, clinic, and PCP level was also well received.
This national audience seemed encouraged by the potential flexibility of the model being
able to accommodate varying definitions of disease as well as CPMs in other systems of
care. The portability of the CCMT to other health care organizations was an attractive
feature.

51
SIGNIFICANCE
Three aspects of this study are significant. First, in my literature review, I have
not come across a tool which gives providers the ability to view more than two chronic
diseases simultaneously. Some have included two conditions, such as diabetes and
depression (13), though none have included capabilities for viewing three or more
conditions all at once. The traditional method of reporting for clinical programs at
Intermountain has been to build rich data registries around a specific condition or disease.
This has been helpful in understanding a great deal about each disease population.
However, this approach to disease-focused care has evolved to the point that
Intermountain is looking for a way to put the patient as the point of focus and somehow
tie together all chronic disease registries to better inform providers about all conditions
that a patient may have. To date, no tool or data model within the EDW has been built to
support this PCCP need. The CCMT architecture successfully put the patient at the
center of chronic disease management. The CCMT is scalable to include more chronic
diseases. While the magnitude of scaling has not yet been explored, three conditions are
included and I expect 3-4 others could be included without performance degradation in
the cube.
Second, the CCMT supports population views of chronic disease management as
well as actionable, patient-level reporting to aid providers in managing individual patients
with chronic diseases. In my experience as a data architect assigned to support the

87
Primary Care Clinical Program, these two types of reporting were not often connected.
Operational, or day-to-day, reporting for clinicians to manage their respective diabetic,
asthmatic, and depressed populations were based off of summarized data tables intended
for that specific purpose. On the other hand, dashboard-type reporting, intended for the
executive team, were based off of SQL query logic embedded into the dashboard. These
queries were not usually based on the summary tables as the summary tables were not
designed to support dashboard reporting. Although both types of reporting addressed the
Intermountain diabetic population, dashboard metrics could not be effectively compared
with operational reports based off the summary tables because the logic for both types of
reports addressed different needs of the organization. The danger lays in metrics from
both report types that address related, though different, metrics. These often gave
significantly different results. This scenario proved challenging for the clinical
leadership team charged with guiding the Primary Care Clinical Program. The PCCP
wanted one consistent representation of data that would support all their reporting needs.
The CCMT supports both types of reporting with the same underlying data model.
Third, the CCMT supports canned reporting as well as ad-hoc cube analysis. The
underlying dimensional model coupled with the cube structure allows various types of
reporting and analytics to provide a more consistent reporting paradigm. This is
significant because of the self-service BI component as demonstrated using Excel 2007.
In my experience with the Intermountain PCCP, PCPs were not expected to generate their
own reports and/or do their own analysis on their patient populations. Analysts and BI
developers shouldered that responsibility. These analysts often worked directly with
clinicians to identify reporting needs. Each month, the PCCP Guidance Council met to

88
review new or enhanced reporting outcomes. During these meetings, PCPs representing
each region within Intermountain would discuss the data and how the findings related to
current care delivery. They would often look for areas that could be improved and with
consensus, established targets for board goals to improve outcomes based on data found
in the operational reporting. I often heard providers ask BI developers if it would be
possible to do ‘what if’ scenarios and capture that capability in a reporting tool that could
support data exploration by nontechnical clinicians who had an interest in doing some of
their own analysis. No such tool was ever built while I was the data architect for the
PCCP. It was not that the project could not be done; it was due to a lack of available
technical resources (analysts/BI developers) compounded by other competing projects
with higher priority. The CCMT demonstrates in a small but significant manner that
clinical data can be modeled in a way that supports both traditional and self-service
reporting needs for a clinical program such as the Intermountain PCCP.

89
FUTURE RECOMMENDATIONS
This study paves the way for future informatics work in chronic disease
management at Intermountain. For example, with the potential of the CCMT being
adopted by Intermountain, implementation of a population-level decision support tool
could be studied to identify challenges in workflow adoption. Additionally, work could
be done to explore outcomes on patients who receive care from PCPs who are consistent
in CPM delivery but then focus on the accountability of the patient for their role in
following through on prescribed care, such as Rx fill-rate on asthma and/or depression
medication.
I have three recommendations for future use of the chronic conditions
management tool. First, pilot the CCMT within the Primary Care Clinical Program or the
Medical Home division at Intermountain. This could be done with a clinical champion at
one clinic, an outcomes analyst, and a data architect. I would estimate that I spent 160
hours developing technical content for the CCMT. Hundreds of hours went into
researching the project need and documenting the problem. These considerations should
be taken into account to help manage expectations around how long it may take to build
the CCMT into a pilot clinic.
My second recommendation would be to map patients to clinics in addition to
PCPs. At Intermountain, there has been considerable dialogue around primary care
integration and providing a medical home for a patient to receive the majority of clinical

90
care. Inherent in the definition of a medical home is a clinical care team working
together to deliver care. Patients often receive care from a team of providers rather than
just one PCP. A patient in the PCCP may visit the same clinic 3-4 times a year, or more,
to receive care. Not every visit will be with the same PCP. This is understood and
recognized by Intermountain and mapping algorithms have been developed to make an
educated guess as to which PCP is reasonably accountable for the patient over the course
of a reporting period. The mapping to providers is an incomplete reporting paradigm. A
more complete approach would be to map patients to teams of clinicians and staff and
then hold the team accountable for care delivery consistent with best practices. The
chronic conditions cube could support a hierarchical reporting structure that mapped
patients to a clinic. Comparative analysis could be done across clinics and regions to
study team-based care.
My third recommendation would be to include CPM components that track
patient adherence to prescribed care. In its current state, the CCMT holds PCPs
accountable for adherence to CPMs in chronic disease management. However, PCP
CPM adherence is one part of the solution needed to improve chronic disease
management. The patient also has a responsibility to comply with care prescribed by the
PCP. For example, the patient is responsible to show up for an ordered eye exam. If the
PCP orders the exam and refers the patient to an ophthalmologist, but the patient never
follows through on the referral, the fault lies with the patient, not the PCP. The same
holds true for medications ordered by the PCP but never filled by the patient. The CCMT
needs to grow its capacity to track patient adherence to prescribed care.

91
CONCLUSION
In the near future, medical home reporting capabilities will be mandated by the
federal government. Aligning the chronic conditions model with the medical home
model reporting needs is important. A strategic alignment such as this would maximize
work efforts of a technical staff tasked with supporting clinical lines at Intermountain. A
population-based decision support tool like the CCMT could support a health care
organization in their quest to demonstrate meaningful use as mandated by the Affordable
Care Act. A pilot study of implementation for usability testing could shed light on the
challenges of implementing such a decision support tool. If the model can sufficiently
address public reporting measures required by the government, there may be components
within the tool which could be generalized to other health care organizations that may
have similar reporting needs.
This project had two main objectives. The first was to create a Business
Intelligence solution to support a more comprehensive approach to chronic disease
management. The tool needed to be flexible to accommodate multiple disease
definitions, scalable to support additional chronic diseases, and portable to allow
adoption by other health care systems. The second objective was to create a tool that
could satisfy Intermountain PCP requests to consolidate asthma, diabetes, and depression
reporting into one view.
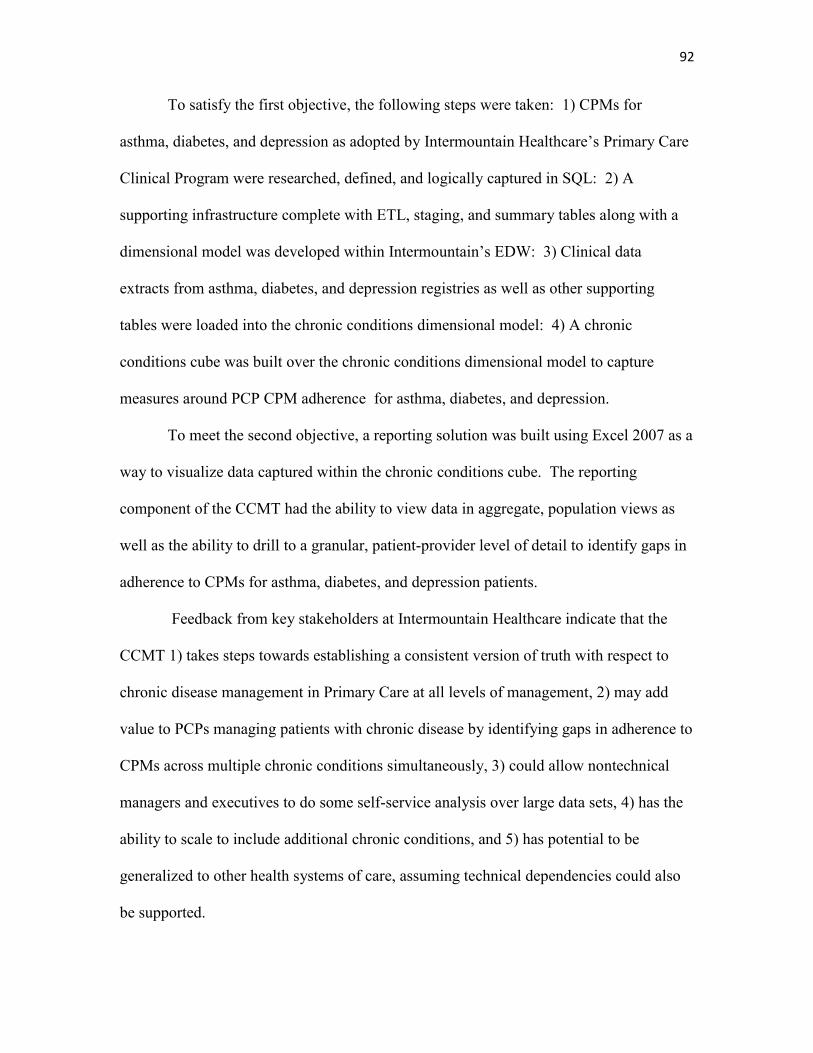
92
To satisfy the first objective, the following steps were taken: 1) CPMs for
asthma, diabetes, and depression as adopted by Intermountain Healthcare’s Primary Care
Clinical Program were researched, defined, and logically captured in SQL: 2) A
supporting infrastructure complete with ETL, staging, and summary tables along with a
dimensional model was developed within Intermountain’s EDW: 3) Clinical data
extracts from asthma, diabetes, and depression registries as well as other supporting
tables were loaded into the chronic conditions dimensional model: 4) A chronic
conditions cube was built over the chronic conditions dimensional model to capture
measures around PCP CPM adherence for asthma, diabetes, and depression.
To meet the second objective, a reporting solution was built using Excel 2007 as a
way to visualize data captured within the chronic conditions cube. The reporting
component of the CCMT had the ability to view data in aggregate, population views as
well as the ability to drill to a granular, patient-provider level of detail to identify gaps in
adherence to CPMs for asthma, diabetes, and depression patients.
Feedback from key stakeholders at Intermountain Healthcare indicate that the
CCMT 1) takes steps towards establishing a consistent version of truth with respect to
chronic disease management in Primary Care at all levels of management, 2) may add
value to PCPs managing patients with chronic disease by identifying gaps in adherence to
CPMs across multiple chronic conditions simultaneously, 3) could allow nontechnical
managers and executives to do some self-service analysis over large data sets, 4) has the
ability to scale to include additional chronic conditions, and 5) has potential to be
generalized to other health systems of care, assuming technical dependencies could also
be supported.

51
APPENDIX A
DATA MODELS

51
Pharmacy Exclusions Polycystic ovarian disease who were identified through diabetes related
pharmacy claims. Hprpt.cmc_clmd_diag ICD9 256.4 Cdrdm.problem with comment/problem PCOS or problem NCID 83260 or
1002531, dx_flg = 1 and status_ncid = 1024 Check previous list against rx claims for 2 fills metformin and 2 fills
rosiglitazone/ploglitazone Gc3 from fdbank=’C4N’ and BN from fdbank != avandament or rezulin.
HP Inpatient Inclusion Criteria > 2 service dates w/in 2 yrs on [(ICD9 Dx: 250%, 357.2, 362.0, 366.41,
648.0)] or [(DRG: 294, 295) and UB92: 0100-0169, 0200-0229, 0450-0452,0459, 0720-0729,0800-0809, 0981, 0987) or (CPT: 99221-99223, 99238-99239, 99251-99255, 99261-99263, 99281-99188, 99291-99292, 99356-99357)]
HP Claims Exclusion Criteria Exclude if
claim or bill with ICD9 Dx 962.0, 648.8, 251.8 or 256.4
HP Outpatient Inclusion Criteria >2 service dates w/in last 2 yrs on [(ICD9 Dx: 250%, 357.2, 362.0,
366.41, 648.0) or (DRG: 462)] and [(UB92: 0490-0539, 0550-0599, 0456, 0650-0669, 0760-0769, 0770-0779, 0820-0859, 0880-0889, 0920-0929, 0940-0949, 0960-0969, 0972-0979, 0982-0986, 0988-0989) or (CPT: 92002-92014, 99201-99205, 99211-99215, 99217-99220, 99241-99245, 99341-99345, 99347-99350, 99384-99387, 99394-99397, 99401-99404, 99411-99412, 99420, 99429, 99455-99456, 99499)]
IDX Outpatient Inclusion Criteria >2 service dates w/in last 2 yrs on [(ICD9 Dx: 250%, 357.2, 362.0x,
648.0) and (billing provider specialty IM, IMP, PD or FP)] or (CPT: 92002-92014, 99201-99205, 99211-99215, 99217-99220, 99241-99245, 99341-99345, 99347-99350, 99384-99387, 99394-99397, 99401-99404, 99411-99412, 99420, 99429, 99455-99456, 99499)]
CDR Inclusion Criteria Include diabetes listed on problem list. Exclude notes with ‘rule out’ and /or ‘question of’.
94

95
9
5
IDX Inclusion Criteria Px_code: 83036, 83037
Chart Notes Inclusion Criteria Populated based on NCID codes (TBD)
CDR Inclusion Criteria Test_NCID = 9989 Observation_NCID not 26350
LabCorp Inclusion Criteria Analyte = ‘HemA1C’
Sunquest Lab Inclusion Criteria Test code: ‘A1C’, ‘HGBA1C’
CDR Inclusion Criteria Systolic – NCID = 1985 Diastolic – NCID = 1976 Include only non hospital events

96
HP Claims Inclusion Criteria Px_code = 83036, 83037 ICD9 Dx = 141-145, 9502-9504, 9511, 9512, 9516 CPT = 2022F, 2024F, 2026F, 3072F, 67028, 67030, 67031, 67036, 67038-67040,
67101, 67105, 67107, 67108, 67110, 67112, 67121, 67145, 67208, 67210, 67218, 67220, 67221, 67227, 67228, 92002, 92004, 92012, 92014, 92018, 92019, 92225, 92226, 92230, 92235, 92240, 92250, 92260, 99203, 99204, 99205, 99213-99215, 99242-99245
CDR Inclusion Criteria ASN1_type_NCID = 160383 Parent_ASN1_type_NCID = 205521
IDX Inclusion Criteria CPT = 2022F, 2024F, 2026F, 3072F, 67028, 67030, 67031, 67036, 67038-67040,
67101, 67105, 67107, 67108, 67110, 67112, 67121, 67145, 67208, 67210, 67218, 67220, 67221, 67227, 67228, 92002, 92004, 92012, 92014, 92018, 92019, 92225, 92226, 92230, 92235, 92240, 92250, 92260, 99203, 99204, 99205, 99213-99215, 99242-99245
9
6

97
Pharmacy Exclusions Polycystic ovarian disease who were identified through diabetes related pharmacy claims. Hprpt.cmc_clmd_diag ICD9 256.4 Cdrdm.problem with comment/problem PCOS or problem NCID 83260 or 1002531, dx_flg
= 1 and status_ncid = 1024 Check previous list against rx claims for 2 fills metformin and 2 fills
rosiglitazone/ploglitazone Gc3 from fdbank=’C4N’ and BN from fdbank != avandament or rezulin.
LabCorp Inclusion Criteria Analyte: Microalbumin, LDL, Triglycerides, HDL
Outpatient Billing IDX Inclusion Criteria Microalbumin: CPT 82042-82044 or 81050 with 84155,84160, or 84165 on same day
LDL: CPT 80061, 83700, 83701, 83704, 83715/6, 83721
Chart Notes Inclusion Criteria Population based on NCID codes (TBD)
CDR Lab Inclusion Criteria Microalbumin: NCID 90953 and observation_ncid 20912/9824
Trig: observation_ncid 21552
HDL: observation_ncid 6577
LDL: observation_ncid 6578
Sunquest Lab Inclusion Criteria Test_cd: alb24, pr24, alcr, albmin, albau, pru, prua, pruel, prarup, hdl, hdla, hdllip, trig, triga, trigfl,
ldl, ldld, ldldl1
9
7

98
Contains all the medications for diabetes patients. Data comes from pharmacy commercial and Medicaid claims from the Health Plan data mart in the EDW.
Contains a history of health plan diabetic member enrollment and eligibility.
98

51
APPENDIX B
SCRIPTING
+++++++++++++++++++++++++++++++++++++++++++++++++++++++++++++++
Table Creation - DDL
+++++++++++++++++++++++++++++++++++++++++++++++++++++++++++++++
DIM_CHRONIC_DETAIL
create table sandbox.dim_chronic_detail ( dim_detail_sk int not null , empi int not null , prvdr_id int not null , rpt_per_start_dt date not null , diabetes_flg int null , last_A1C_dt date , last_A1C_result_no number null , last_micro_dt date null , last_micro_result_no varchar2(15) null , last_LDL_dt date null , last_LDL_result_no number null , last_bp_dt date null , last_bp_result_no varchar2(10) , last_eye_exam_dt date null , asthma_flg int null , last_controller_fill_dt date , last_pft_dt date , depression_flg int null , last_phq9_dt date null , last_phq9_result_no number null , NO_PCP_AFTER_EI_VISIT_FLG char(1) null , NO_PCP_FOLLOWUP_VISIT_FLG char(1) null , MISSED_NEW_RX_FLG char(1) null

100
, HIGH_PHQ9_WITHOUT_VISIT_FLG char(1) null , NO_PCP_VISIT_LAST_6_MONTHS_FLG char(1) null , constraint dim_chronic_detail_pk primary key (dim_detail_sk) , unique (empi, prvdr_id, rpt_per_start_dt) ); grant select, insert, update, delete, alter on sandbox.cpm_compliance_fact to lpjwadsw ; commit; create sequence dim_chronic_detail_seq2; create or replace trigger dim_chronic_detail_trigger before insert on sandbox.dim_chronic_detail for each row when (new.dim_detail_sk is NULL) begin select dim_chronic_detail_seq2.nextval into :new.dim_detail_sk from dual; end;
CPM_COMPLIANCE_FACT
create table primcare.cpm_compliance_fact ( ----------------------------------- /*Primary Key on table ----------------------------------- pt_sk int not null , rpt_per_sk int not null , prvdr_sk int not null , dim_detail_sk int not null ----------------------------------- /*Measures on the fact table ----------------------------------- , A1C_tested int , LDL_tested int , Micro_tested int , eye_tested int , bp_tested int , last_bp_dt int , controller_flg int , pft_tested_flg int , no_pcp_post_ei_visit_flg int , no_pcp_fu_visit_flg int

101
, missed_new_rx_flg int , rx_benefit_flg int , high_phq9_wo_visit_flg int , no_pcp_visit_6_mo_flg int , constraint cpm_compliance_pk PRIMARY KEY (pt_sk, rpt_per_start_dt_sk, prvdr_sk, dim_detail_sk) ); grant select, insert, update, delete on primcare.cpm_compliance_fact to lpjwadsw ; commit;
DIM_PATIENT
create table dim_patient ( pt_sk int not null , empi int not null , gender char(1) null , last_name varchar2(20) null , first_name varchar2(16) null , birth_dt date null , constraint dim_patient_pk primary key (pt_sk) , unique (empi) ); commit; grant select, insert, update, delete on primcare.cpm_compliance_fact to lpjwadsw ; commit; create sequence dim_pt_seq; create or replace trigger primcare.dim_pt_trigger before insert on primcare.dim_patient for each row when (new.pt_sk is NULL) begin select dim_pt_seq.nextval into :new.pt_sk from dual; end;
DIM_PROVIDER
create table primcare.dim_provider_stage (

102
prvdr_id int null , med_dir_id int null , last_nm varchar2(20) null , clinic_nm varchar2(60) null ); grant select, insert, update, delete on primcare.cpm_compliance_fact to lpjwadsw ; commit;
create sequence dim_provider_seq1; create or replace trigger primcare.dim_provider_trigger1 before insert on primcare.dim_provider for each row when (new.prvdr_sk is NULL) begin select dim_provider_seq1.nextval into :new.prvdr_sk from dual; end; DIM_RPT_PERIOD create table primcare.dim_rpt_period ( rpt_per_sk int not null, start_dt date not null, end_dt date not null, constraint rpt_per_pk primary key (rpt_per_sk) , unique (start_dt, end_dt) ); grant select, insert, update, delete on primcare.cpm_compliance_fact to lpjwadsw ; commit; create sequence dim_rpt_period; CREATE OR REPLACE TRIGGER sandbox.DIM_RPT_PER_TRIGGER before insert on sandbox.dim_rpt_period for each row WHEN (new.rpt_per_sk is NULL) begin select dim_rpt_per_seq.nextval into :new.rpt_per_sk from dual;

103
end; +++++++++++++++++++++++++++++++++++++++++++++++++++++++++++++++
Data Staging
+++++++++++++++++++++++++++++++++++++++++++++++++++++++++++++++
DIM_PATIENT_STAGE
/*Gathers all patients from asthma, diabetes and depression registries Starting with rpt_per_start_dt = 01-Jul-2009 --inserted 203,819 rows 07-Apr-2011 */ insert into sandbox.dim_patient_stage (empi) with dbts as ( select distinct p.empi as empi from primcare.pt_dbts_test_smry p --left join primcare.prvdr_dir_assoc@edw dir on dir.prvdr_id = p.prvdr_id where rpt_per_start_dt >= to_date('2009-07-01','YYYY-MM-DD') ), asthma as ( select distinct a.empi as empi from primcare.pt_asthma_smry a --left join primcare.prvdr_dir_assoc@edw dir on dir.prvdr_id = a.pcp_prvdr_id where rpt_per_start_dt >= to_date('2009-07-01','YYYY-MM-DD') ), dprs as ( select distinct d.empi as empi from mhi.depression_summary d --left join primcare.prvdr_dir_assoc@edw dir on dir.prvdr_id = d.pcp_prvdr_id where rpt_per_start_dt >= to_date('2009-07-01','YYYY-MM-DD') ) select dbts.empi from dbts union all select asthma.empi

104
from asthma union all select dprs.empi from dprs; commit;
DIM_PROVIDER_STAGE /* This loads all PCP providers for the chronic conditions model into a staging table. The driving registries are the asthma, diabetes and depression registries. NOTE: Do NOT load prior to 01-Jul-2009. This is the first time all three registries were loaded on a monthly basis rather than a quarterly basis. */ --3,364 rows inserted 07-Apr-2011 insert into sandbox.dim_provider_stage (prvdr_id, med_dir_id, med_dir_region, last_nm, clinic_nm, prmry_spclty_cd) with dbts as ( select distinct nvl(p.prvdr_id, -1) as prvdr_id , nvl(dir.med_dir_id, -1) as med_dir_id , nvl(med_dir_region, 'Unknown') as med_dir_region , nvl(dir.prvdr_lst_nm, 'Unknown') as last_nm , nvl(dir.clinic_nm, 'Unknown') as clinic_nm , nvl(prmry_spclty_cd, 'Unk') as prmry_spclty_cd from primcare.pt_dbts_test_smry p left join primcare.prvdr_dir_assoc dir on dir.prvdr_id = p.prvdr_id left join lkup.provider_master pm on pm.prvdr_id = p.prvdr_id where rpt_per_start_dt >= to_date('2009-07-01','YYYY-MM-DD') ), asthma as ( select distinct nvl(a.pcp_prvdr_id,-1) as prvdr_id , nvl(dir.med_dir_id, -1) as med_dir_id , nvl(med_dir_region, 'Unknown') as med_dir_region , nvl(dir.prvdr_lst_nm, 'Unknown') as last_nm , nvl(dir.clinic_nm, 'Unknown') as clinic_nm , nvl(prmry_spclty_cd, 'Unk') as prmry_spclty_cd from primcare.pt_asthma_smry a left join primcare.prvdr_dir_assoc dir on dir.prvdr_id = a.pcp_prvdr_id left join lkup.provider_master pm on pm.prvdr_id = a.pcp_prvdr_id where rpt_per_start_dt >= to_date('2009-07-01','YYYY-MM-DD')

105
), dprs as ( select distinct nvl(d.pcp_prvdr_id, -1) as prvdr_id , nvl(dir.med_dir_id, -1) as med_dir_id , nvl(med_dir_region, 'Unknown') as med_dir_region , nvl(dir.prvdr_lst_nm, 'Unknown') as last_nm , nvl(dir.clinic_nm, 'Unknown') as clinic_nm , nvl(prmry_spclty_cd, 'Unk') as prmry_spclty_cd from mhi.depression_summary d left join primcare.prvdr_dir_assoc dir on dir.prvdr_id = d.pcp_prvdr_id left join lkup.provider_master pm on pm.prvdr_id = d.pcp_prvdr_id where rpt_per_start_dt >= to_date('2009-07-01','YYYY-MM-DD') ) select dbts.prvdr_id , dbts.med_dir_id , dbts.med_dir_region , dbts.last_nm , dbts.clinic_nm , dbts.prmry_spclty_cd from dbts union all select asthma.prvdr_id , asthma.med_dir_id , asthma.med_dir_region , asthma.last_nm , asthma.clinic_nm , asthma.prmry_spclty_cd from asthma union all select dprs.prvdr_id , dprs.med_dir_id , dprs.med_dir_region , dprs.last_nm , dprs.clinic_nm , dprs.prmry_spclty_cd from dprs; commit;
DIM_PT_RPT_CC_STAGE
--1,538,471 rows inserted 07-Apr-2011

106
insert into sandbox.dim_pt_rpt_cc_stage with dbts as ( select empi , rpt_per_start_dt as start_dt , nvl(prvdr_id, -1) as prvdr_id -- -1 is the default for an unknown PCP , 1 as dbts_flg from primcare.pt_dbts_test_smry where rpt_per_start_dt >= to_date('2009-07-01','YYYY-MM-DD') ), asthma as ( select empi , rpt_per_start_dt as start_dt , nvl(pcp_prvdr_id, -1) as prvdr_id -- -1 is the default for an unknown PCP , 1 as asthma_flg from primcare.pt_asthma_smry where rpt_per_start_dt >= to_date('2009-07-01','YYYY-MM-DD') ), dprs as ( select empi , rpt_per_start_dt as start_dt , nvl(pcp_prvdr_id, -1) as prvdr_id -- -1 is the default for an unknown PCP , 1 as dprs_flg from mhi.depression_summary where rpt_per_start_dt >= to_date('2009-07-01','YYYY-MM-DD') ) select dbts.empi , dbts.start_dt , dbts.dbts_flg , dbts.prvdr_id as dbts_prvdr_id , null as asthma_flg , null as asthma_prvdr_id , null as dprs_flg , null as dprs_prvdr_id from dbts union all select asthma.empi , asthma.start_dt , null as dbts_flg , null as dbts_prvdr_id , asthma.asthma_flg , asthma.prvdr_id , null as dprs_flg

107
, null as dprs_prvdr_id from asthma union all select dprs.empi , dprs.start_dt , null as dbts_flg , null as dbts_prvdr_id , null as asthma_flg , null as asthma_prvdr_id , dprs.dprs_flg , dprs.prvdr_id as dprs_prvdr_id from dprs ; commit; DIM_RPT_PERIOD_STAGE
--26 rows inserted 23-Feb-2011 insert into sandbox.dim_rpt_period_stage (start_dt, end_dt) with dbts as ( select distinct p.rpt_per_start_dt as start_dt , p.rpt_per_end_dt as end_dt from primcare.pt_dbts_test_smry p where rpt_per_start_dt >= to_date('2009-07-01','YYYY-MM-DD') order by 1 ), asthma as ( select distinct a.rpt_per_start_dt as start_dt , a.rpt_per_end_dt as end_dt from primcare.pt_asthma_smry a where rpt_per_start_dt >= to_date('2009-07-01','YYYY-MM-DD') order by 1 ), dprs as ( select distinct d.rpt_per_start_dt as start_dt , d.rpt_per_end_dt as end_dt from mhi.depression_summary d where rpt_per_start_dt >= to_date('2009-07-01','YYYY-MM-DD') order by 1 ) select dbts.start_dt , dbts.end_dt

108
from dbts union all select asthma.start_dt , asthma.end_dt from asthma union all select dprs.start_dt , dprs.end_dt from dprs; commit;
+++++++++++++++++++++++++++++++++++++++++++++++++++++++++++++++
Extract Transform Load
+++++++++++++++++++++++++++++++++++++++++++++++++++++++++++++++
DIM_RPT_PERIOD
insert into sandbox.dim_chronic_detail ( pt_sk, rpt_per_sk, prvdr_sk, EMPI, PRVDR_ID, RPT_PER_START_DT, DIABETES_FLG, LAST_A1C_Days, LAST_A1C_RESULT_NO, LAST_MICRO_Days, LAST_MICRO_RESULT_NO, LAST_LDL_Days, LAST_LDL_RESULT_NO, LAST_BP_Days, /*LAST_BP_RESULT_NO*/ LAST_EYE_EXAM_Days, ASTHMA_FLG, LAST_CONTROLLER_FILL_Days, LAST_PFT_Days, DEPRESSION_FLG, LAST_PHQ9_Days, LAST_PHQ9_RESULT_NO, NO_PCP_AFTER_EI_VISIT_FLG, NO_PCP_FOLLOWUP_VISIT_FLG, MISSED_NEW_RX_FLG, HIGH_PHQ9_WITHOUT_VISIT_FLG, NO_PCP_VISIT_LAST_6_MONTHS_FLG ) with pt_rpt as ( select pt_sk , empi , rpt_per_start_dt , case when asthma_flg is null then 0 else asthma_flg end as asthma_flg , case when dbts_flg is null then 0

109
else dbts_flg end as dbts_flg , case when dprs_flg is null then 0 else dprs_flg end as dprs_flg , coalesce(asthma_prvdr_id, dbts_prvdr_id, dprs_prvdr_id,99999) as prvdr_id from sandbox.dim_pt_rpt_cc where rpt_per_start_dt = to_date('2010-01-01','YYYY-MM-DD') ), rpt as ( select rpt_per_sk , start_dt , end_dt from sandbox.dim_rpt_period where start_dt = to_date('2010-01-01','YYYY-MM-DD') ), prvdr as ( select prvdr_sk , prvdr_id , med_dir_id , last_nm , clinic_nm from sandbox.dim_provider ), pt as ( select pt_sk , empi from sandbox.dim_patient ), dbts as ( select empi , rpt_per_start_dt , case when last_hba1c_dt is null then -1 else trunc((86400*(last_hba1c_dt-rpt_per_start_dt))/60/60/24) end as LAST_A1C_Days , last_hba1c_result_no as LAST_A1C_RESULT_NO , case when last_microalb_test_dt is null then -1 else trunc((86400*(last_microalb_test_dt-rpt_per_start_dt))/60/60/24) end as LAST_MICRO_Days , last_microalb_result_no as LAST_MICRO_RESULT_NO

110
, case when last_ldl_dt is null then -1 else trunc((86400*(LAST_LDL_DT-rpt_per_start_dt))/60/60/24) end as LAST_LDL_Days , LAST_LDL_RESULT_NO , case when last_blood_pressure_test_dt is null then -1 else trunc((86400*(last_blood_pressure_test_dt-rpt_per_start_dt))/60/60/24) end as LAST_BP_Days --, last_blood_pressure_result_txt as LAST_BP_RESULT_NO , case when last_eye_exam_dt is null then -1 else trunc((86400*(LAST_EYE_EXAM_DT-rpt_per_start_dt))/60/60/24) end as LAST_EYE_EXAM_Days from primcare.pt_dbts_test_smry where rpt_per_start_dt = to_date('2010-01-01','YYYY-MM-DD') ), asthma as ( select empi , rpt_per_start_dt , case when LAST_CONTROLLER_FILL_DT is null then -1 else trunc((86400*(LAST_CONTROLLER_FILL_DT-rpt_per_start_dt))/60/60/24) end as last_controller_fill_days , case when LAST_PFT_DT is null then -1 else trunc((86400*(last_pft_dt-rpt_per_start_dt))/60/60/24) end as last_pft_days from primcare.pt_asthma_smry where rpt_per_start_dt = to_date('2010-01-01','YYYY-MM-DD') ), dprs as ( select empi , rpt_per_start_dt , case when LAST_PHQ9_DT is null then -1 else trunc((86400*(LAST_PHQ9_DT-rpt_per_start_dt))/60/60/24) end as LAST_PHQ9_Days , last_phq9_sev_no as LAST_PHQ9_RESULT_NO , NO_PCP_AFTER_EI_VISIT_FLG , NO_PCP_FOLLOWUP_VISIT_FLG , MISSED_NEW_RX_FLG , HIGH_PHQ9_WITHOUT_VISIT_FLG

111
, NO_PCP_VISIT_LAST_6_MONTHS_FLG from mhi.depression_summary where rpt_per_start_dt = to_date('2010-01-01','YYYY-MM-DD') ) select pt.pt_sk , rpt.rpt_per_sk , prvdr.prvdr_sk , pt_rpt.EMPI , pt_rpt.PRVDR_ID , cast(to_char(rpt.start_dt,'YYYYMMDD') as int) rpt_per_start_dt , pt_rpt.dbts_flg as DIABETES_FLG , dbts.LAST_A1C_Days , dbts.LAST_A1C_RESULT_NO , dbts.LAST_MICRO_Days , case when dbts.last_micro_result_no is null then -1 when dbts.last_micro_result_no = 'NEG' then 0 when dbts.last_micro_result_no = 'POS' then 1 end last_micro_result_no , dbts.LAST_LDL_Days , dbts.LAST_LDL_RESULT_NO , dbts.LAST_BP_Days --, dbts.last_bp_result_no --hard-coded for now to get the regex working then break out systolic/diastolic values , dbts.LAST_EYE_EXAM_Days , pt_rpt.ASTHMA_FLG , asthma.LAST_CONTROLLER_FILL_Days , asthma.LAST_PFT_Days , pt_rpt.dprs_flg as DEPRESSION_FLG , dprs.LAST_PHQ9_Days , dprs.LAST_PHQ9_RESULT_NO , dprs.NO_PCP_AFTER_EI_VISIT_FLG , dprs.NO_PCP_FOLLOWUP_VISIT_FLG , dprs.MISSED_NEW_RX_FLG , dprs.HIGH_PHQ9_WITHOUT_VISIT_FLG , dprs.NO_PCP_VISIT_LAST_6_MONTHS_FLG from pt_rpt inner join pt on pt.empi = pt_rpt.empi inner join rpt on rpt.start_dt = pt_rpt.rpt_per_start_dt inner join prvdr on prvdr.prvdr_id = pt_rpt.prvdr_id left join dbts on (dbts.empi = pt_rpt.empi and dbts.rpt_per_start_dt = pt_rpt.rpt_per_start_dt) left join asthma on (asthma.empi = pt_rpt.empi and asthma.rpt_per_start_dt = pt_rpt.rpt_per_start_dt) left join dprs on (dprs.empi = pt_rpt.empi and dprs.rpt_per_start_dt = pt_rpt.rpt_per_start_dt) ;

112
commit;
CPM_COMPIANCE_FACT
insert into sandbox.cpm_compliance_fact (pt_sk, rpt_per_sk, prvdr_sk, dim_detail_sk, asthma_flg, dbts_flg, dprs_flg , a1c_tested, ldl_tested, micro_tested, eye_tested, bp_tested, controller_flg , pft_tested_flg, no_pcp_post_ei_visit_flg, no_pcp_fu_visit_flg , missed_new_rx_flg, high_phq9_wo_visit_flg, no_pcp_visit_6_mo_flg) with pt_rpt as ( /* This is the DRIVING table for the whole fact. However, I don't use any key off the table to ultimately land in the fact. There's no need. The natural key on the table is empi and rpt_per_start_dt. */ select pt_sk , empi , rpt_per_start_dt , asthma_flg , dbts_flg , dprs_flg , dbts_prvdr_id , dprs_prvdr_id , coalesce(asthma_prvdr_id, dbts_prvdr_id, dprs_prvdr_id, -1) as prvdr_id from sandbox.dim_pt_rpt_cc where rpt_per_start_dt = to_date('2009-07-01','YYYY-MM-DD') ), rpt as ( select rpt_per_sk , start_dt , end_dt from sandbox.dim_rpt_period ), dbts as ( select empi , rpt_per_start_dt , nvl(hba1c_test_flg,0) as a1c_tested , nvl(ldl_test_flg,0) as ldl_tested
113
, nvl(microalb_test_flg,0) as micro_tested , nvl(eye_test_flg,0) as eye_tested , nvl(blood_pressure_test_flg,0) as bp_tested from primcare.pt_dbts_test_smry where rpt_per_start_dt = to_date('2009-07-01','YYYY-MM-DD') ), asthma as ( select empi , rpt_per_start_dt , pft_test_flg as pft_tested , decode(controller_flg, 'Y', 1, 'N', 0) on_controller from primcare.pt_asthma_smry where rpt_per_start_dt = to_date('2009-07-01','YYYY-MM-DD') ), dprs as ( select empi , rpt_per_start_dt , no_pcp_after_ei_visit_flg , no_pcp_followup_visit_flg , missed_new_rx_flg , high_phq9_without_visit_flg , no_pcp_visit_last_6_months_flg from mhi.depression_summary where rpt_per_start_dt = to_date('2009-07-01','YYYY-MM-DD') ), prvdr as ( select prvdr_sk , prvdr_id , med_dir_id , last_nm , clinic_nm from sandbox.dim_provider ), pt as ( select pt_sk , empi from sandbox.dim_patient ), dtl as ( select dim_detail_sk

114
, empi , prvdr_id , rpt_per_start_dt from sandbox.dim_chronic_detail ) select pt.pt_sk --Let the dim_patient give the pt_sk. Join on the natural key to pt_rpt! , rpt.rpt_per_sk , prvdr.prvdr_sk , nvl(dim_detail_sk, 1) as dim_detail_sk --this is only valid for the most recent reporting period. , pt_rpt.asthma_flg , pt_rpt.dbts_flg , pt_rpt.dprs_flg , dbts.a1c_tested , dbts.ldl_tested , dbts.micro_tested , dbts.eye_tested , dbts.bp_tested , asthma.on_controller as controller_flg , asthma.pft_tested as pft_tested_flg , no_pcp_after_ei_visit_flg as no_pcp_post_ei_visit_flg , no_pcp_followup_visit_flg as no_pcp_fu_visit_flg , missed_new_rx_flg , high_phq9_without_visit_flg as high_phq9_wo_visit_flg , no_pcp_visit_last_6_months_flg as no_pcp_visit_6_mo_flg -- Add in asthma_flg, dbts_flg, dprs_flg. Drive off the pt_rpt_cc table from pt_rpt inner join prvdr on prvdr.prvdr_id = pt_rpt.prvdr_id inner join rpt on rpt.start_dt = pt_rpt.rpt_per_start_dt inner join pt on pt.empi = pt_rpt.empi --left join dtl on (dtl.empi = pt_rpt.empi and dtl.rpt_per_start_dt = pt_rpt.rpt_per_start_dt) left join dbts on (dbts.empi = pt_rpt.empi and dbts.rpt_per_start_dt = pt_rpt.rpt_per_start_dt) left join asthma on (asthma.empi = pt_rpt.empi and asthma.rpt_per_start_dt = pt_rpt.rpt_per_start_dt) left join dprs on (dprs.empi = pt_rpt.empi and dprs.rpt_per_start_dt = pt_rpt.rpt_per_start_dt) ; commit;
DIM_PATIENT
--inserted 189,885 rows 07-Apr-2011

115
insert into sandbox.dim_patient (empi, sex_cd, last_nm, first_nm, birth_dt, death_dt, age, age_bracket, city_nm, state_cd, postal_cd) with s as ( select distinct empi from sandbox.dim_patient_stage where empi is not null ), l as ( select empi , sex_cd , last_nm , first_nm , birth_dt , death_dt , TO_CHAR(FLOOR(MONTHS_BETWEEN(SYSDATE, birth_dt)/12)) as age , case when TO_CHAR(FLOOR(MONTHS_BETWEEN(SYSDATE,birth_dt)/12)) <= 18 then '1-18' when TO_CHAR(FLOOR(MONTHS_BETWEEN(SYSDATE,birth_dt)/12)) <= 24 then '19-24' when TO_CHAR(FLOOR(MONTHS_BETWEEN(SYSDATE,birth_dt)/12)) <= 34 then '25-34' when TO_CHAR(FLOOR(MONTHS_BETWEEN(SYSDATE,birth_dt)/12)) <= 44 then '35-44' when TO_CHAR(FLOOR(MONTHS_BETWEEN(SYSDATE,birth_dt)/12)) <= 54 then '45-54' when TO_CHAR(FLOOR(MONTHS_BETWEEN(SYSDATE,birth_dt)/12)) <= 64 then '55-64' when TO_CHAR(FLOOR(MONTHS_BETWEEN(SYSDATE,birth_dt)/12)) <= 74 then '65-74' when TO_CHAR(FLOOR(MONTHS_BETWEEN(SYSDATE,birth_dt)/12)) > 75 then '75+' end as age_bracket , nvl(city_nm, 'Unknown') as city_nm , nvl(state_cd, 'Unknown') as state_cd , nvl(postal_cd, -1) as postal_cd from lkup.patient_master where test_patient_flg = 0 ) select s.empi , l.sex_cd , l.last_nm , l.first_nm , l.birth_dt , l.death_dt

116
, l.age , l.age_bracket , l.city_nm , l.state_cd , l.postal_cd from s left join l on l.empi = s.empi; commit; DIM_PROVIDER
/* Loads the sandbox.dim_provider table from sandbox.dim_provider_stage --loaded 1,467 rows on 07-Apr-2011 */ insert into sandbox.dim_provider (prvdr_id, med_dir_id, med_dir_region, last_nm, clinic_nm, prmry_spclty_cd) with s as ( select prvdr_id , max(med_dir_id) med_dir_id , max(med_dir_region) med_dir_region , max(last_nm) last_nm , max(clinic_nm) clinic_nm , max(prmry_spclty_cd) prmry_spclty_cd from sandbox.dim_provider_stage --where prvdr_id is not null group by prvdr_id ) /* -- I changed the staging script to handle nulls so I don't need the dummy script anymore dummy as ( select -1 as prvdr_id , -1 as med_dir_id , 'Unknown' as med_dir_region , 'Unknown' as last_nm , 'Unknown' as clinic_nm , 'Unk' as prmry_spclty_cd from dual ) */ select distinct s.prvdr_id as prvdr_id , s.med_dir_id as med_dir_id , s.med_dir_region as med_dir_region

117
, s.last_nm as last_nm , s.clinic_nm as clinic_nm , s.prmry_spclty_cd as prmry_spclty_cd from s /* union all select dummy.prvdr_id , dummy.med_dir_id , dummy.med_dir_region , dummy.last_nm , dummy.clinic_nm , dummy.prmry_spclty_cd from dummy */ ; commit; DIM_PT_RPT_CC
/* Purpose of Load Do an upload of all depression rows first. This is the largest patient cohort. Follow up with two additional merge scripts to pull in the diabetes patients (next largest cohort) followed by the asthma patients (smallest cohort). */ ------------------------------------------------------------------------------ /* Part One: Insert Depression rows from stage to dim_pt_rpt_cc */ ------------------------------------------------------------------------------ /* NOTE! Be sure to NOT go back prior to 01-July-2009 as this is the first time that all three chronic conditions have a monthly load time. Prior to that, diabetes is on a quarterly basis. Asthma goes back a bit earlier than July. */ insert into sandbox.dim_pt_rpt_cc ( empi , rpt_per_start_dt , asthma_flg , asthma_prvdr_id , dbts_flg

118
, dbts_prvdr_id , dprs_flg , dprs_prvdr_id ) select empi , rpt_per_start_dt , asthma_flg , asthma_prvdr_id , dbts_flg , dbts_prvdr_id , dprs_flg , dprs_prvdr_id from sandbox.dim_pt_rpt_cc_stage where rpt_per_start_dt = to_date('2010-03-01','YYYY-MM-DD') and dprs_flg = 1; commit; ------------------------------------------------------------------------------ /* Part Two: Merge in the diabetes rows for the same reporting period */ ------------------------------------------------------------------------------ /* NOTE! Be sure to not go back prior to 01-July-2009 as this is the first time that all three chronic conditions have a monthly load time. Prior to that, diabetes is on a quarterly basis. Asthma goes back a bit earlier than July. */ merge into sandbox.dim_pt_rpt_cc target using ( select distinct src.empi , src.rpt_per_start_dt , src.asthma_flg , src.asthma_prvdr_id , src.dbts_flg , src.dbts_prvdr_id , src.dprs_flg , src.dprs_prvdr_id from sandbox.dim_pt_rpt_cc_stage src where rpt_per_start_dt = to_date('2010-03-01','YYYY-MM-DD') and dbts_flg = 1 ) source on (target.empi = source.empi and target.rpt_per_start_dt = source.rpt_per_start_dt) when matched then

119
update set dbts_flg = source.dbts_flg , dbts_prvdr_id = source.dbts_prvdr_id when not matched then insert ( target.empi , target.rpt_per_start_dt , target.asthma_flg , target.asthma_prvdr_id , target.dbts_flg , target.dbts_prvdr_id , target.dprs_flg , target.dprs_prvdr_id ) values ( source.empi , source.rpt_per_start_dt , source.asthma_flg , source.asthma_prvdr_id , source.dbts_flg , source.dbts_prvdr_id , source.dprs_flg , source.dprs_prvdr_id ); commit; ------------------------------------------------------------------------------ /* Part Three: Merge in the asthma rows for the same reporting period */ ------------------------------------------------------------------------------ /* NOTE! Be sure to not go back prior to 01-July-2009 as this is the first time that all three chronic conditions have a monthly load time. Prior to that, diabetes is on a quarterly basis. Asthma goes back a bit earlier than July. */ merge into sandbox.dim_pt_rpt_cc target using ( select distinct src.empi , src.rpt_per_start_dt , src.asthma_flg

120
, src.asthma_prvdr_id , src.dbts_flg , src.dbts_prvdr_id , src.dprs_flg , src.dprs_prvdr_id from sandbox.dim_pt_rpt_cc_stage src where rpt_per_start_dt = to_date('2010-03-01','YYYY-MM-DD') and asthma_flg = 1 ) source on (target.empi = source.empi and target.rpt_per_start_dt = source.rpt_per_start_dt) when matched then update set asthma_flg = source.asthma_flg , asthma_prvdr_id = source.asthma_prvdr_id when not matched then insert ( target.empi , target.rpt_per_start_dt , target.asthma_flg , target.asthma_prvdr_id , target.dbts_flg , target.dbts_prvdr_id , target.dprs_flg , target.dprs_prvdr_id ) values ( source.empi , source.rpt_per_start_dt , source.asthma_flg , source.asthma_prvdr_id , source.dbts_flg , source.dbts_prvdr_id , source.dprs_flg , source.dprs_prvdr_id ) ; commit;
DIM_RPT_PERIOD
--6 rows inserted 23-Feb-2011 insert into sandbox.dim_rpt_period (start_dt, end_dt)

121
with dbts as ( select distinct p.start_dt , p.end_dt from sandbox.dim_rpt_period_stage p where p.start_dt >= to_date('2009-07-01','YYYY-MM-DD') ) select start_dt , end_dt from dbts commit;

51
REFERENCES
1. American Diabetes Association. Economic costs of diabetes in the U.S. in 2007. Diabetes Care 2008;31:596-615
2. Narayan KM, Boyle JP, Thompson TJ, Sorensen SW, Williamson DF. Lifetime
risk for diabetes mellitus in the United States. JAMA 2003;290:1884-1890
3. Fradkin J, Rodgers GP. The Economic Imperative to Conquer Diabetes. Diabetes Care. 2008 Mar;31(3):624-625
4. Sullivan PW, Ghushchyan VH, Slejko JF, Belozeroff V, Globe DR, Lin SL. The burden of adult asthma in the United States: evidence from the Medical Expenditure Panel Survey. J Allergy Clin Immunol. 2011 Feb;127(2):363-369.e1-3
5. Barnett SB, Nurmagambetov TA. Costs of asthma in the United States: 2002-2007. J Allergy Clin Immunol. 2011 Jan;127(1):145-52.
6. Murray CJ, Lopez AD. Alternative projections of mortality by cause 1990-2020: Global Burden of Disease Study. Lancet 1997;349:1498-1504
7. World Health Organisation. The World Health Report 2001: Mental Health: New Understanding, New Hope. World Health Organisation: Geneva; 2001
8. Smith JP, Smith GC. Long-term economic costs of psychological problems during childhood. Soc Sci Med. 2010 Jul;71(1):110-5.
9. Australian Institute of Health and Welfare. General practice activity in Australia 2004-05. Australian Institute of Health and Welfare: Canberra, 2005.
10. Australian Bureau of Statistics. Population projections Australia 2004-2102. Canberra: ABS, 2005.
11. Hueston WJ. Does Having a Personal Physician Improve Quality of Care in Diabetes? JABFM. 2010 Jan-Feb;23(1):82-87.
12. Haydar Z, Cox M, Stafford P, Rodriguez V, Ballard DJ. Accelerating Best Care at Baylor Dallas. Proc (Bayl Univ Med Cent) 2009;22(4):311-315

123
13. Detweiler-Bedell JB, Friedman MA, Leventhal H, Miller IW, Leventhal EA. Integrating Co-Morbid Depression and Chronic Physical Disease Management: Identifying and Resolving Failures in Self-Regulation. Clin Psychol Rev. 2008 Dec;28(8):1426-1446.
14. Mitchell GK, Tieman JJ, Shelby-James TM. Multidisciplinary care planning and teamwork in primary care. MJA 2008 Apr;188(8):61-64.
15. Dennis SM, Zwar N, Griffiths R, Roland M, Hasan I, Davies GP, Harris M. Chronic disease management in primary care: from evidence to policy. MJA 2008 Apr;188(8):53-56.
16. Lewanczuk R. Hypertension as a chronic disease: What can be done at a regional level? Can J Cardiol: 2008 Jun; 24(6):483-84.
17. Eley DS, Del Mar CB, Patterson E. A nurse led model of chronic disease care. An interim report. AFP. 2008 Dec;37(12):1030-1032.
18. Ndumele CD, Russell BE, Ayanian JZ, Landon BE, Keegan T, O’Malley J, Hicks LS. Strategies to Improve Chronic Disease Management in Seven Boston Metro Community Health Centers. Prog Community Health Partnersh. 2009;3(3):203-211.
19. Russell GM, Dahrouge S, Hogg W, Geneau R, Muldoon L, Tuna M. Managing Chronic Disease in Ontario Primary Care: The Impact of Organizational Factors. Ann Fam Med. 2009;7:309-318.
20. Askew DA, Jackson CL, Ware RS, Russell A. Protocol and baseline data from The Inala Chronic Disease Management Service evaluation study: a health services intervention study for diabetes care. BMC Health Services Research 2010;10:134-143.
21. Kelleher K. Organizational Capacity to Deliver Effective Treatments for Children and Adolescents. Adm Policy Ment Health. 2010;37:89-94.
22. Sidorov J. The Patient-Centered Medical Home For Chronic Illness: Is It Ready For Prime Time? Health Affairs. 2008;5:1231-1234
23. Rosenthal TC. The Medical Home: Growing Evidence to Support a New Approach to Primary Care. JABFM. 2008 Sep-Oct;21(5):427-440.
24. Crawley D, Ng A, Mainous AG, Majeed A, Millett C. Impact of pay for performance on quality of chronic disease management by social class group in England. J R Soc Med. 2009;102:103-107.

124
25. Gold R, DeVoe J, Shah A, Chauvie S. Insurance continuity and receipt of diabetes preventive care in a network of Federally Qualified health Centers. Med Care. 2009 Apr;47(4):431-439.
26. Boyd CM, Darer J, Boult C, Fried LP, Boult L, Wu AW. Clinical Practice Guidelines and Quality of Care for Older Patients With Multiple Comorbid Diseases. JAMA 2005 Aug;294(6):716-724.
27. Boren SA, Puchbauer AM, Williams F. Computerized Prompting and Feedback of Diabetes Care: A Review of the Literature. J Diabetes Sci Technol. 2009 Jul;3(4):944-950.
28. Every B. Better for Ourselves and Better for Our Patients: Chronic Disease Management in Primary Care Networks. Healthcare Quarterly. 2007;10(3):70-74.
29. Tylee A, Walters P. We need a chronic disease management model for depression in primary care. British Journal of General Practice. 2007 May;348-250.
30. Kotecha J, Birtwhistle RV. Use of electronic medical records. Reminders and decision aids for chronic disease management. Canadian Family Physician. 2009 Sep;55:899
31. Haynes RB, Wilczynski NL. Effects of computerized clinical decision support systems on practitioner performance and patient outcomes: Methods of a decision-maker-researcher partnership systematic review. Implementation Science. 2010;5(12):1-8.
32. Schnipper JL, Linder JA, Palchuk MB, Yu DT, McColgan KE, Volk LA, Tsurikova R, Melnikas A, Einbinder JS, Middleton B. Effects of Documentation-Based Decision Support on Chronic Disease Management. AJMC. 2010 Dec;16:72-81.
33. Dexter PR, Miller DK, Clark DO, Weiner M, Harris LE, Livin L, Myers I, Shaw D, Blue LA, Kunzer J, Overhage JM. Preparing for an Aging Population and Improving Chronic Disease Management. Proc AMIA Symp. 2010;162-166.
34. Concaro S, Sacchi L, Cerra C, Stefanelli M, Fratino P, Bellazzi R. Temporal Data Mining for the Assessment of the Costs Related to diabetes Mellitus Pharmacological Treatment. Proc AMIA Symp. 2009:;119-123.
35. Canadian Health Services Research Foundation. Turning the Tide on Chronic
Disease: How a Province Is Using Evidence to Build Quality Improvement Capacity. Healthcare Policy. 2007;3(2):67-70.

125
36. Van der Meer V, van Stel HF, Detmar SB, Otten W, Sterk PJ, Sont JK. Internet-Based Self-Management Offers an Opportunity To Achieve Better Asthma Control in Adolescents. Chest. 2007 Mar;132:112-119.
37. Poon EG, Wald J, Bates DW, Middleton B, Kuperman GJ, Gandhi TK. Supporting Patient Care Beyond the Clinical Encounter: Three Informatics Innovations from Partners Health Care. Proc AMIA Symp. 2003:;1072
38. Kern LM, Barron Y, Blair AJ, Salkowe J, Chambers D, Callahan MA, Kaushal R. Electronic Result Viewing and Quality of Care in Small Group Practices. J Gen Intern Med. 2007;23(4):405-410.
39. Boren SA, Gunlock TL, Peeples MM, Krishna S. Computerized Learning Technologies for Diabetes: A Systematic Review. J Diabetes Sci Technol. 2008 Jan;2(1):139-146.
40. Katz DL, Nordwall B. Novel Interactive Cell-Phone Technology for Health Enhancement. J Diabetes Sci Technol. 2008 Jan;2(1):147-153.
41. Wise M, Gustafson DH, Sorkness CA, Molfenter T, Staresinic A, Meis T, Hawkins RP, Shanovich KK, Walker NP. Internet Telehealth for Pediatric Asthma Case Management: Tailoring a Web-Based Asthma Education Program. Health Promot Pract. 2007 Jul;8(3):282-291.
42. Pinnock H, Slack R, Pagliari C, Price D, Sheikh A. Professional and patient attitudes to using mobile phone technology to monitor asthma: questionnaire survey. Primary Care Respiratory Journal. 2006;15:237-245.
43. Inmon B. Essential Steps for the Integrated EDW. A Kimball Group White Paper. Available from: http://www.informatica.com/downloads/essential_integrated_edw.pdf
44. Berenso R, Hammons T, Gans DN, Zuckerman S, Merrell K, Underwood WS, Williams AF. A House Is Not A Home: Keeping Patients At The Center Of Practice Redesign. Health Affairs. 2008;27(5):1219-1230.
45. Executive Brief. What Your CEO Should Know About Master Data Management. Available from: http://www.informatica.com/downloads/1511_MDM_CEO_exec_brief_web.pdf
46. Hayward RS, Wilson MC, Tunis SR, Bass EB, Buyatt G. Evidence-Based medicine Working Group. User’s guides to the medical literatures, VIII: how to use clinical practice guidelines: Are the recommendations valid? JAMA. 1995;274:570-574.

126
47. Standard outcome metrics and evaluation methodology for disease management programs. Paper presented at: Second Annual Disease management Outcomes Summit; November 2002; Palm Desert Calif.
48. Computerworld website. Available from: http://www.computerworld.com/s/article/70102/The_Story_So_Far
49. Garber AM. Evidence-based guidelines as a foundation for performance incentives. Health Aff. 2005;24:174-179.
50. Tinetti ME, Fried T. The end of the disease era. Am J Med. 2004;116:179-185.
51. Tinetti ME, Bogardus ST Jr, ,Agostini JV. Potential pitfalls of disease-specific guidelines for patients with multiple conditions. N Engl J Med. 2004;351:2870-2874.
52. Loshin, D. Improving Organizational Productivity through Improved Data Quality. Available from: http://www.informatica.com/downloads/1511_MDM_CEO_exec_brief_web.pdf
53. Ferrante JM, Balasubramanian BA, Hudson SV, Crabtree BF. Principles of the Patient-Centered Medical Home and Preventive Services Delivery. Annals of Family Medicine. 2010 Mar/Apr:8(2):108-116.
54. Sia C. et al. History of the Medical Home Concept. Pediatrics. 2004:113(5):1473-1478
55. World Health Organization. Declaration of Alma-Ata. WHO Chronicle. 1978:32(II)428-430.
56. American Academy of Family Physicians, American Academy of Pediatrics, American College of Physicians, American Osteopathic Association. Joint principles of the Patient-centered Medical home. Mar 2007. Available at www.pcpcc.net/content/joint-principles-patient-centered-medical-home. Accessed July 27, 2008.
57. Dartmouth Atlas of Health Care. Variation among states in the management of severe chronic illness. 2006.
58. Starfield B, Shi L, Macinko J. Improving chronic illness care: translating evidence into action. Health Aff. 2001;20:64-78.
59. Starfield B, Shi L, Macinko J. Contributions of primary care to health systems and health. Millbank Q. 2004;83:457-502.

127
60. Starfield B, Shi L, Grover A, Macinko J. The effect of specialist supply on populations’ health: assessing the evidence. Health Affairs Web Exclusive. March 15, 2005 (W5-97).
61. Starfield B. Presentation to The Commonwealth Fund, Primary Care Roundtable: Strengthening adult primary care: models and policy options. October 3, 2006.
62. Beal AC, doty MM, Hernandez SE, Shea KK, Davis K. Closing the divide: how medical homes promote equity in health care: result from The Commonwealth Fund 2006 Health Care Quality Survey. The Commonwealth Fund. June 2007.
63. Richardson J, Schlegel K, Sallam RL, Hostmann B. Magic Quadrant for Business Intelligence Platforms. Gartner. 16-January-2009.
64. ACMHA website. Available at www.acmha.org
65. Wagner EH, Austin BT, Davis C, Hindmarch m, Schaefer J, Bonomi A. Improving chronic illness care: Translating evidence into action. Health Aff (Millwood). 2001;20:64-78
66. Pathma DE, Konrad TR, Freed GL, Freeman VA, Koch GG. The awareness-to-adherence model of the steps to clinical guideline compliance. The case of pediatric vaccine recommendations. Med Care. Sep 1996;34(9):873-889.
67. Ohman Strickland PA, Hudson, SV, Piasecki A, Hahn K, Cohen D, Orzano AJ, Parchman ML, Crabtree BF. Features of the Chronic Care Model (CCM) Associated with Behavioral Counseling and Diabetes Care in Community Primary Care. JABFM. 2010 May-June:23(3):295-305.