an improved racemase/acylase … fragmentation. the protein digest was separated using an identical...
TRANSCRIPT

S1
Experimental section:
Materials:
Plasmids and Escherichia coli competent cells were purchased from Novagen. All buffers and
reagents including L-penicillamine, pyridoxal 5’-phosphate (PLP) and pyridoxal (PL) were
from Sigma-Aldrich. Palmitoyl-CoA was from Avanti Lipids. Palmitoyl Chloride was
purchased from Alfa Aesar, and coenzyme A (free hydrate) was purchased from Bosche
Scientific. All other chemicals were purchased from Aldrich and used without further
purification. The thioester analogue of palmitoyl-CoA, S-(2-oxoheptadecyl)-CoA, was
synthesised as described 1 with modifications inspired by Gerson and Schlenk
2.
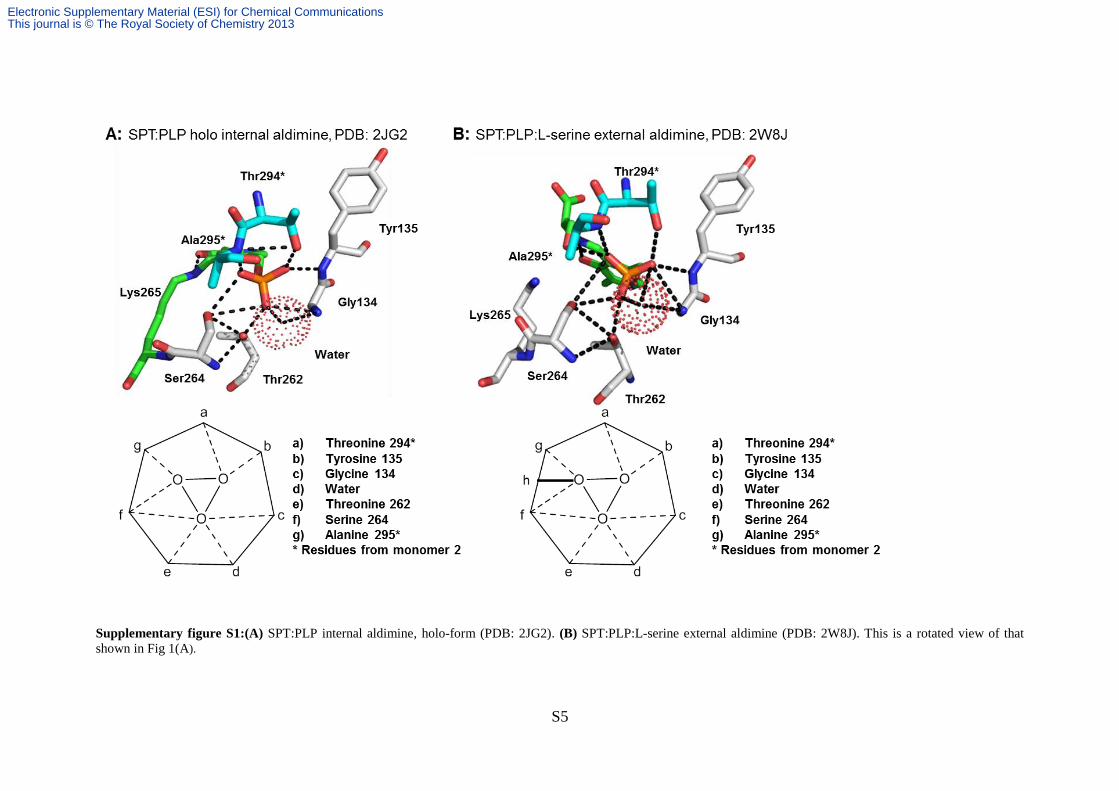
Phosphate binding cup analysis of AOS enzymes:
We analysed the X-ray crystal structures of the internal and external PLP:aldimines of the
SPT, PDB codes: 2JG2, 2W8J 3, 4
.
Cloning and expression of Sphingomonas paucimobilis SPT (SP SPT):
The SP SPT enzyme was prepared as previously described 3 using 20 mM Tris in place of
potassium phosphate buffer in all steps. The apo-enzyme was prepared following previous
methods 5. The PL-reconstituted enzyme was obtained by dialysis against 1L (x3) 20 mM Tris
(pH 7.5) containing 150 mM NaCl and 250 µM PL.
Spectroscopic measurements:
All UV-visible spectra were recorded on a Cary 50 UV-visible spectrophotometer (Varian)
and analysed using Cary WinUV software (Varian). Prior to all UV-visible spectroscopy and
assays, SPT was dialysed against fresh buffers containing 250 µM PLP or PL to ensure the
enzyme was in the PLP or PL-bound, holo-form. Excess PLP or PL was removed on a PD-10
(Sephadex G-25M) desalting column (GE Healthcare). For UV-visible assays the
concentration of enzyme was 40 µM and the spectrophotometer was blanked with 20 mM
Tris (pH 7.5) containing 150 mM NaCl at 25 °C. Quartz cuvettes from NSG Precision Cells,
Type 18-BM with a lightpath of 10 mm and a sample volume of 500 µl were used and the
spectra were collected from 800 nm to 200 nm.
SPT activity by measuring CoASH release using DTNB assay:
SPT activity was measured using the DTNB assay as previously described 3. Assays contained
enzyme, substrates and DTNB with final concentrations as followed: 0.25 µM SpSPT, 25 mM
L-serine, 250 µM palmitoyl-CoA, 0.2 mM DTNB in 20 mM Hepes buffer, pH 8.0 at 25 °C.
Control SPT:PLP samples before removal of PLP, regeneration of PLP or addition of PL rates
Electronic Supplementary Material (ESI) for Chemical CommunicationsThis journal is © The Royal Society of Chemistry 2013
S2
were normalised to 100% relative activity. Activity assays were carried out in duplicate and
the error bars are the standard error of the mean (SEM) values for each separate experiment.
A typical experiment to determine the Km value for L-serine contained 0.42 µM SPT, 0.1 – 50
mM L-serine, 250 µM palmitoyl CoA and 0.2 mM DTNB in 50 mM potassium phosphate
buffer pH 7.5. Km values were calculated directly from Michaelis-Menten plots using Sigma
Plot.
SPT activity by measuring KDS formation:
SPT activity was monitored by incorporation of U- 14
C L-serine (PerkinElmer) into 14
C-KDS.
3 A final enzyme concentration of 25µM SPT (in 20 mM Tris buffer, pH 7.5, 150 mM NaCl)
was incubated with 20 mM 14
C L-serine (7400 Bq, 0.2 µCi,) and 250 µM palmitoyl-CoA in a
final volume of 1 mL. The reaction was incubated at 37 °C for 20 minutes and then the
reaction was quenched by the addition of NH4OH (final concentration 0.4 M). This was then
extracted with an equal volume of CHCl3:CH3OH (2:1, v:v). The sample was centrifuged at
13, 000 rpm for 5 minutes and the aqueous phase was discarded. The organic phase was left
to evaporate at 50 °C. The resulting lipid residue was re-suspended in 15 µl of CHCl3:CH3OH
(2:1, v:v) and spotted onto a Silica Gel 60 F254 TLC plate. Separation was carried out with a
mobile phase of CHCl3:CH3OH (2:1, v:v). The TLC was visualised using an AR-2000TM
imaging scanner.
Analysis of SPT:PL by mass spectrometry:
The PL-bound enzyme was reduced with 1 mM sodium borohydride for 30 minutes at 25 °C.
The shift in absorbance that accompanied the reduction of the imine to an amine was
monitored by UV-vis spectroscopy. The sample was then treated with trypsin at a final
trypsin:SPT sample ratio of 1:50.
Online LC-MS of SPT Typtic Digest:
Online Mass Spectrometry - On-line liquid chromatography was performed using an Ultimate
3000 HPLC system (Dionex) equipped with a monolithic PS-DVB (500 μm X 50 mm)
reverse-phase analytical column (Dionex) coupled to electrospray ionization (nESI). Protein
digests (5 pmoles) were loaded onto the column (maintained at 60°C) followed by a 30 min
linear gradient from 2 to 70% acetonitrile (flow rate 20 μl/min). All mass spectra were
recorded on SolariX FT-ICR mass spectrometer equipped with a 12 T superconducting
magnet (Bruker Daltonics). Transient data size was set to 1Mword for each acquisition.
Online Tandem Mass Spectrometry - Online tandem MS was performed on the SolariX FT-
ICR Instrument. After the initial LC-MS run specific peptides of interest were selected for
Electronic Supplementary Material (ESI) for Chemical CommunicationsThis journal is © The Royal Society of Chemistry 2013

S3
fragmentation. The protein digest was separated using an identical gradient to the above.
However, the mass resolving quadrupole was set to select for a specific m/z throughout the
LC-MS run and MS/MS was performed using collision-induced dissociation (CID).
Data Analysis - All spectra were externally calibrated using ES tuning mix (Agilent
Technologies) and analyzed using DataAnalysis software (Bruker Daltonics). For analysis of
the tryptic digest, the SNAP 2.0 algorithm was used for automated peak picking in order to
create a list of peptide masses. For CID experiments, fragment lists were created (using SNAP
2.0) and the resulting mass lists were searched against the relevant primary sequences using
Prosight PTM software. Error tolerances were set to 10ppm. Isotope distributions of specific
charge states were predicted from theoretical empirical formulas. These were overlaid upon
the recorded experimental data as scatter plots, with the theoretical apex of each isotope peak
designated by a circle.
Determination of dissociation constants, substrate and product quinonoid detection and
SPT activity assays:
Binding assays typically contained 40 µM enzyme in 20 mM Tris (pH 7.5). Varying amounts
of L-serine (0-60 mM) was added and after addition of the substrate, the reaction mixture was
allowed to equilibrate for 15 min at 25 °C. The Kd values were calculated from plots of ∆425
versus L-serine concentrations by fitting to a hyperbolic saturation curve using Sigma Plot
software.
where ∆Aobs represents the observed change in absorbance at 422 nm, and ∆Amax is the
maximal absorbance change, [serine] represents L-serine concentration, and the Kd is the
dissociation constant1. To form the substrate quinonoid, 50 mM L-serine and 1.5 mM S-(2-
oxoheptadecyl)-CoA were added to the enzyme. After addition, the reactants were mixed and
allowed to equilibrate for 15 min at 25 °C. To form the product quinonoid, 25 µM KDS was
added to the enzyme and allowed to equilibrate for 15 min at 25 °C.
Synthesis of S-(2-oxoheptadecyl)-CoA:
Palmitoyl Chloride was purchased from Alfa Aesar, coenzyme A (free hydrate) was purchased
from Bosche Scientific all other chemicals were purchased form Aldrich and used without
further purification. 1H NMR spectra were recorded on a Bruker OPEN400 (400 MHz)
spectrometer. Chemical shifts (δ) are quoted in parts per million (ppm) downfield of
tetramethylsilane, using residual protonated solvent as internal standard (D2O at 4.79 ppm).
ΔAobs ΔAmax [serine]
Kd + [serine] =
Electronic Supplementary Material (ESI) for Chemical CommunicationsThis journal is © The Royal Society of Chemistry 2013

S4
Abbreviations used in the description of resonances are: s (singlet), d (doublet), t (triplet), q
(quartet), app (apparent), br (broad).
Synthesis of 1-chloro-heptadecan-2-one: Trimethylsilyldiazomethane (6 mL, 2M in Hexane)
was diluted into acetonitrile (30 mL) and cooled to 0 oC. Palmitoyl chloride (1.7g, 6 mmol) in
acetonitrile (6 mL) was added dropwise. The reaction mixture was stirred at room room
temperature for 2 hours. The solvent was removed under reduced pressure. The resulting
powder (1.96 g) was suspended in diethyl ether (20 mL) before the dropwise addition of
hydrogen chloride solution (7 mL, 14 mmol, 2M in diethyl ether). The reaction mixture was
stirred for 30 minutes before all volatile components were removed under vacuum. The crude
product was purified by column chromatography on silica gel (5% Ethyl Acetate/Hexane) to
yield 1-chloro-heptadecan-2-one (1.3 g, 75%) as a white solid that displayed spectroscopic
data consistent with those reported previously.2
Synthesis of S-(2-oxoheptadecyl)-CoA: Li2CO3 (3 g, 0.41 mmol) was dissolved in water (10
mL). The solution was purged with Argon for 30 minutes before coenzyme A (100 mg, 0.12
mmol) was added. The reaction mixture was purged with argon for a further 30 minutes. 1-
chloro-heptadecan-2-one (173mg, 0.6 mmol) was dissolved in toluene (1 mL). The ketone
solution was then diluted with ethanol (19 mL) and added dropwise to the coenzyme A
solution. The reaction mixture was left stirring under an atmosphere of argon for 18 hours.
The reaction mixture was poured into acetone (500 mL) and the resulting white solid
collected. The solid was then washed with ethanol (100 mL) and diethyl ether (2x100 mL)
and dried under vacuum to yield a white solid (49 mg, 40%) that displayed spectroscopic data
consistent with those reported previously. 1 The 1H nmr spectrum is shown in Supplementary
figure S6 below.
.
Electronic Supplementary Material (ESI) for Chemical CommunicationsThis journal is © The Royal Society of Chemistry 2013
S5
Supplementary figure S1:(A) SPT:PLP internal aldimine, holo-form (PDB: 2JG2). (B) SPT:PLP:L-serine external aldimine (PDB: 2W8J). This is a rotated view of that
shown in Fig 1(A).
Electronic Supplementary Material (ESI) for Chemical CommunicationsThis journal is © The Royal Society of Chemistry 2013

S6
Supplementary figure S2: Sequence analysis of AOS family of PLP dependent enzymes; SPT, S.
paucimobilis Serine PalmitoylTransferase (Uniprot code: Q93UV0); AONS, E. coli
AminoOxoNonanoate Synthase (P12998); KBL, E. coli KetoButyrate Ligase (P0AB77), ALAS, R.
capsulatus AminoLevulinic Acid Synthase (P18079). The sequence alignment was generated using
CLUSTALW2. 6, 7
Conserved residues are shown in yellow, residues involved in PLP binding are in
green and residues involved in the phosphate binding cup are shown in cyan.
Electronic Supplementary Material (ESI) for Chemical CommunicationsThis journal is © The Royal Society of Chemistry 2013

S7
Supplementary figure S3. Peptide mass fingerprinting of SPT:PL confirms that PL binds to
Lys265.
(A) Sequence coverage achieved when analysing the trypsin digest of SPT:PL. Amino acids
highlighted in bold were observed in the peptide mass fingerprint (total coverage - 55%). Lys265, the
PLP-bound SPT active site residue is highlighted in red. A singles species, with monoisotopic neutral
mass 3859.94 Da, displayed a mass consistent with the tryptic peptide G245-K280 with the covalent
addition of PL (underlined).
(B) The observed mass spectrum of the trypsin digest of PL-modified SPT (left) and the observed
isotope distribution of the species consistent with PL-modified G245-K280 peptide (right). The species
was observed in the [M+4H]4+
charge state at monoisotopic m/z 965.9813. The theoretical isotopic
distribution is overlaid on the experimental data as red circles ([C168H257N43O52+ C8H9NO2 + 4H]4+
;
calculated monoisotopic m/z 965.9928 (4+); error 11 ppm).
(C) Collision induced dissociation fragmentation map of the PL-modified G245-K280 peptide. The
resulting b and y ion fragments (data not shown) represented in red ticks, were mapped onto the peptide
sequence of SPT using ProSight-PTM. Fragmentation allowed the assignment of the PL modification
to a 14 amino acid section of the protein containing Lys265.
Electronic Supplementary Material (ESI) for Chemical CommunicationsThis journal is © The Royal Society of Chemistry 2013

S8
Supplementary Table: Kinetic parameters for the SPT:PLP wild type, SPT:PLP reloaded and SPT:PL
reloaded enzyme.
Supplementary figure S4: Dissociation constant for SPT:PL measured at 425 nm with increasing L-
serine concentrations.
Supplementary figure S5: (A) UV-vis spectra of SPT:PLP (solid line), after addition of 25 µM KDS
(dashed line) (B) UV- vis spectra of SPT:PL (solid line), after addition of 25 µM KDS (dashed line).
Conditions: 20 mM Tris, pH 7.5 and 40 µM enzyme.
Electronic Supplementary Material (ESI) for Chemical CommunicationsThis journal is © The Royal Society of Chemistry 2013

S9
Supplementary figure S6: NMR analysis of S-(2-oxoheptadecyl)-CoA. 1H NMR (400 MHz, D2O) δ 8.37 (1H, b), 7.95 (1H, a), 6.00 (1H, c), 4.49 (1H, f), 4.16 (2H, g), 3.94
(1H, j), 3.79 (1H, h), 3.48 (1H, k), 3.37 (2H, o), 3.29 (2H, m), 2.57 (2H, n), 2.55 (2H, p), 2.40 (2H, l), 1.48 (2H, q), 0.8 (3H, i), (0.78 (3H, i), 0.63 (3H, r)
Electronic Supplementary Material (ESI) for Chemical CommunicationsThis journal is © The Royal Society of Chemistry 2013

S10
1
H. Ikushiro, S. Fujii, Y. Shiraiwa, and H. Hayashi, J. Biol. Chem., 2008, 283, 7542. 2
T. Gerson and H. Schlenk, Chem. Phys. Lipids, 1968, 2, 213. 3
M. C. Raman, K. A. Johnson, B. A. Yard, J. Lowther, L. G. Carter, J. H. Naismith, and D. J. Campopiano, J. Biol. Chem., 2009, 284,
17328. 4
B. A. Yard, L. G. Carter, K. A. Johnson, I. M. Overton, M. Dorward, H. Liu, S. A. McMahon, M. Oke, D. Puech, G. J. Barton, J. H.
Naismith, and D. J. Campopiano, J. Mol. Biol., 2007, 370, 870. 5
J. Lowther, A. E. Beattie, P. R. R. Langdridge-Smith, D. J. Clarke, and D. J. Campopiano, Med. Chem. Comm., 2012, 3, 1003. 6
M. Goujon, H. McWilliam, W. Li, F. Valentin, S. Squizzato, J. Paern, and R. Lopez, Nucleic Acids Res., 2010, 38, W695. 7
M. A. Larkin, G. Blackshields, N. P. Brown, R. Chenna, P. A. McGettigan, H. McWilliam, F. Valentin, I. M. Wallace, A. Wilm, R.
Lopez, J. D. Thompson, T. J. Gibson, and D. G. Higgins, Bioinformatics, 2007, 23, 2947.
Electronic Supplementary Material (ESI) for Chemical CommunicationsThis journal is © The Royal Society of Chemistry 2013