an improved approach for dsm generation from high‐resolution satellite imagery
TRANSCRIPT
This article was downloaded by: [Queensland University of Technology]On: 31 October 2014, At: 09:25Publisher: Taylor & FrancisInforma Ltd Registered in England and Wales Registered Number: 1072954 Registeredoffice: Mortimer House, 37-41 Mortimer Street, London W1T 3JH, UK
Journal of Spatial SciencePublication details, including instructions for authors andsubscription information:http://www.tandfonline.com/loi/tjss20
An improved approach for DSMgeneration from high‐resolution satelliteimageryC. Zhang a & C. S. Fraser ba GIS Center of Excellence , South Dakota State University ,Brookings, SD, 57007, USA E-mail:b Department of Geomatics , University of Melbourne , Melbourne,Vic, 3010, Australia E-mail:Published online: 13 Aug 2010.
To cite this article: C. Zhang & C. S. Fraser (2009) An improved approach for DSM generationfrom high‐resolution satellite imagery, Journal of Spatial Science, 54:2, 1-13, DOI:10.1080/14498596.2009.9635175
To link to this article: http://dx.doi.org/10.1080/14498596.2009.9635175
PLEASE SCROLL DOWN FOR ARTICLE
Taylor & Francis makes every effort to ensure the accuracy of all the information (the“Content”) contained in the publications on our platform. However, Taylor & Francis,our agents, and our licensors make no representations or warranties whatsoever as tothe accuracy, completeness, or suitability for any purpose of the Content. Any opinionsand views expressed in this publication are the opinions and views of the authors,and are not the views of or endorsed by Taylor & Francis. The accuracy of the Contentshould not be relied upon and should be independently verified with primary sourcesof information. Taylor and Francis shall not be liable for any losses, actions, claims,proceedings, demands, costs, expenses, damages, and other liabilities whatsoever orhowsoever caused arising directly or indirectly in connection with, in relation to or arisingout of the use of the Content.
This article may be used for research, teaching, and private study purposes. Anysubstantial or systematic reproduction, redistribution, reselling, loan, sub-licensing,systematic supply, or distribution in any form to anyone is expressly forbidden. Terms &Conditions of access and use can be found at http://www.tandfonline.com/page/terms-and-conditions
SPATIAL SCIENCE 1 Vol. 54, No. 2, December 2009
An Improved Approach for DSM Generation from High-Resolution Satellite Imagery
C. Zhang C. S. Fraser
C. Zhang GIS Center of ExcellenceSouth Dakota State University Brookings, SD 57007, [email protected]
C. S. FraserDepartment of GeomaticsUniversity of Melbourne Melbourne, Vic 3010, [email protected]
This paper deve lops an improved approach to digital surface model (DSM) generation from high-resolution satellite imagery (HRSI). The approach centres upon an image matching strategy that integrates feature point, grid point and edge matching algorithms within a coarse-to-fine hierarchical process. The starting point is a knowledge of precise sensor orientation, achieved in this case through bias-compensated rational polynomial coefficients (RPCs), and the DSM is sequentially constructed through a combination of the matching results for feature and grid points, and edges at different image pyramid levels. The approach is designed to produce precise, reliable and very dense DSMs which preserve information on surface discontinuit ies. Fol lowing a brief introduction to sensor orientation modelling, the integrated image matching
algorithms and DSM generation stages are described. The proposed approach is then experimentally tested through the generation of a DSM covering the Hobart area from a stereo pair of IKONOS Geo images. The accuracy of the resulting surface model is assessed using both ground checkpoints and a lidar DSM, with the results indicating that for favourable imagery and land cover, a heighting accuracy of 2 - 4 pixels can be readily achieved. This result validates the feasibility of the developed approach for DSM production from HRSI.
Keywords: Image matching, IKONOS, high resolution, DSM, accuracy, hierarchical matching strategy
INTRODUCTIONHigh-resolution satellite imagery (HRSI) is commercially available from a variety of platforms at a range of spatial resolutions, the highest currently being the 41cm ground sample distance (GSD) provided by the recently launched GeoEye-1 satellite. As resolution increases, so does the potential for more accurate and reliable extraction and characterization of finer detail on the earth’s surface. The ability of HRSI sensors to vary their viewing angle in a single orbit provides the capability of recording stereo or even triple-overlapped images from the
Dow
nloa
ded
by [
Que
ensl
and
Uni
vers
ity o
f T
echn
olog
y] a
t 09:
25 3
1 O
ctob
er 2
014
Vol. 54, No. 2, December 2009 2 SPATIAL SCIENCE
same orbital pass. The collected imagery can thus alleviate temporal variability concerns as the minute or so separation between the in-track capture of successive scenes allows consistent imaging conditions, which are then optimal for image matching. The radiometric and geometric characteristics of HRSI make it well suited for digital surface model (DSM) generation (Toutin, 2004; Poon et al., 2005; Krauss et al., 2005; Sohn et al., 2005; Zhang and Gruen, 2006; Poon et al., 2007; Büyüksalih and Jacobsen, 2008) and feature extraction (Zhang et al., 2005).
This paper outlines a recent development in the generation of DSMs from HRSI, namely an approach incorporating an improved image matching phase. The method uses a coarse-to-fine hierarchical solution with a combination of several image matching algorithms, thus providing dense, precise and reliable results. Following a brief account of sensor modeling and orientation aspects related to precise image georeferencing, the proposed image matching approach for automatic DSM generation is described. The hierarchical approach employs a processing chain that produces an initial DSM through feature point matching, which is then subsequently refined via grid point and edge matching.
The improved DSM generation approach has been experimentally assessed using a number of HRSI stereo scenes and in this paper a comprehensive evaluation of the approach applied to IKONOS imagery over the Hobart HRSI test field (Fraser and Hanley, 2003; 2005) is reported. This experimental application over varying terrain with a large height range and comprising city, urban and forest land cover, utilized a lidar derived DSM as a reference surface for accuracy evaluation.
SENSOR MODELING AND IMAGE ORIENTATION
High-resolution imaging satellites operate with a linear array scanner where images are obtained with a pushbroom sensor. Thus, the imagery is composed of consecutive scan lines where each line is independently acquired with perspective projection in
accordance with the collinearity equation incorporating time dependent attitude angles and perspective centre position. To mathematically describe the object-to-image space transformation, the rational polynomial coefficient (RPC) model is now widely accepted and extensively used (Fraser and Hanley, 2003; Grodecki and Dial, 2003; Jacobsen, 2003; Baltsavias et al., 2005). RPCs are derived from the satellite’s orbital position and orientation data via a rigorous sensor model (Grodecki and Dial, 2003). The general form of the RPC model is given as:
where
and ln and sn are the normalized line and sample coordinates, LS and L0 the line scale and line offset, SS and S0 the sample scale and sample offset, and U, V and W the normalized latitude, longitude and ellipsoidal height.
B e cau se R PCs are d e r ive d f ro m orientation data originating from the satellite ephemeris and star tracker observations, without reference to ground control points (GCPs), geopositioning biases are inherently present. These biases can be accounted for by introducing additional parameters into the original RPC model (Fraser and Hanley, 2003; Fraser et al., 2006). The general bias compensated model is then given as:
Here, F (l,s) and G (l,s) are functions to model bias. Theoretically, any order of function can be used, however while higher order functions require more GCPs, they do not necessarily increase geopositioning
00 ,n S n Sl l L L s s S S (1)
3
0
3
0
3
0i j k
kjiijk WVUaNum ,
3
0
3
0
3
0i j k
kjiijk WVUbDen (3)
0
0
),,(),,(
),(
),,(),,(),(
SSWVUDenWVUNum
slGs
LLWVUDenWVUNumslFl
SS
S
SL
L
(4)
( , , )( , , ) ,( , , ) ( , , )
SLn n
L S
Num U V WNum U V Wl sDen U V W Den U V W
(2)
Dow
nloa
ded
by [
Que
ensl
and
Uni
vers
ity o
f T
echn
olog
y] a
t 09:
25 3
1 O
ctob
er 2
014
SPATIAL SCIENCE 3 Vol. 54, No. 2, December 2009
accuracy (Fraser et al ., 2006). In the implementation adopted for the present study, an affine distortion model introduced in Fraser and Hanley (2003) has been adopted.
After the bias compensation process, bias-corrected RPCs can be generated and these allow bias-free application of RPC positioning without the need to refer to additional correction terms (Fraser and Hanley, 2003; Grodecki and Dial, 2003; Fraser et al., 2006). It has been shown in previous research that with bias-corrected RPCs, sub-pixel level geopositioning accuracy can be achieved from high-resolution satellite imagery (Fraser and Hanley, 2003; Fraser and Hanley, 2005; Baltsavias et al., 2005; Fraser et al., 2006). As demonstrated in Dial and Grodecki (2002), sub-pixel accuracy is usually obtained from IKONOS image strips of shorter than 50km in length. The sensor orientation and precise georeferencing undertaken to support the reported research into DSM generation has utilized bias-corrected RPCs exclusively.
IMAGE MATCHING AND DSM GENERATION
Image matching is at the core of automatic DSM generation via digital photogrammetry and it has remained an active topic of research in photogrammetry and computer vision. To generate a DSM, robust and reliable image matching is essential for the collection of the 3D data points. The goal of image matching is to automatically find feature point correspondences in overlapping images. A wide variety of image matching approaches have been developed for DSM generation from stereo imagery, and a number of these are embodied in commercially available digital photogrammetric workstations. However, a fully automatic, precise and reliable image matching method, that readily adapts to different image configurations and scene content remains elusive. Current limitations in image matching arise mainly from an insufficient understanding and modeling of the underlying process and from a lack of appropriate theoretical measures for self-
tuning and quality control. Difficulties include radiometric and geometric distortions, occlusions, repeated patterns and lack of features. A recent research trend in image matching is towards hierarchical solutions with a combination of several algorithms and automatic process control (Zhang and Gruen, 2006) and the work described in this paper follows this trend.
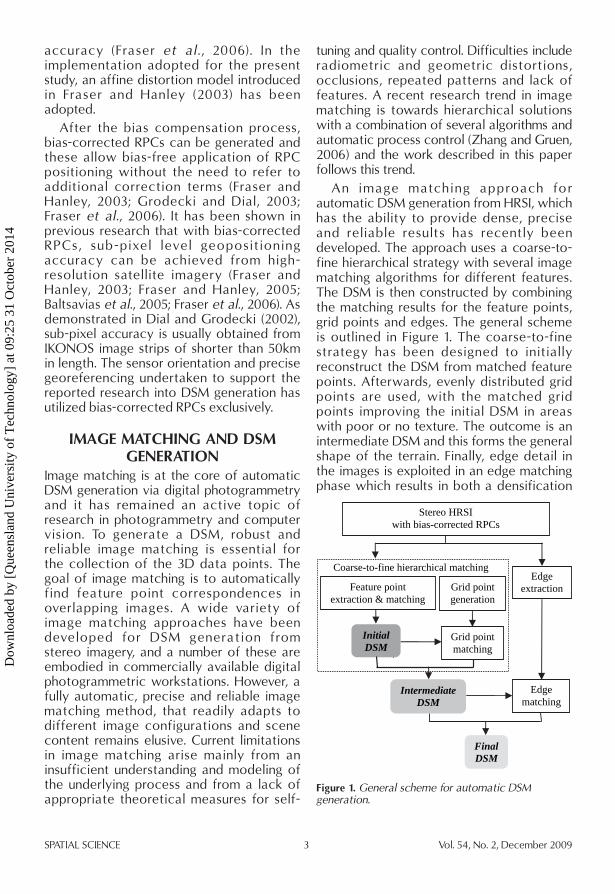
An image match ing approach for automatic DSM generation from HRSI, which has the ability to provide dense, precise and reliable results has recently been developed. The approach uses a coarse-to-fine hierarchical strategy with several image matching algorithms for different features. The DSM is then constructed by combining the matching results for the feature points, grid points and edges. The general scheme is outlined in Figure 1. The coarse-to-fine strategy has been designed to initially reconstruct the DSM from matched feature points. Afterwards, evenly distributed grid points are used, with the matched grid points improving the initial DSM in areas with poor or no texture. The outcome is an intermediate DSM and this forms the general shape of the terrain. Finally, edge detail in the images is exploited in an edge matching phase which results in both a densification
Figure 1. General scheme for automatic DSM generation.
Grid point matching
Coarse-to-fine hierarchical matching Edge
extraction
Edge matching
Feature point extraction & matching
Initial DSM
Intermediate DSM
Final DSM
Grid point generation
Stereo HRSI with bias-corrected RPCs
Dow
nloa
ded
by [
Que
ensl
and
Uni
vers
ity o
f T
echn
olog
y] a
t 09:
25 3
1 O
ctob
er 2
014
Vol. 54, No. 2, December 2009 4 SPATIAL SCIENCE
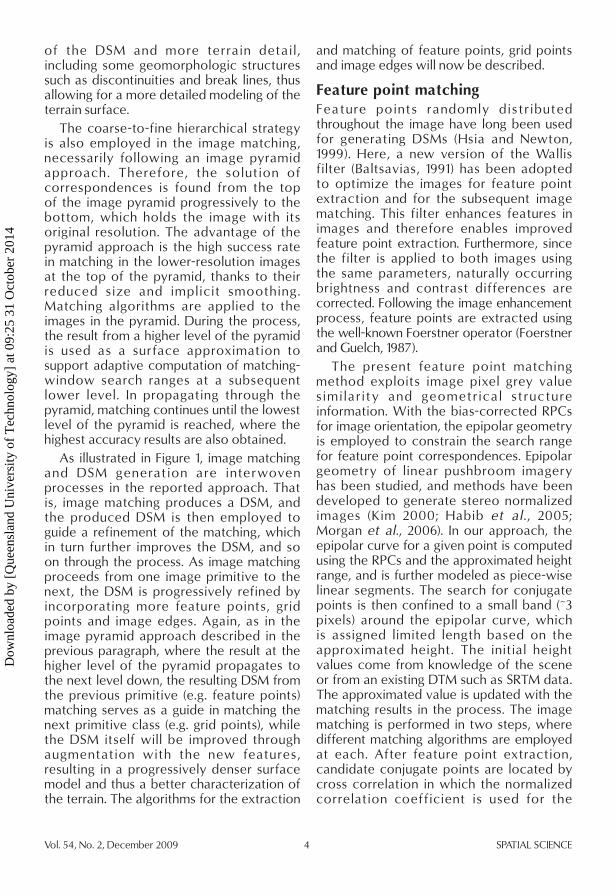
of the DSM and more terrain detail, including some geomorphologic structures such as discontinuities and break lines, thus allowing for a more detailed modeling of the terrain surface.
The coarse-to-fine hierarchical strategy is also employed in the image matching, necessarily following an image pyramid approach . Therefore, the solution of correspondences is found from the top of the image pyramid progressively to the bottom, which holds the image with its original resolution. The advantage of the pyramid approach is the high success rate in matching in the lower-resolution images at the top of the pyramid, thanks to their reduced size and implicit smoothing. Matching algorithms are applied to the images in the pyramid. During the process, the result from a higher level of the pyramid is used as a surface approximation to support adaptive computation of matching-window search ranges at a subsequent lower level. In propagating through the pyramid, matching continues until the lowest level of the pyramid is reached, where the highest accuracy results are also obtained.
As illustrated in Figure 1, image matching and DSM generation are interwoven processes in the reported approach. That is, image matching produces a DSM, and the produced DSM is then employed to guide a refinement of the matching, which in turn further improves the DSM, and so on through the process. As image matching proceeds from one image primitive to the next, the DSM is progressively refined by incorporating more feature points, grid points and image edges. Again, as in the image pyramid approach described in the previous paragraph, where the result at the higher level of the pyramid propagates to the next level down, the resulting DSM from the previous primitive (e.g. feature points) matching serves as a guide in matching the next primitive class (e.g. grid points), while the DSM itself will be improved through augmentation with the new features, resulting in a progressively denser surface model and thus a better characterization of the terrain. The algorithms for the extraction
and matching of feature points, grid points and image edges will now be described.
Feature point matchingFeature points randomly distr ibuted throughout the image have long been used for generating DSMs (Hsia and Newton, 1999). Here, a new version of the Wallis filter (Baltsavias, 1991) has been adopted to optimize the images for feature point extraction and for the subsequent image matching. This filter enhances features in images and therefore enables improved feature point extraction. Furthermore, since the filter is applied to both images using the same parameters, naturally occurring brightness and contrast differences are corrected. Following the image enhancement process, feature points are extracted using the well-known Foerstner operator (Foerstner and Guelch, 1987).
The present feature point matching method exploits image pixel grey value simi lar ity and geometrical structu re information. With the bias-corrected RPCs for image orientation, the epipolar geometry is employed to constrain the search range for feature point correspondences. Epipolar geometry of linear pushbroom imagery has been studied, and methods have been developed to generate stereo normalized images (Kim 2000; Habib et al ., 2005; Morgan et al., 2006). In our approach, the epipolar curve for a given point is computed using the RPCs and the approximated height range, and is further modeled as piece-wise linear segments. The search for conjugate points is then confined to a small band (~3 pixels) around the epipolar curve, which is assigned limited length based on the approximated height. The initial height values come from knowledge of the scene or from an existing DTM such as SRTM data. The approximated value is updated with the matching results in the process. The image matching is performed in two steps, where different matching algorithms are employed at each. After feature point extraction, candidate conjugate points are located by cross correlation in which the normalized correlation coefficient is used for the
Dow
nloa
ded
by [
Que
ensl
and
Uni
vers
ity o
f T
echn
olog
y] a
t 09:
25 3
1 O
ctob
er 2
014
SPATIAL SCIENCE 5 Vol. 54, No. 2, December 2009
similarity measure. The correlation results are then employed as prior information in the next step, namely a structural matching in which probability relaxation is used to achieve neighbourhood consistency.
Th e n or mal ized cross-cor re lat io n coefficient is applied to quantify the similarity of the candidate matching points. This measure has been shown to be largely independent of differences in brightness and contrast due to normalization with respect to the mean and standard deviation (Zhang et al., 2007). Although the correlation coefficient is a good indicator of the similarity between image patches, problems still exist in determining all correct matches. Firstly, difficulties arise in deciding on a correlation coefficient threshold above which a correct match is indicated. The existence of image noise, shadows, occlusions and repeated patterns exacerbates this problem. Furthermore, matching using a very local comparison of grey value differences does not necessarily always deliver consistent results in a local neighbourhood. In order to overcome these problems, the structural matching algorithm with probabil ity relaxation proposed in Zhang and Baltsavias (2000) has been adopted.
Under the assumption that T is the mapping from the first image to the second, the probability p{ li = rj | T} (the ‘=’ sign means ‘match to’) that point li in the first image matches point rj in the second image is sought:
(5)
Rrhi
thi
tji
tji
t
jit
h
rlQrlprlQrlp
Trlp)(}{
)(}{}|{ )()(
)()()1(
where
(6)
|),;,({)(,1 1
)(n
ihh
m
kkhjiji
t rlrlTCrlQ
}{}, )(kh
tkhji rlprlrl
T h e v a l u e of Q ex p r e s s e s t h e support given to the hypothesis of a m atc h ( l i = r j ) b y n e i g h b o u r i n g points, taking into consideration the geometric and radiometric relationships between them. },|),;,({ khjikhi rlrlrlrlTC j is
a compatibility function, quantifying the compatibility between the match (li = rj) and a neighbouring match (lh = rk). For this investigation, the following compatibility function defined in Zhang and Gruen (2004) has been adopted:
(7)
)()(
)()(
)/)exp(/ 22
jkihy
jkihx
yx
yyyyp
xxxxp
kppTI
Here, k is a constant and the parameter TI is quantified using texture information. Its value is obtained from the average correlation coefficient values for the point pairs (i, j ) and (h, k). As mentioned, this definition of the compatibility function also takes into account geometric relationships.
Realization of the probability is achieved via an iterative scheme (Christmas et al., 1995; Zhang and Baltsavias, 2000; Zhang and Gruen, 2006) initialised by assigning the previously computed normalized correlation coefficient to }{)0(
ji rlp = for a potential conjugate pair li and rj. This will increase matching success while reducing computation cost and time. When the iterative procedure is terminated, the point pair that receives the highest probability is selected as the match.
Grid point matchingWhile feature points suitable for accurate and reliable matching are readily found in texture-rich regions, and correspond to points in regions with considerable grey value variation, this is not the case in image regions with poor or no texture where few or even no feature points might be detected. The image matching with only feature points will leave holes in the extracted surface model in these areas. To solve this problem, grid points have been introduced in DSM generation (Hsia and Newton, 1999; Zhang and Gruen, 2004; Baltsavias et al., 2005). These are determined at given positions, uniformly distributed over the whole image. As with feature points, the grid points are matched using cross-correlation and structural matching with epipolar constraints, following the coarse-to-fine concept. Since grid points
Dow
nloa
ded
by [
Que
ensl
and
Uni
vers
ity o
f T
echn
olog
y] a
t 09:
25 3
1 O
ctob
er 2
014
Vol. 54, No. 2, December 2009 6 SPATIAL SCIENCE
may lie in regions with poor texture, shadows or occlusions, the search for the conjugate point has a higher probability of yielding either an ambiguous match or no matching candidate. To increase the reliability of the grid point matching, the DSM generated from feature point matching is employed to further constrain the search for candidate matches. This reduces the search space and thus decreases ambiguity while expediting the matching process.
Edge matchingImage edges such as ridge lines and break lines in terrain are important features; they tend to be rich and plentiful, especially in man-made environments. Thus, 3D edges essentially characterize surface discontinuity and they constitute an important component of a DSM. In addition, edges play an important role in feature extraction, object recognition and 2D/3D reconstruction of man-made objects. The edge extraction and matching algorithms developed in Zhang and Baltsavias (2000) have been employed in the reported strategy. This method, which exploits rich edge attributes and edge geometrical structure information, was developed for automated 3D reconstruction of man-made objects from airborne and space borne images (Zhang, 2003). The edge attributes include a geometric description of the edge along with photometric information in the regions immediately adjacent to the edge. The epipolar constraint is again applied to reduce the search space. The similarity measure for an edge pair is computed by comparing the edge attributes. The similarity measure is then used as prior information in a structural matching process, which again aims at achieving locally consistent matching using probability relaxation. More details of the edge matching algorithm can be found in Zhang and Baltsavias (2000) and Zhang (2003).
Edges are extracted using the Canny operator and then formed into straight line segments. For each such segment, the position, length, orientation and robust photometric statistics in the left and right flanking regions are computed. The
photometric properties include the intensity median and the scatter matrix. The epipolar constraint and the DSM from the previous point matching are employed to reduce the search space, with two end points of an edge segment in one image generating two epipolar lines in the other image. Approximate height information derived from the feature- and grid-point matching can be used to define an epipolar band of limited length. Any edge included in this band (even partially) is a possible candidate. The comparison with each candidate edge is then made only in the common overlap length, i.e. length differences and shifts between edge segments are ignored. For each pair of edges that satisfy the epipolar constraints above, their rich attributes are used to compute a similarity score. Therefore, the similarity score is a weighted combination of various criteria.
Since matching using a local comparison of edge attributes does not always deliver correct results, a structural matching using probability relaxation, similar to that in point matching, is conducted. The method seeks the probability that an edge in one image matches an edge in the other, using the geometric and photometric information of neighboring image edges. By this means, correspondences of both individual edges and edge structures are found. As in point matching, the computed edge similarity scores are used as prior information in structural matching. The compatibility function is evaluated using the differences between the relational measurements of two edge pairs in the stereo images. For further details of the definition of relational measurements and evaluation of the compatibility function, the reader is referred to Zhang and Baltsavias (2000) and Zhang
(2003).
EXPERIMENTAL TESTING AND DISCUSSION
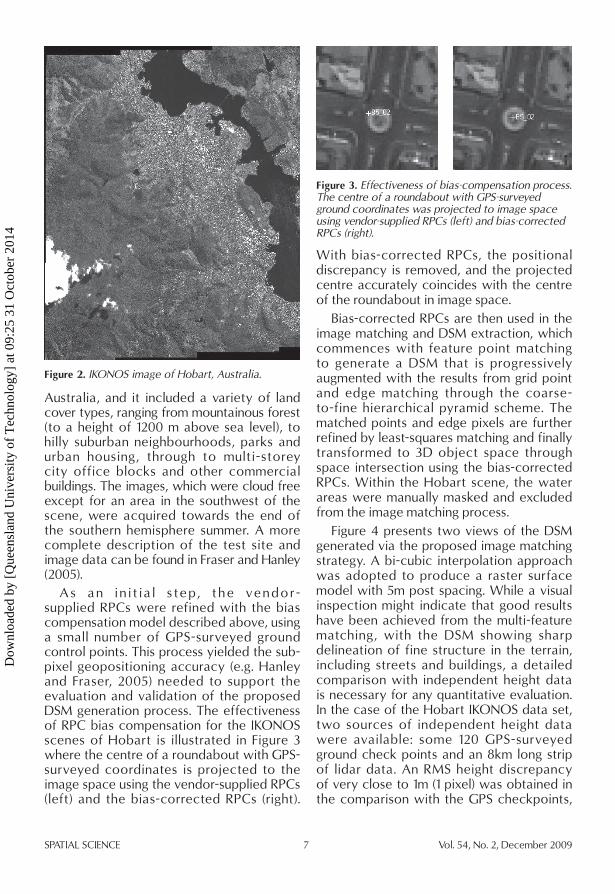
In order to experimentally test and evaluate the developed approach to DSM generation, it was applied to a stereo pair of IKONOS Geo images. The test site, shown in Figure 2, covered a 120 km2 area centred on Hobart,
Dow
nloa
ded
by [
Que
ensl
and
Uni
vers
ity o
f T
echn
olog
y] a
t 09:
25 3
1 O
ctob
er 2
014
SPATIAL SCIENCE 7 Vol. 54, No. 2, December 2009
Australia, and it included a variety of land cover types, ranging from mountainous forest (to a height of 1200 m above sea level), to hilly suburban neighbourhoods, parks and urban housing, through to multi-storey city office blocks and other commercial buildings. The images, which were cloud free except for an area in the southwest of the scene, were acquired towards the end of the southern hemisphere summer. A more complete description of the test site and image data can be found in Fraser and Hanley (2005).
A s a n i n i t i a l s te p, t h e ve n d o r-supplied RPCs were refined with the bias compensation model described above, using a small number of GPS-surveyed ground control points. This process yielded the sub-pixel geopositioning accuracy (e.g. Hanley and Fraser, 2005) needed to support the evaluation and validation of the proposed DSM generation process. The effectiveness of RPC bias compensation for the IKONOS scenes of Hobart is illustrated in Figure 3 where the centre of a roundabout with GPS-surveyed coordinates is projected to the image space using the vendor-supplied RPCs (left) and the bias-corrected RPCs (right).
With bias-corrected RPCs, the positional discrepancy is removed, and the projected centre accurately coincides with the centre of the roundabout in image space.
Bias-corrected RPCs are then used in the image matching and DSM extraction, which commences with feature point matching to generate a DSM that is progressively augmented with the results from grid point and edge matching through the coarse-to-fine hierarchical pyramid scheme. The matched points and edge pixels are further refined by least-squares matching and finally transformed to 3D object space through space intersection using the bias-corrected RPCs. Within the Hobart scene, the water areas were manually masked and excluded from the image matching process.
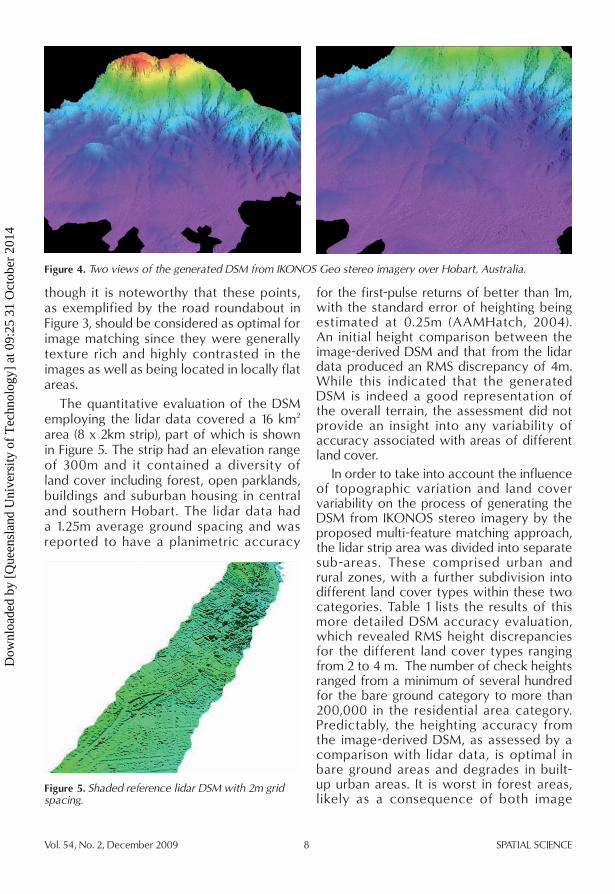
Figure 4 presents two views of the DSM generated via the proposed image matching strategy. A bi-cubic interpolation approach was adopted to produce a raster surface model with 5m post spacing. While a visual inspection might indicate that good results have been achieved from the multi-feature matching, with the DSM showing sharp delineation of fine structure in the terrain, including streets and buildings, a detailed comparison with independent height data is necessary for any quantitative evaluation. In the case of the Hobart IKONOS data set, two sources of independent height data were available: some 120 GPS-surveyed ground check points and an 8km long strip of lidar data. An RMS height discrepancy of very close to 1m (1 pixel) was obtained in the comparison with the GPS checkpoints,
Figure 2. IKONOS image of Hobart, Australia.
Figure 3. Effectiveness of bias-compensation process. The centre of a roundabout with GPS-surveyed ground coordinates was projected to image space using vendor-supplied RPCs (left) and bias-corrected RPCs (right).
Dow
nloa
ded
by [
Que
ensl
and
Uni
vers
ity o
f T
echn
olog
y] a
t 09:
25 3
1 O
ctob
er 2
014
Vol. 54, No. 2, December 2009 8 SPATIAL SCIENCE
though it is noteworthy that these points, as exemplified by the road roundabout in Figure 3, should be considered as optimal for image matching since they were generally texture rich and highly contrasted in the images as well as being located in locally flat areas.
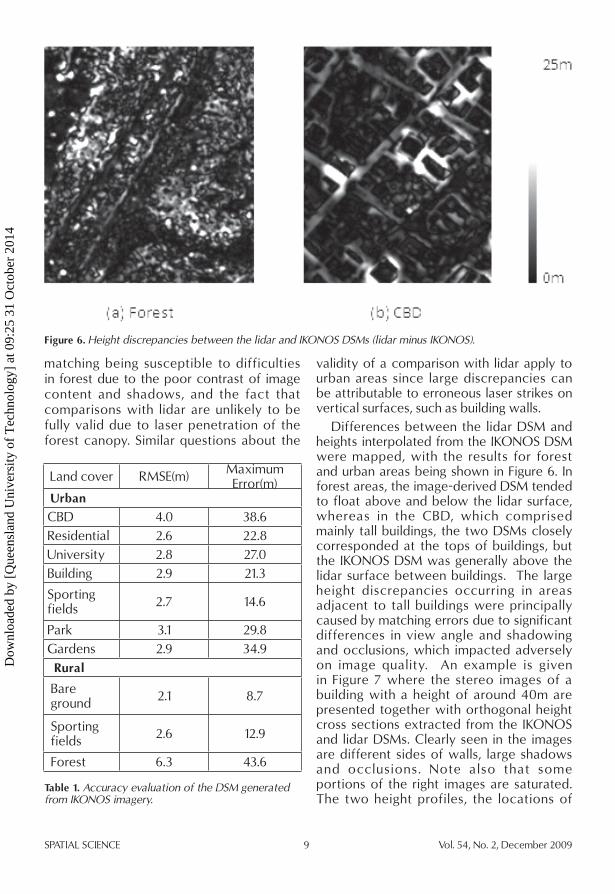
The quantitative evaluation of the DSM employing the lidar data covered a 16 km2 area (8 x 2km strip), part of which is shown in Figure 5. The strip had an elevation range of 300m and it contained a diversity of land cover including forest, open parklands, buildings and suburban housing in central and southern Hobart. The lidar data had a 1.25m average ground spacing and was reported to have a planimetric accuracy
for the first-pulse returns of better than 1m, with the standard error of heighting being estimated at 0.25m (AAMHatch, 2004). An initial height comparison between the image-derived DSM and that from the lidar data produced an RMS discrepancy of 4m. While this indicated that the generated DSM is indeed a good representation of the overall terrain, the assessment did not provide an insight into any variability of accuracy associated with areas of different land cover.
In order to take into account the influence of topographic variation and land cover variability on the process of generating the DSM from IKONOS stereo imagery by the proposed multi-feature matching approach, the lidar strip area was divided into separate sub-areas. These comprised urban and rural zones, with a further subdivision into different land cover types within these two categories. Table 1 lists the results of this more detailed DSM accuracy evaluation, which revealed RMS height discrepancies for the different land cover types ranging from 2 to 4 m. The number of check heights ranged from a minimum of several hundred for the bare ground category to more than 200,000 in the residential area category. Predictably, the heighting accuracy from the image-derived DSM, as assessed by a comparison with lidar data, is optimal in bare ground areas and degrades in built-up urban areas. It is worst in forest areas, likely as a consequence of both image
Figure 4. Two views of the generated DSM from IKONOS Geo stereo imagery over Hobart, Australia.
Figure 5. Shaded reference lidar DSM with 2m grid spacing.
Dow
nloa
ded
by [
Que
ensl
and
Uni
vers
ity o
f T
echn
olog
y] a
t 09:
25 3
1 O
ctob
er 2
014
SPATIAL SCIENCE 9 Vol. 54, No. 2, December 2009
matching being susceptible to difficulties in forest due to the poor contrast of image content and shadows, and the fact that comparisons with lidar are unlikely to be fully valid due to laser penetration of the forest canopy. Similar questions about the
validity of a comparison with lidar apply to urban areas since large discrepancies can be attributable to erroneous laser strikes on vertical surfaces, such as building walls.
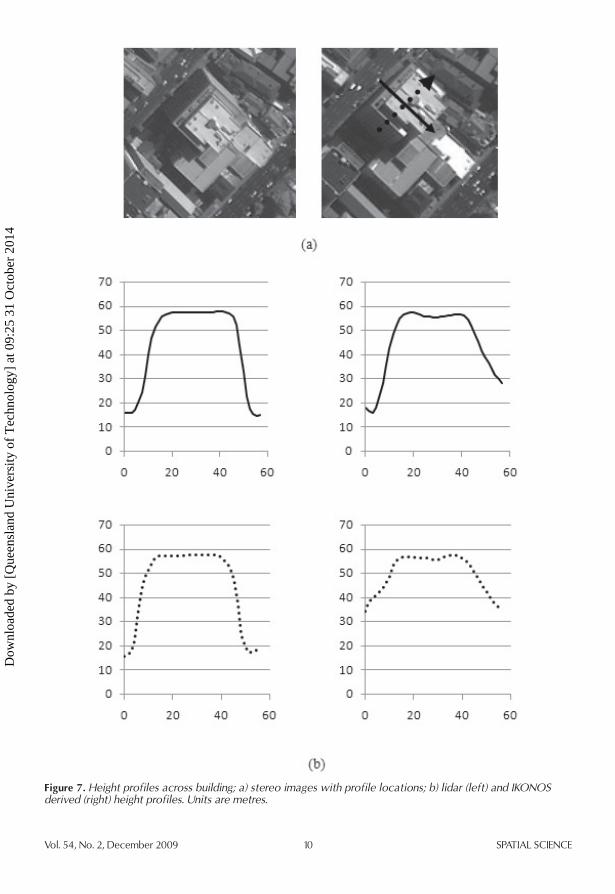
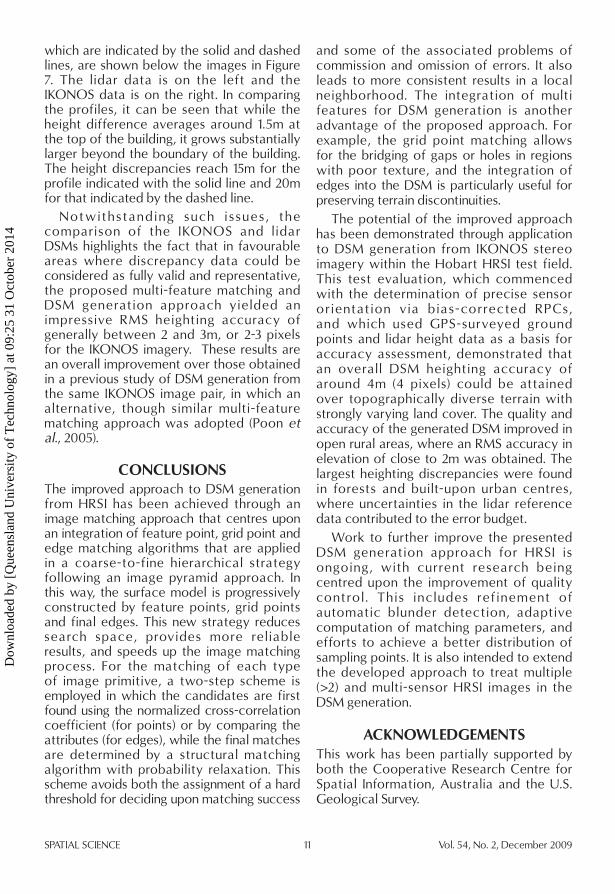
Differences between the lidar DSM and heights interpolated from the IKONOS DSM were mapped, with the results for forest and urban areas being shown in Figure 6. In forest areas, the image-derived DSM tended to float above and below the lidar surface, whereas in the CBD, which comprised mainly tall buildings, the two DSMs closely corresponded at the tops of buildings, but the IKONOS DSM was generally above the lidar surface between buildings. The large height discrepancies occurring in areas adjacent to tall buildings were principally caused by matching errors due to significant differences in view angle and shadowing and occlusions, which impacted adversely on image quality. An example is given in Figure 7 where the stereo images of a building with a height of around 40m are presented together with orthogonal height cross sections extracted from the IKONOS and lidar DSMs. Clearly seen in the images are different sides of walls, large shadows and occlusions. Note also that some portions of the right images are saturated. The two height profiles, the locations of
Figure 6. Height discrepancies between the lidar and IKONOS DSMs (lidar minus IKONOS).
Land cover RMSE(m)Maximum Error(m)
UrbanCBD 4.0 38.6
Residential 2.6 22.8
University 2.8 27.0
Building 2.9 21.3
Sporting fields
2.7 14.6
Park 3.1 29.8
Gardens 2.9 34.9
Rural
Bare ground
2.1 8.7
Sporting fields
2.6 12.9
Forest 6.3 43.6
Table 1. Accuracy evaluation of the DSM generated from IKONOS imagery.
Dow
nloa
ded
by [
Que
ensl
and
Uni
vers
ity o
f T
echn
olog
y] a
t 09:
25 3
1 O
ctob
er 2
014
Vol. 54, No. 2, December 2009 10 SPATIAL SCIENCE
Figure 7. Height profiles across building; a) stereo images with profile locations; b) lidar (left) and IKONOS derived (right) height profiles. Units are metres.
Dow
nloa
ded
by [
Que
ensl
and
Uni
vers
ity o
f T
echn
olog
y] a
t 09:
25 3
1 O
ctob
er 2
014
SPATIAL SCIENCE 11 Vol. 54, No. 2, December 2009
which are indicated by the solid and dashed lines, are shown below the images in Figure 7. The lidar data is on the left and the IKONOS data is on the right. In comparing the profiles, it can be seen that while the height difference averages around 1.5m at the top of the building, it grows substantially larger beyond the boundary of the building. The height discrepancies reach 15m for the profile indicated with the solid line and 20m for that indicated by the dashed line.
Notwith stan din g su ch i ssu es, th e comparison of the IKONOS and lidar DSMs highlights the fact that in favourable areas where discrepancy data could be considered as fully valid and representative, the proposed multi-feature matching and DSM generation approach yielded an impressive RMS heighting accuracy of generally between 2 and 3m, or 2-3 pixels for the IKONOS imagery. These results are an overall improvement over those obtained in a previous study of DSM generation from the same IKONOS image pair, in which an alternative, though similar multi-feature matching approach was adopted (Poon et al., 2005).
CONCLUSIONSThe improved approach to DSM generation from HRSI has been achieved through an image matching approach that centres upon an integration of feature point, grid point and edge matching algorithms that are applied in a coarse-to-fine hierarchical strategy following an image pyramid approach. In this way, the surface model is progressively constructed by feature points, grid points and final edges. This new strategy reduces search space, provides more reliable results, and speeds up the image matching process. For the matching of each type of image primitive, a two-step scheme is employed in which the candidates are first found using the normalized cross-correlation coefficient (for points) or by comparing the attributes (for edges), while the final matches are determined by a structural matching algorithm with probability relaxation. This scheme avoids both the assignment of a hard threshold for deciding upon matching success
and some of the associated problems of commission and omission of errors. It also leads to more consistent results in a local neighborhood. The integration of multi features for DSM generation is another advantage of the proposed approach. For example, the grid point matching allows for the bridging of gaps or holes in regions with poor texture, and the integration of edges into the DSM is particularly useful for preserving terrain discontinuities.
The potential of the improved approach has been demonstrated through application to DSM generation from IKONOS stereo imagery within the Hobart HRSI test field. This test evaluation, which commenced with the determination of precise sensor orientation via bias-corrected RPCs, and which used GPS-surveyed ground points and lidar height data as a basis for accuracy assessment, demonstrated that an overall DSM heighting accuracy of around 4m (4 pixels) could be attained over topographically diverse terrain with strongly varying land cover. The quality and accuracy of the generated DSM improved in open rural areas, where an RMS accuracy in elevation of close to 2m was obtained. The largest heighting discrepancies were found in forests and built-upon urban centres, where uncertainties in the lidar reference data contributed to the error budget.
Work to further improve the presented DSM generation approach for HRSI is ongoing, with current research being centred upon the improvement of quality control . This includes refinement of automatic blunder detection, adaptive computation of matching parameters, and efforts to achieve a better distribution of sampling points. It is also intended to extend the developed approach to treat multiple (>2) and multi-sensor HRSI images in the DSM generation.
ACKNOWLEDGEMENTSThis work has been partially supported by both the Cooperative Research Centre for Spatial Information, Australia and the U.S. Geological Survey.
Dow
nloa
ded
by [
Que
ensl
and
Uni
vers
ity o
f T
echn
olog
y] a
t 09:
25 3
1 O
ctob
er 2
014
Vol. 54, No. 2, December 2009 12 SPATIAL SCIENCE
REFERENCESA A M H a t c h , ( 2 0 0 4 ) D i g i t a l D a t a :
Documentation, Vol. 21004603NOM. AAMHatch Pty Ltd, Australia. p18.
Ba l t sav ias , E . P. ( 199 1 ) Mu l t iphoto geometrically constrained matching. PhD Disserta tion, Report No. 49, Institute of Geodesy and Photogrammetry, ETH Zurich, Swit zerland, 221 pages.
Baltsavias, E. P., Zhang, L. and Eisenbeiss, H . ( 2 0 0 5 ) D S M g e n e r a t i o n a n d interior orientation determination of IKONOS images using a testfiled in Switzerland. International Archives of Photogrammetry, Remote Sensing and Spatial Information Sciences, 36 (Part I/W3), 9 pages, CDROM.
Büyüksalih, G., and Jacobsen, K. (2008) DSM generation with high resolution space imagery over mounta inous forest area. International Archives of Photogrammetry, Remote Sensing and Spatial Information Science, 37(B1):865-871.
Christmas, W., Kittler, J. and Petrou, M. (1995) Structural matching in computer vision using probabilistic relaxation. IEEE Transactions on Pattern Analysis and Machine Intelligence, 17 (8): 749-764.
Dial, G., and Grodecki, J. (2002) Block adjustment with rational polynomial camera models. Proc. of ASPRS Annual Conference, Washington, DC, 22-26 May, CDROM.
Förstner, W. and Gülch, E. (1987) A fast operator for detection and precise location of distinct points, corners and centres of circular features. Proceedings of the ISPRS Conference on Fast Processing of Photogrammetric Data, Interlaken. Switzerland, pp. 281-305.
Fraser, C., and Hanley, H. B. (2003) Bias Compensation in rational functions fo r I KO N O S s a t e l l i t e i m a g e r y. Photogrammetry Engineering and Remote Sensing, 69(1):53-57.
Fraser, C., and Hanley, H.B. (2005) Bias compensated RPCs for sensor orientation of high-resolution satellite imagery.
Photogrammetric Engineering and Remote Sensing, 71(8):909-915.
Fraser, C.S., Dial, G. and Grodecki, J. (2006) Sensor orientation via RPCs. ISPRS journal of Photogrammetry and Remote Sensing, 60(3):182-194.
Grodecki, J., and Dial, G. (2003) Block adjustment of high-resolution satellite images described by rational polynomials. Photogrammetry Engineering and Remote Sensing, 69(1): 59-68.
Habib, A.F., Morgan, M., Jeong, S., Kim, K. (2005) Analysis of epipolar geometry i n l i n e a r a r r a y s c a n n e r s c e n e s . Photogrammetric Record, 20(109), 27-47.Hsia, J-S., and Newton, I. (1999) A method for the automated production of digital terrain models using a combination of feature points, grid points, and filling back points. Photogrammetric Engineering and Remote Sensing, 65(6): 713-719.
Jacobsen, K. (2003) Geometric potential of IKONOS and QuickBird images. In D. Fritsch (Ed.) Photogrammetric Week ‘03, pp. 101-110.
Kim, T. (2000) A study on the epipolarity o f l i n e a r p u s h b r o o m i m a g e s . Photogrammetric Engineering and and Remote Sensing, 66(8), 961-966.
Krauss, T., Reinartz, P., Lehner, M., Schroeder, M. and Stilla, U. (2005) DEM generation from very high resolution stereo satellite data in urban areas using dynamic programming. ISPRS Hanover Workshop 2005 on “High-Resolution Earth Imaging for Geospatial Information”, Hanover, 17-20 May, CDROM.
Morgan, M., Kim, K., Jeong, S., Habib, A. (2006) Epipolar resampling of space-borne linear array scanner scenes using parallel projection. Photogrammetric Engineering and and Remote Sensing, 72(11), 1225-1263.
Poon, J., Fraser, C.S., Zhang, C., Zhang, L. and Gruen, A. (2005) Quality assessment of digital surface models generated from IKONOS imagery. Photogrammetric Record, 20(110): 162-171.
Poon, J., Fraser, C.S. and Zhang, C. (2007) Digital surface models from high resolution
Dow
nloa
ded
by [
Que
ensl
and
Uni
vers
ity o
f T
echn
olog
y] a
t 09:
25 3
1 O
ctob
er 2
014
SPATIAL SCIENCE 13 Vol. 54, No. 2, December 2009
satell ite imagery. Photogrammetric Engineering and Remote Sensing, 73(11): 1225-1231.
Sohn, H., Park, C. and Chang, H. (2005) Rational function model-based image matching for digital elevation models. Photogrammetric Record, 20(112):366-383.
Toutin, T. (2004) Comparison of stereo-extracted DTM from different high-resolution sensors: SPOT-5, EROS-A, IKONOS-II, and QuickBird. IEEE Trans. on Geoscience and Remote Sens., 42(10): 2121-2129.
Zhang, C. and Baltsavias, E. P. (2000) Knowledge-based image ana lys i s for 3-D edge extraction and road reconstruction. International Archives of the Photogrammetry, Remote Sensing and Spatial Information Sciences, 33(B3/1): 1008-1015.
Zhang, C. (2003) Towards an operational system for automated updating of road databases by integrat ion of imagery and geodata. ISPRS Journal of Photogrammetry and Remote Sensing, 58(3/4), 166-186.
Zhang, C., Baltsavias, E. P. and Sullivan, L. (2005) Performance evaluation of ATOMI system for road database updating from aerial film, ADS40, IKONOS and Quickbird orthoimagery. International Archives of Photogrammetry and Remote Sensing, 36(3/W24):165-170.
Zhang, C., Crane, M.P. and Fraser, C.S. (2007) Terrain deformation modeling by photogrammetric exploitation of high-resolution satellite imagery. Proceeding of ASPRS Annual Conference, May 7-11, Tampa, Florida, CDROM.
Zhang, L. and Gruen, A. (2004) Automatic DSM generation from linear array imagery data. International Archives of the Photogrammetry, Remote Sensing and Spatial Information Sciences, 35(B3): 128-133.
Zhang, L. and Gruen, A. (2006) Multi-image matching for DSM generation from IKONOS imagery. ISPRS Journal of Photogrammetry and Remote Sensing, 60(3), 195-211.
Dow
nloa
ded
by [
Que
ensl
and
Uni
vers
ity o
f T
echn
olog
y] a
t 09:
25 3
1 O
ctob
er 2
014