an h2s-tolerant ni-gdc anode with a gdc barrier layer
TRANSCRIPT
Journal of The Electrochemical Society, 158 (11) B1405-B1416 (2011) B14050013-4651/2011/158(11)/B1405/12/$28.00 © The Electrochemical Society
An H2S-Tolerant Ni-GDC Anode with a GDC Barrier LayerChunchuan Xu,a,z Phil Gansor,b John W. Zondlo,a Katarzyna Sabolsky,b andEdward M. Sabolskyb
aDepartment of Chemical Engineering, and bDepartment of Mechanical & Aerospace Engineering,West Virginia University, Morgantown, West Virginia 26506 USA
The solid oxide fuel cell (SOFC) can operate effectively on a variety of fuels, such as coal-syngas and hydrogen. A Ni-based cermetis a cost-effective anode material for these fuels; however, H2S in the fuel can degrade cell performance by poisoning the Ni-basedanode. In this research, nickel- gadolinium doped ceria (Ni-GDC) hybrid anodes were exposed to synthesized coal-syngas and H2fuels with various concentrations of H2S at 800◦C under constant current conditions. Some SOFC prototypes contained a ∼5 μmthick GDC barrier layer inserted between the Ni-GDC hybrid anode and the YSZ electrolyte. A reference electrode was incorporatedin the cell to monitor changes in the anode and cathode polarization resistances. The tests showed that the cells with a GDC barrierlayer were resistant to H2S at levels up to 1000 ppm in wet H2 and 100 ppm in syngas during long-term tests. Cells without thebarrier layer had a significantly lower tolerance for the H2S impurity. This result, along with post-mortem analyses of the poisonedanode, lead to the hypothesis that the GDC barrier layer assists in the prevention of nickel oxidation at the anode/electrolyte interfaceby acting as an oxidation catalyst for the H2S.© 2011 The Electrochemical Society. [DOI: 10.1149/2.067111jes] All rights reserved.
Manuscript submitted July 6, 2011; revised manuscript received August 17, 2011. Published October 5, 2011.
Coal-derived syngas is a potential fuel source for the SOFC. How-ever, the presence of volatile contamination containing H2S, PH3,HCl, AsH3, Sb, and Hg species in warm syngas can cause degradationof the SOFC performance.1 Sulfur is one of the most abundant im-purities in coal and most of the sulfur appears as H2S in the gasifiedsyngas. The concentration could range from 0.1 to 1.6% by volumeH2S in raw coal syngas derived from typical gasification systems.2,3
Although commercial desulfurization techniques, such as adsorptionand wet absorption at ambient temperature, could remove H2S downto 1 ppm, a level which may not lead to SOFC degradation, the hotsyngas from the gasifier has to be cooled, thereby reducing the overallthermal efficiency of the system. Some transition metal oxide desulfu-rization sorbents, such as Cu2O, ZnO, NiO, CoO andMnO, have beenreported to yield as high as 99% H2S removal efficiency at tempera-tures over 600◦C.3 However, the warm gas cleanup technique wouldleave some level of H2S in the syngas, possibily down to levels of50 ppm.4 Therefore, developing H2S resistance in the Ni-based anodeis still a meaningful target for a highly efficient SOFC energy systemfueled by coal-derived syngas.The poisoning mechanisms of H2S on the Ni-based anode have
been discussed and reported in literature. There are two steps of H2Spoisoning on Ni-based anodes that have been identified; the first stepis an initial rapid degradation which is reversible, followed by a slownonstop degradation step which is irreversible. The initial H2S poison-ing mechanism is attributed to the adsorption of sulfur on the nickelwhich blocks the hydrogen reaction sites.5–7 For the second degrada-tion step, there has been a discrepancy in the literature. Dong et al.reported that this degradation results from a chemical reaction whichforms nickel sulfide and leads to the complete loss of Ni catalysisunder typical SOFC operating conditions. Sasaki et al. proposed thatthe second degradation step is associated with the oxidation of theNi electrode catalysts. Thus, the goal of producing an H2S-tolerantNi-based anode is to minimize the initial step of cell degradation andprevent the cell from undergoing the subsequent irreversible degra-dation. The addition of ceria to a Ni-based anode has shown someH2S resistance over that of the pure Ni-YSZ anode under conven-tional SOFC operation conditions.8,9 For example, Trembly reporteda Ni-GDC anode cell exposed to 200–240 ppm H2S in syngas suf-fered 10–12% degradation for a 570 h test.10 The H2S tolerance ofthe Ni-GDC anode used in this case was not optimized by alteringeither the anode architecture or the GDC concentration. Changes ofthe GDC concentration and architecture of the cell anode may affect
z E-mail address: [email protected]
the overall cell resistance, and the anode stability and the cell’s tol-erance of H2S in the fuel. In the present work, different architecturesof the Ni-GDC anode have been tested for times up to 400 h withfuel containing 100 ppm in syngas. According to the test results, theH2S poisoning mechanisms on the Ni-based SOFC and the H2S tol-erance afforded by the GDC barrier layer have been illustrated anddiscussed.
Experimental
Cell fabrication.— Button cells were fabricated by first taking8-YSZ powder (Daiichi KigensoKagakuKagyoCo. LTD) and prepar-ing the electrolyte using standard tape-casting methods. The resul-tant tapes were then cut and sintered to 1450◦C for 2 hours. A5 μm-thick GDC barrier layers made of 10% and 20% gadolinium-doped ceria, hydrothermally synthesized as Gd0.1Ce0.9O2 (GDC-10)and Gd0.2Ce0.8O2 (GDC-20), were screen printed onto both sides andsintered at 1400◦C for 2 hours for optimal density. A 10-μm thickactive anode layer comprised of a 50/50 wt. % mixture of Ni/GDCwas printed and oven-dried. This was followed by a 40 μm thick70/30 wt % Ni/GDC layer. This bi-layered anode was then firedat 1250◦C for 2 hours for proper adhesion. Lastly, a 10 μm thickLSM/GDC active cathode layer was printed and dried before adding a40 μm thick LSM current collector layer. This cathode assembly wassintered at 1100◦C for 2 hours.
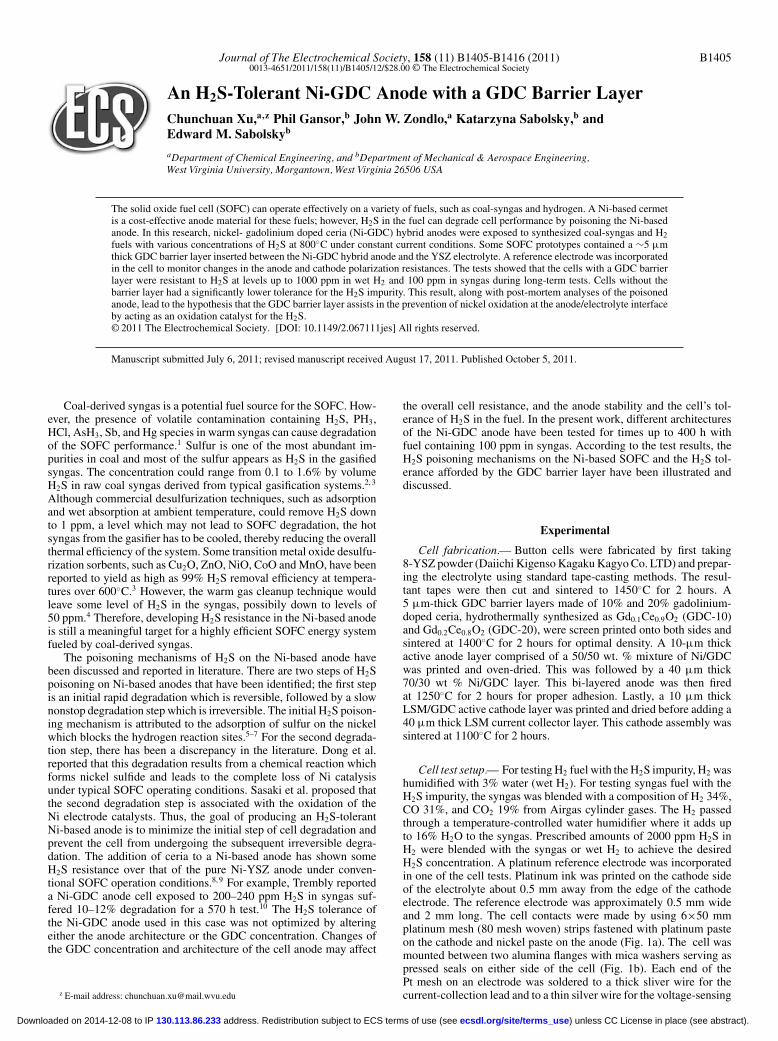
Cell test setup.— For testingH2 fuel with the H2S impurity, H2 washumidified with 3% water (wet H2). For testing syngas fuel with theH2S impurity, the syngas was blended with a composition of H2 34%,CO 31%, and CO2 19% from Airgas cylinder gases. The H2 passedthrough a temperature-controlled water humidifier where it adds upto 16% H2O to the syngas. Prescribed amounts of 2000 ppm H2S inH2 were blended with the syngas or wet H2 to achieve the desiredH2S concentration. A platinum reference electrode was incorporatedin one of the cell tests. Platinum ink was printed on the cathode sideof the electrolyte about 0.5 mm away from the edge of the cathodeelectrode. The reference electrode was approximately 0.5 mm wideand 2 mm long. The cell contacts were made by using 6×50 mmplatinum mesh (80 mesh woven) strips fastened with platinum pasteon the cathode and nickel paste on the anode (Fig. 1a). The cell wasmounted between two alumina flanges with mica washers serving aspressed seals on either side of the cell (Fig. 1b). Each end of thePt mesh on an electrode was soldered to a thick sliver wire for thecurrent-collection lead and to a thin silver wire for the voltage-sensing
) unless CC License in place (see abstract). ecsdl.org/site/terms_use address. Redistribution subject to ECS terms of use (see 130.113.86.233Downloaded on 2014-12-08 to IP
B1406 Journal of The Electrochemical Society, 158 (11) B1405-B1416 (2011)
Figure 1. (a) The cell contact configuration and (b) the cell testing setup diagram.
lead. A thin gold wire was contactedwith gold paste to the Pt referenceelectrode pad at the edge of the electrolyte.At start-up, the cell was heated to 800◦C at a heating rate of 2◦C per
minute while flowing 50 standard cubic centimeter per minute (sccm)N2 on the anode and air on the cathode. After the cell temperaturereached 800◦C, the flow to the cell anode was shifted to 10% H2 in N2for 1 h, then 50%H2 andN2 for another 2 h. A constant current densityof 200 mA cm−2 was loaded on the reduced cell with a flow of either100 sccm wet H2 or 150 sccm syngas (H2 34%, CO 31%, CO2 19%and H2O 16%) to the anode and 200 sccm air flow to the cathode.After the cell voltage stabilized for 24–100 h, the cell polarizationcurve (V-I curve) and electrochemical impedance spectrum (EIS)weretaken as a record of the baseline cell performance. The EIS wascollected using a Solartron SI-1287 electrochemical interface and anSI-1252 frequency response analyzer with an AC amplitude of 10 mAat frequencies ranging from 200 kHz to 0.05 Hz. The constant DCcurrent load was supplied by a solid-state load cell (TDI TransistorDevices SD-1103). H2S was added to the syngas fuel immediatelyupstream of the furnace. The fuel transport tubes were heat-tracedto over 120◦C to prevent H2O condensation. After testing, the cellwas cooled to room temperature while purging 20% H2 in N2 to theanode.The microstructure and chemical composition of the cell anode
were examined with a Hitachi S-4700 SEM / EDS. To determine thecomposition of the anode, an XPS (PHI 5000 VerasProbe XPSMicro-probe)with amonochromaticAlK-alpha radiation source (8.34118Å)was employed.Depth profilingwas performed over an area of 1×1mmbymeans of 2 keVArgon ion sputtering. High-resolution XPS spectrawere subsequently obtained by using a focusing X-ray monochroma-tor with a 100 μm spot size. The sputtering rate was determined tobe 20 nm min−1 with a Ta2O5 reference layer.11 The actual sputteringrate may differ for the Ni samples studied here. Thus, it should benoted that the change in depth (nominal depth) rather than the ab-solute depth of the surface chemical trace layer was the meaningfulmetric. A MSK Instruments Inc. Cirrus (LM99) residual gas analysismass spectrometer was connected to the fuel exhaust from the SOFCto monitor the low concentration of exhaust species.
Results
Ni-GDC-10 anode with/without a GDC-10 barrier layer.— AYSZelectrolyte-supported Ni-GDC-10 anode cell with a 5μm GDC-10barrier layer (cell-1) between the YSZ electrolyte and the anode active
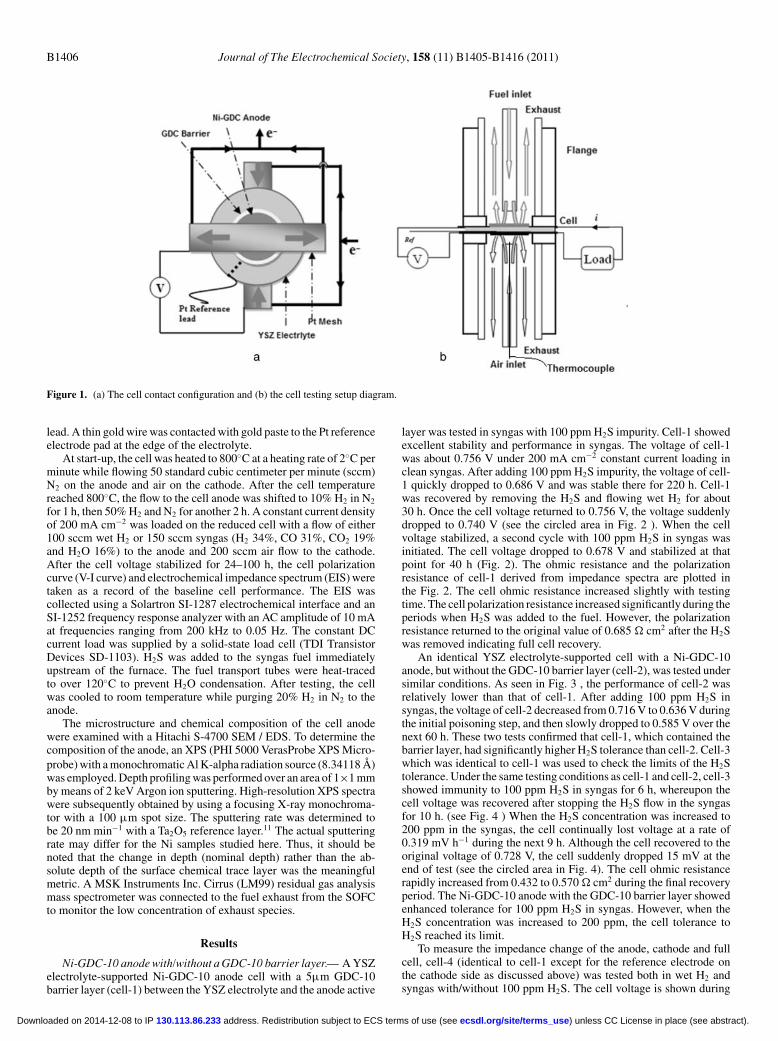
layer was tested in syngas with 100 ppm H2S impurity. Cell-1 showedexcellent stability and performance in syngas. The voltage of cell-1was about 0.756 V under 200 mA cm−2 constant current loading inclean syngas. After adding 100 ppm H2S impurity, the voltage of cell-1 quickly dropped to 0.686 V and was stable there for 220 h. Cell-1was recovered by removing the H2S and flowing wet H2 for about30 h. Once the cell voltage returned to 0.756 V, the voltage suddenlydropped to 0.740 V (see the circled area in Fig. 2 ). When the cellvoltage stabilized, a second cycle with 100 ppm H2S in syngas wasinitiated. The cell voltage dropped to 0.678 V and stabilized at thatpoint for 40 h (Fig. 2). The ohmic resistance and the polarizationresistance of cell-1 derived from impedance spectra are plotted inthe Fig. 2. The cell ohmic resistance increased slightly with testingtime. The cell polarization resistance increased significantly during theperiods when H2S was added to the fuel. However, the polarizationresistance returned to the original value of 0.685 � cm2 after the H2Swas removed indicating full cell recovery.An identical YSZ electrolyte-supported cell with a Ni-GDC-10
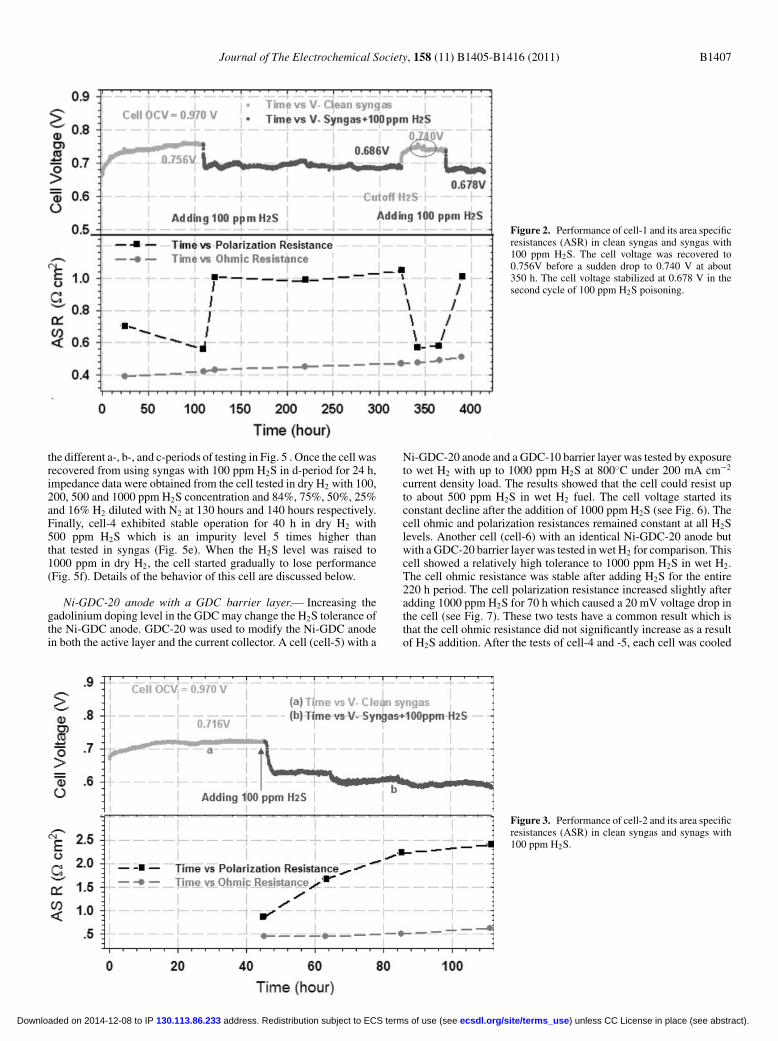
anode, but without the GDC-10 barrier layer (cell-2), was tested undersimilar conditions. As seen in Fig. 3 , the performance of cell-2 wasrelatively lower than that of cell-1. After adding 100 ppm H2S insyngas, the voltage of cell-2 decreased from 0.716V to 0.636V duringthe initial poisoning step, and then slowly dropped to 0.585 V over thenext 60 h. These two tests confirmed that cell-1, which contained thebarrier layer, had significantly higher H2S tolerance than cell-2. Cell-3which was identical to cell-1 was used to check the limits of the H2Stolerance. Under the same testing conditions as cell-1 and cell-2, cell-3showed immunity to 100 ppm H2S in syngas for 6 h, whereupon thecell voltage was recovered after stopping the H2S flow in the syngasfor 10 h. (see Fig. 4 ) When the H2S concentration was increased to200 ppm in the syngas, the cell continually lost voltage at a rate of0.319 mV h−1 during the next 9 h. Although the cell recovered to theoriginal voltage of 0.728 V, the cell suddenly dropped 15 mV at theend of test (see the circled area in Fig. 4). The cell ohmic resistancerapidly increased from 0.432 to 0.570� cm2 during the final recoveryperiod. The Ni-GDC-10 anode with the GDC-10 barrier layer showedenhanced tolerance for 100 ppm H2S in syngas. However, when theH2S concentration was increased to 200 ppm, the cell tolerance toH2S reached its limit.To measure the impedance change of the anode, cathode and full
cell, cell-4 (identical to cell-1 except for the reference electrode onthe cathode side as discussed above) was tested both in wet H2 andsyngas with/without 100 ppm H2S. The cell voltage is shown during
) unless CC License in place (see abstract). ecsdl.org/site/terms_use address. Redistribution subject to ECS terms of use (see 130.113.86.233Downloaded on 2014-12-08 to IP
Journal of The Electrochemical Society, 158 (11) B1405-B1416 (2011) B1407
Figure 2. Performance of cell-1 and its area specificresistances (ASR) in clean syngas and syngas with100 ppm H2S. The cell voltage was recovered to0.756V before a sudden drop to 0.740 V at about350 h. The cell voltage stabilized at 0.678 V in thesecond cycle of 100 ppm H2S poisoning.
the different a-, b-, and c-periods of testing in Fig. 5 . Once the cell wasrecovered from using syngas with 100 ppm H2S in d-period for 24 h,impedance data were obtained from the cell tested in dry H2 with 100,200, 500 and 1000 ppm H2S concentration and 84%, 75%, 50%, 25%and 16% H2 diluted with N2 at 130 hours and 140 hours respectively.Finally, cell-4 exhibited stable operation for 40 h in dry H2 with500 ppm H2S which is an impurity level 5 times higher thanthat tested in syngas (Fig. 5e). When the H2S level was raised to1000 ppm in dry H2, the cell started gradually to lose performance(Fig. 5f). Details of the behavior of this cell are discussed below.
Ni-GDC-20 anode with a GDC barrier layer.— Increasing thegadolinium doping level in the GDCmay change the H2S tolerance ofthe Ni-GDC anode. GDC-20 was used to modify the Ni-GDC anodein both the active layer and the current collector. A cell (cell-5) with a
Ni-GDC-20 anode and a GDC-10 barrier layer was tested by exposureto wet H2 with up to 1000 ppm H2S at 800◦C under 200 mA cm−2
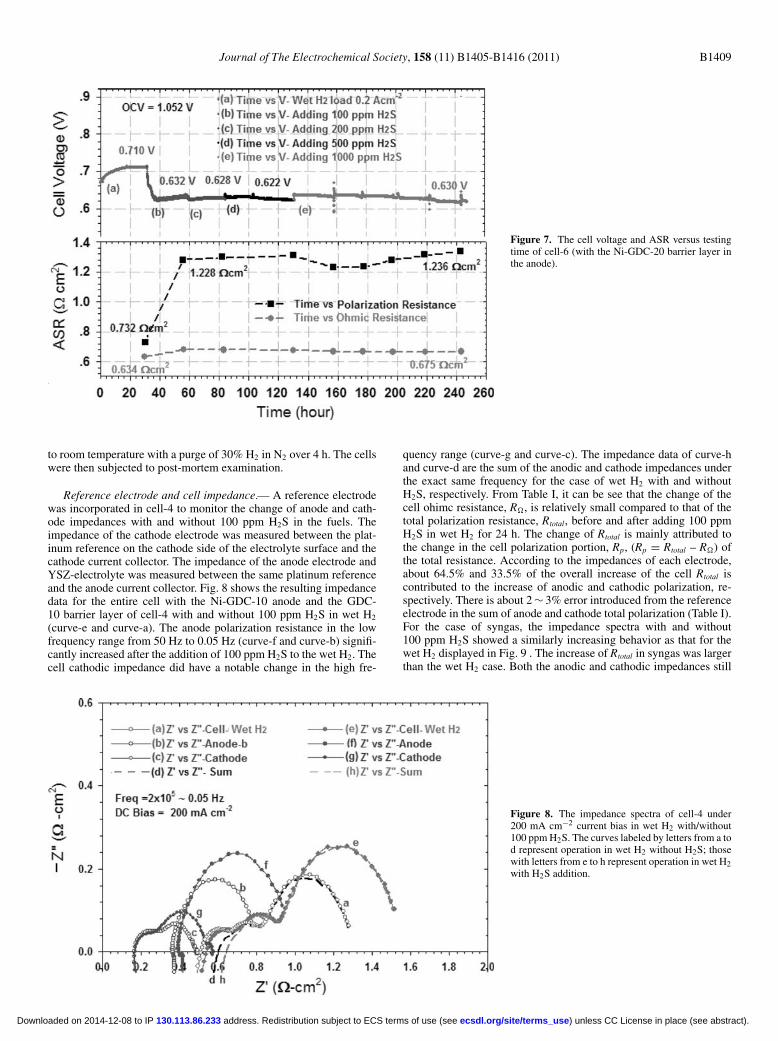
current density load. The results showed that the cell could resist upto about 500 ppm H2S in wet H2 fuel. The cell voltage started itsconstant decline after the addition of 1000 ppm H2S (see Fig. 6). Thecell ohmic and polarization resistances remained constant at all H2Slevels. Another cell (cell-6) with an identical Ni-GDC-20 anode butwith a GDC-20 barrier layer was tested in wet H2 for comparison. Thiscell showed a relatively high tolerance to 1000 ppm H2S in wet H2.The cell ohmic resistance was stable after adding H2S for the entire220 h period. The cell polarization resistance increased slightly afteradding 1000 ppm H2S for 70 h which caused a 20 mV voltage drop inthe cell (see Fig. 7). These two tests have a common result which isthat the cell ohmic resistance did not significantly increase as a resultof H2S addition. After the tests of cell-4 and -5, each cell was cooled
Figure 3. Performance of cell-2 and its area specificresistances (ASR) in clean syngas and synags with100 ppm H2S.
) unless CC License in place (see abstract). ecsdl.org/site/terms_use address. Redistribution subject to ECS terms of use (see 130.113.86.233Downloaded on 2014-12-08 to IP

B1408 Journal of The Electrochemical Society, 158 (11) B1405-B1416 (2011)
Figure 4. Performance of cell-3 and itsASR in cleansyngas and syngas with 100 ppm H2S.
Figure 5. Performance of cell-4 in (a) wet H2, (b) wetH2 + 100 ppm H2S, and (c) syngas with/without 100 ppm H2Sduring the first 100 h, then the cell was recovered in H2, and(d) H2 +N2, H2 + 200 ppm H2S,(e) H2 + 500 ppm H2S and(f) H2 + 1000 ppm H2S testing.
Figure 6. The voltage and ASR of cell-5 versus test-ing time.
) unless CC License in place (see abstract). ecsdl.org/site/terms_use address. Redistribution subject to ECS terms of use (see 130.113.86.233Downloaded on 2014-12-08 to IP
Journal of The Electrochemical Society, 158 (11) B1405-B1416 (2011) B1409
Figure 7. The cell voltage and ASR versus testingtime of cell-6 (with the Ni-GDC-20 barrier layer inthe anode).
to room temperature with a purge of 30% H2 in N2 over 4 h. The cellswere then subjected to post-mortem examination.
Reference electrode and cell impedance.— A reference electrodewas incorporated in cell-4 to monitor the change of anode and cath-ode impedances with and without 100 ppm H2S in the fuels. Theimpedance of the cathode electrode was measured between the plat-inum reference on the cathode side of the electrolyte surface and thecathode current collector. The impedance of the anode electrode andYSZ-electrolyte was measured between the same platinum referenceand the anode current collector. Fig. 8 shows the resulting impedancedata for the entire cell with the Ni-GDC-10 anode and the GDC-10 barrier layer of cell-4 with and without 100 ppm H2S in wet H2(curve-e and curve-a). The anode polarization resistance in the lowfrequency range from 50 Hz to 0.05 Hz (curve-f and curve-b) signifi-cantly increased after the addition of 100 ppm H2S to the wet H2. Thecell cathodic impedance did have a notable change in the high fre-
quency range (curve-g and curve-c). The impedance data of curve-hand curve-d are the sum of the anodic and cathode impedances underthe exact same frequency for the case of wet H2 with and withoutH2S, respectively. From Table I, it can be see that the change of thecell ohimc resistance, R�, is relatively small compared to that of thetotal polarization resistance, Rtotal, before and after adding 100 ppmH2S in wet H2 for 24 h. The change of Rtotal is mainly attributed tothe change in the cell polarization portion, Rp, (Rp = Rtotal – R�) ofthe total resistance. According to the impedances of each electrode,about 64.5% and 33.5% of the overall increase of the cell Rtotal iscontributed to the increase of anodic and cathodic polarization, re-spectively. There is about 2∼ 3% error introduced from the referenceelectrode in the sum of anode and cathode total polarization (Table I).For the case of syngas, the impedance spectra with and without100 ppm H2S showed a similarly increasing behavior as that for thewet H2 displayed in Fig. 9 . The increase of Rtotal in syngas was largerthan the wet H2 case. Both the anodic and cathodic impedances still
Figure 8. The impedance spectra of cell-4 under200 mA cm−2 current bias in wet H2 with/without100 ppmH2S. The curves labeled by letters from a tod represent operation in wet H2 without H2S; thosewith letters from e to h represent operation in wet H2with H2S addition.
) unless CC License in place (see abstract). ecsdl.org/site/terms_use address. Redistribution subject to ECS terms of use (see 130.113.86.233Downloaded on 2014-12-08 to IP
B1410 Journal of The Electrochemical Society, 158 (11) B1405-B1416 (2011)
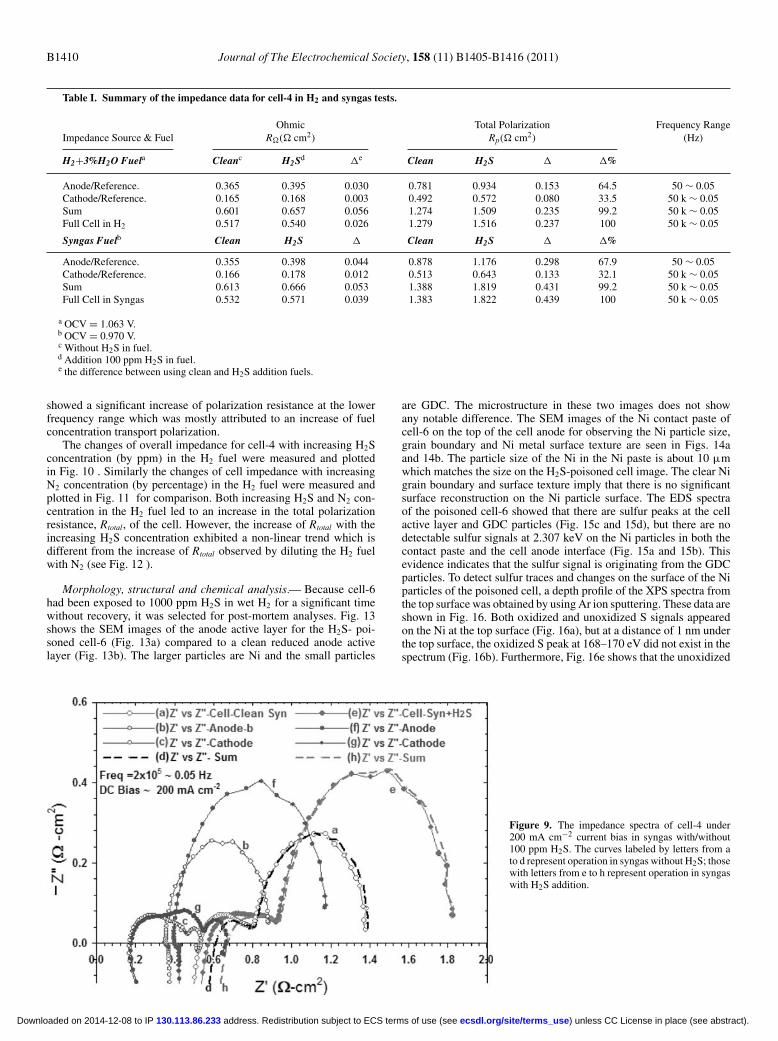
Table I. Summary of the impedance data for cell-4 in H2 and syngas tests.
Ohmic Total Polarization Frequency RangeImpedance Source & Fuel R�(� cm2) Rp(� cm2) (Hz)
H2+3%H2O Fuela Cleanc H2Sd �e Clean H2S � �%
Anode/Reference. 0.365 0.395 0.030 0.781 0.934 0.153 64.5 50 ∼ 0.05Cathode/Reference. 0.165 0.168 0.003 0.492 0.572 0.080 33.5 50 k ∼ 0.05Sum 0.601 0.657 0.056 1.274 1.509 0.235 99.2 50 k ∼ 0.05Full Cell in H2 0.517 0.540 0.026 1.279 1.516 0.237 100 50 k ∼ 0.05Syngas Fuelb Clean H2S � Clean H2S � �%
Anode/Reference. 0.355 0.398 0.044 0.878 1.176 0.298 67.9 50 ∼ 0.05Cathode/Reference. 0.166 0.178 0.012 0.513 0.643 0.133 32.1 50 k ∼ 0.05Sum 0.613 0.666 0.053 1.388 1.819 0.431 99.2 50 k ∼ 0.05Full Cell in Syngas 0.532 0.571 0.039 1.383 1.822 0.439 100 50 k ∼ 0.05a OCV = 1.063 V.b OCV = 0.970 V.c Without H2S in fuel.d Addition 100 ppm H2S in fuel.e the difference between using clean and H2S addition fuels.
showed a significant increase of polarization resistance at the lowerfrequency range which was mostly attributed to an increase of fuelconcentration transport polarization.The changes of overall impedance for cell-4 with increasing H2S
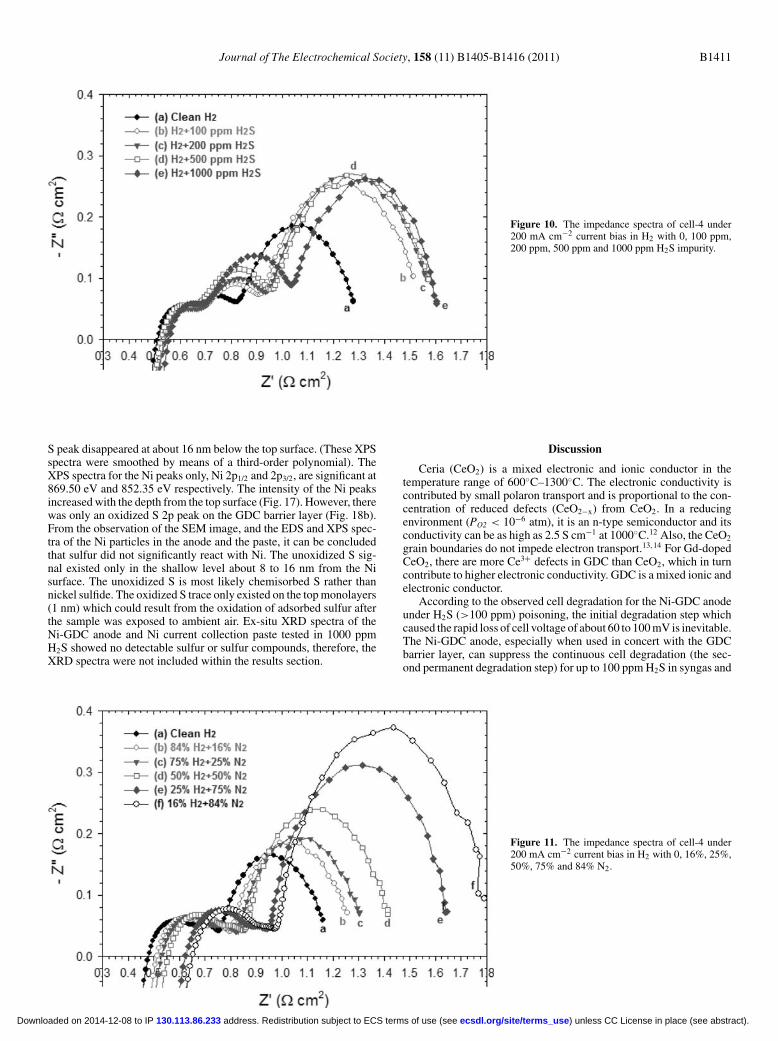
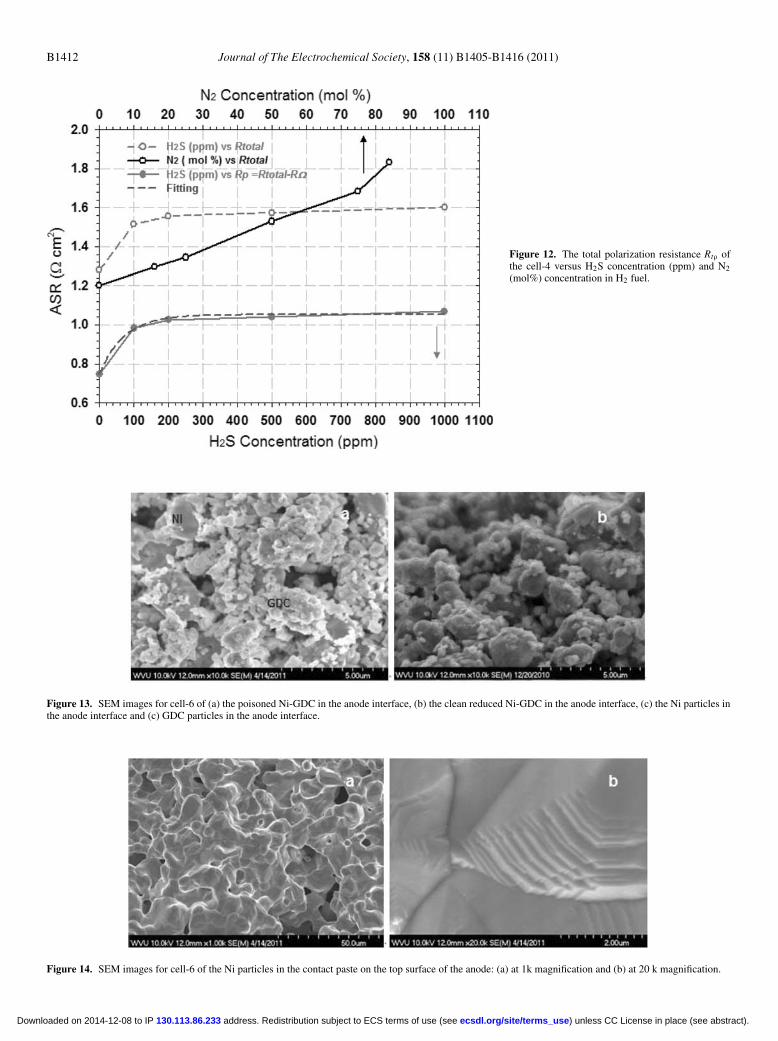
concentration (by ppm) in the H2 fuel were measured and plottedin Fig. 10 . Similarly the changes of cell impedance with increasingN2 concentration (by percentage) in the H2 fuel were measured andplotted in Fig. 11 for comparison. Both increasing H2S and N2 con-centration in the H2 fuel led to an increase in the total polarizationresistance, Rtotal, of the cell. However, the increase of Rtotal with theincreasing H2S concentration exhibited a non-linear trend which isdifferent from the increase of Rtotal observed by diluting the H2 fuelwith N2 (see Fig. 12 ).
Morphology, structural and chemical analysis.— Because cell-6had been exposed to 1000 ppm H2S in wet H2 for a significant timewithout recovery, it was selected for post-mortem analyses. Fig. 13shows the SEM images of the anode active layer for the H2S- poi-soned cell-6 (Fig. 13a) compared to a clean reduced anode activelayer (Fig. 13b). The larger particles are Ni and the small particles
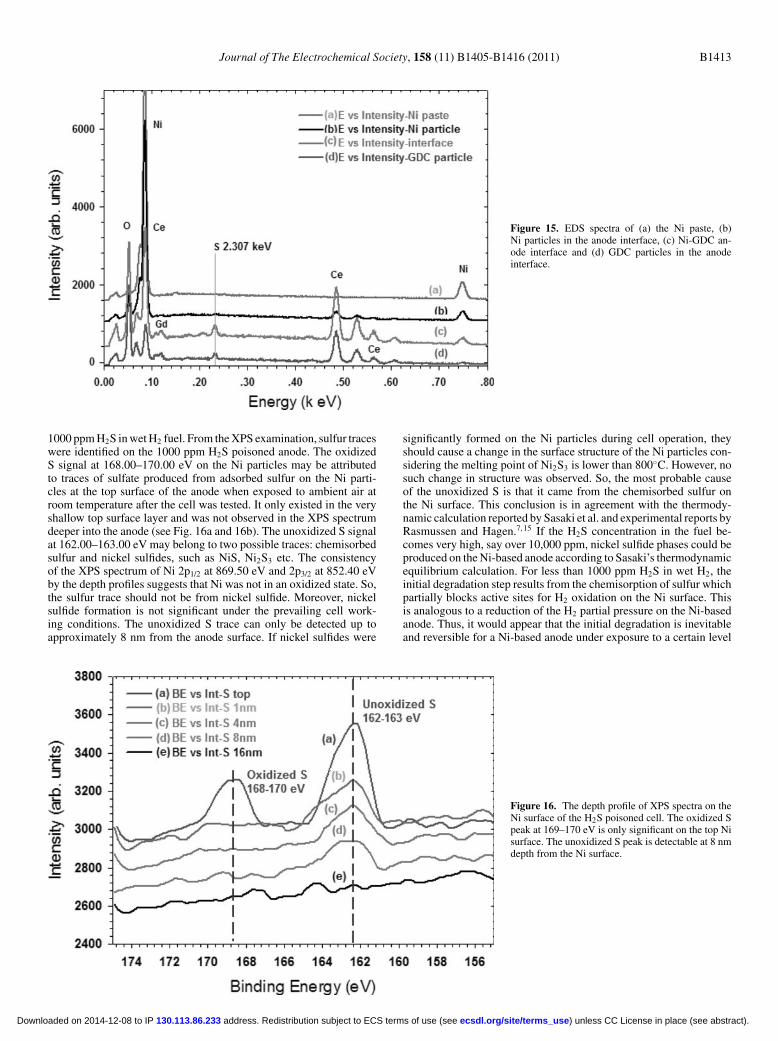
are GDC. The microstructure in these two images does not showany notable difference. The SEM images of the Ni contact paste ofcell-6 on the top of the cell anode for observing the Ni particle size,grain boundary and Ni metal surface texture are seen in Figs. 14aand 14b. The particle size of the Ni in the Ni paste is about 10 μmwhich matches the size on the H2S-poisoned cell image. The clear Nigrain boundary and surface texture imply that there is no significantsurface reconstruction on the Ni particle surface. The EDS spectraof the poisoned cell-6 showed that there are sulfur peaks at the cellactive layer and GDC particles (Fig. 15c and 15d), but there are nodetectable sulfur signals at 2.307 keV on the Ni particles in both thecontact paste and the cell anode interface (Fig. 15a and 15b). Thisevidence indicates that the sulfur signal is originating from the GDCparticles. To detect sulfur traces and changes on the surface of the Niparticles of the poisoned cell, a depth profile of the XPS spectra fromthe top surface was obtained by using Ar ion sputtering. These data areshown in Fig. 16. Both oxidized and unoxidized S signals appearedon the Ni at the top surface (Fig. 16a), but at a distance of 1 nm underthe top surface, the oxidized S peak at 168–170 eV did not exist in thespectrum (Fig. 16b). Furthermore, Fig. 16e shows that the unoxidized
Figure 9. The impedance spectra of cell-4 under200 mA cm−2 current bias in syngas with/without100 ppm H2S. The curves labeled by letters from ato d represent operation in syngas without H2S; thosewith letters from e to h represent operation in syngaswith H2S addition.
) unless CC License in place (see abstract). ecsdl.org/site/terms_use address. Redistribution subject to ECS terms of use (see 130.113.86.233Downloaded on 2014-12-08 to IP
Journal of The Electrochemical Society, 158 (11) B1405-B1416 (2011) B1411
Figure 10. The impedance spectra of cell-4 under200 mA cm−2 current bias in H2 with 0, 100 ppm,200 ppm, 500 ppm and 1000 ppm H2S impurity.
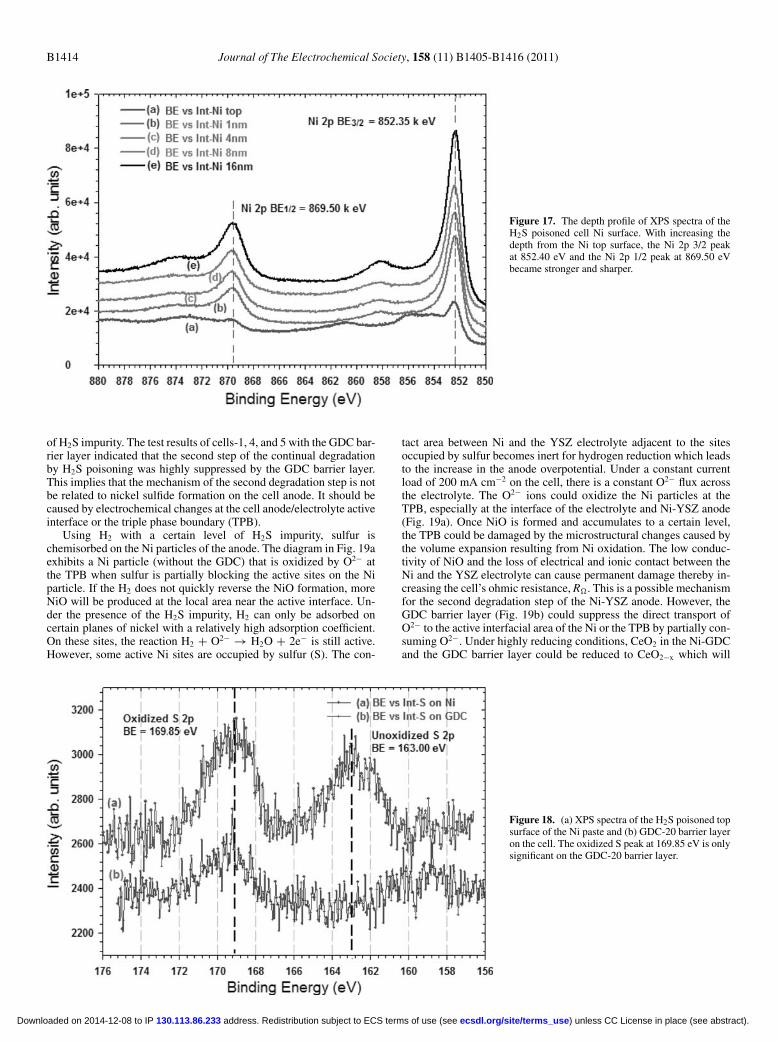
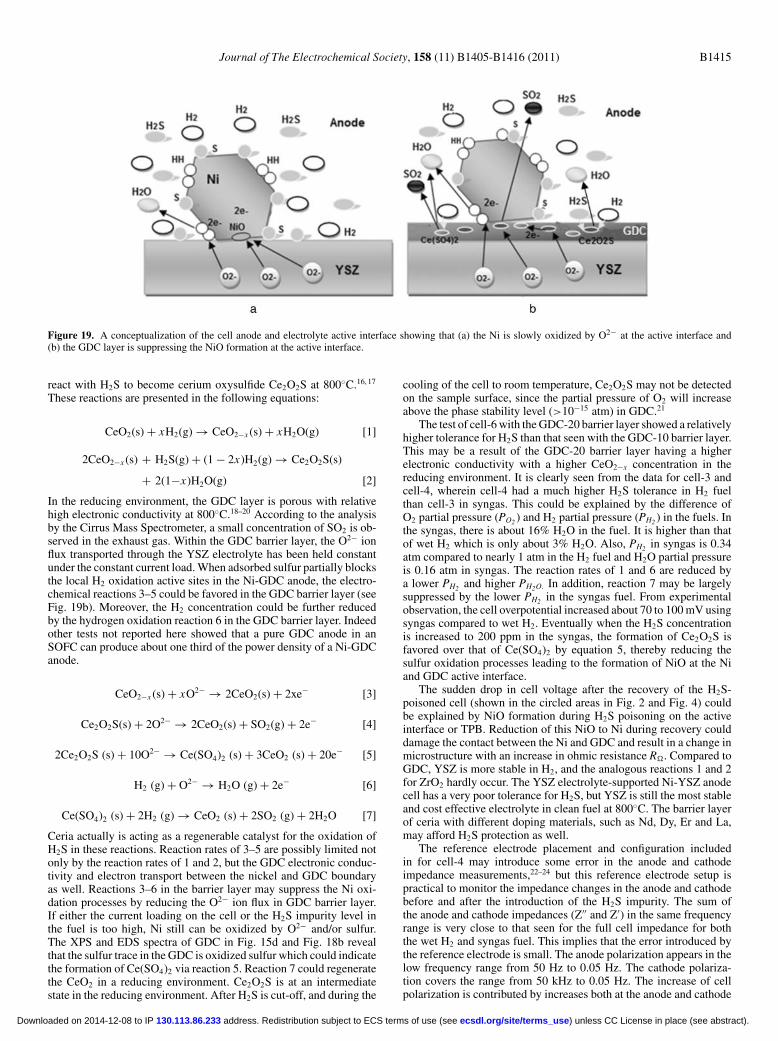
S peak disappeared at about 16 nm below the top surface. (These XPSspectra were smoothed by means of a third-order polynomial). TheXPS spectra for the Ni peaks only, Ni 2p1/2 and 2p3/2, are significant at869.50 eV and 852.35 eV respectively. The intensity of the Ni peaksincreasedwith the depth from the top surface (Fig. 17). However, therewas only an oxidized S 2p peak on the GDC barrier layer (Fig. 18b).From the observation of the SEM image, and the EDS and XPS spec-tra of the Ni particles in the anode and the paste, it can be concludedthat sulfur did not significantly react with Ni. The unoxidized S sig-nal existed only in the shallow level about 8 to 16 nm from the Nisurface. The unoxidized S is most likely chemisorbed S rather thannickel sulfide. The oxidized S trace only existed on the topmonolayers(1 nm) which could result from the oxidation of adsorbed sulfur afterthe sample was exposed to ambient air. Ex-situ XRD spectra of theNi-GDC anode and Ni current collection paste tested in 1000 ppmH2S showed no detectable sulfur or sulfur compounds, therefore, theXRD spectra were not included within the results section.
Discussion
Ceria (CeO2) is a mixed electronic and ionic conductor in thetemperature range of 600◦C–1300◦C. The electronic conductivity iscontributed by small polaron transport and is proportional to the con-centration of reduced defects (CeO2−x) from CeO2. In a reducingenvironment (PO2 < 10−6 atm), it is an n-type semiconductor and itsconductivity can be as high as 2.5 S cm−1 at 1000◦C.12 Also, the CeO2grain boundaries do not impede electron transport.13,14 For Gd-dopedCeO2, there are more Ce3+ defects in GDC than CeO2, which in turncontribute to higher electronic conductivity. GDC is a mixed ionic andelectronic conductor.According to the observed cell degradation for the Ni-GDC anode
under H2S (>100 ppm) poisoning, the initial degradation step whichcaused the rapid loss of cell voltage of about 60 to 100mV is inevitable.The Ni-GDC anode, especially when used in concert with the GDCbarrier layer, can suppress the continuous cell degradation (the sec-ond permanent degradation step) for up to 100 ppmH2S in syngas and
Figure 11. The impedance spectra of cell-4 under200 mA cm−2 current bias in H2 with 0, 16%, 25%,50%, 75% and 84% N2.
) unless CC License in place (see abstract). ecsdl.org/site/terms_use address. Redistribution subject to ECS terms of use (see 130.113.86.233Downloaded on 2014-12-08 to IP
B1412 Journal of The Electrochemical Society, 158 (11) B1405-B1416 (2011)
Figure 12. The total polarization resistance Rtρ ofthe cell-4 versus H2S concentration (ppm) and N2(mol%) concentration in H2 fuel.
Figure 13. SEM images for cell-6 of (a) the poisoned Ni-GDC in the anode interface, (b) the clean reduced Ni-GDC in the anode interface, (c) the Ni particles inthe anode interface and (c) GDC particles in the anode interface.
Figure 14. SEM images for cell-6 of the Ni particles in the contact paste on the top surface of the anode: (a) at 1k magnification and (b) at 20 k magnification.
) unless CC License in place (see abstract). ecsdl.org/site/terms_use address. Redistribution subject to ECS terms of use (see 130.113.86.233Downloaded on 2014-12-08 to IP
Journal of The Electrochemical Society, 158 (11) B1405-B1416 (2011) B1413
Figure 15. EDS spectra of (a) the Ni paste, (b)Ni particles in the anode interface, (c) Ni-GDC an-ode interface and (d) GDC particles in the anodeinterface.
1000 ppmH2S inwetH2 fuel. From theXPS examination, sulfur traceswere identified on the 1000 ppm H2S poisoned anode. The oxidizedS signal at 168.00–170.00 eV on the Ni particles may be attributedto traces of sulfate produced from adsorbed sulfur on the Ni parti-cles at the top surface of the anode when exposed to ambient air atroom temperature after the cell was tested. It only existed in the veryshallow top surface layer and was not observed in the XPS spectrumdeeper into the anode (see Fig. 16a and 16b). The unoxidized S signalat 162.00–163.00 eV may belong to two possible traces: chemisorbedsulfur and nickel sulfides, such as NiS, Ni2S3 etc. The consistencyof the XPS spectrum of Ni 2p1/2 at 869.50 eV and 2p3/2 at 852.40 eVby the depth profiles suggests that Ni was not in an oxidized state. So,the sulfur trace should not be from nickel sulfide. Moreover, nickelsulfide formation is not significant under the prevailing cell work-ing conditions. The unoxidized S trace can only be detected up toapproximately 8 nm from the anode surface. If nickel sulfides were
significantly formed on the Ni particles during cell operation, theyshould cause a change in the surface structure of the Ni particles con-sidering the melting point of Ni2S3 is lower than 800◦C. However, nosuch change in structure was observed. So, the most probable causeof the unoxidized S is that it came from the chemisorbed sulfur onthe Ni surface. This conclusion is in agreement with the thermody-namic calculation reported by Sasaki et al. and experimental reports byRasmussen and Hagen.7,15 If the H2S concentration in the fuel be-comes very high, say over 10,000 ppm, nickel sulfide phases could beproduced on theNi-based anode according to Sasaki’s thermodynamicequilibrium calculation. For less than 1000 ppm H2S in wet H2, theinitial degradation step results from the chemisorption of sulfur whichpartially blocks active sites for H2 oxidation on the Ni surface. Thisis analogous to a reduction of the H2 partial pressure on the Ni-basedanode. Thus, it would appear that the initial degradation is inevitableand reversible for a Ni-based anode under exposure to a certain level
Figure 16. The depth profile of XPS spectra on theNi surface of the H2S poisoned cell. The oxidized Speak at 169–170 eV is only significant on the top Nisurface. The unoxidized S peak is detectable at 8 nmdepth from the Ni surface.
) unless CC License in place (see abstract). ecsdl.org/site/terms_use address. Redistribution subject to ECS terms of use (see 130.113.86.233Downloaded on 2014-12-08 to IP
B1414 Journal of The Electrochemical Society, 158 (11) B1405-B1416 (2011)
Figure 17. The depth profile of XPS spectra of theH2S poisoned cell Ni surface. With increasing thedepth from the Ni top surface, the Ni 2p 3/2 peakat 852.40 eV and the Ni 2p 1/2 peak at 869.50 eVbecame stronger and sharper.
of H2S impurity. The test results of cells-1, 4, and 5 with the GDC bar-rier layer indicated that the second step of the continual degradationby H2S poisoning was highly suppressed by the GDC barrier layer.This implies that the mechanism of the second degradation step is notbe related to nickel sulfide formation on the cell anode. It should becaused by electrochemical changes at the cell anode/electrolyte activeinterface or the triple phase boundary (TPB).Using H2 with a certain level of H2S impurity, sulfur is
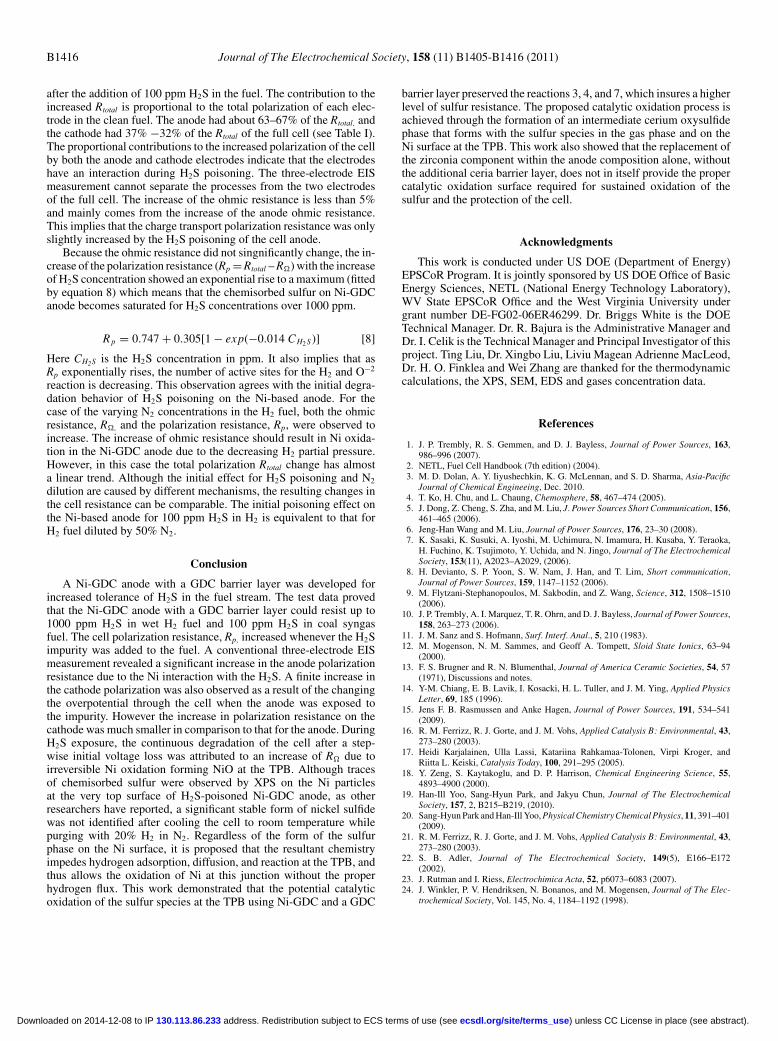
chemisorbed on the Ni particles of the anode. The diagram in Fig. 19aexhibits a Ni particle (without the GDC) that is oxidized by O2− atthe TPB when sulfur is partially blocking the active sites on the Niparticle. If the H2 does not quickly reverse the NiO formation, moreNiO will be produced at the local area near the active interface. Un-der the presence of the H2S impurity, H2 can only be adsorbed oncertain planes of nickel with a relatively high adsorption coefficient.On these sites, the reaction H2 + O2− → H2O + 2e− is still active.However, some active Ni sites are occupied by sulfur (S). The con-
tact area between Ni and the YSZ electrolyte adjacent to the sitesoccupied by sulfur becomes inert for hydrogen reduction which leadsto the increase in the anode overpotential. Under a constant currentload of 200 mA cm−2 on the cell, there is a constant O2− flux acrossthe electrolyte. The O2− ions could oxidize the Ni particles at theTPB, especially at the interface of the electrolyte and Ni-YSZ anode(Fig. 19a). Once NiO is formed and accumulates to a certain level,the TPB could be damaged by the microstructural changes caused bythe volume expansion resulting from Ni oxidation. The low conduc-tivity of NiO and the loss of electrical and ionic contact between theNi and the YSZ electrolyte can cause permanent damage thereby in-creasing the cell’s ohmic resistance, R�. This is a possible mechanismfor the second degradation step of the Ni-YSZ anode. However, theGDC barrier layer (Fig. 19b) could suppress the direct transport ofO2− to the active interfacial area of the Ni or the TPB by partially con-suming O2−. Under highly reducing conditions, CeO2 in the Ni-GDCand the GDC barrier layer could be reduced to CeO2−x which will
Figure 18. (a) XPS spectra of the H2S poisoned topsurface of the Ni paste and (b) GDC-20 barrier layeron the cell. The oxidized S peak at 169.85 eV is onlysignificant on the GDC-20 barrier layer.
) unless CC License in place (see abstract). ecsdl.org/site/terms_use address. Redistribution subject to ECS terms of use (see 130.113.86.233Downloaded on 2014-12-08 to IP
Journal of The Electrochemical Society, 158 (11) B1405-B1416 (2011) B1415
Figure 19. A conceptualization of the cell anode and electrolyte active interface showing that (a) the Ni is slowly oxidized by O2− at the active interface and(b) the GDC layer is suppressing the NiO formation at the active interface.
react with H2S to become cerium oxysulfide Ce2O2S at 800◦C.16,17
These reactions are presented in the following equations:
CeO2(s)+ xH2(g) → CeO2−x (s)+ xH2O(g) [1]
2CeO2−x (s) + H2S(g)+ (1− 2x)H2(g) → Ce2O2S(s)
+ 2(1−x)H2O(g) [2]
In the reducing environment, the GDC layer is porous with relativehigh electronic conductivity at 800◦C.18–20 According to the analysisby the Cirrus Mass Spectrometer, a small concentration of SO2 is ob-served in the exhaust gas. Within the GDC barrier layer, the O2− ionflux transported through the YSZ electrolyte has been held constantunder the constant current load.When adsorbed sulfur partially blocksthe local H2 oxidation active sites in the Ni-GDC anode, the electro-chemical reactions 3–5 could be favored in the GDC barrier layer (seeFig. 19b). Moreover, the H2 concentration could be further reducedby the hydrogen oxidation reaction 6 in the GDC barrier layer. Indeedother tests not reported here showed that a pure GDC anode in anSOFC can produce about one third of the power density of a Ni-GDCanode.
CeO2−x (s)+ xO2− → 2CeO2(s)+ 2xe− [3]
Ce2O2S(s)+ 2O2− → 2CeO2(s)+ SO2(g)+ 2e− [4]
2Ce2O2S (s)+ 10O2− → Ce(SO4)2 (s)+ 3CeO2 (s)+ 20e− [5]
H2 (g)+ O2− → H2O (g)+ 2e− [6]
Ce(SO4)2 (s)+ 2H2 (g) → CeO2 (s)+ 2SO2 (g)+ 2H2O [7]
Ceria actually is acting as a regenerable catalyst for the oxidation ofH2S in these reactions. Reaction rates of 3–5 are possibly limited notonly by the reaction rates of 1 and 2, but the GDC electronic conduc-tivity and electron transport between the nickel and GDC boundaryas well. Reactions 3–6 in the barrier layer may suppress the Ni oxi-dation processes by reducing the O2− ion flux in GDC barrier layer.If either the current loading on the cell or the H2S impurity level inthe fuel is too high, Ni still can be oxidized by O2− and/or sulfur.The XPS and EDS spectra of GDC in Fig. 15d and Fig. 18b revealthat the sulfur trace in the GDC is oxidized sulfur which could indicatethe formation of Ce(SO4)2 via reaction 5. Reaction 7 could regeneratethe CeO2 in a reducing environment. Ce2O2S is at an intermediatestate in the reducing environment. After H2S is cut-off, and during the
cooling of the cell to room temperature, Ce2O2S may not be detectedon the sample surface, since the partial pressure of O2 will increaseabove the phase stability level (>10−15 atm) in GDC.21
The test of cell-6with theGDC-20 barrier layer showed a relativelyhigher tolerance for H2S than that seen with the GDC-10 barrier layer.This may be a result of the GDC-20 barrier layer having a higherelectronic conductivity with a higher CeO2−x concentration in thereducing environment. It is clearly seen from the data for cell-3 andcell-4, wherein cell-4 had a much higher H2S tolerance in H2 fuelthan cell-3 in syngas. This could be explained by the difference ofO2 partial pressure (PO2 ) and H2 partial pressure (PH2 ) in the fuels. Inthe syngas, there is about 16% H2O in the fuel. It is higher than thatof wet H2 which is only about 3% H2O. Also, PH2 in syngas is 0.34atm compared to nearly 1 atm in the H2 fuel and H2O partial pressureis 0.16 atm in syngas. The reaction rates of 1 and 6 are reduced bya lower PH2 and higher PH2O. In addition, reaction 7 may be largelysuppressed by the lower PH2 in the syngas fuel. From experimentalobservation, the cell overpotential increased about 70 to 100mV usingsyngas compared to wet H2. Eventually when the H2S concentrationis increased to 200 ppm in the syngas, the formation of Ce2O2S isfavored over that of Ce(SO4)2 by equation 5, thereby reducing thesulfur oxidation processes leading to the formation of NiO at the Niand GDC active interface.The sudden drop in cell voltage after the recovery of the H2S-
poisoned cell (shown in the circled areas in Fig. 2 and Fig. 4) couldbe explained by NiO formation during H2S poisoning on the activeinterface or TPB. Reduction of this NiO to Ni during recovery coulddamage the contact between the Ni and GDC and result in a change inmicrostructure with an increase in ohmic resistance R�. Compared toGDC, YSZ is more stable in H2, and the analogous reactions 1 and 2for ZrO2 hardly occur. The YSZ electrolyte-supported Ni-YSZ anodecell has a very poor tolerance for H2S, but YSZ is still the most stableand cost effective electrolyte in clean fuel at 800◦C. The barrier layerof ceria with different doping materials, such as Nd, Dy, Er and La,may afford H2S protection as well.The reference electrode placement and configuration included
in for cell-4 may introduce some error in the anode and cathodeimpedance measurements,22–24 but this reference electrode setup ispractical to monitor the impedance changes in the anode and cathodebefore and after the introduction of the H2S impurity. The sum ofthe anode and cathode impedances (Z′′ and Z′) in the same frequencyrange is very close to that seen for the full cell impedance for boththe wet H2 and syngas fuel. This implies that the error introduced bythe reference electrode is small. The anode polarization appears in thelow frequency range from 50 Hz to 0.05 Hz. The cathode polariza-tion covers the range from 50 kHz to 0.05 Hz. The increase of cellpolarization is contributed by increases both at the anode and cathode
) unless CC License in place (see abstract). ecsdl.org/site/terms_use address. Redistribution subject to ECS terms of use (see 130.113.86.233Downloaded on 2014-12-08 to IP
B1416 Journal of The Electrochemical Society, 158 (11) B1405-B1416 (2011)
after the addition of 100 ppm H2S in the fuel. The contribution to theincreased Rtotal is proportional to the total polarization of each elec-trode in the clean fuel. The anode had about 63–67% of the Rtotal, andthe cathode had 37% −32% of the Rtotal of the full cell (see Table I).The proportional contributions to the increased polarization of the cellby both the anode and cathode electrodes indicate that the electrodeshave an interaction during H2S poisoning. The three-electrode EISmeasurement cannot separate the processes from the two electrodesof the full cell. The increase of the ohmic resistance is less than 5%and mainly comes from the increase of the anode ohmic resistance.This implies that the charge transport polarization resistance was onlyslightly increased by the H2S poisoning of the cell anode.Because the ohmic resistance did not singnificantly change, the in-
crease of the polarization resistance (Rp = Rtotal –R�) with the increaseof H2S concentration showed an exponential rise to a maximum (fittedby equation 8) which means that the chemisorbed sulfur on Ni-GDCanode becomes saturated for H2S concentrations over 1000 ppm.
Rp = 0.747+ 0.305[1− exp(−0.014 CH2S)] [8]
Here CH2S is the H2S concentration in ppm. It also implies that asRp exponentially rises, the number of active sites for the H2 and O−2
reaction is decreasing. This observation agrees with the initial degra-dation behavior of H2S poisoning on the Ni-based anode. For thecase of the varying N2 concentrations in the H2 fuel, both the ohmicresistance, R�, and the polarization resistance, Rp, were observed toincrease. The increase of ohmic resistance should result in Ni oxida-tion in the Ni-GDC anode due to the decreasing H2 partial pressure.However, in this case the total polarization Rtotal change has almosta linear trend. Although the initial effect for H2S poisoning and N2dilution are caused by different mechanisms, the resulting changes inthe cell resistance can be comparable. The initial poisoning effect onthe Ni-based anode for 100 ppm H2S in H2 is equivalent to that forH2 fuel diluted by 50% N2.
Conclusion
A Ni-GDC anode with a GDC barrier layer was developed forincreased tolerance of H2S in the fuel stream. The test data provedthat the Ni-GDC anode with a GDC barrier layer could resist up to1000 ppm H2S in wet H2 fuel and 100 ppm H2S in coal syngasfuel. The cell polarization resistance, Rp, increased whenever the H2Simpurity was added to the fuel. A conventional three-electrode EISmeasurement revealed a significant increase in the anode polarizationresistance due to the Ni interaction with the H2S. A finite increase inthe cathode polarization was also observed as a result of the changingthe overpotential through the cell when the anode was exposed tothe impurity. However the increase in polarization resistance on thecathode was much smaller in comparison to that for the anode. DuringH2S exposure, the continuous degradation of the cell after a step-wise initial voltage loss was attributed to an increase of R� due toirreversible Ni oxidation forming NiO at the TPB. Although tracesof chemisorbed sulfur were observed by XPS on the Ni particlesat the very top surface of H2S-poisoned Ni-GDC anode, as otherresearchers have reported, a significant stable form of nickel sulfidewas not identified after cooling the cell to room temperature whilepurging with 20% H2 in N2. Regardless of the form of the sulfurphase on the Ni surface, it is proposed that the resultant chemistryimpedes hydrogen adsorption, diffusion, and reaction at the TPB, andthus allows the oxidation of Ni at this junction without the properhydrogen flux. This work demonstrated that the potential catalyticoxidation of the sulfur species at the TPB using Ni-GDC and a GDC
barrier layer preserved the reactions 3, 4, and 7, which insures a higherlevel of sulfur resistance. The proposed catalytic oxidation process isachieved through the formation of an intermediate cerium oxysulfidephase that forms with the sulfur species in the gas phase and on theNi surface at the TPB. This work also showed that the replacement ofthe zirconia component within the anode composition alone, withoutthe additional ceria barrier layer, does not in itself provide the propercatalytic oxidation surface required for sustained oxidation of thesulfur and the protection of the cell.
Acknowledgments
This work is conducted under US DOE (Department of Energy)EPSCoR Program. It is jointly sponsored by US DOE Office of BasicEnergy Sciences, NETL (National Energy Technology Laboratory),WV State EPSCoR Office and the West Virginia University undergrant number DE-FG02-06ER46299. Dr. Briggs White is the DOETechnical Manager. Dr. R. Bajura is the Administrative Manager andDr. I. Celik is the Technical Manager and Principal Investigator of thisproject. Ting Liu, Dr. Xingbo Liu, Liviu Magean Adrienne MacLeod,Dr. H. O. Finklea and Wei Zhang are thanked for the thermodynamiccalculations, the XPS, SEM, EDS and gases concentration data.
References
1. J. P. Trembly, R. S. Gemmen, and D. J. Bayless, Journal of Power Sources, 163,986–996 (2007).
2. NETL, Fuel Cell Handbook (7th edition) (2004).3. M. D. Dolan, A. Y. Iiyushechkin, K. G. McLennan, and S. D. Sharma, Asia-Pacific
Journal of Chemical Engineeing, Dec. 2010.4. T. Ko, H. Chu, and L. Chaung, Chemosphere, 58, 467–474 (2005).5. J. Dong, Z. Cheng, S. Zha, and M. Liu, J. Power Sources Short Communication, 156,461–465 (2006).
6. Jeng-Han Wang and M. Liu, Journal of Power Sources, 176, 23–30 (2008).7. K. Sasaki, K. Susuki, A. Iyoshi, M. Uchimura, N. Imamura, H. Kusaba, Y. Teraoka,H. Fuchino, K. Tsujimoto, Y. Uchida, and N. Jingo, Journal of The ElectrochemicalSociety, 153(11), A2023–A2029, (2006).
8. H. Devianto, S. P. Yoon, S. W. Nam, J. Han, and T. Lim, Short communication,Journal of Power Sources, 159, 1147–1152 (2006).
9. M. Flytzani-Stephanopoulos, M. Sakbodin, and Z. Wang, Science, 312, 1508–1510(2006).
10. J. P. Trembly, A. I. Marquez, T. R. Ohrn, and D. J. Bayless, Journal of Power Sources,158, 263–273 (2006).
11. J. M. Sanz and S. Hofmann, Surf. Interf. Anal., 5, 210 (1983).12. M. Mogenson, N. M. Sammes, and Geoff A. Tompett, Sloid State Ionics, 63–94
(2000).13. F. S. Brugner and R. N. Blumenthal, Journal of America Ceramic Societies, 54, 57
(1971), Discussions and notes.14. Y-M. Chiang, E. B. Lavik, I. Kosacki, H. L. Tuller, and J. M. Ying, Applied Physics
Letter, 69, 185 (1996).15. Jens F. B. Rasmussen and Anke Hagen, Journal of Power Sources, 191, 534–541
(2009).16. R. M. Ferrizz, R. J. Gorte, and J. M. Vohs, Applied Catalysis B: Environmental, 43,
273–280 (2003).17. Heidi Karjalainen, Ulla Lassi, Katariina Rahkamaa-Tolonen, Virpi Kroger, and
Riitta L. Keiski, Catalysis Today, 100, 291–295 (2005).18. Y. Zeng, S. Kaytakoglu, and D. P. Harrison, Chemical Engineering Science, 55,
4893–4900 (2000).19. Han-Ill Yoo, Sang-Hyun Park, and Jakyu Chun, Journal of The Electrochemical
Society, 157, 2, B215–B219, (2010).20. Sang-HyunPark andHan-Ill Yoo,Physical Chemistry Chemical Physics, 11, 391–401
(2009).21. R. M. Ferrizz, R. J. Gorte, and J. M. Vohs, Applied Catalysis B: Environmental, 43,
273–280 (2003).22. S. B. Adler, Journal of The Electrochemical Society, 149(5), E166–E172
(2002).23. J. Rutman and I. Riess, Electrochimica Acta, 52, p6073–6083 (2007).24. J. Winkler, P. V. Hendriksen, N. Bonanos, and M. Mogensen, Journal of The Elec-
trochemical Society, Vol. 145, No. 4, 1184–1192 (1998).
) unless CC License in place (see abstract). ecsdl.org/site/terms_use address. Redistribution subject to ECS terms of use (see 130.113.86.233Downloaded on 2014-12-08 to IP