an for assessing convergent and discriminant validity - conservancy
TRANSCRIPT

411
An Alternative Procedure for AssessingConvergent and Discriminant ValidityDonald R. LehmannColumbia University
This paper presents a simple procedure for estab-lishing convergent and discriminant validity. Themethod uses ordinary least-squares regression (OLS)with the correlations between measures as the depen-
dent variable. Illustrations indicate that the method
provides reasonable answers. Index terms: conver-
gent validity, discriminant validity, multiple regres-sion.
Establishing the validity of measures is a major focus of research. Essential to establishing validitywith multi-item measures are notions of convergent and discriminant validity (Anastasi, 1968; Bohmstedt,1970; I~u~nally9 1978). Many approaches to convergent and discriminant validity assessment are derivedfrom the multitrait-multimethod approach (Campbell & Fiske, 1959). This paper presents an alternativeto the LISREL-based nested model procedure used by Bagozzi (1978) and Widaman (1985).
Background
The most common approach to establishing convergent and discriminant validity is to demonstratethat multiple measures of a construct are ( 1 ) related, and (2) more related to each other than to measuresof other constructs, even when the two measurement methods are similar (Carr~pbell ~ p’iske9 1959). Thesecond criterion suggests that a construct should have more impact on a relation than does a commonmeasurement method.
The assessment of validity typically has focused on the Pearson product-moment correlation coef-ficient. This requires both intervally scaled data and linear association, although a monotonic relationwill often suffice. Although it is relatively easy to account for non-linearities in the relation (Lehmann,1974), here the focus is on the linear correlation coefficient as the measure of association.
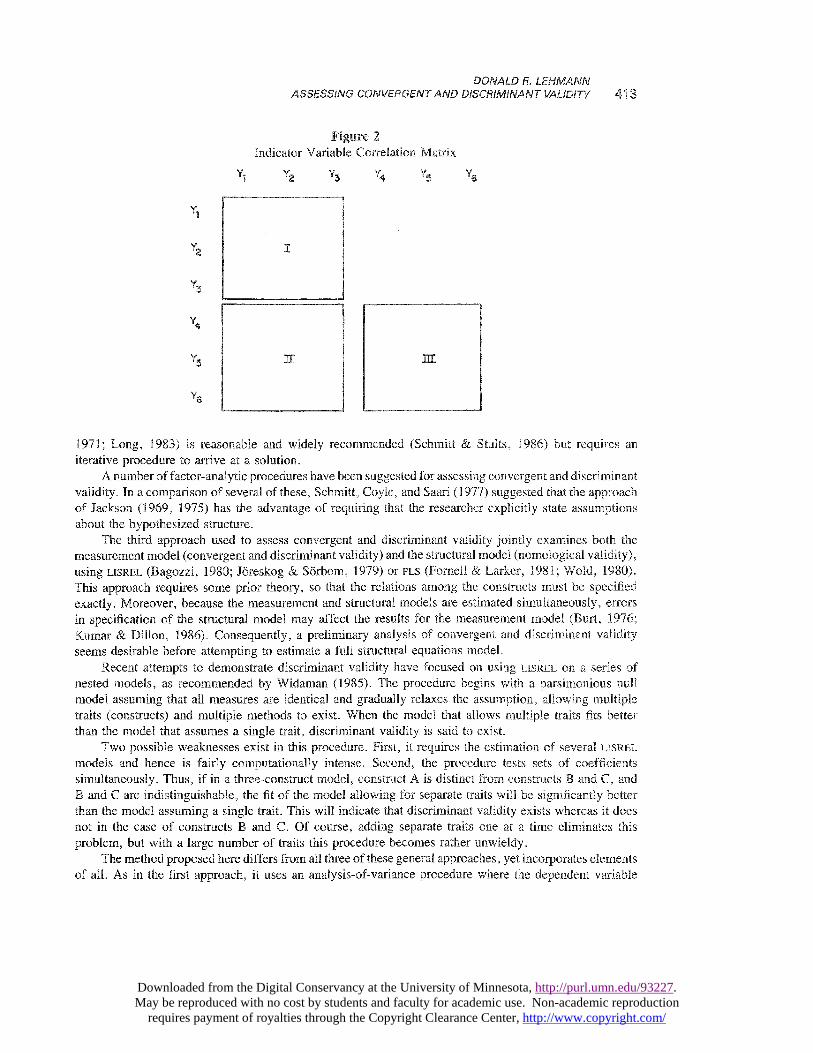
Convergent and discriminant validity require that multiple measures of a construct relate highly toeach other and less highly to measures of other constructs. Consider the hypothetical two-construct, three-measure-per-construct model in Figure 1. In the case of independent constructs (Figure 1 a), correlationsof variable pairs (1,2), (1,3), and (2,3) should be high (Block I in Figure 2). Similarly, correlations ofvariable pairs (4,5), (4,6), and (5,6) should be high (Block III in Figure 2). By contrast, correlations ofvariable pairs in Block II such as ( 1,4) should be zero.
When some measures share a common measurement method (Figure then the correlation betweenthem should be higher than among variables that do not use a common method. Thus, in Figure lb if F,
Downloaded from the Digital Conservancy at the University of Minnesota, http://purl.umn.edu/93227. May be reproduced with no cost by students and faculty for academic use. Non-academic reproduction
requires payment of royalties through the Copyright Clearance Center, http://www.copyright.com/

412
Figure 1Two Construct Models
and Y, share a common measurement base, then rJ4 should be potentially higher than, say, r,,. However,even when variables 4 and 5 are maximally different measures, rl5 should be greater than r14. If a variable.A shares more variance with its construct than another variable .~ then the correlation between A and (1)all other indicators of the construct and (2) any indicator of a related construct should be larger.
Examinations of convergent and discriminant validity have followed three major approaches. Thefirst approach involves examining some form of the multitrait-multimethod matrix (MTMM) approach toanalyze the correlation matrix (i.e., Sullivan & Feldman, 1979) for internal and external consistency(Anderson & Gerbing, 1982).
Kalleberg and Klugel (1975) presented a path-analytic decomposition of the MTMM matrix, whichthey found inadequate due to assumptions that traits and methods are uncorrelated and that methods areminimally correlated with each other (Jackson, 1969). They also found the method &dquo;basically qualitativein nature&dquo; and turned to confirmatory factor analysis to assess validity. Kavanaugh, MacKinney, andWolins (1971) used analysis of variance to decompose the observed data based on person, trait, andmethod variables.
A second approach to assessing validity is factor analysis. When exploratory factor analysis is used,the results are often largely-but not completely-consistent with prior theory. For example, if there areseven constructs with three indicators of each, a principal components analysis must produce seveneigenvalues greater than 1.0 (or possibly 10 if each method also had an effect) and the rotated factormatrix must have seven factors, each with three indicators loading on it. Because this almost never occurs,the researcher can only conclude that the results &dquo;generally support the prior theory.&dquo; Thus, becauseexploratory factor analysis is imprecise and orthogonal factor analysis is not appropriate for correlatedconstructs, confirmatory factor analysis often is used. This approach (Anderson & Gerbing, 1982; 3®resl~og9
Downloaded from the Digital Conservancy at the University of Minnesota, http://purl.umn.edu/93227. May be reproduced with no cost by students and faculty for academic use. Non-academic reproduction
requires payment of royalties through the Copyright Clearance Center, http://www.copyright.com/
413
Figure 2Indicator Variable Correlation Matrix
1971; Long, 1983) is reasonable and widely recommended (Schmitt & Stults, 1986) but requires aniterative procedure to arrive at a solution.
A number of factor-analytic procedures have been suggested for assessing convergent and discriminantvalidity. In a comparison of several of these, Schmitt, Coyle, and Saari ( 1977) suggested that the approachof Jackson (1969, 1975) has the advantage of requiring that the researcher explicitly state assumptionsabout the hypothesized structure.
The third approach used to assess convergent and discriminant validity jointly examines both themeasurement model (convergent and discriminant validity) and the structural model (nomological validity),using LISREL (Bagozzi, 1980; J6reskog & Sorbom, 1979) or PLS (Fomell & Larker, 1981; Wold, 1980).This approach requires some prior theory, so that the relations among the constructs must be specifiedexactly. Moreover, because the measurement and structural models are estimated simultaneously, errorsin specification of the structural model may affect the results for the measurement model (Burt, 1976;Kumar & Dillon, 1986). Consequently, a preliminary analysis of convergent and discriminant validityseems desirable before attempting to estimate a full structural equations model.
Recent attempts to demonstrate discriminant validity have focused on using LISREL on a series ofnested models, as recommended by Widaman (1985). The procedure begins with a parsimonious nullmodel assuming that all measures are identical and gradually relaxes the assumption, allowing multipletraits (constructs) and multiple methods to exist. When the model that allows multiple traits fits betterthan the model that assumes a single trait, discriminant validity is said to exist.
Two possible weaknesses exist in this procedure. First, it requires the estimation of several LISRELmodels and hence is fairly computationally intense. Second, the procedure tests sets of coefficients
simultaneously. Thus, if in a three-construct model, construct A is distinct from constructs B and C, andB and C are indistinguishable, the fit of the model allowing for separate traits will be significantly betterthan the model assuming a single trait. This will indicate that discriminant validity exists whereas it doesnot in the case of constructs B and C. Of course, adding separate traits one at a time eliminates thisproblem, but with a large number of traits this procedure becomes rather unwieldy.
The method proposed here differs from all three of these general approaches, yet incorporates elementsof all. As in the first approach, it uses an analysis-of-variance procedure where the dependent variable
Downloaded from the Digital Conservancy at the University of Minnesota, http://purl.umn.edu/93227. May be reproduced with no cost by students and faculty for academic use. Non-academic reproduction
requires payment of royalties through the Copyright Clearance Center, http://www.copyright.com/

414
is the correlation between items, rather than the item score. In addition, it decomposes correlations basedon trait and method variables. As in the second approach, this method requires assumptions, but onlyabout ( 1 ) which items measure which construct and (2) which items share a common measurement method.In contrast to the third approach, this method, although easily adaptable to the nested-model approach,produces a single-stage least-squares estimate of a &dquo;null&dquo; model (separate traits and methods), whichallows examination of discriminant validity from a single output.
Proposed Method
The approach followed here &dquo;explains&dquo; correlations using a dummy variable regression analysis interms of the measure-to-construct relations, the construct-to-construct relations, and the impact of commonmeasurement bases. Every correlation rij, where is a measure of construct p and j is a measure ofconstruct q, is assumed to be affected by several factors:1. The closeness of the relation between constructs p and q.2. Any common method that i and j might share.3. The relation of each measure to its construct.
The procedure estimates the impact of each of these on correlations, thus allowing an explicit test of thedesired conditions.
Decomposing the correlations is directly related to the analysis-of-variance approach (see the Ap-pendix). In essence, the correlations are decomposed as follows:
where ~p9 = 1 if p and q are the two constructs, 0 otherwise;Zmn = 1 if m and n are the two methods, 0 otherwise; and
Z~=lift=~orj=~,0 otherwise.Due to collinearity among the dummy variables, it is necessary to estimate a reduced form of Equation
1. Two models are of special interest. The first assumes that all the Bks equal 0 (which implies all areequally good measures of their respective constructs):
This strong assumption allows estimation of, for example, correlated methods of measurement (B_,s). Amore reasonable initial assumption allows for the unequal quality of variables and deletes the variablesrelating to two measures of the same construct (Z,,s) and the variables relating to measures by differentmethods (Z,,,,,s). This model becomes
The interpretation of the coefficients in Equation 3 is as follows (assuming deletion of one of the Z,variables).
Coefficients
Constant. This represents the average correlation of the (dummy) variable omitted from the equation(in order to permit estimation) with other measures of the same construct.
Individual variable coefficients (Bis). These indicate how the average correlation for a particularvariable differs from the omitted (dummy) variable’s average correlation. Thus, B¡ = .2 means thatcorrelations involving variable i average .2 larger than those involving the omitted variable. Ignoring
Downloaded from the Digital Conservancy at the University of Minnesota, http://purl.umn.edu/93227. May be reproduced with no cost by students and faculty for academic use. Non-academic reproduction
requires payment of royalties through the Copyright Clearance Center, http://www.copyright.com/

415
common method effects, the correlation among two variables which measure the same construct is
predicted to be Bo + B; + Bj. Therefore, in order for a construct p to have convergent validity, allBo + Bi + Bj must be greater than 0 for all (ij) pairs, where z and j are measures of the particularconstruct p.
Cross-construct coefficients (Bps). These coefficients indicate how the average correlation between
a measure of construct p and a measure of construct q differs from the average correlation between two
measures of the same construct (i.e., two measures of p, two measures of q, ... ). In order to establishdiscriminant validity between constructs p and q, ~Pq should be significantly less than 0. Further, correlatedconstructs exist if Bo + ~; + ~~ + B pq is greater than 0 for i (a measure of construct p) and j (a measureof construct q).
Common method coefficients (Bmms). These coefficients measure the difference between the averagecorrelation of two measures using method m and two measures using different methods. When ~&dquo;,m is
significantly positive, this indicates a significant method effect for method rra.One useful feature of Equation 3 is that it provides an estimate of the magnitude of the common
method effect. This magnitude is interesting both in its own right and in comparison to the magnitudeof the effects of the traits. If the method effects are larger than the trait effects, then a problem may existin isolating the effects of the traits, and the strength of the constructs is relatively weak.
Widaman (1985) suggested that the procedures of Campbell and Fiske (1959) have three mainproblems: (1) the correlations are not independent, (2) estimates of the trait-related and method-relatedvariance are not obtainable, and (3) the procedures are distorted when the variables differ in reliability.Here the dependence of the correlations is explicitly modeled in Equation 3. The proposed procedurespecifically separates trait-related and method-related sources of the correlations (the Bpqs and Bmns), whichis one of the advantages of using LISREL for analyzing validity. Furthermore, Equation 3 explicitly allowsfor unequal reliabilities (Bks) and provides a framework in which to test the constraint of equal reliabilities.
Estimation
The statistical estimation of the model depends on the distribution of e,~. The variance of a correlation,and hence eij, is approximately (1 - r~)/(~ - 2). This suggests that a weighted least-squares (wLs) pro-cedure will be more efficient than ordinary least-squares (OLS), and that WLS will tend to weight thelarger correlations (typically between measures of the same construct) more heavily. The co variances ofthe eiis are assumed to be 0. Note that this does not imply that the correlations themselves are unrelated.If all correlations come from the same dataset, constraints exist on r23 if r2 and r13 are known, althoughunless r°,z and r°13 are large the constraint is not very tight. Here it is assumed that the deviations in thecorrelations from some &dquo;true&dquo; value are uncorrelated.
An alternative approach is to use Fisher’s r to z transformation on the correlations in Equation 3 tonormalize the variances. This method is not recommended because the coefficients are difficult to interpretin terms of the magnitude of correlations, and because this procedure minimizes errors in predicting Z,which does not necessarily minimize error in predicting r.
Variable Coding
Coding the variables for the analysis of the model in Equation 3 is straightforward. For each correlation(i,j) the dummy variables Di and D, are coded as 1, and the rest of the dummy variables are coded as0. If variable i is a measure of construct p and j is a measure of construct q, then Dpq is coded as 1 and
Downloaded from the Digital Conservancy at the University of Minnesota, http://purl.umn.edu/93227. May be reproduced with no cost by students and faculty for academic use. Non-academic reproduction
requires payment of royalties through the Copyright Clearance Center, http://www.copyright.com/

416
the other &dquo;cross-construct&dquo; dummy variables are coded as 0. Finally, if variables and j share method~c, the D,~~ is coded as 1 and the rest of the common method dummy variables are coded as 0.
As an example of coding, consider the variables analyzed by Lawler ( 1967) which consisted of ninevariables representing all combinations of ratings by supervisors, peers, and persons themselves (methods)of ability, quality, and effort on the job (traits):1. Supervisor rating of quality (At),2. Peer rating of quality (A2),3. Self rating of quality (A3),4. Supervisor rating of ability (Bl),5. Peer rating of ability (B2),6. Self rating of ability (B3),7. Supervisor rating of effort (ci),8. Peer rating of effort (C2), and9. Self rating of effort (C3).These nine variables produced 36 pairwise correlations, which are shown, along with the coding, in Table 1.
~~ pl~ Applications
Discriminant Validity
This example examines discriminant validity using the superior, peer, and self ratings of performanceon three criteria (quality, ability, and effort) presented by Lawler (1967). These correlations were analyzedusing Equation 3 and OLS.
The data in Table 2 lead to some obvious conclusions:
1. Bo + ~; + ~~ > 0 for all i, j in the same construct, indicating convergent validity, though only weaklywhen self ratings are involved. (The negative values for the self-rating measures indicate that thesecorrelations tend to be somewhat smaller.)
2. There is clear discriminant validity between ability and effort (B = ―.22) and significant discriminantvalidity between quality and effort (~ = ― .11). There is no discriminant validity between qualityand ability (B = - .05, not significantly different from 0).
3. The correlations involving supervisor or peer ratings are larger than those involving self ratings ingeneral (Bis range from .27 to .35 vs. - .07 and - .08 for self ratings).
4. Bo + + Bj + ~p9 is generally positive, indicating correlated constructs, although again the selfratings tend to be different from the others.
5. There is massive method bias in the self ratings (~ _ .64), a smaller but significant one in thesupervisor ratings (~ _ .13), and a r~®nsi~nific~a~t ~ in peer ratings (.10). This suggests that selfratings are consistent across attributes (ability, quality, effort).
These results mirror those reported by Widaman (1985). His chosen model (Model 3C in his paper)showed a strong correlation between the supervisor and peer method factors (related to the higher cor-relations in their person variables reported here). He argued that effort is the most distinct trait (hereeffort was discriminantly different from both quality and ability), but that the traits were not easilydistinguishable (here indicated by the relatively small coefficients of the trait variables). Thus, the one-step procedure recommended here produces essentially the same interpretation as the nested model testingprocedure used by Widaman (1985).
Downloaded from the Digital Conservancy at the University of Minnesota, http://purl.umn.edu/93227. May be reproduced with no cost by students and faculty for academic use. Non-academic reproduction
requires payment of royalties through the Copyright Clearance Center, http://www.copyright.com/

417DONALD
Downloaded from the Digital Conservancy at the University of Minnesota, http://purl.umn.edu/93227. May be reproduced with no cost by students and faculty for academic use. Non-academic reproduction
requires payment of royalties through the Copyright Clearance Center, http://www.copyright.com/

418
Table 2B Weights from the LawlerData Analysis2(R 2 _.92,
Adjusted ~ - .87)
the Three-Component of Attitude
As a more complex example of the procedure, an assessment of the convergent and discriminantvalidity of the three-component attitude model was made. Specifically, the data of Ostrom (1969) andKothandapani (1971), which have been analyzed using covariance structure methods (Bagozzi, 1978;Widaman, 1985), were analyzed using a form of Equation 3.
Ostrom data. The model used for the Ostrom data was
This model provides a direct test for method variance (if B12, B14, and ~,5 are positive andsignificant, this indicates common method variance). It also provides a direct test of discriminant validity(if ~,69 B 17, and B 18 are significantly negative, there is discriminant validity). Convergent validity requiresthat ~o and all ~o + j6, be significantly positive; in other words, that correlations between measures ofthe same construct should be positive. A stronger test is possible if a certain minimum level of correlationof measures to their construct (e.g., rs above .6) is desired. In such situations, Bo and B, + Bi must beabove that cutoff level.
The results from an OLS regression analysis of the model are shown in Table 3, which used 1-0coding for the dummy variables. The conclusions that can be drawn from the Ostrom ( 1969) data are asfollows:
1. Measure-to-construct relations are remarkably similar for any pair of variables because Bis range onlyfr®rn - .®~ to -i- .09.
Downloaded from the Digital Conservancy at the University of Minnesota, http://purl.umn.edu/93227. May be reproduced with no cost by students and faculty for academic use. Non-academic reproduction
requires payment of royalties through the Copyright Clearance Center, http://www.copyright.com/

419
2. Correlations involving Likert scales tend to be about I larger, suggesting that a stronger methodcomponent exists in them.
3. A significant common method effect is evident for self-rating scales (~,5 = .15) and a small buteffect exists for Likert scales (~,3 = .06).
4. The behavioral construct is significantly different from both the affective and cognitive component,though only barely so. Moreover, the affective and cognitive components are not significantly differentat the .05 level, and the sizes of the discriminant variables ( - .03, - .04, - .02) suggest that theconstructs are highly related.
5. Because all ~o + ~; + Bj 5= .46, there is reasonable convergent validity.
I~®th~~adc~p~ni ~catca. The Kothandapani (1971) data were analyzed using the same version of Equa-tion 3 that was used for the Ostrom data, except that the three components were Feeling, Belief, andIntention instead of Affect, Behavior, and Cognition. The results (also shown in Table 3) differed inseveral ways:1. Correlations involving Likert and Guilford scales tend to be higher (Bs range from -.07 to + .02
for these vs. - . 19 to - . 09 for the Thurstone and Guttman scales).2. A significant and substantial common method effect exists for all four methods. The Bs = .23, .25,
.29, and .3I , indicating, for example, that two Thurstone scales on average are correlated .23 higherthan correlations of variables which share no common method.
3. All the constructs are significantly distinct, with Feeling (Affect) and Intention (Behavior) the mostdistinct. Also, the coefficients of the discriminant variables are as large as the coefficients of themethod factors (~s = .22, - .26, - .42).
Table 3B Weights and Si~~abf3c~~nce Levels (p) From OLS
Decomposition of Ostrom and Kothandapani Correlation Matrices
Downloaded from the Digital Conservancy at the University of Minnesota, http://purl.umn.edu/93227. May be reproduced with no cost by students and faculty for academic use. Non-academic reproduction
requires payment of royalties through the Copyright Clearance Center, http://www.copyright.com/

420
4. Because B, = .62 and all j8 o + B; + ~J : .33, there is convergent validity.Use of Fisher’s r to z transformation is often recommended to normalize the errors. Even though thetransformation is problematic for correlations above .7 (which often occur in MTMM data), the data werereanalyzed using the transformation. Specifically, the dependent variable used was 1/2 In [( 1 + rij)l(l 1 ---r,j)]. All coefficients retained the same sign and the R2 values were comparable.
Overall, the Kothandapani (1971) data give much stronger evidence of discriminant validity thanthe Ostrom (1969) data. Hence, this procedure seems to provide essentially the same interpretation asthe nested model tests of Widaman (1985), in contrast to that of Bagozzi (1978). Notice also that formalnested model tests are also not only possible but relatively simple with the proposed method. However,running the complete model makes them unnecessary.
Limitations
The method as proposed has two major limitations. First, because the model in Equation 3 is onlya linear approximation of the correlation generating process, the analysis contains some model (specifi-cation) error which can obscure differences. Based on initial investigations of well-behaved datasets, thisappears to be a relatively minor problem.
Second, the tests do not explicitly take into account the sample size involved in the correlations.The model which is estimated is thus:
Measured Correlationi,j = True ~®rr~lati®~;.a + Sampling Err®ri,~ _ 2lBD + Model Error,, , (5)where SBD is the model in Equation 3. Hence the model is essentiallyTrue Correlation,, =XM)+c,, , , (6)where ~1~; is a combination of sampling and model error.
This suggests that for a smaller sample size, sampling error will be larger. Hence, assuming thatsampling error and model error are uncorrelated, small samples will produce more error in the regressionestimates, leading to fewer significant coefficients and hence less evidence of convergent and discriminantvalidity. Future developments may make it possible to explicitly include sample size in the analysis ofthe correlations.
Appendix
of of to theAnalysis-of-Variance Decomposition of ~~~ Scores
Consider a P construct model where each construct is measured by the same M methods. Theobserved score for person k on the ith measured variable which uses method m to assess construct p is
X;~ = B,+B,+C,+D~+~+~+~+~+~ , , (A 1)where Bo is the average score on the items,
Bk is the average score of person k minus the average score of all persons on all items (personeffect), 9
Cp is the average score of items on the pth construct minus the average score of all items (constructeffect), 9
D~ is the average score on the mth method minus the average score on all methods (methodeffect), 9
Ipm is the interaction of the pth construct and the mth method,
Downloaded from the Digital Conservancy at the University of Minnesota, http://purl.umn.edu/93227. May be reproduced with no cost by students and faculty for academic use. Non-academic reproduction
requires payment of royalties through the Copyright Clearance Center, http://www.copyright.com/

421
hk is the interaction effect of construct p and person k,~mk is the interaction effect of method rra and person k,
h~&dquo;~k is the interaction of the pth construct, the mth method, and the kth person, andeik is the random component.
Rewriting, this gives
where 2’L is the mean value on item i. Similarly,
If two constructs p and q are correlated, fpk and f9k will be correlated. Similarly, if two methods are
correlated, gm~ and g&dquo;k will be correlated. Also,
the correlation between two measures is positively related to1. Large construct correlation: Corr(p,~)(Var~)~(Var~)’~2. Large method correlation: Corr(m,n)(Var gm)1I2(Var gn)1I23. Large construct-method correlation: Corr(pm,qn)(Var hpm)1I2(Var hqn)1I24. Small variable variances: Var ei, Var ejA linear approximation of this is given by
where ~Pq = 1 if p and q are the constructs, 0 otherwise;Z,n,, = I if rra and n are the methods, 0 otherwise;
Zpmqn = I if Xi is a measure of construct p by method m and Xj is a measure of construct q bymethod n, 0 otherwise; and
Z~=lif~’~~orj=~,0 otherwise.The number of parameters to be estimated in Equation All is as follows:
Downloaded from the Digital Conservancy at the University of Minnesota, http://purl.umn.edu/93227. May be reproduced with no cost by students and faculty for academic use. Non-academic reproduction
requires payment of royalties through the Copyright Clearance Center, http://www.copyright.com/

422
For three constructs and three methods, this becomes
Because there are only (9 x 8)/2 = 36 correlations, the full model is under-identified. In order tohave an identified model, it is necessary to assume that the correlation of hn&dquo;,k and hy&dquo;~ = 0. This reducesthe model to a manageable size. The assumption means that an individual’s response to a combinationof construct and method is explainable by a main-effects-only model. (Note that selected interactionscould be estimated if a strong a priori reason existed for examining them.)
The model in Equation All thus reduces to
Various nested versions of Equation A17 are also of interest. For example, if it is assumed that thereis no correlation between the effects of methods m and rc (except the common method effect when m_ n), the number of parameters reduces. Comparison of the fit of this model to the fuller model in
Equation A17 provides an approximate test of the reasonableness of this assumption.
References
Anastasi, A. (1968). Psychological testing (3rd ed.).New York: Macmillan.
Anderson, J. C., & Gerbing, D. W. (1982). Some meth-ods for respecifying measurement models to obtainunidimensional construct measurement. Journal ofMarketing Research, 19, 453-460.
Bagozzi, R. P. (1978). The construct validity of affec-tive, behavioral, and cognitive components of attitudeby analysis of covariance structures. Multivariate Be-havioral Research, 13, 9-31.
Bagozzi, R. P. (1980). Causal models in marketing.New York: Wiley.
Bohrnstedt, G. W. (1970). Reliability and validity as-sessment in attitude measurement. In G. F. Summers(Ed.), Attitude measurement. Chicago: Rand-Mc-Nally.
Burt, R. S. (1976). Interpretation confounding of unob-served variables in structural equation models. Soci-ological Methods and Research, 5, 33-52.
Campbell, D. T., & Fiske, D. W. (1959). Convergentand discriminant validity by the multitrait-multi-method matrix. Psychological Bulletin, 56, 1-105.
Fomell, C., & Larker, D. F. (1981). Evaluating struc-tural equation models with unobservable variables andmeasurement error. Journal of Marketing Research,18, 39-50.
Jackson, D. N. (1969). Multimethod factor analysis inthe evaluation of convergent and discriminant validity.Psychological Bulletin, 72, 30-49.
Jackson, D. N. (1975). Multimethod factor analysis: Areformulation. Psychological Bulletin, 75, 421-423.
Jöreskog, K. G. (1971). Statistical analysis of sets ofcongeneric tests. Psychometrika, 36, 109-133.
Jöreskog, K. G., & Sörbom, D. (1979). Advances infactor analysis and structural equation models. Cam-bridge MA: Abe Books.
Kalleberg, A. L., & Klugel, J. R. (1975). Analysis ofthe multitrait-multimethod matrix: Some limitationsand an alternative. Journal of Applied Psychology,60, 1-9.
Kavanaugh, M. J., MacKinney, A. C., & Wolins, L.(1971). Issues in managerial performance: Multitrait-multimethod analyses of ratings. Psychological Bul-letin, 75, 34-39.
Kothandapani, V. (1971). Validation of feeling, belief,and intention to act as three components of attitudeand their contribution to prediction of contraceptivebehavior. Journal of Personality and Social Psychol-ogy, 19, 321-333.
Kumar, A., & Dillon, W. (1986). The interaction ofmeasurement and structure in simultaneous equationmodels with unobservable variables. Unpublishedworking paper.
Lawler, E. E. (1967). The multitrait-multirater approachto measuring managerial performance. Journal of Ap-plied Psychology, 51, 369-381.
Lehmann, D. R. (1974). Some alternatives to linear fac-tor analysis for variable grouping applied to buyer
Downloaded from the Digital Conservancy at the University of Minnesota, http://purl.umn.edu/93227. May be reproduced with no cost by students and faculty for academic use. Non-academic reproduction
requires payment of royalties through the Copyright Clearance Center, http://www.copyright.com/

423
behavior models. Journal of Marketing Research, 11,206-213.
Long, J. S. (1983). Confirmatory factor analysis. Bev-erly Hills CA: Sage.
Nunnally, J. C. (1978). Psychometric theory (2nd ed.).New York: McGraw-Hill.
Ostrom, T. M. (1969). The relationship between theaffective, behavioral and cognitive components of at-titude. Journal of Experimental Social Psychology, 5,12-30.
Schmitt, N., Coyle, B. W., & Saari, B. B. (1977). Areview and critique of analyses of multitrait-multi-method matrices. Multivariate Behavioral Research,12, 447-478.
Schmitt, N., & Stults, D. M. (1986). Methodology re-view : Analysis of multitrait-multimethod matrices.
Applied Psychological Measurement, 10, 1-22.
Sullivan, J. L., & Feldman, S. (1979). Multiple indi-cators. Beverly Hills CA: Sage.
Widaman, K. F. (1985). Hierarchically nested co-
variance structure models for multitrait-multimethoddata. Applied Psychological Measurement, 9, 1-26.
Wold, H. (1980). Soft modeling: Intermediate betweentraditional model building and data analysis. Multi-variate Statistics, 6, 333-346.
Author’s Address
Send requests for reprints or further information to Don-ald R. Lehmann, 507 Uris Hall, Columbia University,New York NY 10027, U.S.A.
Downloaded from the Digital Conservancy at the University of Minnesota, http://purl.umn.edu/93227. May be reproduced with no cost by students and faculty for academic use. Non-academic reproduction
requires payment of royalties through the Copyright Clearance Center, http://www.copyright.com/