an fmri investigation of syllable sequence...
TRANSCRIPT

www.elsevier.com/locate/ynimg
NeuroImage 32 (2006) 821 – 841
An fMRI investigation of syllable sequence production
Jason W. Bohlanda,* and Frank H. Guenthera,b,c
aDepartment of Cognitive and Neural Systems, Boston University, 677 Beacon Street, Boston, MA 02215, USAbDivision of Health Sciences and Technology, Harvard University–Massachusetts Institute of Technology, Cambridge, MA 02139, USAcAthinoula A. Martinos Center for Biomedical Imaging, Massachusetts General Hospital, Charlestown, MA 02129, USA
Received 1 December 2005; revised 24 March 2006; accepted 4 April 2006
Available online 26 May 2006
Fluent speech comprises sequences that are composed from a finite
alphabet of learned words, syllables, and phonemes. The sequencing of
discrete motor behaviors has received much attention in the motor
control literature, but relatively little has been focused directly on
speech production. In this paper, we investigate the cortical and
subcortical regions involved in organizing and enacting sequences of
simple speech sounds. Sparse event-triggered functional magnetic
resonance imaging (fMRI) was used to measure responses to prepara-
tion and overt production of non-lexical three-syllable utterances,
parameterized by two factors: syllable complexity and sequence
complexity. The comparison of overt production trials to preparation
only trials revealed a network related to the initiation of a speech plan,
control of the articulators, and to hearing one’s own voice. This
network included the primary motor and somatosensory cortices,
auditory cortical areas, supplementary motor area (SMA), the
precentral gyrus of the insula, and portions of the thalamus, basal
ganglia, and cerebellum. Additional stimulus complexity led to
increased engagement of the basic speech network and recruitment
of additional areas known to be involved in sequencing non-speech
motor acts. In particular, the left hemisphere inferior frontal sulcus and
posterior parietal cortex, and bilateral regions at the junction of the
anterior insula and frontal operculum, the SMA and pre-SMA, the
basal ganglia, anterior thalamus, and the cerebellum showed increased
activity for more complex stimuli. We hypothesize mechanistic roles for
the extended speech production network in the organization and
execution of sequences of speech sounds.
D 2006 Elsevier Inc. All rights reserved.
Keywords: Speech production; Sequencing; fMRI; Language; Motor
control
Introduction
Fluent speech requires a robust serial ordering mechanism to
combine a finite set of discrete learned phonological units (such as
phonemes or syllables) into larger meaningful expressions of
1053-8119/$ - see front matter D 2006 Elsevier Inc. All rights reserved.
doi:10.1016/j.neuroimage.2006.04.173
* Corresponding author.
E-mail address: [email protected] (J.W. Bohland).
Available online on ScienceDirect (www.sciencedirect.com).
words and sentences. Lashley (1951) posed the problem of serial
order in behavior, asking how the brain organizes and executes
smooth, temporally integrated behaviors such as speech and
rhythmic motor control. His proposal for the ‘‘priming of
expressive units,’’ or parallel, co-temporal activation of the items
in a behavioral sequence prior to execution, has been supported in
studies of speech production by bountiful data related to linguistic
performance errors (e.g., MacKay, 1970; Fromkin, 1980; Gordon
and Meyer, 1987), by reaction time experiments (e.g., Klapp,
2003), and by the demonstration of anticipatory and perseveratory
co-articulation (e.g., Ohman, 1966; Hardcastle and Hewlett, 1999).
The problem of serial order in speech production can be
considered at multiple levels. Phonemes, for example, might be
manipulated to form syllables and words, where each phonemic
token is learned and stored with corresponding auditory and/or
orosensory consequences (see, for example, the DIVA model of
speech production; Guenther, 1995; Guenther et al., 2006, which
provides a computational account for how such tokens can be
learned and produced). Data also suggest that syllable or word-
sized tokens can be learned such that they may be efficiently
executed as single motor chunks, forming a mental syllabary
(Levelt and Wheeldon, 1994; Levelt et al., 1999; Cholin et al.,
2006); these larger chunks might then serve as manipulable tokens
for speech sequence planning.
In addition to organizing sequences of planned sounds within a
memory buffer, speech production requires a mechanism to initiate
or release items to the motor apparatus at precise times. Speakers
can typically produce up to six to nine syllables (20 to 30
segments) per second, which is faster than any other form of
discrete motor behavior (Kent, 2000). A system that coordinates
the timed release of each discrete item in the planned sequence of
speech is, therefore, of critical importance to fluent performance.
While the formulation of spoken language plans has been
widely studied at a conceptual level (see, e.g., Levelt, 1989; Levelt
et al., 1999), relatively little is known about the neural representa-
tions of those plans or about the cortical and subcortical machinery
that guides the serial production of speech. Clinical studies have
suggested that damage to the anterior insula or neighboring inferior
frontal areas (Dronkers, 1996; Hillis et al., 2005; Tanji et al., 2001),
supplementary motor area (Jonas, 1981, 1987; Ziegler et al., 1997;
J.W. Bohland, F.H. Guenther / NeuroImage 32 (2006) 821–841822
Pai, 1999), basal ganglia (Pickett et al., 1998; Ho et al., 1998), or
cerebellum (Riva, 1998; Silveri et al., 1998) may lead to deficits in
sequencing and/or initiation of speech plans. Such deficits appear
in various aphasias and apraxia of speech (AOS). Literal or
phonemic paraphasias, in which ‘‘well-formed sounds or syllables
are substituted or transposed in an otherwise recognizable target
word’’ (Goodglass, 1993), exist in many aphasic patients including
Broca’s and (most commonly) conduction aphasics. AOS, a
speech-motor condition1, has been attributed to damage to the left
precentral gyrus of the insula (Dronkers, 1996), as well as the
inferior frontal gyrus, subcortical structures, or posterior temporal/
parietal regions (Hillis et al., 2005; Peach and Tonkovich, 2004;
Duffy, 1995). Ziegler (2002) presents an excellent review of
theoretical models of AOS.
Only a small portion of the large functional neuroimaging
literature related to speech and language has dealt with overt
speech production. Within that body, very few studies have
explicitly addressed sequencing demands during overt speech.
Riecker et al. (2000b) examined brain activations evoked by
repetitive production of stimuli of varying complexity: conso-
nant vowel syllables (CVs), CCCVs, CVCVCV non-word
sequences, and CVCVCV words. This study found that
production of none of the stimulus types (compared to a resting
baseline condition) resulted in significant activations in the
SMA or insula; activation was instead largely restricted to the
primary sensorimotor areas. Only CCCV production led to
significant activation of the cerebellum. Production of the multi-
syllabic items led to a more limited and lateralized expanse of
activation in the banks of the central sulcus than did production
of single syllables.
Shuster and Lemieux (2005) compared production (both
overt and covert) of multi-syllabic and mono-syllabic words
following the presentation of an auditory exemplar. For overt
speech, additional activation was found in the left inferior
parietal lobe, inferior frontal gyrus, and precentral gyrus for
multi-syllabic versus mono-syllabic words. Mono-syllabic words
resulted in greater activation of the left middle frontal gyrus
(BA46). The results for covert speech were somewhat dissim-
ilar; for example, in covert speech, there was greater activation
of the left middle frontal gyrus for multi-syllable words and
greater activation in the left precentral gyrus for mono-syllable
words. A consistent finding was that multi-syllable words
caused additional activation in left inferior parietal areas
(BA40), a region the authors suggest to be involved in speech
programming. In comparing the results of this study to that of
Riecker et al. (2000b), it is difficult to develop a consistent
account for the effects of sequential complexity on the speech
production system.
In the present experiment, we sought to clarify how the
speech system organizes and produces sequences of speech
sounds. While the DIVA model of speech production makes
predictions about brain activations in the executive speech
1 Apraxia of speech (AOS) as described by Darley et al. (1975) is a
unique syndrome that affects motor speech production without diminished
muscle strength. AOS has been associated with phoneme substitution errors
similar to literal paraphasias (e.g., Wertz et al., 1984). The existence of AOS
as a unique disorder, however, has been controversial (see Helm-
Estabrooks, 2002) with some clinicians arguing that the condition actually
reflects articulatory deficits associated with aphasia (e.g., Goodglass, 1993).
motor system (Guenther et al., 2006; in press), it does not
address brain regions likely to be responsible for sequence
planning. Based on clinical observations and studies of other
non-speech sequential motor control tasks, we expected to
observe additional responses to additional stimulus complexity
in a network of brain regions outside of the primary
sensorimotor areas (and other regions treated by the DIVA
model), including the prefrontal cortex, basal ganglia, anterior
insula, supplementary motor area, and cerebellum. Blood
oxygenation level-dependent (BOLD) functional magnetic reso-
nance imaging (fMRI; see Ogawa et al., 1990; Belliveau et al.,
1991; Kwong et al., 1992) was used to measure responses to
speech sequences of varying complexity at both the sub- and
suprasyllabic levels and in both preparatory and overt speech
production tasks. We employed an ‘‘event-triggered’’ design
with GO and NOGO trials that offered many benefits over
previous methods (see Discussion). We discuss the results in
terms of the necessary mechanisms for sequencing and initiation
in fluent speech production.
Materials and methods
Subjects
Thirteen right-handed native English speakers (ages 22–50
years, mean 28.7 years, six females) with no history of
neurological, speech, language, or hearing disorders participated.
Written informed consent was obtained according to the Boston
University Institutional Review Board and the Massachusetts
General Hospital Human Research Committee.
Experimental protocol
Tasks consisted of preparing to produce (NOGO trials) and
overtly producing (GO trials) three syllable sequences. The
linguistic content of the stimuli was specified by two factors:
syllable complexity (syl) and sequence complexity (seq). Each
factor assumed one of two levels (simple or complex), creating
a 2 � 2 matrix of stimulus types (see Fig. 1). Each type was
used in GO and NOGO trials, resulting in a full 2 � 2 � 2
factorial design. This third factor is referred to as go. A
baseline stimulus (three ‘‘xxx’’ syllables) informed the subject
that there was no speech to be planned or produced, but that
(s)he should maintain fixation throughout the trial.
80 stimuli were presented in each (¨20 min) functional run2.
Subjects were asked to complete three runs. For two subjects,
only two runs were used due to technical difficulties. Each trial
began with the visual (orthographic) presentation of a stimulus.
After 2.5 s, the syllables were replaced by a white fixation cross.
Subjects were instructed to maintain fixation and to prepare to
speak the syllable sequence that they had just read. In GO trials,
after a short random duration (0.5–2.0 s), the white cross turned
green, signaling the subject to immediately produce the prepared
sequence. Subjects were instructed to speak at a typical volume
and rate and to avoid prosodic modulation. The scanner remained
silent throughout the 2.5-s production period and was then
2 One subject performed 100 stimuli per run; all other aspects were
equivalent to other subjects’ sessions.

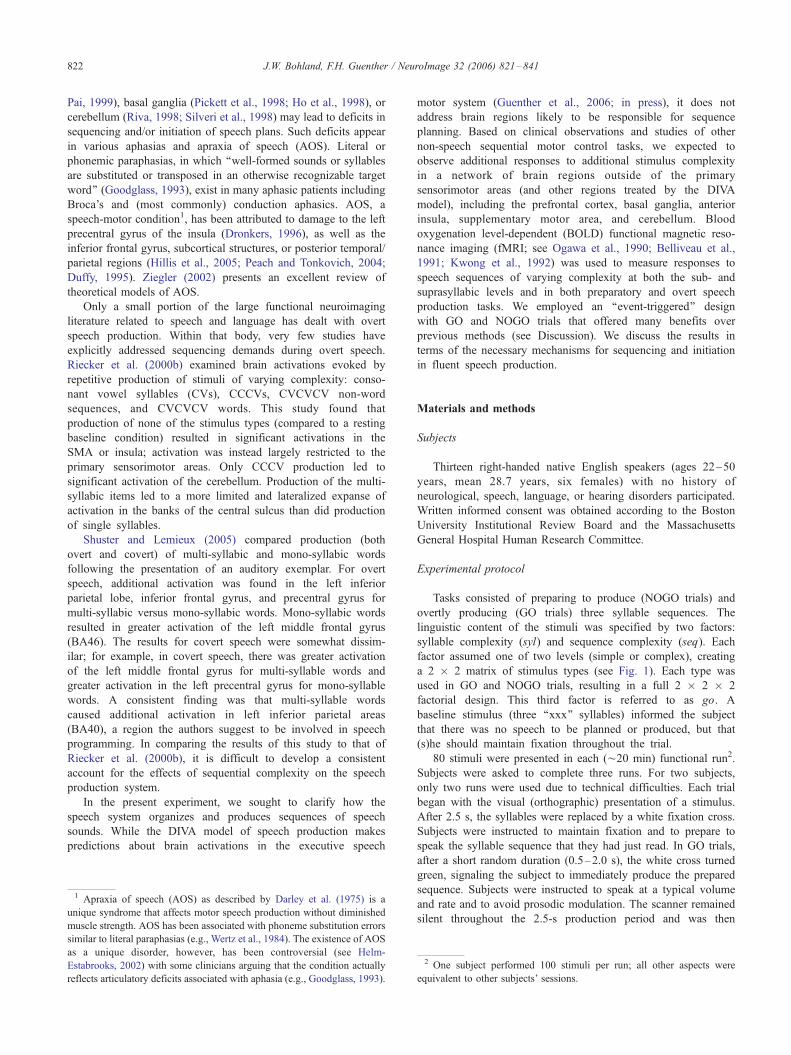
Fig. 1. Speech sequence stimuli. Sequences were each composed of three
syllables separated by hyphens. Four stimulus types were used; a schema
for the construction of each type, as well as an example, is shown in the
boxes above. Simple sequences (S_seq) were repetitions of the same
syllable three times; complex sequences (C_seq) contained three unique
syllables. A similar complexity parameterization has been used to
demonstrate sequence-related effects in previous studies using finger
movements (e.g., Shibasaki et al., 1993; Gerloff et al., 1997). At the
syllabic level, simple syllables (S_syl) were composed of a single consonant
and a vowel (CV), whereas complex syllables (C_syl) began with a
consonant cluster (CCCVor CCV) followed by a vowel. All syllables could
be easily produced in English; consonants used in S_syl were a subset of
those used in C_syl {/s/, /p/, /t/, /k/, /r/, /l/}, and all vowels were chosen
randomly from {/a/, /i/, /u/}. Each stimulus type was used in both GO and
NOGO trials.
J.W. Bohland, F.H. Guenther / NeuroImage 32 (2006) 821–841 823
triggered to acquire three functional volumes3 (details below). In
NOGO trials, the fixation cross remained white throughout.
Because of the time jitter preceding the production period,
subjects were unable to differentiate GO and NOGO trials until
scanning began. After the third volume acquisition, the fixation
cross was replaced by the next stimulus. The mean inter-trial
interval was 13.75 s. Vocal responses were recorded using an
MRI-compatible microphone. Utterance durations were estimated
from the recorded signals, and means for each subject and
condition were entered into paired t tests to assess significant
differences across conditions. Trials containing errors were
removed from the study.
Data acquisition
Subjects lay supine in a 3-T Siemens Trio whole-body scanner
with a Bruker head coil. Foam padding applied between the
subject’s head and the coil helped to constrain head movement. A
high-resolution anatomical volume (T1-weighted, 128 sagittal
images, 256 � 256 matrix, 1 mm2 in-plane resolution, 1.33-mm
slice thickness, TR = 2530 ms, TE = 3.3 ms, flip angle 9-) wasacquired for each subject. Functional images were acquired
sparsely in three-volume clusters, triggered by digital pulses sent
from the stimulus computer. 30 axial slices (5-mm thickness, 0-mm
gap, 64 � 64 matrix, 3.125-mm2 in-plane resolution) oriented
parallel to the line between the anterior and posterior commissures
were acquired in each volume using a T2*-weighted gradient echo
pulse sequence (TR = 2500 ms, TE = 30 ms, flip angle 90-). Theseslices were sufficient to cover the entire brain in all subjects. AT1-
3 In GO trials, the first volume was acquired between 2.5 s and 5.0 s after
the GO signal. Due to the hemodynamic delay (peaking ¨5–6 s after task
performance; Birn et al., 1999), the response in this volume is likely to be
similar to the response to the NOGO task. The second and third volumes,
however, are time aligned to capture the peak of the response to the GO task
(5.0 to 10.0 s after the GO signal).
weighted anatomical volume was also acquired using the same
slice parameters as the functional images and was used for
between-modality co-registration.
Data analysis
Functions from SPM2 (Wellcome Department of Imaging
Neuroscience, London, UK) were used for pre-processing and
voxel-based analyses. Functional series were realigned by
estimating the parameters of a rigid-body transformation; these
coefficients were also included as covariates of non-interest
during model estimation. Images were then co-registered to the
anatomical scans, spatially normalized to a template in Montreal
Neurological Institute (MNI) space (Evans et al., 1993), and
smoothed using an isotropic Gaussian kernel with full width at
half-maximum (FWHM) of 8 mm. Stimulus events were
modeled as delta functions, and the hemodynamic response at
each event was estimated using a finite impulse response (FIR)
model with a single time bin. Differences in the global signal
level between the three functional volumes in each acquisition
cluster were accounted for through linear regression.
A mixed-effects analysis was used. Models were estimated for
each subject. A non-parametric permutation test (Nichols and
Holmes, 2001) was used to assess effects across subjects. Using
the assumption of exchangeability, condition labels were randomly
permuted for each subject, resulting in 2# of subjects = 8192
permutations for each contrast. Significance was determined by
comparing a test statistic for the ‘‘correct’’ labeling to the distribution
of that statistic across all permutations. Variance estimates for each
voxel were pooled across a 4 � 4 � 4-mm3 volume.
A region-of-interest (ROI) analysis was performed (Nieto-
Castanon et al., 2003) to provide supplementary information
about the size and significance of effects in specific, anatom-
ically defined cortical areas. FreeSurfer was used to reconstruct
cortical surfaces from each subject’s anatomical scan (Dale et
al., 1999; Fischl et al., 1999) and was trained to perform
cortical parcellation (Fischl et al., 2004) according to a scheme
based on anatomical landmarks and node points that was
developed for speech-related studies (Tourville and Guenther,
2003). Previous tests revealed that the average overlap between
regions assigned by FreeSurfer and regions assigned by a
trained neuroanatomist was approximately 74%, with most
errors occurring near region boundaries (S.S. Ghosh, 2005,
personal communication). Data from each region and subject
were extracted, reduced using a Fourier basis set, and smoothed
with an isotropic Gaussian kernel with FWHM of 12 mm. A
mixed-effects analysis used the same design matrices as in the
voxel-based analysis. Effects related to a particular contrast were
considered significant for P < 0.001. The ROI tools were also
used when possible to test for lateralization in particular ROIs.
The effect sizes estimated for each subject in the left and right
hemisphere for a particular ROI were entered into a paired t
test. Lateralization was considered significant for P < 0.05.
Each of the individual speaking conditions was contrasted with
the baseline condition. For these contrasts, the False Discovery Rate
(FDR) method (Benjamini and Hochberg, 1995; Genovese et al.,
2002) was used to correct for multiple comparisons. A minimal
speech production network was established by combining the
statistical images for each overt speaking condition using a
conjunction approach based on the ‘‘conjunction null’’ hypothesis
(Nichols et al., 2005). A factorial analysis was used to estimate
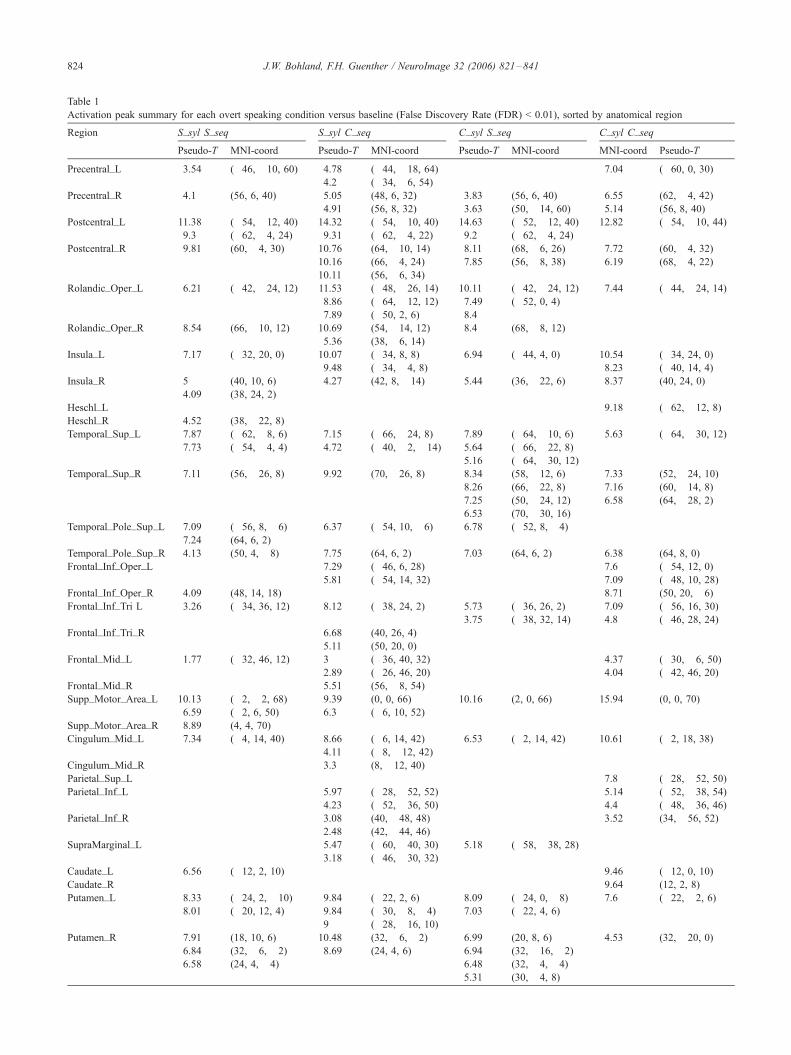
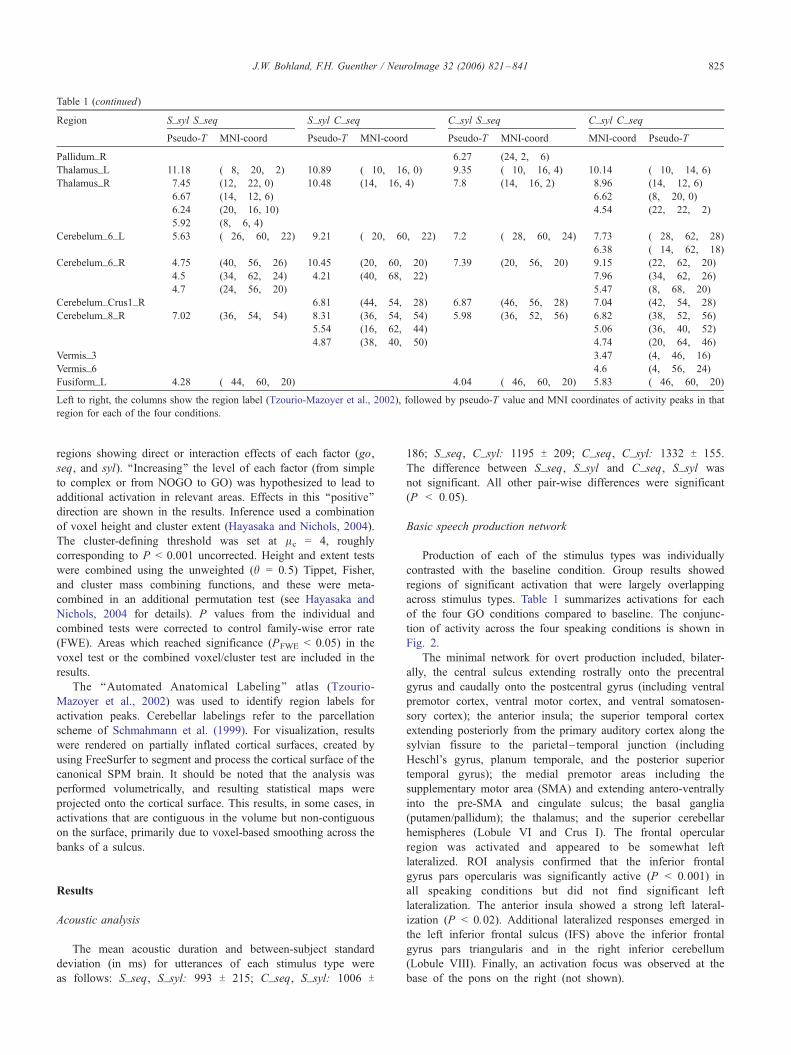
Table 1
Activation peak summary for each overt speaking condition versus baseline (False Discovery Rate (FDR) < 0.01), sorted by anatomical region
Region S_syl S_seq S_syl C_seq C_syl S_seq C_syl C_seq
Pseudo-T MNI-coord Pseudo-T MNI-coord Pseudo-T MNI-coord MNI-coord Pseudo-T
Precentral_L 3.54 (�46, �10, 60) 4.78 (�44, �18, 64) 7.04 (�60, 0, 30)4.2 (�34, �6, 54)
Precentral_R 4.1 (56, 6, 40) 5.05 (48, 6, 32) 3.83 (56, 6, 40) 6.55 (62, �4, 42)4.91 (56, 8, 32) 3.63 (50, �14, 60) 5.14 (56, 8, 40)
Postcentral_L 11.38 (�54, �12, 40) 14.32 (�54, �10, 40) 14.63 (�52, �12, 40) 12.82 (�54, �10, 44)9.3 (�62, �4, 24) 9.31 (�62, �4, 22) 9.2 (�62, �4, 24)
Postcentral_R 9.81 (60, �4, 30) 10.76 (64, �10, 14) 8.11 (68, �6, 26) 7.72 (60, �4, 32)10.16 (66, �4, 24) 7.85 (56, �8, 38) 6.19 (68, �4, 22)10.11 (56, �6, 34)
Rolandic_Oper_L 6.21 (�42, �24, 12) 11.53 (�48, �26, 14) 10.11 (�42, �24, 12) 7.44 (�44, �24, 14)8.86 (�64, �12, 12) 7.49 (�52, 0, 4)7.89 (�50, 2, 6) 8.4
Rolandic_Oper_R 8.54 (66, �10, 12) 10.69 (54, �14, 12) 8.4 (68, �8, 12)5.36 (38, �6, 14)
Insula_L 7.17 (�32, 20, 0) 10.07 (�34, 8, 8) 6.94 (�44, 4, 0) 10.54 (�34, 24, 0)9.48 (�34, �4, 8) 8.23 (�40, 14, 4)
Insula_R 5 (40, 10, 6) 4.27 (42, 8, �14) 5.44 (36, �22, 6) 8.37 (40, 24, 0)
4.09 (38, 24, 2)
Heschl_L 9.18 (�62, �12, 8)Heschl_R 4.52 (38, �22, 8)Temporal_Sup_L 7.87 (�62, �8, 6) 7.15 (�66, �24, 8) 7.89 (�64, �10, 6) 5.63 (�64, �30, 12)
7.73 (�54, �4, 4) 4.72 (�40, �2, �14) 5.64 (�66, �22, 8)5.16 (�64, �30, 12)
Temporal_Sup_R 7.11 (56, �26, 8) 9.92 (70, �26, 8) 8.34 (58, �12, 6) 7.33 (52, �24, 10)8.26 (66, �22, 8) 7.16 (60, �14, 8)7.25 (50, �24, 12) 6.58 (64, �28, 2)6.53 (70, �30, 16)
Temporal_Pole_Sup_L 7.09 (�56, 8, �6) 6.37 (�54, 10, �6) 6.78 (�52, 8, �4)7.24 (64, 6, 2)
Temporal_Pole_Sup_R 4.13 (50, 4, �8) 7.75 (64, 6, 2) 7.03 (64, 6, 2) 6.38 (64, 8, 0)
Frontal_Inf_Oper_L 7.29 (�46, 6, 28) 7.6 (�54, 12, 0)5.81 (�54, 14, 32) 7.09 (�48, 10, 28)
Frontal_Inf_Oper_R 4.09 (48, 14, 18) 8.71 (50, 20, �6)Frontal_Inf_Tri L 3.26 (�34, 36, 12) 8.12 (�38, 24, 2) 5.73 (�36, 26, 2) 7.09 (�56, 16, 30)
3.75 (�38, 32, 14) 4.8 (�46, 28, 24)Frontal_Inf_Tri_R 6.68 (40, 26, 4)
5.11 (50, 20, 0)
Frontal_Mid_L 1.77 (�32, 46, 12) 3 (�36, 40, 32) 4.37 (�30, �6, 50)2.89 (�26, 46, 20) 4.04 (�42, 46, 20)
Frontal_Mid_R 5.51 (56, �8, 54)Supp_Motor_Area_L 10.13 (�2, �2, 68) 9.39 (0, 0, 66) 10.16 (2, 0, 66) 15.94 (0, 0, 70)
6.59 (�2, 6, 50) 6.3 (�6, 10, 52)Supp_Motor_Area_R 8.89 (4, 4, 70)
Cingulum_Mid_L 7.34 (�4, 14, 40) 8.66 (�6, 14, 42) 6.53 (�2, 14, 42) 10.61 (�2, 18, 38)4.11 (�8, �12, 42)
Cingulum_Mid_R 3.3 (8, �12, 40)Parietal_Sup_L 7.8 (�28, �52, 50)Parietal_Inf_L 5.97 (�28, �52, 52) 5.14 (�52, �38, 54)
4.23 (�52, �36, 50) 4.4 (�48, �36, 46)Parietal_Inf_R 3.08 (40, �48, 48) 3.52 (34, �56, 52)
2.48 (42, �44, 46)SupraMarginal_L 5.47 (�60, �40, 30) 5.18 (�58, �38, 28)
3.18 (�46, �30, 32)Caudate_L 6.56 (�12, 2, 10) 9.46 (�12, 0, 10)Caudate_R 9.64 (12, 2, 8)
Putamen_L 8.33 (�24, 2, �10) 9.84 (�22, 2, 6) 8.09 (�24, 0, �8) 7.6 (�22, �2, 6)8.01 (�20, 12, 4) 9.84 (�30, �8, �4) 7.03 (�22, 4, 6)
9 (�28, �16, 10)Putamen_R 7.91 (18, 10, 6) 10.48 (32, �6, �2) 6.99 (20, 8, 6) 4.53 (32, �20, 0)
6.84 (32, �6, �2) 8.69 (24, 4, 6) 6.94 (32, �16, �2)6.58 (24, 4, �4) 6.48 (32, �4, �4)
5.31 (30, �4, 8)
J.W. Bohland, F.H. Guenther / NeuroImage 32 (2006) 821–841824
Region S_syl S_seq S_syl C_seq C_syl S_seq C_syl C_seq
Pseudo-T MNI-coord Pseudo-T MNI-coord Pseudo-T MNI-coord MNI-coord Pseudo-T
Pallidum_R 6.27 (24, 2, �6)Thalamus_L 11.18 (�8, �20, �2) 10.89 (�10, �16, 0) 9.35 (�10, �16, 4) 10.14 (�10, �14, 6)Thalamus_R 7.45 (12, �22, 0) 10.48 (14, �16, 4) 7.8 (14, �16, 2) 8.96 (14, �12, 6)
6.67 (14, �12, 6) 6.62 (8, �20, 0)6.24 (20, �16, 10) 4.54 (22, �22, �2)5.92 (8, �6, 4)
Cerebelum_6_L 5.63 (�26, �60, �22) 9.21 (�20, �60, �22) 7.2 (�28, �60, �24) 7.73 (�28, �62, �28)6.38 (�14, �62, �18)
Cerebelum_6_R 4.75 (40, �56, �26) 10.45 (20, �60, �20) 7.39 (20, �56, �20) 9.15 (22, �62, �20)4.5 (34, �62, �24) 4.21 (40, �68, �22) 7.96 (34, �62, �26)4.7 (24, �56, �20) 5.47 (8, �68, �20)
Cerebelum_Crus1_R 6.81 (44, �54, �28) 6.87 (46, �56, �28) 7.04 (42, �54, �28)Cerebelum_8_R 7.02 (36, �54, �54) 8.31 (36, �54, �54) 5.98 (36, �52, �56) 6.82 (38, �52, �56)
5.54 (16, �62, �44) 5.06 (36, �40, �52)4.87 (38, �40, �50) 4.74 (20, �64, �46)
Vermis_3 3.47 (4, �46, �16)Vermis_6 4.6 (4, �56, �24)Fusiform_L 4.28 (�44, �60, �20) 4.04 (�46, �60, �20) 5.83 (�46, �60, �20)Left to right, the columns show the region label (Tzourio-Mazoyer et al., 2002), followed by pseudo-T value and MNI coordinates of activity peaks in that
region for each of the four conditions.
Table 1 (continued)
J.W. Bohland, F.H. Guenther / NeuroImage 32 (2006) 821–841 825
regions showing direct or interaction effects of each factor (go,
seq, and syl). ‘‘Increasing’’ the level of each factor (from simple
to complex or from NOGO to GO) was hypothesized to lead to
additional activation in relevant areas. Effects in this ‘‘positive’’
direction are shown in the results. Inference used a combination
of voxel height and cluster extent (Hayasaka and Nichols, 2004).
The cluster-defining threshold was set at lc = 4, roughly
corresponding to P < 0.001 uncorrected. Height and extent tests
were combined using the unweighted (h = 0.5) Tippet, Fisher,
and cluster mass combining functions, and these were meta-
combined in an additional permutation test (see Hayasaka and
Nichols, 2004 for details). P values from the individual and
combined tests were corrected to control family-wise error rate
(FWE). Areas which reached significance (PFWE < 0.05) in the
voxel test or the combined voxel/cluster test are included in the
results.
The ‘‘Automated Anatomical Labeling’’ atlas (Tzourio-
Mazoyer et al., 2002) was used to identify region labels for
activation peaks. Cerebellar labelings refer to the parcellation
scheme of Schmahmann et al. (1999). For visualization, results
were rendered on partially inflated cortical surfaces, created by
using FreeSurfer to segment and process the cortical surface of the
canonical SPM brain. It should be noted that the analysis was
performed volumetrically, and resulting statistical maps were
projected onto the cortical surface. This results, in some cases, in
activations that are contiguous in the volume but non-contiguous
on the surface, primarily due to voxel-based smoothing across the
banks of a sulcus.
Results
Acoustic analysis
The mean acoustic duration and between-subject standard
deviation (in ms) for utterances of each stimulus type were
as follows: S_seq, S_syl: 993 T 215; C_seq, S_syl: 1006 T
186; S_seq, C_syl: 1195 T 209; C_seq, C_syl: 1332 T 155.
The difference between S_seq, S_syl and C_seq, S_syl was
not significant. All other pair-wise differences were significant
(P < 0.05).
Basic speech production network
Production of each of the stimulus types was individually
contrasted with the baseline condition. Group results showed
regions of significant activation that were largely overlapping
across stimulus types. Table 1 summarizes activations for each
of the four GO conditions compared to baseline. The conjunc-
tion of activity across the four speaking conditions is shown in
Fig. 2.
The minimal network for overt production included, bilater-
ally, the central sulcus extending rostrally onto the precentral
gyrus and caudally onto the postcentral gyrus (including ventral
premotor cortex, ventral motor cortex, and ventral somatosen-
sory cortex); the anterior insula; the superior temporal cortex
extending posteriorly from the primary auditory cortex along the
sylvian fissure to the parietal– temporal junction (including
Heschl’s gyrus, planum temporale, and the posterior superior
temporal gyrus); the medial premotor areas including the
supplementary motor area (SMA) and extending antero-ventrally
into the pre-SMA and cingulate sulcus; the basal ganglia
(putamen/pallidum); the thalamus; and the superior cerebellar
hemispheres (Lobule VI and Crus I). The frontal opercular
region was activated and appeared to be somewhat left
lateralized. ROI analysis confirmed that the inferior frontal
gyrus pars opercularis was significantly active (P < 0.001) in
all speaking conditions but did not find significant left
lateralization. The anterior insula showed a strong left lateral-
ization (P < 0.02). Additional lateralized responses emerged in
the left inferior frontal sulcus (IFS) above the inferior frontal
gyrus pars triangularis and in the right inferior cerebellum
(Lobule VIII). Finally, an activation focus was observed at the
base of the pons on the right (not shown).

Fig. 2. Minimal speech production network. These renderings show the conjunction of activations in the four overt speaking (GO) conditions compared to
baseline. The map was thresholded to control false discovery rate at 5%. The color scale represents significance level ( P value) of activations, and results are
rendered using a logarithmic scale (�log10 (P)). Left: Significant activity rendered on semi-inflated cortical surface. Dark gray cortical areas represent sulci,
lighter gray areas are gyri. Right: Significant activations rendered on coronal slices through the cerebellum at various depths. Anatomical sections are cropped
versions of the canonical SPM T1 image and follow neurological conventions (right hemisphere on the right side of image); y values refer to planes in MNI-
space. The color scale is common to both cortical and cerebellar renderings.
J.W. Bohland, F.H. Guenther / NeuroImage 32 (2006) 821–841826
Main effect of overt production
Fig. 3 shows the main effect of overt production (GO > NOGO;
PFWE < 0.05)4. GO trials resulted in significantly increased
responses bilaterally in the primary motor and somatosensory
cortices, the superior temporal plane, the anterior insula, and the
medial premotor areas, particularly focused in the supplementary
motor area near the superior convexity, but also including portions
of the pre-SMA and anterior cingulate sulcus. ROI analysis
confirmed that both the SMA and pre-SMA bilaterally were more
active for GO than for NOGO trials. The anterior cingulate showed
the same trend but was not significant. No active cortical ROIs
showed significant lateralization for the effect of go. Subcortically,
the putamen/globus pallidus and two regions of the thalamus (one
anterior, one posterior) showed an additional bilateral response.
The superior cerebellar cortices (Lobule VI) bilaterally were more
active for GO trials, as was a small region in the right inferior
cerebellum (anterior Lobule VIII). This latter region was signif-
icant in the voxel based test but not in combined voxel-cluster
inference. Table 2 summarizes activations for the main effect of
go.
4 The results shown for main effects and interactions are unidirectional
according to the hypothesis that increasing the level of a factor will
result in an increase in BOLD response. Regions that showed significant
activations in the other direction were typically not active in the
baseline contrasts and not areas for which we had a priori hypotheses.
Discussion of these areas, which included the angular gyrus, precuneus,
and anterior prefrontal regions, is therefore omitted for the sake of
brevity.
Main effect of sequence complexity
Fig. 4 shows the main effect of sequence complexity (C_seq >
S_seq; PFWE < 0.05). The medial premotor areas were more active
bilaterally for complex sequences. Region-level testing showed an
effect in both hemispheres in the pre-SMA but no effect in the
SMA or anterior cingulate. The lateral frontal cortex, including
premotor and prefrontal areas and extending along the inferior
frontal sulcus was also more active. These activations were
strikingly left lateralized in the voxel-based results. The laterali-
zation test for the ventral premotor cortex and the inferior frontal
gyrus pars opercularis showed very strong left lateralization (P <
0.001); however, none of the ROIs in the parcellation scheme
(Tourville and Guenther, 2003) corresponded well to the inferior
frontal sulcus region, and thus, we could not explicitly test this
using the ROI tools. Regions at the junction of the anterior insula
and the frontal operculum were engaged bilaterally by sequence
complexity. The ROI analysis confirmed that the activation
included both the anatomically defined anterior insula and frontal
operculum (P < 0.001). The effect was significantly greater in the
left anterior insula than in the right; no such lateralization effect
was found in the frontal operculum. The posterior parietal lobe, left
lateralized (P < 0.05), and the inferior posterior temporal lobes
also showed the sequence complexity effect. The cerebellum
demonstrated strong effects bilaterally (although somewhat stron-
ger in the right hemisphere) in the superior areas (Lobule VI, Crus
I, Crus II) and unilaterally in the right inferior cerebellar cortex
(Lobule VIII). The superior cerebellar activations extended more
laterally than those related to the main effect of go (see above) and
also included portions of the vermis. The anterior thalamus and

Fig. 3. Main effect of overt production: areas that showed a significantly greater response for GO trials than for NOGO trials, averaged across other factors. The
statistical image was thresholded at PFWE < 0.05. Color scale represents voxel-wise pseudo-T value for significant voxels. See Materials and methods for
further details. Left: Significant activity rendered on semi-inflated cortical surface. Dark gray cortical areas represent sulci, lighter gray areas are gyri. Right:
Significant activations rendered on coronal slices through the cerebellum at various depths. Anatomical sections are cropped versions of the canonical SPM T1
image and follow neurological conventions (right hemisphere on the right side of image); y values refer to planes in MNI-space. The color scale is common to
both cortical and cerebellar renderings.
J.W. Bohland, F.H. Guenther / NeuroImage 32 (2006) 821–841 827
caudate nucleus also showed a main effect for sequence com-
plexity bilaterally. Table 3 summarizes activations for the main
effect of seq.
Main effect of syllable complexity
Fig. 5 shows the main effect of syllable complexity (C_syl >
S_syl; PFWE < 0.05). The medial premotor areas showed additional
activation in the voxel-based analysis; region-level testing showed
a significant effect isolated to the pre-SMA bilaterally, with no
significant difference in the effect size between hemispheres. The
junction of the frontal operculum and anterior insula was engaged
bilaterally; in the ROI test, the effect was significant in the
anatomically defined frontal operculum (FO) in both hemispheres,
but the effect was below significance in the anterior insula in
both hemispheres. Additionally, the left posterior parietal cortex,
near the intraparietal and postcentral sulci demonstrated an effect
due to syl. Cerebellar effects were much more focal when com-
pared with the effect of seq, with significant increased activity
limited to the right superior cerebellar cortex (Lobule VI) near the
vermis, and generally posterior to the areas showing an effect of
seq (see Fig. 4). Table 4 summarizes activations for the main
effect of syl.
Interactions between factors
No significant (PFWE < 0.05) interaction effects were found
for go � seq, go � syl, or for the three-way interaction go �seq � syl. There was, however, a strong interaction between the
factors seq and syl. Fig. 6 shows brain areas that demonstrated
a significant positive direction interaction between sequence
complexity and syllable complexity (i.e., {C_syl,C_seq�C_syl,S_seq} > {S_syl,C_seq�S syl,S seq}). These areas included
the medial premotor cortices (SMA/pre-SMA/cingulate sulcus),
the junction of the frontal operculum and anterior insula
bilaterally, the left posterior parietal cortex, the anterior
thalamus, the superior cerebellum, and regions of the precentral
gyrus and prefrontal cortex in and surrounding the inferior
frontal sulcus, primarily in the left hemisphere. Results from
region-level testing showed that the medial activations only
produced a significant effect in the pre-SMA (and not SMA),
bilaterally. The effects in the ventral premotor cortex, inferior
frontal gyrus pars opercularis, and superior parietal lobe were
significantly (P < 0.05) left lateralized. Table 5 summarizes
activations for the seq � syl interaction. A further investigation
of interactions between syl and seq is also available in the
online Supplementary materials.
Discussion
In this study, we sought to better understand the neural
substrates for planning and producing sequences of simple speech
sounds, a faculty that is ubiquitous in normal discourse. This topic
has received relatively little attention in the neuroimaging literature
to date, with most studies of language production focusing on
aspects of word generation and production (reviewed in Indefrey
and Levelt, 2000; Turkeltaub et al., 2002) or on other aspects of

Table 2
Significant ( P < 0.05, corrected for multiple comparisons) activation peak summary for the main effect of overt production (GO > NOGO)
Cluster size P (combo) P (cluster) P (voxel) Pseudo-T MNI (x, y, z) Region label
3682 0.00037 0.00171 0.00012 13.14092 (�54, �12, 40) Postcentral_L
0.00012 11.95341 (�44, �24, 12) Rolandic_Oper_L
0.00037 10.31301 (�64, �8, 20) Postcentral_L
0.00037 9.89571 (�62, �6, 4) Temporal Sup_L
0.01318 6.81526 (�48, �16, 2) Heschl_L
0.01648 6.62541 (�50, 10, �6) Temporal_Pole_Sup_L
0.02441 6.29443 (�60, �30, 12) Temporal_Sup_L
0.02454 6.28383 (�44, 6, �2) Insula_L
0.02966 6.1484 (�48, �14, 60) Precentral_L
6079 0.00037 0.00073 0.00024 11.59105 (60, �12, 10) Rolandic_Oper_R
0.00037 9.79065 (64, 8, 0) Temporal_Pole_Sup_R
0.00122 8.48157 (62, �4, 28) Postcentral_R
0.00122 8.35654 (50, �22, 12) Rolandic_Oper_R
0.00281 7.87694 (12, �16, 4) Thalamus_R
0.00378 7.78941 (46, �14, 0) Temporal_Sup_R
0.00378 7.74591 (0, �6, 12) Thalamus_Mid
0.0127 6.83599 (10, 0, 10) Caudate_R
0.01379 6.72545 (68, �26, 4) Temporal_Sup_R
0.01917 6.49536 (�10, �16, 4) Thalamus_L
0.03809 5.98882 (�24, 0, �8) Putamen_L
0.04089 5.93748 (�20, 4, 2) Pallidum_L
0.06079 5.68653 (30, 0, �6) Putamen_R
0.08899 5.38535 (40, 8, 4) Insula R
0.09436 5.34178 (�10, �14, 16) Thalamus_L
0.11584 5.19571 (20, 8, 4) Putamen_R
0.13843 5.06274 (14, �16, 16) Thalamus_R
0.19312 4.82253 (34, �12, �2) Putamen_R
0.39014 4.24658 (48, 2, �10) Temporal_Sup_R
490 0.01111 0.0127 0.01416 6.7078 (32, �66, �22) Cerebelum_6_R
0.03003 6.14265 (20, �58, �18) Cerebelum_6_R
482 0.01135 0.01294 0.01953 6.45726 (�26, �60, �22) Cerebelum_6_L
0.02075 6.39888 (�14, �60, �16) Cerebelum_4_5_L
0.39856 4.22681 (�8, �58, �2) Lingual_L
1162 0.00635 0.00598 0.02136 6.37997 (0, 0, 68) Supp_Motor_Area_R
0.02222 6.34191 (2, �6, 72) Supp_Motor_Area_R
0.08215 5.44359 (0, 2, 50) Supp_Motor Area_R
0.08728 5.40461 (2, �4, 52) Supp_Motor_Area_R
0.11011 5.2412 (2, 18, 40) Frontal_Sup_Medial_R
0.14331 5.04149 (�4, �14, 78) Paracentral_Lobule_L
53 0.06458 0.10913 0.04102 5.93599 (38, �48, �56) Cerebelum_8_R
Left to right, columns show the size of contiguous clusters, the P value for that cluster using combined cluster extent-voxel height inference, the P value based
only on cluster extent, and the voxel-wise P value, pseudo-T value, MNI coordinates, and anatomical region label for activation peaks within the cluster. All P
values are corrected to control family-wise error.
5 It has been suggested (Gupta et al., 2005), however, that non-word
repetition and word list recall may share common sequencing mechanisms
We believe that the use of non-words simplifies possible interpretations o
the experimental results and still sheds light on mechanisms involved in
more typical language production.
J.W. Bohland, F.H. Guenther / NeuroImage 32 (2006) 821–841828
verbal output such as speaking rate (Wildgruber et al., 2001;
Riecker et al., 2005) or prosody (Riecker et al., 2002a). Previous
computational studies in our laboratory have led to the implemen-
tation of a neural model that is capable of learning and producing
(by means of a computer-simulated vocal tract) simple speech
sounds (Guenther, 1994, 1995; Guenther et al., 1998, 2006). More
recently, we have generated and tested hypotheses regarding the
anatomical locations of various processing components and
representations in the model (Guenther et al., 2006; in press).
Currently, however, the model does not treat sequencing or explicit
planning beyond a single ‘‘chunk.’’ Here, we investigated the
neural substrates for representing speech items (and their serial
order) within planned sequences and for initiating and coordinating
the serial production of these items (e.g., Lashley’s action syntax
problem; Lashley, 1951).
Subjects spoke or prepared to speak non-word sequences of three
syllables. The use of non-lexical items served to eliminate semantic
effects, which were not of interest in this study5. Because our mo-
deling work is not tied to a particular level of phonological rep-
resentation (the current DIVA implementation is capable of learning
phonemes, syllables, or multi-syllabic words), and because the
research community has not arrived at a consensus on planning
‘‘units’’ in speech, the stimuli were parameterized by two complexity
factors: within each syllable (syllable complexity or syl) and across
the syllables in the sequence (sequence complexity or seq). Many
previous authors have considered the importance of the syllable as a
unit in speech production (Sevald et al., 1995; Ferrand and Segui,
.
f
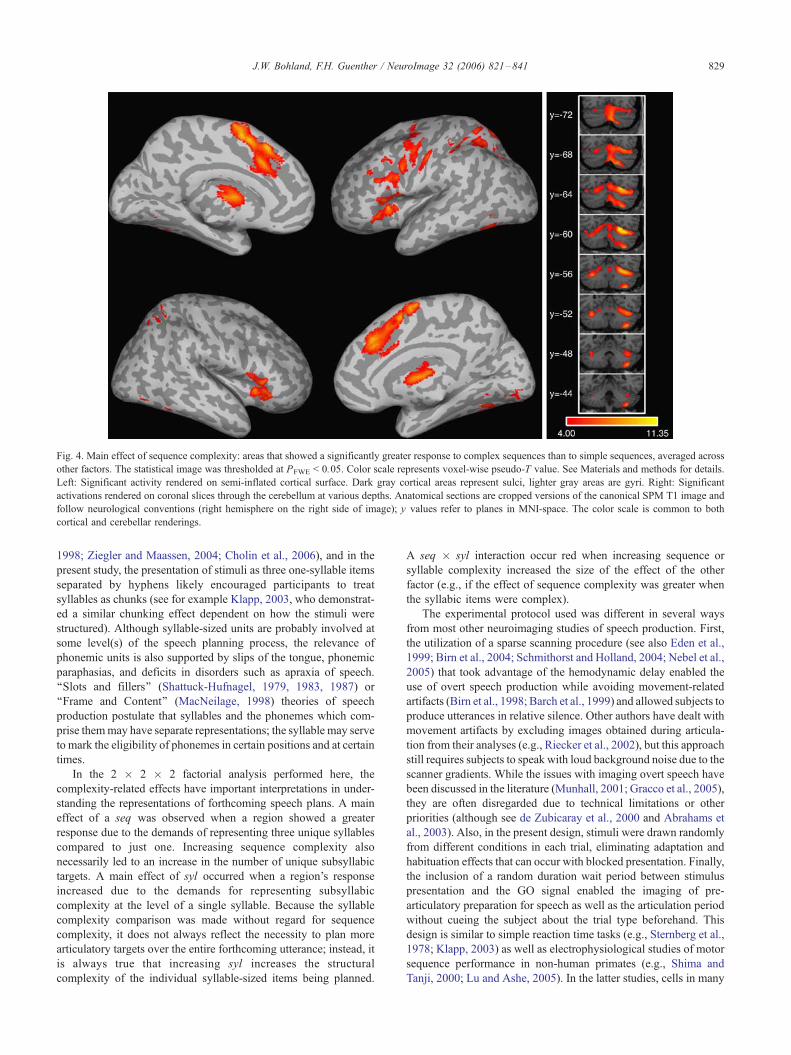
Fig. 4. Main effect of sequence complexity: areas that showed a significantly greater response to complex sequences than to simple sequences, averaged across
other factors. The statistical image was thresholded at PFWE < 0.05. Color scale represents voxel-wise pseudo-T value. See Materials and methods for details.
Left: Significant activity rendered on semi-inflated cortical surface. Dark gray cortical areas represent sulci, lighter gray areas are gyri. Right: Significant
activations rendered on coronal slices through the cerebellum at various depths. Anatomical sections are cropped versions of the canonical SPM T1 image and
follow neurological conventions (right hemisphere on the right side of image); y values refer to planes in MNI-space. The color scale is common to both
cortical and cerebellar renderings.
J.W. Bohland, F.H. Guenther / NeuroImage 32 (2006) 821–841 829
1998; Ziegler and Maassen, 2004; Cholin et al., 2006), and in the
present study, the presentation of stimuli as three one-syllable items
separated by hyphens likely encouraged participants to treat
syllables as chunks (see for example Klapp, 2003, who demonstrat-
ed a similar chunking effect dependent on how the stimuli were
structured). Although syllable-sized units are probably involved at
some level(s) of the speech planning process, the relevance of
phonemic units is also supported by slips of the tongue, phonemic
paraphasias, and deficits in disorders such as apraxia of speech.
‘‘Slots and fillers’’ (Shattuck-Hufnagel, 1979, 1983, 1987) or
‘‘Frame and Content’’ (MacNeilage, 1998) theories of speech
production postulate that syllables and the phonemes which com-
prise themmay have separate representations; the syllable may serve
to mark the eligibility of phonemes in certain positions and at certain
times.
In the 2 � 2 � 2 factorial analysis performed here, the
complexity-related effects have important interpretations in under-
standing the representations of forthcoming speech plans. A main
effect of a seq was observed when a region showed a greater
response due to the demands of representing three unique syllables
compared to just one. Increasing sequence complexity also
necessarily led to an increase in the number of unique subsyllabic
targets. A main effect of syl occurred when a region’s response
increased due to the demands for representing subsyllabic
complexity at the level of a single syllable. Because the syllable
complexity comparison was made without regard for sequence
complexity, it does not always reflect the necessity to plan more
articulatory targets over the entire forthcoming utterance; instead, it
is always true that increasing syl increases the structural
complexity of the individual syllable-sized items being planned.
A seq � syl interaction occur red when increasing sequence or
syllable complexity increased the size of the effect of the other
factor (e.g., if the effect of sequence complexity was greater when
the syllabic items were complex).
The experimental protocol used was different in several ways
from most other neuroimaging studies of speech production. First,
the utilization of a sparse scanning procedure (see also Eden et al.,
1999; Birn et al., 2004; Schmithorst and Holland, 2004; Nebel et al.,
2005) that took advantage of the hemodynamic delay enabled the
use of overt speech production while avoiding movement-related
artifacts (Birn et al., 1998; Barch et al., 1999) and allowed subjects to
produce utterances in relative silence. Other authors have dealt with
movement artifacts by excluding images obtained during articula-
tion from their analyses (e.g., Riecker et al., 2002), but this approach
still requires subjects to speak with loud background noise due to the
scanner gradients. While the issues with imaging overt speech have
been discussed in the literature (Munhall, 2001; Gracco et al., 2005),
they are often disregarded due to technical limitations or other
priorities (although see de Zubicaray et al., 2000 and Abrahams et
al., 2003). Also, in the present design, stimuli were drawn randomly
from different conditions in each trial, eliminating adaptation and
habituation effects that can occur with blocked presentation. Finally,
the inclusion of a random duration wait period between stimulus
presentation and the GO signal enabled the imaging of pre-
articulatory preparation for speech as well as the articulation period
without cueing the subject about the trial type beforehand. This
design is similar to simple reaction time tasks (e.g., Sternberg et al.,
1978; Klapp, 2003) as well as electrophysiological studies of motor
sequence performance in non-human primates (e.g., Shima and
Tanji, 2000; Lu and Ashe, 2005). In the latter studies, cells in many

Table 3
Significant ( P < 0.05, corrected for multiple comparisons) activation peak summary for the main effect of sequence complexity (seq)
Cluster size P (combo) P (cluster) P (voxel) Pseudo-T MNI (x, y, z) Region label
4920 0.00024 0.00012 0.00049 9.3025 (22, �60, �20) Cerebelum_6_R
0.00061 8.6905 (32, �60, �26) Cerebelum_6_R
0.0061 7.13077 (�34, �56, �32) Cerebelum_6_L
0.00708 7.00493 (36, �54, �56) Cerebelum_8_R
0.0083 6.89034 (26, �32, �46) Cerebelum_8_R
0.00964 6.8132 (6, �74, �38) Cerebelum_Crus2_R
0.00977 6.80131 (16, �70, �48) Cerebelum_8_R
0.01575 6.54791 (30, �62, �56) Cerebelum_8_R
0.01843 6.43769 (36, �44, �54) Cerebelum_8_R
0.03589 6.07315 (�44, �58, �10) Temporal_Inf_L
0.04578 5.92515 (6, �68, �18) Cerebelum_6_R
0.06006 5.76695 (30, �38, �50) Cerebelum_8_R
0.06995 5.6757 (4, �80, �18) Vermis_6
0.13599 5.24158 (�24, �64, �22) Cerebelum_6_L
0.16626 5.10358 (�48, �64, �22) Fusiform_L
0.17029 5.08838 (22, �82, �18) Fusiform_R
0.17712 5.0637 (�16, �62, �16) Cerebelum_6_L
0.21021 4.94853 (�30, �78, �22) Cerebelum_6_L
0.30566 4.65947 (�22, �84, �22) Cerebelum_Crus1_L
0.46948 4.31036 (6, �88, �10) Lingual_R
0.47888 4.2941 (36, �38, �40) Cerebelum_Crus2_R
2294 0.00037 0.00061 0.00024 11.3493 (0, 6, 56) Supp_Motor_Area_R
0.00049 9.32545 (8, 30, 34) Cingulum_Mid_R
0.00049 9.25186 (�2, 18, 46) Supp_Motor_Area_L
0.00061 8.66842 (0, 2, 68) Supp_Motor_Area_R
0.00073 8.53792 (0, �6, 70) Supp_Motor_Area_R
0.00122 8.14325 (�2, 22, 36) Frontal_Sup_Medial_L
1736 0.00061 0.00098 0.00281 7.64762 (�48, 4, 30) Precentral_L
0.0061 7.12261 (�56, �8, 46) Postcentral_L
0.01782 6.46693 (�50, 28, 24) Frontal_Inf_Tri_L
0.02063 6.34655 (�54, 16, 32) Frontal_Inf_Oper_L
0.05212 5.84752 (�50, �6, 54) Precentral_L
0.05823 5.77984 (�54, 6, 42) Precentral_L
0.08655 5.54831 (�32, �4, 64) Frontal_Sup_L
0.1167 5.35413 (�42, �2, 44) Precentral_L
0.18481 5.03744 (�32, �4, 52) Precentral_L
0.21655 4.92606 (�58, 10, 20) Frontal_Inf_Oper_L
0.23328 4.86595 (�26, �6, 50) Frontal_Sup_L
1153 0.00061 0.00305 0.00061 8.71686 (0, �6, 12) Thalamus
0.00098 8.27126 (�8, �2, 10) Caudate_L
0.23267 4.86751 (18, �8, 20) Caudate_R
1031 0.00061 0.00354 0.00061 8.71972 (�32, 22, 4) Insula_L
0.00452 7.2841 (�42, 16, 6) Insula_L
0.00854 6.88164 (�48, 14, 2) Frontal_Inf_Oper_L
0.02576 6.24065 (�48, 20, �6) Frontal_Inf_Orb_L
830 0.00171 0.00476 0.00195 7.84031 (40, 22, 2) Insula_R
0.00391 7.36148 (50, 20, �2) Frontal_Inf_Oper_R
1063 0.0022 0.0033 0.00684 7.02179 (�30, �54, 58) Parietal_Sup_L
0.00757 6.95509 (�26, �60, 56) Parietal_Sup_L
0.01013 6.76815 (�30, �48, 46) Parietal_Inf_L
0.11938 5.33424 (�48, �32, 46) Postcentral_L
0.41821 4.40675 (�26, �68, 38) Parietal_Sup_L
0.45251 4.34567 (�52, �34, 52) Postcentral_L
130 0.07507 0.04443 0.14087 5.21796 (26, �64, 64) Parietal_Sup_R
0.23376 4.86263 (32, �56, 52) Parietal_Inf_R
Left to right, columns show the size of contiguous clusters, the P value for that cluster using combined cluster extent-voxel height inference, the P value based
only on cluster extent, and the voxel-wise P value, pseudo-T value, MNI coordinates, and anatomical region label for activation peaks within the cluster. All P
values are corrected to control family-wise error.
J.W. Bohland, F.H. Guenther / NeuroImage 32 (2006) 821–841830
regions of the frontal cortex show anticipatory activity related to the
forthcoming sequence during the wait period. Here, we attempted to
measure similar responses with fMRI in the wait period prior to
articulation of syllable sequences.
While the NOGO task used in this experiment shares common
elements with covert speech, it is not equivalent to that task, which
has been used in many speech imaging studies. In our task, there is
no explicit instruction other than to ‘‘be prepared to immediately

Fig. 5. Main effect of syllable complexity: areas that showed a significantly greater response for sequences comprised of complex syllables than for sequences
comprised of simple syllables, averaged across other factors. The statistical image was thresholded at PFWE < 0.05. Color scale represents voxel-wise pseudo-T
value. See Materials and methods for details. Left: Significant activity rendered on semi-inflated cortical surface. Dark gray cortical areas represent sulci, lighter
gray areas are gyri. Right: Significant activations rendered on coronal slices through the cerebellum at various depths. Anatomical images are cropped versions
of the canonical SPM T1 image and follow neurological conventions (right hemisphere on the right side of image); y values refer to planes in MNI-space. The
color scale is common to both cortical and cerebellar renderings.
J.W. Bohland, F.H. Guenther / NeuroImage 32 (2006) 821–841 831
speak’’ the most recently presented sequence upon viewing a GO
signal. It was assumed that subjects use the stimulus display as a
‘‘precue,’’ loading the sequence into a working memory buffer
prior to the arrival of the GO signal. This notion is supported by the
classical finding in reaction time studies that choice reaction time
(in which the GO signal itself informs the subject of the stimulus)
is longer than simple reaction time (in which the precue provides
the stimulus, as in the present study; Donders, 1969).
The minimal network used for producing syllable sequences was
assessed by performing a conjunction analysis (Nichols et al., 2005)
between the four individual speaking conditions compared to the
baseline. This method based on the maximum P statistic provides a
conservative estimate (Friston et al., 2005) of the speech production
system (see Fig. 2). Overt production of syllable sequences of all
types resulted in significant activation that extended beyond the
central sulcus, involving also the medial premotor areas, the frontal
operculum and anterior insula, the anterior thalamus, and the cere-
bellum. The only differences between speaking conditions were in
the phonological composition of the sequences. Very generally, we
observed that increasing the complexity of the stimulus led to
additional activity in this minimal speech production network and
beyond. Average utterance durations varied moderately but signifi-
cantly across conditions. Although these differences could, them-
selves, lead to variable brain responses, one would expect duration-
specific responses to be focused in the primary sensorimotor and
auditory regions. Differences observed across conditions in ‘‘higher
order’’ regions are unlikely to have been a simple effect of speaking
duration.
The results observed here conflict with the findings of Riecker et
al. (2000b), who examined the effects of articulatory/phonetic
complexity. In that study, none of the stimuli elicited significant
activation of the anterior insula, frontal operculum, or SMA, and
only production of complex syllables (our terminology) activated
the cerebellum. There were several differences between experimen-
tal designs. In Riecker et al. (2000b), stimuli were spoken repeatedly
for one minute periods. For single syllables, this amounted to simple
repetitions over the full minute; for the multi-syllabic utterances,
subjects attempted to equally space the individual syllables at the
same rate as the single syllable stimuli, and repeated the set of three
until the minute was complete. In our protocol, a sequence was
presented then removed during a delay period, forcing subjects to
load the sequence into a working memory buffer in anticipation of
the GO signal. A three-syllable utterance was prepared and/or pro-
duced just once in a trial, and the next trial involved a new stimulus.
In a previous study in our laboratory (Ghosh et al., 2003), production
of even simple vowel sounds activated areas beyond those observed
in Riecker et al. (2000b); furthermore, in that experiment, syllables
were produced immediately upon visual presentation, so the acti-
vation of those areas cannot be merely attributed to the verbal
working memory requirements in the present study. We believe that
the limited activation patterns for complex speech stimuli in Riecker
et al. (2000b) most likely resulted from the blocked paradigm used.
The authors’ suggestion that poly-syllable tokens might be
organized as higher order units posing fewer demands on the motor
system seems unlikely. In English, for example, there are approx-
imately 500 very commonly used syllables. If arbitrary non-lexical
combinations of these syllables were stored as higher level motor
memories, this would result in an unlikely combinatorial explosion.
Rather, as Lashley (1951) noted, the human brain must be able to
arrange smooth sequences of behavior from a finite alphabet of

Fig. 6. Interactions between sequence complexity and syllable complexity. The statistical image was thresholded at PFWE < 0.05. Color scale represents voxel-
wise pseudo-T value. See Materials and methods for details. Left: Significant activity rendered on semi-inflated cortical surface. Dark gray cortical areas
represent sulci, lighter gray areas are gyri. Right: Significant activations rendered on coronal slices through the cerebellum at various depths. Anatomical
images are cropped versions of the canonical SPM T1 image and follow neurological conventions (right hemisphere on the right side of image); y values refer
to planes in MNI-space. The color scale is common to both cortical and cerebellar renderings.
J.W. Bohland, F.H. Guenther / NeuroImage 32 (2006) 821–841832
learned acts. The additional activations observed in the present study
due to increasing stimulus complexity support the notion that these
utterances were ‘‘assembled’’ and not simply executed from a single
motor memory.
The basic speech production network observed is in general
agreement (although activated regions differ depending on the
precise conditions and baselines used) with many other studies of
overt production of various speech stimuli (Murphy et al., 1997;
Wise et al., 1999; Riecker et al., 2000a, 2002, 2005; Fiez, 2001;
Blank et al., 2002; Shuster and Lemieux, 2005, see also Indefrey
and Levelt, 2000 and Turkeltaub et al., 2002 for meta-analyses of
word production experiments). Many of the regions within and
beyond the minimal speech production network (Fig. 2) showed
complexity-related response variations. Our results show that
sequence and syllable complexity interacted strongly in many of
the regions in which a main effect of seq was observed. This is
likely due to the hierarchical relationship between syllables and the
phonemes or phonetic targets that comprise them. In this study, a
complex sequence of simple syllables (e.g., ka–ru– ti) could
contain up to four more distinct phonetic targets than a simple
sequence of simple syllables (e.g., ka–ka–ka), whereas a complex
sequence of complex syllables (e.g., kla– tri–splu) could contain
up to eight more targets than a simple sequence of complex
syllables (e.g., kla–kla–kla). Thus, the two factors were inherently
intertwined, and an interaction would be anticipated if a region
represented the full forthcoming speech plan at a subsyllabic level
or if the representation of complex syllables was simply larger
(e.g., greater BOLD response). In assessing the main effect of seq,
complex sequences were compared to simple ones regardless of the
complexity of the individual syllables within. While more syllables
had to be represented for complex sequences, subjects also had to
plan more subsyllabic targets because these stimuli always
contained more unique phonemes than did simple sequence
stimuli. If an area showed a main effect for seq but did not show
an interaction between seq and syl, this would indicate that the area
likely was used to represent ’’chunks’’ without regard for the
complexity of the chunk. In the present study, the only region that
showed the main effect of seq but did not also show the seq � syl
interaction was the right inferior cerebellum (Lobule VIII). The
fact that the remaining regions showing a main effect for seq also
showed a seq � syl interaction is informative because it indicates
that in most portions of the speech planning system, subsyllabic
detail plays an important representative role.
A major motivation for this study was to provide additional
constraints for models of the speech production system. In the
following sections, we discuss the patterns of responses obtained
for various anatomical structures, review previous pertinent data,
and develop hypotheses concerning how these structures may each
contribute to the planning and production of sequences of syllables
and, moreover, fluent speech.
Sensorimotor areas
Overt production of all stimulus types resulted in significant
bilateral activation (compared to baseline) of the primary sensori-
motor areas in and surrounding the central sulcus. These areas
showed a main effect for go, indicating that they were, on average,
more active for performance than for preparation. In both compa-
risons, the activity maps roughly follow the motor/sensory homun-
culus representations of the lips, jaw, tongue, and larynx (see
Guenther et al., 2006, for a review of the estimated anatomical
locations of the components of the speech motor system). These
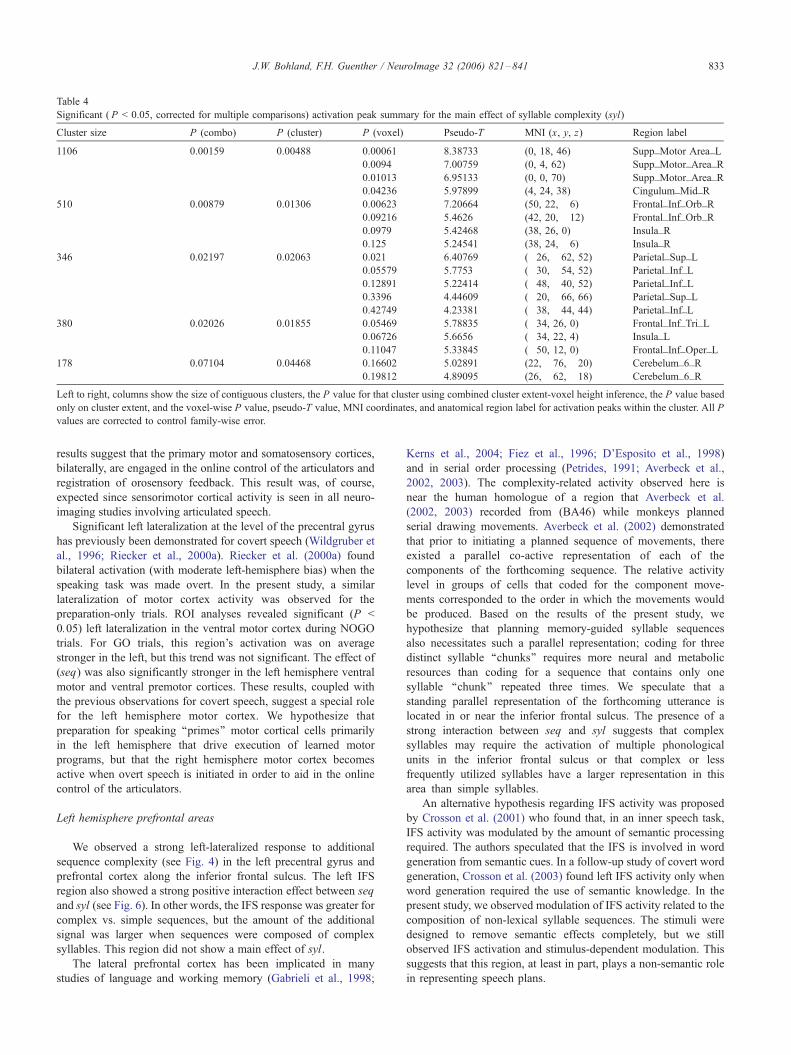
Table 4
Significant ( P < 0.05, corrected for multiple comparisons) activation peak summary for the main effect of syllable complexity (syl)
Cluster size P (combo) P (cluster) P (voxel) Pseudo-T MNI (x, y, z) Region label
1106 0.00159 0.00488 0.00061 8.38733 (0, 18, 46) Supp_Motor Area_L
0.0094 7.00759 (0, 4, 62) Supp_Motor_Area_R
0.01013 6.95133 (0, 0, 70) Supp_Motor_Area_R
0.04236 5.97899 (4, 24, 38) Cingulum_Mid_R
510 0.00879 0.01306 0.00623 7.20664 (50, 22, �6) Frontal_Inf_Orb_R
0.09216 5.4626 (42, 20, �12) Frontal_Inf_Orb_R
0.0979 5.42468 (38, 26, 0) Insula_R
0.125 5.24541 (38, 24, �6) Insula_R
346 0.02197 0.02063 0.021 6.40769 (�26, �62, 52) Parietal_Sup_L
0.05579 5.7753 (�30, �54, 52) Parietal_Inf_L
0.12891 5.22414 (�48, �40, 52) Parietal_Inf_L
0.3396 4.44609 (�20, �66, 66) Parietal_Sup_L
0.42749 4.23381 (�38, �44, 44) Parietal_Inf_L
380 0.02026 0.01855 0.05469 5.78835 (�34, 26, 0) Frontal_Inf_Tri_L
0.06726 5.6656 (�34, 22, 4) Insula_L
0.11047 5.33845 (�50, 12, 0) Frontal_Inf_Oper_L
178 0.07104 0.04468 0.16602 5.02891 (22, �76, �20) Cerebelum_6_R
0.19812 4.89095 (26, �62, �18) Cerebelum_6_R
Left to right, columns show the size of contiguous clusters, the P value for that cluster using combined cluster extent-voxel height inference, the P value based
only on cluster extent, and the voxel-wise P value, pseudo-T value, MNI coordinates, and anatomical region label for activation peaks within the cluster. All P
values are corrected to control family-wise error.
J.W. Bohland, F.H. Guenther / NeuroImage 32 (2006) 821–841 833
results suggest that the primary motor and somatosensory cortices,
bilaterally, are engaged in the online control of the articulators and
registration of orosensory feedback. This result was, of course,
expected since sensorimotor cortical activity is seen in all neuro-
imaging studies involving articulated speech.
Significant left lateralization at the level of the precentral gyrus
has previously been demonstrated for covert speech (Wildgruber et
al., 1996; Riecker et al., 2000a). Riecker et al. (2000a) found
bilateral activation (with moderate left-hemisphere bias) when the
speaking task was made overt. In the present study, a similar
lateralization of motor cortex activity was observed for the
preparation-only trials. ROI analyses revealed significant (P <
0.05) left lateralization in the ventral motor cortex during NOGO
trials. For GO trials, this region’s activation was on average
stronger in the left, but this trend was not significant. The effect of
(seq) was also significantly stronger in the left hemisphere ventral
motor and ventral premotor cortices. These results, coupled with
the previous observations for covert speech, suggest a special role
for the left hemisphere motor cortex. We hypothesize that
preparation for speaking ‘‘primes’’ motor cortical cells primarily
in the left hemisphere that drive execution of learned motor
programs, but that the right hemisphere motor cortex becomes
active when overt speech is initiated in order to aid in the online
control of the articulators.
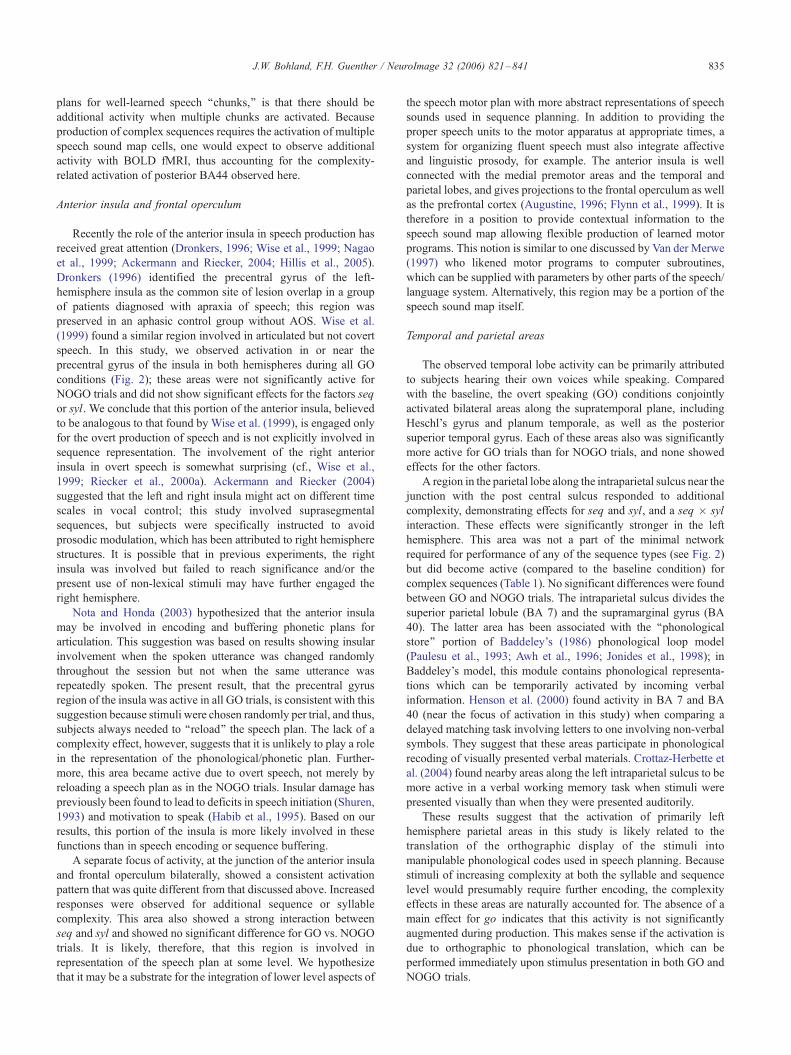
Left hemisphere prefrontal areas
We observed a strong left-lateralized response to additional
sequence complexity (see Fig. 4) in the left precentral gyrus and
prefrontal cortex along the inferior frontal sulcus. The left IFS
region also showed a strong positive interaction effect between seq
and syl (see Fig. 6). In other words, the IFS response was greater for
complex vs. simple sequences, but the amount of the additional
signal was larger when sequences were composed of complex
syllables. This region did not show a main effect of syl.
The lateral prefrontal cortex has been implicated in many
studies of language and working memory (Gabrieli et al., 1998;
Kerns et al., 2004; Fiez et al., 1996; D’Esposito et al., 1998)
and in serial order processing (Petrides, 1991; Averbeck et al.,
2002, 2003). The complexity-related activity observed here is
near the human homologue of a region that Averbeck et al.
(2002, 2003) recorded from (BA46) while monkeys planned
serial drawing movements. Averbeck et al. (2002) demonstrated
that prior to initiating a planned sequence of movements, there
existed a parallel co-active representation of each of the
components of the forthcoming sequence. The relative activity
level in groups of cells that coded for the component move-
ments corresponded to the order in which the movements would
be produced. Based on the results of the present study, we
hypothesize that planning memory-guided syllable sequences
also necessitates such a parallel representation; coding for three
distinct syllable ‘‘chunks’’ requires more neural and metabolic
resources than coding for a sequence that contains only one
syllable ‘‘chunk’’ repeated three times. We speculate that a
standing parallel representation of the forthcoming utterance is
located in or near the inferior frontal sulcus. The presence of a
strong interaction between seq and syl suggests that complex
syllables may require the activation of multiple phonological
units in the inferior frontal sulcus or that complex or less
frequently utilized syllables have a larger representation in this
area than simple syllables.
An alternative hypothesis regarding IFS activity was proposed
by Crosson et al. (2001) who found that, in an inner speech task,
IFS activity was modulated by the amount of semantic processing
required. The authors speculated that the IFS is involved in word
generation from semantic cues. In a follow-up study of covert word
generation, Crosson et al. (2003) found left IFS activity only when
word generation required the use of semantic knowledge. In the
present study, we observed modulation of IFS activity related to the
composition of non-lexical syllable sequences. The stimuli were
designed to remove semantic effects completely, but we still
observed IFS activation and stimulus-dependent modulation. This
suggests that this region, at least in part, plays a non-semantic role
in representing speech plans.

Table 5
Significant ( P < 0.05, corrected for multiple comparisons) activation peak summary for the positive interaction effect of syllable complexity � sequence
complexity (seq � syl)
Cluster size P (combo) P (cluster) P (voxel) Pseudo-T MNI (x, y, z) Region label
2768 0.00012 0.00037 0.00012 9.24008 (0, 16, 48) Supp_Motor_Area_L
0.00037 8.85036 (�8, 8, 62) Supp_Motor_Area_L
0.00037 8.32387 (2, 34, 36) Frontal_Sup_Medial_R
0.00073 8.07759 (8, 26, 34) Cingulum_Mid_R
0.03589 6.11734 (0, 16, 66) N/A
0.06482 5.77648 (2, 14, 32) Cingulum_Mid_R
0.08374 5.61253 (�6, 24, 28) Cingulum_Ant_L
2101 0.00012 0.00049 0.00012 9.15435 (34, 22, �8) Frontal_Inf_Orb_R
0.00195 7.77868 (38, 44, 24) Frontal_Mid_R
0.00891 6.97827 (52, 20, �4) Frontal_Inf_Orb_R
0.01501 6.60839 (40, 20, 10) Frontal_Inf_Tri_R
0.13525 5.30193 (52, 34, 26) Frontal_Inf_Tri_R
0.31763 4.67356 (58, 24, 14) Frontal_Inf_Tri_R
3187 0.00024 0.00037 0.00037 8.41327 (�42, 30, 24) Frontal_Inf_Tri_L
0.00305 7.42877 (�30, 24, 6) Insula_L
0.00439 7.31329 (�42, 46, 22) Frontal_Mid_L
0.01282 6.68387 (�36, 16, �8) Insula_L
0.01404 6.64428 (�58, 14, 18) Frontal_Inf_Oper_L
0.04053 6.06169 (�52, 16, 14) Frontal_Inf_Tri_L
0.04272 6.04246 (�44, 14, 4) Insula_L
0.12463 5.35462 (�62, 6, 28) Precentral_L
0.15784 5.19544 (�40, 12, 26) Frontal_Inf_Tri_L
0.27173 4.80442 (�52, 10, 44) Frontal_Mid_L
0.31409 4.68594 (�50, 4, 36) Precentral_L
1686 0.00134 0.00085 0.01111 6.81014 (42, �50, �30) Cerebelum_Crus1_R
0.0166 6.5356 (28, �52, �24) Cerebelum_6_R
0.02649 6.27152 (32, �52, �28) Cerebelum_6_R
0.0271 6.24839 (36, �56, �28) Cerebelum_6_R
0.03821 6.08466 (�2, �72, �8) Vermis_6
0.05945 5.82793 (14, �66, �12) Cerebelum_6_R
0.11084 5.43767 (42, �72, �28) Cerebelum_Crus1_R
0.13684 5.29047 (2, �56, �32) Vermis_9
0.31763 4.67387 (14, �58, �20) Cerebelum_6_R
0.52759 4.17515 (14, �54, �14) Cerebelum_4_5_R
856 0.00244 0.00366 0.00317 7.39145 (16, �6, 14) Caudate_R
0.00415 7.32411 (�10, 0, 10) Caudate_L
0.01111 6.81383 (10, �2, 12) Caudate_R
0.03857 6.08045 (�4, �10, 14) Thalamus_L
0.07166 5.71289 (8, �8, 2) Thalamus_R
1004 0.00305 0.00281 0.01379 6.65005 (�30, �52, 50) Parietal_Inf_L
0.10303 5.48829 (�40, �44, 54) Parietal_Sup_L
0.1759 5.12255 (�52, �40, 56) Postcentral_L
0.18689 5.08376 (�36, �48, 42) Parietal_Inf_L
0.48474 4.26502 (�24, �72, 46) Parietal_Sup_L
0.51648 4.19948 (�18, �68, 64) Parietal_Sup_L
292 0.0282 0.01501 0.07263 5.69839 (34, 2, 58) Frontal_Mid_R
0.19836 5.0424 (34, 2, 38) Frontal_Mid_R
0.21497 4.98342 (34, 4, 44) Frontal_Mid_R
0.23511 4.92222 (44, 12, 38) Frontal_Mid_R
0.43384 4.36841 (34, 0, 48) Precentral_R
114 0.03137 0.06018 0.0166 6.53542 (�44, �58, �16) Fusiform_L
221 0.0354 0.02271 0.10193 5.49464 (�32, 0, 52) Frontal_Mid_L
0.15063 5.22492 (�38, 0, 62) Precentral_L
0.50818 4.21622 (�38, �4, 42) Precentral_L
Left to right, columns show the size of contiguous clusters, the P value for that cluster using combined cluster extent-voxel height inference, the P value based
only on cluster extent, and the voxel-wise P value, pseudo-T value, MNI coordinates, and anatomical region label for activation peaks within the cluster. All P
values are corrected to control family-wise error.
J.W. Bohland, F.H. Guenther / NeuroImage 32 (2006) 821–841834
We also observed activity within the left posterior inferior frontal
gyrus pars opercularis (BA44) and neighboring premotor areas
related to seq. In previous work, this area (in the left hemisphere) has
been associated with the Speech SoundMap component of the DIVA
model (Guenther et al., 2006). The effect of seq in both the ventral
premotor cortex and the inferior frontal gyrus pars opercularis was
significantly greater in the left hemisphere. A prediction of the
model, which suggests that Speech Sound Map cells read out motor
J.W. Bohland, F.H. Guenther / NeuroImage 32 (2006) 821–841 835
plans for well-learned speech ‘‘chunks,’’ is that there should be
additional activity when multiple chunks are activated. Because
production of complex sequences requires the activation of multiple
speech sound map cells, one would expect to observe additional
activity with BOLD fMRI, thus accounting for the complexity-
related activation of posterior BA44 observed here.
Anterior insula and frontal operculum
Recently the role of the anterior insula in speech production has
received great attention (Dronkers, 1996; Wise et al., 1999; Nagao
et al., 1999; Ackermann and Riecker, 2004; Hillis et al., 2005).
Dronkers (1996) identified the precentral gyrus of the left-
hemisphere insula as the common site of lesion overlap in a group
of patients diagnosed with apraxia of speech; this region was
preserved in an aphasic control group without AOS. Wise et al.
(1999) found a similar region involved in articulated but not covert
speech. In this study, we observed activation in or near the
precentral gyrus of the insula in both hemispheres during all GO
conditions (Fig. 2); these areas were not significantly active for
NOGO trials and did not show significant effects for the factors seq
or syl. We conclude that this portion of the anterior insula, believed
to be analogous to that found by Wise et al. (1999), is engaged only
for the overt production of speech and is not explicitly involved in
sequence representation. The involvement of the right anterior
insula in overt speech is somewhat surprising (cf., Wise et al.,
1999; Riecker et al., 2000a). Ackermann and Riecker (2004)
suggested that the left and right insula might act on different time
scales in vocal control; this study involved suprasegmental
sequences, but subjects were specifically instructed to avoid
prosodic modulation, which has been attributed to right hemisphere
structures. It is possible that in previous experiments, the right
insula was involved but failed to reach significance and/or the
present use of non-lexical stimuli may have further engaged the
right hemisphere.
Nota and Honda (2003) hypothesized that the anterior insula
may be involved in encoding and buffering phonetic plans for
articulation. This suggestion was based on results showing insular
involvement when the spoken utterance was changed randomly
throughout the session but not when the same utterance was
repeatedly spoken. The present result, that the precentral gyrus
region of the insula was active in all GO trials, is consistent with this
suggestion because stimuli were chosen randomly per trial, and thus,
subjects always needed to ‘‘reload’’ the speech plan. The lack of a
complexity effect, however, suggests that it is unlikely to play a role
in the representation of the phonological/phonetic plan. Further-
more, this area became active due to overt speech, not merely by
reloading a speech plan as in the NOGO trials. Insular damage has
previously been found to lead to deficits in speech initiation (Shuren,
1993) and motivation to speak (Habib et al., 1995). Based on our
results, this portion of the insula is more likely involved in these
functions than in speech encoding or sequence buffering.
A separate focus of activity, at the junction of the anterior insula
and frontal operculum bilaterally, showed a consistent activation
pattern that was quite different from that discussed above. Increased
responses were observed for additional sequence or syllable
complexity. This area also showed a strong interaction between
seq and syl and showed no significant difference for GO vs. NOGO
trials. It is likely, therefore, that this region is involved in
representation of the speech plan at some level. We hypothesize
that it may be a substrate for the integration of lower level aspects of
the speech motor plan with more abstract representations of speech
sounds used in sequence planning. In addition to providing the
proper speech units to the motor apparatus at appropriate times, a
system for organizing fluent speech must also integrate affective
and linguistic prosody, for example. The anterior insula is well
connected with the medial premotor areas and the temporal and
parietal lobes, and gives projections to the frontal operculum as well
as the prefrontal cortex (Augustine, 1996; Flynn et al., 1999). It is
therefore in a position to provide contextual information to the
speech sound map allowing flexible production of learned motor
programs. This notion is similar to one discussed by Van der Merwe
(1997) who likened motor programs to computer subroutines,
which can be supplied with parameters by other parts of the speech/
language system. Alternatively, this region may be a portion of the
speech sound map itself.
Temporal and parietal areas
The observed temporal lobe activity can be primarily attributed
to subjects hearing their own voices while speaking. Compared
with the baseline, the overt speaking (GO) conditions conjointly
activated bilateral areas along the supratemporal plane, including
Heschl’s gyrus and planum temporale, as well as the posterior
superior temporal gyrus. Each of these areas also was significantly
more active for GO trials than for NOGO trials, and none showed
effects for the other factors.
A region in the parietal lobe along the intraparietal sulcus near the
junction with the post central sulcus responded to additional
complexity, demonstrating effects for seq and syl, and a seq � syl
interaction. These effects were significantly stronger in the left
hemisphere. This area was not a part of the minimal network
required for performance of any of the sequence types (see Fig. 2)
but did become active (compared to the baseline condition) for
complex sequences (Table 1). No significant differences were found
between GO and NOGO trials. The intraparietal sulcus divides the
superior parietal lobule (BA 7) and the supramarginal gyrus (BA
40). The latter area has been associated with the ‘‘phonological
store’’ portion of Baddeley’s (1986) phonological loop model
(Paulesu et al., 1993; Awh et al., 1996; Jonides et al., 1998); in
Baddeley’s model, this module contains phonological representa-
tions which can be temporarily activated by incoming verbal
information. Henson et al. (2000) found activity in BA 7 and BA
40 (near the focus of activation in this study) when comparing a
delayed matching task involving letters to one involving non-verbal
symbols. They suggest that these areas participate in phonological
recoding of visually presented verbal materials. Crottaz-Herbette et
al. (2004) found nearby areas along the left intraparietal sulcus to be
more active in a verbal working memory task when stimuli were
presented visually than when they were presented auditorily.
These results suggest that the activation of primarily left
hemisphere parietal areas in this study is likely related to the
translation of the orthographic display of the stimuli into
manipulable phonological codes used in speech planning. Because
stimuli of increasing complexity at both the syllable and sequence
level would presumably require further encoding, the complexity
effects in these areas are naturally accounted for. The absence of a
main effect for go indicates that this activity is not significantly
augmented during production. This makes sense if the activation is
due to orthographic to phonological translation, which can be
performed immediately upon stimulus presentation in both GO and
NOGO trials.
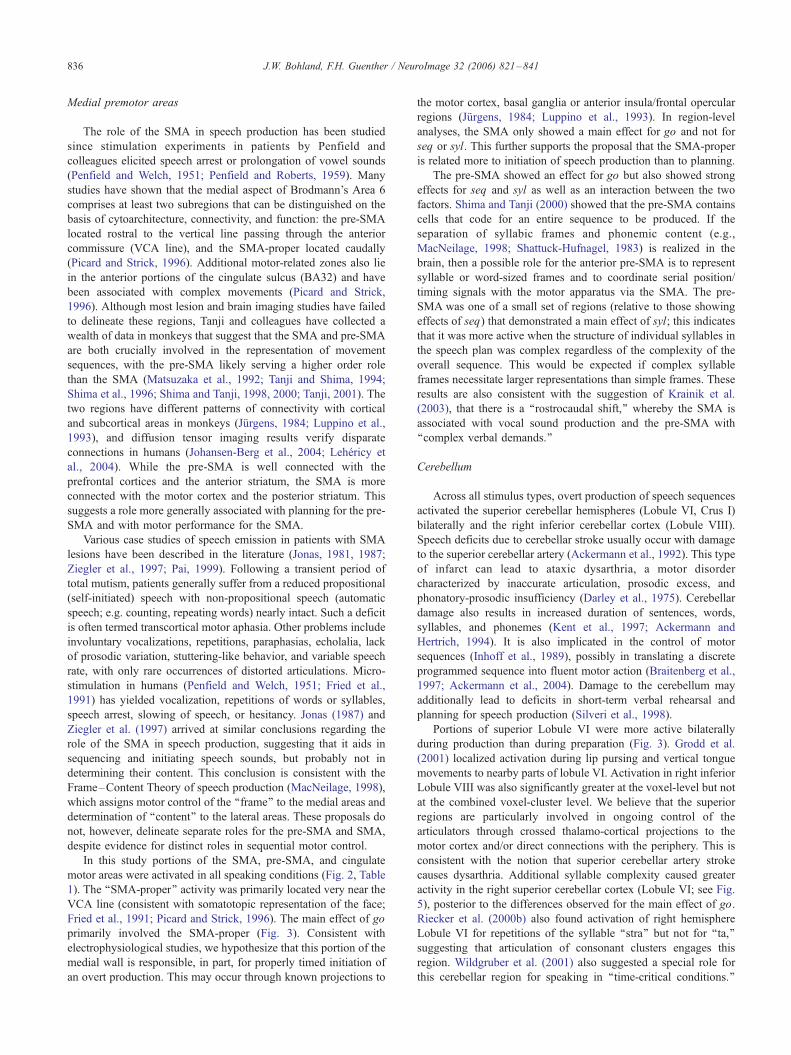
J.W. Bohland, F.H. Guenther / NeuroImage 32 (2006) 821–841836
Medial premotor areas
The role of the SMA in speech production has been studied
since stimulation experiments in patients by Penfield and
colleagues elicited speech arrest or prolongation of vowel sounds
(Penfield and Welch, 1951; Penfield and Roberts, 1959). Many
studies have shown that the medial aspect of Brodmann’s Area 6
comprises at least two subregions that can be distinguished on the
basis of cytoarchitecture, connectivity, and function: the pre-SMA
located rostral to the vertical line passing through the anterior
commissure (VCA line), and the SMA-proper located caudally
(Picard and Strick, 1996). Additional motor-related zones also lie
in the anterior portions of the cingulate sulcus (BA32) and have
been associated with complex movements (Picard and Strick,
1996). Although most lesion and brain imaging studies have failed
to delineate these regions, Tanji and colleagues have collected a
wealth of data in monkeys that suggest that the SMA and pre-SMA
are both crucially involved in the representation of movement
sequences, with the pre-SMA likely serving a higher order role
than the SMA (Matsuzaka et al., 1992; Tanji and Shima, 1994;
Shima et al., 1996; Shima and Tanji, 1998, 2000; Tanji, 2001). The
two regions have different patterns of connectivity with cortical
and subcortical areas in monkeys (Jurgens, 1984; Luppino et al.,
1993), and diffusion tensor imaging results verify disparate
connections in humans (Johansen-Berg et al., 2004; Lehericy et
al., 2004). While the pre-SMA is well connected with the
prefrontal cortices and the anterior striatum, the SMA is more
connected with the motor cortex and the posterior striatum. This
suggests a role more generally associated with planning for the pre-
SMA and with motor performance for the SMA.
Various case studies of speech emission in patients with SMA
lesions have been described in the literature (Jonas, 1981, 1987;
Ziegler et al., 1997; Pai, 1999). Following a transient period of
total mutism, patients generally suffer from a reduced propositional
(self-initiated) speech with non-propositional speech (automatic
speech; e.g. counting, repeating words) nearly intact. Such a deficit
is often termed transcortical motor aphasia. Other problems include
involuntary vocalizations, repetitions, paraphasias, echolalia, lack
of prosodic variation, stuttering-like behavior, and variable speech
rate, with only rare occurrences of distorted articulations. Micro-
stimulation in humans (Penfield and Welch, 1951; Fried et al.,
1991) has yielded vocalization, repetitions of words or syllables,
speech arrest, slowing of speech, or hesitancy. Jonas (1987) and
Ziegler et al. (1997) arrived at similar conclusions regarding the
role of the SMA in speech production, suggesting that it aids in
sequencing and initiating speech sounds, but probably not in
determining their content. This conclusion is consistent with the
Frame–Content Theory of speech production (MacNeilage, 1998),
which assigns motor control of the ‘‘frame’’ to the medial areas and
determination of ‘‘content’’ to the lateral areas. These proposals do
not, however, delineate separate roles for the pre-SMA and SMA,
despite evidence for distinct roles in sequential motor control.
In this study portions of the SMA, pre-SMA, and cingulate
motor areas were activated in all speaking conditions (Fig. 2, Table
1). The ‘‘SMA-proper’’ activity was primarily located very near the
VCA line (consistent with somatotopic representation of the face;
Fried et al., 1991; Picard and Strick, 1996). The main effect of go
primarily involved the SMA-proper (Fig. 3). Consistent with
electrophysiological studies, we hypothesize that this portion of the
medial wall is responsible, in part, for properly timed initiation of
an overt production. This may occur through known projections to
the motor cortex, basal ganglia or anterior insula/frontal opercular
regions (Jurgens, 1984; Luppino et al., 1993). In region-level
analyses, the SMA only showed a main effect for go and not for
seq or syl. This further supports the proposal that the SMA-proper
is related more to initiation of speech production than to planning.
The pre-SMA showed an effect for go but also showed strong
effects for seq and syl as well as an interaction between the two
factors. Shima and Tanji (2000) showed that the pre-SMA contains
cells that code for an entire sequence to be produced. If the
separation of syllabic frames and phonemic content (e.g.,
MacNeilage, 1998; Shattuck-Hufnagel, 1983) is realized in the
brain, then a possible role for the anterior pre-SMA is to represent
syllable or word-sized frames and to coordinate serial position/
timing signals with the motor apparatus via the SMA. The pre-
SMA was one of a small set of regions (relative to those showing
effects of seq) that demonstrated a main effect of syl; this indicates
that it was more active when the structure of individual syllables in
the speech plan was complex regardless of the complexity of the
overall sequence. This would be expected if complex syllable
frames necessitate larger representations than simple frames. These
results are also consistent with the suggestion of Krainik et al.
(2003), that there is a ‘‘rostrocaudal shift,’’ whereby the SMA is
associated with vocal sound production and the pre-SMA with
‘‘complex verbal demands.’’
Cerebellum
Across all stimulus types, overt production of speech sequences
activated the superior cerebellar hemispheres (Lobule VI, Crus I)
bilaterally and the right inferior cerebellar cortex (Lobule VIII).
Speech deficits due to cerebellar stroke usually occur with damage
to the superior cerebellar artery (Ackermann et al., 1992). This type
of infarct can lead to ataxic dysarthria, a motor disorder
characterized by inaccurate articulation, prosodic excess, and
phonatory-prosodic insufficiency (Darley et al., 1975). Cerebellar
damage also results in increased duration of sentences, words,
syllables, and phonemes (Kent et al., 1997; Ackermann and
Hertrich, 1994). It is also implicated in the control of motor
sequences (Inhoff et al., 1989), possibly in translating a discrete
programmed sequence into fluent motor action (Braitenberg et al.,
1997; Ackermann et al., 2004). Damage to the cerebellum may
additionally lead to deficits in short-term verbal rehearsal and
planning for speech production (Silveri et al., 1998).
Portions of superior Lobule VI were more active bilaterally
during production than during preparation (Fig. 3). Grodd et al.
(2001) localized activation during lip pursing and vertical tongue
movements to nearby parts of lobule VI. Activation in right inferior
Lobule VIII was also significantly greater at the voxel-level but not
at the combined voxel-cluster level. We believe that the superior
regions are particularly involved in ongoing control of the
articulators through crossed thalamo-cortical projections to the
motor cortex and/or direct connections with the periphery. This is
consistent with the notion that superior cerebellar artery stroke
causes dysarthria. Additional syllable complexity caused greater
activity in the right superior cerebellar cortex (Lobule VI; see Fig.
5), posterior to the differences observed for the main effect of go.
Riecker et al. (2000b) also found activation of right hemisphere
Lobule VI for repetitions of the syllable ‘‘stra’’ but not for ‘‘ta,’’
suggesting that articulation of consonant clusters engages this
region. Wildgruber et al. (2001) also suggested a special role for
this cerebellar region for speaking in ‘‘time-critical conditions.’’
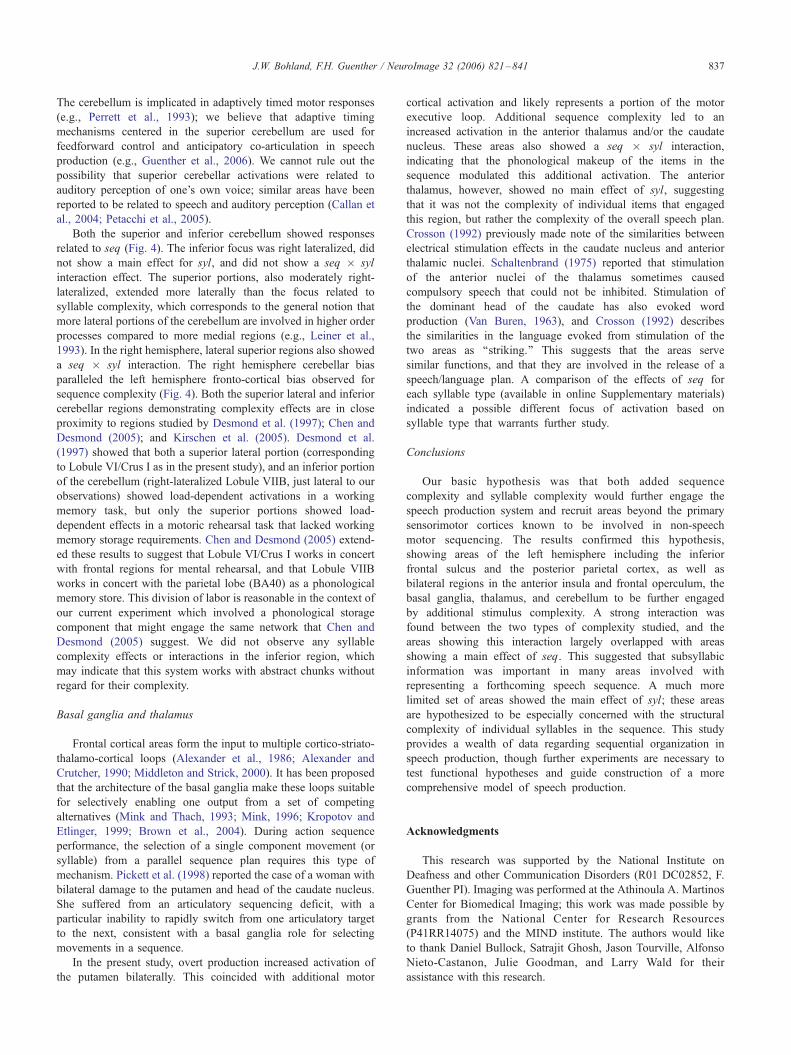
J.W. Bohland, F.H. Guenther / NeuroImage 32 (2006) 821–841 837
The cerebellum is implicated in adaptively timed motor responses
(e.g., Perrett et al., 1993); we believe that adaptive timing
mechanisms centered in the superior cerebellum are used for
feedforward control and anticipatory co-articulation in speech
production (e.g., Guenther et al., 2006). We cannot rule out the
possibility that superior cerebellar activations were related to
auditory perception of one’s own voice; similar areas have been
reported to be related to speech and auditory perception (Callan et
al., 2004; Petacchi et al., 2005).
Both the superior and inferior cerebellum showed responses
related to seq (Fig. 4). The inferior focus was right lateralized, did
not show a main effect for syl, and did not show a seq � syl
interaction effect. The superior portions, also moderately right-
lateralized, extended more laterally than the focus related to
syllable complexity, which corresponds to the general notion that
more lateral portions of the cerebellum are involved in higher order
processes compared to more medial regions (e.g., Leiner et al.,
1993). In the right hemisphere, lateral superior regions also showed
a seq � syl interaction. The right hemisphere cerebellar bias
paralleled the left hemisphere fronto-cortical bias observed for
sequence complexity (Fig. 4). Both the superior lateral and inferior
cerebellar regions demonstrating complexity effects are in close
proximity to regions studied by Desmond et al. (1997); Chen and
Desmond (2005); and Kirschen et al. (2005). Desmond et al.
(1997) showed that both a superior lateral portion (corresponding
to Lobule VI/Crus I as in the present study), and an inferior portion
of the cerebellum (right-lateralized Lobule VIIB, just lateral to our
observations) showed load-dependent activations in a working
memory task, but only the superior portions showed load-
dependent effects in a motoric rehearsal task that lacked working
memory storage requirements. Chen and Desmond (2005) extend-
ed these results to suggest that Lobule VI/Crus I works in concert
with frontal regions for mental rehearsal, and that Lobule VIIB
works in concert with the parietal lobe (BA40) as a phonological
memory store. This division of labor is reasonable in the context of
our current experiment which involved a phonological storage
component that might engage the same network that Chen and
Desmond (2005) suggest. We did not observe any syllable
complexity effects or interactions in the inferior region, which
may indicate that this system works with abstract chunks without
regard for their complexity.
Basal ganglia and thalamus
Frontal cortical areas form the input to multiple cortico-striato-
thalamo-cortical loops (Alexander et al., 1986; Alexander and
Crutcher, 1990; Middleton and Strick, 2000). It has been proposed
that the architecture of the basal ganglia make these loops suitable
for selectively enabling one output from a set of competing
alternatives (Mink and Thach, 1993; Mink, 1996; Kropotov and
Etlinger, 1999; Brown et al., 2004). During action sequence
performance, the selection of a single component movement (or
syllable) from a parallel sequence plan requires this type of
mechanism. Pickett et al. (1998) reported the case of a woman with
bilateral damage to the putamen and head of the caudate nucleus.
She suffered from an articulatory sequencing deficit, with a
particular inability to rapidly switch from one articulatory target
to the next, consistent with a basal ganglia role for selecting
movements in a sequence.
In the present study, overt production increased activation of
the putamen bilaterally. This coincided with additional motor
cortical activation and likely represents a portion of the motor
executive loop. Additional sequence complexity led to an
increased activation in the anterior thalamus and/or the caudate
nucleus. These areas also showed a seq � syl interaction,
indicating that the phonological makeup of the items in the
sequence modulated this additional activation. The anterior
thalamus, however, showed no main effect of syl, suggesting
that it was not the complexity of individual items that engaged
this region, but rather the complexity of the overall speech plan.
Crosson (1992) previously made note of the similarities between
electrical stimulation effects in the caudate nucleus and anterior
thalamic nuclei. Schaltenbrand (1975) reported that stimulation
of the anterior nuclei of the thalamus sometimes caused
compulsory speech that could not be inhibited. Stimulation of
the dominant head of the caudate has also evoked word
production (Van Buren, 1963), and Crosson (1992) describes
the similarities in the language evoked from stimulation of the
two areas as ‘‘striking.’’ This suggests that the areas serve
similar functions, and that they are involved in the release of a
speech/language plan. A comparison of the effects of seq for
each syllable type (available in online Supplementary materials)
indicated a possible different focus of activation based on
syllable type that warrants further study.
Conclusions
Our basic hypothesis was that both added sequence
complexity and syllable complexity would further engage the
speech production system and recruit areas beyond the primary
sensorimotor cortices known to be involved in non-speech
motor sequencing. The results confirmed this hypothesis,
showing areas of the left hemisphere including the inferior
frontal sulcus and the posterior parietal cortex, as well as
bilateral regions in the anterior insula and frontal operculum, the
basal ganglia, thalamus, and cerebellum to be further engaged
by additional stimulus complexity. A strong interaction was
found between the two types of complexity studied, and the
areas showing this interaction largely overlapped with areas
showing a main effect of seq. This suggested that subsyllabic
information was important in many areas involved with
representing a forthcoming speech sequence. A much more
limited set of areas showed the main effect of syl; these areas
are hypothesized to be especially concerned with the structural
complexity of individual syllables in the sequence. This study
provides a wealth of data regarding sequential organization in
speech production, though further experiments are necessary to
test functional hypotheses and guide construction of a more
comprehensive model of speech production.
Acknowledgments
This research was supported by the National Institute on
Deafness and other Communication Disorders (R01 DC02852, F.
Guenther PI). Imaging was performed at the Athinoula A. Martinos
Center for Biomedical Imaging; this work was made possible by
grants from the National Center for Research Resources
(P41RR14075) and the MIND institute. The authors would like
to thank Daniel Bullock, Satrajit Ghosh, Jason Tourville, Alfonso
Nieto-Castanon, Julie Goodman, and Larry Wald for their
assistance with this research.

J.W. Bohland, F.H. Guenther / NeuroImage 32 (2006) 821–841838
Appendix A. Supplementary data
Supplementary data associated with this article can be found, in
the online version, at doi:10.1016/j.neuroimage.2006.04.173.
References
Abrahams, S., Goldstein, L.H., Simmons, A., Brammer, M.J., Williams,
S.C.R., Giampietro, V.P., Andrew, C.M., Leigh, P.N., 2003. Functional
magnetic resonance imaging of verbal fluency and confrontation
naming using compressed image acquisition to permit overt responses.
Hum. Brain Mapp. 20 (1), 29–40.
Ackermann, H., Hertrich, I., 1994. Speech rate and rhythm in cerebellar
dysarthria: an acoustic analysis of syllabic timing. Folia Phoniatr.
Logop. 46 (2), 70–78.
Ackermann, H., Riecker, A., 2004. The contribution of the insula to motor
aspects of speech production: a review and a hypothesis. Brain Lang.
89, 320–328.
Ackermann, H., Vogel, M., Petersen, D., Poremba, M., 1992. Speech
deficits in ischaemic cerebellar lesions. J. Neurol. 239 (4), 223–227.
Ackermann, H., Mathiak, K., Ivry, R.B., 2004. Temporal organization of
’’internal speech’’ as a basis for cerebellar modulation of cognitive
functions. Behav. Cogn. Neurosci. Rev. 3 (1), 14–22.
Alexander, G.E., Crutcher, M.D., 1990. Functional architecture of basal
ganglia circuits: neural substrates of parallel processing. Trends Neuro-
sci. 13, 266–271.
Alexander, G.E., DeLong, M.R., Strick, K.L., 1986. Parallel organization of
functionally segregated circuits linking basal ganglia and cortex. Annu.
Rev. Neurosci. 9, 357–381.
Augustine, J.R., 1996. Circuitry and functional aspects of the insular lobe in
primates including humans. Brain Res. Rev. 22 (3), 229–244.
Averbeck, B.E., Chafee, M.V., Crowe, D.A., Georgopoulos, A.P., 2002.
Parallel processing of serial movements in prefrontal cortex. Proc. Natl.
Acad. Sci. 99 (20), 13172–13177.
Averbeck, B.B., Chafee, M.V., Crowe, D.A., Georgopoulos, A.P., 2003.
Neural activity in prefrontal cortex during copying geometrical shapes:
I. Single cells encode shape, sequence, and metric parameters. Exp.
Brain Res. 150 (2), 127–141.
Awh, E., Jonides, J., Smith, E.E., Schumacher, E.H., Koeppe, R.A., Katz,
S., 1996. Dissociation of storage and rehearsal in verbal working
memory. Psychol. Sci. 7, 25–31.
Baddeley, A.D., 1986. Working Memory. Oxford Univ. Press, Oxford.
Barch, D.M., Sabb, F.W., Carter, C.S., Braver, T.S., Noll, D.C., Cohen, J.D.,
1999. Overt verbal responding during fMRI scanning: empirical
investigations of problems and potential solutions. NeuroImage 10 (6),
642–657.
Belliveau, J.W., Kennedy, D.N., McKinstry, R.C., Buchbinder, B.R.,
Weisskoff, R.M., Cohen, M.S., Vevea, J.M., Brady, T.J., Rosen, B.R.,
1991. Functional mapping of the human visual cortex by magnetic
resonance imaging. Science 254 (5032), 716–719.
Benjamini, Y., Hochberg, Y., 1995. Controlling the false discovery rate: a
practical and powerful approach to multiple testing. J. R. Stat. Soc., Ser.
B Methodol. 57, 289–300.
Birn, R.M., Bandettini, P.A., Cox, R.W., Jesmanowicz, A., Shaker, R.,
1998. Magnetic field changes in the human brain due to swallowing or
speaking. Magn. Reson. Med. 40, 55–60.
Birn, R.M., Bandettini, P.A., Cox, R.W., Shaker, R., 1999. Event-related
fMRI of tasks involving brief motion. Hum. Brain Mapp. 7, 106–114.
Birn, R.M., Cox, R.W., Bandettini, P.A., 2004. Experimental designs and
processing strategies for fMRI studies involving overt verbal responses.
NeuroImage 23 (3), 1046–1058.
Blank, S.C., Scott, S.K., Murphy, K., Warburton, E., Wise, R.J., 2002.
Speech production: Wernicke, Broca and beyond. Brain 125 (Pt 8),
1829–1838.
Braitenberg, V., Heck, D., Sultan, F., 1997. The detection and generation of
sequences as a key to cerebellar function: experiments and theory.
Behav. Brain Sci. 20 (2), 229–245.
Brown, J.W., Bullock, D., Grossberg, S., 2004. How laminar frontal cortex
and basal ganglia circuits interact to control planned and reactive
saccades. Neural Netw. 17 (4), 471–510.
Callan, D.E., Jones, J.A., Callan, A.M., Akahane-Yamada, R., 2004.
Phonetic perceptual identification by native and second-language
speakers differentially activates brain regions involved with acoustic
phonetic processing and those involved with articulatory-auditory/or-
osensory internal models. NeuroImage 22, 1182–1194.
Chen, S.H., Desmond, J.E., 2005. Cerebrocerebellar networks during
articulatory rehearsal and verbal working memory tasks. NeuroImage
24 (2), 332–338.
Cholin, J., Levelt, W.J.M., Schiller, N.O., 2006. Effects of syllable
frequency in speech production. Cognition 99 (2), 205–235.
Crosson, B.A., 1992. Subcortical Functions in Language and Memory.
Guilford Press, New York.
Crosson, B., Sadek, J.R., Maron, L., Gokcay, D., Mohr, C.M., Auerbach,
E.J., Freeman, A.J., Leonard, C.M., Briggs, R.W., 2001. Relative shift
in activity from medial to lateral frontal cortex during internally versus
externally guided word generation. J. Cogn. Neurosci. 13, 272–283.
Crosson, B., Benefield, H., Cato, M.A., Sadek, J.R., Moore, A.B.,
Wieranga, C.E., Gopinath, K., Soltysik, D., Bauer, R.M., Auerbach,
E.J., Gokcay, D., Leonard, C.M., Briggs, R.W., 2003. Left and right
basal ganglia and frontal activity during language generation: contribu-
tions to lexical, semantic, and phonological processes. J. Int. Neuro-
psychol. Soc. 9 (7), 1061–1077.
Crottaz-Herbette, S., Anagnoson, R.T., Menon, V., 2004. Modality effects
in verbal working memory: differential prefrontal and parietal responses
to auditory and visual stimuli. NeuroImage 21 (1), 340–351.
Dale, A., Fischl, B., Sereno, M.I., 1999. Cortical surface-based analysis: I.
Segmentation and surface reconstruction. NeuroImage 9 (2), 179–194.
Darley, F.L., Aronson, A.E., Brown, J.R., 1975. Motor Speech Disorders.
Saunders, Philadelphia.
Desmond, J.E., Gabrieli, J.D., Wagner, A.D., Ginier, B.L., Glover, G.H.,
1997. Lobular patterns of cerebellar activation in verbal working
memory and finger-tapping tasks as revealed by functional MRI.
J. Neurosci. 17 (24), 9675–9685.
D’Esposito, M., Aguirre, G.K., Zarahn, E., Ballard, D., Shin, R.K., Lease,
J., 1998. Functional MRI studies of spatial and nonspatial working
memory. Cogn. Brain Res. 7 (1), 1–13.
de Zubicaray, G.I., Zelaya, F.O., Andrew, C., Williams, S.C., Bullmore,
E.T., 2000. Cerebral regions associated with verbal response initiation,
suppression and strategy use. Neuropsychologia 38 (9), 1292–1304.
Donders, F.C., 1969. Over de snelheid van psychische proessen (On the
speed of mental processes). Acta Psychol. 30, 412–431 (originally
published in 1868).
Dronkers, N.F., 1996. A new brain region for coordinating speech
articulation. Nature 384 (6605), 159–161.
Duffy, J.R., 1995. Motor Speech Disorders. Mosby, St. Louis, MO.
Eden, G.F., Joseph, J.E., Brown, H.E., Brown, C.P., Zeffro, T.A., 1999.
Utilizing hemo dynamic delay and dispersion to detect fMRI signal
change without auditory interference: the behavior interleaved gradients
technique. Magn. Reson. Med. 41 (1), 13–20.
Evans, A.C., Collins, D.L., Mills, S.R., Brown, E.D., Kelly, R.L., Peters,
T.M., 1993. 3D statistical neuroanatomical models from 305 MRI
volumes. Proc. IEEE—Nuclear Science Symposium and Medical
Imaging Conference, pp. 1813–1817.
Ferrand, L., Segui, J., 1998. The syllable’s role in speech production: are
syllables chunks, schemas or both? Psychon. Bull. Rev. 5 (2), 253–258.
Fiez, J.A., 2001. Neuroimaging studies of speech: an overview of
techniques and methodological approaches. J. Commun. Disord. 34
(6), 445–454.
Fiez, J.A., Raife, E.A., Balota, D.A., Schwarz, J.P., Raichle, M.E., Petersen,
S.E., 1996. A positron emission tomography study of the short-term
maintenance of verbal information. J. Neurosci. 16 (2), 808–822.
Fischl, B., Sereno, M.I., Dale, A.M., 1999. Cortical surface-based analysis:

J.W. Bohland, F.H. Guenther / NeuroImage 32 (2006) 821–841 839
II. Inflation, flattening, and a surface-based coordinate system. Neuro-
Image 9 (2), 195–207.
Fischl, B., van der Kouwe, A., Destrieux, C., Halgren, E., Segonne, F.,
Salat, D.H., Busa, E., Seidman, L.J., Goldstein, J., Kennedy, D.,
Caviness, V., Makris, N., Rosen, B., Dale, A.M., 2004. Automatically
parcellating the human cerebral cortex. Cereb. Cortex 14 (1), 11–22.
Flynn, F.G., Benson, D.F., Ardila, A., 1999. Anatomy of the insula-
functional and clinical correlates. Aphasiology 13 (1), 55–78.
Fried, I., Katz, A., McCarthy, G., Sass, K.J., Williamson, P., Spencer, S.S.,
Spencer, D.D., 1991. Functional organization of the human supplemen-
tary motor cortex studied by electrical stimulation. J. Neurosci. 11 (11),
3656–3666.
Friston, K.J., Penny, W.D., Glaser, D.E., 2005. Conjunction revisited.
NeuroImage 25 (3), 661–667.
Fromkin, V., 1980. Errors in Linguistic Performance: Slips of the Tongue,
Ear, Pen, and Hand. Academic Press, London.
Gabrieli, J.D.E., Poldrack, R.A., Desmond, J.E., 1998. The role of left
prefrontal cortex in language and memory. Proc. Natl. Acad. Sci. 95,
906–913.
Genovese, C.R., Lazar, N.A., Nichols, T., 2002. Thresholding of statistical
maps in functional neuroimaging using the false discovery rate.
NeuroImage 15, 870–878.
Gerloff, C., Corwell, B., Chen, R., Hallett, M., Cohen, L.G., 1997.
Stimulation over human supplementary motor area interferes with the
organization of future elements in complex motor sequences. Brain 120
(9), 1587–1602.
Ghosh, S.S., Bohland, J.W., Guenther, F.H., 2003. Comparisons of brain
regions involved in overt production of elementary phonetic units
(abstract). Presented at 9th Annual Conference on Functional Mapping
of the Human Brain, New York, NeuroImage, vol. 19. (Available on
CD-ROM, No. 2).
Goodglass, H., 1993. Understanding Aphasia. Academic Press, San Diego.
Gordon, P.C., Meyer, D.E., 1987. Hierarchical representation of
spoken syllable order. In: Allport, A., MacKay, D.G., Prinz, W.
(Eds.), Language Perception and Production. Academic Press,
London, pp. 445–462.
Gracco, V.L., Tremblay, P., Pike, B., 2005. Imaging speech production
using fMRI. NeuroImage 26 (1), 294–301.
Grodd, W., Hulsmann, E., Lotze, M., Wildgruber, D., Erb, M., 2001.
Sensorimotor mapping of the human cerebellum: fMRI evidence of
somatotopic organization. Hum. Brain Mapp. 13, 55–73.
Guenther, F.H., 1994. A neural network model of speech acquisition and
motor equivalent speech production. Biol. Cybern. 72, 43–53.
Guenther, F.H., 1995. Speech sound acquisition, coarticulation, and rate
effects in a neural network model of speech production. Psychol. Rev.
102 (3), 594–621.
Guenther, F.H., in press. Cortical interactions underlying the production of
speech sounds. Journal of Communication Disorders.
Guenther, F.H., Hampson, M., Johnson, D., 1998. A theoretical investiga-
tion of reference frames for the planning of speech movements. Psychol.
Rev. 105 (4), 611–633.
Guenther, F.H., Ghosh, S.S., Tourville, J.A., 2006. Neural modeling and
imaging of the cortical interactions underlying syllable production.
Brain Lang. 96 (3), 280–301.
Gupta, P., Abbs, B., Lin, P., 2005. Serial position effects in nonword
repetition. J. Mem. Lang. 53, 141–162.
Habib, M., Daquin, G., Milandre, L., Royere, M.L., Rey, M., Lanteri, A.,
Slamanon, G., Khalil, R., 1995. Mutism and auditory agnosia due to
bilateral insular damage—Role of the insula in human communication.
Neuropsychologia, 327–339.
Hardcastle, W.J., Hewlett, N., 1999. Coarticulation. Cambridge Univ. Press,
Cambridge, UK.
Hayasaka, S., Nichols, T.E., 2004. Combining voxel intensity and cluster
extent with permutation test framework. NeuroImage 23 (1), 54–63.
Helm-Estabrooks, N., 2002. Diagnostic and treatment issues of apraxia.
Semin. Speech, Lang. 23, 219–220.
Henson, R.N., Burgess, N., Frith, C.D., 2000. Recoding, storage, rehearsal
and grouping in verbal short-term memory: an fMRI study. Neuro-
psychologia 38, 426–440.
Hillis, A.E., Work, M., Barker, P.B., Jacobs, M.A., Breese, E.L., Maurer,
K., 2005. Re-examining the brain regions crucial for orchestrating
speech articulation. Brain 127, 1479–1487.
Ho, A.K., Bradshaw, J.L., Cunnington, R., Phillips, J.G., Iansek, R.,
1998. Sequence heterogeneity in parkinsonian speech. Brain Lang.
64, 122–145.
Indefrey, P., Levelt, W.J., 2000. The neural correlates of language
production. In: Gazzaniga, M. (Ed.), The New Cognitive Neuro-
sciences, 2nd ed. MIT Press, Cambridge, MA, pp. 845–865.
Inhoff, A., Diener, H., Rafal, R., Ivry, R., 1989. The role of cerebellar
structures in the execution of serial movements. Brain 112 (Pt 3),
565–581.
Johansen-Berg, H., Behrens, T.E.J., Robson, M.D., Drobnjak, I.,
Rushworth, M.F.S., Brady, J.M., Smith, S.M., Matthews, P.M.,
2004. Changes in connectivity profiles define functionally distinct
regions in human medial frontal cortex. Proc. Natl. Acad. Sci. 101,
13335–13340.
Jonas, S., 1981. The supplementary motor region and speech emission.
J. Commun. Disord. 14, 349–373.
Jonas, S., 1987. The supplementary motor region and speech. In:
Perecman, E. (Ed.), The Frontal Lobes Revisited. IRBN Press, New
York, pp. 241–250.
Jonides, J., Schumacher, E.H., Smith, E.E., Koeppe, R.A., Awh, E., Reuter-
Lorenz, P.A., Marshuetz, C., Willis, C.R., 1998. The role of parietal
cortex in verbal working memory. J. Neurosci. 18 (13), 5026–5034.
Jurgens, U., 1984. The efferent and efferent connections of the supplemen-
tary motor area. Brain Res. 300, 63–81.
Kent, R.D., 2000. Research on speech motor control and its disorders: a
review and prospective. J. Commun. Disord. 33 (5), 391–427.
Kent, R.D., Kent, J.F., Rosenbek, J.C., Vorperian, H.K., Weismer, G., 1997.
A speaking task analysis of the dysarthria in cerebellar disease. Folia
Phoiatr. Logop. 49 (2), 63–82.
Kerns, J.G., Cohen, J.D., Stenger, V.A., Carter, C.S., 2004. Prefrontal
cortex guides context-appropriate responding during language produc-
tion. Neuron 43, 283–291.
Kirschen, M.P., Chen, S.H., Schraedley-Desmond, P., Desmond, J.E.,
2005. Load- and practice-dependent increases in cerebro-cerebellar
activation in verbal working memory: an fMRI study. NeuroImage
24 (2), 462–472.
Klapp, S.T., 2003. Reaction time analysis of two types of motor preparation
for speech articulation: action as a sequence of chunks. J. Mot. Behav.
35 (2), 135–150.
Krainik, A., Lehericy, S., Duffau, H., Capelle, L., Chainay, H., Cornu, P.,
Cohen, L., Boch, A.L., Mangin, J.F., LeBihan, D., Marsault, C., 2003.
Postoperative speech disorder after medial frontal surgery: role of the
supplementary motor area. Neurology 60 (4), 587–594.
Kropotov, J.D., Etlinger, S.C., 1999. Selection of actions in the basal
ganglia-thalamocortical circuits: review and model. Int. J. Psychophy-
siol. 31 (3), 197–217.
Kwong, K.K., Belliveau, J.W., Chesler, D.A., Goldberg, I.E., Weisskoff,
R.M., Poncelet, B.P., Kennedy, D.N., Hoppel, B.E., Cohen, M.S.,
Turner, R., 1992. Dynamic magnetic resonance imaging of human brain
activity during primary sensory stimulation. Proc. Natl. Acad. Sci. 89
(12), 5675–5679.
Lashley, K.S., 1951. The problem of serial order in behavior. In:
Jeffress, L. (Ed.), Cerebral Mechanisms in Behavior. John Wiley
and Sons Inc., pp. 112–136.
Lehericy, S., Ducros, M., Krainik, A., Francois, C., Van de Moortele, P.F.,
Ugurbil, K., Kim, D.S., 2004. 3-D diffusion tensor axonal tracking
shows distinct SMA and pre-SMA projections to the human striatum.
Cereb. Cortex 14 (12), 1302–1309.
Leiner, H.C., Leiner, A.L., Dow, R.S., 1993. Cognitive and language
functions of the human cerebellum. Trends Neurosci. 16 (11), 444–447.
Levelt, W.J.M., 1989. Speaking: From Intention to Articulation. MIT Press,
Cambridge, MA.
J.W. Bohland, F.H. Guenther / NeuroImage 32 (2006) 821–841840
Levelt, W.J., Wheeldon, L., 1994. Do speakers have access to a mental
syllabary? Cognition 50, 239–269.
Levelt, W.J., Roelofs, A., Meyer, A.S., 1999. A theory of lexical access in
speech production. Behav. Brain Sci. 22 (1), 1–38.
Luppino, G., Matelli, M., Camarda, R., Rizzolatti, G., 1993. Corticocortical
connections of area F3 (SMA-proper) and area F6 (Pre-SMA) in the
macaque monkey. J. Comp. Neurol. 338, 114–140.
Lu, X., Ashe, J., 2005. Anticipatory activity in primary motor cortex codes
memorized movement sequences. Neuron 45 (6), 967–973.
MacKay, D.G., 1970. Spoonerisms: the structure of errors in the serial order
of speech. Neuropsychologia 8 (3), 323–350.
MacNeilage, P.F., 1998. The frame/content theory of evolution of speech
production. Behav. Brain Sci. 21, 499–511.
Matsuzaka, Y., Aizawa, H., Tanji, J., 1992. A motor area rostral to the
supplementary motor area (presupplementary motor area) in the
monkey: neuronal activity during a learned motor task. J. Neurophysiol.
68 (3), 653–662.
Middleton, F.A., Strick, P.L., 2000. Basal ganglia and cerebellar loops:
motor and cognitive circuits. Brain Res. Rev. 31, 236–250.
Mink, J.W., 1996. The basal ganglia: focused selection and inhibition of
competing motor programs. Prog. Neurobiol. 50, 381–425.
Mink, J.W., Thach, W.T., 1993. Basal ganglia intrinsic circuits and their role
in behavior. Curr. Opin. Neurobiol. 3, 950–957.
Munhall, K.G., 2001. Functional imaging during speech production. Acta
Psychol. 107, 95–117.
Murphy, K., Corfield, D.R., Guz, A., Fink, G.R., Wise, R.J.S., Harrison, J.,
Adams, L., 1997. Cerebral areas associated with motor control of
speech in humans. J. Appl. Physiol. 83 (5), 1438–1447.
Nagao, M., Takeda, K., Komori, T., Isozaki, E., Hirai, S., 1999. Apraxia of
speech associated with an infarct in the precentral gyrus. Neuroradiol-
ogy 41, 356–357.
Nebel, K., Stude, P., Wiese, H., Muller, B., deGreiff, A., Forsting, M.,
Diener, H.C., Keidel, M., 2005. Sparse imaging and continuous event-
related fMRI in the visual domain: a systematic comparison. Hum.
Brain Mapp. 24 (2), 130–143.
Nichols, T.E., Holmes, A.P., 2001. Nonparametric permutation tests for
functional neuroimaging: a primer with examples. Hum. Brain Mapp.
15, 1–25.
Nichols, T.E., Brett, M., Andersson, J., Wager, T., Poline, J.B., 2005. Valid
conjunction inference with the minimum statistic. NeuroImage 25,
653–660.
Nieto-Castanon, A., Ghosh, S.S., Tourville, J.A., Guenther, F.H., 2003.
Region of interest based analysis of functional imaging data. Neuro-
Image 19 (4), 1303–1316.
Nota, Y., Honda, K., 2003. Possible role of the anterior insula in articulation.
In: Palethorpe, S., Tabain, M. (Eds.), Proceedings of the 6th International
Seminar on Speech Production. Sydney, pp. 191–194.
Ogawa, S., Lee, T.M., Kay, A.R., Tank, D.W., 1990. Brain magnetic
resonance imaging with contrast dependent on blood oxygenation. Proc.
Natl. Acad. Sci. 87, 9869–9872.
Ohman, S., 1966. Coarticulation in VCV utterances: spectrographic
measurements. J. Acoust. Soc. Am. 39, 151–168.
Pai, M.C., 1999. Supplementary motor area aphasia: a case report. Clin.
Neurol. Neurosurg. 101, 29–32.
Paulesu, E., Frith, C.D., Frackowiak, R.S., 1993. The neural correlates of
the verbal component of working memory. Nature 362, 245–342.
Peach, R.K., Tonkovich, J.D., 2004. Phonemic characteristics of apraxia of
speech resulting from subcortical hemorrhage. J. Commun. Disord. 37,
77–90.
Penfield, W., Roberts, L., 1959. Speech and Brain Mechanisms. Princeton
Univ. Press, Princeton, NJ.
Penfield, W., Welch, K., 1951. The supplementary motor area of the
cerebral cortex; a clinical and experimental study. Arch. Neurol.
Psychiatry 66 (3), 289–317.
Perrett, S.P., Ruiz, B.P., Mauk, M.D., 1993. Cerebellar cortex lesions disrupt
learning-dependent timing of conditioned eyelid responses. J. Neurosci.
13 (4), 1708–1718.
Petacchi, A., Laird, A.R., Fox, P.T., Bower, J.M., 2005. Cerebellum and
auditory function: an ALE meta-analysis of functional neuroimaging
studies. Hum. Brain Mapp. 25, 118–128.
Petrides, M., 1991. Functional specialization within the dorsolateral frontal
cortex for serial order memory. Proc. R. Soc. Lond., B Biol. Sci. 246
(1317), 299–306.
Picard, N., Strick, P.L., 1996. Motor areas of the medial wall: a review of
their location and functional activation. Cereb. Cortex 6 (3), 342–353.
Pickett, E.R., Kuniholm, E., Protopapas, A., Friedman, J., Lieberman, P.,
1998. Selective speech motor, syntax and cognitive deficits associated
with bilateral damage to the putamen and the head of the caudate
nuclues: a case study. Neuropsychologia 36, 173–188.
Riecker, A., Ackermann, H., Wildgruber, D., Dogil, G., Grodd, W.,
2000. Opposite hemispheric lateralization effects during speaking
and singing at motor cortex, insula and cerebellum. NeuroReport 11
(9), 1997–2000.
Riecker, A., Ackermann, H., Wildgruber, D., Meyer, J., Dogil, G., Haider,
H., Grodd, W., 2000. Articulatory/phonetic sequencing at the level of
the anterior perisylvian cortex: a functional magnetic resonance imaging
(fMRI) study. Brain Lang. 75 (2), 259–276.
Riecker, A., Wildgruber, D., Dogil, G., Grodd, W., Ackermann, H., 2002.
Hemispheric lateralization effects of rhythm implementation during
syllable repetitions: an fMRI study. NeuroImage 16 (1), 169–176.
Riecker, A., Mathiak, K., Wildgruber, D., Erb, M., Hertrich, I., Grodd, W.,
Ackermann, H., 2005. fMRI reveals two distinct cerebral networks
subserving speech motor control. Neurology 64, 700–706.
Riva, D., 1998. The cerebellar contribution to language and sequential
functions: evidence from a child with cerebellitis. Cortex 34 (2),
279–287.
Schaltenbrand, G., 1975. The effects on speech and language of stereo-
tactical stimulation in thalamus and corpus callosum. Brain Lang. 2,
70–77.
Schmahmann, J.D., Doyon, J., McDonald, D., Holmes, C., Lavoie, K.,
Hurwitz, A.S., Kabani, N., Toga, A., Evans, A., Petrides, M., 1999.
Three-dimensional MRI atlas of the human cerebellum in proportional
stereotaxic space. NeuroImage 10 (3), 233–260.
Schmithorst, V.J., Holland, S.K., 2004. Event-related fMRI technique for
auditory processing with hemodynamics unrelated to acoustic gradient
noise. Magn. Reson. Med. 51 (2), 399–402.
Sevald, C.A., Dell, G.S., Cole, J.S., 1995. Syllable structure in speech
production: are syllables chunks or schemas? J. Mem. Lang. 34,
807–820.
Shattuck-Hufnagel, S., 1979. Speech errors as evidence for a serial order
mechanism in sentence production.. In: Walker, E. (Ed.), Sentence
Processing: Psycholinguistic Studies Presented to Merrill Garrett.
Erblaum, Hillsdale, NJ, pp. 295–342.
Shattuck-Hufnagel, S., 1983. Sublexical units and suprasegmental structure
in speech production planning. In: MacNeilage, P. (Ed.), The Produc-
tion of Speech. Springer-Verlag, New York, pp. 109–136.
Shattuck-Hufnagel, S., 1987. The role of word-onset consonants in speech
production planning: new evidence from speech error patterns. In:
Keller, E., Gopnik, M. (Eds.), Motor and Sensory Processes of
Language. Lawrence Erlbaum, Hillsdale, NJ, pp. 17–51.
Shibasaki, H., Sadato, N., Lyshkow, H., Yonekura, Y., Honda, M.,
Nagamine, T., 1993. Both primary motor cortex and supplementary
motor area play an important role in complex finger movement. Brain
116, 1387–1398.
Shima, K., Tanji, J., 1998. Both supplementary and presupplementary
motor areas are crucial for the temporal organization of multiple
movements. J. Neurophysiol. 80 (6), 3247–3260.
Shima, K., Tanji, J., 2000. Neuronal activity in the supplementary and
presupplementary motor areas for temporal organization of multiple
movements. J. Neurophysiol. 84 (4), 2148–2160.
Shima, K., Mushiake, H., Saito, N., Tanji, J., 1996. Role for cells in the
presupplementary motor area in updating motor plans. Proc. Natl. Acad.
Sci. 93 (16), 8694–8698.
Shuren, J., 1993. Insula and aphasia. J. Neurol. 240, 216–218.
J.W. Bohland, F.H. Guenther / NeuroImage 32 (2006) 821–841 841
Shuster, L.I., Lemieux, S.K., 2005. An fMRI investigation of covertly and
overtly produced mono and multisyllabic words. Brain Lang. 93 (1),
20–31.
Silveri, M.C., Di Betta, A.M., Filippini, V., Leggio, M.G., Molinari, M.,
1998. Verbal short-term store-rehearsal system and the cerebellum.
Evidence from a patient with a right cerebellar lesion. Brain 121 (Pt 11),
2175–2187.
Sternberg, S., Monsell, S., Knoll, R.L., Wright, C.E., 1978. The latency and
duration of rapid movement sequences: Comparisons of speech and
typewriting. In: Stelmach, G. (Ed.), Information processing in motor
control and learning. Academic Press, New York, pp. 117–152.
Tanji, J., 2001. Sequential organization of multiple movements: involve-
ment of cortical motor areas. Annu. Rev. Neurosci. 24, 631–651.
Tanji, J., Shima, K., 1994. Role for supplementary motor area cells in
planning several movements ahead. Nature 371 (6496), 413–416.
Tanji, K., Suzuki, K., Yamadoir, A., Tabuchi, M., Endo, K., Fuji, T.,
Itoyama, Y., 2001. Pure anarthria with predominantly sequencing errors
in phoneme articulation. Cortex 37 (5), 671–678.
Tourville, J.A., Guenther, F.H., 2003. A cortical and cerebellar parcellation
system for speech studies. Tech. Rep.Boston University, Boston, MA.
(CAS/CNS-03-022).
Turkeltaub, P.E., Eden, G.F., Jones, K.M., Zeffro, T.A., 2002. Meta-analysis
of the functional neuroanatomy of single-word reading: method and
validation. NeuroImage 16 (3), 765–780.
Tzourio-Mazoyer, N., Landeau, B., Papathanassiou, D., Crivello, F., Etard,
O., Delcroix, N., Mazoyer, B., Joliot, M., 2002. Automated anatomical
labeling of activations in SPM using a macroscopic anatomical
parcellation of the MNI MRI single-subject brain. NeuroImage 15 (1),
273–289.
Van Buren, J.M., 1963. Confusion and disturbance of speech from
stimulation in vicinity of the head of the caudate nucleus. J. Neurosurg.
20, 148–157.
Van der Merwe, A., 1997. A theoretical framework for the characterization
of pathological speech sensorimotor control. In: McNeil, M. (Ed.),
Clinical Management of Sensorimotor Speech Disorders. Thieme, New
York, pp. 1–25.
Wertz, R.T., LaPointe, L.L., Rosenbek, J.C., 1984. Apraxia of Speech in
Adults: The Disorder and its Management. Grune and Stratton Inc,
Orlando.
Wildgruber, D., Ackermann, H., Klose, U., Kardatzki, B., Grodd, W., 1996.
Functional lateralization of speech production at primary motor cortex:
a fMRI study. NeuroReport 7 (15–17), 2791–2795.
Wildgruber, D., Ackermann, H., Grodd, W., 2001. Differential contribu-
tions of motor cortex, basal ganglia, and cerebellum to speech motor
control: effects of syllable repetition rate evaluated by fMRI. Neuro-
Image 13 (1), 101–109.
Wise, R.J., Greene, J., Buchel, C., Scott, S.K., 1999. Brain regions involved
in articulation. Lancet 353 (9158), 1057–1061.
Ziegler, W., 2002. Psycholinguistic and motor theories of apraxia of speech.
Semin. Speech, Lang. 23 (4), 231–243.
Ziegler, W., Maassen, B., 2004. The role of the syllable in disorders
of spoken language production. In: Maassen, B., Kent, R.,
Peters, H., Lieshout, P., Hulstijn, V. (Eds.), Speech Motor
Control in Normal and Disordered Speech. Oxford Univ. Press,
Oxford, pp. 415–445.
Ziegler, W., Kilian, B., Deger, K., 1997. The role of the left mesial frontal
cortex in fluent speech: evidence from a case of left supplementary
motor area hemorrhage. Neuropsychologia 35 (9), 1197–1208.

J.W. Bohland, F.H. Guenther / NeuroImage 32 (2006) 821-841
Supplementary Figure 1.
Effect of sequence complexity by syllable type during GO trials (P < 0.01 uncorrected). Blue patches show the effects of sequence complexity for simple syllables, yellow patches for complex syllables, and green for the intersection (conjunction) between syllable types. Left Top: Significant activity rendered on semi-inflated cortical surface. Dark gray cortical areas represent sulci, lighter gray areas are gyri. Left Bottom: Significant activity rendered on axial slices through the basal ganglia and thalamus at various depths. Right: Significant activations rendered on coronal slices through the cerebellum at various depths. y- and z-values refer to planes in MNI-space. Anatomical images are cropped versions of the canonical SPM T1 image, and follow neurological conventions (Left hemisphere on the left side of the image); the color scale is common to each sub-figure.