an exploratory analysis of financial inclusion in chad
TRANSCRIPT

HAL Id: hal-03322905https://hal.archives-ouvertes.fr/hal-03322905
Submitted on 20 Aug 2021
HAL is a multi-disciplinary open accessarchive for the deposit and dissemination of sci-entific research documents, whether they are pub-lished or not. The documents may come fromteaching and research institutions in France orabroad, or from public or private research centers.
L’archive ouverte pluridisciplinaire HAL, estdestinée au dépôt et à la diffusion de documentsscientifiques de niveau recherche, publiés ou non,émanant des établissements d’enseignement et derecherche français ou étrangers, des laboratoirespublics ou privés.
An exploratory analysis of financial inclusion in ChadMahamat Ibrahim Ahmat Tidjani
To cite this version:Mahamat Ibrahim Ahmat Tidjani. An exploratory analysis of financial inclusion in Chad. The Euro-pean Journal of Applied Economics, Singidunum University, 2020, 17 (2), pp.34 - 53. �10.5937/ejae17-27027�. �hal-03322905�

34
AN EXPLORATORY ANALYSIS OF FINANCIAL INCLUSION IN CHAD
Mahamat Ibrahim Ahmat Tidjani*
Unit of Economics and Management,Félix Houphouët-Boigny University,Abidjan/Côted’Ivoire, Ivory Coast
Abstract: This paper aims to explore the state of financial inclusion in Chad. Adopting a Multiple Correspondence Analysis (MCA) on a sample of 1000 individuals from the Global Findex (2017), the study measured the inclusiveness of financial systems in Chad through a Financial Inclusion Index (FII). Furthermore, it assessed the distribution of the FII using the factor decomposition of the Gini coefficient. The findings showed that the average FII was low, 24.89%, and it varied between 7.43% and 60.35%. Financial institution account, deposit, withdrawal, and debit card ownership were the most influential indicators of fi-nancial inclusion in Chad. Moreover, the paper revealed that, despite its low level, financial inclusion was not smoothly distributed among the Chadian population (Gini coefficient of 0.196). The analysis of the financial inclusion inequality profile showed that there was a persistent financial inclusion gender gap in Chad, exacerbated by discriminations in education and income. Thus, policy interventions should target the provision of formal accounts, a reduction of costs of financial services (withdrawal and debit cards), and promoting formal savings by developing adequate savings products, to foster financial inclusion in Chad. Furthermore, these policies should be gender-responsive while considering its interaction with education and income.
Keywords: Financial inclusion index, multiple correspondence analysis, inequality decomposition, Chad.
*E-mail: [email protected]
EJAE 2020, 17(2): 34 - 53ISSN 2406-2588UDK: 336.02(674.3)DOI: 10.5937/EJAE17-27027Original paper/Originalni naučni rad
Article info:
Received: Jun 15, 2020Correction: July 31, 2020Accepted: September 14, 2020
INTRODUCTION
1.1 Background
Several years of politico-military conflicts and structural problems, such as endemic corruption and weak institutions, have impeded efforts to pave the road for development in Chad. The growth prospect of Chad is characterized by two episodes during the last two decades prior to 2015. An average growth of about 3% occurred before 2003 and 9% occurred after the oil exploitation in 2003 (MEPD, 2017) . However, that prosperity has not impacted the livelihood of poor people that much.

35
As a result, the income gap between the rich and the poor, and the interregional inequality has widened (Gadom et al., 2018; Gadom et al., 2019). Although poverty declined by 8 percentage points between 2003 and 2011, the latest data on poverty from 2011 indicate that 47% of the population still lives below the national poverty line (MEPD, 2017)1. The recent oil price shocks, security threats to the region, and the Covid-19 outbreak add further vulnerabilities, and might increase the incidence and severity of poverty. The gender-disaggregated human development index (HDI) shows that women fall behind men in human development in Chad and that their deprivations are more pronounced in education and standard of living (UNDP, 2018). Access to finance allows the poor to invest in their education, health, start-up small businesses, or sustain existing ones, and manage their financial risks, thus boost-ing shared prosperity (Abor et al., 2018; Coulibaly & Yogo, 2020; Dixit & Ghosh, 2013; Kuada, 2019).
Financial inclusion has become a global development agenda, the World Bank’s Universal Finan-cial Access by 2020 is an example. In this respect, Chad has implemented three national strategies to promote access and usage of formal finance by the poor and women specifically in remote areas. These are the SNMF (Stratégie Nationale de la Microfinance) in 2009, the PAFIT (Programme d’Appui à la Finance Inclusive au Tchad) for the period 2010-2014, and the PADLFIT (Programme National d’Appui au Développement Local et à la Finance Inclusive au Tchad) for the period 2017-2021. However, the financial system in Chad remains one of the least inclusive in the region. The Global Findex report indicates that only 22% of Chadians had access to formal financial services in 2017.
Access to formal financial services is limited or simply inexistent in some remote areas. Only about 22% of adults reported owning an account in 2017 (figure 1, panel a). Formal account ownership was driven by mobile money account (15.23%) against 8.73% for the financial institutions account (Demirguc-Kunt et al., 2018). The account penetration rate in Chad is low compared to the average of peer sub-Saharan African (SSA) low-income countries (32%). Panel (b) of Figure 1 reveals that Chad falls short by far from SSA in other dimensions of financial inclusion, including savings and credit. The propensity to save in Chad was low, only 3% of adults saved at a formal financial institution in 2017, against 15% in SSA. Similarly, only 3% of Chadians borrowed from a formal financial institution whereas, on average, 8% of adults did so in SSA. The extant literature provides evidence that gender, education, income, age, residence area, work status, and trust in financial institutions are some of the individual level determinants of financial inclusion (Fungáčová & Weill, 2015; Soumaré et al., 2016; Zins & Weill, 2016), whereas population density, per capita GDP, employment, age dependency ratio, and internet usage are their macro level counterparts (Allen et al., 2014; Park & Mercado Jr, 2018; Sha'ban et al., 2019; Uddin et al., 2017).
Figure (1): Financial Inclusion Indicators in SSA in 2017
Source: author, using the Global Findex (2017) data.
1 Ministère de l’Economie et de la Planification du Développement (MEPD).
EJAE 2020 17(2) 34 - 53AHMAT TIDJANI. M. I. AN EXPLORATORY ANALYSIS OF FINANCIAL INCLUSION IN CHAD

36
1.2 Statement of the Problem
Financial inclusion plays a vital role in economic development. It affects the income distribution, and helps close the gender gap in economic opportunities, leading to the empowerment of women (De Haan & Sturm, 2017; Weber & Ahmad, 2014). Despite its vital role, access to finance is lacking in Chad, like in many other developing countries. Account ownership in Chad (22%) is also relatively low, compared to 43% and 35%, respectively, in SSA and low-income countries (Demirguc-Kunt et al., 2018). Furthermore, the global Findex (2017) dataset reveals double-digit gaps in account ownership by gender, income, and education in Chad. These gaps stand, respectively, at 18, 20, and 40 percentage points for gender, income, and education level. In addition, formal financial services are concentrated in urban areas, and quasi-inexistent in remote areas. By relaxing the liquidity constraints of the previously excluded, financial inclusion promotes economic activities (Inoue & Hamori, 2016), and is a vital tool for the sustainability of development (Kuada, 2019).
However, financial inclusion in Chad has attracted less attention from academic researchers. Few cross-country studies include Chad in their analysis. Therefore, what is the level of financial inclusion in Chad? And how is financial inclusion distributed among the Chadian population? To the best of my knowledge, no study has investigated the financial inclusion in the specific context of Chad in-depth, nor provided answers to such questions. This paper aims to explore the state of financial inclusion in Chad. More specifi-cally, it proposes to measure the level of financial inclusion in Chad by constructing a multidimensional financial inclusion index and assess its distribution among the Chadian population according to their characteristics, gender, education, and income level. The remainder of the paper is structured as follows. Section II reviews the relevant literature. Section III describes the data and the method of the analysis. Section IV presents the empirical results. Section V concludes, and provides some policy implications.
LITERATURE REVIEW
The classical literature of finance has mainly focused on financial development in the development of the functioning of financial markets and intermediaries in terms of size, efficiency, and stability. The literature has established that such development affects a country’s economic growth, its level of poverty, and income inequality (Aka, 2010; Ayyagari et al., 2020; Demetriades & James, 2011; Ibrahim & Alagidede, 2018; Jauch & Watzka, 2016; Kaidi & Mensi, 2019). However, following the recent obser-vation that even a well-developed financial system can still be exclusive, the focus is shifted to financial inclusion, which has become at the focus of international debates. Financial inclusion is defined as the process of securing access to all segments of society to formal financial services, which must be useful, affordable, and adequate to their needs.
This paper develops the consumer choice theory and the new Keynesian theory as theoretical frameworks for financial inclusion. The classical assumptions of the consumer choice theory apply. Individuals are rational, self-interested, and interact in a competitive market. Financial services are considered as other normal goods that consumers can purchase. Therefore, at equilibrium, for a given price, the demand for financial services is equal to the supply. At this point, financial exclusion that may arise is a voluntary one. However, in practice, such an equilibrium may not necessarily exist because of several reasons including, i) the absence of supply tough demand exists in the market, which is a common situation in most rural areas in developing countries; ii) the presence of price barriers that prevent the intersection between the supply and the demand; and iii) and the absence of demand for financial services, reflecting voluntary exclusion.
EJAE 2020 17 (2) 34 - 53IBRAHIM. M. TIDJANI. A. AN EXPLORATORY ANALYSIS OF FINANCIAL INCLUSION IN CHAD

37
Under the New-Keynesian theory, principal-agent problems, moral hazard, and adverse selection distort the well-functioning of financial markets, resulting in financial exclusion, even in a competitive market. High-interest rates tend to attract riskier borrowers (adverse selection), and affect their incen-tive for repayment (moral hazard). Thus, banks ration credits, because they cannot unambiguously distinguish riskier borrowers from creditworthy ones. Above the optimal level of interest rate, banks deny credit, even if the potential borrower is willing to pay a high-interest rate. Thus, creditworthy borrowers can be denied credit, leading to financial exclusion in a competitive market.
Empirically, Honohan (2008) measured households’ access to finance using separate indicators. Sarma and Pais (2011), on the other hand, constructed a financial inclusion index, following closely the methodology of the UNDP to overcome the problems of cross-country comparability that arise when using separate indicators of financial inclusion. However, their index assumes perfect substitutability between the dimensions, and subjectively assigns weights to financial inclusion dimensions. Cámara and Tuesta (2014) employed a multivariate technique, a two-stage Principal component Analysis (PCA), to endogenously generate the weights of their index, thus overcoming the problems of perfect substitutability and subjectivity in Sarma and Pais’ index.
Other studies investigate the impact and determinants of financial inclusion. In a naturel experiment in Mexico, Bruhn and Love (2014) explored the impact of improved access to finance through branch expansion on the poor. They concluded that financial inclusion reduced poverty in Mexico, and the impact was manifested through labour market participation. A study by Swamy (2014) assessed the gendered impact of access to finance on households poverty in India. The study revealed that finance inclusion boosted the income of the poor in India, and the impact was more pronounced for women than men. Churchill and Marisetty (2020) confirmed the poverty reduction effects of financial inclu-sion on a sample of 45,000 Indian households. Soumaré et al. (2016) used demand-side data to assess the determinants of financial inclusion in Central and West African countries. Their study identified income, gender, education, residence area, age, employment status, household size, marital status, and trust in the financial system as determinants of financial inclusion. On household data from Nigeria, Dimova and Adebowale (2018) investigated the impact improved access to finance on households’ welfare and inequality. The findings indicated that, though financial inclusion improved households’ welfare, it increased inter-household inequalities. Recent findings by Adegbite and Machethe (2020) have pointed to the persistence of the gender gap in financial inclusion among small farmers in Nigeria, with negative effects on several sustainable development outcomes.
This brief literature shows that there is no country-specific study that has investigated in-depth the financial inclusion in Chad. Thus, the present paper seeks to fill this gap by exploring the state of financial inclusion in Chad.
METHODOLOGY
3.1 Data Source
Data used in this paper were from the World Bank Global Findex (2017). The target population was civilian, non-institutionalized population above the age of 15. The survey was conducted by Gallup INC, in association with the Gallup World Pool on 144 economies around the globe. For each economy, a national representative sample of at least 1,000 individuals was drawn using a simple or double strati-fication technique. The survey was conducted using telephone interviewing or face to face in countries where telephone coverage was less than 80%. The dataset contains financial inclusion indicators and individual characteristics.
EJAE 2020 17(2) 34 - 53IBRAHIM. M. TIDJANI. A. AN EXPLORATORY ANALYSIS OF FINANCIAL INCLUSION IN CHAD

38
3.2 Construction of the Financial Inclusion Index
This paper used a multivariate technique, the Multiple Correspondence Analysis (MCA), to construct the financial inclusion index. The MCA was preferred to PCA because of its ability to accommodate both categorical and quantitative data, unlike PCA (Kassambara, 2017). The MCA identifies similarities/dissimilarities between individuals (in rows) as well as the relationships between variable categories (in columns) by using a contingency table. It locates the n individuals in the dataset as a cloud point in a space of dimension m (the number of variable categories). Each individual has a Coordinate (Profile) and a Mass representing their weights. The space, for which an average weight can be computed, uses chi-squared metrics to measure the distance between individuals. It can be represented by several Axes (dimensions), each associated with a relative Inertia (eigenvalues). The Total Inertia, which is the total variance explained by the axes, is computed as a weighted sum of the distances between the average cloud weight and the points located in that cloud. Thus, the MCA assigns endogenous weights to the variable categories and produces row scores (individuals scores). These individual scores are used in the construction of the Financial Inclusion Index (FII) following Minvielle and BRY (2003). The aggregation formulas are given by the following equations (1) and (2):
Equation (1) computes the sub-indices for the (t) dimensions retained. Equation (2) aggregates the sub-indices from the equation (1) to form the FII. K is the total number of variables in the analysis;
k
kjW is the normalized score of the jth category on each of the retained axes; , k
ki jI an indicator variable
taking 1 if individual i chooses category jk and 0 otherwise. In equation (2), p is the total number of the axes retained for the analysis and tλ their respective eigenvalues.
3.3 Inequality in Financial Inclusion
The Gini and concentration coefficients are used to compute the financial inclusion inequality in Chad. Following Yitzhaki (1983), the covariance-based definition of the generalized Gini and concentration coefficients can, respectively, be expressed as follows:
where Z and Y are two random variables; ( )Zµ , the mean of Z, H(Z), and G(Y) are the cumulative distribution functions, respectively. The parameter a is an inequality aversion coefficient.
(1)
(2)
1( ) cov( , (1 ( )) )( )
aZGINI Z a H ZZµ
−= − − (3)
a 1( , , ) cov( , (1 ( )) )( )ZCONC Z Y a a G ZZµ
−= − − (4)
,1
1 k
k kk
JKk k
it j i jk j
FII W IK =
= ∑∑
*pt itt
i ptt
FIIFII
λ
λ= ∑
∑
EJAE 2020 17 (2) 34 - 53IBRAHIM. M. TIDJANI. A. AN EXPLORATORY ANALYSIS OF FINANCIAL INCLUSION IN CHAD

39
The standard Gini and concentration coefficients are obtained for a=2. The standard Gini coefficient is a measure of inequality of a distribution, whereas the concentration coefficient measures how a random variable Z is concentrated on observations with high ranks in a random variable Y. Follow-ing Lerman and Yitzhaki (1985), the natural decomposition of the generalized Gini coefficient can be expressed as follows:
where j=1…. J represents the categories of individual characteristics, and ( )jZµ , the mean of the jth category of the random variable Z, the remaining parameters are as defined above. The decomposition of the financial inclusion inequality helps to identify the contribution of each characteristic to the total inequality, as well as the between and within-group inequalities. The within-group inequality captures inequality due to the variability of financial inclusion within each group, whereas the between-group inequality measures inequality in financial inclusion across the groups.
EMPIRICAL RESULTS
4.1 Descriptive Statistics
To construct the FII, 23 indicators (binary) were chosen based on their relevance to measuring financial inclusion, and data availability. To analyze the financial inclusion inequality profile, three categorical variables (gender, education, and income) were used for the decomposition. Variables de-scription and summary statistics are provided in Tables (A1) and (A2), respectively, in the appendix. In general, access to and usage of formal financial services was low in Chad in 2017. Financial inclusion was driven by mobile money (15%) penetration, which exceeded by 6 percentage points formal account ownership (9%) in Chad. The use of digital financial instruments, such as debit cards, credit cards, and online transactions, was very low in Chad. Only about 3% of adults owned a debit/credit card and fewer than 2% of adults made online transactions in the year prior to 2017. Furthermore, savings and bor-rowing were low, with fewer than 3% of adults reported having saved or borrowed in or from formal financial institutions. However, in terms of financial resilience, 37% answered yes when asked whether they could come up with 1/20 of the GNI within the next month. With respect to socio-economic characteristics, there was a near gender balance in the sampled population, and the population was nearly equally distributed in the income quintiles. However, the majority of the population had a lower level of education, 87% of which having completed primary education, or not having finished it at all.
4.2 Computation of the Financial Inclusion Index (FII)
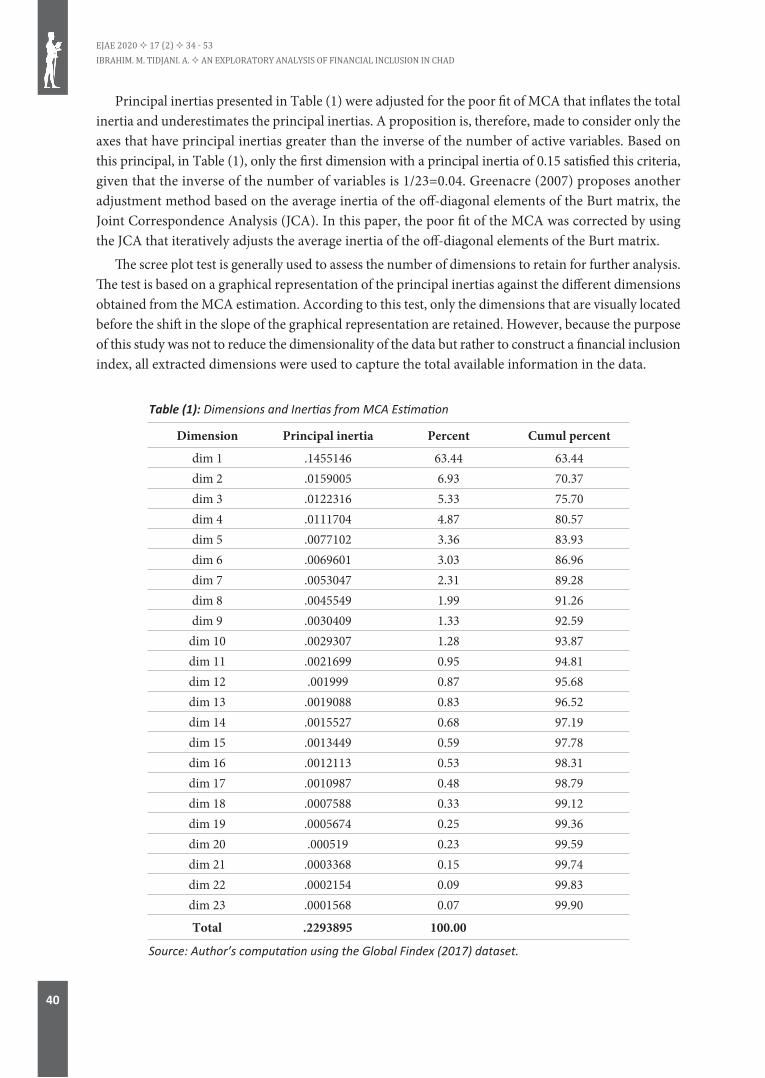
Table (1) below displays the financial inclusion dimensions and the relative inertias from the MCA estimation. A total of 23 dimensions were extracted, where the first ones summarized the largest amount of variability in the data. The extracted dimensions represented a total inertia of 0.23, and is useful in observing the inertia ratio. The amount of variation in the data accounted for by each dimension is quantified usin the corresponding principal inertia. Thus, the first four dimensions summarized, respectively, 63%, 7%, 5%, and 5%, meaning that these dimensions jointly explained 81% of the total available information in the data. The other 19 dimensions jointly explained the remaining 19%.
1
( )( , ) ( , Z, )( )
jJj
j
ZGINI Z a CONC Z aZ
µµ=
=∑ (5)
EJAE 2020 17(2) 34 - 53IBRAHIM. M. TIDJANI. A. AN EXPLORATORY ANALYSIS OF FINANCIAL INCLUSION IN CHAD
40
Principal inertias presented in Table (1) were adjusted for the poor fit of MCA that inflates the total inertia and underestimates the principal inertias. A proposition is, therefore, made to consider only the axes that have principal inertias greater than the inverse of the number of active variables. Based on this principal, in Table (1), only the first dimension with a principal inertia of 0.15 satisfied this criteria, given that the inverse of the number of variables is 1/23=0.04. Greenacre (2007) proposes another adjustment method based on the average inertia of the off-diagonal elements of the Burt matrix, the Joint Correspondence Analysis (JCA). In this paper, the poor fit of the MCA was corrected by using the JCA that iteratively adjusts the average inertia of the off-diagonal elements of the Burt matrix.
The scree plot test is generally used to assess the number of dimensions to retain for further analysis. The test is based on a graphical representation of the principal inertias against the different dimensions obtained from the MCA estimation. According to this test, only the dimensions that are visually located before the shift in the slope of the graphical representation are retained. However, because the purpose of this study was not to reduce the dimensionality of the data but rather to construct a financial inclusion index, all extracted dimensions were used to capture the total available information in the data.
Table (1): Dimensions and Inertias from MCA Estimation
Dimension Principal inertia Percent Cumul percent
dim 1 .1455146 63.44 63.44dim 2 .0159005 6.93 70.37dim 3 .0122316 5.33 75.70dim 4 .0111704 4.87 80.57dim 5 .0077102 3.36 83.93dim 6 .0069601 3.03 86.96dim 7 .0053047 2.31 89.28dim 8 .0045549 1.99 91.26dim 9 .0030409 1.33 92.59
dim 10 .0029307 1.28 93.87dim 11 .0021699 0.95 94.81dim 12 .001999 0.87 95.68dim 13 .0019088 0.83 96.52dim 14 .0015527 0.68 97.19dim 15 .0013449 0.59 97.78dim 16 .0012113 0.53 98.31dim 17 .0010987 0.48 98.79dim 18 .0007588 0.33 99.12dim 19 .0005674 0.25 99.36dim 20 .000519 0.23 99.59dim 21 .0003368 0.15 99.74dim 22 .0002154 0.09 99.83dim 23 .0001568 0.07 99.90
Total .2293895 100.00
Source: Author’s computation using the Global Findex (2017) dataset.
EJAE 2020 17 (2) 34 - 53IBRAHIM. M. TIDJANI. A. AN EXPLORATORY ANALYSIS OF FINANCIAL INCLUSION IN CHAD

41
The financial inclusion index (FII) constructed following the procedure described in subsection (3.2) is a measure of the intensity of the use of formal financial services in Chad. Thus, a higher/lower score was attributed to individuals who used more/less formal financial services. For ease of interpretation and presentation, the index was normalized using the min-max scaling and multiplied by 100, making the computed index vary between 0 and 100. To reduce the influence of outliers in the data, the index was winsorized at 1% of the extreme values. Table (2) below presents the summary statistics of the computed FII. Financial inclusion level in Chad in 2017 was low, with an average score of 24.89%. Furthermore, access to and use of formal financial services in Chad varied widely between the population, as shown by the disparity between the minimum (7.43%) and maximum (60.35%) values of the FII.
Table (2): Summary Statistics of the Computed Financial Inclusion Index (FII)
Variable Obs Mean Std. Dev. Min Max
FII 1000 24.888 9.305 7.427 60.346
Source: Author’s computation using the Global Findex (2017) dataset.
Table (A3) in the appendix reports the details of the MCA estimation. The first three columns of the table display, respectively, the mass (weights), overall quality, and the relative inertia of each variable category. The mass represents the weights endogenously generated by the MCA, the overall quality indicates the quality of the fit, and the relative inertia measures how much of the variation in the data is accounted for by the corresponding variable category. The other two blocs of columns display the coordinates (profile or position), squared correlation, and contributions of variable categories to the construction of dimensions (1) and (2), respectively. It is for the sake of brevity that only the two-first dimensions were presented. Since the first dimension explains as much variance as possible in the data, I comment on results only pertaining to this dimension, and specifically column (7) of the table.
Column (7) shows the contribution, which is the share of the corresponding variable category to the construction of the first dimension. It is found that account ownership at financial institutions “Account_fin” (7%), deposit “Fin9” (6%), withdrawal “Fin10” (6%), and debit card “Fin2” (5%) were the most important indicators of financial inclusion in Chad in terms of their relative contribution to the construction of the first dimension. These are the basic functions performed by the traditional banking system, representing the access (Account_fin) and usage (Fin9; Fin10; Fin2) dimensions. Ac-count ownership serves as an entry point to the formal financial system, thus justifying its relatively high contribution over the other indicators. Deposit and withdrawal are the classical transactions performed by the banking system. The importance of digital financial instrument, debit card ownership, in the context of Chad can be explained by the bancarization policy of salaries of civil servants in 2009 by the government. However, a striking observation is that mobile money accounted only for 0.8% to the construction of dimension (1), even though mobile money account (15%) exceeded financial institutions account ownership (9%) in Chad in 2017. However, this result can be explained by the institutional settings of mobile money services in Chad. Mobile money services providers operate through financial institutions (banks), and their activities are restricted to only domestic remittances (transfers) of a limited amount of money, unlike in other countries like Kenya, where MPESA provides additional services savings and credits.
EJAE 2020 17(2) 34 - 53IBRAHIM. M. TIDJANI. A. AN EXPLORATORY ANALYSIS OF FINANCIAL INCLUSION IN CHAD

42
4.3 Inequality in Access to Finance in Chad
Table (3) displays inequality in financial inclusion and its decomposition by individual character-istics. Despite its low level (24.89%), access to and use of financial services in Chad were not smoothly distributed among the population, as indicated by the Gini of financial inclusion (0.196). The Gini coefficient was broken down according to individual characteristics, including gender, education, and income, to draw the profile of financial inclusion inequality in Chad. This exercise helped identifying the contribution of each characteristic to the total inequality, as well as the within and between-group inequalities. Table (3) indicates the presence of inequality in financial inclusion inside and across the groups, since the within/between inequalities were different zero.
For the gender dimension, financial inclusion distribution was more highly skewed amongst women than amongst men, as indicated by their respective Gini coefficients, 0.233 and 0.164. This result was supported by the non-zero value of the within-group gender inequality (0.064), which accounted for 33% of the overall financial inclusion inequality. There was also evidence of a gender gap in financial inclusion in Chad, indicated by the between-group inequality different from zero (0.005). This means that men were more likely to gain access to and use formal financial services in Chad than women. Such between-group inequality accounted for 3% of the total financial inclusion inequality in Chad.
Table (3): Financial Inclusion Inequality Profile in Chad
Group decomposition Gini Within Between Within (%Gini)
Between (%Gini)
Gender 0.196 0.064 0.005 32.653 2.551
Female 0.233
Male 0.164
Education level 0.196 0.060 0.009 30.612 4.592
Primary 0.221
Secondary 0.102
Tertiary 0.132
Income level 0.196 0.064 0.005 32.653 2.551
Poorest 20% 0.219
Second 20% 0.180
Middle 20% 0.197
Fourth 20% 0.200
Richest 20% 0.168
Source: Author’s computation using the Global Findex (2017) dataset.
There was also evidence of a within-group education inequality of 0.060 amongst those who completed primary or less, secondary, and tertiary or more education. Moving from primary to secondary education drastically reduced within-group inequalities (from 0.22 to 0.10). However, within-group inequality increased amongst individuals who completed tertiary or more education. This result might be explained by other relevant specific characteristics. The within-education inequality contributed up
EJAE 2020 17 (2) 34 - 53IBRAHIM. M. TIDJANI. A. AN EXPLORATORY ANALYSIS OF FINANCIAL INCLUSION IN CHAD

43
to 31% to the construction of the total inequality. There was also evidence of a gap between the three sub-groups of education. The between inequality accounted for 5% of the total financial inclusion inequality in Chad. That was the highest value among the three values of between inequalities. Thus, education had the most un-equalizing effect (the most discriminating factor) on financial inclusion, consequently exacerbating financial inclusion inequality in Chad. This finding points to the importance of improving access to education in expanding financial inclusion in Chad.
The analysis of the income level showed that the richest 20% and the poorest 20% had, respectively, the lowest and highest within-group inequalities. Financial inclusion distribution was not smooth in the other quintiles as well. It raised in some cases and decreased in others. The within-group income inequality accounted for 33% of the total financial inclusion inequality. Likewise, there was financial inclusion inequality between the income quintiles, which accounted for 3% of the total inequality. Both contributions are comparable to the contributions of the between and within-group gender inequality, respectively. However, the financial inclusion inequality profile presented in Table (3) may be incom-plete because of the possible influence of the interactions between individual characteristics. Tables (4), and (5) below complement the analysis by considering the following interactions: gender-education, and gender-income, respectively.
In Table (4), the within-group inequality showed that inequality in financial inclusion is higher among women with primary education or less than among those who completed secondary education. However, there were no women who completed tertiary or more education in the sample, corroborating the gender gap in education in Chad reported by (UNDP, 2018). Within the group of men, financial inclusion inequality was higher among those who had completed primary education or less and those who had completed tertiary education or more than among those with secondary education. The between-group inequality indicated that women who had completed primary education or less and those who had completed secondary education had less access to financial services than men within the corresponding categories of education. This result corroborates the presence of a gender gap in financial inclusion in Chad found in Table (3), and the gap is further exacerbated by gender discrimination in education.
Table (4): Financial Inclusion Inequality Profile in Chad: Gender and Education
Group (gender & education) Gini Within Between
Female & completed primary or less 0.24259
0.057 0.012
Female & secondary 0.12258
Male & completed primary or less 0.19446
Male & secondary 0.09535
Male & completed tertiary or more 0.13159
Source: Author’s computation using the Global Findex (2017) dataset. Note: the group ‘female & completed tertiary’ is missing because there was no female individual with a tertiary education in the sample.
Table (5) presents the financial inclusion inequality profile considering the interaction between gender and income level. Once again, there were between and within-group inequalities, as indicated by their non-zero values, 0.009 and 0.06, respectively. In the within-group inequality, inequality was higher/lower among women belonging to the poorest 20%/richest 20%, respectively, evidencing that income exacerbates the financial inclusion gap among women in Chad.
EJAE 2020 17(2) 34 - 53IBRAHIM. M. TIDJANI. A. AN EXPLORATORY ANALYSIS OF FINANCIAL INCLUSION IN CHAD

44
For the group of men, inequality was higher/lower for men belonging to the poorest 20%/second poorest 20%, indicating that the discriminating power of income in financial inclusion is lower among men. Based on the between-group inequality (0.009), the study shows that financial inclusion inequality is higher for women than men, and for a given level of income, women have a lower likelihood to access finance than men do in Chad. Thus, Tables (4) and (5) jointly show that there was a persistent gender gap in access to formal financial services in Chad and gender discrimination in education and income (UNDP, 2018), exacerbating inequality in access to and use of formal financial services. Overall, the findings of this study corroborate from another angle the importance of gender, education, and income in expanding financial inclusion found in studies by (Fungáčová & Weill, 2015; Soumaré et al., 2016; Zins & Weill, 2016). However, these studies have not investigated the interrelations among individual characteristics in explaining financial inclusion. Thus, the present study has the merit of drawing the profile of the specific target in each group and the possibility of interaction between the groups that can be used to expand financial inclusion in Chad.
Table (5): Financial Inclusion Inequality Profile in Chad: Gender and Income
Group (gender& income) Gini Within Between
Female & Poorest 20% 0.26970
0.060 0.009
Female & Second 20% 0.21455
Female & Middle 20% 0.24356
Female & Fourth 20% 0.25421
Female & Richest 20% 0.17416
Male & Poorest 20% 0.17913
Male & Second 20% 0.14172
Male & Middle 20% 0.14504
Male & Fourth 20% 0.15870
Male & Richest 20% 0.15543
Source: Author’s computation using the Global Findex (2017) dataset.
CONCLUDING REMARKS AND POLICY IMPLICATIONS
This paper explores the state of financial inclusion in Chad. Specifically, it measures the level of access to and use of formal financial services in Chad, and assesses its distribution amongst the Chad-ian population. To achieve these objectives, the paper mobilizes cross-sectional data from the World Bank, the Global Findex (2017), on a sample of 1,000 individuals. The paper employs a multivariate technique, the Multiple Correspondence Analysis (MCA) to construct a Financial Inclusion Index (FII). The findings indicate that the average level of financial inclusion (FII) in Chad is low, 24.89% and varies between 7.43% and 60.35%. Furthermore, financial institutions account ownership, deposit, withdrawal, and debit card ownership, respectively, are found to be the most important indicators of financial inclusion in Chad in terms of their contribution to the construction of the FII.
EJAE 2020 17 (2) 34 - 53IBRAHIM. M. TIDJANI. A. AN EXPLORATORY ANALYSIS OF FINANCIAL INCLUSION IN CHAD

45
The study further assesses the financial inclusion inequality profile, adopting factor decomposition of the Gini coefficient. The findings show that, in addition to its low level, financial inclusion is not equally distributed among the Chadian population. Although the Gini coefficient is low (0.196), there exists room for smooth financial inclusion distribution in Chad. The decomposition analysis provides evidence of both within and between-group financial inclusion inequality in gender, education, and income. Gender and income have the most un-equalizing effects on financial inclusion in Chad in terms of within-group contribution, whereas education has the most discriminating power in terms of between-group inequality. The within-group inequality shows that inequality is higher amongst women than amongst men, and amongst the poor (poorest 20%) than amongst the rich (richest 20%). The between-group inequality shows that inequality is higher for individuals with lower educational levels (primary or less) than for those with a higher one (tertiary or more). In further assessing the inequality profile, interaction terms between gender, education, and income are included. It has found a persistent gender gap in access to financial services in Chad, exacerbated by discriminations in edu-cation and income.
Firstly, the paper reveals that policy interventions should target the provision of formal accounts, a reduction of costs of financial services, such as withdrawal and debit cards, and channelling savings to the formal financial system, in order to foster financial inclusion in Chad. This can be achieved with the provision of no-frills bank accounts, incentivizing banks to reach the poor by fuelling competition, and sensitizing people to save formally by developing appropriates mechanisms, such as the experiments of locked boxes for savings in the Philippines. Secondly, policy interventions that are responsive to gender, education, and income, which are found to exacerbate inequality in financial inclusion in Chad, need to be designed. Thus, policies aimed at closing the gender gap in education and promoting income-generating activities for women may foster and facilitate the distribution of financial inclusion in Chad. Improving women’s education increases their financial literacy, and boosts their income so that they can afford formal financial services. Future research needs to identify the specific constraints for women’s access to education and economic participation in order to adequately address these issues in Chad.
REFERENCES
Abor, J. Y., Amidu, M., & Issahaku, H. (2018). Mobile telephony, financial inclusion and inclusive growth. Journal of African Business, 19(3), 430-453.
Adegbite, O. O., & Machethe, C. L. (2020). Bridging the financial inclusion gender gap in smallholder agriculture in Nigeria: An untapped potential for sustainable development. World Development, 127, 104755. DOI: 10.1016/j.worlddev.2019.104755
Aka, B. E. (2010). Développement financier, croissance économique et productivité globale des facteurs en Afrique Sub‐saharienne. African Development Review, 22(1), 23-50.
Allen, F., Carletti, E., Cull, R., Qian, J. Q., Senbet, L., & Valenzuela, P. J. (2014). The African financial development and financial inclusion gaps. Journal of African Economies, 23(5), 614-642.
Ayyagari, M., Beck, T., & Hoseini, M. (2020). Finance, law and poverty: Evidence from India. Journal of Corporate Finance, 60, 101515. DOI: 10.1016/j.jcorpfin.2019.101515
Bruhn, M., & Love, I. (2014). The real impact of improved access to finance: Evidence from Mexico. The Journal of Finance, 69(3), 1347-1376.
Cámara, N., & Tuesta, D. (2014). Measuring Financial Inclusion: A Multidimensional Index. BBVA Research Paper (14/26).
Churchill, S. A., & Marisetty, V. B. (2020). Financial inclusion and poverty: a tale of forty-five thousand households. Applied Economics, 52(16), 1777-1788.
EJAE 2020 17(2) 34 - 53IBRAHIM. M. TIDJANI. A. AN EXPLORATORY ANALYSIS OF FINANCIAL INCLUSION IN CHAD

46
Coulibaly, A., & Yogo, U. T. (2020). The path to shared prosperity: Leveraging financial services outreach to create decent jobs in developing countries. Economic Modelling, 87, 131-147.
De Haan, J., & Sturm, J.-E. (2017). Finance and income inequality: A review and new evidence. European Journal of Political Economy, 50, 171-195.
Demetriades, P. O., & James, G. A. (2011). Finance and growth in Africa: The broken link. Economics Letters, 113(3), 263-265.
Demirguc-Kunt, A., Klapper, L., Singer, D., Ansar, S., & Hess, J. (2018). The Global Findex Database 2017: Meas-uring financial inclusion and the fintech revolution. The World Bank.
Dimova, R., & Adebowale, O. (2018). Does access to formal finance matter for welfare and inequality? Micro level evidence from Nigeria. The Journal of Development Studies, 54(9), 1534-1550.
Dixit, R., & Ghosh, M. (2013). Financial inclusion for inclusive growth of India-A study of Indian states. Inter-national Journal of Business Management and Research, 3(1), 147-156.
Fungáčová, Z., & Weill, L. (2015). Understanding financial inclusion in China. China Economic Review, 34, 196-206. Gadom, D.-G., Fondo, S., & Totouom, A. (2018). Rente pétrolière et disparité des revenus au Tchad. Mondes en
développement, 183(3), 71-90. Gadom, G. D., Djossou, G. N., Kane, G. Q., & Mboutchouang Kountchou, A. (2019). Multidimensional Poverty
Dynamic in Chad, Analysis of. In A. Farazmand (Ed.), Global Encyclopedia of Public Administration, Public Policy, and Governance (pp. 1-10). Springer International Publishing. DOI: https://doi.org/10.1007/978-3-319-31816-5_646-1
Greenacre, M. J. (2017). Correspondence analysis in practice. Boca Raton: Chapman & Hall/CRC. DOI: https://doi.org/10.1201/9781315369983
Honohan, P. (2008). Cross-country variation in household access to financial services. Journal of Banking & Finance, 32(11), 2493-2500.
Ibrahim, M., & Alagidede, P. (2018). Nonlinearities in financial development–economic growth nexus: Evidence from sub-Saharan Africa. Research in International Business and Finance, 46, 95-104.
Inoue, T., & Hamori, S. (2016). Financial access and economic growth: Evidence from Sub-Saharan Africa. Emerging Markets Finance and Trade, 52(3), 743-753.
Jauch, S., & Watzka, S. (2016). Financial development and income inequality: a panel data approach. Empirical Economics, 51(1), 291-314.
Kaidi, N., & Mensi, S. (2019). Financial Development, Income Inequality, and Poverty Reduction: Democratic Versus Autocratic Countries. Journal of the Knowledge Economy, 1-24.
Kassambara, A. (2017). Practical Guide To Principal Component Methods in R: PCA, M (CA), FAMD, MFA, HCPC, factoextra. STHDA.
Kuada, J. (2019). Financial Inclusion and the Sustainable Development Goals. In Extending Financial Inclusion in Africa (pp. 259-277). Elsevier.
Lerman, R. I., & Yitzhaki, S. (1985). Income inequality effects by income source: A new approach and applications to the United States. The review of economics and statistics, 67(1), 151-156.
MEPD. (2017). Plan National de Development, PND 2017-2021. https://www.refworld.org/pdfid/5b34ac4f4.pdfMinvielle, J.-P., & BRY, X. (2003). Critique de l’Indicateur de Pauvreté Humaine du PNUD et proposition d’un
Indice Synthétique de la Pauvreté Humaine (ISPH). Cahier du C3ED N, 3, 1. Park, C.-Y., & Mercado Jr, R. (2018). Financial inclusion, poverty, and income inequality. The Singapore Economic
Review, 63(01), 185-206. Sarma, M., & Pais, J. (2011). Financial inclusion and development. Journal of international development, 23(5),
613-628. Sha'ban, M., Girardone, C., & Sarkisyan, A. (2020). Cross-country variation in financial inclusion: a global perspective.
The European Journal of Finance, 26(4-5), 319-340.
EJAE 2020 17 (2) 34 - 53IBRAHIM. M. TIDJANI. A. AN EXPLORATORY ANALYSIS OF FINANCIAL INCLUSION IN CHAD

47
Soumaré, I., Tchana Tchana, F., & Kengne, T. M. (2016). Analysis of the determinants of financial inclusion in Central and West Africa. Transnational Corporations Review, 8(4), 231-249.
Swamy, V. (2014). Financial Inclusion, Gender Dimension, and Economic Impact on Poor Households. World development, 56, 1-15.
Uddin, A., Chowdhury, M. A. F., & Islam, M. N. (2017). Determinants of financial inclusion in Bangladesh: Dynamic GMM & quantile regression approach. The Journal of Developing Areas, 51(2), 221-237.
UNDP, H. (2018). Human development indices and indicators: Briefing note for countries on the 2018 Statistical Update.
Weber, O., & Ahmad, A. (2014). Empowerment through microfinance: The relation between loan cycle and level of empowerment. World development, 62, 75-87.
Yitzhaki, S. (1983). On an extension of the Gini inequality index. International economic review, 24(3), 617-628. Zins, A., & Weill, L. (2016). The determinants of financial inclusion in Africa. Review of Development Finance,
6(1), 46-57.
EJAE 2020 17(2) 34 - 53IBRAHIM. M. TIDJANI. A. AN EXPLORATORY ANALYSIS OF FINANCIAL INCLUSION IN CHAD

48
APPENDIXES
Table (A1): Description of variables used in the study
Indicators Code DescriptionFinancial institution account accnt_fin Do you have an account at a formal financial institution?
Account mobile money accnt_mob Do you have an account in a mobile money services provider?Debit Card fin2 Do you, personally, have a debit card?Credit Card fin7 Do you, personally, have a credit card?Loan for home, fin19 Do you currently have a loan to purchase a home, apartment, or land?
Borrowing fin22a Have you borrowed money from a bank or another type of formal financial institution?
Saving fin17a Have you saved money using an account at a bank or another type of formal financial institution?
Online_bill_pay fin14a Have you used the Internet, whether on a mobile phone, a computer, or some other device, to make bill payments?
Bought online fin14b Have you used the Internet, whether on a mobile phone, a computer, or some other device, to buy something online?
Financial resilience fin24 Is it possible to come up with [1/20 of GNI per capita in local currency] within the next month?
Own debit card use fin4 have you used your OWN debit card DIRECTLY to make a purchase?
Mobile phone use for payments fin5
did you ever use a MOBILE PHONE or the Internet to make a payment, to buy something, or to send money FROM your account at a bank or another type of financial institution?
Mobile phone use to check account fin6 have you checked your account balance using a mobile phone or the
Internet?Credit card use fin8 have you, personally, used your credit card?Deposit fin9 has money ever been DEPOSITED into your personal account(s)?Withdrawal fin10 has money ever been TAKEN OUT of your personal account(s)?Remittance received: account fin29a Have you received money through a bank or another type of
formal financial institution?Remittance: mobile fin29b Have you received money through a mobile phone?
Sent money: account fin27a Have you sent money through a bank or another type of formal financial institution?
Sent money: mobile fin27b Have you sent money through a mobile phone?
Payment: account fin31a Have you used an account at a bank or another type of formal financial institution to directly make a payment?
Payment: mobile fin31b Have you used a mobile phone to make a payment?
Gender gender Is the gender of the respondent. It is a dummy variable that takes 1 if the respondent is male and 0 if female.
Education educIs the educational level attained by the respondent. It is a categorical variable taking 1 if completed primary or less, 2 if completed secondary and 3 if tertiary or more.
Income quintile Inc_quintIt is a categorical variable taking 1 if the respondent belongs to the poorest quintile; 2, if the second poorest; 3, if the middle; 4 if the fourth and 5 if the richest quintile.
Source: The Global Findex (2017).
EJAE 2020 17 (2) 34 - 53IBRAHIM. M. TIDJANI. A. AN EXPLORATORY ANALYSIS OF FINANCIAL INCLUSION IN CHAD

49
Table (A2): Descriptive statistics
Variables percentage observationAccount fin
no 91.25 853yes 8.753 147
Account mobno 84.77 824yes 15.23 176
Debit cardno 96.67 881yes 3.332 56
credit cardno 96.79 899yes 3.215 39
Bill payment onlineno 98.74 956yes 1.261 24
Bought onlineno 98.26 947yes 1.742 23
Savingno 97.36 926yes 2.638 47
Loanno 96.76 941yes 3.235 49
Borrowedno 97.13 939yes 2.872 40
Fin resiliencenot possible 62.88 549
possible 37.12 429Gender
female 51.28 363Male 48.72 637
Educationcomplete 87.29 662secondary 12.16 323complete .5444 15
Income levelpoorest 19.84 161
second 2 20.16 185middle 2 19.85 172fourth 2 20.15 191richest 20 291
Source: Author’s calculation on the Global Findex (2017).
EJAE 2020 17(2) 34 - 53IBRAHIM. M. TIDJANI. A. AN EXPLORATORY ANALYSIS OF FINANCIAL INCLUSION IN CHAD

50
Table (A3): Detailed results of the MCA
dimension_1 dimension_2
Categories mass overall quality %inert coord sqcorr contrib coord sqcorr contrib
account no 0.031 0.924 0.013 0.258 0.881 0.015 -0.057 0.042 0.009yes 0.012 0.924 0.034 -0.666 0.881 0.040 0.146 0.042 0.023
account_fin no 0.037 0.983 0.010 0.215 0.969 0.013 0.027 0.015 0.002yes 0.006 0.983 0.056 -1.248 0.969 0.073 -0.154 0.015 0.014
account_mob no 0.036 0.816 0.003 0.083 0.419 0.002 -0.081 0.397 0.021yes 0.008 0.816 0.015 -0.388 0.419 0.008 0.378 0.397 0.098fin2 no 0.038 0.734 0.002 0.088 0.649 0.002 0.032 0.084 0.003yes 0.002 0.931 0.042 -1.706 0.919 0.052 -0.196 0.012 0.008
sysmiss 0.003 0.260 0.009 0.289 0.139 0.002 -0.269 0.121 0.018fin7 no 0.039 0.402 0.001 0.047 0.354 0.001 0.017 0.048 0.001yes 0.002 0.770 0.029 -1.555 0.769 0.030 0.056 0.001 0.000
sysmiss 0.003 0.273 0.009 0.293 0.140 0.002 -0.286 0.134 0.020fin19
no 0.041 0.835 0.001 0.057 0.810 0.001 0.010 0.025 0.000yes 0.002 0.920 0.017 -1.157 0.917 0.021 -0.067 0.003 0.001
sysmiss 0.000 0.184 0.006 0.345 0.045 0.000 -0.603 0.138 0.014fin22a
no 0.041 0.782 0.001 0.049 0.755 0.001 0.009 0.027 0.000yes 0.002 0.909 0.017 -1.271 0.909 0.021 -0.001 0.000 0.000
sysmiss 0.001 0.226 0.005 0.240 0.058 0.000 -0.409 0.168 0.014fin17a
no 0.040 0.801 0.001 0.066 0.732 0.001 0.020 0.070 0.001yes 0.002 0.932 0.027 -1.487 0.929 0.033 -0.080 0.003 0.001
sysmiss 0.001 0.310 0.009 0.330 0.080 0.001 -0.557 0.230 0.033fin14a
no 0.042 0.428 0.000 0.030 0.421 0.000 0.004 0.006 0.000yes 0.001 0.751 0.016 -1.405 0.720 0.015 0.290 0.031 0.008
sysmiss 0.001 0.184 0.009 0.251 0.034 0.000 -0.525 0.150 0.022fin14b
no 0.041 0.368 0.000 0.024 0.354 0.000 0.005 0.014 0.000yes 0.001 0.738 0.011 -1.190 0.716 0.010 0.210 0.022 0.004
sysmiss 0.001 0.186 0.005 0.154 0.036 0.000 -0.313 0.150 0.011fin24
Not possible 0.024 0.870 0.005 0.182 0.810 0.006 -0.049 0.060 0.005
EJAE 2020 17 (2) 34 - 53IBRAHIM. M. TIDJANI. A. AN EXPLORATORY ANALYSIS OF FINANCIAL INCLUSION IN CHAD

51
Possible 0.019 0.912 0.007 -0.246 0.841 0.008 0.071 0.070 0.008sysmiss 0.001 0.238 0.002 0.257 0.177 0.000 -0.150 0.060 0.002
fin4 no 0.001 0.910 0.029 -1.820 0.895 0.035 -0.233 0.015 0.007yes 0.001 0.838 0.018 -1.982 0.830 0.020 -0.204 0.009 0.003
sysmiss 0.041 0.933 0.002 0.096 0.920 0.003 0.012 0.013 0.000fin5 no 0.004 0.939 0.049 -1.422 0.887 0.059 -0.344 0.052 0.042yes 0.001 0.839 0.025 -2.058 0.839 0.028 -0.032 0.000 0.000
sysmiss 0.039 0.987 0.008 0.194 0.954 0.011 0.036 0.033 0.005fin6 no 0.004 0.927 0.045 -1.415 0.876 0.053 -0.340 0.051 0.038yes 0.001 0.905 0.028 -1.900 0.901 0.033 -0.134 0.004 0.002
sysmiss 0.039 0.986 0.008 0.194 0.953 0.011 0.036 0.033 0.005fin8 no 0.001 0.651 0.009 -1.352 0.641 0.008 -0.167 0.010 0.001yes 0.001 0.746 0.023 -1.654 0.740 0.023 0.159 0.007 0.003
sysmiss 0.042 0.769 0.001 0.063 0.769 0.001 -0.002 0.001 0.000fin9 no 0.002 0.825 0.028 -1.299 0.771 0.029 -0.346 0.055 0.025yes 0.003 0.948 0.046 -1.721 0.933 0.058 -0.222 0.015 0.012
sysmiss 0.038 0.985 0.009 0.197 0.949 0.011 0.038 0.036 0.005fin10
no 0.002 0.821 0.027 -1.277 0.771 0.028 -0.327 0.051 0.023yes 0.003 0.952 0.047 -1.749 0.935 0.059 -0.238 0.017 0.013
sysmiss 0.038 0.985 0.009 0.197 0.950 0.011 0.038 0.036 0.005fin29a
no 0.008 0.577 0.010 -0.185 0.155 0.002 0.305 0.422 0.071yes 0.002 0.912 0.019 -1.102 0.875 0.022 0.226 0.037 0.011
sysmiss 0.032 0.777 0.006 0.130 0.506 0.004 -0.095 0.271 0.027fin29b
no 0.004 0.510 0.007 -0.378 0.488 0.004 0.080 0.022 0.002yes 0.007 0.834 0.015 -0.389 0.387 0.008 0.419 0.447 0.107
sysmiss 0.032 0.778 0.006 0.129 0.495 0.004 -0.098 0.283 0.028fin27a
no 0.008 0.609 0.011 -0.285 0.336 0.005 0.257 0.273 0.049yes 0.003 0.925 0.029 -1.306 0.920 0.036 0.102 0.006 0.003
sysmiss 0.032 0.850 0.009 0.190 0.733 0.009 -0.076 0.117 0.017fin27b
no 0.004 0.660 0.010 -0.541 0.660 0.008 0.012 0.000 0.000yes 0.007 0.869 0.018 -0.534 0.619 0.015 0.340 0.250 0.076
sysmiss 0.032 0.844 0.009 0.188 0.718 0.008 -0.078 0.126 0.018
EJAE 2020 17(2) 34 - 53IBRAHIM. M. TIDJANI. A. AN EXPLORATORY ANALYSIS OF FINANCIAL INCLUSION IN CHAD

52
fin31a no 0.004 0.452 0.013 -0.492 0.431 0.007 0.107 0.020 0.004yes 0.001 0.659 0.010 -1.158 0.623 0.009 0.280 0.036 0.006
sysmiss 0.038 0.578 0.002 0.078 0.551 0.002 -0.017 0.027 0.001fin31b
no 0.004 0.351 0.011 -0.418 0.346 0.005 0.055 0.006 0.001yes 0.001 0.746 0.013 -1.145 0.671 0.012 0.383 0.075 0.016
sysmiss 0.038 0.580 0.002 0.078 0.552 0.002 -0.018 0.028 0.001Source: Author’s calculation on the Global Findex (2017).
EJAE 2020 17 (2) 34 - 53IBRAHIM. M. TIDJANI. A. AN EXPLORATORY ANALYSIS OF FINANCIAL INCLUSION IN CHAD

53
ISTRAŽIVAČKA ANALIZA FINANSIJSKE INKLUZIJE U ČADU
Rezime: Ovaj rad ima za cilj da istraži stanje finansijske inkluzije u Čadu. Usva-janjem višestruke analize korespondencije (MCA) na uzorku od 1000 pojedinaca iz Global Findex-a (2017), studija je merila inkluzivnost finansijskih sistema u Čadu kroz Indeks finansijske inkluzije (FII). Pored toga, procenjena je raspodela FII koristeći faktor dekompozicije Džini koeficijenta. Zaključci su pokazali da je prosečna FII bila niska, 24,89% i da je varirala između 7,43% i 60,35 %. Računi finansijskih institucija, polaganje i podizanje novca i vlasništvo nad debitnim karticama bili su najuticajniji pokazatelji finansijske inkluzije u Čadu. Pored toga, u radu je pokazano da, uprkos njenom niskom stepenu, finansijska inkluzija nije ravnomerno raspoređena među populacijom u toj zemlji (Džini koeficijent 0,196). Analiza profila nejednakosti finansijske inkluzije pokazala je da u Čadu postoji stalni jaz između polova u vezi sa finansijskom inkluzijom, a tu situaciju pogoršava diskriminacija u obrazovanju i prihodima. Stoga bi intervencije politikama trebalo da budu usmerene na obezbeđivanje formalnih računa, smanjenje troškova finansijskih usluga (podizanje novca i debitne kartice) i podsticanje formalne štednje kreiranjem adekvatnih štednih proizvoda, kako bi se podstakla finansijska inkluzija u Čadu. Pored toga, te politike bi trebalo responzivne na pol, uz istovremeno vođenje računa o njihovoj interakciji sa obrazovanjem i prihodima.
Ključne reči: Indeks finansijske inkluzije, višestruka analiza korespondencije, dekompozicija nejednakosti, Čad.
EJAE 2020 17(2) 34 - 53IBRAHIM. M. TIDJANI. A. AN EXPLORATORY ANALYSIS OF FINANCIAL INCLUSION IN CHAD