an expert system for predictive quality control in industrial
TRANSCRIPT

An expert system for predictive quality
control in industrial production
Focusing on the knowledge acquisition process with
several experts
Alain MILLE1 Daniel PIALOT2 André MICHEL1
and
Jean Marie BECKER(1), Luc DELCROIX3, Olivier LECOINTRE(2), Marc POURPRIX(3), Thierry SIMONI(1),
Claude STELLMANN(2)
1LISA-Informatique Industrielle, CPE Lyon, 31 Place Bellecour, 69288, Lyon Cedex02 2Société Rhône-Mérieux, Service des Biomathématiques,254 Rue Marcel Mérieux, 69007 Lyon 3Société DIPOLE, Rue Claude Terrasse, 69210 L’Arbresle

2
Sommaire
1. THE THREE TASKS ASSIGNED TO THE SYSTEM ARE : TO DETECT QUALITY DRIFT, TO GIVE EXPLANATIONS AND TO PLAN REMEDIAL ACTION 4
1.1 The vaccine production process is completed in several stages which take place in strictly separate areas 4
1.2 The main goals of the system are: to detect quality drifts and to modify production parameters in order to remedy the problem. 5
2. INVESTIGATION OF PAST PRODUCTION AND ELICITATION OF EXPERTISE ARE THE TWO FACETS OF THE MODELING WORK 6
2.1 Statistical analysis of past production allows the creation of multivariate control maps 6
2.2 Elicitation of expertise is a long and difficult process; knowledge representation is easier 7 2.2.1 The three phases of the knowledge elicitation process are : preparation stages, interviews and synthesis. 9 2.2.2 Knowledge representation 18
3. THE SYSTEM IS USER-FRIENDLY AND ENCOURAGES TRACEABILITY 18
4. DISCUSSION: TOWARD A CASE BASED REASONING SYSTEM IMPLEMENTED IN A MULTIAGENT CONTEXT 21
4.1 About the multivariate control map 21
4.2 About the knowledge elicitation process 21 4.2.1 Knowledge acquisition as the modeling of expert tasks 21 4.2.2 The multiexpert context is a major characteristic of our work 23
5. CONCLUSION 25
Figures
Figure 1-1 Description of a production stage ____________________________________________________ 5 Figure 1-2 SADT model_____________________________________________________________________ 5 Figure 2-1 Timetable of the knowledge elicitation process _________________________________________ 11 Figure 2-2 Two diagrams of indicative trends for some variables of a series___________________________ 15 Figure 3-1 Multivariate control map __________________________________________________________ 19 Figure 3-2 General description of a typical session using the decision-helping system __________________ 19 Figure 4-1 Proposed architecture for future development _________________________________________ 25

3
Monitoring the quality of an industrial product such as veterinary vaccines is a difficult challenge, especially
when it has to be implemented in « real time » on the production line. This is firstly because vaccines are made
in batches which go through a sequence of operations, each taking place in strictly separate areas of the factory,
due to biological constraints, and secondly because each operation involves a high degree of specialist
expertise.
The system CCMV (Carte de Contrôle Multivariée) described below was developed in order to improve quality
management in the triple context of batch processing, monitoring by a large number of parameters and
assessment by several different experts.
CCMV consists in collecting data on the different reactors while they are working, in order to fire an early
warning on any detected quality drift and display to the operators what remedial action they should take.
To achieve this early detection, the system had to integrate some of the sophisticated statistical tools used in
multivariate analysis, some simulation models of the biochemical reactions involved along the production line
and a rule-based expert system encapsulating the multi-faceted knowledge of the Company’s engineers.
Multivariate discriminant analysis yields a quality control map on which all batches can be positioned.
The control map provides a graphical support displaying clusters of batches of similar quality. The allocation of
a new batch to a quality group can therefore be estimated not only by calculation but also at a glance by the
operator.
The project was an industrial one. The design of the resulting CCMV stressed the importance of complying
strictly with specifications of robustness, data safety, «rules of good manufacturing » and user friendliness.
The project lasted two years and CCMV is now in test on the production site.
The article presents briefly the features of the CCMV as it is run now. We then focus on the complexity of the
knowledge acquisition process. We discuss our experience with regard to recent research work on knowledge
acquisition. We conclude the article by a proposal for further study in the framework of Case Based Reasoning
and traceability Agent Architecture.
4
1. The three tasks assigned to the system are : to detect quality drift, to give explanations and to plan remedial action
1.1 The vaccine production process is completed in several stages
which take place in strictly separate areas
The system works in the context of batch processing of veterinary vaccines. The production runs in different
phases each taking place in a separate area. Each area is reserved for a specific activity, either a production
activity, or a control activity. The passage from one area to another is strictly controlled and a control sheet
follows the batch throughout the process. At the end of each production phase, the product is carried inside
containers or by pipes for temporary storage in a specific area. The sterility of the product must be guaranteed, so
particular attention is paid to intermediate storage conditions. Each area is under the responsibility of a different
team and precise protocols have been written to ensure sterility throughout the process. When a product is
collected by an area team, it is assumed that all the upstream activities have been carried out correctly. Interested
readers could consult [Cam83and [Fon86]for more information about production of veterinary vaccines.
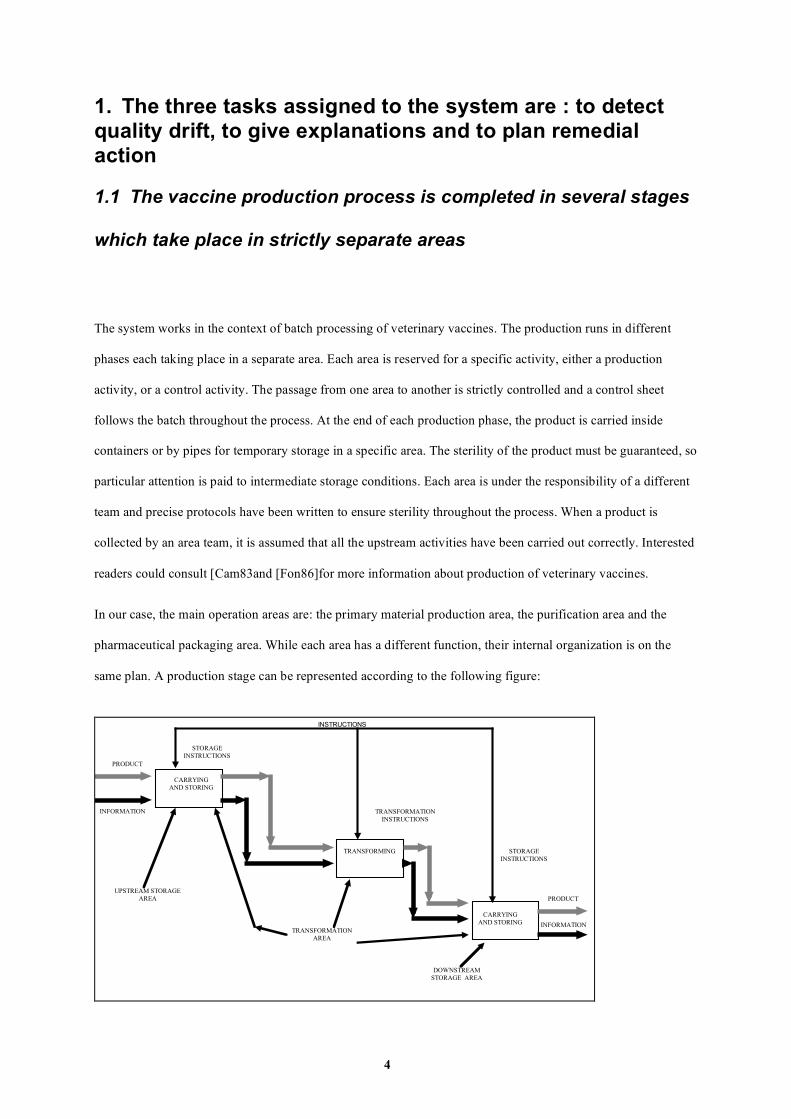
In our case, the main operation areas are: the primary material production area, the purification area and the
pharmaceutical packaging area. While each area has a different function, their internal organization is on the
same plan. A production stage can be represented according to the following figure:
PRODUCT
INFORMATION
INSTRUCTIONS
INFORMATION
UPSTREAM STORAGE
AREA
STORAGE
INSTRUCTIONS
TRANSFORMATION
INSTRUCTIONS
STORAGE
INSTRUCTIONS
PRODUCT
CARRYING
AND STORING
DOWNSTREAM
STORAGE AREA
TRANSFORMING
CARRYING
AND STORING
TRANSFORMATION
AREA

5
Figure 1-1 Description of a production stage
Figure 1-1 uses the SADT (Structured Analysis Design Technique)
model to express activities, controls, mechanisms and the information-
production stream. The following figure recalls the essentials of the
model:
Control and
instructions
Input streams Output streams
Supporting
Mechanism
The product, together with its description sheet, is taken out of
storage according to specific instructions. This operation is
initiated by the transformation area team according to a schedule (
Schedule assisted by a central computer).
Information and product are carried into the transformation area to
be processed according to the transformation instructions.
When the process is finished, the product is carried out and stored
in the downstream storage area with its updated description sheet.
The storage is under the double responsibility of the upstream and
downstream transformation areas.
Figure 1-2 SADT model
Such a model is useful for describing the compartmentalization of the production line. When the product is
correct for a downstream area, there is a signed acceptance that the upstream production is correct. The goal of
such compartmentalization is to be able to trace any sterility problem and the point at which it occurs. It is this
aspect of the organization which demands a multi expert knowledge acquisition process.
1.2 The main goals of the system are: to detect quality drifts and to
modify production parameters in order to remedy the problem.
Because vaccine batches need close attention to safety and quality rules, the Company must follow each batch
throughout its production cycle according to many parameters. The analysis of the historical data of many
batches of the same vaccine show that some parameters more than others have an impact on the final quality.
The batch quality is established at the end of the production by effectiveness and sterility tests and can later be
confirmed or denied by customer feedback, for example in the case of poor appearance. When there is quality
drift, the Company needs the system to give explanations about the phenomenon to the operators and to propose
corrective action to steer the quality back to the acceptable standard.
We are assuming that all the necessary expertise can be found in-house. Our task is to formalize this expertise
and to encapsulate the resulting knowledge in an expert system to provide effective help in the case of quality

6
drift. The detection of a quality drift is based on statistical similarity between the current batch and the batches
available in the historical data base. The quality rank of the closest cluster on the control map is assigned to the
current batch.
2. Investigation of past production and elicitation of
expertise are the two facets of the modeling work
This section presents the preliminary work carried out to acquire information about statistics from previous
production and how experts currently cope with quality drift.
2.1 Statistical analysis of past production allows the creation of
multivariate control maps
We divided the data from past production into segments and analyzed each phase of the production separately:
first, the historical data about the production of the primary material , then data on purification and finally that
on pharmaceutical packaging. We used this data to create local control maps for each production area. For each
stage of the production , historical data is available about the production itself and about the quality obtained.
Usually, several quality parameters are available. Correlation between parameters are analyzed and compared to
the whole set of historical data. This can be done either by using Principal Components Analysis (when all
parameters are quantitative) or by using Multiple Correspondences Analysis (if some parameters are
qualitative).[ LMN77]. The corresponding quality groups chosen as future references are based on the
multivariate analysis results (4 groups in the prototype - « very good », « good », « acceptable» and
« unacceptable»). A quality rank is assigned to each batch in the historical database. The data relating to the
production is then examined. We try to find correspondences between observations on the production and the
quality rank assigned to the batch.. We use discriminant factorial analysis on qualitative variables [Sap90]
because of the constant presence of qualitative parameters within the production data. Factorial planes of
discriminant analysis provide the support for the graphical representation of a multivariate control map. This
approach comes from [Cos84] and from [Pia90]. A convex envelope of each cluster is drawn on the control map.
Depending on the characteristics of the real or simulated process, each batch is projected onto the control map. It
is then easy to see immediately in which quality group the batch falls and to predict what will be its quality rank
7
if nothing changes. If a batch leaves its quality group (in terms of distance on the control map) we must decide
whether there has been a change in the production or whether data about this batch is unreliable. In the first case
the database has to be revised. In the second case, the batch data has to be ignored in the calculations.
From production characteristics (real or simulated), we compute a distance between the batch and the center of
each quality group. The batch gets the quality rank of the nearest group. If the batch is too far from all the groups
(according to an agreed threshold) it does not receive a quality rank.
If the production gets a bad quality rank, or is on the borderline of an « unacceptable » group, we compute the
relative contribution of each production parameter to that result, and we retain those parameters which are most
heavily implicated (in our prototype: two parameters).
2.2 Elicitation of expertise is a long and difficult process;
knowledge representation is easier
The compartmentalization of the production process and the number of different areas concerned demand that
we collect knowledge from several experts. They are in executive positions and possess both theoretical and
practical knowledge of the process. Experts are chosen among those responsible for different production areas.
They are involved in the production process at different stages and so have quite different points of view on the
product and its characteristics. Some of them have long experience of several areas and, when necessary, they
are brought together to explain possible quality problems. Such a meeting is of course quite rare. It is an
exceptional procedure and not very well documented; it seems to consist of a collective reconstitution of the
« history » of the batch concerned. Of course, information about these investigations is highly confidential.
However, we are very interested in this procedure because it corresponds largely to the tasks we have to model
in our expert system - interpreting drift and planning remedial action -.
Work organization
Elicitation of expertise has three main objectives:
- eliciting the quality criteria used by each expert.
- eliciting the parameters that the expert feels are most important for explaining quality drift.

8
- gathering knowledge from each stage of production and from each area to identify cause-effect
relationships in the production process ( as seen from a quality point of view).
The working group is composed of:
- A Project Manager - who represents the company in the group and must coordinate the project.
- An industrial leader and a scientific leader to provide guidance on the interviews
- Four « Knowledge Engineers ».
- Eight experts nominated by the Project Manager, one for each production area: - Primary product preparation - Primary material production - Purification - Pharmaceutical packaging - Physical and chemical controls - Biological controls.
A generalist is added and, in one of the areas, two experts are brought in for the interviews.
A classical method is used:
- exploiting to the maximum the written material available,
- using sound-recorded, reported4 and validated5 interviews.
- asking the expert to « reason out loud » about production cases.
- generalizing information drawn from individual cases.
The knowledge elicitation process is complex because of the number of experts and because several
« knowledge engineers » are necessary to complete the work in time6. The work lasted around six months, and
we detail it in the next paragraphs. Key-moments and interesting points are emphasized while the elicitation
process is presented in a chronological way.
4The interviews are not reported verbatim but only in summary. This decision was made in order to save time. But lost
information can be important and biases can occur easily. We now think that it is preferable to make a verbatim report of an interview.
5The report of the interview is submitted to the expert who can modify it. One bias often observed occurs when the expert modifies the report in order to transform it into a kind of « course manual » on the subject.
6Compartmentalization of the factory makes for the compartmentalization of knowledge, so that it is difficult to gather and make connections between the different knowledge bases.

9
2.2.1 The three phases of the knowledge elicitation process are : preparation stages,
interviews and synthesis.
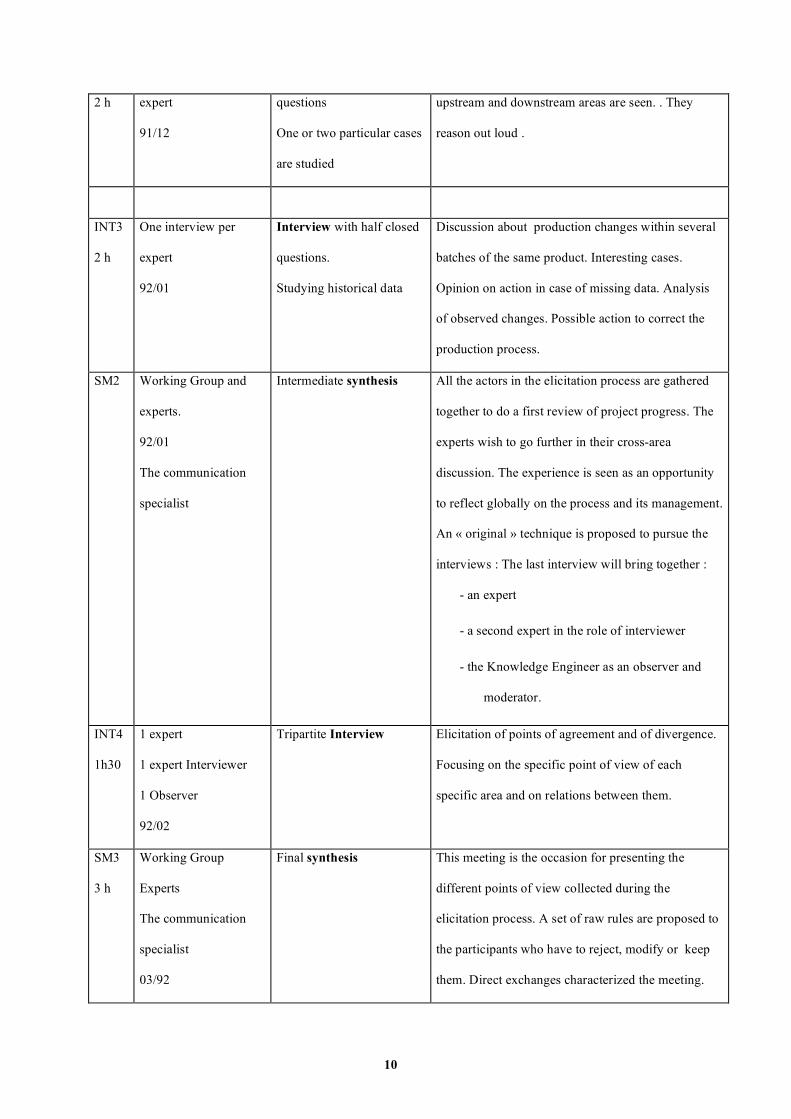
The following table presents a summary of the different stages followed in the elicitation process. After the
synthesis, key-points and lessons from experience are emphasized in the following paragraphs.
Stage
code
Time table and short
description of the
event
Stage category Comments about goals and results of each stage
PM1 Working Group
3 meetings on 2
months
91/09,91/10
Preparation Meetings The working group prepares its strategy, its methods
and the calendar. Interviewers agree about goals and
tools of the knowledge elicitation process.
PM2 Working Group and
Experts
One meeting
91/10
Preparation
Project presentation to the
experts. Discussion about
the knowledge elicitation
process
A specialist in Communication leads the meeting.
The experts are invited to react to the project and to
express themselves about their role in the process.
The experts are more or less convinced by the system
and prefer to reserve judgment.
PM3 Working Group
One meeting
91/11
Preparation
Interview simulation and
discussion between
interviewers and the
working group.
Training the interviewers. Time control, elicitation
control points, ...Observers react by reporting back on
strengths and weaknesses of the interview. Cassette
recorders are tested.
INT1
1 h
One interview per
expert
91/11
Interview with open
questions
The production process as it is seen by the experts,
their convictions, their practice, their general
experience. The first interview is easy to run,
everybody wants to go ahead.
SM1 Working group Synthesis Meeting
Weaknesses of the knowledge elicitation method.
The strategy is modified towards a task more
centered on historical data.
INT2 One interview per Interview with semi-closed Expert Reactions. Their opinion on their area. How
10
2 h expert
91/12
questions
One or two particular cases
are studied
upstream and downstream areas are seen. . They
reason out loud .
INT3
2 h
One interview per
expert
92/01
Interview with half closed
questions.
Studying historical data
Discussion about production changes within several
batches of the same product. Interesting cases.
Opinion on action in case of missing data. Analysis
of observed changes. Possible action to correct the
production process.
SM2 Working Group and
experts.
92/01
The communication
specialist
Intermediate synthesis All the actors in the elicitation process are gathered
together to do a first review of project progress. The
experts wish to go further in their cross-area
discussion. The experience is seen as an opportunity
to reflect globally on the process and its management.
An « original » technique is proposed to pursue the
interviews : The last interview will bring together :
- an expert
- a second expert in the role of interviewer
- the Knowledge Engineer as an observer and
moderator.
INT4
1h30
1 expert
1 expert Interviewer
1 Observer
92/02
Tripartite Interview
Elicitation of points of agreement and of divergence.
Focusing on the specific point of view of each
specific area and on relations between them.
SM3
3 h
Working Group
Experts
The communication
specialist
03/92
Final synthesis This meeting is the occasion for presenting the
different points of view collected during the
elicitation process. A set of raw rules are proposed to
the participants who have to reject, modify or keep
them. Direct exchanges characterized the meeting.

11
There was a real discussion between experts to arrive
at a consensus.
FM Working group modeling Meeting Industrial project leaders and scientific leader bring
together all the raw knowledge collected and from it
model verifiable production rules. The first stages of
production are chosen to test the system, so only
knowledge available at these stages is taken into
account. Sixty rules are created in this way and are
controlled by a small set of metarules ( which take
into account the context of individual interpretation).
The
end
92/06 The software is ready to
use
CCMV Version 1.0 is ready to use. A test period can
start.
Tableau 2-1 The knowledge elicitation process
These different stages took place over a relatively short time and written reports were made of each. The content
of these documents constitutes the raw material of our knowledge elicitation process. The following diagram
shows the chronological sequence of the stages.
PM1 PM1PM1 PM2 PM3
INT1
INT1
INT1
INT1
INT2 INT3 INT4
INT2
INT2
INT2
INT3
INT3
INT3
INT4
INT4
INT4
SM1 SM2 SM3 FM
91/09 91/10 91/11 91/12 92/01 92/02 92/03 92/04-06
INT 1
INT1INT 2
INT 2
INT 3
INT 3
INT 4
INT 4
Figure 2-1 Timetable of the knowledge elicitation process
This figure demonstrates the density of the work at certain times, creating practical difficulties.
PM1: the main task of the working group is to manage the whole project, but these preparatory meetings are
devoted mainly to planning the elicitation process. It is the occasion for deciding the best way to involve experts
in the work, for agreeing costs and timing and for drawing up procedures concerning confidentiality and
reporting . As the main part of the cost comes from time spent by experts, it is decided to limit the number and
the length of the interviews. All meetings and interviews have to be reported and typed up. To insure

12
confidentiality, recordings and reports must stay within the company and all reports will be validated before
circulating. These precautions establish a climate of confidence between experts and the working group.
PM2: This meeting is considered as the most difficult to make successful. Its main objective - convincing experts
that the system is advantageous for the company and indeed for them- is a challenging task for the working
group. Such a meeting has to be very carefully prepared, and we think that the key points for success are:
- an official announcement that the project is starting.
- the presentation to each other of all actors in the project..
- a global presentation of the project ( goals, tools, methods and timetable)
- comprehensive explanations about the concepts and principles operating in a knowledge elicitation
process.
- assurances about confidentiality, and about how interview reports will be validated and circulated.
These points are general and can apply in a number of other situations.
Because of the number and rank of the participants ( the meeting gathers together the company manager,
project managers, interviewers and experts), the meeting is led by a specialist in communication techniques.
Besides his role of leader in the meeting, the communication specialist makes recommendations for managing a
communication process. He presents a model of behavior to have in mind when communicating. This model has
three main components: Internal process ( personal capabilities, methods, strategies,..), Internal State (beliefs,
values, criteria,..) and External Behavior. This model may be a guide to evaluating the communication process.
He proposed a general method inspired by Bandler and Grinder ( no bibliography is given at this stage), based on
« productive re-phrasing » . There are several approaches: reformulation by generalization ( chunking up), by
specialization (chunking down) or by analogy ( lateral chunking). Other practical recommendations are:
- referring in the report to the experts’ point of view rather than trying to elaborate a theory from their talk.
The experts must recognize themselves in the report.
- paraphrasing the main expert sentences to check good understanding.
- checking generalizations and particularizations (Does the expert really mean « always » and « never », .?.)
- clarifying what appear to be cause-effect relationships.
- identifying the favorite manner of expression of the expert. (is he a visual, an aural, a kinesthesist,..?)
13
It is important to note that these recommendations were made on the initiative of the communication specialist
and were not the result of research. However, we think that the design of effective knowledge elicitation methods
would be an interesting field of research.
This meeting creates a climate of detente between the experts and the working group, and the experts are very
curious to start the work. At the end of the meeting, dates are fixed for the first interviews.
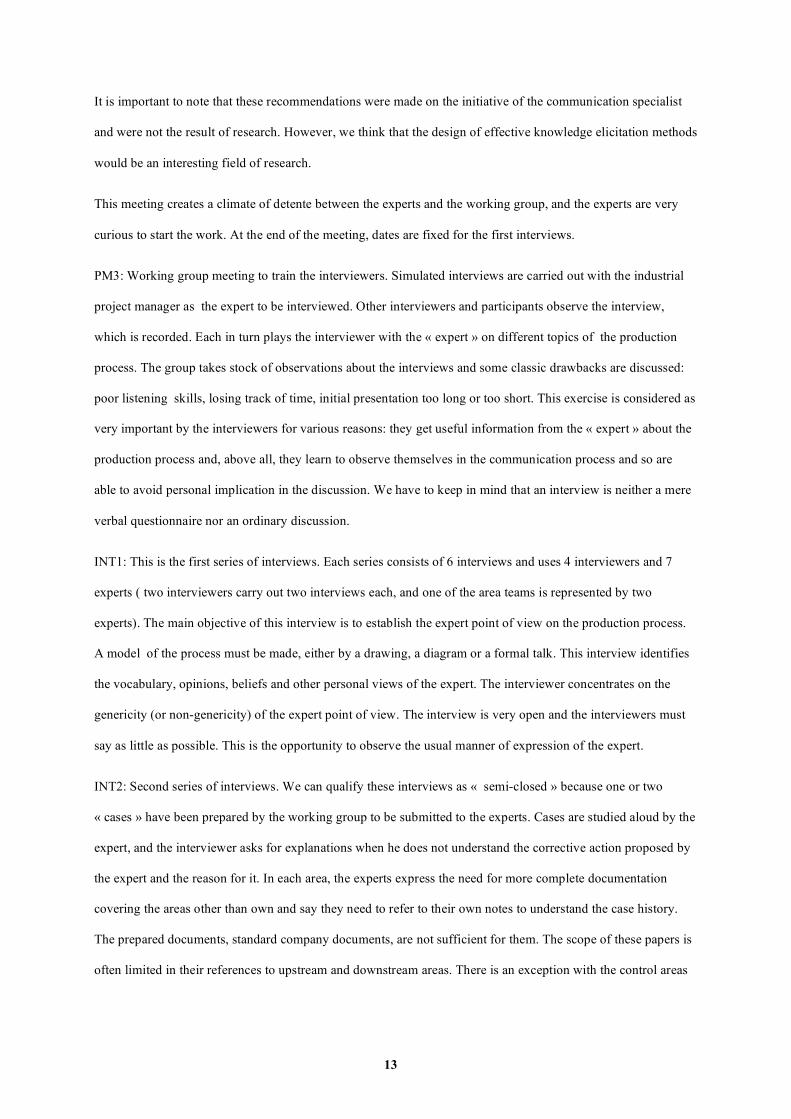
PM3: Working group meeting to train the interviewers. Simulated interviews are carried out with the industrial
project manager as the expert to be interviewed. Other interviewers and participants observe the interview,
which is recorded. Each in turn plays the interviewer with the « expert » on different topics of the production
process. The group takes stock of observations about the interviews and some classic drawbacks are discussed:
poor listening skills, losing track of time, initial presentation too long or too short. This exercise is considered as
very important by the interviewers for various reasons: they get useful information from the « expert » about the
production process and, above all, they learn to observe themselves in the communication process and so are
able to avoid personal implication in the discussion. We have to keep in mind that an interview is neither a mere
verbal questionnaire nor an ordinary discussion.
INT1: This is the first series of interviews. Each series consists of 6 interviews and uses 4 interviewers and 7
experts ( two interviewers carry out two interviews each, and one of the area teams is represented by two
experts). The main objective of this interview is to establish the expert point of view on the production process.
A model of the process must be made, either by a drawing, a diagram or a formal talk. This interview identifies
the vocabulary, opinions, beliefs and other personal views of the expert. The interviewer concentrates on the
genericity (or non-genericity) of the expert point of view. The interview is very open and the interviewers must
say as little as possible. This is the opportunity to observe the usual manner of expression of the expert.
INT2: Second series of interviews. We can qualify these interviews as « semi-closed » because one or two
« cases » have been prepared by the working group to be submitted to the experts. Cases are studied aloud by the
expert, and the interviewer asks for explanations when he does not understand the corrective action proposed by
the expert and the reason for it. In each area, the experts express the need for more complete documentation
covering the areas other than own and say they need to refer to their own notes to understand the case history.
The prepared documents, standard company documents, are not sufficient for them. The scope of these papers is
often limited in their references to upstream and downstream areas. There is an exception with the control areas

14
which have relations with each production area, but don’t often work together. This interview demonstrates the
side-effects of the compartmentalization of the production process.
SM1: First synthesis meeting of the working group: the group takes stock of the information collected from the
first series of interviews and makes these initial observations:
- it is difficult to insure consistency of method and reporting style between the different interviewers.
- the method can lead to bias. Cases are too standard and the expert reaction is not very sharp. The case
documentation is not precise enough to encourage thorough investigation. The written report is often
corrected by the expert in order to transform it into a well-presented document on the subject in hand.
The interviewer makes efforts to highlight sentences which might be suitable for creating rules later on
and the expert tries to moderate the scope of these sentences. Now, with hindsight, we can say that it
was too soon to establish any rules at this stage of the elicitation process.
- the information collected is reviewed with emphasis on its weaknesses (generalizations) and its strengths (
statements capable of generating quality rules)
- some experts don’t understand why they have to explain the production process which they say is very
well described in the documentation. They think they should be focusing on their own area7. They also
think that the interviewers should be more aware of how they, the experts, work.
- other experts say that they feel as if they are undergoing an inspection of their activities. This feeling
however does not last.
- some technical problems can have serious consequences. For example, a bad tape recording can make it
necessary to repeat an interview.
- most of the experts express their knowledge through examples. Some of them, by contrast, try to
conceptualize and give a general value to their discourse. As the written report is a kind of synthesis, the
second type of expression is simpler to report.
- All the experts recall past production batches to situate the case they are asked to study. When they find
something « similar » in their own notes, they compare the two cases more precisely in order to explain
the new one by what they know from their experience.
7However, if the general model is almost the same for each expert, the details are very different from one expert to one
another. The experts’ scope is limited to two or three areas, but they are curious to know how the process really works in other areas.
15
Interviewers work in their own style, but the meeting demonstrates that differences are minimal and that goals
remain clear and homogeneous.
The experts try to find trends in the data available, and the working group decide to construct a series of relevant
cases. A document containing seven cases is prepared for the interviewers. It is decided that the next interview
will be two hours long to allow detailed study with the experts.
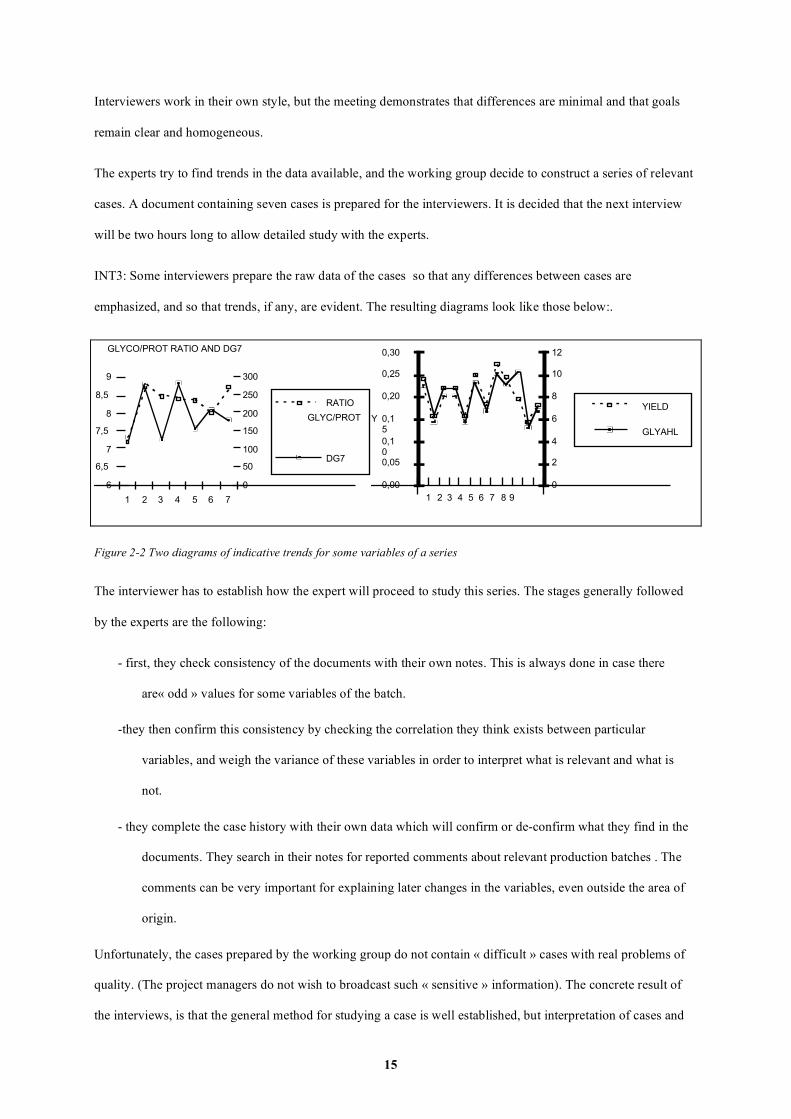
INT3: Some interviewers prepare the raw data of the cases so that any differences between cases are
emphasized, and so that trends, if any, are evident. The resulting diagrams look like those below:.
GLYCO/PROT RATIO AND DG7
6
6,5
7
7,5
8
8,5
9
1 2 3 4 5 6 7
0
50
100
150
200
250
300
RATIO
GLYC/PROT
DG7
Y
0,00
0,05
0,1
0
0,1
5
0,20
0,25
0,30
1 3 5 9
0
2
4
6
8
10
12
YIELD
GLYAHL
2 4 876
Figure 2-2 Two diagrams of indicative trends for some variables of a series
The interviewer has to establish how the expert will proceed to study this series. The stages generally followed
by the experts are the following:
- first, they check consistency of the documents with their own notes. This is always done in case there
are« odd » values for some variables of the batch.
-they then confirm this consistency by checking the correlation they think exists between particular
variables, and weigh the variance of these variables in order to interpret what is relevant and what is
not.
- they complete the case history with their own data which will confirm or de-confirm what they find in the
documents. They search in their notes for reported comments about relevant production batches . The
comments can be very important for explaining later changes in the variables, even outside the area of
origin.
Unfortunately, the cases prepared by the working group do not contain « difficult » cases with real problems of
quality. (The project managers do not wish to broadcast such « sensitive » information). The concrete result of
the interviews, is that the general method for studying a case is well established, but interpretation of cases and
16
action planning are not described. Only standard interpretations and standard action are invoked if the
interviewer asks the expert to study some « textbook hypothesis ».
For example, the major quality criterion cited is the productivity of the production process . The other quality
criteria are standard ones - sterility, animal reaction- This interview establishes that some events, reported inside
only one area, can lead to some lowering of the productivity criterion (a broken bottle for example).
The recording technique reaches its limits in situations where the expert is very loquacious and refers to several
different documents. The interviewer must pay attention to each detail and must persuade the expert to slow
down to avoid any abridgment of the reasoning process.
SM2: First synthesis meeting of all the actors in the project. The leader of the meeting is the same as for the first
big meeting. The experts give their point of view on the progress of the project, the methods and the information
collected during the interviews. There are contrasting opinions: some experts are enthusiastic while others
remain skeptical about the results of the knowledge collected. The most interesting thing is that the experts talk
together in a very open way. It seems there are not many occasions for them to meet all together. There is a lot of
information exchanged, but it is very difficult to manage such a meeting. The main result of the meeting is that
agreement and differences of opinion are now emphasized. This is a very important guideline for the
continuation of the elicitation work.
To complete the knowledge elicitation and to exploit the dynamics of this meeting, it is decided to bring together
two experts for the last interview. One expert plays the role of interviewer and the other plays himself while the
« knowledge engineer » observes and reports the meeting.
INT4: The tripartite interview. All the experts has their own documentation and use it either to ask questions or
to answer and comment. For the first time, we can observe simultaneously the use of different sources on the
same case. Real problems are treated and very interesting information comes to light. The knowledge material
produced is more accurate and the reasoning process is well described. The most interesting thing is that, after a
short observation time, both experts together start trying to find explanations for the problem under discussion.
They are searching for a consensus on interpretation and diagnosis. Planning remedial action remains the sole
responsibility of the area expert concerned. Important lessons can be drawn from such an interview:
- the simulated situation is close to the real one, where several people meet to find explanations for a quality
drift.

17
- the interviewer is able to understand most of the reasoning process because he knows the global process
well enough(it is the fourth interview).
- the experts are fully involved in the process of the interview and « forget » the observer.
- biases can exist if experts are in fact playing a different role than their own. It can be difficult to detect
such role-shifts.
SM3: Last meeting of all the actors in the project. The working group has prepared « selected passages » of the
different reports to submit to the whole assembly. These extracts are chosen on the basis of their relative
importance for the tasks we have to model (drift detection, diagnosis and planning remedial action). A document
is given to each expert. Extracts are numbered and discussed by the experts. Each of them can be rejected,
accepted, modified or merged with another extract. Sometimes, the discussion between experts starts again on
some difficult point. A score is given to each extract depending on the strength of the implicit (or explicit) rules
carried in the text.
Specific attention is given to the list of quality criteria as they appear in the reports:
- sterility (standard)
- satisfactory output (quantitative)
- regularity of output
- « reproducibility » of the product properties
- just-in-time production
and for certain areas:
- clearness
- visual aspect
-biological activity better than the norm
It is interesting to note that this list is richer than that produced during INT3.
FM: Last meeting directly connected to the knowledge elicitation process. The working group uses the results of
SM3 to design a first set of rules and metarules.
18
2.2.2 Knowledge representation
In the context of this project, task models were defined in advance to fit the functions that the system has to
perform. The task of drift detection is based on statistical analysis of the historical data base. Drift interpretation
and remedial action are the two tasks to which the expert system is devoted. Both tasks can be carried out either
for a simulation, in which case new values must be proposed for initial production parameters in downstream
areas, or for a real production, when only actions allowed in upstream areas have to be proposed.
All the knowledge is represented by production rules - If (premise) then (conclusion). This kind of representation
is sufficient for our objective and we designed 60 rules divided into three groups of 20 rules controlled by
metarules. Metarules are easy to formulate because they treat particular situations. Examples of metarules
include the following:
- if context is a simulated situation, then modify initial production parameters.
- if context is a real situation, then try only feasible remedial action..
- if context is a real situation and some data is missing, then calculate it with the help of the historical data
base and then avoid any conclusion using this calculated data.
The first knowledge base we produced dealt only with the early stages of production .. Rules focus on either
explanation of a drift or on possible remedial action. The rules remain general and the reasoning goes only to
two levels in depth. The next chapter will present an example of a reasoning session using the knowledge base.
While only a small part of the knowledge might be used for the current expert system, all the knowledge is kept
in a report[Mil92] to be used if other stages of the production are treated by a later, expanded system. The
validation of the knowledge base is done by a simple check and this is probably sufficient given its small size.
The complete system is tested with real data before being installed in the production areas.
3. The system is user-friendly and encourages traceability
The following diagram presents the main screen used by the operator to place the current production alongside
the past batches:

19
Figure 3-1 Multivariate control map
The following figure presents the principle of a session based on the respective roles of statistical analysis and
the expert system. The software is used as a decision helping system.
x
x
xx
x
x
x
o
o
o ooo
x
x
xx
x
x
x
o
o
o ooo
diagnostic
Historical
Data Base
Knowledge
Base
Current
production
ab c
The operator can get (a) a diagnosis either from the actual
parameters of the current batch or from simulated parameters. As
soon as the production parameters (real or simulated) are keyed
in, consistency with the historical data base is checked through
statistical analysis. The batch is then placed in a quality group on
the multivariate control map according to the degree of similarity
to past batches belonging to that group. The current production is
highlighted on the multivariate control map. If the statistical
analysis produces a diagnosis of possible drift, the expert system
is triggered to give explanations (b). Explanations and remedial
action are displayed (c), printed and logged in a special file.
Figure 3-2 General description of a typical session using the decision-helping system
Current batch
Convex envelope of the different quality groups
Number of the last batch

20
The following is a typical printout from such a session:
------------------------------------------------------------------------------
-------------------
Numéro du lot : 151
Le : 04 / 08 / 94
20 :05 :58
------------------------------------------------------------------------------
-------------------
Complémentation
RAS
Coherence quantitative
26.0335
Les valeurs que vous avez indiquées pour les paramètres
de culture virale représentent une combinaison relativement
exceptionnelle par rapport aux valeurs observées pour
l’historique.
La saisie ne comporterait-elle pas une erreur ?
Coherence qualitative
3.3259 RAS
Affectation qualitative :
2.4686
3.6828
3.6167
4.0167
3.3847
2.4686
1
1 (Groupe de qualité prévu pour le lot).
D’après ses caractéristiques par rapport à l’historique, le lot
pourrait donner une récolte virale présentant un titre
relativement
faible.
Diagnostic à faire par le système-expert.
Numéro du lot 151
Le : 04 /08 /94 à 20 :06 :12
Variables pesantes (Paramètres qui pourraient être en
cause) :
Paramètres Niveau Effet
Volume en culture virale 3 0.0740
Fin Ampli. Cell. 1 0.0490
Concentr. Cell. Cult. virale à J0 1 0.0400
pH fin Cult. Cell. 1 0.0390
Paramètres soumis au système expert :
Volume en culture virale
Concentr. Cell. Cult. virale à J0
Compte rendu de l’analyse du système expert :
******************
Pour le diagnostic concernant la variable
« concentration cellulaire en culture virale à J0 »
je travaille sur une valeur « saisie »
******************
Pour le diagnostic concernant la variable
« volume en culture virale »
je travaille sur une valeur « saisie »
********** diagnostic r27 **********
La concentration cellulaire est plutôt faible en considération
des situations observées dans l’historique. Les opérations de
numération et de préparation du milieu se sont-elles
déroulées correctement ?
Tableau 3-1 Typical printout of a decision-helping
session
A detailed description of the functions and implementation of the system is available in [MilPia94 et al].
21
4. Discussion: Toward a Case Based Reasoning System
implemented in a multiagent context
4.1 About the multivariate control map
A multivariate control map may be drawn up if the production parameters discriminate sufficiently between
batches: A clear distinction is needed at least between the « very good » group and the « unacceptable » group.
As an alternative to the use of discriminant analysis for the definition of quality groups, a principal components
analysis of experimental data [Sab83] could be performed. In the present state of the project, this technique is
only used for simulating the values of quality parameters using data restoration.. Analysis by multivariate control
map risks becoming blocked if any data is missing. To overcome this problem, we designed a procedure to
restore missing data. In the same way, the production parameters were separated into two groups according to
their power of discrimination:
- major parameters used alone to position the batch
- minor parameters keyed in, but not used directly to position the batch.
This precaution reduces the number of computation blockages due to missing data, but at the same time, requires
attention to the correlation between observed quality and diagnosed quality to be sure that the major parameters
are in fact discriminating enough. The global study of the production process, taking into account final controls,
has not yet started. It will need major discriminant parameters for each stage of production .
4.2 About the knowledge elicitation process
We discuss our work here in the light of recent research contributions to the field of Knowledge Acquisition.
This research field is now very active and interested readers can find a relatively complete state of the art in
[AKS92] or in [KriDav91]. Methods for the firsts stages of the Knowledge Acquisition Process are presented in
[ReiRue87].
4.2.1 Knowledge acquisition as the modeling of expert tasks
The knowledge acquisition process is generally presented as the modeling of expert tasks and consequently
much effort has gone into defining generic tasks to make modeling easier. Since the pioneering works

22
[HRWL83], several proposals were made by Chandrasekaran [for the first time in 1987] and by Breuker and
Wielinga at about the same dates. These first works lay the foundations for most of the Knowledge Engineering
Tools and several commercial frameworks are already available. Interested readers can find an overview of these
tools in [ABB92],[WVS92] or [Ste91]
This approach is based on the assumption that it is possible to identify the tasks of an expert, or of several
experts, by observing them as they solve a problem. This is often the case, but if it is true that there exist only a
few generic tasks, it is also true that there exist generally a great number of variants and the generic task
identification does not help us with what the experts do in detail. Nevertheless, such a framework is a very useful
guide to the knowledge engineer in his work. If the expert task is very close to a generic one, there is some
chance that the generic problem-solving methods in the tool being used will work. The assumption is made that
re-using can avoid a lot of effort for the design of knowledge based systems.
In our context, the problem given to the experts was new to them, and for the question « How do you do that
task? », we had to substitute « how would you do that task? ». Even then, we failed when working with a single
expert because the tasks of diagnosis and remedial action are by nature multiexpert. Because of the
compartmentalization of the production process and the fact that the tasks were mainly new for the experts, we
had some problems in helping them design methods for diagnosis and remedial action. We used the three tasks -
quality drift detection, drift explanation and planning of remedial action - as starting points to get partial
contributions from each expert. It became evident that we needed to elicit specific sub-tasks from each expert
according to the production stage in which they were involved. We then had to define how the different sub-
tasks contributed to the goals of the three generic tasks.
The task of « drift detection »is carried out by the statistical analysis software and is exclusively based on data
similarity measurement. The contribution of expert knowledge is minimal for this task.
For the task of explaining « quality drift », we collect the individual opinion of each expert. The experts make
some assumptions about upstream and downstream events, and by putting these different points of view side by
side, we could emphasize where views coincide and where they differ.. We decided to retain only common
points of view for our system, but it would be interesting to investigate the real reasons for the disagreements. As
a model for finding a consensus, the last interview (INT4) was the most important. This method of solving
problems collectively is already used in the company when a serious problem occurs. When a special group is

23
formed to investigate the history of a batch , one expert per area is asked to work with the others to find
explanations and solutions.
The task of planning « remedial action» is new for the experts (except when the drift detection concerns a
simulated production ) and consists mainly in the adaptation of an old solution to a new situation. They have to
decide what process parameters may be modified to correct the drift. As the production process is controlled by
strict protocols, it is not easy to see what can be attempted without violating the protocol. What is more, the area
experts can only take action in their own area and it is not easy to guess the possible consequences upstream.
There is at present no way to consult the others in order to validate a decision about the production process. For
all these reasons, the knowledge acquisition remains weak for this task. However a test period could be used to
try out some solutions and to learn from experience.
4.2.2 The multiexpert context is a major characteristic of our work
One of the major characteristics of our project is the multi-expert context. Specific books about knowledge
elicitation such as [FirHel91] or [Vog89] recommend that a multiexpert approach be avoided Each elicitation
process is independent and must remain independent to avoid any bias. This recommendation finds its origin in
the initial works of Newell and Simon [New82] who focused on the modeling reasoning of one expert to propose
different knowledge levels. Nevertheless, we have found in the literature a few works treating the multi-expert
situation. MEDKAT[1985] is presented as automating the Delphi method to gather information from multiple
experts in[BucWil92]but no details are available on how to merge these items of information. AQUINAS
[BooBra87] is a very powerful software tool for obtaining and modeling expertise. One of its components allows
the representation of multiple knowledge sources in expert hierarchies. Each node of a hierarchy represents
either an individual, an aspect of an individual, a group, or an independent source of knowledge. Information can
be elicited independently then weighted and combined to derive joint solutions to problems. The system makes
the assumption that different knowledge sources do not overlap with each other and does not take into account
any cooperative solutions. We use this assumption for the task of explanation but we fail to do the same thing
concerning the planning task. As claimed by [Gai89 we think that it is difficult to validate such a merging
process except if the merging is a kind of generalization. The use of multiple knowledge sources is well suited
to our case, but could be better used in a multiagent environment, working on a cooperative basis. More recent
software tools such as those described in [WVS92] or [Ste91] allow multiple knowledge sources but seem to
have the same limitations as AQUINAS.

24
Some results of Psychology research on human decisions seem to demonstrate that, in general, operators do not
« see » what is not usually of their responsibility. This would explain why, in our project, experts in one area
often forget about events in other areas and important information is missed.. The work of Hoc in this direction
is described in [Ric90]. This observation means that it will be difficult to get spontaneous consensus among the
experts from different areas. We think that a multiagent approach would avoid the need for a complete consensus
when knowledge is elicited.
« How to maintain the knowledge base? » is also a major question in our case. The knowledge base has to
evolve in several directions:
- completion of the knowledge concerning remedial action, probably by using experience.
- completion of the knowledge base to cover other areas of production or control.
- updating of the information related to process elements which have evolved.
- updating of the information if new parameters are identified as important by the statistical analysis system.
We do not have a good answer to this question. We think that the first modifications of our expert system will
not be very difficult to integrate into the maintenance of the knowledge base but some mechanisms to detect
inconsistencies must be added in the future to help the knowledge engineers. There is already such a mechanism
to detect changes in the production process that would suggest updating of the historical data base, and we have
to find something similar for the knowledge base.
As we can observe from different interviews such as INT3 and INT4, it is evident that the experts use their
particular experience to explain new cases. Some batches are used as prototypes of their class of quality to
explain what is the matter with a new production assigned to that class. Similarities are used in our system to
assign a quality rank, and we think that we could use the existing batches of the same group to explain why this
batch belongs to that group. A part of the work is already done by a specific treatment named « heavy variables »
which puts in order the most important variables of a batch to explain the quality assignment. If we get some
relations between variables and one of the production parameters on which we can play to modify the parameter,
it will be possible to infer more easily from trends in the variables what action to take. Unfortunately, these
relations are not easy to see, and there is no explicit model of the biological process. The constant references of
the experts to problem cases, in order to find similarities with the one being studied, make us think that it would
be useful to store the batches as cases with attributes indicating action taken on the production process and other
useful information. Learning from cases [Kol93] [RiesSha89] would be the best way to synchronize with the

25
statistical analysis system, which is based exclusively on the qualitative and quantitative values of the parameters
stored in the historical data base.
The following diagram summarizes how we think our system could develop in the future to include all the
elements of this discussion:
Historicaldata base
Current productiondata
SpecialistArea 1
Knowledge Basespecialist Area 1
specialistArea 2
KBArea 2
specialisti
KBArea i
specialistn
KBArea nCases Base
Expert systeminterface
Statisticalanalysissystem
Case
Based
Reasoning
SystemMultiagent
System
Figure 4-1 Proposed architecture for future development
Every « specialist » in the diagram above has a specific reasoning process according to its task and, moreover,
may use the knowledge representation that best fits its needs. Past cases are ranked according to the results of the
statistical analysis and their description helps decide which is the best case to adapt. The adaptation is submitted
to each expert for their agreement. In case of major disagreement, another cycle can be started with another case.
This system takes advantage of recent works in the domain of cooperating systems as presented in [Ros93]. This
approach is also advocated in « la Revue Internationale de Systémique » (1994, Vol 8, N°1) devoted to
Distributed Artificial Intelligence.
5. Conclusion
This article aims to report our real experience in an industrial context. Multiexpert knowledge elicitation makes
the process more complex but brings with it a great deal of useful information, especially concerning cooperative
interpretation tasks. An aid to decision-making needs to provide good explanations, i.e. explanations easy to

26
understand by any operator. Explanations using past cases seem to be well suited to our situation because most
of the knowledge is to be found in past batches.
The discussion in paragraph 4 is an important part of this article and represents an effort to place our work in the
context of recent research on knowledge elicitation and acquisition. Using generic tasks could help to implement
an expert system but it is less useful if the tasks are too general. Multiexpert approaches will pay off in a
multiagent environment, since each expertise is kept as it is expressed, and the mixing of different kinds of
knowledge can be avoided.
Maintaining the Knowledge Base should be easier with a Case Based Reasoning approach[Aam91] because the
reasoning process evolves along with the historical data base.
At the end of the paragraph 4, we proposed a future development based on a multiagent approach. The overall
complexity of the software would be considerably increased, but the resulting system would be much more
effective.
BIBLIOGRAPHY
Aam91 Agnar Aamodt, A Knowledge Intensive Integrated Approach to Problem Solving and Sustained Learning, Thesis, University of Trondheim, 1991, 301 pages.
ABB92 Patrick Albert, Isabelle Bousquet et Eric Brunet, Kads Tools, an Industrial Workbench for the Kads Technology, 10 pages
AKS92 Nathalie Aussenac, Jean Paul Krivine, Jean Sallantin: Editorial sur l'acquisition des connaissances, Revue d'Intelligence Artificielle, vol N°6, N°1-2, pages 6 à 8
BooBra87 John H Boose, Jeffrey M Bradshaw, Expertise Transfer and complex problems: using Aquinas as a knowledge-acquisition workbench for knowledge-based systems., in Readings in Knowledge acquisition and learning (Morgan Kaufmann 1993), p 240-251
BucWil92 Bruce G Buchanan & David C Wilkins, Readings in knowledge acquisition and learning,Morgan Kaufmann Publishers, 1993, 907 pages
Cam83 M Camand, M Precausta, Une unité de production de Vaccins, Biofutur N°17, Octobre 83, pages 26-30 Cos84 A Costecalde, Suivi de Qualité de fabrication par analyse des données, 1984, Revue AFCIQ, VolXX, N°1, pages
31-36 FirHel91 Maureen Firlej et Dave Hellens, Knowledge Elicitation, A practical handbook, 1991, 188 pages Fon86 J Fontaine, A propos de la production des vaccins contre les virus animaux, Ann.
Méd. Vét, N°130, 1986, pages 253-265 Gai89 Brian R Gaines, The Quantification of Knowledge- Formal Foundations for Acquisitions Methodologies,
Methodologies for intelligent systems, 4, 1989, Elsevier Science Publishing, Zbigniew W Ras Editor, in Readings in Knowledge acquisition and learning (Morgan Kaufmann 1993), p 462-474
HRWL83 Hayes-Roth F, Waterman D & Lenat D (1983) Building Expert Systems, New-York, Addison-Wesley. Kol93 Janet Kolodner, Case Based Reasoning, Morgan Kaufman Publishers, 1993, isbn 1.55860.237.2, 668 pages KriDav91 JP Krivine, JM David, L'acquisition des connaissances vue comme un processus de modélisation : méthodes et
outils, Intellectica 1991/2,12, pages 101 à 137 LMN77 J Lebart, A Morineau et N Tabard, Techniques de la description statistique. Méthodes et logiciels pour l’analyse
des grands tableaux.1977, Dunod, 351 pages Mil92 Alain Mille, Rapport de fin de contrat, Système Expert CCMV,Juillet 1992,300 pages MilPia94 Alain Mille, Daniel Pialot et Al ( JM Becker, P Lecointre, A Michel, JM Pourprix, T Simoni, M Stelman),
Système Expert de contrôle prédictif de qualité en production industrielle:Association d’une approche statistique et
27
d’un système expert., Rapport interne non encore soumis à publication, 1994, 18 pages Pia90 Daniel Pialot, Analyse multidimensionnelle des résultats d’essais de cuisson d’un gateau. Propositions pour la mise
en oeuvre de cartes de controle multiparametriques. in Actes du colloque « Méthodes statistiques et agro-industries », Angers, 9 pages
New82 Allen Newell, The Knowledge Level, Artificial Intelligence N°18-82, pages 87-127 ReiRue87 Judith Reitman Olson, Henry H. Rueter, Extracting expertise from experts, Methods for knowledge acquisition,
Expert Systems, August 1987, Vol 4, N°3 Ric90 Jean François Richard, Les activités mentales, comprendre, raisonner, trouver des solutions. Editions Armand
Colin, Série Psychologie, 1990,435 pages. RiesSha89 Christopher K Riesbek, Roger C Shank, Inside Case based reasoning, LEA, Publishers, Hills dale, Newjersey,
1989, 423 pages Ros93 Jeffrey S Rosenshein, Consenting Agents: Negotiating mechanisms for multiagent systems, 13th IJCAI,
Chambéry, France, 28/08/93-03/09/93, pages 792 à 799 Sab83 R Sabatier, approximation d’un tableau de données. Application à la reconstitution des paleoclimats, 1983, Thèse
de 3° cycle, USTL, Montpellier Sap90 G Saporta, Analyse des données et statistique, 1990, Editions Technip, 493 pages Ste91 Luc Steels, Commet: A Component methodology for knowledge engineering, Work package 2/3/4 du project esprit
CONSTRUCT, 63 pages Vog89 C Vogel, Génie Cognitif, Masson 1989 WVS92 Bob Wielinga, Walter Van de Velde, Guus Shreiber, The Kads Knowledge Modelling Approach, Projet de
recherche Esprit 5248, 20 pages