an experimental study on durability of shield segments under load and chloride environment coupling...
TRANSCRIPT

Tunnelling and Underground Space Technology 42 (2014) 15–24
Contents lists available at ScienceDirect
Tunnelling and Underground Space Technology
journal homepage: www.elsevier .com/ locate/ tust
International Tunnelling Association
An experimental study on durability of shield segments under loadand chloride environment coupling effect
http://dx.doi.org/10.1016/j.tust.2014.01.0040886-7798/� 2014 Elsevier Ltd. All rights reserved.
⇑ Corresponding author. Tel.: +86 13787232438.E-mail address: [email protected] (C. Shi).
Mingfeng Lei, Limin Peng, Chenghua Shi ⇑School of Civil Engineering, Central South University, Changsha, Hunan 410075, China
a r t i c l e i n f o
Article history:Received 24 May 2013Received in revised form 23 December 2013Accepted 30 January 2014Available online 22 February 2014
Keywords:Shield tunnelChloride environmentStructural loadCoupling effectDurabilityExperimental study
a b s t r a c t
Taking into consideration a shield tunnel’s environmental and mechanical properties, we designed adurability test method for its segment lining under the coupling effect of load and chloride environment(CEL&E). To verify the credibility of the method, we developed an environmental simulation test deviceand conducted durability tests on specimens using the test device. The results of the tests showed thatwith increased environmental chloride concentration and extended time period, the chloride ion contentin the protective layer of the concrete increased gradually. It was also found that the external load chan-ged the pore structure properties within the concrete, thus affecting chloride ion penetration. Consider-ing that the load effect can change the structural characteristics of pores, we proposed a chloridediffusion coefficient evolution model for concrete under the CEL&E. By applying numerical fitting andusing parameters of quadratic regression, we also established an equation for determining surface ionconcentration under the coupling effect. Finally, we devised an evaluation model and calculation methodfor durability of a shield tunnel’s segment lining under the CEL&E. This calculation method can be usedfor assessing the concrete durability of existing shield tunnel structures, prediction of remaining servicelife, as well as durability design of new shield tunnel structures.
� 2014 Elsevier Ltd. All rights reserved.
1. Introduction zant (1979), Bhargava et al. (2006) and others conducted
Shied tunnels are one of the major structural forms of urban railtransit and play important roles in the safe operation of a city.When problems occur at the node of a tunnel, the entire urbantransport system can be affected. Therefore, the structure perfor-mance (e.g., durability) of shield tunnel is critical important forits safety and smooth operation.
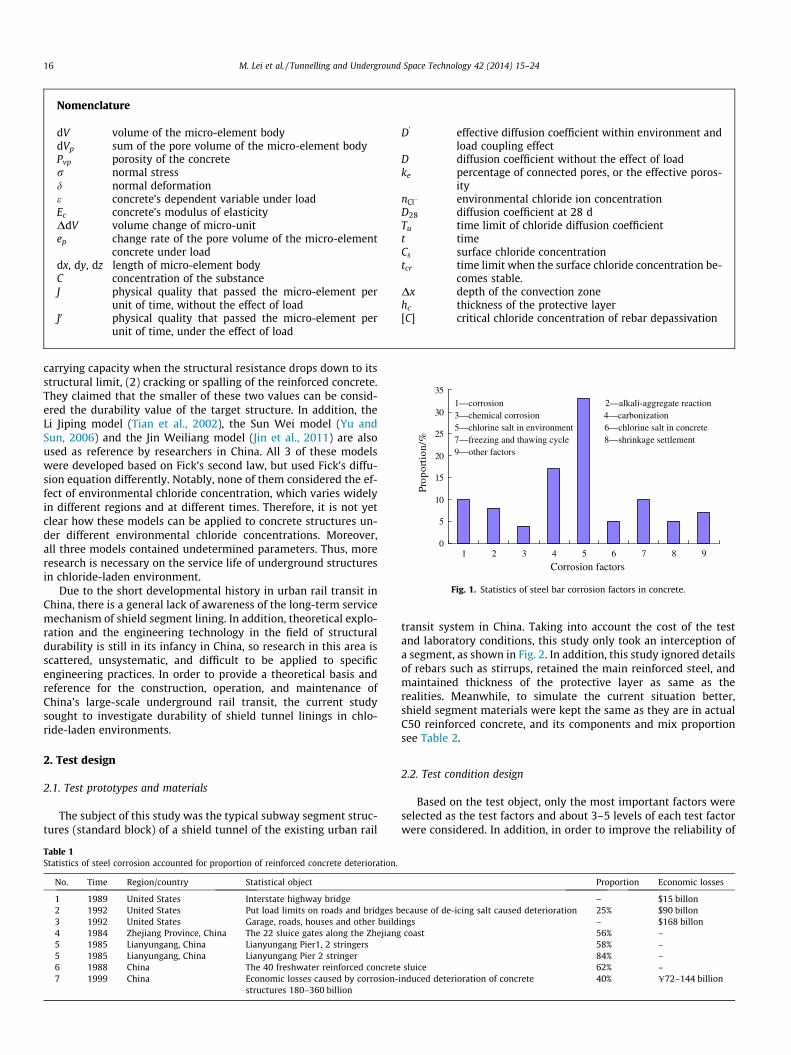
One of the major factors that affect the structural durability ofconcrete is corrosion of its steel reinforcements (Mehta, 1991). In-deed, reinforcement corrosion has been attributed to structuraldeterioration and the resulting economic loss in many parts ofthe world (Wang, 2009) (Table 1). A major contributing factor toreinforcement corrosion is chloride penetration. A study conductedby the British Society of Civil Engineers (Zhang et al., 2009) foundthat chloride penetration accounts for more than 30% of the totaldeterioration of reinforced concrete (Fig. 1). Not surprisingly, thereis significant interest in the failure mechanism, law of evolution,and other issues relevant to corrosion of steel reinforced concretein chloride-laden environments.
Lomax (2002) proposed a cathodic protection technique for pro-tecting reinforced concrete in reservoirs. González et al. (1996), Ba-
experimental analyses of how chloride environments (e.g., marineenvironments) affect reinforced concrete. Based on their findings,they proposed mathematical representation models respectivelyand successfully implemented the proposed models in variouspractical applications. Rose and Matzkanin (2003) proposed asemi-empirical, semi-theoretical model based on Fick’s secondlaw of diffusion for predicting concrete durability under chloridepenetration. Thomas (1996), Alonso et al. (2000), and Morris et al.(2007) conducted in-depth studies on the chloride threshold con-centrations in concrete, and provided reference thresholds for dif-ferent environmental conditions. Raupach (1996) proposed thefailure criteria and end flags of serviceability of a concrete structurein chloride-rich environments. Using concrete surface cracking asthe failure criterion, Morinaga (1990) determined the correlationbetween the amount of steel corrosion and corrosion rate, and pro-posed the ratio of the amount of steel corrosion and corrosion rateas a measure of concrete durability. Based on the one-dimensionaldiffusion equation, Fick’s second law and the results of indoor cor-rosion tests, Swamy et al. (1994) proposed a mathematical modelthat can predict service life of a reinforced concrete structure underthe influence of a chloride-diffused environment.
Among studies conducted in China, Xianming and Hongyan(1996) suggested using two criteria to predict the service life ofreinforced concrete in chloride-laden environment: (1) its ultimate
Nomenclature
dV volume of the micro-element bodydVp sum of the pore volume of the micro-element bodyPvp porosity of the concreter normal stressd normal deformatione concrete’s dependent variable under loadEc concrete’s modulus of elasticityDdV volume change of micro-unitep change rate of the pore volume of the micro-element
concrete under loaddx, dy, dz length of micro-element bodyC concentration of the substanceJ physical quality that passed the micro-element per
unit of time, without the effect of loadJ0 physical quality that passed the micro-element per
unit of time, under the effect of load
D0
effective diffusion coefficient within environment andload coupling effect
D diffusion coefficient without the effect of loadke percentage of connected pores, or the effective poros-
itynCl� environmental chloride ion concentrationD28 diffusion coefficient at 28 dTu time limit of chloride diffusion coefficientt timeCs surface chloride concentrationtcr time limit when the surface chloride concentration be-
comes stable.Dx depth of the convection zonehc thickness of the protective layer[C] critical chloride concentration of rebar depassivation
0
5
10
15
20
25
30
35
1 2 3 4 5 6 7 8 9
Corrosion factors
Prop
orti
on/%
2—alkali-aggregate reaction4—carbonization
5—chlorine salt in environment 6—chlorine salt in concrete
1—corrosion3—chemical corrosion
7—freezing and thawing cycle 8—shrinkage settlement9—other factors
Fig. 1. Statistics of steel bar corrosion factors in concrete.
16 M. Lei et al. / Tunnelling and Underground Space Technology 42 (2014) 15–24
carrying capacity when the structural resistance drops down to itsstructural limit, (2) cracking or spalling of the reinforced concrete.They claimed that the smaller of these two values can be consid-ered the durability value of the target structure. In addition, theLi Jiping model (Tian et al., 2002), the Sun Wei model (Yu andSun, 2006) and the Jin Weiliang model (Jin et al., 2011) are alsoused as reference by researchers in China. All 3 of these modelswere developed based on Fick’s second law, but used Fick’s diffu-sion equation differently. Notably, none of them considered the ef-fect of environmental chloride concentration, which varies widelyin different regions and at different times. Therefore, it is not yetclear how these models can be applied to concrete structures un-der different environmental chloride concentrations. Moreover,all three models contained undetermined parameters. Thus, moreresearch is necessary on the service life of underground structuresin chloride-laden environment.
Due to the short developmental history in urban rail transit inChina, there is a general lack of awareness of the long-term servicemechanism of shield segment lining. In addition, theoretical explo-ration and the engineering technology in the field of structuraldurability is still in its infancy in China, so research in this area isscattered, unsystematic, and difficult to be applied to specificengineering practices. In order to provide a theoretical basis andreference for the construction, operation, and maintenance ofChina’s large-scale underground rail transit, the current studysought to investigate durability of shield tunnel linings in chlo-ride-laden environments.
2. Test design
2.1. Test prototypes and materials
The subject of this study was the typical subway segment struc-tures (standard block) of a shield tunnel of the existing urban rail
Table 1Statistics of steel corrosion accounted for proportion of reinforced concrete deterioration.
No. Time Region/country Statistical object
1 1989 United States Interstate highway bridge2 1992 United States Put load limits on roads and bridges b3 1992 United States Garage, roads, houses and other build4 1984 Zhejiang Province, China The 22 sluice gates along the Zhejiang5 1985 Lianyungang, China Lianyungang Pier1, 2 stringers5 1985 Lianyungang, China Lianyungang Pier 2 stringer6 1988 China The 40 freshwater reinforced concrete7 1999 China Economic losses caused by corrosion-
structures 180–360 billion
transit system in China. Taking into account the cost of the testand laboratory conditions, this study only took an interception ofa segment, as shown in Fig. 2. In addition, this study ignored detailsof rebars such as stirrups, retained the main reinforced steel, andmaintained thickness of the protective layer as same as therealities. Meanwhile, to simulate the current situation better,shield segment materials were kept the same as they are in actualC50 reinforced concrete, and its components and mix proportionsee Table 2.
2.2. Test condition design
Based on the test object, only the most important factors wereselected as the test factors and about 3–5 levels of each test factorwere considered. In addition, in order to improve the reliability of
Proportion Economic losses
– $15 billonecause of de-icing salt caused deterioration 25% $90 billon
ings – $168 billoncoast 56% –
58% –84% –
sluice 62% –induced deterioration of concrete 40% U72–144 billion

Fig. 2. Model dimension.
Table 3Test condition design and factor levels.
Factors Group Factor levels
Cl� concentration nCl� /% 1 52 103 15
Load level r/m 1 52 103 15
Corrosion time t/month 1 22 43 6
Fig. 3. Artificial environment testing device (unit: cm).
M. Lei et al. / Tunnelling and Underground Space Technology 42 (2014) 15–24 17
test data, two parallel tests were conducted for each set of test con-ditions. Design of factor levels and working conditions was done bytaking existing research data as reference, as shown in Table 3.
It should be noted that load is represented by depth in the table.For example, ‘‘5’’ indicates the depth is 5 m. During the test pro-cess, the load applied to the sample segment was calculated byusing a value equal to the value of 5 m depth.
2.3. Test method and test device
The test system consisted of an environmental simulation sys-tem, a static loading system, and a measurement system. The envi-ronmental simulation system was mainly used for simulating ashield tunnel structure of the urban rail transit under corrosiveenvironments, and included the tunnel environment, surroundingrock environment, and corrosive environment. The static loadingand measurement system were mainly used for conducting staticload simulations on specimens under different durations of corro-sion, recording changes in various physical quantities, and summa-rizing evolution of the mechanical properties of the shield tunnellining with respect to corrosion time. Fig. 3 shows the test device.
2.4. Test procedure
(1) Determination of the ratio: developed standard test blocks15 cm � 15 cm � 15 cm in size, placed test blocks in thesame environment as the test environment, measured testcube’s strength at age 3 d, 7 d, 28 d, calculated strength ofconcrete with different water–cement (w/c) ratios, anddetermined whether concrete with various w/c ratios metthe strength requirements of C50.
(2) Developed high-precise steel formwork according to the sizerequirements. In order to avoid mixing of the samples,which would affect the accuracy of the test blocks, the form-works were numbered in the subsequent process of mold-ing, and stacked on flat ground. After molding, the formwas removed and care was taken to properly cure the testconcrete blocks.
Table 2Components and mix proportion of test material (per cube) kg.
Cement (P.O. 42.5) Flyash (grade-I) Medium sand (zone-II)
400 50 537
(3) Developed the test device according to size requirements,determined the size of each loading condition, debugged,and tested the equipment.
(4) After curing the test blocks for 28 d, the sample blocks werenumbered, passed with strain gages, and placed in the testdevice. Upon verification of leak-proofness of the test appa-ratus, chloride solution was added to the device and the loadwas set to start the test.
(5) When a test block was in the solution for a preset period oftime, it was taken out of the solution, dried naturally, andthen testing samples (concrete powder) were drilled out fromthree important positions (i.e. 1/4, 1/2 and 3/4 quantile ofspecimen). At each position, the drilling was repeated atdifferent depths along the protective layer (i.e.5 mm,10 mm,20 mm, . . . ,60 mm). Tests to determine thechloride content were then carried out on these concretepowder samples by RCM method. A graph showing the rela-tionship between chloride concentration and distance was
Gravel Water Admixture (polycarboxylate superplasticizer)
1315 148 2.7

0.0
0.2
0.4
0.6
0.8
1.0
1.2
x /mm
C(x
,2)/
%
20511 20512
21011 21012
21511 21512
0.0
0.2
0.4
0.6
0.8
1.0
1.2
0 10 20 30 40 50 60
0 10 20 30 40 50 60
0 10 20 30 40 50 60
x /mm
C(x
,2)/
%
20521 20522
21021 21022
21521 21522
0.0
0.2
0.4
0.6
0.8
1.0
1.2
x /mm
C(x
,2)/
%20531 20532
21031 21032
21531 21532
(a)
(b)
(c)
Fig. 5. Distribution curve of Cl� concentration in concrete corroded for 2 month. (a)1/4 quantile; (b) 1/2 quantile; (3) 3/4 qauntile.
0.8
1.0
1.2
1.4
x,2
)/% x =5
18 M. Lei et al. / Tunnelling and Underground Space Technology 42 (2014) 15–24
drawn, and the chloride diffusion coefficient Dt1 was deter-mined by conducting numerical fittings. Through this pro-cess, a number of Dti values were obtained, which can be fitinto the time-varying equation of chloride ion diffusioncoefficient.
3. Test results and analysis
Since this test included many variables and experimental fac-tors, the test results were numbered to track them easily. Forexample: ‘‘20,511’’ means the time under corrosion was 2 months,concentration of the chloride solution was 5%, the test position was1/4 quantile from top-down, the specimen used in the parallel testwas test block No. 1. See Fig. 4 for specific numbering rules.
3.1. The effect of solution concentration on chloride diffusion
Due to page limitations, this paper only provides curves thatillustrated the chloride concentration distribution in the concreteprotective layer after the specimen was in the solution with differ-ent chloride concentrations for 2 months (see Fig. 5). The findingsare as follows:
(1) With increase in the depth of the concrete protective layer,the chloride concentration in the concrete decreased rapidly,and quickly reached a stable value. The lower the concentra-tion, the quicker tender to stable. As shown in Fig. 5, whenthe concentration of the solution was 5%, chloride ion dif-fused to the protective layer at a depth of 20 mm and thenbecame stabilized; when the concentration of the solutionincreased to 10%, chloride ions became stable at approxi-mately 30 mm depth; when the concentration furtherincreased to 15%, the stable depth increased to 40 mm.
(2) The higher the concentration, the more the chloride ion pen-etration into the concrete. As shown in Fig. 6, the chloride ionconcentration closely followed change in concentration ofthe solution close to the surface. At the same depth, the chlo-ride ion content in the concrete and the concentration of thesolution followed an approximately linear growth trend.
3.2. The effect of load on the chloride ion diffusion
Fig. 7 shows the curves of mean values illustrating the chlorideconcentrations in tensile and compressive stress areas under theexperimental condition. Fig. 8 illustrates the chloride ion distribu-tion in tensile and compressive stress zones. The findings are asfollows:
Fig. 4. Numbering rule of sample.
0.0
0.2
0.4
0.6
0 5 10 15 20n /%
C(
x =10
x =20
Fig. 6. Distribution of Cl� concentration in concrete under different solutionconcentration.
(1) Chloride concentration in the tensile stress area was higherin general than that in the compressive stress area. This islikely because the change in pore structure caused by com-pressive stress had negative effect on chloride penetrationby hindering or slowing down the ingress of solution. Onthe other hand, tensile stress played a positive role, andaccelerated the ingress of the chloride solution to someextent.

0.2
0.3
0.4
0.5
0.6
0.7
0.8
C(x
,t)/
%
t=2
t=4
t=6
(a)
M. Lei et al. / Tunnelling and Underground Space Technology 42 (2014) 15–24 19
(2) When the differences in chloride concentration of solutionswere not considered, the distribution curve of the averagechloride concentration in the tensile stress area was signifi-cantly higher than that in the compressive stress area. Themean value of chloride concentration in the tensile stressarea was about 10–20% higher than that in the compressivestress area, which indicated that this effect was not negligi-ble for the already low critical value of chloride concentra-tion of rebar depassivation.
(3) Further analysis of differences in chloride concentration intensile and compressive stress areas revealed that the effectof external load on distribution of chloride concentration isnot evenly distributed along the entire protective layer. Atpositions close to the surface of the concrete or steel rein-forcement, the difference is small. In other words, the effectis relatively weak. However, the effect was comparativelylarger in the area approximately 10–20 mm from the con-crete surface. This may have been caused by two factors.On the one hand, pore distribution was relatively obviouson the concrete surface, and in this region that called asconvection zone, the chloride penetration did not satisfythe diffusion equation, also the effect of changes in porestructure under load was very weak compared to theconvection effect. On the other hand, the tensile stress zonedid not cover the entire protective layer. Whether theprotective layer was in tension depends on the size of theeccentric load.
3.3. Changes in chloride diffusion over time
Figs. 9 and 10 show curves and statistical range chart with chlo-ride ion distribution under different test times. The findings are asfollows:
0.0
0.1
0.2
0.3
0.4
0.5
0.6
0.7
0.8
0 10 20 30 40 50 60x /mm
C(x
,2) /
%
mean value of compressivestress
mean value of tensil stress
Fig. 7. Mean value curve of Cl� concentration in tensile and compressive locationunder test condition.
0.0
0.2
0.4
0.6
0.8
1.0
1.2
0 10 20 30 40 50 60x /mm
C(x
,2)/
%
area of compressivestress
area of tensil stress
Fig. 8. Distribution ranges of Cl� concentration in tensile and compressive locationunder test condition.
(1) Chloride concentration in the concrete increased graduallywith time. As shown in Fig. 9, the distribution curve becamehigher with longer duration under different solution concen-trations. Fig. 10 shows the range chart of chloride concentra-tion distribution under different time with changes in otherconditions. The statistical analyses also showed that chlorideconcentration increased with increase in duration ofexposure. For example, when a specimen was in the solutionfor up to 6 months, its chloride distribution range wassignificantly higher than that of a specimen left in the solu-tion for 2 months. In addition, these two distribution rangesonly had a small overlapping area, especially on the surfaceof the protective layer.
(2) The distribution ranges of 6 months and 4 months had acomparatively large overlapping area, while there was nooverlapping area between the distribution ranges of4 months and 2 months. Thus, it can be seen that chloridepenetration has a decay trend during the late erosion time.This is consistent with theoretical predictions – diffusionphenomena occur mainly because of concentration differ-ence caused by mass transfer. Chloride concentrationdecreases gradually towards deeper parts of the concreteprotective layer, so the diffusion rate is also reduced.
0.0
0.1
0 10 20 30 40 50 60x /mm
0.0
0.2
0.4
0.6
0.8
1.0
0 10 20 30 40 50 60x /mm
C(x
,t)/
%
t=2
t=4
t=6
0.0
0.2
0.4
0.6
0.8
1.0
1.2
1.4
0 10 20 30 40 50 60x /mm
C(x
, t)/
%
t=2
t=4
t=6
(b)
(c)
Fig. 9. Mean value curves of Cl� concentration with different corrosion time undertest condition. (a) n = 5%; (b) n = 10%; (c) n = 15%.

0.0
0.2
0.4
0.6
0.8
1.0
1.2
1.4
0 10 20 30 40 50 60x /mm
C(x
,t)/
%
t
t
t
Fig. 10. Distribution ranges of Cl� concentration with different corrosion timeunder test condition.
20 M. Lei et al. / Tunnelling and Underground Space Technology 42 (2014) 15–24
4. Parameters related to durability of shield segment under thecoupling effect of chloride ion and load
4.1. Diffusion coefficient
4.1.1. The effect laws of load on diffusion coefficientBased on the foregoing analysis, we can see that the effect of
external load on diffusion of chloride ion mainly reflects changein the pore structure under change of load.
As shown in Fig. 11, in the one-dimensional diffusion analysismodel, the volume of the micro-element body is dV, and the sumof the pore volume is dVp.
Therefore,
dVp ¼ Pvp � dV ð1Þ
where Pvp is the porosity of the concrete—usually 0–40% of the totalvolume (CCES, 2004).
Under the effect of load (stress value is r), the vertical deforma-tion of the concrete d is:
d ¼ edz ¼ r=Ecdz ð2Þ
In this equation, e is the concrete’s dependent variable under load;Ec is concrete’s modulus of elasticity. Only unidirectional deforma-tion was considered to simplify our analysis.
Then the volume change DdV of the above stated micro-unitbecomes:
DdV ¼ ddxdy ð3Þ
d
d
d
d
(a)Fig. 11. Analysis mode of ion diffusion. (a) w
Assuming the cement particles are incompressible (or stretched),DdV is the change in pore volume. The change rate ep of the porevolume of the micro-element concrete under stress r can thus beobtained as follows,
ep ¼ DdV=dVp ð4Þ
Combining the equations above, we get:
ep ¼r
EcPvpð5Þ
Considering the diffusion is one-dimensional, when dx tends toinfinity, the concentration of the substance within dx can be re-garded as a constant C, so we can get the physical quality thatpassed the micro-element per unit of time as follows:
Without the effect of load : J ¼ CdVp ð6Þ
Under the effect of load : J0 ¼ Cð1� epÞdVp ð7Þ
By Fick’s first law:
J ¼ �D @C@x
J0 ¼ �D0 @C@x
(ð8Þ
In this equation, D0
is the effective diffusion coefficient in concreteafter fitting the experimental data obtained from the environmentand load coupling effect, D is the diffusion coefficient without theeffect of load on the chloride diffusion coefficient.Combining Eqs.6, 7 and 8, we get:
D0 ¼ ð1� epÞD ð9Þ
Taking into account that not all the pores are connected in concrete,and unconnected pores have no influence on the diffusion of chlo-ride ion, the coefficient ke is introduced to represent the percentageof connected pores, or the effective porosity. Substituting it into Eqs.(9) and (5), we get:
D0 ¼ 1� kerEcPvp
� �D ð10Þ
Eq. (10) is the function representing the effect of load on chlorideion diffusion coefficient. Obviously, when r is positive (i.e., undercompressive stress), load has a negative effect on the diffusion coef-ficient. When r is negative (i.e., under tensile stress), load has a po-sitive effect on the diffusion coefficient, which accelerates chloride
d
d
¦ Ò
'
(b)ithout load effect; (b) with load effect.
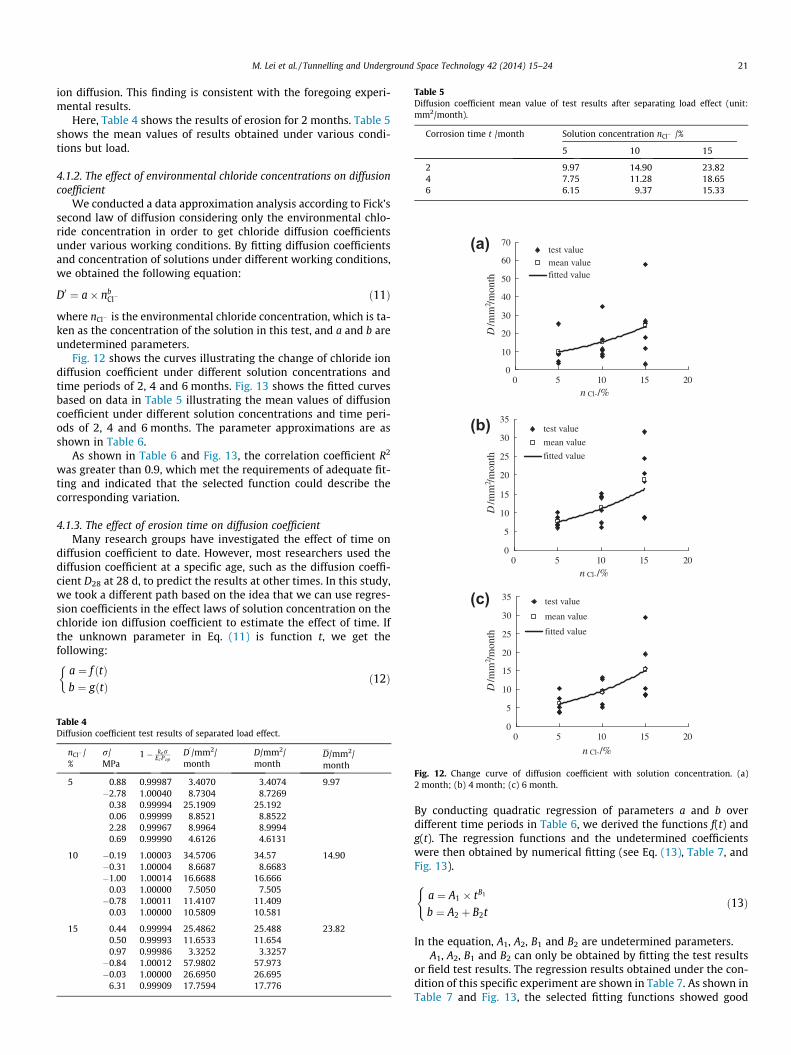
Table 5Diffusion coefficient mean value of test results after separating load effect (unit:mm2/month).
Corrosion time t /month Solution concentration nCl� /%
5 10 15
2 9.97 14.90 23.824 7.75 11.28 18.656 6.15 9.37 15.33
0
10
20
30
40
50
60
70
0 5 10 15 20n Cl-/%
D/m
m2 /m
onth
test valuemean valuefitted value
0
5
10
15
20
25
30
35
0 5 10 15 20
n Cl-/%
D/m
m2 /m
onth
test value
mean value
fitted value
10
15
20
25
30
35
D/m
m2 /m
onth
test value
mean value
fitted value
(a)
(b)
(c)
M. Lei et al. / Tunnelling and Underground Space Technology 42 (2014) 15–24 21
ion diffusion. This finding is consistent with the foregoing experi-mental results.
Here, Table 4 shows the results of erosion for 2 months. Table 5shows the mean values of results obtained under various condi-tions but load.
4.1.2. The effect of environmental chloride concentrations on diffusioncoefficient
We conducted a data approximation analysis according to Fick’ssecond law of diffusion considering only the environmental chlo-ride concentration in order to get chloride diffusion coefficientsunder various working conditions. By fitting diffusion coefficientsand concentration of solutions under different working conditions,we obtained the following equation:
D0 ¼ a� nbCl� ð11Þ
where nCl� is the environmental chloride concentration, which is ta-ken as the concentration of the solution in this test, and a and b areundetermined parameters.
Fig. 12 shows the curves illustrating the change of chloride iondiffusion coefficient under different solution concentrations andtime periods of 2, 4 and 6 months. Fig. 13 shows the fitted curvesbased on data in Table 5 illustrating the mean values of diffusioncoefficient under different solution concentrations and time peri-ods of 2, 4 and 6 months. The parameter approximations are asshown in Table 6.
As shown in Table 6 and Fig. 13, the correlation coefficient R2
was greater than 0.9, which met the requirements of adequate fit-ting and indicated that the selected function could describe thecorresponding variation.
4.1.3. The effect of erosion time on diffusion coefficientMany research groups have investigated the effect of time on
diffusion coefficient to date. However, most researchers used thediffusion coefficient at a specific age, such as the diffusion coeffi-cient D28 at 28 d, to predict the results at other times. In this study,we took a different path based on the idea that we can use regres-sion coefficients in the effect laws of solution concentration on thechloride ion diffusion coefficient to estimate the effect of time. Ifthe unknown parameter in Eq. (11) is function t, we get thefollowing:
a ¼ f ðtÞb ¼ gðtÞ
�ð12Þ
Table 4Diffusion coefficient test results of separated load effect.
nCl� /%
r/MPa
1� kerEc Pvp
D0/mm2/
monthD/mm2/month
D/mm2/month
5 0.88 0.99987 3.4070 3.4074 9.97�2.78 1.00040 8.7304 8.7269
0.38 0.99994 25.1909 25.1920.06 0.99999 8.8521 8.85222.28 0.99967 8.9964 8.99940.69 0.99990 4.6126 4.6131
10 �0.19 1.00003 34.5706 34.57 14.90�0.31 1.00004 8.6687 8.6683�1.00 1.00014 16.6688 16.666
0.03 1.00000 7.5050 7.505�0.78 1.00011 11.4107 11.409
0.03 1.00000 10.5809 10.581
15 0.44 0.99994 25.4862 25.488 23.820.50 0.99993 11.6533 11.6540.97 0.99986 3.3252 3.3257�0.84 1.00012 57.9802 57.973�0.03 1.00000 26.6950 26.695
6.31 0.99909 17.7594 17.776
0
5
0 5 10 15 20
n Cl-/%
Fig. 12. Change curve of diffusion coefficient with solution concentration. (a)2 month; (b) 4 month; (c) 6 month.
By conducting quadratic regression of parameters a and b overdifferent time periods in Table 6, we derived the functions f(t) andg(t). The regression functions and the undetermined coefficientswere then obtained by numerical fitting (see Eq. (13), Table 7, andFig. 13).
a ¼ A1 � tB1
b ¼ A2 þ B2t
(ð13Þ
In the equation, A1, A2, B1 and B2 are undetermined parameters.A1, A2, B1 and B2 can only be obtained by fitting the test results
or field test results. The regression results obtained under the con-dition of this specific experiment are shown in Table 7. As shown inTable 7 and Fig. 13, the selected fitting functions showed good
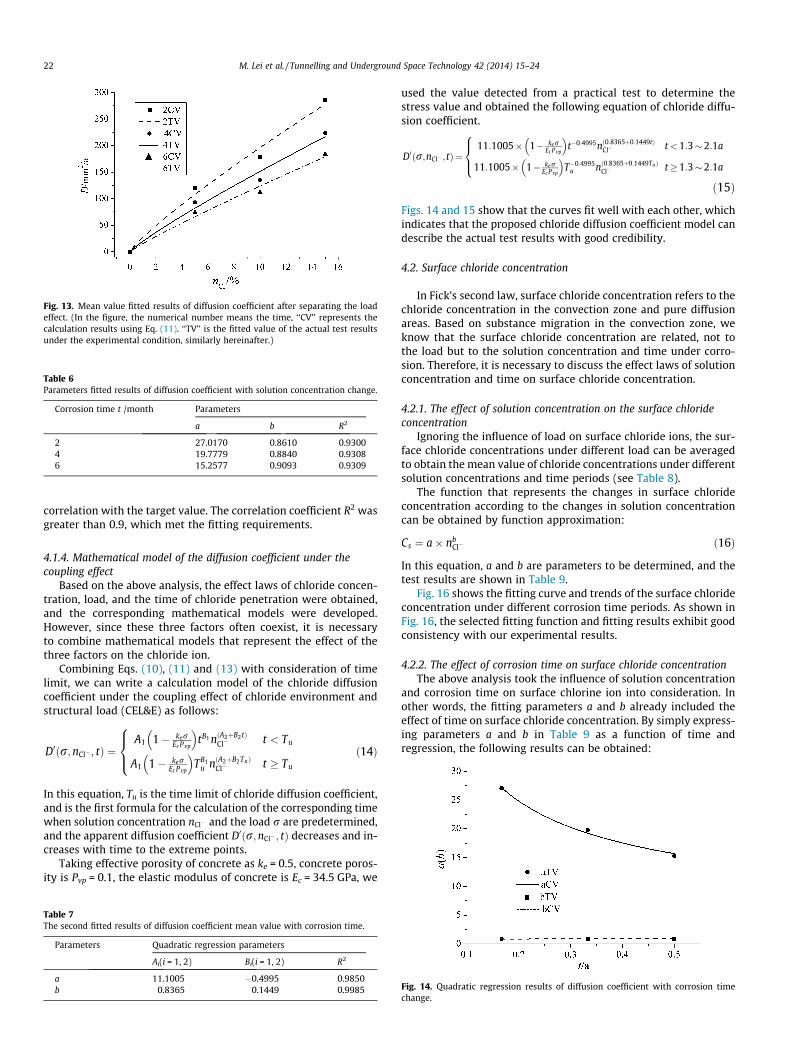
Table 6Parameters fitted results of diffusion coefficient with solution concentration change.
Corrosion time t /month Parameters
a b R2
2 27.0170 0.8610 0.93004 19.7779 0.8840 0.93086 15.2577 0.9093 0.9309
Fig. 13. Mean value fitted results of diffusion coefficient after separating the loadeffect. (In the figure, the numerical number means the time, ‘‘CV’’ represents thecalculation results using Eq. (11). ‘‘TV’’ is the fitted value of the actual test resultsunder the experimental condition, similarly hereinafter.)
22 M. Lei et al. / Tunnelling and Underground Space Technology 42 (2014) 15–24
correlation with the target value. The correlation coefficient R2 wasgreater than 0.9, which met the fitting requirements.
4.1.4. Mathematical model of the diffusion coefficient under thecoupling effect
Based on the above analysis, the effect laws of chloride concen-tration, load, and the time of chloride penetration were obtained,and the corresponding mathematical models were developed.However, since these three factors often coexist, it is necessaryto combine mathematical models that represent the effect of thethree factors on the chloride ion.
Combining Eqs. (10), (11) and (13) with consideration of timelimit, we can write a calculation model of the chloride diffusioncoefficient under the coupling effect of chloride environment andstructural load (CEL&E) as follows:
D0ðr;nCl� ; tÞ ¼A1 1� ker
EcPvp
� �tB1 nðA2þB2tÞ
Cl� t < Tu
A1 1� kerEc Pvp
� �TB1
u nðA2þB2TuÞCl� t � Tu
8><>: ð14Þ
In this equation, Tu is the time limit of chloride diffusion coefficient,and is the first formula for the calculation of the corresponding timewhen solution concentration nCl� and the load r are predetermined,and the apparent diffusion coefficient D0ðr;nCl� ; tÞ decreases and in-creases with time to the extreme points.
Taking effective porosity of concrete as ke = 0.5, concrete poros-ity is Pvp = 0.1, the elastic modulus of concrete is Ec = 34.5 GPa, we
Table 7The second fitted results of diffusion coefficient mean value with corrosion time.
Parameters Quadratic regression parameters
Ai(i = 1, 2) Bi(i = 1, 2) R2
a 11.1005 �0.4995 0.9850b 0.8365 0.1449 0.9985
used the value detected from a practical test to determine thestress value and obtained the following equation of chloride diffu-sion coefficient.
D0ðr;nCl� ;tÞ¼11:1005� 1� ker
Ec Pvp
� �t�0:4995nð0:8365þ0:1449tÞ
Cl� t<1:3�2:1a
11:1005� 1� kerEc Pvp
� �T�0:4995
u nð0:8365þ0:1449TuÞCl� t�1:3�2:1a
8><>:
ð15Þ
Figs. 14 and 15 show that the curves fit well with each other, whichindicates that the proposed chloride diffusion coefficient model candescribe the actual test results with good credibility.
4.2. Surface chloride concentration
In Fick’s second law, surface chloride concentration refers to thechloride concentration in the convection zone and pure diffusionareas. Based on substance migration in the convection zone, weknow that the surface chloride concentration are related, not tothe load but to the solution concentration and time under corro-sion. Therefore, it is necessary to discuss the effect laws of solutionconcentration and time on surface chloride concentration.
4.2.1. The effect of solution concentration on the surface chlorideconcentration
Ignoring the influence of load on surface chloride ions, the sur-face chloride concentrations under different load can be averagedto obtain the mean value of chloride concentrations under differentsolution concentrations and time periods (see Table 8).
The function that represents the changes in surface chlorideconcentration according to the changes in solution concentrationcan be obtained by function approximation:
Cs ¼ a� nbCl� ð16Þ
In this equation, a and b are parameters to be determined, and thetest results are shown in Table 9.
Fig. 16 shows the fitting curve and trends of the surface chlorideconcentration under different corrosion time periods. As shown inFig. 16, the selected fitting function and fitting results exhibit goodconsistency with our experimental results.
4.2.2. The effect of corrosion time on surface chloride concentrationThe above analysis took the influence of solution concentration
and corrosion time on surface chlorine ion into consideration. Inother words, the fitting parameters a and b already included theeffect of time on surface chloride concentration. By simply express-ing parameters a and b in Table 9 as a function of time andregression, the following results can be obtained:
Fig. 14. Quadratic regression results of diffusion coefficient with corrosion timechange.

0
50
100
150
200
250
300
0.1 0.2 0.3 0.4 0.5
t /a
Dap
p/m
m2 /a
5CV 5TV10CV 10TV15CV 15TV
Fig. 15. Comparison between computed and test value of Cl� diffusion coefficientunder coupling effect.
Table 8Mean value of surface Cl� concentration under different conditions (unit: %).
Solution concentration nCl� /% Corrosion time t /month
2 4 6
5 0.4836 0.6633 0.780110 0.7726 0.9232 0.988015 0.7681 1.0361 1.1430
Fig. 16. Change laws of surface Cl� concentration with solution concentration andits fitted curves.
Table 10Statistic of fitted parameters.
Parameters Ai(i = 3, 4) Bi(i = 3, 4) C4 R2
a 0.1890 0.5082 – 0.9981b 0.3452 0.4866 �0.9612 1.0000
Fig. 17. Fitted results of parameters.
M. Lei et al. / Tunnelling and Underground Space Technology 42 (2014) 15–24 23
a ¼ A3 þ B3t
b ¼ A4 þ B4t þ C4t2
�ð17Þ
In this equation, A3, B3, A4, B4 and C4 are undetermined parameters.As shown in results in Table 10 and Fig. 17, the selected fitting func-tion and the target point value exhibit good correlation with corre-lation coefficient larger than 0.9, indicating that they meet ouraccuracy requirements.
4.2.3. The joint effect of solution concentration and time on surfacechloride concentration
Combining Eqs. (16) and (17) with consideration of the timelimit, we can get the following mathematical model of chlorideconcentration under the joint influence of solution concentrationand time.
CsðnCl� ; tÞ ¼ðA3 þ B3tÞ � nðA4þB4tþC4t2Þ
Cl� t < tcr
ðA3 þ B3tcrÞ � nðA4þB4tcrþC4t2crÞ
Cl� t � tcr
8<: ð18Þ
In this equation, tcr is the time limit when the surface chloride con-centration becomes stable.
For underground structures, that is, in a comparatively stablegroundwater environment, tcr is relatively short. tcr is the extre-mum time determined through Eq. (18) or the time when the con-centration reaches environmental concentration.
Substituting the specific parameters into the equation, we canget the following surface chloride concentration function underour experimental conditions:
CsðnCl� ;tÞ¼ð0:1890þ0:5082tÞ�nð0:3452þ0:4866t�0:9612t2Þ
Cl� t<0:5�0:6a
ð0:1890þ0:5082tcrÞ�nð0:3452þ0:4866tcr�0:9612t2cr Þ
Cl� t�0:5�0:6a
8<:
ð19Þ
Table 9Statistic of fitted parameters.
Corrosion time t /month a b R2
2 0.2752 0.3996 0.62614 0.3554 0.4006 0.96486 0.4446 0.3482 0.9996
Fig. 18 shows the comparison between the calculated value of chlo-ride concentration and the fitted values under the joint influence oftime and solution concentration. The two values exhibit good corre-lation, which indicates that the model for chloride concentrationcalculation used in this study is reliable.
5. Durability evaluation model and method for segmentconcrete under the coupling effect of chloride ion and load
Based on our analysis of the aforementioned test results, math-ematical models that describe the chloride ion diffusion and sur-face chloride ion concentration under the CEL&E were developed.By substituting these two models into the diffusion equation de-rived from Fick’s second law, we obtained a durability evaluationmodel for shield tunnel segment concrete under coupling effect.
Cðx; tÞ ¼ CsðnCl� ; tÞ 1� erfx� Dx
2ffiffiffiffiffiffiffiffiffiffiffiffiffiffiffiffiffiffiffiffiffiffiffiffiffiffiffiffiD0ðr;nCl� ; tÞt
p !" #
ð20Þ

0.0
0.2
0.4
0.6
0.8
1.0
1.2
0.1 0.2 0.3 0.4 0.5t /a
Cs/%
5CV 5TV10CV 10TV15CV 15TV
Fig. 18. Comparison between test and computed values of surface Cl� concentra-tion under joint effect of solution concentration and time.
24 M. Lei et al. / Tunnelling and Underground Space Technology 42 (2014) 15–24
wherein;
CsðnCl� ; tÞ ¼ðA3 þ B3tÞ � nðA4þB4tþC4t2Þ
Cl� t < tcr
ðA3 þ B3tcrÞ � nðA4þB4tcrþC4t2crÞ
Cl� t � tcr
8<:
D0ðr;nCl� ; tÞ ¼A1 1� ker
Ec Pvp
� �tB1 nðA2þB2tÞ
Cl� t < Tu
A1 1� kerEc Pvp
� �TB1
u nðA2þB2TuÞCl� t � Tu
8><>:
8>>>>>>>>><>>>>>>>>>:
For shield tunnel’s segment structure, Dx is usually set at 5 mm, andother parameters should be determined based on the actual situa-tion of the project test or on-site detection. Alternatively, the resultsof this test can be used as reference.
If the unknown parameters in Eq. (20) are determined throughexperiments or tests, then chloride concentration C(hc, t) on thesteel surface (thickness of the protective layer is hc) can be ob-tained at any time. Thus, the durability of concrete in a real projectenvironment can be assessed.
Setting the critical chloride concentration of rebar depassiva-tion as [C] and current time as tn, we get the following results:
When C(hc, tn) < [C], the structure’s durability meets standardrequirements or has durability.When C(hc, tn) > [C], the structure does not meet the require-ments of durability or has lost durability.When C(hc, tn) = [C], the structure is at the end of its durabilitystatus, so the remaining durability expectancy is 0.
6. Conclusions
(1) Taking into consideration a shield tunnel’s environmentaland mechanical properties, we proposed a durability testmethod for the segment lining under CEL&E. Additionally,we developed an environmental simulation test device andused it to conduct tests.
(2) Based on a detailed analysis of the test results, we exploredthe joint effect of environmental chloride concentration,time, and load on chloride ingress and its law ofconcentration distribution. Our results indicate that, alongwith increase in ion concentration in the environment andpassage of time, chlorine ion content in the protective layerof the concrete goes up gradually. We also found that exter-nal load alters the pore structure properties within concrete,changing tensile stress in favor of chloride ion penetration,while changing compressive stress against it.
(3) Based on our data on change in internal porosity of concreteunder load, we developed an evolution equation for measur-ing chloride diffusion coefficient under the effect of load. Byapplying numerical fitting, the influence laws of
environmental ion concentration on chloride diffusion coef-ficient were obtained. Combining this with a time-varyingequation, we obtained a diffusion coefficient evolutionmodel under CEL&E, and derived corresponding formulas.
(4) By using numerical fitting and quadratic regression parame-ters, we proposed and developed an equation that reflectsCEL&E on the surface chloride concentration with highfitting precision.
(5) By combining equations that represent the law of CEL&Ewith chloride diffusion coefficient and surface concentra-tion, we developed a durability evaluation model and acalculation method for segmented concrete under the jointeffect of environmental corrosion and structural load. Thiscalculation method can be used for assessing the concretedurability of existing shield tunnel structures, prediction ofremaining service life, as well as durability design of newshield tunnel structures.
Acknowledgement
Financial support from the National Basic Research Program ofChina (973 Program: 2011CB013802) is gratefully acknowledged.
References
Alonso, C., Andrade, C., Castellote, M., et al., 2000. Chloride threshold values todepassivate reinforcing bars embedded in a standardize OPC mortar. CementConcr. Res. 30 (7), 1047–1055.
Bazant, Z., 1979. Physical model for steel corrosion in concrete sea structures –application. J. Struct. Div. ASCE 105 (ST6), 1155–1166.
Bhargava, Kapilesh, Ghosh, A.K., Mori, Yasuhiro, 2006. Model for cover cracking dueto rebar corrosion in RC structures. Eng. Struct. 28 (8), 1093–1109.
China Civil Engineering Society (CCES), 2004. Guide to durability design andconstruction of reinforced structure. China Building Industry Press, Beijing (inChinese).
González, J.A., Feliú, S., Rodríguez, P., et al., 1996. Some questions on the corrosion ofsteel in concrete-Part I: When, how and how much steel corrodes. Mater. Struct.29 (1), 40–46.
Jin, Weiliang, Yuan, Yingxu, Wei, Jun, et al., 2011. Durability Theory and DesignMethod of Concrete Structure in Chloride Salt Environment. Science Press (InChinese), Beijing.
Lomax, Rob, 2002. Cathodic protection system protects underground reservoir.Water Wastewater Int. 17, 23–29.
Mehta, P.K., 1991. Concrete in the Marine Environment. EIsevier Applied Science,Barking, UK, pp. 29–42.
Morinaga, S., 1990. Prediction of service life of reinforced concrete buildings basedon the corrosion rate of reinforcing steel. In: Proceedings of 5th InternationalConference on Durability of Building Materials and Components. Brighton, UK,pp. 5–17.
Morris, W., Vico, A., Vázquez, M., 2007. Chloride induced corrosion of reinforcedsteel evaluated by concrete resistivity measurements. Electrochim. Acta 49 (25),4447–4453.
Raupach, M., 1996. Investigations on the influence of oxygen on corrosion of steel inconcrete – Part 2. Mater. Struct. 29 (4), 226–232.
Rose, M.H., Matzkanin, G.A., 2003. Improved access to corrosion research willreduce total ownership costs. AMPTIAC Quart. 7 (4), 67–88.
Swamy, R.N., Hamada, H., Laiw, J.C., 1994. A critical evaluation of chloridepenetration into concrete in the marine environment. In: Corrosion andCorrosion Protection of Steel in Concrete – Proceedings of an InternationalConference. University of Sheffield, England, pp. 404–419.
Thomas, M.D.A., 1996. Chloride thresholds in marine concrete. Cement Concr. Res.26 (4), 513–519.
Tian, Junfeng, Pan, Deqiang, Zhao, Shangchuan, 2002. Prediction of durable life ofHPC structures resisting chloride ion penetration in marine environment. ChinaHarbour Eng. (2), 1–6 (in Chinese).
Wang, Jiangqiang, 2009. Study on lining structure steel corrosion and durability ofsubway tunnels. Chang’an university, Xi’an. (in Chinese).
Xianming, Wang, Hongyan, Zhao, 1996. Residual life prediction of RC membersunder ordinary atmospheric environment. J. Build. Struct. 3, 58–61 (in Chinese).
Yu, Hongfa, Sun, Wei, 2006. Model research on chlorine ion diffusion in concretes. J.Southeast Univ. (Nat. Sci. Ed.) 36 (Suppl. 2), 68–76 (in Chinese).
Zhang, Youhong, Cao, Yong, Chen, Xiaobin, 2009. Study on durability technologyand life prediction of tunnel structure suffering chloride salt attack. HunanCommun. Sci. Technol. 35 (3), 151–155 (in Chinese).