an experimental investigation of self regulatory …€¦ · · 2012-07-11(5) many cpa firms are...
TRANSCRIPT
Margarette Ilano
Shirley Magtipon
Andrew Pua
April Vidal De La Salle University-Manila, Philippines
The DLSU-AKI Working Paper Series represents research in progress. This paper is preliminary,
unreviewed and subject to further revisions and final editing. The views and opinions in this paper are of
the author(s) and do not represent the position or opinions of DLSU-AKI or its Members, nor the official
position of any staff members. Limited copies of this paper can be requested from DLSU-Angelo King
Institute, Room LS223, De La Salle University, 2401 Taft Avenue, 1004 Manila, Philippines. Please
request papers by number and title. Tel. No: (632) 524-5333; (632) 524-5369; Fax No: (632) 524-5347.
An Experimental Investigation of Self-
Regulatory Mechanisms and Auditor
Liability Regimes
Series 2008-01
DLSU-AKI Working Paper Series 2008-01
Self-Regulatory Mechanisms 2 March 2008
Table of Contents
Abstract 3
Introduction 4
Review of Related Literature 5
Auditor Liability Debate 5
Experimental Investigations 7
Framework 10
Comparison of Liability Regimes 10
Self-Regulation Mechanisms 11
Methodology and Experimental Design 13
Experimental Procedures 13
Subject pool and protocols 13
Design choice 13
Experimental stages 14
Post-experiment procedures 16
Equilibrium Strategies 17
Analysis of Experimental Data 19
General Observations 19
Estimation of Models and Discussion of Results 21
Conclusion and Recommendations 25
Acknowledgment 27
References 28
Appendix 31
List of Tables
1. Signal and Report Determination 33
2. Distribution of Failure Outcomes 34
3. Distribution of Effort Choices, Issued Reports and Failure Outcomes 35
4. Self-Regulation Treatment Investigations 36
5. Variable Definitions 37
6. Multinomial Logit and Probit Results Under Alternative Specifications 39
7. Seemingly Unrelated Estimation of Poisson Regression Models 42

DLSU-AKI Working Paper Series 2008-01
Self-Regulatory Mechanisms 3 March 2008
Abstract
This paper used recent corporate scandals as motivation to examine and test hypotheses from
models of auditor behavior, and experimental economics in constructing the basic elements of an
audit market populated by subjects hired to verify an investment outcome. Subjects were asked
to make effort choices linked to particular success and failure outcomes. To examine the effects
of different treatment combinations involving legal regimes, damage apportionment rules and
self-regulation regimes, a 3 x 2 x 2 factorial design was used to determine the extent of audit
failures and the behavior of subjects over time. Applying multinomial logit and Poisson
regression specifications helped determine the main and interaction effects of different treatment
combinations on the probability of committing audit failures. Arguments in literature and
popular debates were likewise evaluated, and some claims were invalidated within the context of
the experiment. Finally, it was recommended that the auditor's role in today's business
environment be re-examined.
DLSU-AKI Working Paper Series 2008-01
Self-Regulatory Mechanisms 4 March 2008
An Experimental Investigation of Self-Regulatory Mechanisms and
Auditor Liability Regimes
Recurring audit failures have persuaded the auditing industry to reflect upon the
institutionalized features of professional education, audit technologies, institutions of
accountancy and the ideologies and values of auditing firms. Defined as the issuance of an
erroneous audit opinion due to an underlying failure to comply with the requirements of
generally accepted auditing standards (Arens, Elder, & Beasley, 2003)1, audit failures maybe
classified into two – technical and independence audit failures. Technical audit failure refers to
the reckless or at least negligent acquiescence by auditors of accounting irregularities;
independence audit failure refers to inherent limitations in the auditor's role or capacity (Yu,
2004).
To minimize the occurrence of audit failures, governments introduced auditor liability
with the rationale that credible auditing can increase economic efficiency of capital markets by
reducing adverse selection and moral hazard (King, 1999). However, many auditing firms have
opposed the passage of stricter auditor liability rules in favor of lighter penalties combined with
self-regulation through professional associations. Yet with the spate of recent scandals, there
have been moves to increase penalties and promulgate looser and detailed rules to accommodate
every conceivable exception.
This paper adopts elements of past experiments and extends them by synthesizing the
literature on auditor liability, external regulation, and the relatively new literature on self-
regulation. Experiments were used to determine whether a combination of a self-regulatory
mechanism and auditor liability regime further reduce the frequency of audit failures.
Specifically, it seeks to answer the following question: What institutional combination is
superior with respect to auditors' effort choices, auditors' payoffs, auditors' reports, audit
failures, and auditor dropouts? Furthermore, this paper is limited to the study of an audit
market where details of financial statements are abstracted away.
1 Additionally, they explained why the failure of financial statement users to differentiate among business failure,
audit failure and audit risk has resulted in unwarranted lawsuits, as well as the nature of “expectations gap”, that is,
the conflict between financial statement users and auditors due to misunderstanding of the roles of auditors. Most
auditors believe that the conduct of an audit in accordance with generally accepted auditing standards is all that can
be expected of auditors. Many users believe that auditors can guarantee the accuracy of financial statements and
some users even believe that the auditor can guarantee the financial viability of the business.

DLSU-AKI Working Paper Series 2008-01
Self-Regulatory Mechanisms 5 March 2008
Review of Related Literature
Lawsuits against auditors have been on the rise. Arens, Elder, and Beasley (2003) cited
the reasons for this trend:
(1) There is growing awareness of the responsibilities of public accountants by users of
financial statements;
(2) There is an increased consciousness on the part of the regulatory authorities regarding
their responsibility for protecting investors' interests;
(3) Auditing and accounting are more complex because of factors such as the increasing size
of business, the globalization of business, and the intricacies of business operations;
(4) Society accepts lawsuits by injured parties against anyone who might be able to provide
compensation, regardless of who was at fault, coupled with the joint-and-several liability
doctrine. This is often called the “deep pocket” concept of liability;
(5) Many CPA firms are willing to settle their legal problems out of court in an attempt to
avoid costly legal fees and adverse publicity rather than resolving them through the
judicial process; and
(6) Courts have difficulty in understanding and interpreting accounting and auditing matters.
Auditor Liability Debate
Major auditing firms and their trade associations use wealth and political power to
require further liability exemptions such as proportional liability instead of joint-and-several
liability and capping of auditor's liability to third parties. Many do not agree with the auditing
firms in changing from joint-and-several liability to full proportional liability for four reasons.
First, it will be unfair for the stakeholders because there might be a possibility that the
respondent is insolvent. Second, joint-and-several liability is based on the principle of causation
which means that each respondent is liable for a certain amount of damages only so there is no
need to argue on being unfair for those who are not at fault yet being asked for claims. Third, the
solvency of the defendant is not assured so there is a need for having alternative respondents to
pay all the liabilities. Last, it is better that another possible party at fault will bear the loss than
the victim of the case (Cousins, Mitchell, & Sikka, 1998).
Liability policies encourage risk creators to employ optimal levels of care and encourage
shifting of allocations of costs to parties better equipped to bear the losses (Alagiah, Gunz,
Hillison, & Pacini, 2002). Increasing liability will also stimulate audit practices that will detect
fraud and misrepresentation. Narayanan (1994) analyzed auditor liability rules and found that if
the standard of care is set optimally without uncertainty, then joint-and-several liability is
preferred to proportionate liability. Examining the effect of due care (negligence) and strict
liability regimes on auditor effort when the damages are exogenously specified, Narayanan
(1994) showed that audit effort is higher in the due care regime than in the strict liability regime,
provided that the probability that the auditor is not held liable in the due care (negligence) regime
DLSU-AKI Working Paper Series 2008-01
Self-Regulatory Mechanisms 6 March 2008
is sufficiently sensitive to changes in audit effort. Additionally, he posits that changing the
liability regime from joint-and-several to a proportionate one will increase audit quality.2
In joint-and-several liability regime, auditors are assigned higher liability for
misstatements. While this regime encourages management and auditors to monitor each other3, it
also encourages named defendants to bring in unnamed but culpable parties to reduce their
expected legal costs. All these enable the joint-and-several liability regime to provide better
overall incentives, despite less incentive for auditor effort (Gigler, 1994).
In popular literature, many articles posit that joint-and-several liability makes an accused
auditor answer for all damages even if he is not really liable for all the mistakes. This is the
popular “deep pockets” syndrome. This kind of regime does not motivate auditors to check
deeply the company under examination. Auditors will also become selective in auditing clients
making it hard for firms to be audited. The current joint-and-several liability doctrine forces
defendants to pay more than their fair share if defendants are unable to pay. On the other hand,
proportionate liability states each party pays only the damages they have caused. Auditors are
well aware that they must be also financially responsible for their misdeeds and shortcomings.
Trial attorneys argue that under the joint-and-several liability doctrine, fraud and abuse
can be slowed down because all parties will take extra care in performing their jobs. However,
accountants are now pushing for a reform they believe constitutes the best approach to auditor
liability. Proportionate liability makes it clear that if the auditor is negligent, he is liable only to
the extent of his perceived share of responsibility for the loss caused. Being jointly and severally
liable, auditing firms might be in point of bankruptcy, sustaining more losses from lawsuits than
their revenues. Another costly litigation and it may put out one big auditing firm out of business
and further shrink the rank of auditors. Companies will only have a limited choice of auditors to
audit their firms. Firms will be more selective in choosing their client base in an effort to limit
their liability risk (Cousins, Mitchell, & Sikka, 1998).
2 In a proportionate regime, auditor's litigation costs are more sensitive to effort than it is under joint-and-several
liability regime. There is also a rule of apportioning liability between auditor and the company which ensures higher
audit quality under proportionate liability than joint-and-several liability regime. Moreover, proportionate liability
provides greater incentives to take greater effort in auditing [Narayanan 1994].
3 This is because both parties are potentially liable for each other's negligence and that legal discovery could be
improved because it may increase a wealthy defendant's incentive to defend himself.

DLSU-AKI Working Paper Series 2008-01
Self-Regulatory Mechanisms 7 March 2008
Experimental Investigations
Dopuch and King (1992) used experiments to know how legal regimes influence the
demand and supply of auditing services. They conducted 15 experimental markets with 8
subjects for 20 periods, and used three legal regimes (no-liability regime, negligence regime, and
strict liability regime) and a constant damage measure to determine the amount of damages to be
paid to the injured party.
Under the negligence regime, courts absolve verifiers of any liability for damages if they
had performed their services according to an exogenously determined due care standard. Under
the strict liability regime, courts make verifiers liable for damages regardless of fulfilling the due
care requirement. The purpose of the experiment is to determine the extent with which a strict
liability or negligence would alleviate the verifiers' moral hazard problem. They also investigated
15 negligence liability markets in a laboratory setting to assess the effect of varying liability on
the demand for and supply of auditing services, by devising a game imitating the roles of auditor,
firm management, and users of audit information (who represent possible litigants) with three
defined levels of responsibility (no liability, negligence, and strict liability). The prices paid for
audit services in the no-liability markets were lowest, medium in negligent liability, and highest
in strict liability. Interestingly, buyers seemed to treat strict liability almost like insurance. Their
findings suggest negligence liability markets induce more economic efficiency, that there are no
systematic benefits from imposing a strict liability rule, and that expanding the scope of auditor
liability may not achieve the desired effect.
Dopuch, King, and Schatzberg (1994) used experimental markets to test the effect of
different liability regimes on the decisions of the key players identified as the verifiers (auditors),
sellers and buyers. They have three different regimes. In the verifier only liability (VOL) regime,
only the verifier is liable for damages to buyers. In the verifier and seller proportionate (VSL)
liability regime, damages are shared proportionately by the verifier and the seller. In the verifier
proportionate liability (VPL) regime, the verifier can be proportionately liable for only his share,
and the seller does not pay damages. Using a game-theoretic model in the experiment, the
authors found that although the auditors were able to increase their fees in the VOL regime, it
was not enough to cover the litigation exposure it gets. Under the VPL regime, buyers reduce
their prices to more than compensate for their expected losses from nonpayment. In this regime,
the buyer achieves the highest wealth and the lowest for the seller even though they did not shed
any for the payment of damages. Of the three regimes, the VSL produced the greatest total
wealth for all the agents. It is interesting to note that the seller selects costly investments and
makes truthful disclosures when he directly shares the payment of damages with the verifier and
not indirectly through higher verifier fees or lower asset prices. The results prove to be consistent
with the desire of auditors to approve the proposal for a proportionate liability regime. Verifiers,
sellers and buyers are all better off in this regime since the verifiers do not have to take on all the
damages; the sellers are in a better position with their investments and in relation to the buyers;
and the buyers are able to collect more, compared to VPL, and at the same time obtain more or
less a truthful disclosure.
King and Schwartz (1999) used experiments to know how legal regimes influence audit
quality. They defended the use of experiments by arguing that the consequences of legal regimes
DLSU-AKI Working Paper Series 2008-01
Self-Regulatory Mechanisms 8 March 2008
are difficult to determine. Aside from this difficulty, there are delays in identifying the
consequences themselves in addition to data availability issues. Even if there were data available,
the nature of happenstance data confounds the effects of different institutions making up real
world markets. They further argued that an experiment's controlled setting leads to high levels of
internal validity. Their experiment modeled the learning effects of different legal regimes and
determined the reactions of subjects to actual imposition of financial penalties under different
regimes. It featured 4 legal regimes composed of 2 liability rules and 2 damage apportionment
measures. They interpret liability rules as probabilities that a court will impose liability based on
auditor's effort level and demonstrated that the convergence process did not differ significantly
across four legal regimes. They also demonstrated that actual imposition of penalties had a
significant effect on the choice of effort. Consistent with literature on psychology, effort
increased in the period immediately following a penalty. Effort levels are declining as the time
from the penalty imposition increased.
Yu (2001) explored the pattern of firms' new investments if auditor's liability increases.
He demonstrated that: (1) increases in auditor’s liability decreases the likelihood of audit failures
which may decrease firms' new investments if excessive; (2) firms' new investments increase
significantly when auditor’s liability increases from low to medium and decrease significantly
when auditor’s liability is increased from medium to high; (3) the frequency of audit failures
decreases insignificantly when auditor’s liability increases; and (4) higher auditor litigation may
increase auditing costs, decrease audit quality, and threaten the strength of capital markets. Yu
(2004) also had another argument for the effect of auditor liability on new investments. He posits
that liability payments may induce auditors to work hard which will ultimately be some form of
insurance to investors. These “protected” investors may over-invest in riskier assets. However,
he concludes that auditor liability is necessary to deter auditors from negligent auditing.
One of the alternatives to auditor liability is self-regulation, defined by Matthew and
Hepp (2003) as a process that involves members of the group making costly decisions to monitor
the other members of the group to enforce choices that maximizes group utility. They developed
a theory of self-regulation in auditing which assumes auditors face a social dilemma in making
audit quality decisions. Testing the theory using experimental markets, the results suggest that
self-regulation can overcome the dilemma and provide for a high quality audit. In this model, the
dilemma of the auditor is to choose between contradictory auditor preferences – earning high
rewards for high quality financial reporting of the group and obtain and retain clients who prefer
reputable auditors that allow client discretion. To avoid low quality reports, the authors argue
that auditors can use self-regulation to discipline group behavior. The baseline treatment
suggests that auditors give way to the pressures of opinion shopping when there is no way to
monitor other auditors' behavior. When a signal about audit quality is added, auditors do not
succumb easily, but low-quality audits cannot be completely removed. The collective action of
auditors assumes that the group shares a common goal – to provide high-quality audits. This
collective action, as the authors suggest, might be the key to solving the auditing dilemma.
Yu (2004) adopted laboratory experiments to test a series of economic and behavioral
hypotheses derived from a one-period game-theoretic model in which the auditor may commit
either a technical audit failure (due to imperfect audit technology and lack of audit effort) or an
independence audit failure (due to the impairment of independence). He designed four
DLSU-AKI Working Paper Series 2008-01
Self-Regulatory Mechanisms 9 March 2008
experiments (which combines two legal regimes and two damage apportionment rules) and used
the method of experimental economics to test a series of economic and behavioral hypotheses
derived from a one-period game model. In this experiment, it was put that (a) the manager
provides the quasi-rents and side payment to induce the auditor to compromise his independence;
and (b) the auditor may commit either a technical audit failure or an independence audit failure.
Results suggest there is no single legal system that can simultaneously induce higher audit
quality, decrease audit failure, improve auditor independence, and motivate firms' investment.
Specifically, a strict legal regime with a proportionate damage rule was found to effectively
decrease technical audit failure, improve auditor independence, and encourage firms' investment
despite the fact that audit quality also decreases. Auditor independence is impaired less often
than the model prediction because subjects recognize the compromise of independence to be
unethical. In addition, the auditor-subjects exert high effort under the proportionate rule than
under the joint-and-several rule because they perceive the former to be relatively fair in the
occurrence of a technical audit failure. These results suggest the importance of considering
people's ethical concerns and fairness perceptions in examining legal liability, audit quality, and
independence.
This paper extends previous literature to include self-regulation mechanisms in the
presence of external regulation mechanisms. It also considers a multi-period setting, which has
been largely ignored in previous experiments. This paper also puts Sunder's (2005) proposition
to the test.4
In today's auditing environment, the distinction between right and wrong depends on the
treatment espoused by standard-setters. The present auditing environment uses greater
punishment to induce cooperation; however, greater punishment entails greater resources
devoted to protect oneself, leading to lesser cooperation. Through an experiment, this paper
includes external regulation and self-regulation to determine how to induce a “good” auditing
environment. Yu’s (2004) experimental design is also applied to a multi-period setting. A self-
regulation mechanism is added to represent the role of social norms in Hepp and Mayhew’s
(2003) sense. Further, the manager’s role is treated as exogenous, unlike in past experiments, to
try out a design that involves anonymity.
4 Sunder (2005) argued that: (1) the auditing industry of the past had placed a great role for social norms to govern
their behavior and the rule books then were quite thin; (2) the present state of the auditing industry advocated a high
degree of specificity when it came to accounting treatments; and (3) social norms of the past, though incompletely
specified and has no authoritative source, did not foster an environment where anything that is not prohibited
specifically is acceptable.
DLSU-AKI Working Paper Series 2008-01
Self-Regulatory Mechanisms 10 March 2008
Framework
Comparison of Liability Regimes5
Legal liability for accidents is a means by which society can reduce the risk of harm by
threatening potential injurers with having to pay for the harms they cause. Under a strict liability
regime, an injurer must always pay for harm due to an accident that he causes. Under the
negligence rule, an injurer must pay for the harm caused only when he is found to be negligent.
Courts determine the standard of care required to distinguish negligent acts and careful acts
(Varian, 1999).
Assume two classes of parties: injurers and victims. Let be the expenditures on care
and be the probability of an accident that causes harm , is declining in . Further
assume a benevolent social planner wishes to minimize total expected costs . Under
strict liability, injurers pay damages equal to whenever an accident occurs and they bear the
cost of care . To minimize total expected costs, they choose the optimal level of care . Include
the victim as it is possible that the victim might be a party to his own accident. Add an argument
, the level of care chosen by the injurer in the model earlier. The social goal will be to
minimize . If there is no form of liability law, the injurer will choose a zero level
of care and the victim will choose the level of care that minimizes his total costs. This outcome is
not socially optimal because the injurer will take excessive care.
Under strict liability, the injurers’ incentives are optimal conditional on the victims' level
of care, but victims have no incentive to take care because they are fully compensated for their
losses. If there is a strict form of liability, the victims will be compensated for all costs imposed
on them. Therefore, victims have no incentive to take care of themselves. The injurers will then
choose the level of care that is optimal for them given the reckless behavior of the victims. This
is not a socially optimal outcome.
Under the negligence rule, the optimal behavior and is a unique equilibrium.
Injurers will not take care exceeding . If injurers choose less than , victims will take no
care so injurers will minimize which exceeds which
exceeds . Thus, injurers are better off taking care of . Since injurers will choose in
equilibrium, and then victims will choose
If levels of care and of activity for both injurers and victims are considered, then none of
the liability rules previously considered leads to full optimality, assuming that activity levels are
unobservable. The negligence rule induces injurers to engage excessively in their activity. Strict
liability induces victims to engage excessively in their activity, as they do not bear the losses
given that they also take due care. Full optimality cannot be achieved because injurers must bear
accident losses to induce them to choose the right level of activity, but this means that victims
will not choose their optimal level of their activity and conversely (Varian, 1999; Shavell, 2002).
5 The theoretical analysis in this section is adopted from Shavell (2002) and Varian (1999).

DLSU-AKI Working Paper Series 2008-01
Self-Regulatory Mechanisms 11 March 2008
Self-Regulation Mechanisms
Self-regulation involves members of the group making costly decisions to monitor other
members of the group to enforce choices that maximize group utility (Hepp & Mayhew, 2003).
This paper adopts an approach similar to Hepp and Mayhew (2003)6 and use collective-action
games to describe the auditors' dilemma; it also uses the mathematical model, illustrations and
analyses from Dixit and Skeath (1999) framed in an auditor context. Collective action games are
games involving many players where individual actions are not in the best private interests of
individuals. The socially optimal outcome is not automatically achievable as the Nash
equilibrium of the game.
Let there be auditors who decide to abide by professional codes of conduct. If of
them abide truthfully (where ), each of these auditors will incur a cost , which increases
in . All auditors including those who do not incur costs in abiding to professionalism will
receive benefits that also depends on . Thus, each ethical auditor will have a
payoff . Those unethical auditors will have a payoff of .
Society’s payoff from this configuration will be . Therefore,
the benefit to society is composed of benefits of being ethical and the benefits of being unethical.
Now, it is not entirely optimal if all auditors became ethical because the costs of being ethical
also increase. Conversely, having all unethical auditors is also not optimal because all unethical
auditors' benefits come from the presence of ethical auditors, i.e. . Society's payoff is
maximized if it tolerates a few unethical auditors, where “few” depends on the functional forms
of the payoff functions outlined earlier. The legal system will now be the mechanism used to
discipline these unethical auditors.
An auditor's action has some effect on the payoffs of all other players, referred to as
spillovers or externalities. These can be positive or negative and lead to individually driven
outcomes that are not socially optimal. When actions create negative spillovers, they are
overused from society's point of view; when actions create positive spillovers, they are
underused. What happens if there is someone who wishes to be ethical? The appropriate
derivative is:
The derivative has a natural interpretation. The term is the private gain from
switching from being unethical to being ethical. The term is the total change in the
6 Hepp and Mayhew [2003] described the auditing scene as a social dilemma where all auditors should do credible
audits to enhance their group reputations. Individually, the auditors have incentives not to produce credible audits.
However, with the help of group pressure, norms and probably coercion, auditors can align themselves towards a
public defender role.

DLSU-AKI Working Paper Series 2008-01
Self-Regulatory Mechanisms 12 March 2008
payoffs of the ethical auditors. The term is the change in the payoffs of unethical
auditors. These last two terms comprise the marginal spillover effect or the externality. In the
auditing dilemma, if all people will become unethical, society's marginal payoff will be zero
since all benefits, including being unethical, depend on the number of people who are ethical .

DLSU-AKI Working Paper Series 2008-01
Self-Regulatory Mechanisms 13 March 2008
Methodology and Experimental Design
Many texts and journal articles on the experimental economics literature specify an
experiment as a microeconomic system that includes an environment, agent behavior, and
institutions (e.g., Smith, 1987; Friedman & Sunder, 1994). The environment contains the set of
agents, commodities, resources, or endowments. Agent behavior comprises a set of choices
among allowable alternatives, messages, or signals. Institutions govern all agent interaction or
simply “the rules of the game.” Smith (1987) provides reasons why experiments will be helpful.
Experimental Procedures
Subject pool and protocols.
Subjects consist of 83 senior accounting students from De La Salle University, all of
whom are currently taking, or have taken, Auditing Principles (AUDPRIN).7 They were selected
because of their knowledge of the problems besetting the audit industry and the ethical
predispositions accountants are supposed to possess. Recruitment was through informal channels
such as invitations through Yahoo! Groups, and logging in signup sheets. All interested
participants are randomly placed in the twelve treatment combinations.8 All subjects are paid a
show-up fee of 30 pesos; latecomers are not allowed to participate in the experiment.
When it is time to begin the experiment, all subjects take their seats and are given copies
of instructions. After reading the instructions, one practice session is conducted so that the
manual environment and logistics of the experimental procedures will be familiar. The
experiment runs for an uncertain number of periods to prevent any last-round effects. Each
subject receives an experiment kit containing a ream of scratchpad, a big envelope, forms, a
ballpoint pen, folders and instruction sets. All subjects are not to engage in any private
communication and are not to reveal any information they have or have been provided them.
The experiment is implemented using a manual system at several different classrooms in
the university. To remove any context effects, the term ‘verifier’ is used instead of ‘auditor’.
Physical devices such as coins, balls and urns determine chance outcomes. All choices made by
subjects are written in pieces of paper. The experimenter approaches the subjects to determine
the choices they have made.
Design choice.
The experiment uses a 3 x 2 x 2 factorial design. The factorial design is the most
important general method for combining randomization and direct control when one has two or
7 AUDPRIN is a course outlining the principles of audit, ethical codes, legal issues and duties of a public
accountant.
8 Sample selection bias maybe a problem in this case. The bias may be justifiable on the grounds that it is
excessively difficult to synchronize schedules of different participants and randomly place them in 12 treatment
combinations.

DLSU-AKI Working Paper Series 2008-01
Self-Regulatory Mechanisms 14 March 2008
more treatment variables.9 In this paper’s experiment, the factors are two liability regimes, two
damage apportionment rules, and three self-regulation mechanisms. There should be twelve
possible combinations of the factors. The two liability regimes considered are the strict liability
regime (SL) and negligence regime (NE), which are similar to past literature (Dejong, 1985;
Dopuch, 1992; Dopuch, 1994; King, 1999; Yu, 2001; Yu, 2004). The two damage apportionment
rules are the joint-and-several liability rules (JS) and proportionate liability (PL) rules, which
have been discussed in the earlier sections. Self-regulation treatments into divided into three
levels: no self-regulation (NR), self-regulation 1 (SR1), and self-regulation 2 (SR2).
Experimental stages.
The steps for each experimental period for all treatments are as follows:
(1) At the beginning of the period, a randomly generated name is assigned to each auditor-
subject. This assigned name will not change throughout the experiment and remains
private for the meantime. Each assigned name is for data-gathering purposes.
(2) At the beginning of each period, each auditor-subject is assigned two true investment
outcomes, each with a 50% probability: a low true investment outcome and a high true
investment outcome. These true outcomes are predetermined by coin tosses prior to the
start of the experiment.
(3) Each auditor-subject receives a flat audit fee of 500 EPs10 to credibly verify the outcome
of the investment.
(4) Each auditor-subject privately determines the effort level to be exerted by choosing either
a high effort level that costs 260 EPs, or a low effort level that costs 200 EPs. Since the
true outcome of the investment is never revealed to the auditor-subject, his audit
technology is imperfect.
(5) The audit signal is determined. This can either be a low signal or a high signal based on
the auditor-subject's effort choice and the unrevealed true investment outcome. This
signal is given to the auditor-subject after he/she made his/her effort choice. (Table 1
shows how the signals are determined; this is not shown to the auditor-subjects, who
merely make effort choices and receive signals.)
9 The factorial design is more efficient than the completely randomized design because it allows each treatment
combination to occur an equal number of times (Friedman & Sunder, 1994). A factorial design is also desirable
since it allows examination of main effects and interaction effects of factors. While a factorial treatment structure
provides the maximal amount of information about the effects of factors and their interactions, there are some
disadvantages. In general, the number of treatments that will appear in the experiment is equal to the product of the
levels from all of the factors. In an experiment with many factors, this can be enormous. For example, in a 10-factor
design, with each factor at 2 levels, there are 1024 treatment combinations (Cox & Reid, 2000). There are several
reasons for designing complete factorial experiments, rather than, for example, using a series of experiments
investigating one factor at a time. The first is that factorial experiments are much more efficient for estimating main
effects, which are the averaged effects of a single factor over all units. The second, and very important, reason is that
interaction among factors can be assessed in a factorial experiment but not from series of one-at-a-time experiments
(Cox & Reid, 2000)
10 This is the notional currency in the experiment. EPs stand for experimental pesos with a conversion rate of 15 EPs
= 1 peso.

DLSU-AKI Working Paper Series 2008-01
Self-Regulatory Mechanisms 15 March 2008
(6) Upon the auditor-subjects' receipt of the signal, the auditor-subjects privately determine
the audit report to be issued by choosing either high report or low report. Independence
audit failure occurs if the auditor intentionally misrepresents the true outcome of the
investment. This occurs when the auditor issues a high audit report when the audit signal
is low. Technical audit failure occurs if the auditor cannot effectively discover the true
outcome of the investment due to his imperfect audit technology and effort level [Yu
2004]. This occurs if the auditor obtains a high audit signal when the true investment
outcome is low. Every time that the auditor gives out a high report, that auditor-subject
automatically receives engagement rent of 600 EPs. The damages under the different
combinations of legal regimes and damage apportionment rules are summarized in the
next step.
(7) If the auditor-subject commits a technical audit failure, no side payments are made. If the
auditor-subject commits an independence audit failure, he receives a side payment of 400
EPs. If the auditor-subject commits a technical audit failure, damages total 750 EPs. If
the auditor-subject commits an independence audit failure, damages total 1300 EPs. Both
damages arise if auditors become liable which depends on the prevailing regime
treatment. The division of damages also depends on the damage apportionment rule in the
treatment.
(8) Under joint-and-several liability regime (JS), the auditor-subject shoulders all the
damages while under the proportionate regime (PR), the auditor-subject shoulders only
40% of the damages. The legal regime determines the probability that the auditor is
liable. Under the strict liability regime (SL), all auditors are liable regardless of the effort
level. Under the negligence regime (NE), the auditor is held liable 30% of the time if his
effort level is high. Under the negligence regime, the auditor is held liable 70% of the
time if his effort level is low.
Additional steps in the unregulated treatment:
(1) Inform the auditor-subject about the reporting rules.
(2) Give the auditor-subject an update on the payoffs they have received using the formulas
given in the instruction set.
Additional steps in the self-regulation 1 (SR1) treatment:
(1) After the auditor-subjects have made their report decision, no liabilities are calculated
yet.
(2) An urn containing the assigned names of all auditor-subjects is part of a lottery to
determine an auditor-subject who will be investigated. Each auditor-subject is asked if
he/she wishes to investigate. Each investigation costs 200 EPs. Each auditor-subject may
investigate only once per period.
(3) If an auditor-subject chooses to investigate, he/she draws an assigned name and reveals
the name to the experimenter. The drawn name is not returned to the urn. If the
investigated auditor-subject commits any type of audit failure, the investigated auditor is
given a payoff reduction of 900 EPs. Otherwise, there is no payoff reduction.
(4) If any of the auditor-subjects choose not to investigate and any one of the auditor-subjects
commits an audit failure, all auditor-subjects are asked to write an amount deductible

DLSU-AKI Working Paper Series 2008-01
Self-Regulatory Mechanisms 16 March 2008
from all auditor-subjects who commit audit failures. The median of all written amounts is
computed and deducted accordingly from those who committed such failures. Otherwise,
there is no payoff reduction.
Additional steps in the self-regulation 2 (SR2) treatment:
(1) After the auditor-subjects make their report decision, no liability is calculated yet.
(2) An urn containing the assigned names of all auditor-subjects is part of a lottery to
determine an auditor-subject who will be investigated. Each auditor-subject is asked if
he/she wishes to investigate. Each investigation costs 200 EPs. Each auditor-subject may
investigate only once per period.
(3) If an auditor-subject chooses to investigate, he/she will draw an assigned name and
he/she reveals the name to the experimenter. The drawn name will not be returned as part
of the lottery. If the investigated auditor-subject commits any type of audit failure, the
investigated auditor is given a payoff reduction of 900 EPs and the investigating auditor
gains 600 EPs. Otherwise, there is no payoff reduction to the investigated auditor.
(4) If any of the auditor-subjects choose not to investigate and any one of the auditor-subjects
commits an audit failure, there is a payoff reduction of 750 EPs to all auditors.
Otherwise, there is no payoff reduction.
Additional steps for the last parts of the round for all treatment combinations:
(1) Each subject's payoff is determined and all subjects are informed of their respective
payoffs privately. A pro-forma statement of their earnings is given at the end of each
round. This statement must be kept for verification of earnings at the end of the
experiment.
(2) Auditor-subjects are given an option to drop out of the experiment with a corresponding
percentage deduction from their cumulative payoffs at the end of the round. If the
auditor-subject declines, proceed again with Step One.
(3) If an auditor-subject drops out, 60% of his/her end-of-round cumulative payoffs are
deducted.
Post-experiment procedures.
Administer an exit poll at the end of the experiment. The exit poll consists of survey
questionnaire requesting demographic information and experiment-related questions. Subjects
fill up a blank comment form for any comments and suggestions for improvement. At the end of
the experiment, each random name is part of a lottery. Two participants have a chance to convert
their accumulated EPs into cash. After the names of these two participants are drawn, the
experimenters draw one more name from the remaining names in the lottery. The EPs earned by
the participant with such name is divided among the remaining participants who did not get the
chance to convert their earnings into cash.

DLSU-AKI Working Paper Series 2008-01
Self-Regulatory Mechanisms 17 March 2008
Equilibrium Strategies
A software called GAMBIT (McKelvey, McLennan and Turocy, 2007) is used to draw
the game tree and to solve for all Nash equilibria. If the game tree is subjected to one of the
twelve treatment combinations, only the payoffs will change. The auditor has five strategies,
namely:
(1) Exert high effort, report low when audit signal is low
(2) Exert high effort, report high when audit signal is low
(3) Exert low effort, report high when audit signal is low
(4) Exert high effort, report high when audit signal is high
(5) Exert low effort, report high when audit signal is high
In a strict liability/joint and several/unregulated treatment combination, the auditor
selects a low effort level regardless of the true investment outcome. There are multiple equilibria
in this treatment combination where all, but two, are socially optimal. The two inefficient
equilibria are technical audit failure outcomes.
In a strict liability/proportionate liability/unregulated treatment combination, the auditor
exerts low effort regardless of the true investment outcome. There are two equilibria where one
is a socially optimal outcome and the other is a technical audit failure outcome. The only
difference with the previous treatment is the payoff difference.
In a negligence/joint and several/unregulated treatment combination, the equilibrium
strategy is for the auditor to exert high effort regardless of the true investment outcome. There
are two equilibria where one is a socially optimal outcome and the other is an independence audit
failure outcome. The auditors here choose to face the liabilities associated with the failure
outcome.
In a negligence/proportionate liability/unregulated treatment combination, the
equilibrium strategy is for the auditor to exert high effort regardless of the true investment
outcome. There are two equilibria - one is a socially optimal outcome and the other is an
independence audit failure outcome. The auditors here choose to face the liabilities associated
with the failure outcome. The only difference between this treatment and the previous treatment
is the payoff difference.
In the self-regulated treatment combinations, the auditor's effort levels remain the same.
However, all inefficient equilibria, which are failure outcomes, are totally removed. The only
difference between different possible equilibria is wealth distribution. Of course, these outcomes
in the self-regulation treatment depend greatly on the second stage of the experiment, which is
the auditors' collective action game. The Nash equilibria are for the investigating auditor to
refrain from investigating and for all other auditors to refrain from committing any audit failures.
However, this may not be possible in the first few rounds of the experiment. This game can be
solved through repeated play where the end game is uncertain. If a norm of being honest
prevails, then the collective-action game is solved and it will not be possible to have audit
failures. It is also possible there would be diffusion of responsibility. Here the idea is that
everyone might agree help is needed, but they are not in direct communication with each other
DLSU-AKI Working Paper Series 2008-01
Self-Regulatory Mechanisms 18 March 2008
and so cannot coordinate on who should help. Since investigation has costs and the revelation of
an audit failure arising from an investigation only punishes the auditor who failed, it is possible
diffusion of responsibility might occur. This leads to few auditors investigating. However, the
presence of payoff reductions to all other auditors (with or without fault) might induce honesty in
the auditing dilemma.

DLSU-AKI Working Paper Series 2008-01
Self-Regulatory Mechanisms 19 March 2008
Analysis of Experimental Data
There are 84 subjects with 7 subjects in each of the 12 treatment combinations. Of the 84
subjects, one subject in the NE/PR/NR treatment did not participate in the experiment because of
tardiness. The experiment had 857 observations with 83 subjects. The observations in the
experiment form an unbalanced panel and missing observations were treated as missing at
random.
General Observations
Observation 1: The proportion of audit failures in all treatments across time is less than 50% but
a closer look at the data reveals otherwise.
Table 2 shows the distribution of failures for all cases. However, a closer look at the
distribution of effort and true outcomes reveals that out of 201 cases of low investment outcome
and high effort choice, 144 (70%) were independence failures outcomes. This suggests that most
subjects, despite the high effort choice, opted to willfully ignore to give a truthful assessment.
Observation 2: There were no auditor dropouts in all treatment combinations.
This observation casts doubt on the validity of the arguments on auditors dropping out of
the market because of stringent standards and rules. The experiment gave the subjects a chance
to dropout from the experiment in any round with a deduction of 60% of cumulative payoffs
from all rounds. The deduction reflects the opportunity costs of exiting the audit market. Policies
should focus on increasing the opportunity costs of exiting the simulated audit market to prevent
exit of auditors (both competent and incompetent) even with stringent liability regimes. This
observation disproves arguments made by people regarding the unattractive features of the audit
markets if there are stringent regimes.
Observation 3: All treatment combinations did not fully prevent the happening of audit failures.
Table 3 shows the distribution of failure outcomes. It indicates the SL/JS/SR1 treatment
combination has the lowest incidence of independence failure and the SL/PR/SR2 treatment
combination has the lowest incidence of technical failure. Expectations were not consistent with
the distribution given here which suggests the possible role of subject level variables but the
analysis in the next section reveals that subject level variables do not play a statistically
significant role in explaining the probability of committing failures. This suggests further
refinement of the strict liability and negligence regimes.
Observation 4: Although all treatment combinations did not fully prevent audit failures from
happening, there seems to be a tradeoff between the incidence of technical audit failures and
independence audit failures.
Observation 5: Self-regulatory mechanisms will not work if there are no incentives to make
them work.
DLSU-AKI Working Paper Series 2008-01
Self-Regulatory Mechanisms 20 March 2008
This observation is especially true in the SR treatments (see Table 4). In the SR
treatment, all auditor-subjects were asked to make a decision to investigate fellow auditor-
subjects or not. If any auditor-subject chooses to investigate, the investigating subject incurs
costs of 200 EPs. If not, all auditor-subjects will be asked to write an amount to be used to
deduct the payoffs of all auditor-subjects who committed mistakes. In some treatments, no one
investigated except for the first two periods only. In the SR2 treatments, there is a higher rate of
investigations because there are gains to catching auditor-subjects that commit audit failures.
Observation 6: The self-regulated 2 (SR2) treatment boosted the number of investigations;
however, subjects who committed failures initiated almost half of those investigations.
Following the earlier observation, this proposed treatment created a tradeoff. In the SR
treatments, no subject initiated investigations since there were no incentives to do so. The
provision of such incentives in SR2, however, created a situation where those who committed
failures were the ones who investigated to prevent the payoff deductions to all auditors.
Observation 7: There was a high incidence of high reports in all treatment combinations.
Observation 8: Although the optimal strategy in the negligence (strict) legal regimes is to exert
high (low) effort, not all subjects chose to exert high (low) effort.
Table 4 shows that subjects selecting high efforts were a little over 50%. Not all optimal
strategies, as outlined in the previous section, were truly used. However, there is a small
difference between the percentages of high efforts chosen by subjects in the negligence regime
compared to those subjects in the strict liability regime. The optimal strategy for a subject in the
negligence regime is to exert a high level of effort but a little more than 50% did so. In the strict
liability regime, the optimal strategy for the subject is to choose low effort but only less than
50% did so. This may be interpreted as auditor-subjects’ aversion towards low effort levels.
Observation 9: Allowing subjects to decide on punishments for other subjects who committed
audit failures promote diffusion of responsibility and member protection.
This observation is especially true in the SR regimes where subjects are asked to write an
amount that would represent payoff deductions to other subjects. Only one subjects needs to
investigate, therefore, there is diffusion of responsibility. No one wished to incur the costs of
investigation even if the costs were small relative to the possible payoffs. No subject was willing
to commit some of the payoffs to investigate fellow subjects. Moreover, the median punishment,
which is indirectly controlled by the subjects, provides a measure of the lack of incentive to
promote honesty in reporting. This observation is very startling since auditor-subjects are
supposed to uphold the public interest, yet no one wished to investigate fellow auditor-subjects
for any failures committed. The median punishments were declining rapidly through time.
DLSU-AKI Working Paper Series 2008-01
Self-Regulatory Mechanisms 21 March 2008
Estimation of Models and Discussion of Results
Eight models, with failure as the dependent variable, were estimated. All odd numbered
models are estimated using multinomial logit; all even numbered models are estimated using
multinomial probit.
The probability of committing failure is modeled as a function of effort choice,
investment outcome, the treatment variables, payoffs and a time trend. Variable definitions and
descriptions are in Table 5. The models estimated are subject-level which means that the unit of
analysis is the subject. The purpose is to determine the effect of the treatment variables on the
responses of subjects. It is clear from all the results that the effects of effort choice and the
assignment of a true investment outcome are robust across all eight specifications. Even after
controlling for subject effects, the results are qualitatively the same; hence a presentation of the
estimation results with subject effects was unnecessary. A series of likelihood ratio tests were
computed to determine the best model. Model 7 and Model 8 are the best models by the
likelihood ratio tests.
A Poisson regression model was estimated, where the number of each type of failure (no
failure, technical failure, and independence failure) is treated as a count variable. The dependent
variable in the Poisson regression model is treated as a rare event. The model uses aggregate
level outcomes to determine the effects of the treatment variables on the probability of the
occurrence of a failure. Each type of failure is modeled as a function of the proportion of high
investment outcomes, the proportion of high effort choices, the treatment variables, their
interaction effects and a time trend. The analysis is further supplemented by a seemingly
unrelated estimation technique to take advantage of the correlations of the error terms and the
interrelationships between the types of failures.
The results discussed below are for Models 1 to 8 and are in Table 6.
Result 1: The trend variable time is statistically insignificant in explaining the probability of
failure over time.
We included the trend variable to determine if there are learning effects over time. There
is no indication of any learning effects over time even if the trend variable is dropped and 10
time dummies were used for the 11 periods. Including 10 such time dummies in the model did
not improve the fit significantly and all time dummies were highly insignificant (with some
having a p-value of 0.954).
The surprising result is that the greater the number of rounds, the higher the likelihood of
committing both types of failures.
Result 2: Effort choice and true investment outcomes are both statistically significant in
explaining the probability of failure of subjects over time.
These two variables were included to determine if effort choices made by subjects and
chance outcomes determine the probability of failure. The coefficients of effort choice are very

DLSU-AKI Working Paper Series 2008-01
Self-Regulatory Mechanisms 22 March 2008
plausible for both types of failures. Low effort choices have a higher average probability of
committing technical failures. High efforts have a higher average probability of committing
independence failures. The coefficients of true investment outcome are also very plausible. Since
both technical and independence failures arise solely from low true investment outcomes, the
sign on the coefficient is negative.
Result 3: The liability regime is statistically insignificant in explaining the probability of failure.
The liability treatment variable is statistically insignificant and has an implausible sign.
The coefficients show that a negligence regime increases the probability of committing a
technical failure and decreases the probability of committing an independence failure compared
to the strict liability regime.
Result 4: The damage rule is statistically insignificant in explaining the probability of failure.
A positive sign was expected but the results suggest a proportionate damage rule
increases the probability of committing technical failure and decreases the probability of
committing an independence failure. A possible explanation will be the lower damages (40% of
750 only) received in a proportionate damage rule makes it conducive for committing technical
failures. Another is the lack of choice given to the subject when events lead to technical failure.
They choose to face damages since they are particularly lower. For the independence failure, it is
possible that subjects committing independence failure view proportionate damage rule as a
“fair” measure of damage compared to the joint and several damage rule. However, this
explanation must also apply equally well to subjects committing technical failure. The result is
implausible because regardless of the type of failure to be committed, a proportionate damage
rule must be preferred. Subject-level variables cannot explain this result as well.
Result 5: The SR1 treatment variable is statistically significant in explaining the probability of
technical failure. The SR2 treatment variable is statistically significant in explaining the
probability of technical failure (for Models 1 to 6).
In explaining the probability of committing technical and independence failure, the
variable is statistically significant. The signs, however, are surprising. A self-regulation 1 (SR1)
regime decreases the probability of committing both types of failure but a self-regulation 2 (SR2)
regime increases the probability of committing both types of failure. The SR2 treatment result
can be interpreted as the hedging of subjects against future failures. The SR1 treatment result can
be interpreted as a diffusion of responsibility phenomenon. Since the SR1 treatment featured a
median punishment mechanism under the control of auditor-subjects, it is possible subjects are
playing a game with each other. They do not really know who should initiate investigations since
investigations are costly with no matching benefits. The median punishment mechanism is also a
highly probabilistic mechanism from a subject's point of view because the subjects do not truly
know what punishment they would receive. Due to the inherent uncertainty, subjects may be
deterred from committing any failures. The reverse is true in the SR2 treatment. The SR2
treatment allows initiators of investigations to gain from their investigations. This may lead to
investigators who have committed failures to investigate and use the gains as a safety net for any
damages.
DLSU-AKI Working Paper Series 2008-01
Self-Regulatory Mechanisms 23 March 2008
Result 6: Second-order interactions of the treatment variables are statistically insignificant
except for the liability-SR1 interaction term.
Second-order interactions indicate that the effect of one treatment variable differs at
different levels of another treatment variable (Delaney & Maxwell, 2004). For the liability-
damage interaction term, subjects under the negligence regime and proportionate damage rule
treatment combination are less likely to commit technical failure but are more likely to commit
independence failure. For the liability-SR1 interaction term, subjects under the negligence
regime and SR1 treatment combination are more likely to commit technical and independence
failure. For the liability-SR2 interaction term, subjects under the negligence regime and SR2
treatment combination are less likely to commit technical and independence failure. However,
this is only true for the multinomial logit specifications and the reverse is the case for the
multinomial probit specifications. For the damage-SR1 interaction term, subjects under the
proportionate damage rule and SR1 treatment combination are more likely to commit technical
failure. However the reverse is true for the probability of committing independence failure under
the multinomial probit specifications. For the damage-SR2 interaction term, subjects under the
proportionate damage rule-SR2 treatment combination are less likely to commit independence
failure. However, the reverse is the case for the multinomial logit specifications for the
probability of committing technical failure. The general trend is that lenient punishment
mechanisms involving chance and low pressure of conformity increases the likelihood of
committing failures.
It cannot be explained why the results of the second-order interactions are such. The
results of these interaction terms suggest further study on the effects of combination of different
policy interventions on the probability of committing failure.
Result 7: Third-order interactions of the treatment variables are highly insignificant.
Third-order interactions indicate the effect of second-order interactions differ at different
levels of the remaining treatment variable (Delaney & Maxwell, 2004). Here the liability-
damage-SR1 interaction term suggests subjects under negligence regime, proportionate damage
rule and SR1 treatment combination are less likely to commit failures. The reverse is true for the
probability of committing independence failures. Again, this is still consistent with the hedging
effects explained earlier. In the estimated model, there are only two third-order interactions and
such interactions are statistically insignificant; therefore we can interpret the second-order
interactions unambiguously.
Result 8: Payoffs are statistically significant in explaining the probability of committing failures.
The results from Model 7 and Model 8 suggest higher payoffs reduce the probability of
committing technical failures. On the other hand, higher payoffs increase the probability of
committing independence failures. This can also be explained by the hedging effect mentioned
earlier.

DLSU-AKI Working Paper Series 2008-01
Self-Regulatory Mechanisms 24 March 2008
The succeeding results pertain to the seemingly unrelated estimation of the Poisson
regression models (Models 9 to 12) mentioned earlier. (Refer to Table 7 for complete results.)
Result 9: The proportion of high investment outcomes is statistically significant in all alternative
specifications. The same results hold for the proportion of high effort choices.
Results are consistent with expectations that the larger the proportion of high investment
outcomes, the lower the incidence of technical and independence failures. Results are also robust
across different specifications. For proportion of high effort choices, the larger the proportion of
high effort choices, the lower is the incidence of technical failures. The reverse is true for
independence failures.
Result 10: The SR2 treatment is statistically significant in explaining the incidence of
independence failures.
This is consistent with the hedging explanation earlier. The results suggest that the SR2
treatment leads to more aggregate independence failures. This result is also robust across
different specifications. Further the coefficient of the interaction term damage-SR2 suggests that
the proportionate damage rule and SR2 treatment combination contributes to lower incidence of
independence failure. This is a surprising result because it seems being punished jointly and
severally might be construed as an unfair outcome. However, this interaction requires further
study.
Result 11: The damage-SR1 interaction term is statistically significant in explaining the
incidence of technical failure.
This aggregate outcome is consistent with the individual level models. The treatment
combination of proportionate damage rule and SR1 increases the incidence of technical failure.
This might be the effect of the diffusion of responsibility combined with the leniency and
ineffectual median punishment mechanism of SR1.

DLSU-AKI Working Paper Series 2008-01
Self-Regulatory Mechanisms 25 March 2008
Conclusion and Recommendations
Results of the estimated models, whether estimated at the individual or aggregate level,
suggest the great role that effort choice and true investment outcomes play in the determination
of failure outcomes. The experiment abstracts the effort choice as an observable variable by the
experimenter and can be used to determine earnings. Future policies should create mechanisms
that can reveal the amount of effort exerted by auditors. Although this would be very costly,
there is need to explore if the benefits from an effort revelation mechanism is higher than letting
audit failures come out.
Stricter liability rules are not solutions to the audit failure problem. There is a greater role
for self-regulation in governing the behavior of auditors. The significance of the variable
suggests future policies must promote stronger linkages between norms and actions of auditors.
Disciplinary actions through societal mechanisms rather than legal means may be a way to deter
auditors from committing failures.
To further promote self-regulation, auditors should be given a chance to demonstrate a
strong sense of morality and dedication to public interest. Further education may also play a
critical role. As economic agents who respond to incentives, auditors should be given higher
compensation to counteract attempts to commit audit failures. However, careful construction of a
compensation scheme must be present to prevent hedging. It is necessary to have a strong sense
and definition of what makes an auditor construct clear mechanisms for self-regulation.
Instead of using a manual experimental setup, a computerized setup may be adopted to
make it easier to gather data and participants. The computerized setup may also be used to
increase the number of periods of the experiment to increase the number of data points. A
manager or a market controlling the true investment outcome may be used to provide some
realism to the true investment outcome.
Since the experiment adopted a between-subjects factorial design, the use of a within-
subjects factorial design is recommended to have stronger inferences in the behavior of subjects
in different regimes.11 Future researchers can conduct the experiment by letting all subjects
experience all treatment combinations instead of only one. The within-subjects design requires
far lesser subjects than the between-subjects design and has greater power to detect true
treatment effects (Delaney & Maxwell, 2004).
Further exploration of second-order interactions is also recommended. Results have some
counterintuitive interpretations, suggesting caution in mixing policy variables together. Policy
variables may reinforce or offset each other’s effects. Results also show subject-level variables
cannot account for the differences in the incidence and probability of committing failures. Group
dynamics and norm creation can be explored instead of individual level interventions.
11 Between-subjects designs refer to designs where there is a single observed value of the dependent variable for
each subject. In contrast, within-subjects designs are designs in which two or more measures are obtained for each
subject in the study.
DLSU-AKI Working Paper Series 2008-01
Self-Regulatory Mechanisms 26 March 2008
Real auditors may also be used as subjects. The usual argument against the conduct of
experiments is the use of students as subjects. In the context of our experiment, it would seem
the use of students would not create any justifiable results. Smith (1987) and Friedman and
Sunder (1994) have argued and proven that as long as monotonicity, salience and dominance are
met, results of the experiment can be used to describe real world situations that are parallel to the
conditions of the experiment. Crafting possible (realistic or imaginative) self-regulation
mechanisms and liability regimes is another way of extending the experiment.
Experiments provide a way of testing and formulating alternative policy regimes to
determine their subsequent effect on behavior. Other possible self-regulation regimes and other
liability regimes can be constructed to determine their joint effect on the reduction of audit
failures. Since experimental economics is the study of behavior in controlled environments
(Miller, 2002), better auditing institutions and environments can be built through experiments to
improve the conflicts of interest present in today's audit markets.

DLSU-AKI Working Paper Series 2008-01
Self-Regulatory Mechanisms 27 March 2008
Acknowledgment
Mr. Andrew Pua wishes to thank his research assistant, Vivian Earl Ramirez.

DLSU-AKI Working Paper Series 2008-01
Self-Regulatory Mechanisms 28 March 2008
References
Alagiah, R., Gunz, S., Hillison, W., & Pacini, C. (2002). Commonwealth convergence toward a
narrower scope of auditor liability to third parties for negligent misstatements. Abacus,
38(3), 425-464.
Arens, A. A., Elder, R. J., & Beasley, M. (2003). Auditing and assurance Services: An integrated
approach. New York: Prentice Hall.
Boatsman, J. R., Grasso, L. P., Ormiston, M. B., & Reneau, J. H. (1992). A perspective on the
use of laboratory market experimentation in auditing research. The Accounting Review,
67(1), 148-156.
Cousins, J., Mitchell, A., & Sikka, P. (1998). Auditor liability: The other side of the debate.
Retrieved from http://www.essex.ac.uk/AFM/research/working_papers/WP98-01.pdf
Cox, D. R., & Reid, N. (2000). The theory of the design of experiments. New York: CRC Press.
DeJong, D. V., & Forsythe, R. (1992). A perspective on the use of laboratory market
experimentation in auditing research. The Accounting Review, 67(1), 157-170.
DeJong, D. V., Forsythe, R., & Uecker, W. C. (1985). The methodology of laboratory markets
and its implications for agency research in accounting and auditing. Journal of
Accounting Research, 23(2), 753-793.
Delaney, H. D., Maxwell, S. E. (2004). Designing experiments and analyzing data: A model
comparison perspective (2nd ed.). New Jersey: Lawrence Erlbaum Associates Publishers.
Dixit, A., & Skeath, S. (1999). Games of strategy. New York: W. W. Norton & Company, Inc.
Dopuch, N., & King, R. R. (1992). Negligence versus strict liability regimes in auditing: An
experimental investigation. The Accounting Review, 67(1), 97-120.
Dopuch, N., King, R. R., & Schatzberg, J. W. (1994). An experimental investigation of
alternative damage-sharing liability regimes with an auditing perspective. Journal of
Accounting Research, 32(Supplement), 103-130.
Friedman, D., & Sunder, S. (1994). Experimental methods: A primer for economists. New York:
Cambridge University Press.
Gigler, F. (1994). Discussion of an analysis of auditor liability rules. Journal of Accounting
Research, 32(3 Supplement), 61-65.
Gujarati, D. N. (2003). Basic Econometrics (4th ed.). Philippines: McGraw Hill Co.
DLSU-AKI Working Paper Series 2008-01
Self-Regulatory Mechanisms 29 March 2008
Hepp, J., & Mayhew, B. W. (2003). Self-regulation of auditors: Theory and experimental
evidence. Retrieved from http://www.accountancy.smu.edu.sg/research/seminar/pdf/
JohnHepp.pdf
Kachelmeier, S. J., & King, R. R. (2002). Using laboratory experiments to evaluate accounting
policy issues. Accounting Horizons, 16(3), 219-232.
Kaplow, L., & Shavell, S. (2002). Economic analysis of law. In A. Auerbach & M. Feldstein,
Handbook of Public Economics (Vol. 3), 1661-1784. New York: Elsevier.
King, R. R., & Schwartz, R. (1999). Legal penalties and audit quality: An experimental
investigation. Contemporary Accounting Research, 16(4), 685-710.
Kirk, R. E. (1968). Experimental design: Procedures for the behavioral sciences. New York:
Wadsworth Publishing Company, Inc.
Konrath, L. F. (2002). Auditing: A risk analysis approach (5th ed.). Singapore: South-Western.
McKelvey, R. D., McLennan, A. M., & Turocy, T. L. (2007). Gambit: Software tools for game
theory, Version 0.2007.01.30.
Miller, R. M. (2002). Experimental economics: How we can build better financial markets.
Canada: John Wiley and Sons, Inc.
Narayanan, V. G. (1994). An analysis of auditor liability rules. Journal of Accounting Research
32(Supplement), 39-59.
Palfrey, T., & Porter, R. (1991). Guidelines for submission of manuscripts on experimental
economics. Econometrica 59(4), 1197-1198.
Smith, V. L. (1982). Microeconomic systems as an experimental science. American Economic
Review 72(5), 923-955.
Smith, V. L., Schatzberg, J. W., & Waller W. S. (1987). Experimental economics and auditing.
Auditing: A Journal of Theory and Practice, 7(1), 71-93.
Sunder, S. (2005). Social norms versus standards of accounting. Retrieved from
http://www.som.yale.edu/faculty/Sunder/Norms/SocialNormsvStandardsofAccounting.pd
f
Train, K. E. (2003). Discrete choice methods with simulation. New York: Cambridge University
Press.
Varian, H. R. (1999). Intermediate microeconomics: A modern approach (5th ed.). New York:
W. W. Norton & Company, Inc.
DLSU-AKI Working Paper Series 2008-01
Self-Regulatory Mechanisms 30 March 2008
Yu, H. C. (2001). Experimental evidence of the impact of increasing auditors' legal liability on
firms' new investments. Contemporary Accounting Research, 18(3), 495-528.
Yu, H. C. (2004). Legal regimes, damage apportionment rules, and auditor independence-theory
and experimental evidence. Retrieved from http://www.ssrn.com

DLSU-AKI Working Paper Series 2008-01
Self-Regulatory Mechanisms 31 March 2008
Appendix
Instructions: This appendix is for the use of future researchers who are interested in replicating the
experiment. Here we provide the consent forms, exit questionnaires, and instructions for the SL/JS/SR2
regime. If you wish to have copies of the instructions of other regimes, please contact the authors at
[email protected]. These copies of instructions are considered open source materials however; we
request that any researcher using these forms to acknowledge the source. Future researchers are free to
alter the forms and instructions as they see fit as long as they continue to release new forms with said
modifications as open source materials.
Verifier Instructions
General: This is an experiment on how people make decisions. If you have questions about the
experiment, feel free to approach the experimenter. Avoid talking or chatting with anyone except the
experimenter until the whole experiment is finished. Whenever you are asked to make a decision among a
set of alternatives, please write your decision on a piece of scratchpad. Make sure that you write your
identification name on the upper right portion of the piece of paper.
Random Assignment Phase: You will be randomly assigned a unique identification name, which you will
use for the whole experiment. This name is part of your experiment kit. Do not reveal this name to
anyone. All throughout the game, you will earn more EPs depending on how you play.
You take the role of a verifier who should credibly verify the outcome of an investment. The true
outcome of said investment is unknown to you. Since you are hired to verify, you will be paid a flat fee of
500 EPs. The true outcome of an investment can be high or low with 50\% probability.
Effort Level Phase: Choose between a high effort level which costs 260 EPs and a low effort level which
costs 200 EPs.
Signal Determination Phase: Based on your effort level and the true investment outcome which is
unknown to you, the signal will be privately revealed to you after you have made your decision in the
effort level phase. This signal may either be high or low.
Report Phase: Choose between a high report and a low report after you have known the signal given. If
you have received a high audit signal, then you can only give out a high report. If you have received a low
audit signal, then you have two options: you can give out a high report or low report. Your report choice
will determine whether you committed any mistake or not. A mistake happens when the true investment
outcome is not the same as the type of report issued.
Side Payment Phase: If you choose to give a high report and you received a low signal, your will
automatically receive 400 EPs.
Rent Phase: If you choose to give a high report regardless of the circumstances, you will automatically
receive 600 EPs.
Investigation Phase: Make a decision whether to investigate or not to investigate other participant-
verifiers.
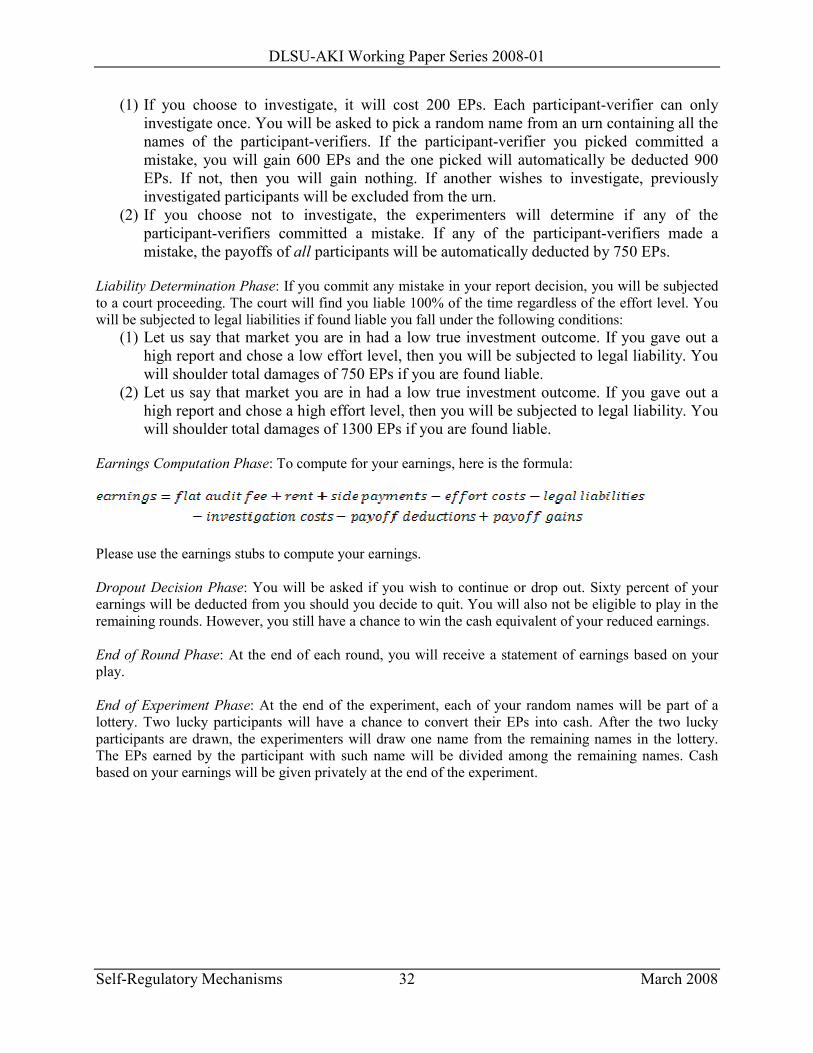
DLSU-AKI Working Paper Series 2008-01
Self-Regulatory Mechanisms 32 March 2008
(1) If you choose to investigate, it will cost 200 EPs. Each participant-verifier can only
investigate once. You will be asked to pick a random name from an urn containing all the
names of the participant-verifiers. If the participant-verifier you picked committed a
mistake, you will gain 600 EPs and the one picked will automatically be deducted 900
EPs. If not, then you will gain nothing. If another wishes to investigate, previously
investigated participants will be excluded from the urn.
(2) If you choose not to investigate, the experimenters will determine if any of the
participant-verifiers committed a mistake. If any of the participant-verifiers made a
mistake, the payoffs of all participants will be automatically deducted by 750 EPs.
Liability Determination Phase: If you commit any mistake in your report decision, you will be subjected
to a court proceeding. The court will find you liable 100% of the time regardless of the effort level. You
will be subjected to legal liabilities if found liable you fall under the following conditions:
(1) Let us say that market you are in had a low true investment outcome. If you gave out a
high report and chose a low effort level, then you will be subjected to legal liability. You
will shoulder total damages of 750 EPs if you are found liable.
(2) Let us say that market you are in had a low true investment outcome. If you gave out a
high report and chose a high effort level, then you will be subjected to legal liability. You
will shoulder total damages of 1300 EPs if you are found liable.
Earnings Computation Phase: To compute for your earnings, here is the formula:
Please use the earnings stubs to compute your earnings.
Dropout Decision Phase: You will be asked if you wish to continue or drop out. Sixty percent of your
earnings will be deducted from you should you decide to quit. You will also not be eligible to play in the
remaining rounds. However, you still have a chance to win the cash equivalent of your reduced earnings.
End of Round Phase: At the end of each round, you will receive a statement of earnings based on your
play.
End of Experiment Phase: At the end of the experiment, each of your random names will be part of a
lottery. Two lucky participants will have a chance to convert their EPs into cash. After the two lucky
participants are drawn, the experimenters will draw one name from the remaining names in the lottery.
The EPs earned by the participant with such name will be divided among the remaining names. Cash
based on your earnings will be given privately at the end of the experiment.

DLSU-AKI Working Paper Series 2008-01
Self-Regulatory Mechanisms 33 March 2008
Table 1
Signal and Report Determination
Effort Choice True Outcome Signal Received Possible Reports
High High High High
High Low Low Low or high
Low High High High
Low Low High high
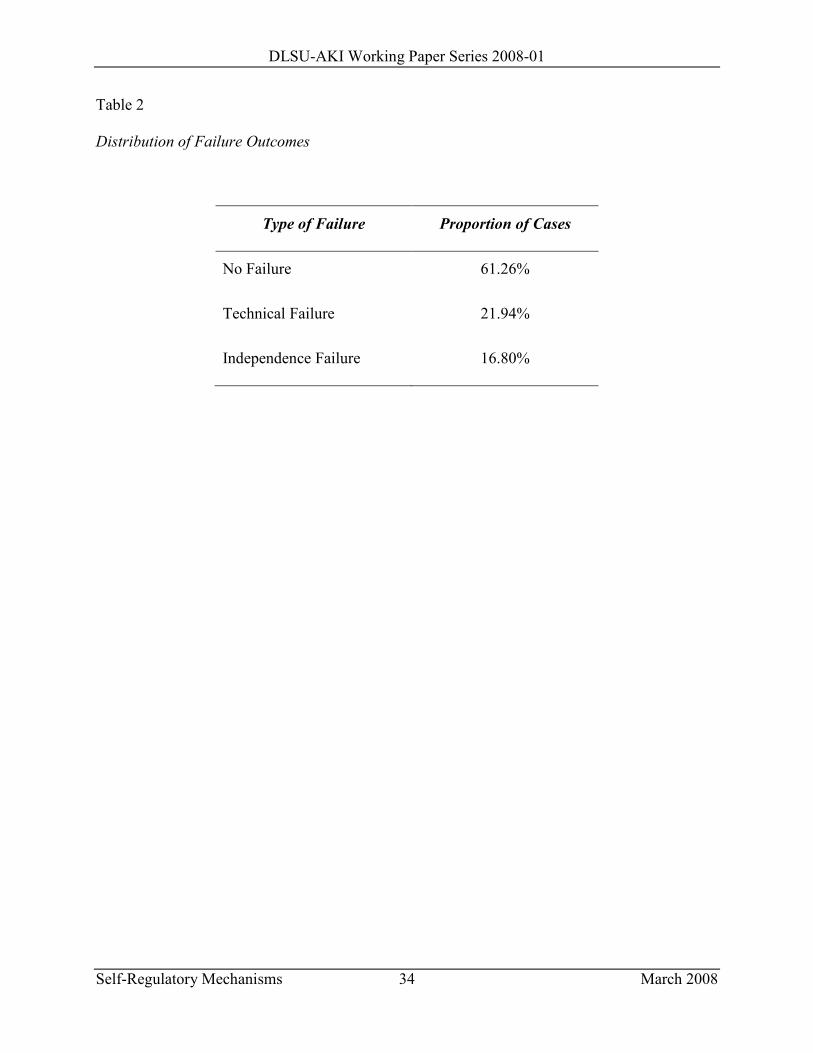
DLSU-AKI Working Paper Series 2008-01
Self-Regulatory Mechanisms 34 March 2008
Table 2
Distribution of Failure Outcomes
Type of Failure Proportion of Cases
No Failure 61.26%
Technical Failure 21.94%
Independence Failure 16.80%
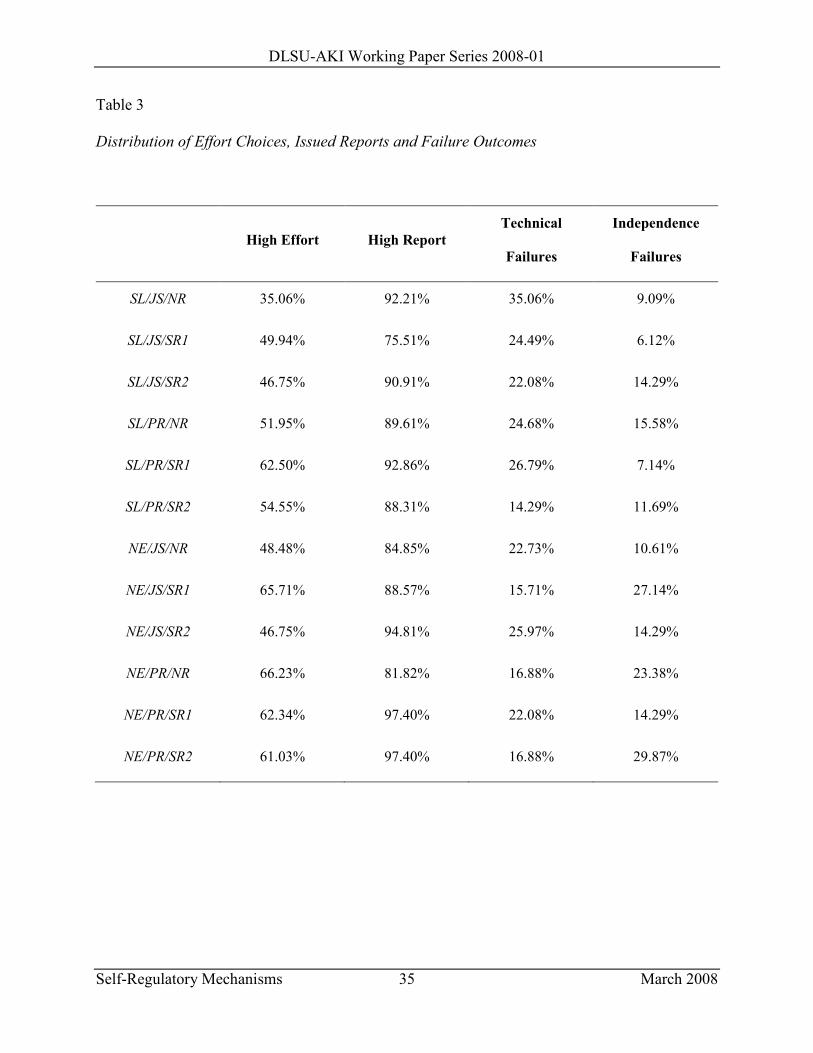
DLSU-AKI Working Paper Series 2008-01
Self-Regulatory Mechanisms 35 March 2008
Table 3
Distribution of Effort Choices, Issued Reports and Failure Outcomes
High Effort High Report
Technical
Failures
Independence
Failures
SL/JS/=R 35.06% 92.21% 35.06% 9.09%
SL/JS/SR1 49.94% 75.51% 24.49% 6.12%
SL/JS/SR2 46.75% 90.91% 22.08% 14.29%
SL/PR/=R 51.95% 89.61% 24.68% 15.58%
SL/PR/SR1 62.50% 92.86% 26.79% 7.14%
SL/PR/SR2 54.55% 88.31% 14.29% 11.69%
=E/JS/=R 48.48% 84.85% 22.73% 10.61%
=E/JS/SR1 65.71% 88.57% 15.71% 27.14%
=E/JS/SR2 46.75% 94.81% 25.97% 14.29%
=E/PR/=R 66.23% 81.82% 16.88% 23.38%
=E/PR/SR1 62.34% 97.40% 22.08% 14.29%
=E/PR/SR2 61.03% 97.40% 16.88% 29.87%

DLSU-AKI Working Paper Series 2008-01
Self-Regulatory Mechanisms 36 March 2008
Table 4
Self-Regulation Treatment Investigations
Treatment
Proportion of Undertaken
Investigations
Proportion of Undertaken
Investigations Initiated by
Subjects with Failure Outcomes
SL/JS/SR2 44.16% 50%
SL/PR/SR2 25.97% 25%
=E/JS/SR2 53.25% 45.16%
=E/PR/SR2 41.56% 52.78%
SL/JS/SR 6.12% 6.67%
SL/PR/SR 0.00% 0.00%
=E/JS/SR 4.29% 6.67%
=E/PR/SR 0.00% 0.00%

DLSU-AKI Working Paper Series 2008-01
Self-Regulatory Mechanisms 37 March 2008
Table 5
Variable Definitions
Variable 8ame Variable Specification Variable Description and A-priori Expectations
failure 1 if technical audit failure, 2 if
independence audit failure, 0 if no failure
This is the dependent variable for multinomial logit and
multinomial probit models. This represents the state of affairs
associated with a subject on a particular round.
number of no failures treated as count variable These are the dependent variables for the three Poisson
regression models to be estimated. number of technical failures
number of independence
failures
effort choice 1 if high effort, 0 if low effort Effort choice is the effort level chosen by a subject on a
particular round. It is hypothesized that a higher effort level
will make it more likely for a subject to commit an
independence audit failure and a lower effort will make it more
likely for the subject to commit a technical audit failure.
true investment outcome 1 if high investment outcome, 0 if low
investment outcome
This is the true investment outcome randomly assigned to a
subject on a particular round. It is hypothesized that low true
investment outcomes increase the probability of committing
both types of failures.
liability regime 1 if negligence regime, 0 if strict liability
regime
It is hypothesized that strict liability regimes make it more
likely to commit technical audit failures while negligence
regimes make it more likely to commit independence audit
failures.
damage rule 1 if proportionate damage rule, 0 if joint
and several damage rule
The expected signs for these coefficients may go any other way
since the equilibrium strategies of the auditor do not depend on
the type of damage rule. However, economic theory suggests
that a proportionate damage rule is preferred over a joint and
several damage rule.

DLSU-AKI Working Paper Series 2008-01
Self-Regulatory Mechanisms 38 March 2008
self-regulation 1 1 if self-regulated 1 (SR1), 0 if not self-
regulated
This is the treatment variable that will allow us to test the
effects of diffusion of responsibility especially when it comes
to punishment of other subjects performing the same task.
self-regulation 2 1 if self-regulated 2 (SR2), 0 if not self-
regulated
This is the treatment variable that will allow us to test the effect
of group-enforceable punishments on the probability of
committing failures.
second order interaction
terms
These are generated by getting pairwise
products of the treatment variables.
There are 5, namely, liability-damage
rule, liability-SR1, liability-SR2, damage
rule-SR1 and damage rule-SR2.
third order interaction terms These are generated by getting the
product of the three treatment
combinations, namely, liability-damage
rule-SR1 and liability-damage rule-SR2.
payoff current round payoffs in EPs This variable allows us to test the effects of monetary
incentives on the probability of committing failures.
time trend 1 if first round, 2 if second round, and so
on
This variable is a trend variable which will be used to test for
any differences in the average responses of subjects over time.
proportion of high investment
outcomes
number of high investment outcomes
divided by the total number of
investment outcomes
This variable tests the effect of high investment outcomes on
the number of failures. It is hypothesized that the larger the
proportion, the less is the incidence of failure outcomes.
proportion of high effort
choices
number of high effort choices divided by
the total number of effort choices
This variable tests the effect of high effort choices on the
number of failures. It is hypothesized that the larger the
proportion, the less is the incidence of technical failure
outcomes. It is hypothesized that the larger the proportion, the
more is the incidence of technical failure outcomes.

DLSU-AKI Working Paper Series 2008-01
Self-Regulatory Mechanisms 39 March 2008
Table 6
Multinomial Logit and Probit Results under Alternative Specifications
Technical Failure
Variable Model 1 Model 2 Model 3 Model 4 Model 5 Model 6 Model 7 Model 8
effort choice -5.1601*** -3.2421*** -5.1725*** -3.2872*** -5.2006*** -3.2932*** -5.5282*** -3.4100***
true
investment
outcome
-6.1982*** -4.2787*** -6.2782*** -4.3554*** -6.2822*** -4.3545*** -5.6040*** -4.0141***
liability
regime
-0.0277 0.0942 0.3245 0.1989 0.3228 0.04899 0.6636 0.2679
damage rule 0.1538 -0.0770 -0.1689 0.0199 -0.1785 -0.1431 0.3330 0.1332
self-
regulation 1
-0.7947 -0.3535 -1.7003* -1.1446* -1.9201* -1.3671* -2.0834 -1.4080*
self-
regulation 2
-0.0849 0.2534 -0.1857 0.1400 0.1072 0.07998 0.5042* 0.27878
liability-
damage
-.07261 -0.6950 -0.7045 -0.3576 -0.9004 -0.4877
liability-self
regulation 1
0.3008 0.3943 0.7902 0.8311 0.5937 0.6281
liability-self
regulation 2
-0.3348 0.2468 -0.9103 0.3748 -1.2507 0.0759
damage-self
regulation 1
1.5932 1.1438 2.2095 1.6074 2.3238 1.6452
damage-self
regulation 2
0.5994 -0.0651 0.0772 0.0679 -0.5177 -0.2954
third order
interaction 1
-1.1523 -0.8953 -0.9003 -0.6600
third order
interaction 2
1.0115 -0.2880 0.3398 -0.4911
payoffs -0.0016* -0.0009*
time trend 0.0308 0.0464
Intercept 2.8179*** 1.8678*** 2.9937*** 1.9554*** 3.006*** 2.0319*** 3.2725*** 2.0303***
Note: *** significant at 0.1%; ** significant at 1%; * significant at 5%.
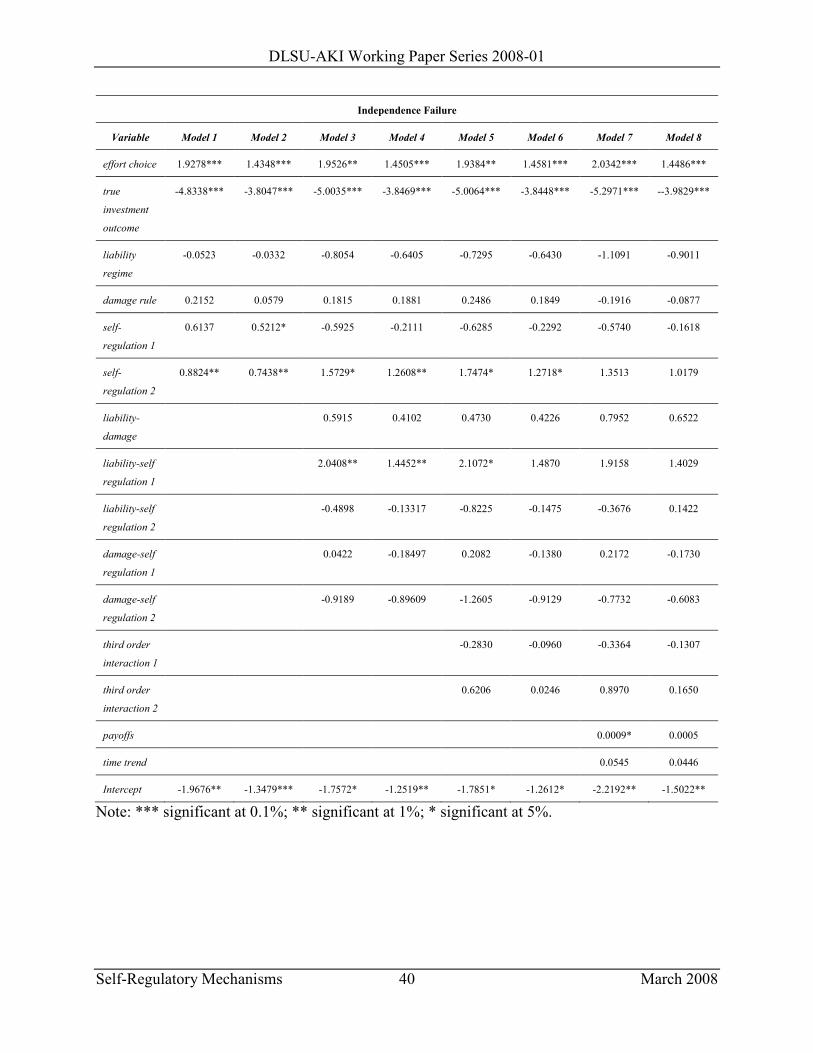
DLSU-AKI Working Paper Series 2008-01
Self-Regulatory Mechanisms 40 March 2008
Independence Failure
Variable Model 1 Model 2 Model 3 Model 4 Model 5 Model 6 Model 7 Model 8
effort choice 1.9278*** 1.4348*** 1.9526** 1.4505*** 1.9384** 1.4581*** 2.0342*** 1.4486***
true
investment
outcome
-4.8338*** -3.8047*** -5.0035*** -3.8469*** -5.0064*** -3.8448*** -5.2971*** --3.9829***
liability
regime
-0.0523 -0.0332 -0.8054 -0.6405 -0.7295 -0.6430 -1.1091 -0.9011
damage rule 0.2152 0.0579 0.1815 0.1881 0.2486 0.1849 -0.1916 -0.0877
self-
regulation 1
0.6137 0.5212* -0.5925 -0.2111 -0.6285 -0.2292 -0.5740 -0.1618
self-
regulation 2
0.8824** 0.7438** 1.5729* 1.2608** 1.7474* 1.2718* 1.3513 1.0179
liability-
damage
0.5915 0.4102 0.4730 0.4226 0.7952 0.6522
liability-self
regulation 1
2.0408** 1.4452** 2.1072* 1.4870 1.9158 1.4029
liability-self
regulation 2
-0.4898 -0.13317 -0.8225 -0.1475 -0.3676 0.1422
damage-self
regulation 1
0.0422 -0.18497 0.2082 -0.1380 0.2172 -0.1730
damage-self
regulation 2
-0.9189 -0.89609 -1.2605 -0.9129 -0.7732 -0.6083
third order
interaction 1
-0.2830 -0.0960 -0.3364 -0.1307
third order
interaction 2
0.6206 0.0246 0.8970 0.1650
payoffs 0.0009* 0.0005
time trend 0.0545 0.0446
Intercept -1.9676** -1.3479*** -1.7572* -1.2519** -1.7851* -1.2612* -2.2192** -1.5022**
Note: *** significant at 0.1%; ** significant at 1%; * significant at 5%.

DLSU-AKI Working Paper Series 2008-01
Self-Regulatory Mechanisms 41 March 2008
Statistics
Variable Model 1 Model 2 Model 3 Model 4 Model 5 Model 6 Model 7 Model 8
number of
observations
857 857 857 857 857 857 857 857
AIC 598.1 625.7 595.3 623.3 602 630.8 591.8 622.1
log-
likelihood
-285 -298.9 -273.7 -287.7 -273 -287.4 -263.9 -279.1

DLSU-AKI Working Paper Series 2008-01
Self-Regulatory Mechanisms 42 March 2008
Table 7
Seemingly Unrelated Estimation of Poisson Regression Models
8o Failures
Variable Model 9 Model 10 Model 11 Model 12
proportion of high
investment outcome
0.0120*** 0.0125*** 0.0125*** 0.0124***
proportion of high
effort choices
0.0035*** 0.0043*** 0.0045*** 0.0045***
liability regime -0.0082 -0.0621 -0.1155* -0.1128*
damage rule -0.0060 0.0055 -0.0467 -0.0483
self-regulation 1 -0.0166 0.1937* 0.1979* 0.1770
self-regulation 2 -0.0339 -0.1315* -0.2144*** -0.2167***
liability-damage rule 0.0822 0.1802 0.1794
liability-self
regulation 1
-0.1657* -0.1748 -0.1632
liability-self
regulation 2
0.1476 0.2941** 0.2962**
damage-self
regulation 1
-0.2380** -0.2493* -0.2414*
damage-self
regulation 2
0.0309 0.18672* 0.1892*
third order interaction
1
0.0193 0.0179
third order interaction
2
-0.2830* -0.2864
time trend -0.0091
Intercept 0.6364*** 0.5723*** 0.5931*** 0.6511***
Note: *** significant at 0.1%; ** significant at 1%; * significant at 5%.

DLSU-AKI Working Paper Series 2008-01
Self-Regulatory Mechanisms 43 March 2008
Technical Failures
Variable Model 9 Model 10 Model 11 Model 12
proportion of high
investment outcome
-0.0202*** -0.0225*** -0.0230*** -0.0229***
proportion of high
effort choices
-0.0192*** -0.0188*** -0.1962*** -0.0197***
liability regime -0.1528 -0.1794 -0.2815 -0.2794
damage rule 0.2013 0.0428 -0.0441 -0.0454
self-regulation 1 0.0335 -0.3456 -0.5531 -0.5393
self-regulation 2 -0.0337 -0.2339 -0.2171 -0.2189
liability-damage rule -0.2350 0.0234 0.0285
liability-self
regulation 1
0.0653 0.5136 0.5063
liability-self
regulation 2
0.3492 0.3682 0.3691
damage-self
regulation 1
0.7249* 1.1218** 1.1198**
damage-self
regulation 2
0.1927 0.1958 0.2013
third order interaction
1
-0.8289 -0.8389
third order interaction
2
-0.1066 -0.1185
time trend 0.0070
Intercept 2.3282*** 2.5336*** 2.6237*** 2.5775***
Note: *** significant at 0.1%; ** significant at 1%; * significant at 5%.

DLSU-AKI Working Paper Series 2008-01
Self-Regulatory Mechanisms 44 March 2008
Independent Failures
Variable Model 9 Model 10 Model 11 Model 12
proportion of high
investment outcome
-0.0199*** -0.0171*** -0.0170*** -0.0167***
proportion of high
effort choices
0.0145*** 0.0123*** 0.0123** 0.01205**
liability regime 0.0462 -0.4352 -0.3843 -0.3742
damage rule -0.0203 0.2679 0.3050 0.3032
self-regulation 1 0.3028 0.0729 0.1082 0.1340
self-regulation 2 0.4847** 0.8994*** 0.9262*** 0.9324***
liability-damage rule 0.5154 0.4413 0.4516
liability-self
regulation 1
1.0089* 0.9420 0.9080
liability-self
regulation 2
-0.1447 -0.2106 -0.2249
damage-self
regulation 1
-0.7677 -0.8355 -0.8437
damage-self
regulation 2
-0.7566* -0.8061* -0.8149*
third order interaction
1
0.114 0.1126
third order interaction
2
0.1057 0.1065
time trend 0.0138
Intercept -0.0090 -0.0918 -0.1176 -0.2038
Note: *** significant at 0.1%; ** significant at 1%; * significant at 5%.