an experimental investigation of audit decision …apps.olin.wustl.edu/faculty/king/choyking.pdf ·...
TRANSCRIPT
An Experimental Investigation of Audit Decision-Making: An Evaluation Using System-Mediated Mental Models
Amy K. Choy [email protected]
and
Ronald R. King
[email protected] Washington University
St Louis, Missouri 63130
April 23, 2003
Helpful suggestions were received from Vicky Arnold, Tim Bell, Stan Biggs, Carolyn Callahan, Angela Davis, Nick Dopuch, Chris Earley, Bill Felix, Mahendra Gupta, Bill Kinney, Gary Miller, Thomas Omer, Krishna Palepu, Mark Peecher, Jay Rich, Steven Salterio, Gim Seow, Ira Solomon, Hun-Tong Tan, and Mike Willenborg and seminar participant at the University of Connecticut, University of Arkansas, Cornell University, Harvard University, Texas A&M, Washington University and the 2002 Symposium on auditing research at the University of Illinois. We gratefully acknowledge the KPMG/University of Illinois Business Measurement Case Development and Research Program for financial support and for helpful suggestions. We also acknowledge Jim Holloway for research support in the Taylor Experimental Laboratory at Washington University.
Keywords: Mental model theory; Systems theory; System Audits; Audit judgment.

Page
1
An Experimental Investigation of Audit Decision-Making: An Evaluation Using System-Mediated Mental Model Theory
Abstract
This paper has two purposes. The first is to present hypotheses generated by joining two foundation
theories of decision-making. The first foundation theory is the mental model theory, which has its roots in
cognitive psychology (Johnson-Laird 1983). The theory posits that individuals make inferences by
constructing and integrating mental models, which are internal representations of external items.
Decision-makers facing complex problems make predictable errors by failing to fully integrate their
mental models of the inference task. The second foundation theory is the general systems theory, which
argues that decision-makers need to understand the system as a whole in order to lessen the chances of
overlooking important properties of the system (Bertalanffy 1968). Joining these two theories, we
formulate a set of hypotheses referred to as System-Mediated Mental Model (SMMM) hypotheses. The
SMMM hypotheses provide insights as to how systems thinking can lead to improved decision-making. In
short, the SMMM hypothesis posits that systems knowledge will help DMs integrate multiple mental
models more accurately, thus reducing systematic inference errors. The second purpose of this paper is to
investigate the hypotheses using a laboratory experiment that compares “bottom-up data immersion”
approach to decision-making (i.e., settings with no guideline for developing a framework to solve the
problem) with “top-down big picture” approach to decision-making (i.e., settings with a guideline for
developing a framework). Our results are consistent with the predictions of the SMMM hypotheses and
indicate that a top-down systems approach can enhance the effectiveness of decision-making by reducing
systematic errors that arise from not fully understanding the system underlying the problem. These
findings have implications for the systems audit approach developed by Bell et al. (1997).
Page
2
INTRODUCTION
Bell et al. (1997) advance the argument that systems audits could enhance auditor
decision-making. Under the systems audit (SA) approach, the auditor takes a “top-down big
picture” orientation by first acquiring general knowledge about the client’s underlying business
activities and then using this knowledge as a guide for collecting evidence and drawing
inferences (Kinney 2000; Knechel 2001). The SA approach has evolved, in part, because
business models of clients have become increasingly complex and changeable, which in turn has
increased demands on the auditor (Elliott 1994). The SA approach can be contrasted with a
“bottom-up data immersion” approach, in which auditors immerse themselves in the details of
accounting transactions and develop perceived relations between transactions and financial
statements, but perhaps without specific knowledge of how the underlying business processes
generate the transactions.1 Currently, the largest audit firms are moving toward a greater top-
down orientation (Eilifsen et al. 2001; Winograd et al. 2000). Our objective is to address the
theoretical questions of how systems knowledge might improve auditors’ decision-making,
especially in changing environments. Thus, our goal is to provide a decision-making foundation
to the Bell et al. (1997) framework.
We begin by presenting a set of hypotheses referred to as the System-Mediated Mental
Model (SMMM) hypotheses. The SMMM hypotheses build on two related but distinct
foundation theories. The first is the mental model theory (MMT), which has its roots in cognitive
psychology (Johnson-Laird 1983). The MMT predicts that humans make inferences by
constructing mental models that are internal (mental) representations of some external state of
affairs. Decision-makers (DMs) who face complex problems and are boundedly rational (i.e.,
have limits on working memory or problem solving skills) are unable to construct and evaluate
multiple mental models to arrive at an accurate integrated mental model, thereby making
1 This characterization focuses on only one dimension of audits and we recognize that audits typically have some mix of the top-down and bottom-up approaches. Also audits can have other distinguishing features that are not considered in this analysis.

Page
3
predictable errors (Johnson-Laird and Savary 1999).2 We use the MMT as a benchmark theory to
evaluate decision-making and to identify predictable decision errors.
The second input into the SMMM hypothesis comes from the general system theory
(GST) proposed by Bertalanffy (1968). This theory emphasizes the importance of understanding
the interactions of activities within an entity (such as the client’s organization) and the
interactions between the entity and its environment. The SA approach, as articulated by Bell et
al. (1997) is consistent with GST.
Although MMT explains how DMs make systematic errors in their decisions, the theory
offers no guidance for improvement. In contrast, the GST offers an approach for improving an
individual’s ability to solve complex problems, but it offers no explanation for how the approach
helps DMs improve their decisions. By combining the MMT with the GST, the SMMM
hypothesis posits that systems knowledge will help DMs integrate multiple mental models more
accurately, thereby reducing systematic inference errors. The SMMM hypothesis helps explain
how systems thinking can improve decision-making.
Our second purpose is to examine the SMMM hypotheses using a laboratory experiment.
We use student subjects and follow the precepts of experimental economics, including providing
subjects with salient and dominant rewards. The task performed by subjects has an information
collection component and a reporting component, which is consistent with modeling approaches
in auditing (Antle 1984; Dye et al. 1990).
We create two experimental audit approaches under two different environments. The first
audit approach is a top-down big picture approach (denoted as TOP) that provides a guideline to
the DM to develop an organizing framework for decision-making. The second audit approach is
a bottom-up data immersion approach (denoted as BOT) that does not provide explicit guidance
to the DM for developing an organizing framework. The task is designed so that if DMs are
unboundedly rational (i.e., ability to create an accurate organizing framework without external
guidance), the DM will perform equally well under both approaches. However, the MMT
predicts that if DMs are boundedly rational, they are likely to commit systematic errors under the
2 The words “mental model” have a different meaning in different fields, and sometimes even among different researchers in the same field. Our use of mental models follows that used by Johnson-Laird (1983). Subsequent research has led to refinement of the theory (Bara et al. 2001), but these refinements do not affect the basis of our theory.

Page
4
BOT approach. The SMMM hypothesis predicts that the TOP approach will result in more
effective decision-making by reducing the systematic inference errors. The two environments we
created in the experiment are Static World (SW) and Dynamic World (DW) surrogating for a
stable and an evolving business environment respectively. The two different environments allow
us to investigate how the two approaches perform when the decision-making environment
changes unexpected.
In general, our results are consistent with the predictions of the MMT and the SMMM
hypotheses. Specifically, the results show that (1) subjects make predictable systematic errors in
the absence of a guideline for developing an organizing framework, as predicted by the MMT;
(2) the guideline provided by TOP reduces systematic errors, as predicted by the SMMM
hypothesis; and (3) as predicted by the SMMM hypothesis, the TOP approach improves DMs’
inference accuracy even when the environment affecting the decision variables changes
unexpectedly.
Our research complements traditional behavioral auditing research (for reviews, see
Gibbins and Swieringa 1995; Libby 1995; Messier 1995; Solomon and Shields 1995) and
research addressing systems audits (Ballou et al. 2001; Blokdijk et al. 2001; O’Donnell 2001) by
investigating psychology-based theory under controlled experimental economic conditions
(Kachelmeier 1996; Kachelmeier and King 2002). Our findings add to auditing literature by
providing a decision-making foundation to the System Audit approach as articulated by Bell et
al. (1997). In addition, our research has implications for the decision aid literature in that systems
thinking may aid auditors to develop big-picture judgment abilities, as opposed to “smaller”
judgment capabilities, as discussed by Messier (1995). We view our research as a first step in a
progression from theory development and refinement, to laboratory experimentation, and then to
empirical investigation in natural settings.
In the next section we discuss the hypothesis development; in Section III we discuss the
experimental design, task, and methods; and in Section IV, we present the procedures for testing
the hypotheses. The results are presented in Section V, and Section VI provides a summary and
discussion of future research.
Page
5
II. Hypothesis Development
Bell et al. (1997) advance the proposition that a successful audit is one that focuses on the
client’s systems dynamics, such as the interactions between the client and its suppliers,
customers, competitors, regulators, strategic partners, and the capital markets. Such a focus is
argued to improve the auditor’s evidence collection efficiency and inference accuracy. Our
objective here is to provide a theoretical underpinning of how systems theory could improve
auditors’ judgment using the System Mediated Mental Model (SMMM) hypotheses. Below we
discuss the two components of the SMMM hypotheses; the mental model theory (MMT) and the
general systems theory (GST) and present our three general hypotheses. We expand on these
hypotheses below in the section titled ‘hypotheses testing procedures.’
Mental Model Theory (MMT)
The goal of the mental model theory is to provide a foundation to help explain the
process of decision-making, to show how systematic errors could arise, and to predict the type of
and the conditions for inference errors to occur. According to Johnson-Laird (1983), a mental
model is an internally constructed representation of an event based on a set of premises and the
general knowledge possessed by the DM. To illustrate, assume that the DM needs to make
inferences based on two premises. The DM uses the first premise to construct one or more
mental models; similarly, the DM uses the second premise to construct the corresponding mental
model(s). The DM must then consider the different possible ways the mental models from the
two premises could be combined to produce an integrated model, and draw temporary
conclusions based on the integrated model. If the models are integrated correctly, the temporary
conclusions will pass the process of falsification and the DM will have arrived at the correct
inference (see Brown et al (1999) for a discussion of the falsification process).
Integrating mental models imposes a heavy burden on memory. To minimize this
cognitive burden, the DM only considers some of the possible models based on the information,
which could lead to decision errors (see Appendix A for an example illustrating the MMT). The
MMT predicts that (1) more complicated problems require more mental models to be constructed
and evaluated; and, (2) the more mental models the DM needs to process and integrate, the more
errors the DM is prone to make. The errors are systematic and predictable due to improperly
integrated mental models.
Page
6
There is mounting evidence supporting the theory in the psychology literature; however,
the theory has not been evaluated in combination with systems theory. 3 We initially investigate
settings to test the MMT alone and use these settings as benchmarks for comparison to settings
where MMT is evaluated in combination with systems theory.
Our first hypothesis deals with the benchmark settings and the null hypothesis is that
DMs’ decision errors are random and hence unpredictable. In contrast, the MMT posits that DMs
make systematic and hence predictable inference errors (the specific type of errors is discussed in
the hypotheses testing procedure section below).
H1 (null): The decision maker’s inference errors are random.
H1 (MMT): The decision maker’s inference errors are systematic, and hence predictable.
The inference errors are consistent with those predicted under MMT.
Systems-Mediated Mental Model Hypotheses
Our second hypothesis deals with the application of systems theory to decision-making.
Systems theory emphasizes the importance of understanding individual components as an
integrated part of a system rather than as stand alone parts because the DMs are more likely to
miss important interactions among different components in a system when the components are
investigated independently. Auditing requires auditors to make inferences in complex
environments. The external environment, such as the actions taken by suppliers, debtors,
customers, government, and special interest groups, often have an important impact on the
client’s economic health, and hence an auditor who understands the client’s business
environment and strategies can increase efficiencies (see Bell et al 1997). That is, an
understanding of the client’s systems dynamics could help auditors to develop mental models
that maps more accurately into the client’s true financial condition. The auditor can use the
developed mental models, which incorporate all vital factors, both internal and external, to form
an organizing framework, a set of decision rules that maps various information signals from the
audit to the validity of the client’s financial statements. Information signals include signs of
3 Empirically, MMT is well supported when tested against other theories of reasoning (Johnson-Laird and Byrne 1991; Johnson-Laird 1996; Goldvarg and Johnson-Laird 2001; Garcia-Madruga et al. 2001). The theory has been applied to explain systematic errors in reasoning (Johnson-Laird and Savary 1996, 1999) and differences in
Page
7
GAAP compliance versus violations and/or coherence versus incoherence between the client’s
business strategy and its business environment (Bell et al. 1997). Auditors who develop a correct
organizing framework are more likely to perform efficient and effective audit. If the systems
audit approach helps auditors form more accurate expectations by helping them to develop a
correct organizing framework, audits should be more efficient. We characterize systems
technology as the acquisition of a guideline for developing an organizing framework (denoted as
guideline hereafter). The SMMM hypothesis predicts that DMs who gain an understanding of the
systems underlying a problem are more likely to integrate the mental models appropriately,
leading to better decisions compared to DMs who do not have such an understanding. In an
auditing context, the auditor acquires systems thinking by undertaking actions along the lines
suggested by Bell et al. (1997). We do not investigate how SA provides such a guideline, or the
challenges of developing the guideline. Rather we investigate how the provision of the guideline
can improve decision-making in settings where DMs must integrate multiple mental models.
Our second hypothesis compares subjects’ decision accuracy in settings with the
guideline to settings without the guideline. The SMMM hypothesis predicts that DMs make less
systematic inference errors in the presence of the guideline than in the absence of the guideline.
Hence our second hypothesis stated in the alternative form is:
H2 (SMMM): Decision-maker’s inference accuracy is higher in the presence of the guideline.
Changes in Business Process
Our third hypothesis deals with one of the key strengths of the top-down approach to
decision-making: inference accuracy in a changing environment. As articulated by Bell et al
(1997), under the bottom-up approach, DMs focus more on understanding the interrelationships
among reported data while under the top-down approach, auditors focus more on understanding
the interrelationships among the client’s business strategies and its environment. 4 The auditor
forms expectations about the client’s financial situation after gaining an understanding of these
interrelationships and then compares the expectations to the reported data. Thus, auditors using
inferential ability among different individuals (Johnson-Laird 1983). Recent work by Knauff et al. (2002) shows evidence supporting the MMT in a functional MRI study of the brain. 4 In an auditing setting, the top-down approach has a business process focus instead of information process focus (Bell et al. 1997 p.72).
Page
8
the top-down approach are more likely to perceive changes in the interrelation between the
client’s business strategy and its environment, leading to more accurate inference decisions in a
rapidly changing business world.
In our last hypothesis, we compare DMs’ decision accuracy both when the guideline is
presence and absence when the interactions among the key components in a system change; that
is when a different organizing framework is required. We expect DMs who use the bottom-up
approach are less likely to develop a mental model that incorporates how changes in the
environment could lead to different decision. Failure to develop a correct mental model under the
bottom-up approach will increase inference errors. Hence, our last hypothesis stated in the
alternative form is:
H3 (Changing environment): Inference accuracy is higher for DMs who use the top-down
approach than for DMs who use the bottom-up approach even
when the actual decision rule (unobservable) changes.
III. EXPERIMENTAL DESIGN, TASK, AND METHODS
We design an experimental task that captures the essence of a stylized audit process to (1)
test the predictions of the MMT and the SMMM hypothesis and (2) investigate the DMs’
performance when the environment changes. We design two experimental audit approaches
(TOP and BOT) under two different environments (Static World and Dynamic World). We use
TOP and BOT to represent the experimental audit approaches that surrogate for the respective
top-down and bottom-up audit approaches. We use static world (denoted as SW) to represent a
stable client environment and dynamic world (denoted as DW) to represent a more dynamic
client business environment.
There are four parts in each experimental session and 10 rounds in each part. We use a
combination of within-and between-subject design in a 2 × 2 design. In the first treatment, we
manipulated the order in which the subjects were given the audit approaches (TOP and BOT);
half the subjects were given one of the audit approaches in part 1 while the same audit approach
is given to the other half in part 2. We denote this treatment as the ordering treatment and the
settings in this treatment are TOP-BOT and BOT-TOP. In the second treatment, we manipulated
the environment, we denote this the environment treatment, and the settings in this treatment are
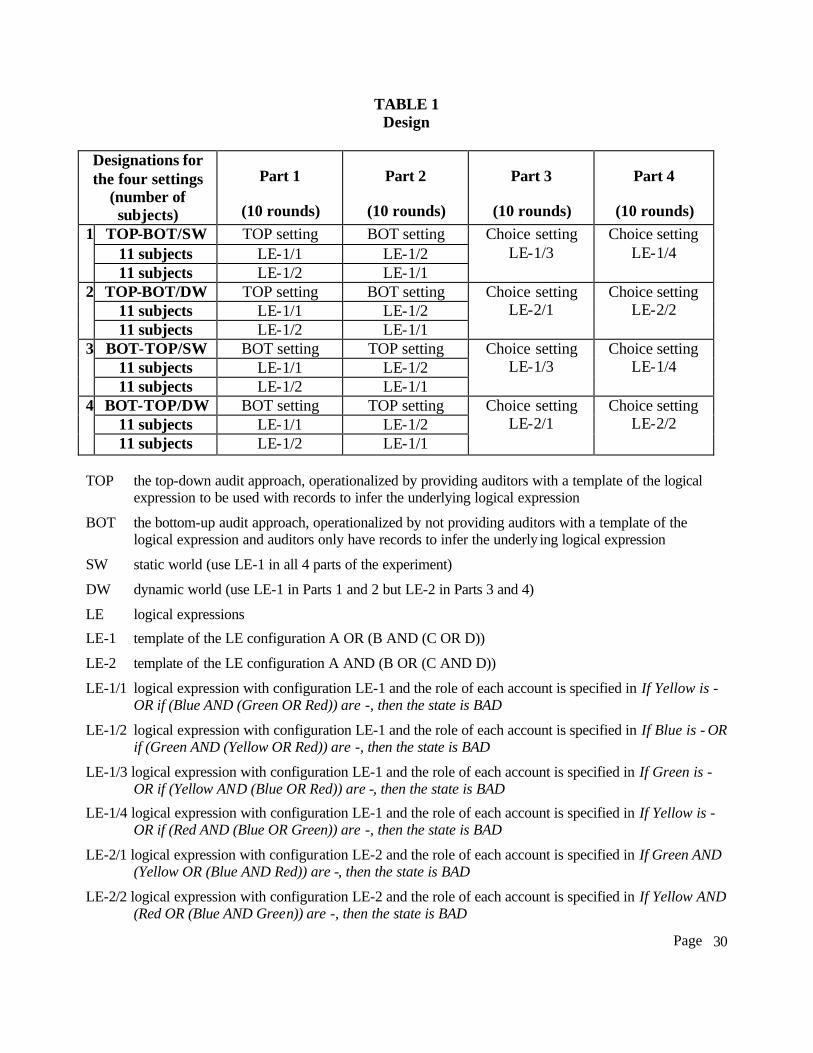
SW and DW. Table 1 provides a summary of the treatments. The rows of Table 1 show the four
Page
9
settings: TOP-BOT/SW; TOP-BOT/DW; BOT-TOP/SW; and BOT- TOP/DW and the columns
show the design and treatment specific details used in each of the four parts.
{Insert Table 1 about here}
Table 1 also shows that subjects could choose either the BOT or the TOP approach in
Parts 3 and 4. Providing subjects this choice allows us to investigate the extent to which the
approach acquired by the subjects appears appropriate given their decision-making accuracy in
Parts 1 and 2. We provide the treatment specific details in the experimental task section below.
Subjects
Subjects are university business-school student volunteers, paid based on the outcome of
their decisions. We conducted each experimental session on networked personal computers with
privacy maintained. The instructions, available upon request, do not use terms with real-world
connotations, such as auditor. The use of context in experimental settings can have important
implications, as discussed by Haynes and Kachelmeier (1998). Our goal is to create a setting that
has internal validity for the investigation of the underlying hypothesis. A total of 88 subjects
participated in the experiment.
Experimental Task
Objectives for the task
The experimental task was designed to meet three basic objectives. First, the task must
require the DM to make inferences within the purview of the SMMM hypothesis (i.e., it must be
possible to characterize the task using systems). Second, the task needed to capture the important
decision aspects of an audit, which we simplify to include (i) planning and executing the audit
and (ii) issuing a report (a choice that could represent one component of the overall audit).5
Third, the task had to be appropriately challenging so that subjects needed to construct and
evaluate multiple mental models to make inferences.
5 Our setting is a very simplified version of the native complexities of real-world auditing. However, our objective is to incorporate only those frictions that are most germane to testing the hypothesis. See Bloomfield (1997), Calegari et al (1998), Dopuch and King (1992), and Kachelmeier (1991) for examples of other experimental operationalizations of audits.
Page
10
We designed the task with a single-person decision-theoretic orientation to insulate
subjects from strategic interactions. We acknowledge that strategic issues between auditors and
clients are central to auditing, but we consider this study to be a first step in assessing the
predictions of the SMMM hypothesis.6 In addition, our setting does not involve uncertainty
(assuming an optimal solution), thus removing risk issues. We realize the design deviates from
practice. However, we want a setting that is most appropriate for a controlled examination of the
SMMM hypothesis. Lastly, we tied subjects’ payoffs to their decisions, consistent with the
method of experimental economics (as discussed below). It is particularly critical to induce
subjects to exert effort in settings that are cognitively demanding in order to have confidence that
subjects’ decision errors are due to limitations in working memory, rather than errors caused by a
lack of motivation.
Conceptual overview of the task
There are seven components of the experimental task, including: (1) accounts, (2) data
(3) states, (4) report, (5) logical expressions, (6) records, and (7) templates of logical expression
configurations (only under the TOP approach). Accounts are information sources containing data
useable by the subject to draw inferences about the state. We use four accounts in the
experiment; designated by the colors Red, Yellow, Green, and Blue.7 Each account contains data
that indicate either a positive (+) or a negative (–) sign. A positive sign is analogous to no
errors/no red flags while the negative sign indicates errors/red flags in the account.8
A state represents the validity of the client’s financial statement. There are two states:
GOOD and BAD. In a GOOD state, the client’s financial statements are accurately stated while
in a BAD state, there are red flags/material misstatements in the client’s financial report. A
report represents the auditor’s judgment about the state after investigating the data in the
accounts. There are two types of reports: ^ G and ^ B. If the subject expects the state to be GOOD
6 See Bloomfield (1995) for a discussion of strategic dependence in an auditing setting. 7 A real world parallel to our term ‘accounts’ could be any evidence source available to the auditor used to form and justify a report. We chose four accounts because it is consistent with our objective of having a task that is appropriately complex for our purposes (discussed above). 8 With four accounts and two possibilities in each account, either a positive (+) or a negative (–) sign, we have a total of 16 (24) different data combinations.

Page
11
(BAD), s/he should report ^ G (^ B). Logical expressions (LE) are the rules that map data (+ or –
signs) from the four accounts into the two states. A LE is modeled here as the relations among
the factors that determine the state. We limit the number of possible LEs with the following three
conditions to obtain tractable analysis:9
1. We use the logical operators/connectors “AND”, “OR”, and “( )” only, but these logical
operators/connectors could be used multiple times in a LE;
2. We use only negative sign(s) to contribute to a BAD state; and
3. We assume that the four accounts presented to subjects are the accounts that matter if a
negative sign (alone or in combination) is found. Hence, each account must play a role,
either alone or in combination with other account(s) leading to a BAD state. For
tractability, we restrict each account to appear in the LE once and only once.
It is critically important to note that in the instructions, we told subjects these three
conditions and that these conditions are necessary for them to infer the LE. An example of a LE
used in the experiment (denoted as LE-1/1) is:
If Yellow is - OR if (Blue AND (Green OR Red)) are -, then the state is BAD (LE-1/1)
LE-1/1 is interpreted as follows. If the Yellow account has a negative sign, then the state is BAD,
however, the state could also be BAD if the Blue and either the Green or Red accounts are
negative. In natural auditing settings, LE-1/1 could indicate that the Yellow account is
individually critical in determining the appropriateness of the financial statements, but the effect
of others is interactive. A loose illustration of LE-1/1 could be as follows: assume that a
company competes in the market for high quality product. A negative sign in the Yellow account
indicates a material departure from GAAP, a negative sign in Blue indicates an immaterial error
in the revenue account, a negative sign in Green indicates an immaterial error in the inventory
account, and a negative sign in Red indicates that the quality of the company’s product is low
relative to its competitors. Thus, a problem/error found in the revenue account, combined with a
problem/error found in the inventory account or a factor contrary to the company’s strategic
objectives indicates a BAD state.
As mentioned above, we use three conditions to obtain tractability in the LEs. With these
9 With these conditions, we are able to limit the LEs to 52 different possibilities.

Page
12
conditions, we could classify the LEs into 10 different configurations based on the logical
complexity of each expression. Each LE configuration contains LEs with the
operators/connectors located in exactly the same position while each account serves a different
role. Appendix B provides a summary for all LE configurations and an explanatory note on how
to calculate the number of different LEs under each configuration. To control for task
complexity, we only use the following two LE configurations in the experiment:
• A OR (B AND (C OR D))
• A AND (B OR (C AND D))
where A, B, C, and D represent the accounts in a generic manner. We use “LE-number”
to denote the configuration and the extension “/number” to identify each specific LE in a
configuration. 10
To control for the complexity of the LEs across settings, we only use LEs with LE-1
configuration in Parts 1 and 2, and LE-1 and LE-2 in Parts 3 and 4. Table 1 shows the specific
LEs we used in the experiment. We rotated the LEs used in Part 1 and 2 to achieve a balanced
design. In other words, half of the subjects had LE-1/1 in Part 1 while the other half had LE-1/2
in Part 1. Subjects with LE-1/1 in Part 1 had LE-1/2 in Part 2 while the remaining half, who had
LE-1/2 in Part 1 had LE-1/1 in Part 2. The rotation is designed to achieve high internal validity
because learning under TOP and BOT could be different under different LEs. Table 1 columns
three and four show the rotations described above in each setting.
Under SW, the LE configuration used in Parts 3 and 4 is the same as that used in Parts 1
and 2. Under DW, the LE configuration used in Parts 3 and 4 differs from the one used in Parts 1
and 2. By changing the LE configuration under the DW setting, we can evaluate auditors’
performance under the TOP and the BOT approach when the data in the accounts are mapped
into the state differently. We model a change in the LE configuration as a change in the
environment. Changing from one LE to another with the same configuration does not constitute
to a change in the environment in our setting because only changes in the configuration require a
10 For example: “If Yellow is - OR if (Blue AND (Green OR Red)) are -, then the state is BAD” has the same configuration as: “If Blue is - OR if (Red AND (Green OR Yellow)) are -, then the state is BAD” but different configuration as: “If Yellow AND (Blue OR (Green AND Red)) are -, then the state is BAD”
Page
13
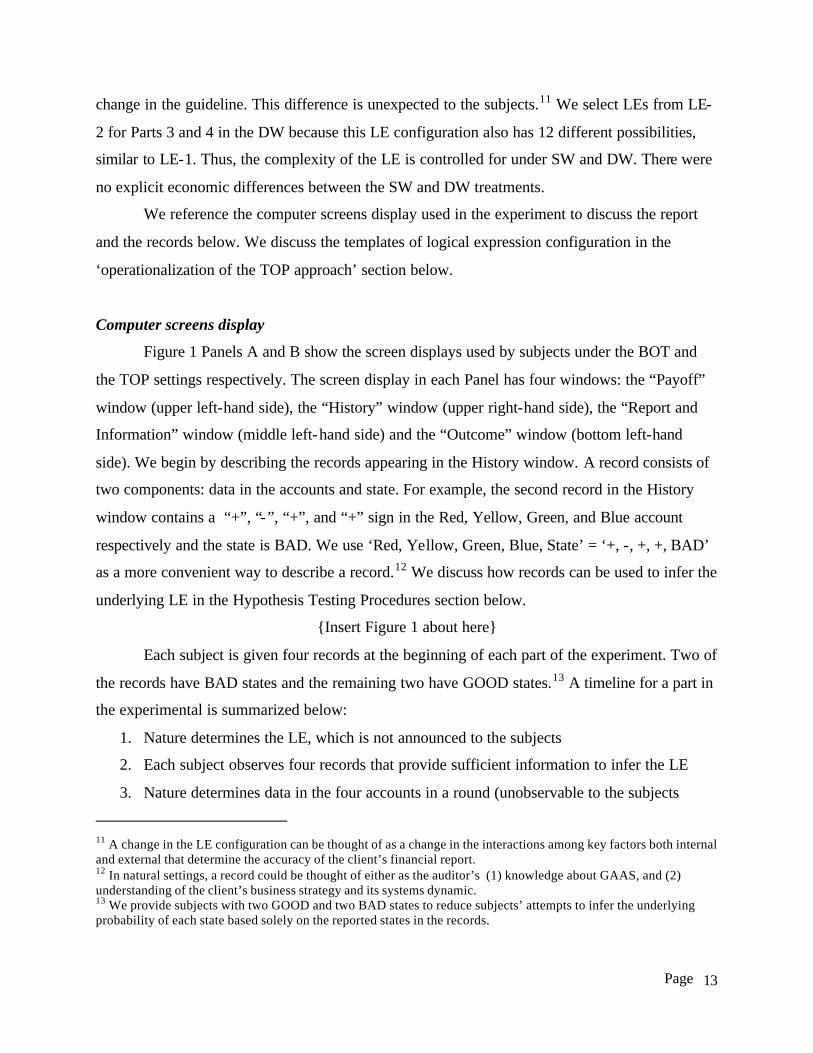
change in the guideline. This difference is unexpected to the subjects.11 We select LEs from LE-
2 for Parts 3 and 4 in the DW because this LE configuration also has 12 different possibilities,
similar to LE-1. Thus, the complexity of the LE is controlled for under SW and DW. There were
no explicit economic differences between the SW and DW treatments.
We reference the computer screens display used in the experiment to discuss the report
and the records below. We discuss the templates of logical expression configuration in the
‘operationalization of the TOP approach’ section below.
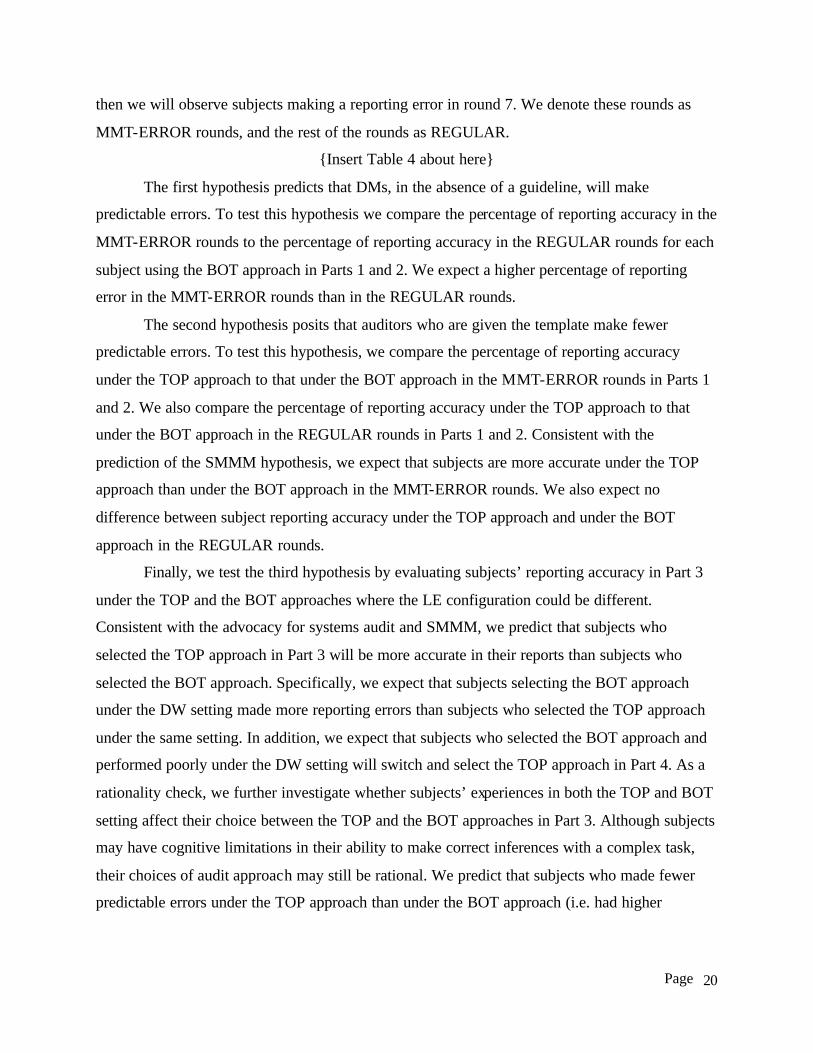
Computer screens display
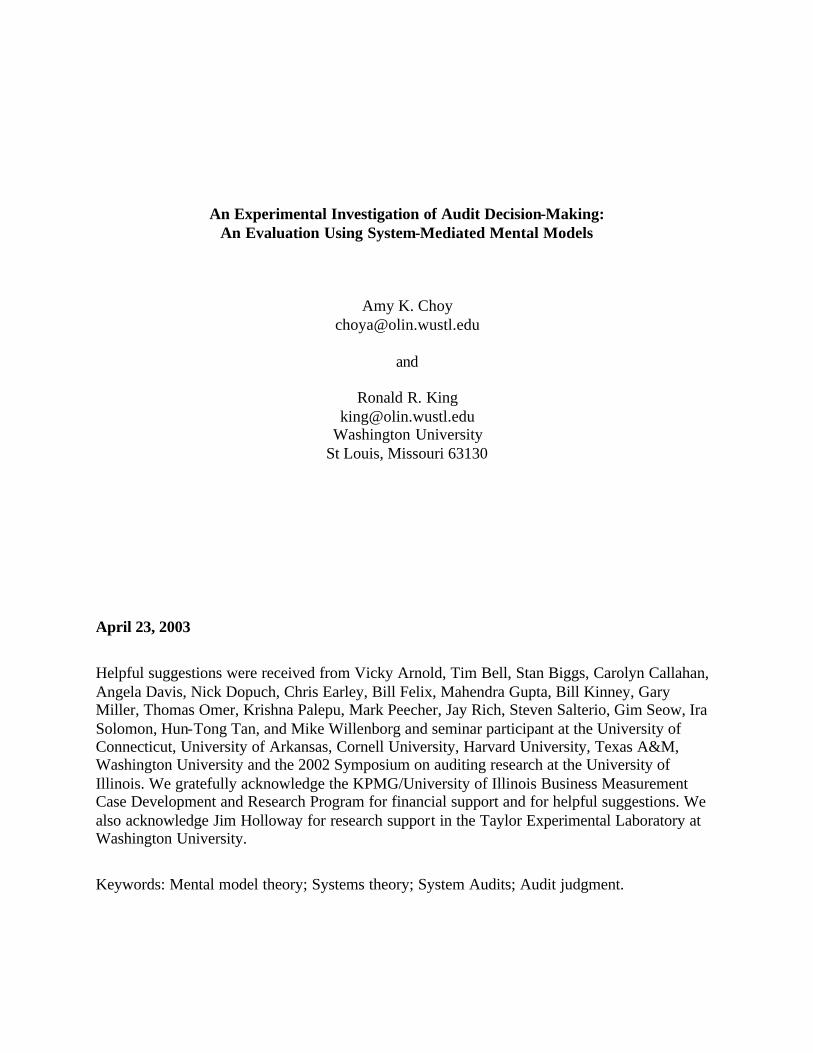
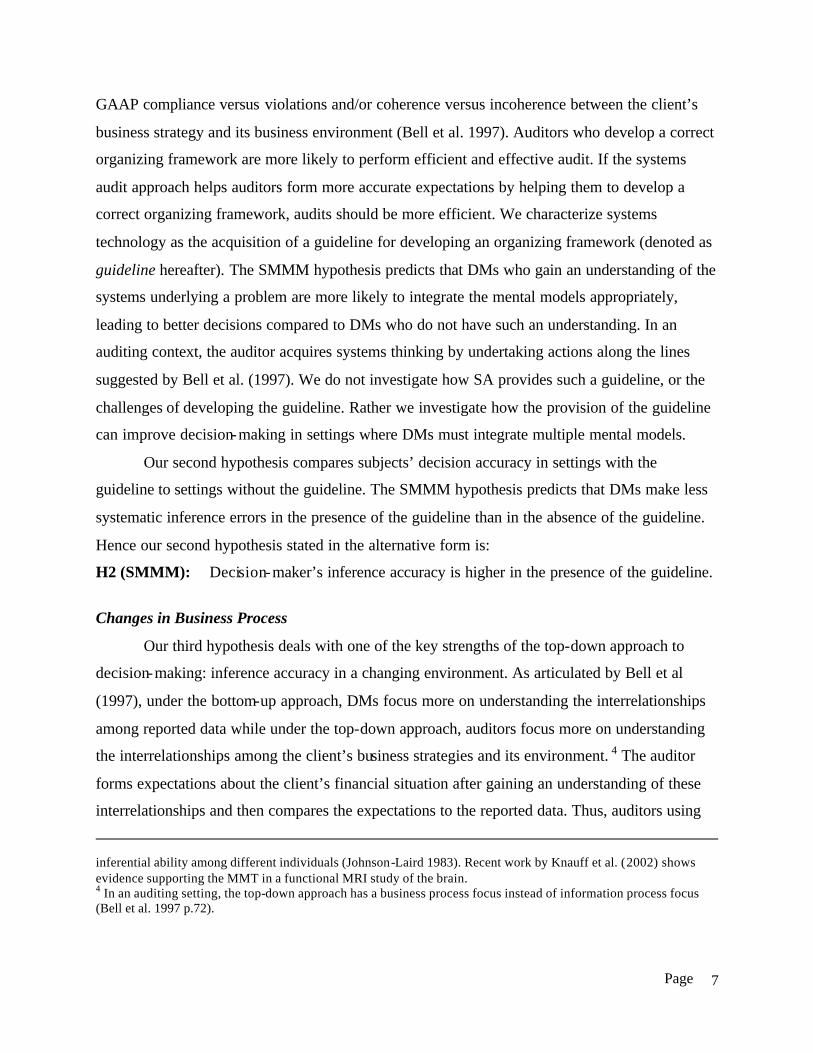
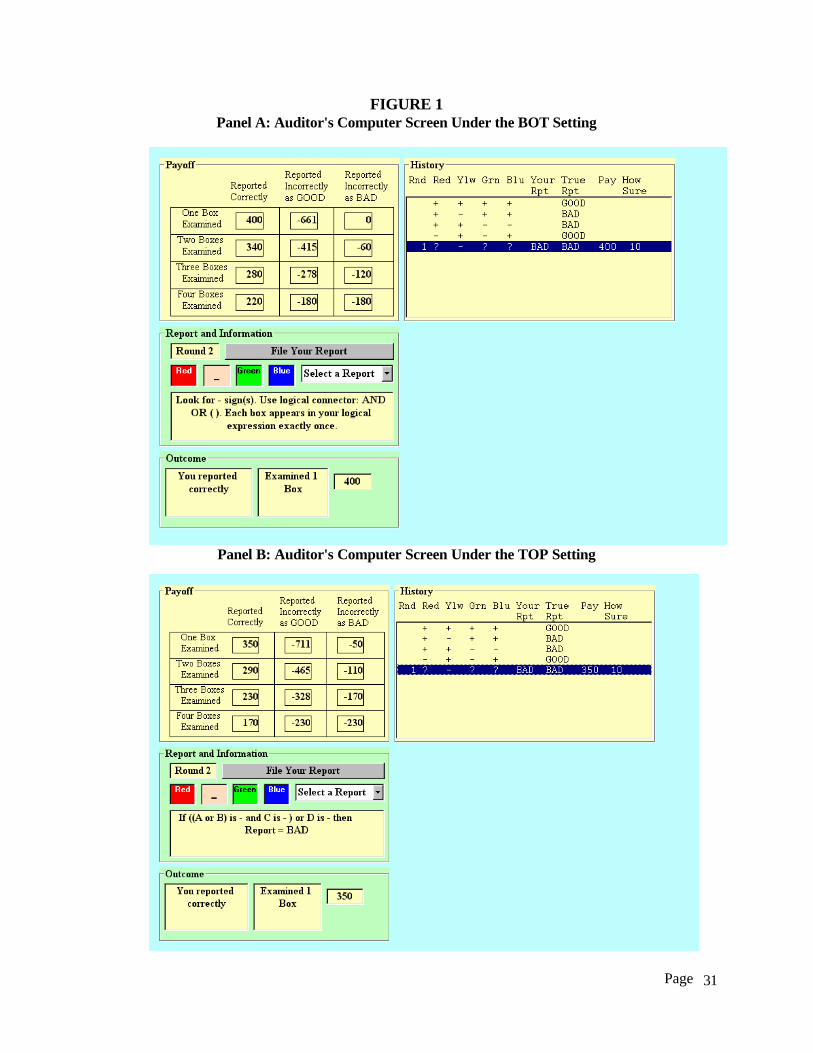
Figure 1 Panels A and B show the screen displays used by subjects under the BOT and
the TOP settings respectively. The screen display in each Panel has four windows: the “Payoff”
window (upper left-hand side), the “History” window (upper right-hand side), the “Report and
Information” window (middle left-hand side) and the “Outcome” window (bottom left-hand
side). We begin by describing the records appearing in the History window. A record consists of
two components: data in the accounts and state. For example, the second record in the History
window contains a “+”, “-”, “+”, and “+” sign in the Red, Yellow, Green, and Blue account
respectively and the state is BAD. We use ‘Red, Yellow, Green, Blue, State’ = ‘+, -, +, +, BAD’
as a more convenient way to describe a record.12 We discuss how records can be used to infer the
underlying LE in the Hypothesis Testing Procedures section below.
{Insert Figure 1 about here}
Each subject is given four records at the beginning of each part of the experiment. Two of
the records have BAD states and the remaining two have GOOD states.13 A timeline for a part in
the experimental is summarized below:
1. Nature determines the LE, which is not announced to the subjects
2. Each subject observes four records that provide sufficient information to infer the LE
3. Nature determines data in the four accounts in a round (unobservable to the subjects
11 A change in the LE configuration can be thought of as a change in the interactions among key factors both internal and external that determine the accuracy of the client’s financial report. 12 In natural settings, a record could be thought of either as the auditor’s (1) knowledge about GAAS, and (2) understanding of the client’s business strategy and its systems dynamic. 13 We provide subjects with two GOOD and two BAD states to reduce subjects’ attempts to infer the underlying probability of each state based solely on the reported states in the records.

Page
14
unless they investigates the accounts). Hence the state (unobservable to the subjects) is
also determined14
4. Each subject receives an endowment of resources (¥460) that can be used to investigate
the accounts and to pay penalties if there is a reporting error
5. Each subject must investigate one account (at a cost of ¥60) before issuing a report
6. Each subject can investigate a second, third, or fourth account before issuing a report
(each investigation costs ¥60)
7. Subjects provide a measure of their confidence in the accuracy of the reports
8. Each subject’s payoff is determined for a round
9. Repeat steps 3-8 for rounds 2-10.
In other words, subjects are given an initial endowment of ¥460 in each round (¥ is used
here to denote experimental currency) and they can use this endowment to investigate accounts
and to pay sanctions when there is a reporting error. At each round, the subject must investigate
at least one account before issuing a report. After investigating the desirable number of accounts,
the subject issues either a ^ G or ^ B report corresponding to the subject’s beliefs of a GOOD or
BAD state.15 A report is correct when the report matches the state and incorrect when the report
does not match the state. The cost to investigate an account is held constant at ¥60 and a subject
who investigates one account and reports correctly earns ¥400 for that round.
When the subject issues an incorrect report, s/he is assessed a penalty that depends on the
type of reporting error. Specifically, if the state is GOOD and the subject’s report is ^ B, the
subject pays a fixed penalty of ¥400. This penalty represents the cost to the subject of being
disciplined by the client for issuing ^ B when the state is actually GOOD (the penalty imposed by
the client is assumed to be independent of the subject’s effort). On the other hand, if the state is
BAD and the subject’s report is ^ G, then the penalty depends on the number of accounts being
investigated in that round. The more evidence the subject collects, the smaller the penalty for the
reporting error. Specifically, if the subject reports ^ G when the state is BAD, the penalty is 1061,
14 All data are presequenced for control purposes. 15 The report represents the auditor’s expectation about the state (i.e., the validity of the overall financial statements), so a reporting error indicates a judgment error.
Page
15
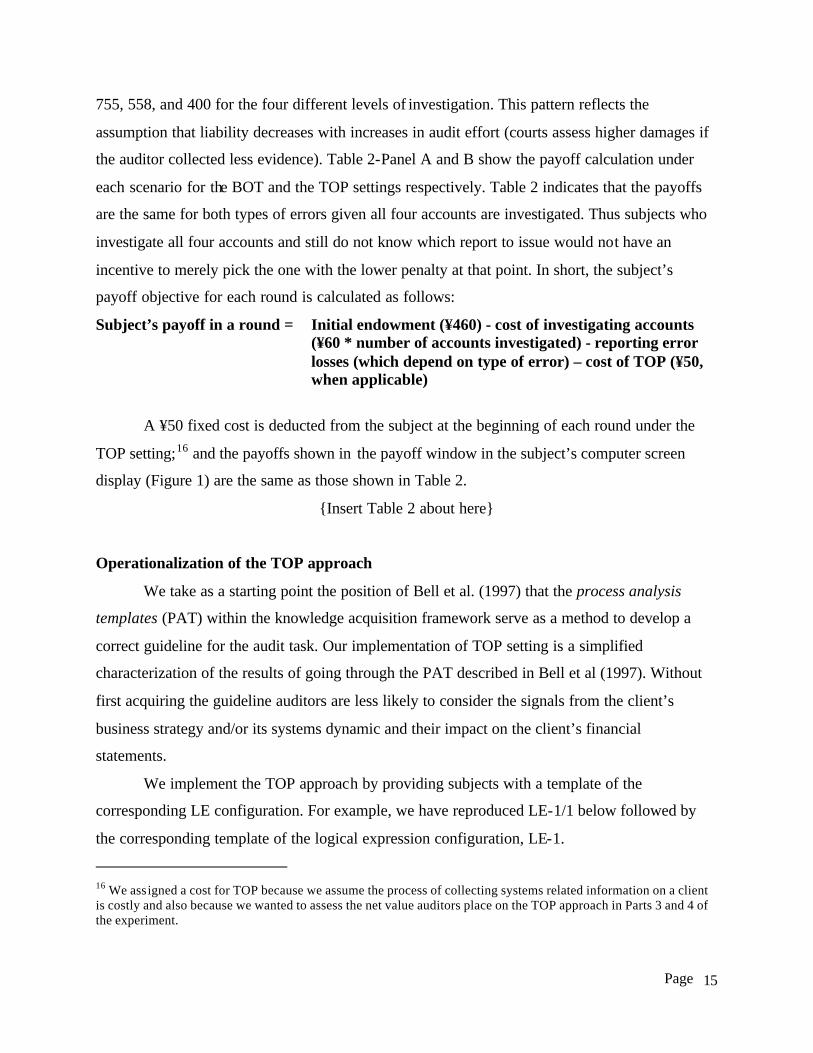
755, 558, and 400 for the four different levels of investigation. This pattern reflects the
assumption that liability decreases with increases in audit effort (courts assess higher damages if
the auditor collected less evidence). Table 2-Panel A and B show the payoff calculation under
each scenario for the BOT and the TOP settings respectively. Table 2 indicates that the payoffs
are the same for both types of errors given all four accounts are investigated. Thus subjects who
investigate all four accounts and still do not know which report to issue would not have an
incentive to merely pick the one with the lower penalty at that point. In short, the subject’s
payoff objective for each round is calculated as follows:
Subject’s payoff in a round = Initial endowment (¥460) - cost of investigating accounts (¥60 * number of accounts investigated) - reporting error losses (which depend on type of error) – cost of TOP (¥50, when applicable)
A ¥50 fixed cost is deducted from the subject at the beginning of each round under the
TOP setting;16 and the payoffs shown in the payoff window in the subject’s computer screen
display (Figure 1) are the same as those shown in Table 2.
{Insert Table 2 about here}
Operationalization of the TOP approach
We take as a starting point the position of Bell et al. (1997) that the process analysis
templates (PAT) within the knowledge acquisition framework serve as a method to develop a
correct guideline for the audit task. Our implementation of TOP setting is a simplified
characterization of the results of going through the PAT described in Bell et al (1997). Without
first acquiring the guideline auditors are less likely to consider the signals from the client’s
business strategy and/or its systems dynamic and their impact on the client’s financial
statements.
We implement the TOP approach by providing subjects with a template of the
corresponding LE configuration. For example, we have reproduced LE-1/1 below followed by
the corresponding template of the logical expression configuration, LE-1.
16 We assigned a cost for TOP because we assume the process of collecting systems related information on a client is costly and also because we wanted to assess the net value auditors place on the TOP approach in Parts 3 and 4 of the experiment.
Page
16
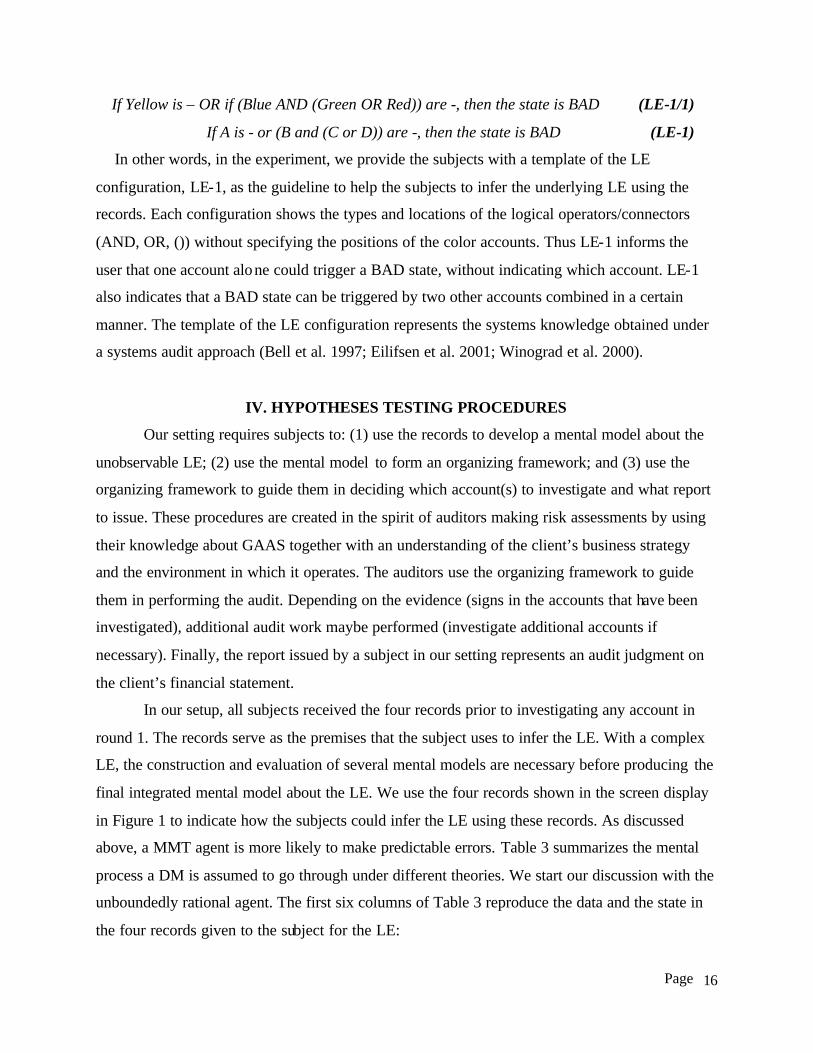
If Yellow is – OR if (Blue AND (Green OR Red)) are -, then the state is BAD (LE-1/1)
If A is - or (B and (C or D)) are -, then the state is BAD (LE-1)
In other words, in the experiment, we provide the subjects with a template of the LE
configuration, LE-1, as the guideline to help the subjects to infer the underlying LE using the
records. Each configuration shows the types and locations of the logical operators/connectors
(AND, OR, ()) without specifying the positions of the color accounts. Thus LE-1 informs the
user that one account alone could trigger a BAD state, without indicating which account. LE-1
also indicates that a BAD state can be triggered by two other accounts combined in a certain
manner. The template of the LE configuration represents the systems knowledge obtained under
a systems audit approach (Bell et al. 1997; Eilifsen et al. 2001; Winograd et al. 2000).
IV. HYPOTHESES TESTING PROCEDURES
Our setting requires subjects to: (1) use the records to develop a mental model about the
unobservable LE; (2) use the mental model to form an organizing framework; and (3) use the
organizing framework to guide them in deciding which account(s) to investigate and what report
to issue. These procedures are created in the spirit of auditors making risk assessments by using
their knowledge about GAAS together with an understanding of the client’s business strategy
and the environment in which it operates. The auditors use the organizing framework to guide
them in performing the audit. Depending on the evidence (signs in the accounts that have been
investigated), additional audit work maybe performed (investigate additional accounts if
necessary). Finally, the report issued by a subject in our setting represents an audit judgment on
the client’s financial statement.
In our setup, all subjects received the four records prior to investigating any account in
round 1. The records serve as the premises that the subject uses to infer the LE. With a complex
LE, the construction and evaluation of several mental models are necessary before producing the
final integrated mental model about the LE. We use the four records shown in the screen display
in Figure 1 to indicate how the subjects could infer the LE using these records. As discussed
above, a MMT agent is more likely to make predictable errors. Table 3 summarizes the mental
process a DM is assumed to go through under different theories. We start our discussion with the
unboundedly rational agent. The first six columns of Table 3 reproduce the data and the state in
the four records given to the subject for the LE:

Page
17
If Yellow is – OR if (Blue AND (Green OR Red)) are -, then the state is BAD (LE-1/1)
Column 7 of Table 3, denoted “prediction with unbounded rationality”, shows the mental process
of an unboundedly rational agent.
{Insert Table 3 about here}
To illustrate how an unboundedly rational agent uses the records to infer the LE, we look
at the information content of each record. In the first record, there are only positive signs and the
state is GOOD. This record is not informative because subjects were instructed that only
negative sign(s) could give rise to a BAD state. With no negative signs, the DM knows that the
state will never be BAD. In the second record, there is a negative sign in the Yellow account and
the state is BAD, indicating that a negative sign in the Yellow account alone is sufficient to
produce a BAD state. Hence the DM form the following mental model:
If Yellow is – OR (XXX), then the state is BAD (MM-start)
where XXX represents the unknown part of the LE yet to be determined. In the third record,
there are negative signs in the Green and the Blue accounts, and the state is BAD. The DM
reasons that a negative sign in either of these accounts or both accounts could trigger a BAD
state. Hence the three possible mental models are:
If Yellow is – OR if Green is – OR (XXX), then the state is BAD (MM#1)
If Yellow is – OR if Blue is – OR (XXX), then the state is BAD (MM#2)
If Yellow is – OR if Green AND Blue are – OR (XXX), then the state is BAD (MM#3)
That is, MM#1 indicates the possibility that a negative sign in the Green account alone triggers a
BAD state, MM#2 indicates the possibility that a negative sign in the Blue account alone triggers
a BAD state and MM#3 indicates the possibility that both the Blue and Green accounts need to
be negative to trigger a BAD state. In the fourth record, the signs in both the Red and the Green
accounts are negative, and the state is GOOD. This structure allows the DM to realize that a
negative sign in the Green account alone will not produce a BAD state, which eliminates MM#1
as a viable possibility, leaving only MM#2 and MM#3 as the remaining possibilities. However,
an unboundedly rational agent will also eliminate MM#2 because the agent knows that each
account is restricted to appear in the LE exactly once. The agent will eliminate the following
possibility:
Page
18
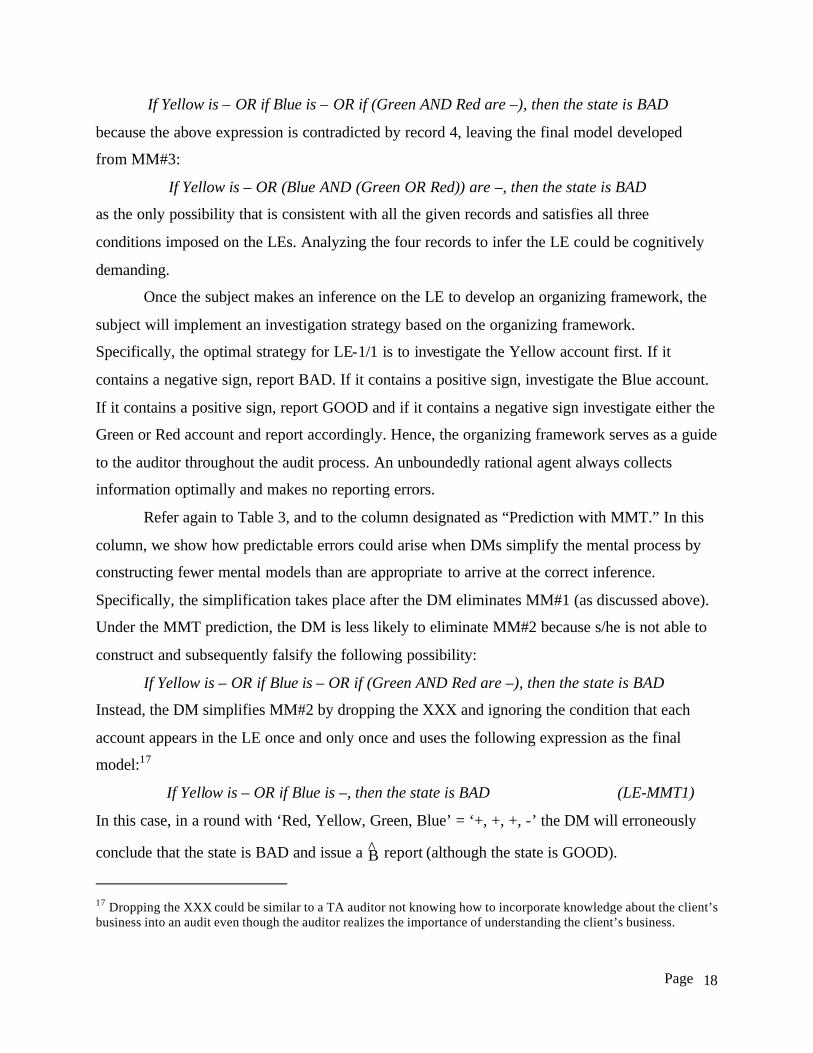
If Yellow is – OR if Blue is – OR if (Green AND Red are –), then the state is BAD
because the above expression is contradicted by record 4, leaving the final model developed
from MM#3:
If Yellow is – OR (Blue AND (Green OR Red)) are –, then the state is BAD
as the only possibility that is consistent with all the given records and satisfies all three
conditions imposed on the LEs. Analyzing the four records to infer the LE could be cognitively
demanding.
Once the subject makes an inference on the LE to develop an organizing framework, the
subject will implement an investigation strategy based on the organizing framework.
Specifically, the optimal strategy for LE-1/1 is to investigate the Yellow account first. If it
contains a negative sign, report BAD. If it contains a positive sign, investigate the Blue account.
If it contains a positive sign, report GOOD and if it contains a negative sign investigate either the
Green or Red account and report accordingly. Hence, the organizing framework serves as a guide
to the auditor throughout the audit process. An unboundedly rational agent always collects
information optimally and makes no reporting errors.
Refer again to Table 3, and to the column designated as “Prediction with MMT.” In this
column, we show how predictable errors could arise when DMs simplify the mental process by
constructing fewer mental models than are appropriate to arrive at the correct inference.
Specifically, the simplification takes place after the DM eliminates MM#1 (as discussed above).
Under the MMT prediction, the DM is less likely to eliminate MM#2 because s/he is not able to
construct and subsequently falsify the following possibility:
If Yellow is – OR if Blue is – OR if (Green AND Red are –), then the state is BAD
Instead, the DM simplifies MM#2 by dropping the XXX and ignoring the condition that each
account appears in the LE once and only once and uses the following expression as the final
model:17
If Yellow is – OR if Blue is –, then the state is BAD (LE-MMT1)
In this case, in a round with ‘Red, Yellow, Green, Blue’ = ‘+, +, +, -’ the DM will erroneously
conclude that the state is BAD and issue a ^ B report (although the state is GOOD).
17 Dropping the XXX could be similar to a TA auditor not knowing how to incorporate knowledge about the client’s business into an audit even though the auditor realizes the importance of understanding the client’s business.

Page
19
Even if the DM is able to eliminate MM#2, s/he may not be able to integrate the mental
models correctly to produce the final model using MM#3. Instead, s/he may drop the XXX and
overlook the importance of the Red account, leading to the following erroneous organizing
framework as the final mental model:
If Yellow is – OR (Blue AND Green) are –, then the state is BAD (LE-MMT2)
In this case, in a round with ‘Red, Yellow, Green, Blue’ = ‘-, +, +, -’, a DM will
incorrectly conclude that the state is GOOD when it is BAD. It is equally likely that a boundedly
rational DM will use either LE-MMT1 or LE-MMT2 as the organizing framework to guide the
accounting investigation process and the reporting decision.
Finally, the right-hand column (designated “Prediction with SMMM”) of Table 3 shows
how the inference process can be enhanced with the template LE-1 as a guideline for the DM.
The second record indicates that A represents the Yellow account. From the last two records, the
negative sign in Green leads to a BAD state in the third record but not in the fourth record;
therefore, B can only be the blue account.
As noted earlier, there are four parts in each experimental session, and in each part, there
are 10 rounds. We consider each part an audit and the subject’s reporting accuracy in a part is
used as an observation. Considering the subject’s reporting accuracy out of 10 rounds as one
observation allows us to (1) avoid the problem that the subject is correct just by chance (in any
one round, there is a 50% chance that the report is correct); (2) evaluate the predictable errors
based on the MMT. Table 4 shows these predictable errors under different LEs used in the
experiment. The first column of Table 4 shows the LEs used in the experiment. The second
column shows the organizing framework subjects could potentially use at if they fail to construct
and integrate the final mental model properly. The third column shows the round number in a
part that we expect to see subjects reporting incorrectly for the respective LE used. For example,
for the LE:
If Yellow is - OR (Blue AND (Red OR Green)) are -, then the state is BAD
if the subject use the following organizing framework instead:
If Yellow is - OR (Blue AND Green) are -, then the state is BAD
we will observe subjects with a reporting error in round 5. If the subject uses the following
organizing framework:
If Yellow is - OR Blue is -, then the state is BAD
Page
20
then we will observe subjects making a reporting error in round 7. We denote these rounds as
MMT-ERROR rounds, and the rest of the rounds as REGULAR.
{Insert Table 4 about here}
The first hypothesis predicts that DMs, in the absence of a guideline, will make
predictable errors. To test this hypothesis we compare the percentage of reporting accuracy in the
MMT-ERROR rounds to the percentage of reporting accuracy in the REGULAR rounds for each
subject using the BOT approach in Parts 1 and 2. We expect a higher percentage of reporting
error in the MMT-ERROR rounds than in the REGULAR rounds.
The second hypothesis posits that auditors who are given the template make fewer
predictable errors. To test this hypothesis, we compare the percentage of reporting accuracy
under the TOP approach to that under the BOT approach in the MMT-ERROR rounds in Parts 1
and 2. We also compare the percentage of reporting accuracy under the TOP approach to that
under the BOT approach in the REGULAR rounds in Parts 1 and 2. Consistent with the
prediction of the SMMM hypothesis, we expect that subjects are more accurate under the TOP
approach than under the BOT approach in the MMT-ERROR rounds. We also expect no
difference between subject reporting accuracy under the TOP approach and under the BOT
approach in the REGULAR rounds.
Finally, we test the third hypothesis by evaluating subjects’ reporting accuracy in Part 3
under the TOP and the BOT approaches where the LE configuration could be different.
Consistent with the advocacy for systems audit and SMMM, we predict that subjects who
selected the TOP approach in Part 3 will be more accurate in their reports than subjects who
selected the BOT approach. Specifically, we expect that subjects selecting the BOT approach
under the DW setting made more reporting errors than subjects who selected the TOP approach
under the same setting. In addition, we expect that subjects who selected the BOT approach and
performed poorly under the DW setting will switch and select the TOP approach in Part 4. As a
rationality check, we further investigate whether subjects’ experiences in both the TOP and BOT
setting affect their choice between the TOP and the BOT approaches in Part 3. Although subjects
may have cognitive limitations in their ability to make correct inferences with a complex task,
their choices of audit approach may still be rational. We predict that subjects who made fewer
predictable errors under the TOP approach than under the BOT approach (i.e. had higher
Page
21
reporting accuracy in Parts 1 or 2 under the TOP approach) are more likely to select the TOP
approach in Parts 3 and 4. We use a logistic regression to evaluate subjects’ choices.
V. RESULTS
In this section we present the results for the three hypotheses discussed above using the
methods outlined in the previous section. In general, our results are consistent with the
predictions of the MMT and the SMMM hypotheses. Specifically, the results show that (1)
subjects make predictable and systematic errors in the absence of a guideline; (2) the template
provided by TOP reduces systematic errors, as predicted by the SMMM hypothesis; and (3)
when subjects face the changing environment, they make fewer errors if they have the guideline.
There were 22 subjects in each of the four settings, with each subject making decisions in
40 rounds (10 rounds in each of the four parts). We use subjects’ decisions over the 10 rounds in
each part as an observation, resulting in 88 observations for each part.
Results for H1: DMs make predictable reporting errors under the BOT approach
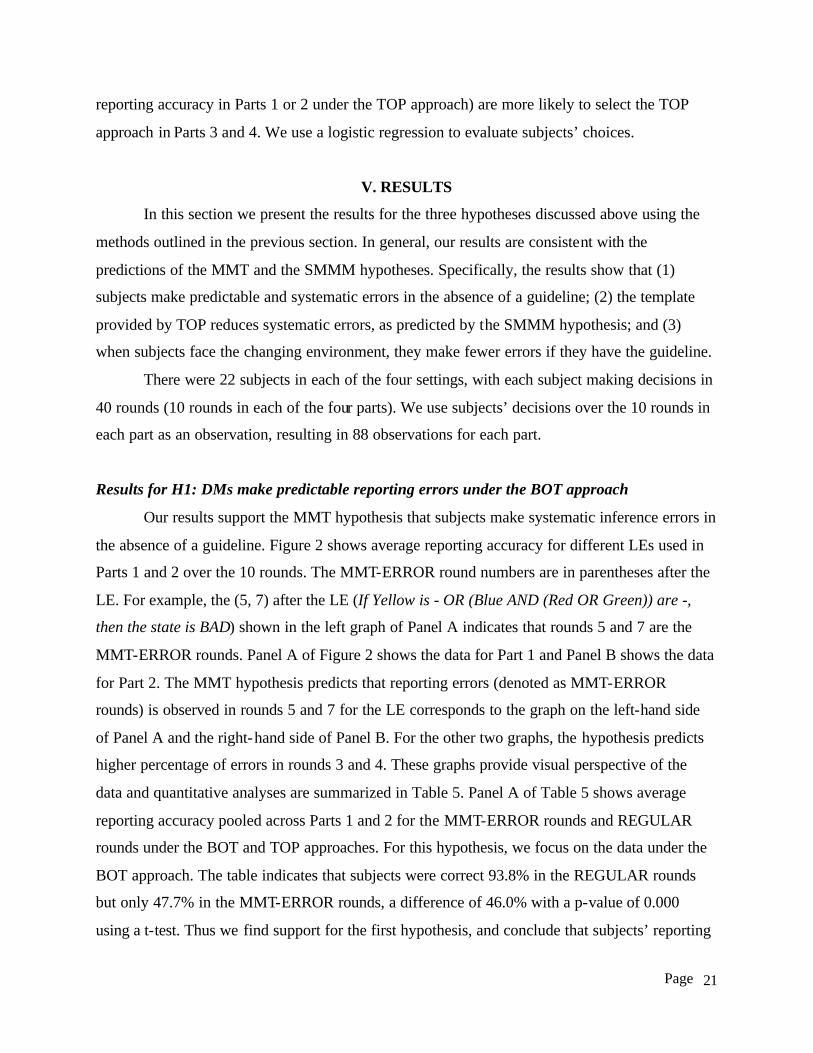
Our results support the MMT hypothesis that subjects make systematic inference errors in
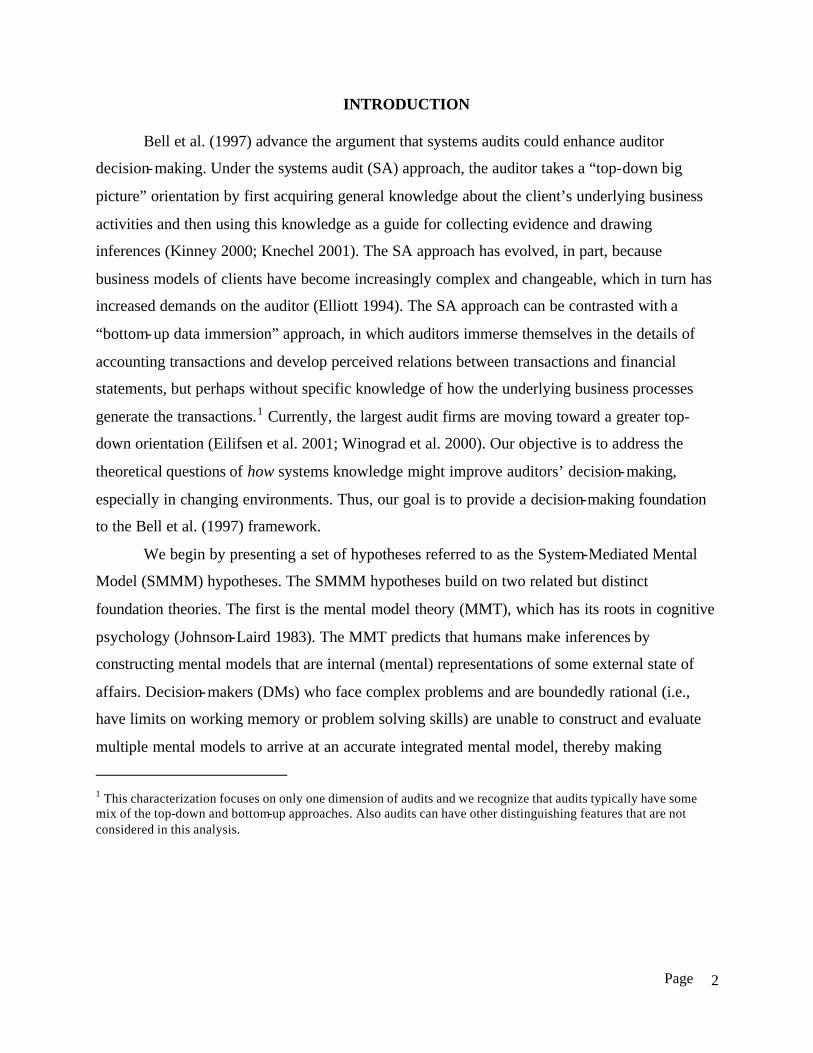
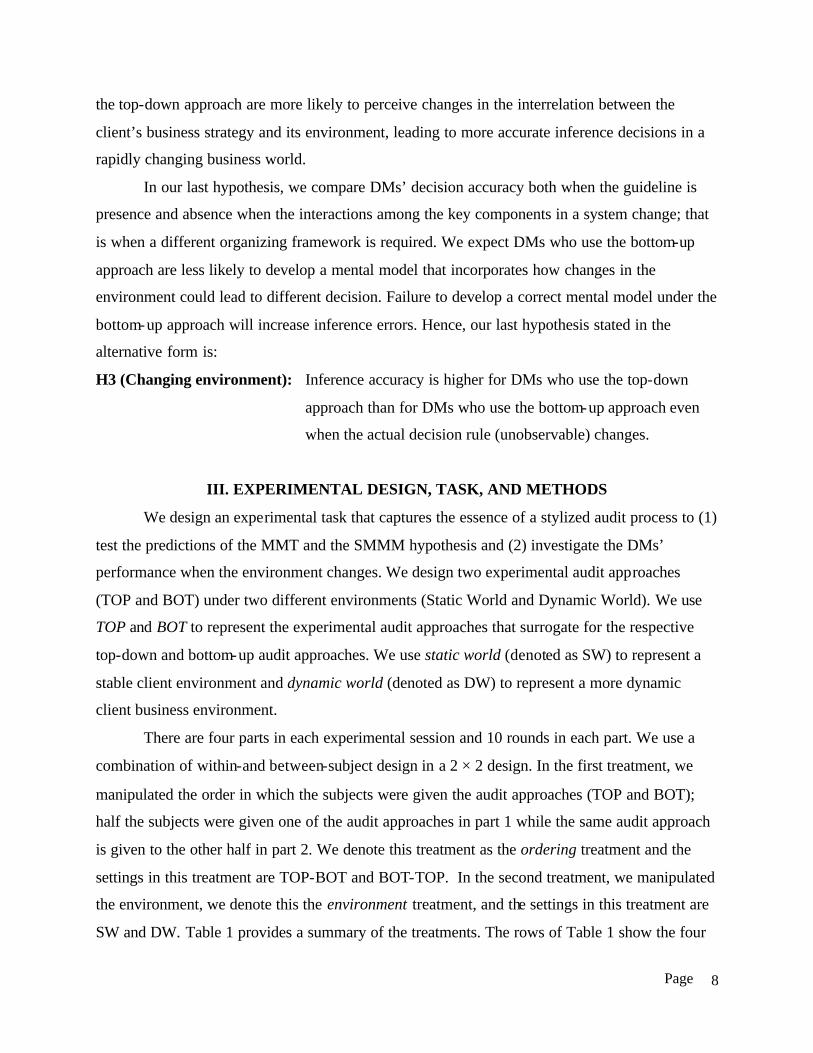
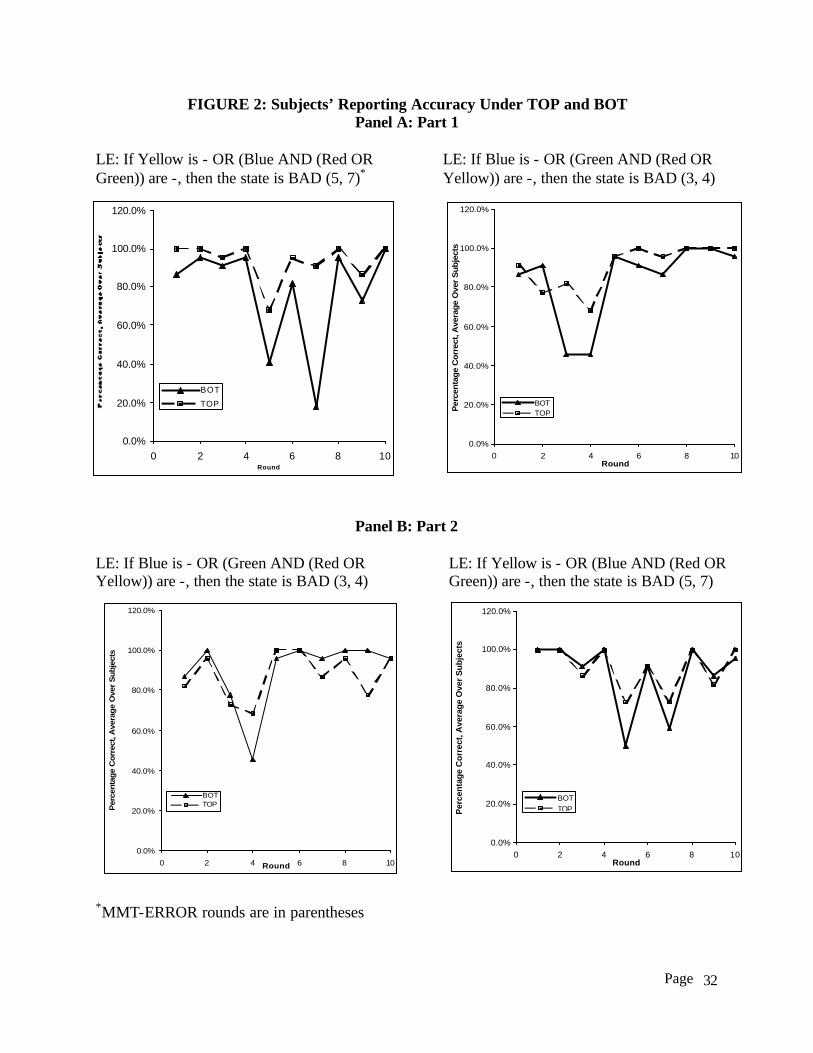
the absence of a guideline. Figure 2 shows average reporting accuracy for different LEs used in
Parts 1 and 2 over the 10 rounds. The MMT-ERROR round numbers are in parentheses after the
LE. For example, the (5, 7) after the LE (If Yellow is - OR (Blue AND (Red OR Green)) are -,
then the state is BAD) shown in the left graph of Panel A indicates that rounds 5 and 7 are the
MMT-ERROR rounds. Panel A of Figure 2 shows the data for Part 1 and Panel B shows the data
for Part 2. The MMT hypothesis predicts that reporting errors (denoted as MMT-ERROR
rounds) is observed in rounds 5 and 7 for the LE corresponds to the graph on the left-hand side
of Panel A and the right-hand side of Panel B. For the other two graphs, the hypothesis predicts
higher percentage of errors in rounds 3 and 4. These graphs provide visual perspective of the
data and quantitative analyses are summarized in Table 5. Panel A of Table 5 shows average
reporting accuracy pooled across Parts 1 and 2 for the MMT-ERROR rounds and REGULAR
rounds under the BOT and TOP approaches. For this hypothesis, we focus on the data under the
BOT approach. The table indicates that subjects were correct 93.8% in the REGULAR rounds
but only 47.7% in the MMT-ERROR rounds, a difference of 46.0% with a p-value of 0.000
using a t-test. Thus we find support for the first hypothesis, and conclude that subjects’ reporting
Page
22
errors are systematic under the BOT setting. The TOP data are discussed below.
{Insert Table 5 about here}
Results for H2: Hypothesis on DMs’ inferences errors with an organizing framework
In general, we find support for the SMMM hypothesis that inference accuracy is higher in
the presence of a guideline. Panel A of Table 5 provides a side-by-side comparison of the
average reporting accuracy under the TOP and the BOT approaches. We find that under both the
TOP and BOT settings, subjects were significantly more accurate in the REGULAR rounds than
in the MMT-ERROR rounds (94.6% in the REGULAR rounds and 74.4% in the MMT-ERROR
rounds with a 20.2% difference for TOP; p < 0.0001, and 93.8% in the REGULAR rounds and
47.7% in the MMT-ERROR rounds with a 46.0% difference for BOT; p <0.0001). This also
confirms the findings above that subjects made disproportionately more mistakes in the MMT-
ERROR rounds under the BOT approach.
We perform a between subject comparison using data from Part 1 (comparing subjects’
performance in the TOP setting with that in the BOT setting in Part 1), and a within subject
comparison of subjects’ performance in Parts 1 and 2. Table 5 Panel B provides a summary of
the findings and the t-test results. Columns 2 and 3 of Table 5 Panel B show the mean and the
standard deviation for the percentage of reporting accuracy for subjects under the TOP-BOT and
the BOT-TOP setting respectively. The differences and the p-value for the t-test are shown in
column 4.
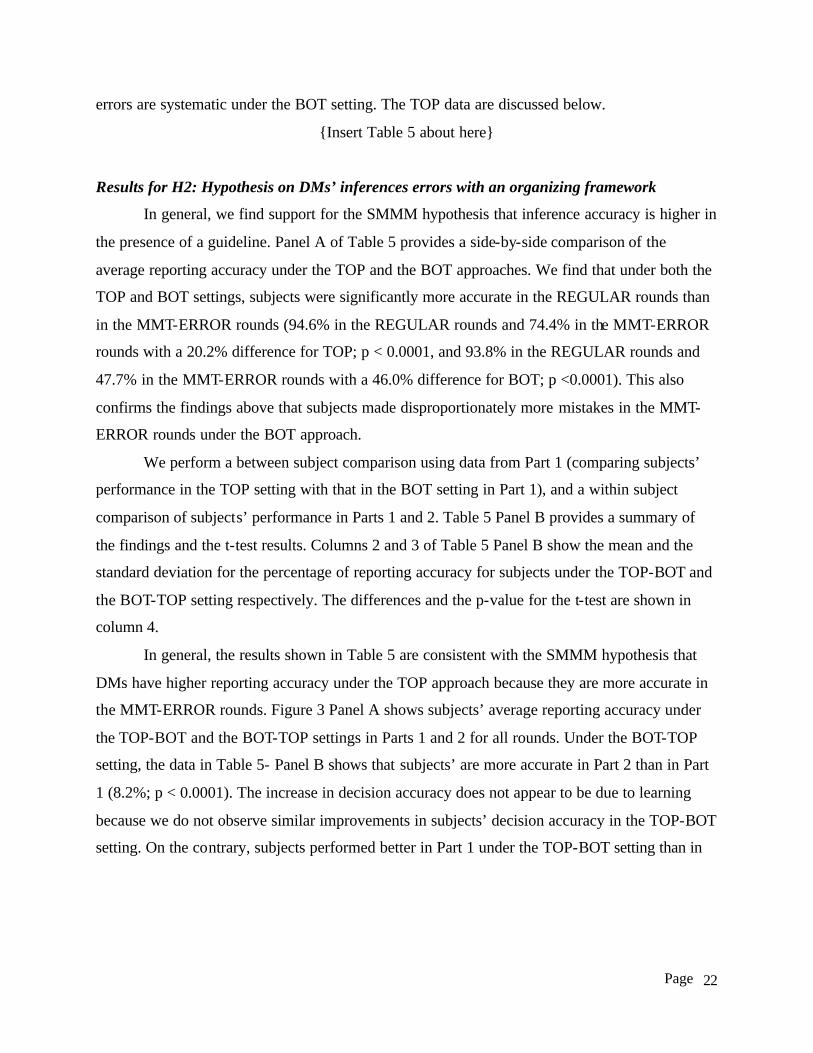
In general, the results shown in Table 5 are consistent with the SMMM hypothesis that
DMs have higher reporting accuracy under the TOP approach because they are more accurate in
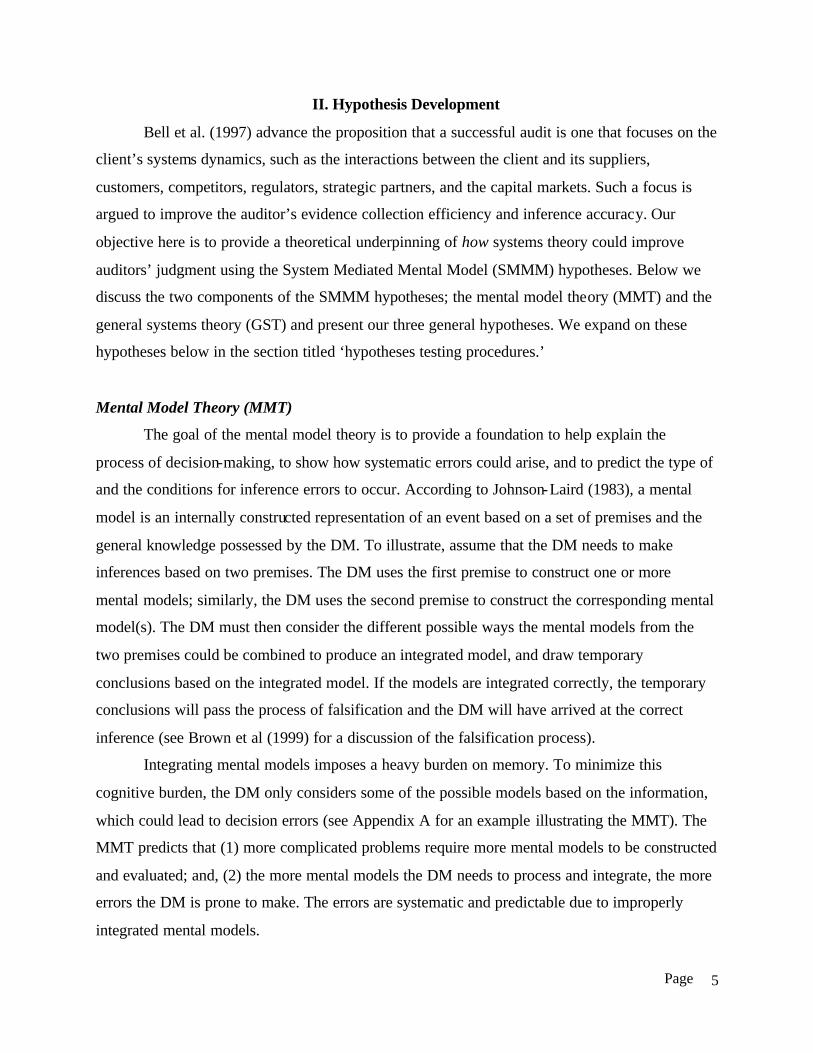
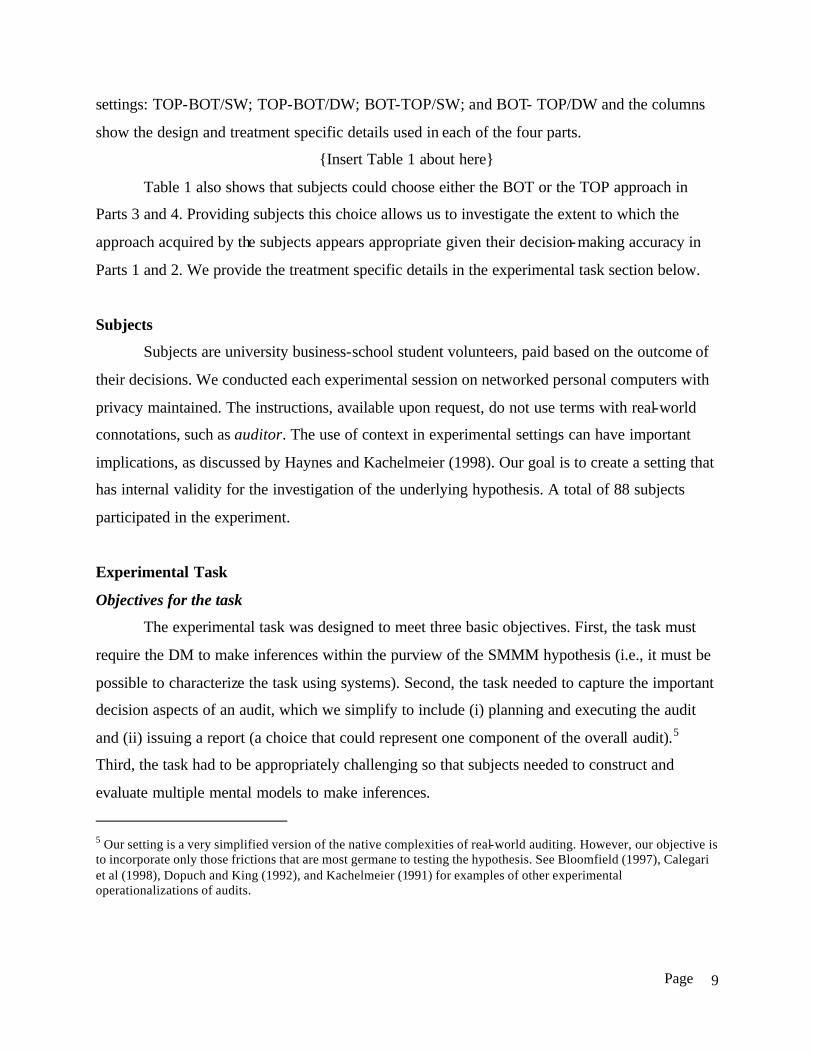
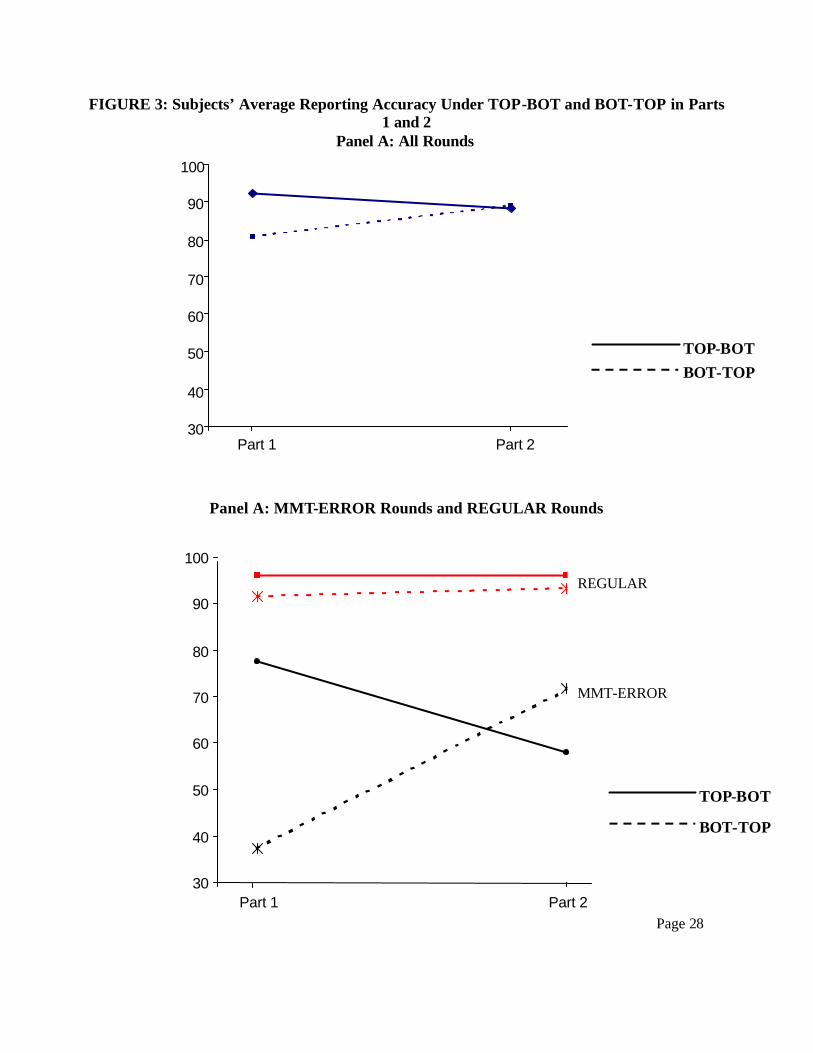
the MMT-ERROR rounds. Figure 3 Panel A shows subjects’ average reporting accuracy under
the TOP-BOT and the BOT-TOP settings in Parts 1 and 2 for all rounds. Under the BOT-TOP
setting, the data in Table 5- Panel B shows that subjects’ are more accurate in Part 2 than in Part
1 (8.2%; p < 0.0001). The increase in decision accuracy does not appear to be due to learning
because we do not observe similar improvements in subjects’ decision accuracy in the TOP-BOT
setting. On the contrary, subjects performed better in Part 1 under the TOP-BOT setting than in
Page
23
Part 2 (3.9% more accurate; p = 0.024).18 Figure 3 Panel B shows subjects’ average reporting
accuracy under the TOP-BOT and the BOT-TOP settings in Parts 1 and 2 for the MMT-ERROR
rounds and the REGULAR rounds. The graph reveals that subjects’ improvements under the
BOT-TOP setting comes primarily from an improvement in the subjects’ decisions in the MMT-
ERROR rounds while decline in subjects’ perform under the TOP-BOT setting came primarily
from subjects making more decision errors in the MMT-ERROR rounds. Interestingly, the
between subject comparisons in Part 2 show no significant differences between the TOP and
BOT settings for subjects’ decisions accuracy.
We also find that the order in which subjects are exposed to the approach seems to
matter. We compare results for subjects who had TOP in Part 1 with those who had TOP in Part
2. We find no significant differences in subjects’ reporting accuracy (p = 0.20, result not shown
in Table 5). However, we find that subjects are more accurate, 7.7%, in their reports in Part 2 of
the TOP-BOT sequence than in Part 1 of the BOT-TOP sequence (p = 0.0003, result not shown
in Table 5). Because there is no difference between subjects’ performance under the TOP setting
in Parts 1 and 2, we cannot attribute the difference in subjects’ performance under the BOT
setting in Parts 1 and 2 as due to subjects’ learning about the task.
Results for H3: Comparing DMs’ reporting accuracy in the Static World setting with that in
the Dynamic World setting
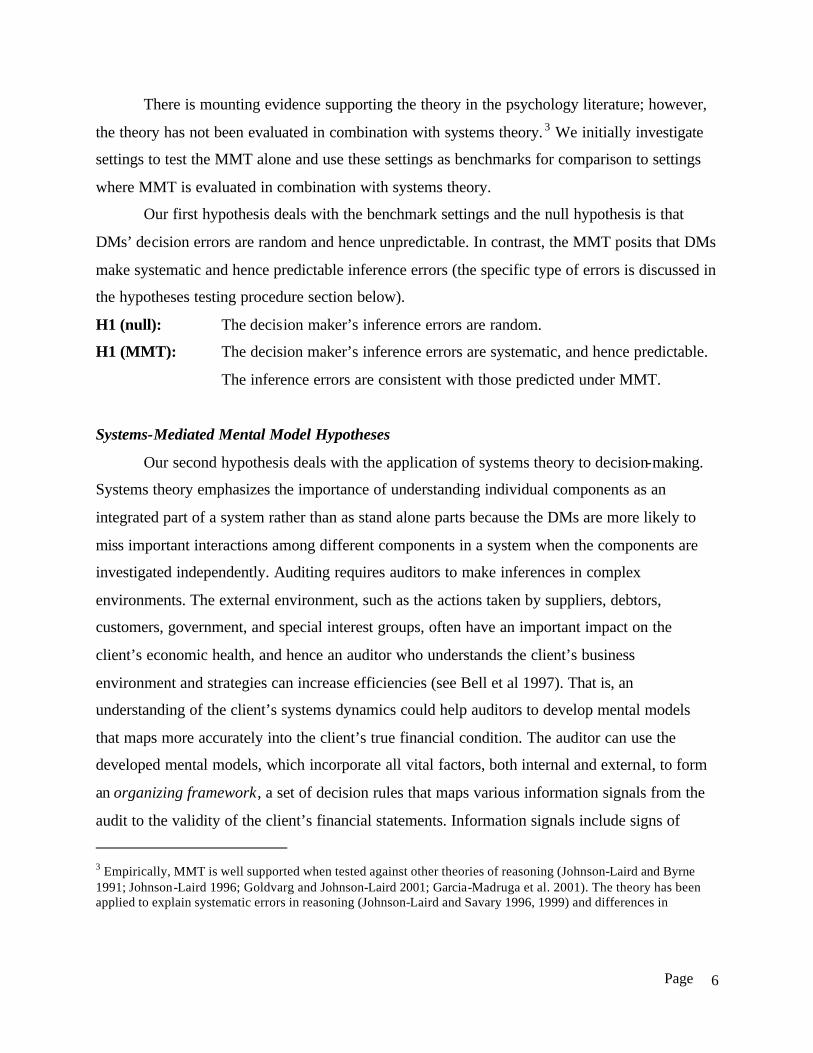
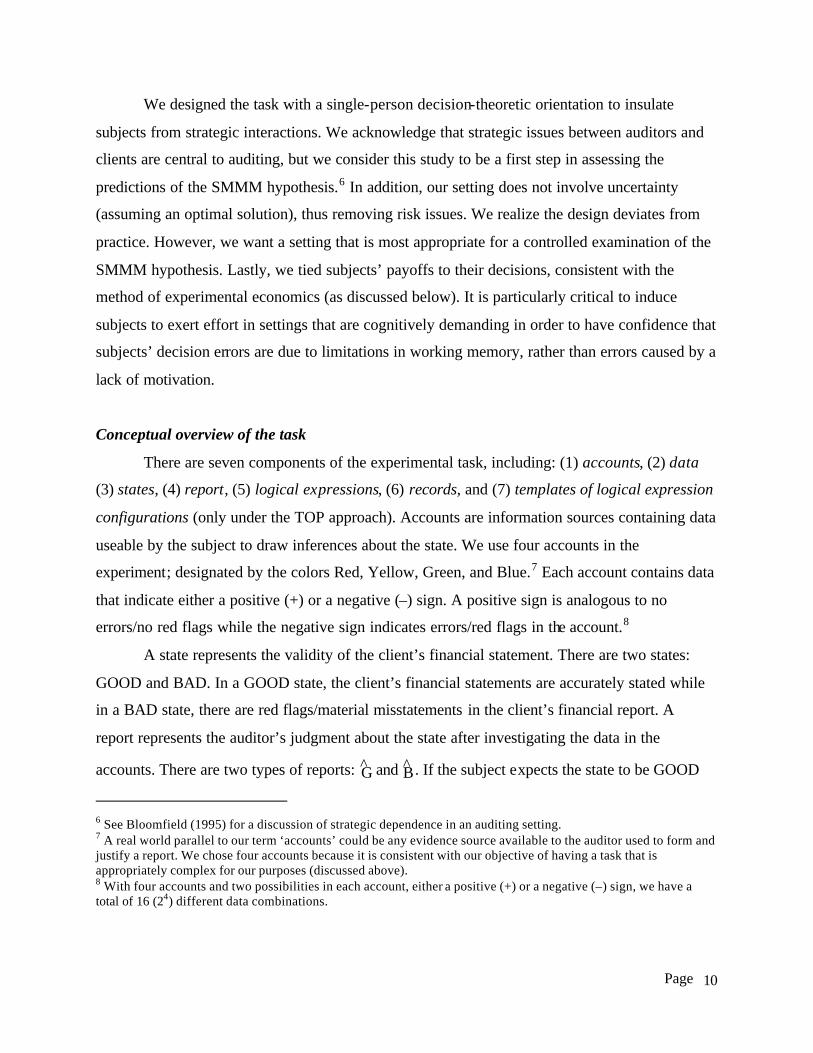
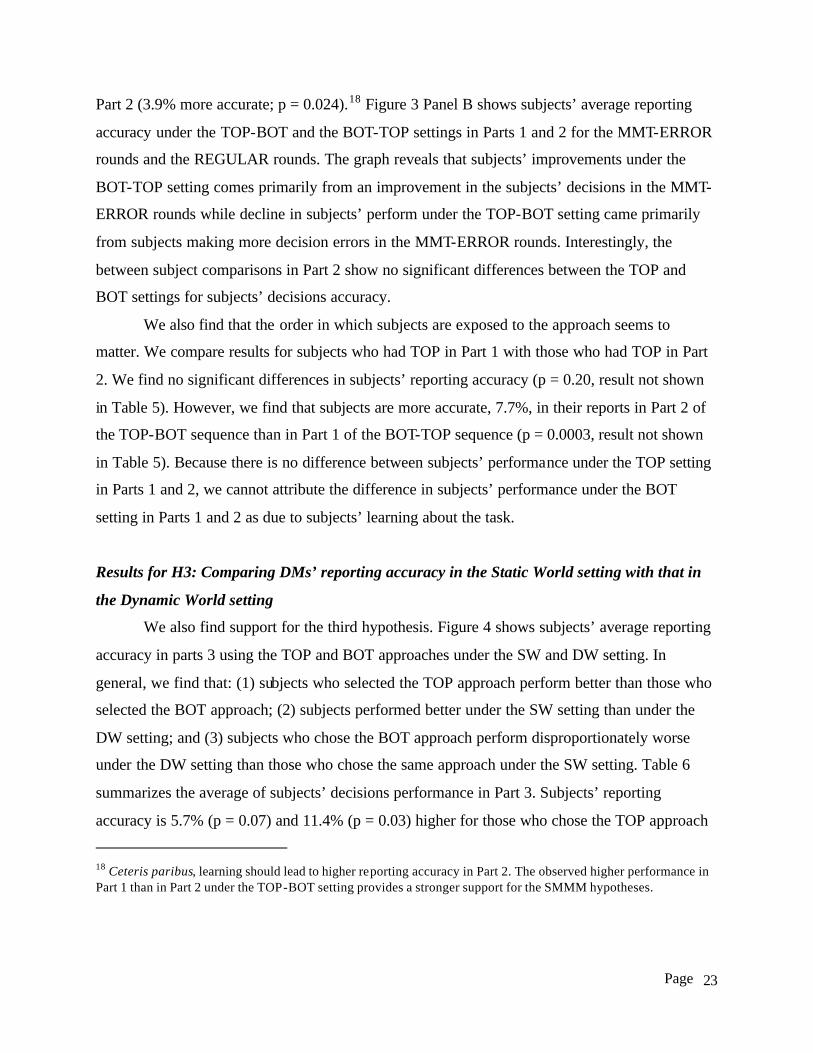
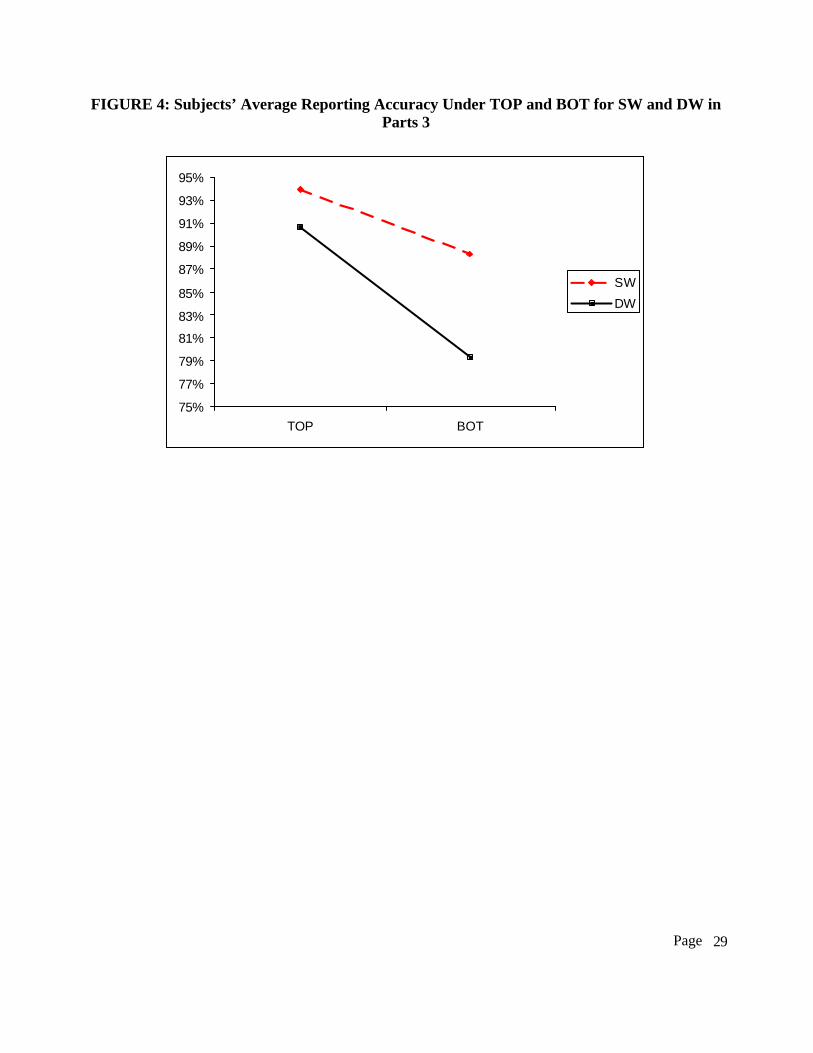
We also find support for the third hypothesis. Figure 4 shows subjects’ average reporting
accuracy in parts 3 using the TOP and BOT approaches under the SW and DW setting. In
general, we find that: (1) subjects who selected the TOP approach perform better than those who
selected the BOT approach; (2) subjects performed better under the SW setting than under the
DW setting; and (3) subjects who chose the BOT approach perform disproportionately worse
under the DW setting than those who chose the same approach under the SW setting. Table 6
summarizes the average of subjects’ decisions performance in Part 3. Subjects’ reporting
accuracy is 5.7% (p = 0.07) and 11.4% (p = 0.03) higher for those who chose the TOP approach
18 Ceteris paribus, learning should lead to higher reporting accuracy in Part 2. The observed higher performance in Part 1 than in Part 2 under the TOP-BOT setting provides a stronger support for the SMMM hypotheses.
Page
24
instead of the BOT under the SW and DW settings respectively. Overall, subjects’ reporting
accuracy is 7.3% (p = 0.02) higher under the SW than DW settings.
Table 6 reveals that: (1) there are no significant differences in subjects’ performance
under the SW and DW settings for subjects who selected TOP in both settings (p = 0.24); (2)
subjects who selected the BOT approach under SW were on average 8.9% (p = 0.02) more
accurate than those who selected the BOT approach under DW; and (3) subjects who selected the
TOP approach under DW were on average 11.4% (p=0.03) more accurate than those who
selected the BOT approach.
{Insert Table 6 about here}
Given that subject’s choice of audit approach is endogenous in Parts 3 and 4, we also run
a few logistic regressions to investigate the extent to which subjects select TOP or BOT in Part 3
are based on (1) their experiences in Part 1 and 2; and (2) economic motivation. Specifically, we
investigate whether subjects’ experiences across Parts 1 and 2 affected the TOP/BOT choice in
Part 3. We use the reporting accuracy rather than payoff loss in the regression because the payoff
loss function is non- linear.19 We hypothesize that subjects’ choice of the TOP approach depends
on whether they had higher payoff and spent less time in each round under the TOP setting than
under the BOT setting. The first logit model is based only on variables that we consider
economic in nature. In all the logit regressions, the probability of selecting the TOP approach in
Part 3 is modeled. The two economic explanatory variables we included in the regression are: (1)
the percentage of correct reports under TOP minus the percentage of correct reports under BOT
(denoted ?REP_ACC); and (2) the difference between the average amount of time (measure in
seconds) a subject spent in a round under the TOP setting and the BOT setting (denoted ?TIME).
The economic prediction is that subjects who have higher relative reporting accuracy under the
TOP setting in Part 1 or 2 are more likely to select the TOP approach in Part 3; thus there should
be a positive correlation between the probability of selecting TOP in Part 3 and the change in
reporting accuracy, ?REP_ACC. If subjects also value their time as an important economic
19 Apart from the number of correct report in each part, we also have data on the type of reporting errors, each subject’s reported confidence about the selected report, and the number of second used in each round. These data allow us to calculate the payoff loss from each type of reporting errors and the total payoff loss in a round. However,

Page
25
resource, the more time they spent under the TOP setting compared to the BOT setting in the
first two parts of the experiment, the less likely they are to select the TOP approach in Part 3;
thus we expect a negative relationship between the dependent variable and ?TIME. Table 7,
column 2 shows the expected signs for the all the explanatory variables.
In the experiment, no time constraint is imposed on the subjects. As a result, even though
time could be a valuable resource, it may not affect the subjects’ choice. We estimated a second
economic motivated model using ?REP_ACC as the only explanatory variable. We also notice
that of the 44 subjects in the TOP-BOT setting, 34 (77%) chose BOT in part 3 while only 25
(57%) of the 44 subjects in the BOT-TOP setting chose BOT. Coupled with the results of higher
subjects’ reporting accuracy in Part 2 in the TOP-BOT setting, we also develop a third model to
include two other variables, ?CONF and ORDER. 20 ?CONF is the difference of a subject’s
average confidence under the TOP setting (in either Part 1 or 2) and that under the BOT setting.
ORDER is an indicator variable that equals 1 if the subject was given the TOP setting in Part 1
and 0 otherwise. The three models that we estimated are summarized below:
log(P/1-P) = ß0 + ß1?REP_ACC + ß2 ?TIME (Model 1)
log(P/1-P) = ß0 + ß1?REP_ACC (Model 2)
log(P/1-P) = ß0 + ß1?REP_ACC + ß3 ?CONF + ß4 ORDER (Model 3)
where P is the probability of choosing the TOP approach in Part 3.
Our results show that ? TIME is not significant in model 1. In other words, the relative
amount of time subjects spent on the task in Parts 1 and 2 did not affect their choice of the audit
approach in Part 3. We also find that apart from the economic factor such as ?REP_ACC, the
psychological factor ?CONF and the treatment factor ORDER also affect subjects’ choice of
audit approach in Part 3. These variables add 9.3% (82.8% - 73.5%) to the predictive power over
the ? REP_ACC variable (see Table 7). In short, we find that subjects’ choices in Part 3 are
consistent with their experiences in Part 1 and 2 (see Table 7).
{Insert Table 7 about here}
we opt not to use the payoff loss function in the analysis because the payoff function is non linear, depending on the type of reporting errors and the number of accounts the individual chose to investigate.
Page
26
VI. SUMMARY AND CONCLUSIONS
Although the idea of a dynamic audit technology to meet current challenges had been
discussed in the literature (Elliott 1994), the publication by Bell el al. (1997) has provided a
concrete basis on which to discuss the approach. This publication has precipitated a number of
research papers, including Ballou et al. (2001), Blokdijk et al. (2001), and O’Donnell (2001), and
has generate a great deal of discussion, both in practice (Eilifsen et al. 2001; Winograd et al.
2000) and in the research arena (Ballou and Heitger 2001).
Our goal is to contribute to the understanding of how systems knowledge can improve
audit decision-making and thus provide a decision-making foundation to the work of Bell et al.
(1997). The SMMM hypothesis developed here predicts that systems knowledge reduces the
cognitive demands of integrating the multiple mental models needed to solve a complex
problem. The SMMM hypothesis predicts that the DMs who gain an understanding of the
interactions among the components, both internal and external, of a system are more likely to
integrate the mental models appropriately, leading to better decisions compared to DMs who do
not have such an understanding. In an auditing context, the DM gains a system understanding by
undertaking actions along the lines suggested by Bell et al. (1997). We also conduct an
experiment to investigate the theory and find support for the hypothesis. In summary, we find
that: (1) subjects make errors that are predicted by the mental model theory; (2) subjects perform
better (i.e., higher reporting accuracy) under the TOP setting than the BOT setting, (3) subjects
perform better under the TOP setting than the BOT setting in an environment that changes
unexpectedly.
There are some noteworthy caveats to our study. First, our operationalization of the audit
setting and audit approaches (TA and SA) is very stark relative to natural settings. However, we
seek to create a setting that is simplified to focus on primitive decision-making issues that apply
to the theory. A second caveat is that we use student subjects in our experiment, rather than audit
practitioners. However, our subject pool choice and other experimental choices were chosen to
enhance internal validity, which is a fundamental requirement of valid experimentation (Peecher
and Solomon 2001). The last caveat is that we do not investigate how DMs might develop an
20 These variables were also selected by a model-selection procedure that determine the extent that other variables also help to predict auditors’ choices in Part 3

Page
27
understanding of a system. Rather, we investigate how a guideline for an organizing framework,
such as systems knowledge, can be useful in settings where DMs are prone to making predictable
errors.
One future research possibility is to refine the theory to evaluate the robustness of this
theory when applied to other types of problems. A second possibility is to conduct experimental
research to investigate the effects of adding a strategic element to the setting to investigate the
emergence of biased decision-making. For example, Kadous et al. 2003 investigate decision-
making under the mediating effect of the preference of others. This “motivated reasoning” could
be a function of the extent to which systems are (mis)understood by auditor and that the
negotiation stance that auditors take could be a function of their confidence in their
understanding of the underlying systems.
Page
28
REFERENCES
Antle, R. 1984. Auditor Independence. Journal of Accounting Research 22 (1): 1-20 Ballou, B., C. Earley, and J. Rich. 2001. The impact of strategic positioning evaluation on
auditor judgments about business process performance. Auburn University and University of Connecticut working paper.
Ballou, B. and D. Heitger. 2001. Potential impacts of recent developments in audit
methodologies on experimental auditing research. Auburn University working paper. Bara, B., G, Bucciarelli, M., and Lombardo, V. 2001. Model theory of deduction: a unified
computational approach. Cognitive Science 25: 839-901. Bell, T., F. Marrs, I. Solomon, and H. Thomas. 1997. Auditing Organizations Through a
Strategic-Systems Lens. The KPMG Business Measurement Process. KPMG Peat Marwick LLP.
Bertalanffy, L. von. 1968. General Systems Theory. Foundations, Development, Applications.
New York, N. Y.: George Braziller. Blokdijk, J., F. Drieenhuizen, D. Simunic, and M. Stein. 2001. Determinants of the mix of audit
procedures: Key factors that cause auditors to change what they do. UBC working paper. Bloomfield, R. 1995. Strategic dependence and inherent risk assessments. The Accounting
Review 70 (January): 71-90. Bloomfield, R. 1997. Strategic dependence and the assessment of fraud risk: A laboratory study.
The Accounting Review 72 (October): 517-538. Brown, C., M. Peecher, and I. Solomon. 1999. Auditors’ hypothesis testing in diagnostic
inference tasks. Journal of Accounting Research (Vol. 37, No 1, Spring): 1-26. Calegari, M., J. Schatzberg, and G. Sevcik. 1998. Experimental Evidence of Differential Auditor
Pricing and Reporting Strategies. The Accounting Review 73 (April): 255-275. Dopuch, N., and R. King. 1992. Negligence versus strict liability regimes in auditing: An
experimental investigation. The Accounting Review (January): 97-120. Dye, R., B. Balachandran, R. Magee. 1990. Contingent Fees for Audit Firms. Journal of
Accounting Research 28 (2): 239-266. Elliott, R. 1994. “The future of audits. Journal of Accountancy 178 (September): 74-82. Eilifsen, A., W. Knechel, and P. Wallage. 2001. Application of the business risk audit model: A
field study. Accounting Horizon (Vol 15, No 3 September):193-207
Page
29
Garcia-Madruga, J.A., S. Moreno, N. Carriedo, F. Gutiérrez, and P.N. Johnson-Laird 2001. Are
conjunctive inferences easier than disjunctive inferences? A comparison of rules and models. The Quarterly Journal of Experimental Psychology 54(2): 613-632.
Gibbins, M., and R. J. Swieringa 1995. Twenty years of judgment research in accounting and
auditing. In R. H. Ashton and A. H. Ashton (Eds), Cambridge Series on Judgment and Decision Making: Judgment and Decision-Making Research in Accounting and Auditing. New York: Cambridge University Press: 131-249.
Goldvarg, E., and P. N. Johnson-Laird. 2001. Naive causality: A mental model theory of causal
meaning and reasoning. Cognitive Science 25: 565-610. Haynes, C., and S. Kachelmeier. 1998. The effects of accounting contexts on accounting
decisions: A synthesis of cognitive and economic perspectives in accounting experimentation. Journal of Accounting Literature 17: 97-136.
Johnson-Laird, P. N. 1983. Mental models. Cambridge, UK: Cambridge University Press. __________. 1996. Images, models, and prepositional representations. In M. de Vega, M. J.
Intons-Peterson, P. N. Johnson-Laird, M. Denis, & M. Marschark (Eds.), Models of visuo-spatial cognition. New York: Oxford University Press: 90-127.
__________. 2001. Mental models and deduction. Trends in Cognitive Sciences 5 (10): 434-442. Johnson-Laird, P. N., & Byrne, R. M. J. 1991. Deduction. Hove, UK: Lawrence Erlbaum. Johnson-Laird, P. N., and F. Savary. 1996. Illusory preferences about probabilities. Acta
Psychologica 93: 69-90. __________. 1999. Illusory inferences: A novel class of erroneous deductions. Cognition 71:
191-229. Kachelmeier, S. 1991. A laboratory market investigation of the demand for strategic auditing.
Auditing: Journal of Practice and Theory 10: 25-48. Kachelmeier, S. 1996. Discussion of “Tax advice and reporting under uncertainty: Theory and
experimental evidence.” Contemporary Accounting Research 13 (Spring): 81-89. Kachelmeier, S. and R. King. 2002. Using laboratory experiments to evaluate accounting policy
issues. Forthcoming in Accounting Horizons. Kadous, K., J. Kennedy, and M. Peecher. 2003. The effect of quality assessment and directional
goal commitment on auditors’ acceptance of client-preferred accounting methods, Forthcoming The Accounting Review.
Page
30
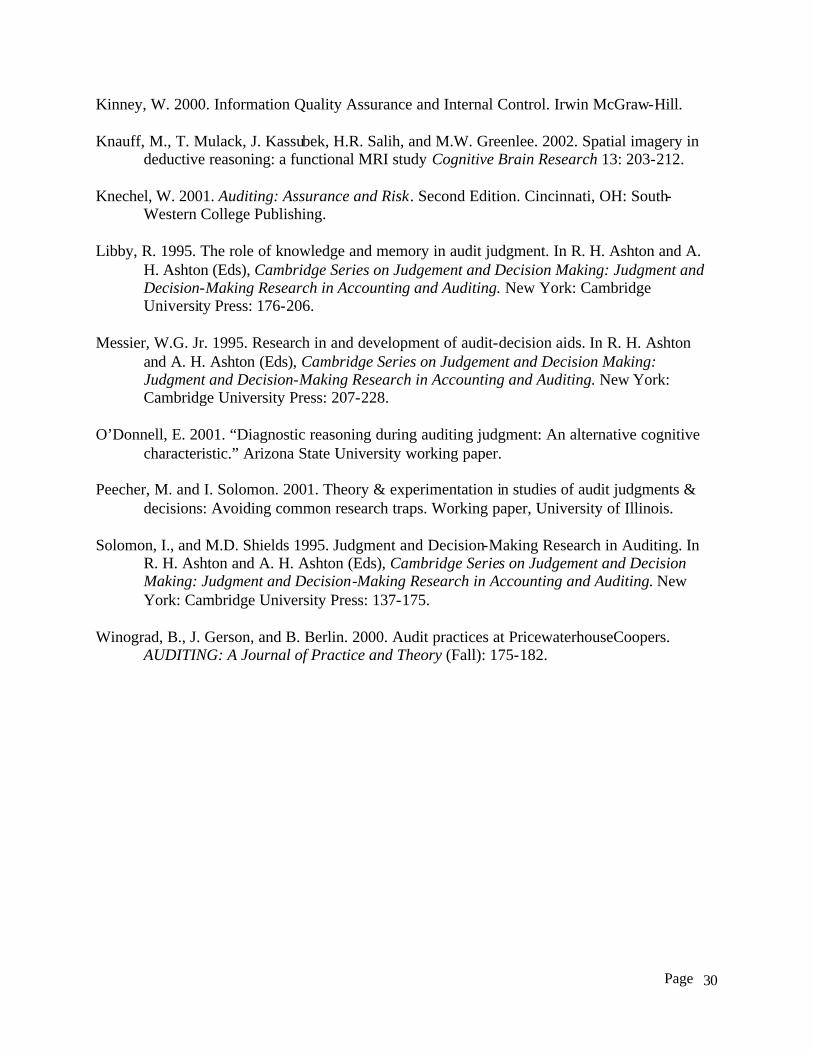
Kinney, W. 2000. Information Quality Assurance and Internal Control. Irwin McGraw-Hill. Knauff, M., T. Mulack, J. Kassubek, H.R. Salih, and M.W. Greenlee. 2002. Spatial imagery in
deductive reasoning: a functional MRI study Cognitive Brain Research 13: 203-212. Knechel, W. 2001. Auditing: Assurance and Risk. Second Edition. Cincinnati, OH: South-
Western College Publishing. Libby, R. 1995. The role of knowledge and memory in audit judgment. In R. H. Ashton and A.
H. Ashton (Eds), Cambridge Series on Judgement and Decision Making: Judgment and Decision-Making Research in Accounting and Auditing. New York: Cambridge University Press: 176-206.
Messier, W.G. Jr. 1995. Research in and development of audit-decision aids. In R. H. Ashton
and A. H. Ashton (Eds), Cambridge Series on Judgement and Decision Making: Judgment and Decision-Making Research in Accounting and Auditing. New York: Cambridge University Press: 207-228.
O’Donnell, E. 2001. “Diagnostic reasoning during auditing judgment: An alternative cognitive
characteristic.” Arizona State University working paper. Peecher, M. and I. Solomon. 2001. Theory & experimentation in studies of audit judgments &
decisions: Avoiding common research traps. Working paper, University of Illinois. Solomon, I., and M.D. Shields 1995. Judgment and Decision-Making Research in Auditing. In
R. H. Ashton and A. H. Ashton (Eds), Cambridge Series on Judgement and Decision Making: Judgment and Decision-Making Research in Accounting and Auditing. New York: Cambridge University Press: 137-175.
Winograd, B., J. Gerson, and B. Berlin. 2000. Audit practices at PricewaterhouseCoopers.
AUDITING: A Journal of Practice and Theory (Fall): 175-182.
Page
31
FIGURE 1 Panel A: Auditor's Computer Screen Under the BOT Setting
Panel B: Auditor's Computer Screen Under the TOP Setting
Page
32
FIGURE 2: Subjects’ Reporting Accuracy Under TOP and BOT Panel A: Part 1
LE: If Yellow is - OR (Blue AND (Red OR Green)) are -, then the state is BAD (5, 7)*
LE: If Blue is - OR (Green AND (Red OR Yellow)) are -, then the state is BAD (3, 4)
Panel B: Part 2
LE: If Blue is - OR (Green AND (Red OR Yellow)) are -, then the state is BAD (3, 4)
LE: If Yellow is - OR (Blue AND (Red OR Green)) are -, then the state is BAD (5, 7)
*MMT-ERROR rounds are in parentheses
0.0%
20.0%
40.0%
60.0%
80.0%
100.0%
120.0%
0 2 4 6 8 10Round
Per
cen
tag
e C
orr
ect,
Ave
rag
e O
ver
Su
bje
cts
BOTTOP
0.0%
20.0%
40.0%
60.0%
80.0%
100.0%
120.0%
0 2 4 6 8 10Round
BOT
TOP
0.0%
20.0%
40.0%
60.0%
80.0%
100.0%
120.0%
0 2 4 6 8 10Round
Per
cen
tag
e C
orr
ect,
Ave
rag
e O
ver
Su
bje
cts
BOTTOP
0.0%
20.0%
40.0%
60.0%
80.0%
100.0%
120.0%
0 2 4 6 8 10Round
Per
cen
tag
e C
orr
ect,
Ave
rag
e O
ver
Su
bje
cts
BOTTOP
Page 28
FIGURE 3: Subjects’ Average Reporting Accuracy Under TOP-BOT and BOT-TOP in Parts 1 and 2
Panel A: All Rounds
Panel A: MMT-ERROR Rounds and REGULAR Rounds
30
40
50
60
70
80
90
100
Part 1 Part 2
REGULAR
MMT-ERROR
30
40
50
60
70
80
90
100
Part 1 Part 2
TOP-BOT BOT-TOP
TOP-BOT
BOT-TOP
Page
29
FIGURE 4: Subjects’ Average Reporting Accuracy Under TOP and BOT for SW and DW in Parts 3
75%
77%
79%
81%
83%
85%
87%
89%
91%
93%
95%
TOP BOT
SW
DW
Page
30
TABLE 1 Design
Designations for the four settings
(number of subjects)
Part 1
(10 rounds)
Part 2
(10 rounds)
Part 3
(10 rounds)
Part 4
(10 rounds) TOP-BOT/SW TOP setting BOT setting
11 subjects LE-1/1 LE-1/2 1
11 subjects LE-1/2 LE-1/1
Choice setting LE-1/3
Choice setting LE-1/4
TOP-BOT/DW TOP setting BOT setting 11 subjects LE-1/1 LE-1/2
2
11 subjects LE-1/2 LE-1/1
Choice setting LE-2/1
Choice setting LE-2/2
BOT-TOP/SW BOT setting TOP setting 11 subjects LE-1/1 LE-1/2
3
11 subjects LE-1/2 LE-1/1
Choice setting LE-1/3
Choice setting LE-1/4
BOT-TOP/DW BOT setting TOP setting 11 subjects LE-1/1 LE-1/2
4
11 subjects LE-1/2 LE-1/1
Choice setting LE-2/1
Choice setting LE-2/2
TOP the top-down audit approach, operationalized by providing auditors with a template of the logical
expression to be used with records to infer the underlying logical expression
BOT the bottom-up audit approach, operationalized by not providing auditors with a template of the logical expression and auditors only have records to infer the underly ing logical expression
SW static world (use LE-1 in all 4 parts of the experiment)
DW dynamic world (use LE-1 in Parts 1 and 2 but LE-2 in Parts 3 and 4)
LE logical expressions
LE-1 template of the LE configuration A OR (B AND (C OR D))
LE-2 template of the LE configuration A AND (B OR (C AND D))
LE-1/1 logical expression with configuration LE-1 and the role of each account is specified in If Yellow is - OR if (Blue AND (Green OR Red)) are -, then the state is BAD
LE-1/2 logical expression with configuration LE-1 and the role of each account is specified in If Blue is - OR if (Green AND (Yellow OR Red)) are -, then the state is BAD
LE-1/3 logical expression with configuration LE-1 and the role of each account is specified in If Green is - OR if (Yellow AND (Blue OR Red)) are -, then the state is BAD
LE-1/4 logical expression with configuration LE-1 and the role of each account is specified in If Yellow is - OR if (Red AND (Blue OR Green)) are -, then the state is BAD
LE-2/1 logical expression with configuration LE-2 and the role of each account is specified in If Green AND (Yellow OR (Blue AND Red)) are -, then the state is BAD
LE-2/2 logical expression with configuration LE-2 and the role of each account is specified in If Yellow AND (Red OR (Blue AND Green)) are -, then the state is BAD
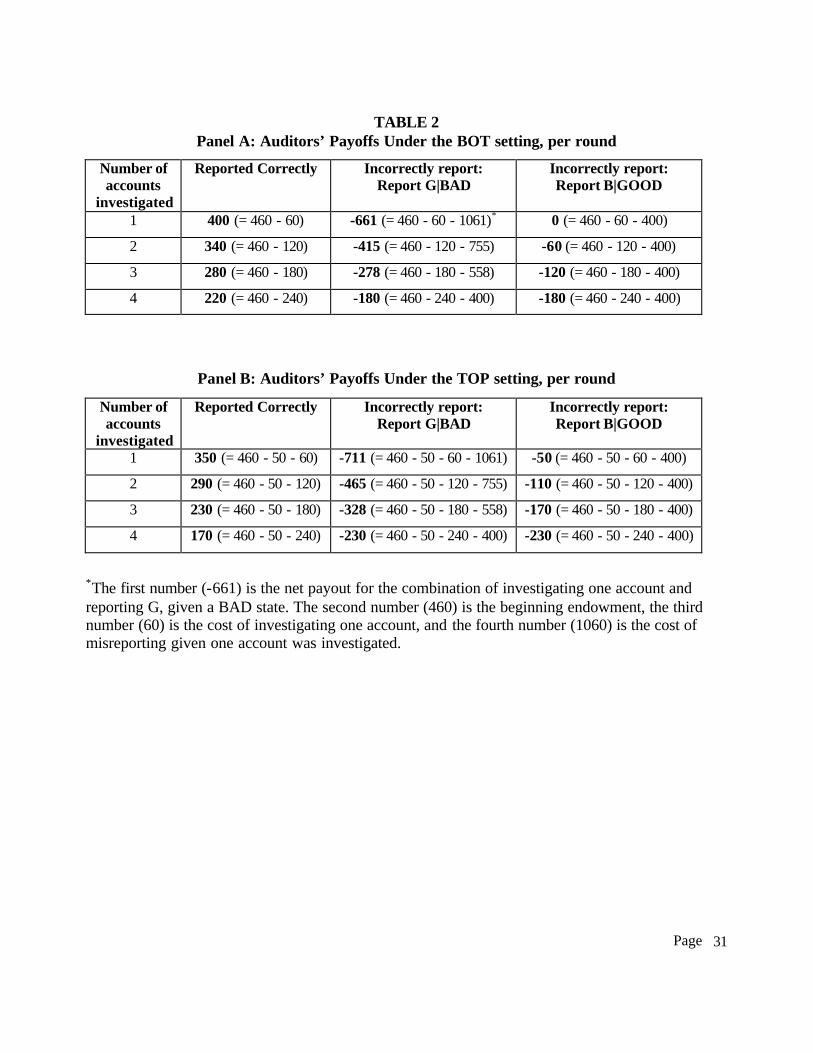
Page
31
TABLE 2
Panel A: Auditors’ Payoffs Under the BOT setting, per round
Number of accounts
investigated
Reported Correctly Incorrectly report: Report G|BAD
Incorrectly report: Report B|GOOD
1 400 (= 460 - 60) -661 (= 460 - 60 - 1061)* 0 (= 460 - 60 - 400)
2 340 (= 460 - 120) -415 (= 460 - 120 - 755) -60 (= 460 - 120 - 400)
3 280 (= 460 - 180) -278 (= 460 - 180 - 558) -120 (= 460 - 180 - 400)
4 220 (= 460 - 240) -180 (= 460 - 240 - 400) -180 (= 460 - 240 - 400)
Panel B: Auditors’ Payoffs Under the TOP setting, per round
Number of accounts
investigated
Reported Correctly Incorrectly report: Report G|BAD
Incorrectly report: Report B|GOOD
1 350 (= 460 - 50 - 60) -711 (= 460 - 50 - 60 - 1061) -50 (= 460 - 50 - 60 - 400)
2 290 (= 460 - 50 - 120) -465 (= 460 - 50 - 120 - 755) -110 (= 460 - 50 - 120 - 400)
3 230 (= 460 - 50 - 180) -328 (= 460 - 50 - 180 - 558) -170 (= 460 - 50 - 180 - 400)
4 170 (= 460 - 50 - 240) -230 (= 460 - 50 - 240 - 400) -230 (= 460 - 50 - 240 - 400)
*The first number (-661) is the net payout for the combination of investigating one account and reporting G, given a BAD state. The second number (460) is the beginning endowment, the third number (60) is the cost of investigating one account, and the fourth number (1060) is the cost of misreporting given one account was investigated.
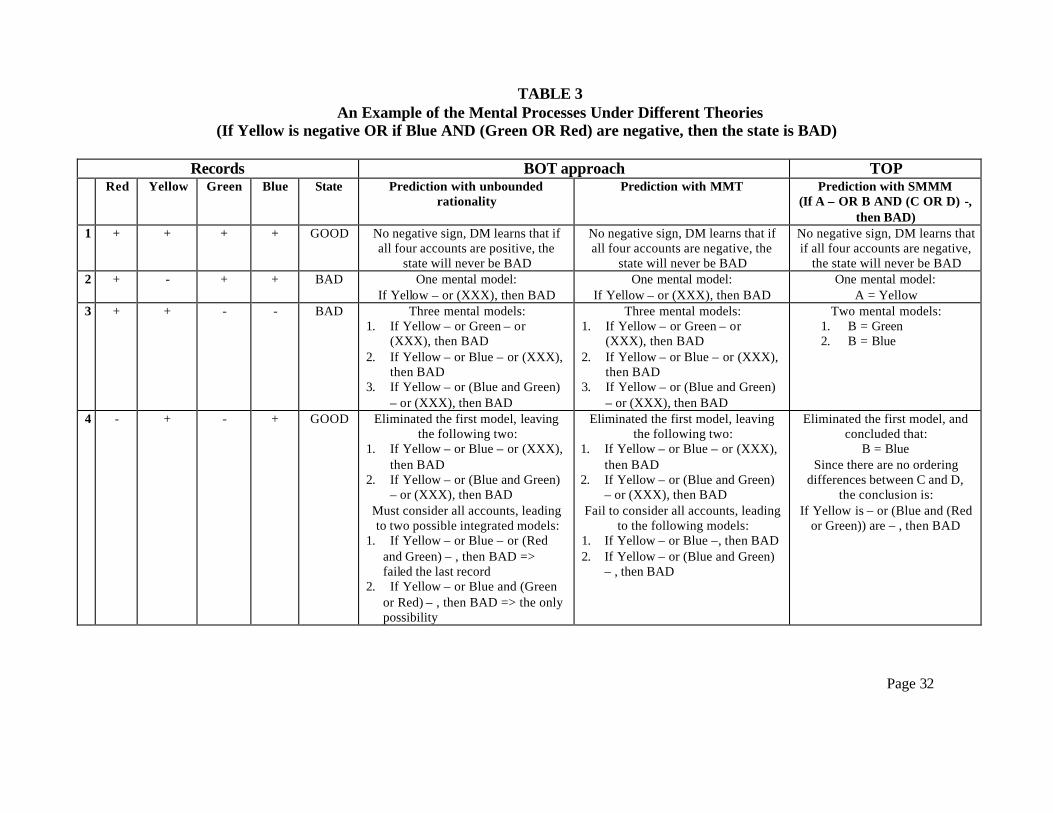
Page 32
TABLE 3 An Example of the Mental Processes Under Different Theories
(If Yellow is negative OR if Blue AND (Green OR Red) are negative, then the state is BAD)
Records BOT approach TOP Red Yellow Green Blue State Prediction with unbounded
rationality Prediction with MMT Prediction with SMMM
(If A – OR B AND (C OR D) -, then BAD)
1 + + + + GOOD No negative sign, DM learns that if all four accounts are positive, the
state will never be BAD
No negative sign, DM learns that if all four accounts are negative, the
state will never be BAD
No negative sign, DM learns that if all four accounts are negative,
the state will never be BAD 2 + - + + BAD One mental model:
If Yellow – or (XXX), then BAD One mental model:
If Yellow – or (XXX), then BAD One mental model:
A = Yellow 3 + + - - BAD Three mental models:
1. If Yellow – or Green – or (XXX), then BAD
2. If Yellow – or Blue – or (XXX), then BAD
3. If Yellow – or (Blue and Green) – or (XXX), then BAD
Three mental models: 1. If Yellow – or Green – or
(XXX), then BAD 2. If Yellow – or Blue – or (XXX),
then BAD 3. If Yellow – or (Blue and Green)
– or (XXX), then BAD
Two mental models: 1. B = Green 2. B = Blue
4 - + - + GOOD Eliminated the first model, leaving the following two:
1. If Yellow – or Blue – or (XXX), then BAD
2. If Yellow – or (Blue and Green) – or (XXX), then BAD
Must consider all accounts, leading to two possible integrated models:
1. If Yellow – or Blue – or (Red and Green) – , then BAD => failed the last record
2. If Yellow – or Blue and (Green or Red) – , then BAD => the only possibility
Eliminated the first model, leaving the following two:
1. If Yellow – or Blue – or (XXX), then BAD
2. If Yellow – or (Blue and Green) – or (XXX), then BAD
Fail to consider all accounts, leading to the following models:
1. If Yellow – or Blue –, then BAD 2. If Yellow – or (Blue and Green)
– , then BAD
Eliminated the first model, and concluded that:
B = Blue Since there are no ordering
differences between C and D, the conclusion is:
If Yellow is – or (Blue and (Red or Green)) are – , then BAD
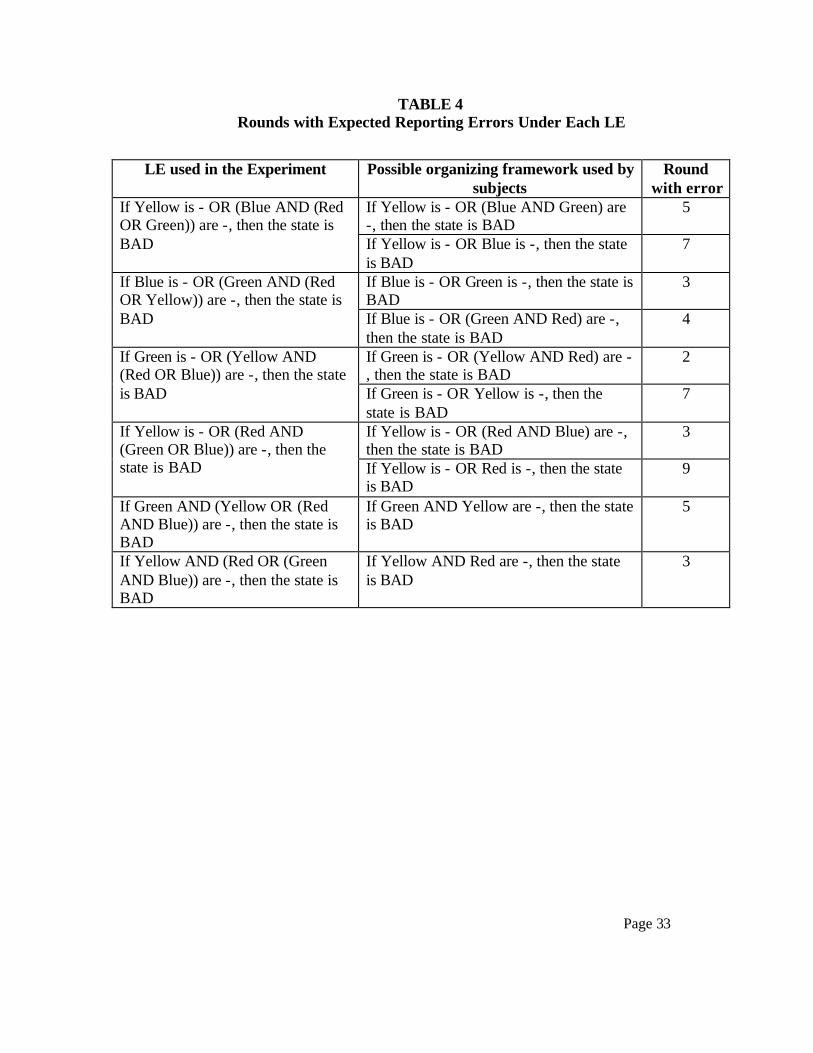
Page 33
TABLE 4 Rounds with Expected Reporting Errors Under Each LE
LE used in the Experiment Possible organizing framework used by subjects
Round with error
If Yellow is - OR (Blue AND Green) are -, then the state is BAD
5 If Yellow is - OR (Blue AND (Red OR Green)) are -, then the state is BAD If Yellow is - OR Blue is -, then the state
is BAD 7
If Blue is - OR Green is -, then the state is BAD
3 If Blue is - OR (Green AND (Red OR Yellow)) are -, then the state is BAD If Blue is - OR (Green AND Red) are -,
then the state is BAD 4
If Green is - OR (Yellow AND Red) are -, then the state is BAD
2 If Green is - OR (Yellow AND (Red OR Blue)) are -, then the state is BAD If Green is - OR Yellow is -, then the
state is BAD 7
If Yellow is - OR (Red AND Blue) are -, then the state is BAD
3 If Yellow is - OR (Red AND (Green OR Blue)) are -, then the state is BAD If Yellow is - OR Red is -, then the state
is BAD 9
If Green AND (Yellow OR (Red AND Blue)) are -, then the state is BAD
If Green AND Yellow are -, then the state is BAD
5
If Yellow AND (Red OR (Green AND Blue)) are -, then the state is BAD
If Yellow AND Red are -, then the state is BAD
3
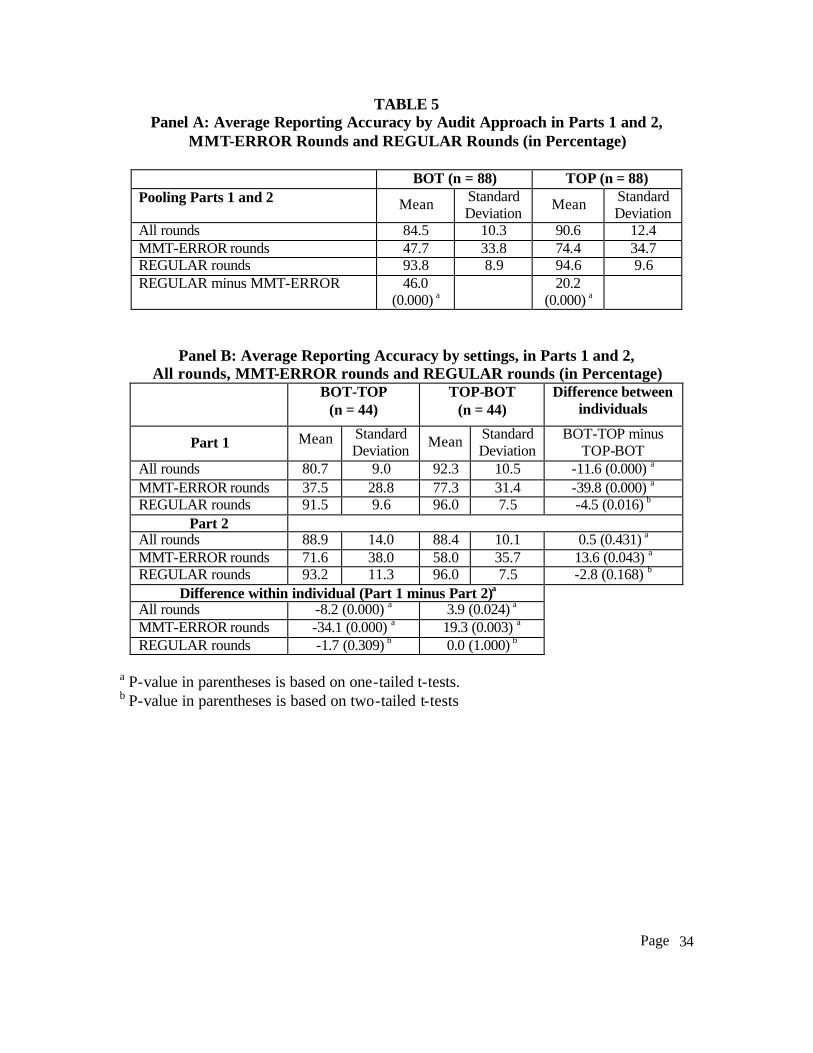
Page
34
TABLE 5 Panel A: Average Reporting Accuracy by Audit Approach in Parts 1 and 2,
MMT-ERROR Rounds and REGULAR Rounds (in Percentage)
BOT (n = 88) TOP (n = 88) Pooling Parts 1 and 2 Mean Standard
Deviation Mean Standard Deviation
All rounds 84.5 10.3 90.6 12.4 MMT-ERROR rounds 47.7 33.8 74.4 34.7 REGULAR rounds 93.8 8.9 94.6 9.6 REGULAR minus MMT-ERROR 46.0
(0.000) a 20.2
(0.000) a
Panel B: Average Reporting Accuracy by settings, in Parts 1 and 2, All rounds, MMT-ERROR rounds and REGULAR rounds (in Percentage)
BOT-TOP (n = 44)
TOP-BOT (n = 44)
Difference between individuals
Part 1 Mean Standard Deviation Mean Standard
Deviation BOT-TOP minus
TOP-BOT All rounds 80.7 9.0 92.3 10.5 -11.6 (0.000) a MMT-ERROR rounds 37.5 28.8 77.3 31.4 -39.8 (0.000) a REGULAR rounds 91.5 9.6 96.0 7.5 -4.5 (0.016) b
Part 2 All rounds 88.9 14.0 88.4 10.1 0.5 (0.431) a MMT-ERROR rounds 71.6 38.0 58.0 35.7 13.6 (0.043) a REGULAR rounds 93.2 11.3 96.0 7.5 -2.8 (0.168) b
Difference within individual (Part 1 minus Part 2)a
All rounds -8.2 (0.000) a 3.9 (0.024) a MMT-ERROR rounds -34.1 (0.000) a 19.3 (0.003) a REGULAR rounds -1.7 (0.309) b 0.0 (1.000) b
a P-value in parentheses is based on one-tailed t-tests. b P-value in parentheses is based on two-tailed t-tests

Page 35
TABLE 6 Average Audit Accuracy, Confidence, and Time Used in Part 3, by SW and DW
Overall Choose TOP
Choose BOT
Difference TOP-BOT
Number of participants 44 15 29 (14) SW
Average reporting accuracy (percentage) 90.2% 94.0% 88.3% 5.7%
(0.07)a
Number of participants 44 14 30 (16) DW
Average reporting accuracy (percentage) 83.0% 90.7% 79.3% 11.4%
(0.03)a Difference SW-DW
Average reporting accuracy (percentage)
7.3% (0.02)a
3.3% (0.24)a
8.9% (0.02)a
a P-value in parentheses is based on one-tailed t-tests.

Page
36
TABLE 7
Results for Predicting Auditors’ Choice of TOP Approach in Part 3 Dependent Variable = CHOICE_P3
Expected Sign
Model (1) Estimated
Coefficients (Wald Chi-Square)
Model (2) Estimated
Coefficients (Wald Chi-Square)
Model (3) Estimated
Coefficients (Wald Chi-Square)
ß0 Intercept +/- -1.4186*** (16.9503)
-1.3602*** (16.4416)
-1.0995** (5.7226)
ß1 ?REP_ACC + 0.7482*** (10.5409)
0.8020*** (12.1444)
0.7240*** (8.5319)
ß2 ?TIME - -0.00686 (1.4715)
ß3 ?CONF + 0.5843*** (8.7839)
ß4 ORDER - -1.4427** (5.8280)
Likelihood Ratio 17.2089 (0.0002)
15.7039 (<.0001)
30.7323 (<.0001)
Max-rescaled R-Square
0.2472
0.2275
0.4102
c 0.765 0.735 0.828
**, *** Indicates a significant level at 5 percent level or less, and 1 percent level or less respectively.
The variables are defined as follows:
CHOICE_P3 = 1 if TOP is selected; 0 otherwise ?REP_ACC = Percentage of correct reports under the TOP setting minus Percentage of
correct reports under the BOT setting, using data from Parts 1 and 2 of the experiment
?TIME = Difference in the average minutes used under the TOP setting and that under the BOT setting, using data from Parts 1 and 2 of the experiment
?CONF = Difference in the average of an auditor’s confidence in a round under the TOP setting and that under the BOT setting, using data from Parts 1 and 2 of the experiment
ORDER = 1 if the auditor was given the TOP setting in Part 1; 0 otherwise

Page
37
APPENDIX A
Example to Illustrate the MMT with Pictorial Representation
Consider the following two premises: Premise 1: None of A is a B
Premise 2: All Bs are C What can you conclude about A and C?
Johnson-Laird 2001 finds that DMs typically draw conclusions such as None of A is a C, which is incompatible with the premises because Cs that are not Bs could be As. DMs need to construct the mental model about the valid connection between As and Cs, which is ‘Some of Cs are not As.’ However, they may draw incorrect conclusions from the second premise to mean ‘All the Cs are Bs.’ A pictorial representation of the premises and the four possible mental models are shown below: Premise 1: None of A is B
Premise 2: All of Bs are C
OR
What can you conclude about A and C?
Case 1 Case 2
Case 3 Case 4
A B
C B
B=C
B
B=C
B
A C A
C A
B
C
A
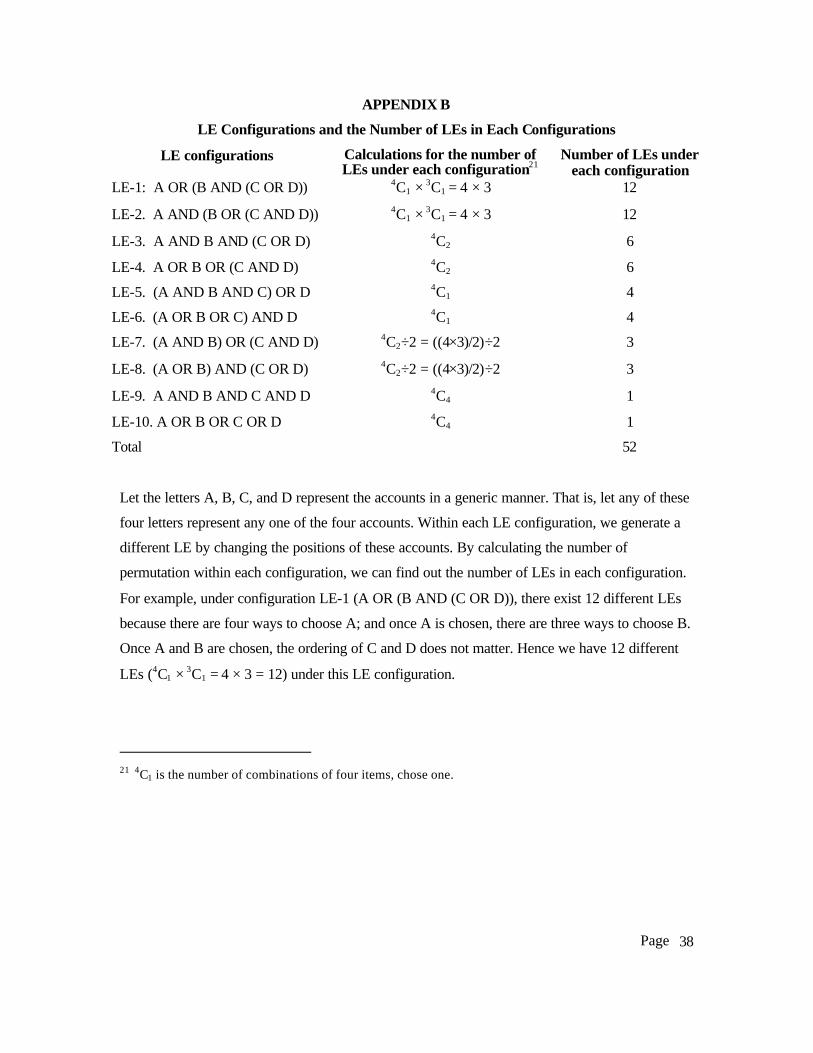
Page
38
APPENDIX B
LE Configurations and the Number of LEs in Each Configurations
LE configurations Calculations for the number of LEs under each configuration21
Number of LEs under each configuration
LE-1: A OR (B AND (C OR D)) 4C1 × 3C1 = 4 × 3 12
LE-2. A AND (B OR (C AND D)) 4C1 × 3C1 = 4 × 3 12
LE-3. A AND B AND (C OR D) 4C2 6
LE-4. A OR B OR (C AND D) 4C2 6
LE-5. (A AND B AND C) OR D 4C1 4
LE-6. (A OR B OR C) AND D 4C1 4
LE-7. (A AND B) OR (C AND D) 4C2÷2 = ((4×3)/2)÷2 3
LE-8. (A OR B) AND (C OR D) 4C2÷2 = ((4×3)/2)÷2 3
LE-9. A AND B AND C AND D 4C4 1
LE-10. A OR B OR C OR D 4C4 1
Total 52
Let the letters A, B, C, and D represent the accounts in a generic manner. That is, let any of these
four letters represent any one of the four accounts. Within each LE configuration, we generate a
different LE by changing the positions of these accounts. By calculating the number of
permutation within each configuration, we can find out the number of LEs in each configuration.
For example, under configuration LE-1 (A OR (B AND (C OR D)), there exist 12 different LEs
because there are four ways to choose A; and once A is chosen, there are three ways to choose B.
Once A and B are chosen, the ordering of C and D does not matter. Hence we have 12 different
LEs (4C1 × 3C1 = 4 × 3 = 12) under this LE configuration.
21 4C1 is the number of combinations of four items, chose one.