an exhumation history of continents over billion-year...
TRANSCRIPT

DOI: 10.1126/science.1213496, 73 (2012);335 Science
, et al.Terrence J. BlackburnAn Exhumation History of Continents over Billion-Year Time Scales
This copy is for your personal, non-commercial use only.
clicking here.colleagues, clients, or customers by , you can order high-quality copies for yourIf you wish to distribute this article to others
here.following the guidelines
can be obtained byPermission to republish or repurpose articles or portions of articles
): January 5, 2012 www.sciencemag.org (this infomation is current as of
The following resources related to this article are available online at
http://www.sciencemag.org/content/335/6064/73.full.htmlversion of this article at:
including high-resolution figures, can be found in the onlineUpdated information and services,
http://www.sciencemag.org/content/suppl/2012/01/05/335.6064.73.DC1.html can be found at: Supporting Online Material
http://www.sciencemag.org/content/335/6064/73.full.html#ref-list-1, 3 of which can be accessed free:cites 24 articlesThis article
registered trademark of AAAS. is aScience2012 by the American Association for the Advancement of Science; all rights reserved. The title
CopyrightAmerican Association for the Advancement of Science, 1200 New York Avenue NW, Washington, DC 20005. (print ISSN 0036-8075; online ISSN 1095-9203) is published weekly, except the last week in December, by theScience
on
Janu
ary
5, 2
012
www.
scie
ncem
ag.o
rgDo
wnlo
aded
from
than in the c direction, thus resulting in the thinhexagonal-plate form due to the limited crystalgrowth via the layer-by-layer mechanism alongthe c direction (29).
The homogeneity of the two samples, ultra-small (6- to 15-nm) and nanosized (50- to -70 nm)EMT crystals, is illustrated at two different mag-nifications in Fig. 4, A to D. The hexagonal mor-phology of both samples is evident. Moreover,their colloidal stability was examined by mea-suring the zeta potential values, which are equalto –45 mV. This negative charge leads to electro-static stabilization of the hexagonal nanoparticles.
Why has EMT never been observed inorganic-free synthesis solutions? The reason maybe surprisingly simple. When the same synthesissolutions as described above were heated at thesame temperature for extended times or at highertemperatures, the nanoscale EMT materials con-verted into the well-known FAU and SOD struc-tures (fig. S2). We propose that under appropriateconditions the EMT is the first kinetic, metastableproduct in this synthesis field, followed by con-version into the more stable cubic FAU and moredense SOD structures. This hypothesis is strong-ly supported by several reports on EMT/FAU in-tergrowths (9–14). Indeed, we suggest that it maybe possible to capture other important zeolitephases that occur as intergrowths by exploitingthe very early stages of synthesis and thus avoid-ing the use of organic reagents that are commonlyneeded to stabilize the desired phases.
From an environmental perspective, the syn-thesis of EMT zeolite presented here is extremelyattractive, as the nanocrystals can be easily syn-thesized at very high yield at near ambient tem-perature without using any organic templates,suggesting that scale-up of an energy-efficient
synthesis would be easily feasible. These nano-scale EMT materials offer exciting opportunitiesfor both fundamental study and potential indus-trial applications. The possible green mass pro-duction of EMT-type zeolite provides excellentopportunities for applications in catalysis, ad-sorption, and separations involving larger mole-cules and for designing thin films, membranes, ornanoscale devices.
References and Notes1. M. E. Davis, Nature 417, 813 (2002).2. D. W. Breck, Zeolites and Molecular Sieves System
(Wiley, New York, 1974).3. J. Choi et al., Science 325, 590 (2009).4. M. A. Snyder, M. Tsapatsis, Angew. Chem. Int. Ed. 46,
7560 (2007).5. Ch. Baerlocher, L. B. McCusker, D. H. Olson, in Atlas of
Zeolite Framework Types (Elsevier, Amsterdam,Netherlands, ed. 6, 2007), p. 123.
6. D. E. W. Vaughan, in Properties and Applications ofZeolites, R. P. Townsend, Ed. (The Chemical Society,London, 1980), p. 294.
7. F. Dougnier, J. Patarin, J.-L. Guth, D. Anglerot, Zeolites12, 160 (1992).
8. S. Liu, L. Li, C. Li, X. Xiong, F.-S. Xiao, J. Porous Mater.15, 295 (2008).
9. A. Haas, D. A. Harding, J. R. D. Nee, MicroporousMesoporous Mater. 28, 325 (1999).
10. M. G. Barrett, D. E. W. Vaughan, UK Patent GB2,076,793 A (1981).
11. D. E. W. Vaughan, European Patent 0,351,461 (1989).12. J. M. Newsam, M. M. J. Treacy, D. E. W. Vaughan,
K. G. Strohmaier, W. J. Mortier, Chem. Commun.493 (1989).
13. G. T. Kokotailo, J. Ciric, Adv. Chem. Ser. 101, 109 (1971).14. J. A. Martens, P. A. Jacobs, S. Cartlidge, Zeolites 9, 423
(1989).15. F. Dougnier, J. L. Guth, Microporous Mater. 6, 79 (1996).16. R. Wendelbo, M. Stöcker, H. Junggreen, H. B. Mostad,
Norwegian Patent Application No. 964988 (2001).17. R. Wendelbo, M. Stöcker, H. Junggreen, H. B. Mostad,
D. E. Akporiaye, Microporous Mesoporous Mater. 28,361 (1999).
18. M. Matsukata, K. Kizu, M. Ogura, E. Kikuchi,Cryst. Growth Des. 1, 509 (2001).
19. J. Sun, M. Sun, C. Nie, Q. Li, J. Chem. Soc. Chem.Commun. 2459 (1999).
20. Y. Luo, J. Sun, W. Zhao, J. Yao, Q. Li, Chem. Mater. 14,1906 (2002).
21. T. Chatelain, J. Patarin, M. Soulard, J. L. Guth, P. Shulz,Zeolites 15, 90 (1995).
22. S. L. Burkett, M. E. Davis, Microporous Mater. 1, 265(1993).
23. S. Mintova, N. H. Olson, V. Valtchev, T. Bein, Science283, 958 (1999).
24. B.-Z. Zhan et al., Chem. Mater. 14, 3636 (2002).25. S. Mintova, M. Reinelt, T. H. Metzger, J. Senker, T. Bein,
Chem. Commun. 2003, 326 (2003).26. L. Tosheva, V. Valtchev, Chem. Mater. 17, 2494 (2005).27. J. L. Casci, Microporous Mesoporous Mater. 82, 217
(2005).28. A. Le Bail, J. Non-Cryst. Solids 183, 39 (1995).29. G. González, C. S. González, W. Stracke, R. Reichelt,
L. García, Microporus Mesoporus Mater. 101, 30(2007).
30. D. Chateigner, in Combined Analysis: Structure-Texture-Microstructure-Phase-Stresses-Reflectivity Determinationby X-ray and Neutron Scattering (Wiley, New York,2010), p. 410.
31. L. Lutterotti, S. Matthies, H.-R. Wenk, in MAUD (MaterialAnalysis Using Diffraction): A User Friendly JAVA Programfor Rietveld Texture Analysis and More, in Textures ofMaterials, J. A. Szpunar, Ed. (National Research CouncilCanada Research Press, Ottawa, 2002), p. 1599.
32. N. C. Popa, J. Appl. Cryst. 31, 176 (1998).
Acknowledgments: We thank S. Schmidt (LMU) for collectingthe TEM data and SRIF-ANR-06-NANO-007-01 Region andFEDER of Down Normandy, NIM (Nano-Initiative-Munich), forfinancial support.
Supporting Online Materialwww.sciencemag.org/cgi/content/full/science.1214798/DC1SOM TextFigs. S1 to S12Tables S1 to S5
3 October 2011; accepted 11 November 2011Published online 8 December 2011;10.1126/science.1214798
An Exhumation History of Continentsover Billion-Year Time ScalesTerrence J. Blackburn,1* Samuel A. Bowring,1 J. Taylor Perron,1 Kevin H. Mahan,2
Francis O. Dudas,1 Katherine R. Barnhart2
The continental lithosphere contains the oldest and most stable structures on Earth, where fragmentsof ancient material have eluded destruction by tectonic and surface processes operating over billions ofyears. Although present-day erosion of these remnants is slow, a record of how they have uplifted, eroded,and cooled over Earth’s history can provide insight into the physical properties of the continents andthe forces operating to exhume them over geologic time. We constructed a continuous record of ancientlithosphere cooling with the use of uranium-lead (U-Pb) thermochronology on volcanically exhumedlower crustal fragments. Combining these measurements with thermal and Pb-diffusion models constrainsthe range of possible erosion histories. Measured U-Pb data are consistent with extremely low erosionrates persisting over time scales approaching the age of the continents themselves.
The preservation of fragments of stableArchean continental lithosphere, or “cra-tons,” over geologic time is intimately
linked with the presence of a low-density mantleroot that supports and protects the overlyingcrust (1). The long-term stability of these rootshas been attributed to an apparent “isopycnic”
balance between the negative thermal buoyancyfrom contraction during cooling and the pos-itive chemical buoyancy from the depletion ofthe root’s denser basaltic component during cra-ton formation (1, 2). Despite this stability, cra-tons must survive exposure to surface processesworking to erode on durations lasting billions
of years, a process that results in continued rockexhumation toward Earth’s surface. Althoughpresent-day erosion within these stable regionsis low, the assembly of continental masses throughmountain-building processes (3) requires thatthese terranes experienced periods of rapid ero-sion after the construction of topographicallyhigh mountain belts. An erosional history record-ing the duration of this early rapid erosional phaseand the timing and rate of transition to the slowerosion observed today will allow us to under-stand more about the composition and density ofthe lithosphere, its relationship with the underly-ing mantle, and the thermal, buoyant, and me-chanical forces operating to exhume or bury thecontinents over the geologic history of Earth.
Because the exhumation or burial of Earth’ssurface has a direct effect on the rate of heatloss within the lithosphere, a continuous record
1Earth Atmospheric and Planetary Sciences, MassachusettsInstitute of Technology, Cambridge, MA 02139, USA. 2Depart-ment of Geological Sciences, University of Colorado, Boulder,CO 80309, USA.
*To whom correspondence should be addressed. E-mail:[email protected]
www.sciencemag.org SCIENCE VOL 335 6 JANUARY 2012 73
REPORTS
on
Janu
ary
5, 2
012
www.
scie
ncem
ag.o
rgDo
wnlo
aded
from

of lithosphere exhumation can be reconstructedthrough the use of a temperature-sensitive radio-metric dating technique known as thermochronol-ogy. The combination of thermochronologic datawith thermal models for heat transfer in the litho-sphere can be used tomeasure the processes operat-ing to cool or heat the lithosphere in the geologicpast (4). Thermochronologic studies have typicallyused geochronologic systems sensitive to cooling attemperatures below 110°C. These techniques aremost useful for the measurement of cooling at-tributable to deformation in the upper crust anderosion of topography (5). A thermochronologicsystem sensitive to cooling at higher temperaturesand greater depths is insensitive to the “noise” as-
sociatedwith near-surface cooling and thereforeprovides a measure of the background rate of ero-sion or burial associated with the vertical motionsof a craton. The U-Pb thermochronologic systemis sensitive to cooling at temperatures of ~400° to650°C, corresponding to lower crustal depths incratonic regions of ~20 to 50 km (6). Here, we usedthis technique to reconstruct an ancient and long-lived thermal history of volcanically exhumed lowercrustal fragments—samples that resided at depth forbillions of years before recent volcanism transport-ed them to the surface as xenoliths. A high-fidelityreconstruction of time-temperature paths for thesesamples is produced using the U-Pb system’s dualdecay scheme,where parent isotopes 238U and 235U
decay at different rates to daughter isotopes 206Pband 207Pb, respectively. Coupling this dual isotopicsystem with diffusion’s length scale dependen-cy, which causes different crystal sizes to retainPb over different absolute time scales, results ina set of daughter isotopic compositions for arange of crystal sizes that is unique to the time-temperature history of the sample (7). The mea-sured and modeled U-Pb results presented hereexplore a range of crystal grain sizes to exploitthese advantages (8).
The thermal processes operating to cool orheat the deep lithosphere include conductiveheat loss, heat input from the underlying man-tle, heat production from the decay of heat-
Fig. 1. (A and B) Thermal history for the lithosphere (A) used to produce time-temperature paths (B) for samples at middle to lower crustal depths. (C and D) Time-temperature paths are used to calculate modeled U-Pb thermochronologic data foreach sample depth (colors) and over a range of grain sizes. The “concordia” curve in(C) represents the daughter-to-parent ratios of 235U-207Pb and 238U-206Pb for a U-Pbsystem that remains closed throughout Earth history. The shallowest samples cool
quickly through the Pb partial retention zone (PRZ), yielding old 238U-206Pb dates thatplot on concordia (C) or yield ! U-Pb values close to zero (D). The deepest samplesreside at temperatures that are too hot for Pb retention in rutile, and thus yieldyounger dates. The middle to lower crust spends a long time in the Pb-PRZ, resultingin discordance (C) and a large apparent offset between the two U-Pb systems (D).The magnitude of ! U-Pb values (D) is correlated with lithosphere exhumation rate.
6 JANUARY 2012 VOL 335 SCIENCE www.sciencemag.org74
REPORTS
on
Janu
ary
5, 2
012
www.
scie
ncem
ag.o
rgDo
wnlo
aded
from

producing elements (HPEs), and cooling orinsulation due to surface erosion or burial, re-spectively. The combined effects of these pro-
cesses on the U and Pb isotopic evolution of aset of rutile crystals can be described with asimple thermal model (8). The modeled litho-
sphere thermal history begins with a steep geo-thermal gradient consistent with formation orreheating during mountain-building events,followed by cooling due to heat loss at the litho-sphere surface (Fig. 1A). The time-temperaturehistories for crustal depths from the thermal mod-el (Fig. 1B) are then used as the input to a modelof Pb production and diffusion (8). ModeledU-Pb thermochronologic data correlate directlywith sample depth (Fig. 1C). Shallow samplescool quickly through the 400° to 600°C rutilethermal window, yielding U-Pb dates that areconsistent with the model start time, whereas thedeepest samples never cool below the Pb closurefor rutile, accumulate no radiogenic Pb, and yieldU-Pb dates of 0 million years ago (Ma) (Fig. 1C).The faster-cooling, shallow samples yield datesthat plot on the “concordia” curve (which rep-resents the daughter-to-parent ratios of 235U-207Pband 238U-206Pb for a U-Pb system that remainsclosed throughout Earth history), indicating agree-ment between the 238U-206Pb and 235U-207Pbsystems and closed-system behavior. Samplesat intermediate depths accumulate differentamounts of radiogenic Pb, depending on depth,forming a curvilinear “discordant” array off theconcordia curve that indicates partially open sys-tem behavior. Mineral grains that spend a longtime in the Pb partial retention zone (PRZ)—atemperature range in which the diffusion andproduction of radiogenic daughters are at ornear a balance—result in the partial retentionof Pb with a range of isotopic compositions(207Pb/206Pb). Awhole-crystal analysis yields anintegrated measure of the internal Pb-diffusionprofile, resulting in the apparent difference be-tween the measured 235U-207Pb and 238U-206Pbdates (hereafter referred to as ! U-Pb). Slowercooling, and thus longer durations in the PRZ,result in a Pb diffusion profile containing a widerrange of 207Pb/206Pb compositions, and thus agreater ! U-Pb age difference (Fig. 1D) (7).Because the vertical advection of lower crustalrocks toward Earth’s surface increases the rate ofcooling at depth, there is a strong correlationbetween the maximum ! U-Pb value and netexhumation, where higher net exhumation ratesyield lower ! U-Pb values (Fig. 1D). The U-Pbsystem’s sensitivity to cooling rate—and, in thisthermal setting, to exhumation rate—is the keyfactor that allows constraints to be placed on thelong-term evolution of continental surfaces.
Along the southwestern edge of the NorthAmerican Craton within Montana, the ArcheanMedicine Hat Block and Wyoming Provincecollided at ~1800 Ma to form the Great FallsTectonic Zone (GFTZ), a Proterozoic suture be-tween the two terranes (9) (Fig. 2B, inset). Low-er crustal xenoliths used in this study werecollected from four ~50 Ma volcanic epicenterswithin each terrane. The volcanic entrainment ofsamples at 50 Ma is so rapid that U/Pb loss dueto volcanic reheating is negligible (7). Lowercrustal U-Pb thermochronologic data yield the“humped” topology of ! U-Pb data predicted by
0 200 400 600 800 1000 1200 1400 16000
20
40
60
80
100
120
238U-206Pb age (Ma)
! U
-Pb
(My)
! U
-Pb
(My)
Modeled data, exhumation rate-2.5 m/My
0.0 m/My
2.5 m/My
rutile,SG02, ~25km
rutile,SG05, ~30km
rutile,SG20, ~40km
Measured data:Medicine Hat Block
Wyoming Province
rutile,HS02, ~35km
titanite,HS01, ~35km
A
0 200 400 600 800 1000 1200 1400 1600 1800 20000
20
40
60
80
100
120
2.0 m/My, -0.003 m/My 2
238U-206Pb age (Ma)
49°0'0"N B
rutile,ROB1, ~45km
rutile,ROB3, ~45km
rutile,ROB5, ~30km
Measured data,GFTZ
rutile,LSC18, ~28km
titanite,ROB9, ~50km
-2.5 m/My
0.0 m/My
Modeled data, exhumation rate
2.5 m/My
Wyoming ProvinceMedicine Hat Block
Great Falls Tectonic Zone
110°
0'0"
W
115°
0'0"
W
45°0'0"N
Fig. 2. Plots of ! U-Pb versus time for measured and modeled lower crustal xenolith data from a northwest-southeast transect through Montana: (A) Archean Medicine Hat Block and Wyoming Province, (B) ProterozoicGreat Falls Tectonic Zone (GFTZ). Sample numbers and geobarometrically determined depths are indicated. Faster-cooling, shallow samples yield older dates with a trend of increasing ! U-Pb in time; deeper samples decreasewith time, consistent with the results predicted by the thermal model (Fig. 1D). Uncertainties on individualanalyses are shown at the 2s level and are dominated by the uncertainty of the 235U-207Pb date. Dashed, dotted,and solid lines mark the forward-modeled U-Pb results with exhumation rates of –2.5 to 2.5 m/My. A dashed-dotline in (A) marks the data produced by an erosional history that decreased in time. The inset in (B) shows asimplified geologic terrane map of Montana; stars mark the xenolith sample location within each geologic terrane.
www.sciencemag.org SCIENCE VOL 335 6 JANUARY 2012 75
REPORTS
on
Janu
ary
5, 2
012
www.
scie
ncem
ag.o
rgDo
wnlo
aded
from
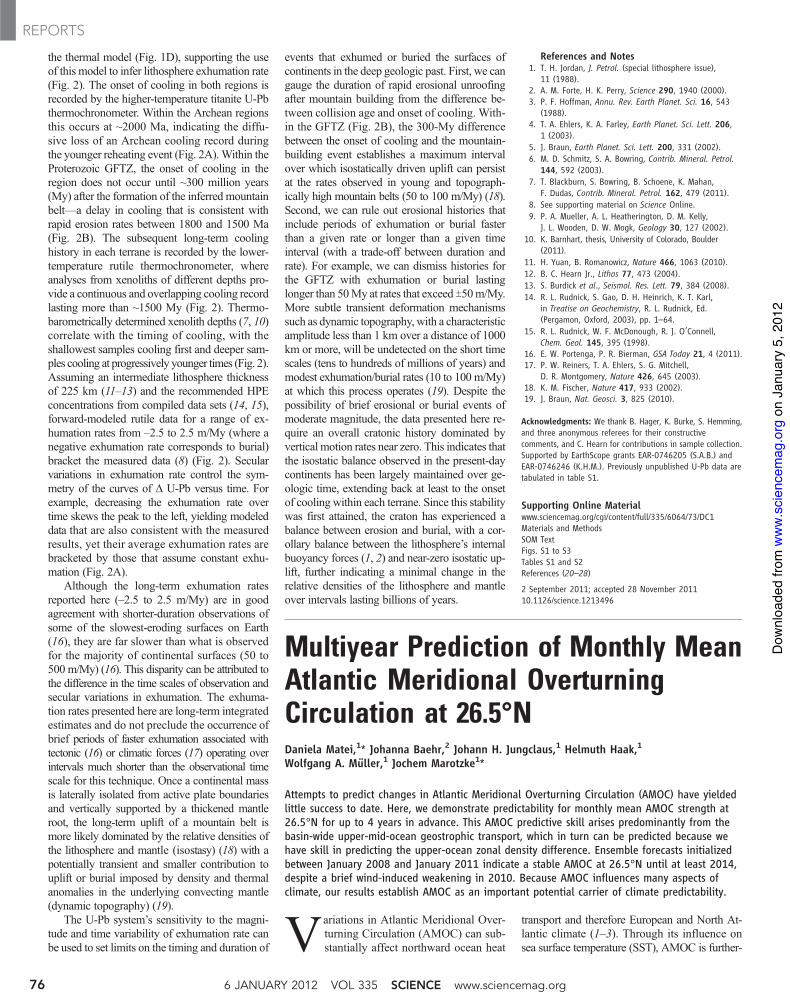
the thermal model (Fig. 1D), supporting the useof this model to infer lithosphere exhumation rate(Fig. 2). The onset of cooling in both regions isrecorded by the higher-temperature titanite U-Pbthermochronometer. Within the Archean regionsthis occurs at ~2000 Ma, indicating the diffu-sive loss of an Archean cooling record duringthe younger reheating event (Fig. 2A).Within theProterozoic GFTZ, the onset of cooling in theregion does not occur until ~300 million years(My) after the formation of the inferred mountainbelt—a delay in cooling that is consistent withrapid erosion rates between 1800 and 1500 Ma(Fig. 2B). The subsequent long-term coolinghistory in each terrane is recorded by the lower-temperature rutile thermochronometer, whereanalyses from xenoliths of different depths pro-vide a continuous and overlapping cooling recordlasting more than ~1500 My (Fig. 2). Thermo-barometrically determined xenolith depths (7, 10)correlate with the timing of cooling, with theshallowest samples cooling first and deeper sam-ples cooling at progressively younger times (Fig. 2).Assuming an intermediate lithosphere thicknessof 225 km (11–13) and the recommended HPEconcentrations from compiled data sets (14, 15),forward-modeled rutile data for a range of ex-humation rates from –2.5 to 2.5 m/My (where anegative exhumation rate corresponds to burial)bracket the measured data (8) (Fig. 2). Secularvariations in exhumation rate control the sym-metry of the curves of ! U-Pb versus time. Forexample, decreasing the exhumation rate overtime skews the peak to the left, yielding modeleddata that are also consistent with the measuredresults, yet their average exhumation rates arebracketed by those that assume constant exhu-mation (Fig. 2A).
Although the long-term exhumation ratesreported here (–2.5 to 2.5 m/My) are in goodagreement with shorter-duration observations ofsome of the slowest-eroding surfaces on Earth(16), they are far slower than what is observedfor the majority of continental surfaces (50 to500 m/My) (16). This disparity can be attributed tothe difference in the time scales of observation andsecular variations in exhumation. The exhuma-tion rates presented here are long-term integratedestimates and do not preclude the occurrence ofbrief periods of faster exhumation associated withtectonic (16) or climatic forces (17) operating overintervals much shorter than the observational timescale for this technique. Once a continental massis laterally isolated from active plate boundariesand vertically supported by a thickened mantleroot, the long-term uplift of a mountain belt ismore likely dominated by the relative densities ofthe lithosphere and mantle (isostasy) (18) with apotentially transient and smaller contribution touplift or burial imposed by density and thermalanomalies in the underlying convecting mantle(dynamic topography) (19).
The U-Pb system’s sensitivity to the magni-tude and time variability of exhumation rate canbe used to set limits on the timing and duration of
events that exhumed or buried the surfaces ofcontinents in the deep geologic past. First, we cangauge the duration of rapid erosional unroofingafter mountain building from the difference be-tween collision age and onset of cooling. With-in the GFTZ (Fig. 2B), the 300-My differencebetween the onset of cooling and the mountain-building event establishes a maximum intervalover which isostatically driven uplift can persistat the rates observed in young and topograph-ically high mountain belts (50 to 100 m/My) (18).Second, we can rule out erosional histories thatinclude periods of exhumation or burial fasterthan a given rate or longer than a given timeinterval (with a trade-off between duration andrate). For example, we can dismiss histories forthe GFTZ with exhumation or burial lastinglonger than 50My at rates that exceed T50m/My.More subtle transient deformation mechanismssuch as dynamic topography, with a characteristicamplitude less than 1 km over a distance of 1000km or more, will be undetected on the short timescales (tens to hundreds of millions of years) andmodest exhumation/burial rates (10 to 100 m/My)at which this process operates (19). Despite thepossibility of brief erosional or burial events ofmoderate magnitude, the data presented here re-quire an overall cratonic history dominated byvertical motion rates near zero. This indicates thatthe isostatic balance observed in the present-daycontinents has been largely maintained over ge-ologic time, extending back at least to the onsetof cooling within each terrane. Since this stabilitywas first attained, the craton has experienced abalance between erosion and burial, with a cor-ollary balance between the lithosphere’s internalbuoyancy forces (1, 2) and near-zero isostatic up-lift, further indicating a minimal change in therelative densities of the lithosphere and mantleover intervals lasting billions of years.
References and Notes1. T. H. Jordan, J. Petrol. (special lithosphere issue),
11 (1988).2. A. M. Forte, H. K. Perry, Science 290, 1940 (2000).3. P. F. Hoffman, Annu. Rev. Earth Planet. Sci. 16, 543
(1988).4. T. A. Ehlers, K. A. Farley, Earth Planet. Sci. Lett. 206,
1 (2003).5. J. Braun, Earth Planet. Sci. Lett. 200, 331 (2002).6. M. D. Schmitz, S. A. Bowring, Contrib. Mineral. Petrol.
144, 592 (2003).7. T. Blackburn, S. Bowring, B. Schoene, K. Mahan,
F. Dudas, Contrib. Mineral. Petrol. 162, 479 (2011).8. See supporting material on Science Online.9. P. A. Mueller, A. L. Heatherington, D. M. Kelly,
J. L. Wooden, D. W. Mogk, Geology 30, 127 (2002).10. K. Barnhart, thesis, University of Colorado, Boulder
(2011).11. H. Yuan, B. Romanowicz, Nature 466, 1063 (2010).12. B. C. Hearn Jr., Lithos 77, 473 (2004).13. S. Burdick et al., Seismol. Res. Lett. 79, 384 (2008).14. R. L. Rudnick, S. Gao, D. H. Heinrich, K. T. Karl,
in Treatise on Geochemistry, R. L. Rudnick, Ed.(Pergamon, Oxford, 2003), pp. 1–64.
15. R. L. Rudnick, W. F. McDonough, R. J. O’Connell,Chem. Geol. 145, 395 (1998).
16. E. W. Portenga, P. R. Bierman, GSA Today 21, 4 (2011).17. P. W. Reiners, T. A. Ehlers, S. G. Mitchell,
D. R. Montgomery, Nature 426, 645 (2003).18. K. M. Fischer, Nature 417, 933 (2002).19. J. Braun, Nat. Geosci. 3, 825 (2010).
Acknowledgments: We thank B. Hager, K. Burke, S. Hemming,and three anonymous referees for their constructivecomments, and C. Hearn for contributions in sample collection.Supported by EarthScope grants EAR-0746205 (S.A.B.) andEAR-0746246 (K.H.M.). Previously unpublished U-Pb data aretabulated in table S1.
Supporting Online Materialwww.sciencemag.org/cgi/content/full/335/6064/73/DC1Materials and MethodsSOM TextFigs. S1 to S3Tables S1 and S2References (20–28)
2 September 2011; accepted 28 November 201110.1126/science.1213496
Multiyear Prediction of Monthly MeanAtlantic Meridional OverturningCirculation at 26.5°NDaniela Matei,1* Johanna Baehr,2 Johann H. Jungclaus,1 Helmuth Haak,1
Wolfgang A. Müller,1 Jochem Marotzke1*
Attempts to predict changes in Atlantic Meridional Overturning Circulation (AMOC) have yieldedlittle success to date. Here, we demonstrate predictability for monthly mean AMOC strength at26.5°N for up to 4 years in advance. This AMOC predictive skill arises predominantly from thebasin-wide upper-mid-ocean geostrophic transport, which in turn can be predicted because wehave skill in predicting the upper-ocean zonal density difference. Ensemble forecasts initializedbetween January 2008 and January 2011 indicate a stable AMOC at 26.5°N until at least 2014,despite a brief wind-induced weakening in 2010. Because AMOC influences many aspects ofclimate, our results establish AMOC as an important potential carrier of climate predictability.
Variations in Atlantic Meridional Over-turning Circulation (AMOC) can sub-stantially affect northward ocean heat
transport and therefore European and North At-lantic climate (1–3). Through its influence onsea surface temperature (SST), AMOC is further-
6 JANUARY 2012 VOL 335 SCIENCE www.sciencemag.org76
REPORTS
on
Janu
ary
5, 2
012
www.
scie
ncem
ag.o
rgDo
wnlo
aded
from