an example of official statistics at home and abroad
TRANSCRIPT

Exeter Initiative for Statistics and its Applications (ExIStA) Kay Building, University of Exeter, 29 February 2012
Occupational injury statistics – An example of official statistics at home and abroad
Peter Wingfield-Digby Independent statistical consultant
www.pwdigby.co.uk 1
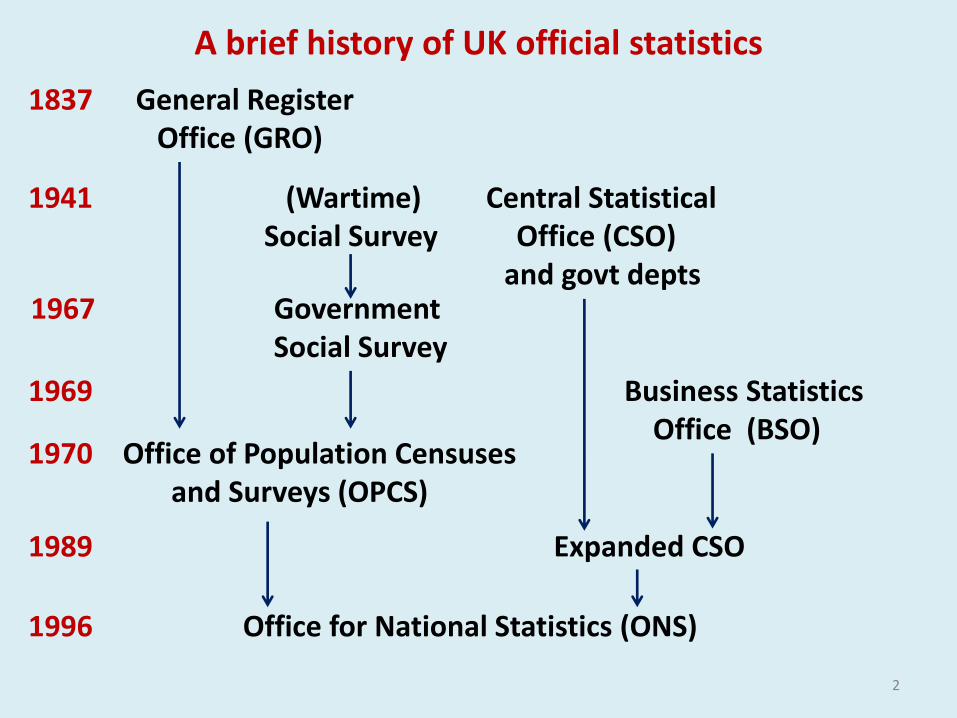
A brief history of UK official statistics
1996 Office for National Statistics (ONS)
1989 Expanded CSO
1970 Office of Population Censuses and Surveys (OPCS)
1969 Business Statistics Office (BSO)
1967 Government Social Survey
1941 (Wartime) Central Statistical Social Survey Office (CSO) and govt depts
1837 General Register Office (GRO)
2

2000 Statistics Commission - Limited functions. Reported to Treasury ‘National Statistics’ – seal of approval (Quality mark)
Recent Chair – Sir Michael Scholar. New Chair – Andrew Dilnot
National statistics – recent developments
National Statisticians / Head of government statistical service
2005-09 Karen Dunnell 2009- Jil Matheson
Monitoring and reporting on all government statistics
2008 Registration function (BMD) moved to IPS, Home Office
2007 Statistics and Registration Service Act
2008 Statistics Authority – Independent. Accountable to Parliament (i) Oversight of ONS (ii) Scrutiny of all official statistics
3

Occupational injury Statistics – International perspective
Principal data sources in the past:
1. Administrative records of compensations schemes
2. Systems for notifying occupational injuries to labour inspectorates
Major problems: Low coverage; Under-reporting of injuries
4
Data quality is a problem in both developed and developing countries A study in the UK some time ago (1980s ?) found that: For paid employees: only 1 in 3 injuries were reported For the self-employed: only 1 in 5 injuries were reported

Scale of the problem worldwide
The ILO estimated (around 1998) that each year:
• 300,000 workers die as a result of accidents at work
• 250 million workers are injured badly enough to have to take time off work
5
International action
16th International Conference of Labour Statisticians, 1998
Resolution concerning statistics of occupational injuries resulting from occupational accidents
• Provides guidance on what data should be collected
• Also requested the International Labour Organization (ILO) to prepare a manual giving technical guidance on the contents of the resolution, and on how to collect relevant data through household surveys and establishment surveys

ILO project on occupational injuries I was the outside consultant, assisting the occupational injury statistics specialist in the ILO Bureau of Statistics
• Helped to design two questionnaire modules: (i) labour force surveys, (ii) establishment surveys
• 3 countries tested them out: Jamaica, Nigeria, Philippines
• Helped analyse the results, then had a workshop in Geneva.
• Then we prepared the manual
Timeline 1998 16th International Conference of Labour Statisticians 1999 Preparatory work and pilot conducted 2003 Workshop held in Geneva 2008 Handbook published
6

7
Can be downloaded from: http://www.ilo.org/stat/ Publications/WCMS_173153/ lang--en/index.htm

8
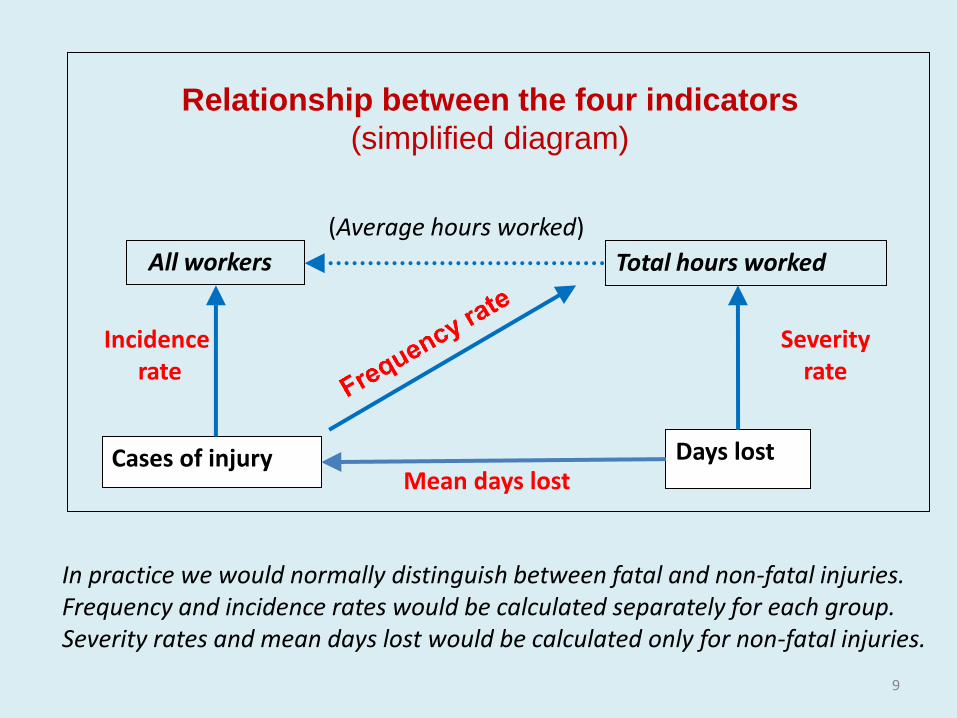
Key indicators
There are four key indicators for reporting occupational injury statistics, as recommended by the 16th ICLS
Measure Relates To
(numerator) (denominator)
Frequency rate Cases of injury Million hours worked
Incidence rate Cases of injury Thousand workers
Severity rate Days lost Million hours worked
Average days lost Days lost Cases of injury
9
All workers Total hours worked
Cases of injury Days lost
(Average hours worked)
Incidence rate
Severity rate
Mean days lost
Relationship between the four indicators
(simplified diagram)
In practice we would normally distinguish between fatal and non-fatal injuries. Frequency and incidence rates would be calculated separately for each group. Severity rates and mean days lost would be calculated only for non-fatal injuries.

Example: Liberia LFS 2010
Note: The LFS will probably already have included questions on age, sex, activities over 12 months, hours of work in each activity, etc. If the module is attached to a labour force survey, only a few extra questions are required.
Main results for Liberia: In 2009, 70,000 males and 43,000 females suffered occupational injuries. Average days lost – 14 days. Total lost time = 1½ million days.
Additional questions: • Whether ever had an occupational accident
• Whether any occupational accident in the last 12 months
• Job in which working at the time of the accident
• Whether the accident caused absence from work for at least one day
• How many calendar days were lost from work (or will be lost)
10

11
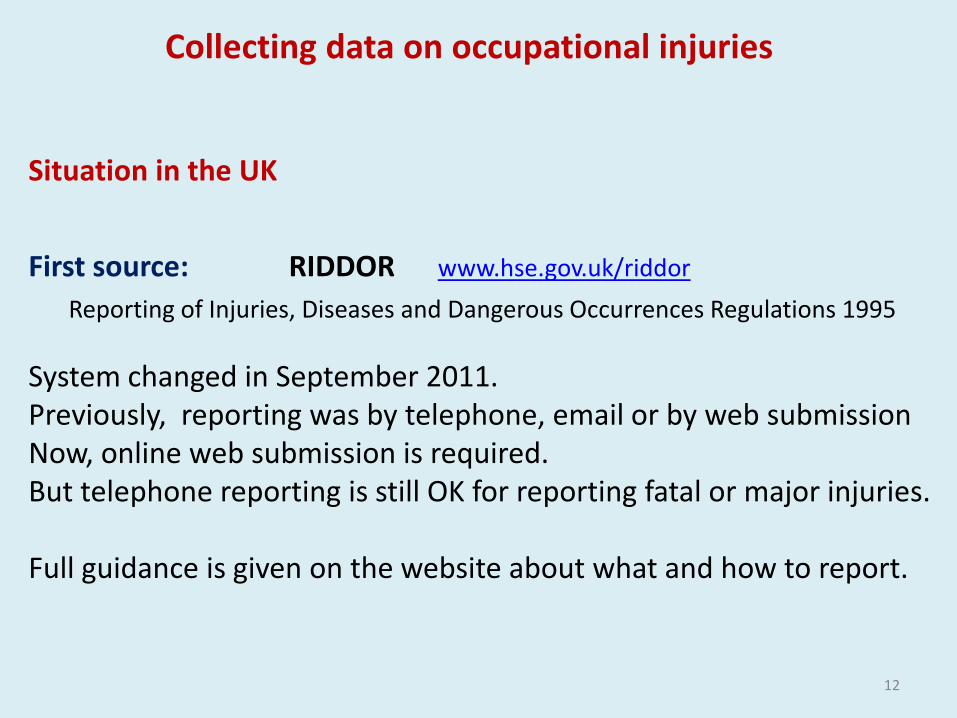
Situation in the UK
First source: RIDDOR www.hse.gov.uk/riddor
Reporting of Injuries, Diseases and Dangerous Occurrences Regulations 1995
System changed in September 2011. Previously, reporting was by telephone, email or by web submission Now, online web submission is required. But telephone reporting is still OK for reporting fatal or major injuries. Full guidance is given on the website about what and how to report.
Collecting data on occupational injuries
12
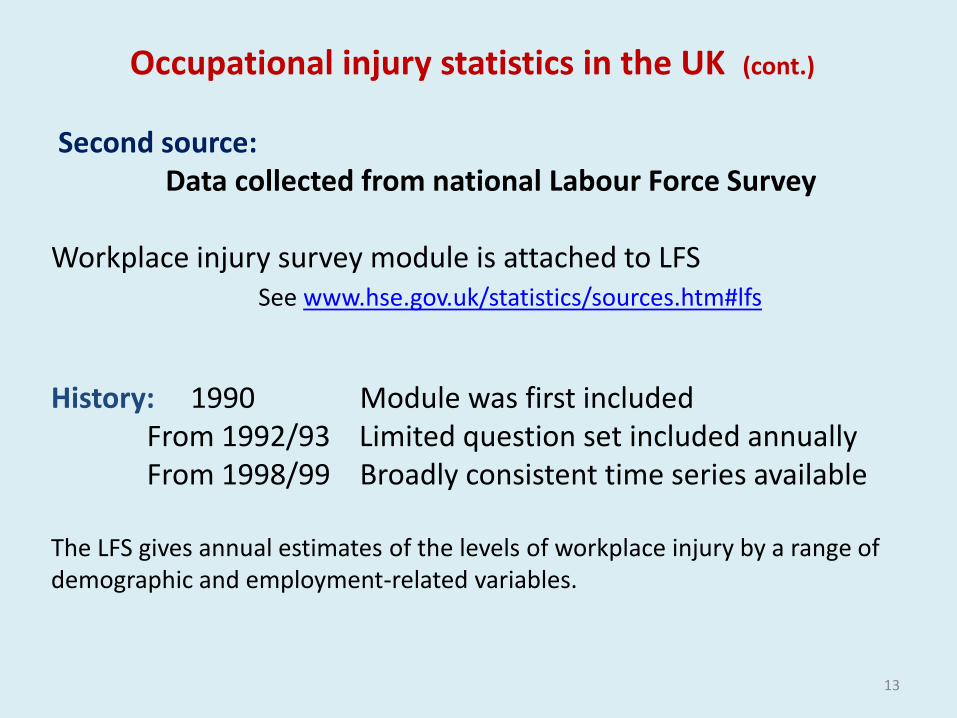
Occupational injury statistics in the UK (cont.)
Second source: Data collected from national Labour Force Survey Workplace injury survey module is attached to LFS See www.hse.gov.uk/statistics/sources.htm#lfs
History: 1990 Module was first included From 1992/93 Limited question set included annually From 1998/99 Broadly consistent time series available The LFS gives annual estimates of the levels of workplace injury by a range of demographic and employment-related variables.
13

UK Occupational Injury Statistics Source 2009/10 2010/11 Fatal injuries RIDDOR 147 171
‘Reportable’ non-fatal LFS 231,000 200,000 injuries (over 3 days)
Estimated days lost LFS 5.1 million 4.4 million
Reported non-fatal injuries RIDDOR 124,654 117,469 (major, and over 3 days)
“Self-reported results suggest that around half of (LFS) reportable non-fatal injuries (> 3-day absence) are recorded under RIDDOR”
www.hse.gov.uk HSE Statistics 2010/11, page 9
Thank you ! 14

Annex 1
Some key characteristics of UK occupational injuries • Occupation is the biggest influence on the risk of a workplace injury
• New workers are at higher risk of injury than established workers
• Shift workers and part-time workers are at higher risk of workplace injury
• Around half of the reduction in injury rates between 1986 and 2004 can be attributed to changes in the occupational mix of the British workforce over that period
• The business cycle affects injury rates (increases in GDP lead to increased injury rates, and vice versa)
Source: www.hse.gov.uk
15

Annex 2
Occupational injury statistics in the UK
Topics covered in the LFS:
ACCDNT Accident at work resulting in injury NUMACC No. of accidents in last 12 months ROAD Whether it was a road accident WchJb Which job (details of job already collected in LFS) GOBACK How soon back to work (still off work, 0, 1, 2, 3, 4, 5+ days) TIMEDAYS Days off work (if 5 or more) TYPINJ Type of injury SITEFR If injury involved fracture/break: Part of body injured SITEDI If injury involved fracture/break: Which bones fractured SIGHT If injury involved loss of sight: Permanent or temporary SIGHTL If injury involved loss of sight: How long impaired ACCURH Whether experienced loss of consciousness, hypothermia, etc. UNCONC If lost consciousness: How long for ACCKIND Mode of injury – how accident happened
16
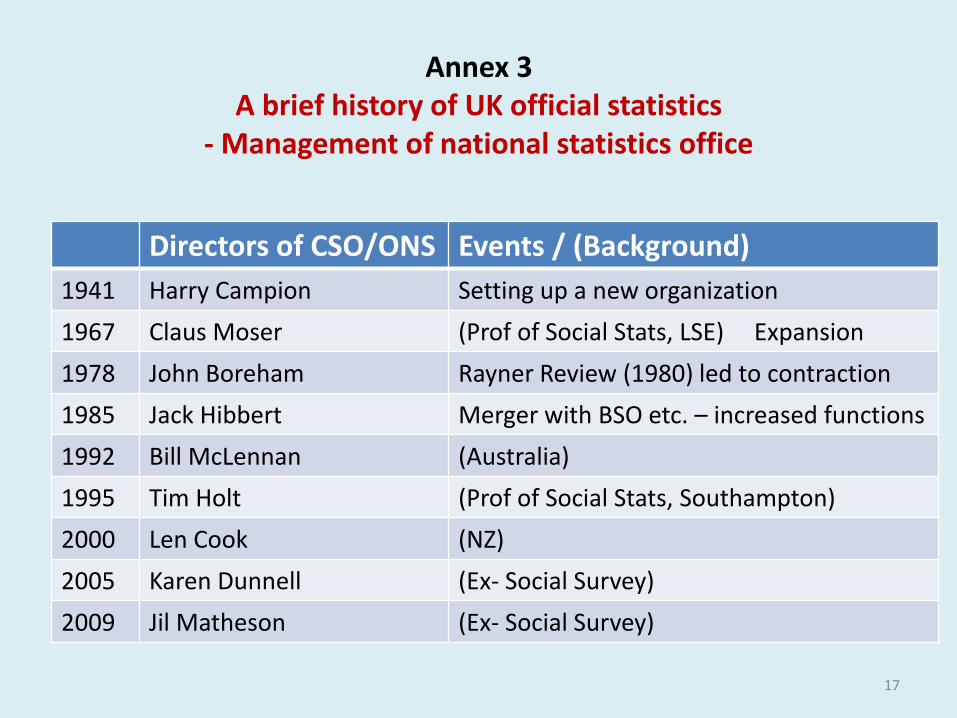
Annex 3 A brief history of UK official statistics
- Management of national statistics office
Directors of CSO/ONS Events / (Background)
1941 Harry Campion Setting up a new organization
1967 Claus Moser (Prof of Social Stats, LSE) Expansion
1978 John Boreham Rayner Review (1980) led to contraction
1985 Jack Hibbert Merger with BSO etc. – increased functions
1992 Bill McLennan (Australia)
1995 Tim Holt (Prof of Social Stats, Southampton)
2000 Len Cook (NZ)
2005 Karen Dunnell (Ex- Social Survey)
2009 Jil Matheson (Ex- Social Survey)
17

Annex 4
Useful websites to check out www.ons.gov.uk Office for National Statistics
www.statisticsauthority.gov.uk UK Statistics Authority
www.statistics.gov.uk Publication hub for government statistics
www.parliament.uk/pasc Public Administration Select Committee
www.bbc.co.uk/programmes/b006q ‘More or Less’ Radio 4 programmes
www.bbc.co.uk/programmes/b00wgq01 ‘Joy of Statistics’ TV programme
www.gapminder.org Explore the world
www.rss.org.uk Royal Statistical Society
www.getstats.org.uk RSS 10-year numbers campaign
www.significancemagazine.org Demonstrates practical use of statistics
www.hse.gov.uk Health and Safety Executive
www.ilo.org International Labour Organization
18