an examination of personnel instability in public
TRANSCRIPT

AN EXAMINATION OF PERSONNEL INSTABILITY IN PUBLIC ORGANIZATIONS
by
JUSTIN MICHAEL STRITCH
(Under the Direction of Laurence J. O’Toole, Jr.)
ABSTRACT
There have been relatively few studies examining how personnel instability affects the
management and performance of public organizations. In this dissertation I examine the
organizational consequences of two sources of personnel instability: 1) managerial succession;
and 2) collective employee turnover. I consider personnel instability’s theoretical relationships
with performance, organizational human capital, social climate, and management. Additionally,
I integrate the current public administration research and theory with literature from education
policy, general management, and sociology to theoretically explore multiple causal paths among
the variables. I formulate hypotheses on the nature of the relationships between the variables
over time.
I use approximately 1,000 New York City elementary, intermediate (K-8), and middle
schools over five years (2006-2011) to test my hypotheses with Generalized Estimating
Equations. The advantages of using GEE models in this situation are three-fold: 1) The
technique addresses unobserved school-level effects; 2) I can estimate a population average
effect without using the degrees of freedom needed to estimate unit specific effects (random or
fixed); 3) I can leverage the data to adjust for the error correlation structure that actually exists—
not the one I assume exists and impose on the model.

This dissertation makes a considerable number of theoretical and empirical contributions
to current public management scholarship. First, while I find evidence that collective employee
turnover has a nonlinear relationship with performance; I find that performance has a negative
relationship with both collective teacher turnover and managerial succession in future time
periods. Second, contrary to existing scholarship, I find evidence that the effect of principal
succession on performance is contingent on past performance and that a change in principal at a
low performing school negatively affects performance, while a succession in a high performing
school provides a boost to performance. Third, I find evidence that schools with high-levels of
collective teacher turnover will turn to inexperienced teachers to staff the organization, but that
these are the employees that are most likely to leave in the future. Finally, I find evidence that
managerial succession can undermine the organization’s social climate and management.
INDEX WORDS: public management, personnel instability, employee turnover,
organizational performance, human capital quality, social climate

AN EXAMINATION OF PERSONNEL INSTABILITY IN PUBLIC ORGANIZATIONS
by
JUSTIN MICHAEL STRITCH
BA, University of North Carolina at Charlotte, 2006
MPA, University of North Carolina at Charlotte, 2010
A Dissertation Submitted to the Graduate Faculty of The University of Georgia in Partial
Fulfillment of the Requirements for the Degree
DOCTOR OF PHILOSOPHY
ATHENS, GEORGIA
2014

© 2014
Justin Michael Stritch
All Rights Reserved
AN EXAMINATION OF PERSONNEL INSTABILITY IN PUBLIC ORGANIZATIONS
by
JUSTIN MICHAEL STRITCH
Major Professor: Laurence J. O’Toole, Jr.
Committee: Andrew B. Whitford
Hal G. Rainey
Robert K. Christensen
Electronic Version Approved:
Julie Coffield
Interim Dean of the Graduate School
The University of Georgia
August 2014
iv
DEDICATION
I dedicate this dissertation to my parents, Michael and Suzanne Stritch, and to my sister,
Megan Stritch. This dissertation is a reflection of all your love and support.

v
ACKNOWLEDGEMENTS
I would like to begin by thanking my dissertation chair, Larry O’Toole. I am thankful for
the opportunity to work under his guidance. Over the past four years, Larry has spent many
hours reading, commenting on, and editing my work, paying incredible attention to every detail.
Under his guidance, I have seen myself develop and grow as a writer and scholar. I am also
grateful for the independence he afforded me over the course of this project. This independence
has instilled in me a confidence that will serve me well as I begin my academic career. I can
only hope to follow Larry’s example of excellence in scholarship, dedication to students, and
service to the field of public administration.
I would like to thank the remaining members of my committee. As a group, my
committee encouraged me to go beyond my initial dissertation proposal and to collect the data
that would allow me to test the effects of changes in management (managerial succession) on the
organization. The consequence was a far more interesting project. Each member has also
provided important individual contributions to the successful completion of this dissertation.
Andy Whitford has provided me with important methodological guidance and his
fingerprints are on many parts of this dissertation. I am thankful for having had the opportunity
to take his organizational theory course where he exposed me to a body of literature that I found
useful as I wrote this dissertation. One of my first assignments to a research assistant will be to
follow Andy on social media. In addition to a stream of Dilbert cartoons and Disney video
montages, they will find useful blog posts and links to underutilized and newly released data
sources.

vi
Hal Rainey always kept an open door. Hal recruited me to the program and has provided
important guidance at critical junctures along the way. Hal has also been a key force in
providing the doctoral students with professional development opportunities that I have benefited
from over the past four years. Hal’s willingness to work with students and his commitment to
the field of public administration make it an honor to have spent time working with him.
Finally, I would like to thank Rob Christensen for everything he has done for me as a
teacher, mentor, co-author, and friend. Over the past six years, beginning at UNC-Charlotte,
Rob has shown me the pre-tenure hustle of a junior faculty member as well as the nitty-gritty of
data collection. He has been generous with both his time and research resources, bringing me
and two other student colleagues to a research conference in Europe. I will be sure to pay his
generosity forward in the future with my own students.
In addition to the members of my dissertation committee, there are a number of other
faculty, both at the University of Georgia and at UNC-Charlotte, I would like to thank, including
Ed Kellough, Barry Bozeman, Brad Wright, Suzanne Leland, Maureen Brown, JoAnn Carman,
Gary Rassell, Greg Weeks, Beth Whitaker, and Cindy Combs. At different points in my
academic career, each of them provided me with encouragement to continue my studies.
I want to thank Nathan Favero, from whose previous work with the complex New York
City schools data I benefited as I constructed my own data set. I appreciate Nathan’s time and
willingness to help me troubleshoot over the last eighteen months.
I would like to thank my entire family for the love and support they have given me my
entire life. I would like to thank my father, Michael Stritch, and my mother, Suzanne Stritch, for
instilling in me the value of hard work, but also showing me how to be kind and fair to those
around you. My parents have always encouraged me to forge my own path and made me think

vii
anything I wanted was possible. As the recipient of the so-called “Mike Stritch Scholarship,” I
also appreciate their financial support throughout my education. I also want to thank my sister,
Megan Stritch, who has put up with me her entire life—not always with a smile—but always in
stride. I am incredibly proud of her and glad to be her brother.
I want to thank my family members who did not get to see me complete this journey, my
grandfather, Patrick Stritch, my uncle and aunt, Joseph and Marjorie Brady, and my cousin,
Michael Chagnon. I miss you all dearly.
I want to thank Melissa Dengler for allowing me to squat for long periods of time at her
home in Nevada as I completed this project. I am very glad you and George will be joining me
in Phoenix.
I would like to thank my fellow doctoral students over the past four years. There are few
people who know or will ever understand the ups and downs of this journey. Knowing that I am
not going through it alone has been an important source of motivation on daily basis. I
especially want to thank Justin Bullock, Derrick Anderson, John Ronquillo, Tyler Reinagel,
Elizabeth Sassler, Barry Edwards, Kukkyoung Moon, and Mogens Pedersen. We have many
papers to write together over the next few decades.
I want to thank my best friend, Michael Trivette, for putting up with me over the last few
years. I always know I can count on you to get a beer with me. Last, but certainly not least, I
want to thank Hannah Sawyer, Lisa Smitherman, Chase Woodall, Steven Morrison, and C. J.
Toscano for the friendship each has provided me. Each of you has been an important source of
friendship, inspiration, humor, and support as I have crawled toward the completion of this
degree.

viii
TABLE OF CONTENTS
Page
ACKNOWLEDGEMENTS .............................................................................................................v
LIST OF TABLES ......................................................................................................................... xi
LIST OF FIGURES ..................................................................................................................... xiii
CHAPTER
1 INTRODUCTION .........................................................................................................1
Managerial Succession.............................................................................................2
Collective Frontline Employee Turnover ................................................................4
Employee Turnover in the Public Administration Literature ..................................5
Research Questions ..................................................................................................6
Dissertation Structure and Organization ..................................................................9
2 PERSONNEL INSTABILITY: CONTEXTUAL AND HISTORICAL
PERSPECTIVES .........................................................................................................13
Organizations and Stability ....................................................................................13
Personnel Stability in Public Administration Scholarship .....................................19
Chapter Summary ..................................................................................................28
3 PERSONNEL INSTABILITY AND PUBLIC ORGANIZATIONS: LITERATURE
AND HYPOTHESES ..................................................................................................29
Personnel Instability and Performance ..................................................................30
Personnel Instability and Organizational Human Capital ......................................48

ix
Personnel Instability, Organizational Climate, and Management .........................54
Chapter Summary ..................................................................................................66
4 DATA, MEASURES, AND RESEARCH METHODS ..............................................68
New York City Schools .........................................................................................68
Main Variables of Interest .....................................................................................72
Models....................................................................................................................88
Chapter Summary ..................................................................................................93
5 ANALYSIS OF PERSONNEL INSTABILITY AND PERFORMANCE ...............108
Variables ..............................................................................................................108
Model Estimation .................................................................................................110
Personnel Instability and Performance ................................................................112
Does Performance Drive Instability? ...................................................................121
Chapter Summary ................................................................................................126
6 ANALYSIS OF PERSONNEL INSTABILITY AND HUMAN CAPITAL ...........141
Collective Employee Turnover and Organizational Human Capital ...................141
Does Human Capital Quality Drive Future Turnover? ........................................146
Managerial Succession and Future Employee Turnover .....................................147
Chapter Summary ................................................................................................148
7 ANALYSIS OF PERSONNEL INSTABILITY, SOCIAL CLIMATE, AND
MANGEMENT..........................................................................................................155
Variables and Models ..........................................................................................156
Personnel Instability and Social Climate .............................................................158
Personnel Instability and Management ................................................................160

x
Halo Correction ....................................................................................................163
Estimating the Halo Effect ...................................................................................164
Social Climate Indicators with the Halo Correction ............................................166
Management Indicators with the Halo Correction ...............................................168
Chapter Summary ................................................................................................171
8 DISCUSSION AND CONCLUSION .......................................................................183
Personnel Instability and Organizational Performance ........................................184
Personnel Instability and Organizational Human Capital ....................................190
Personnel Instability, Organizational Social Climate, and Management ............192
Conclusion ...........................................................................................................196
REFERENCES ............................................................................................................................199
APPENDICES
A NYC-DOE PARENT SURVEY INSTRUMENT .....................................................226
B NYC-DOE TEACHER SURVEY INSTRUMENT ..................................................231
C GENERALIZED ESTIMATING EQUATIONS WORKING CORRELATION
MATRICES ...............................................................................................................237
xi
LIST OF TABLES
Page
Table 3.1: Summary of Hypotheses ..............................................................................................67
Table 4.1: Distribution of School Type by Year...........................................................................94
Table 4.2: Community School District by Borough (2006-2011) ................................................95
Table 4.3: School Type by Borough in 2012 ................................................................................96
Table 4.4: Principal Succession by School Type (2003-2012) .....................................................97
Table 4.5: Collective Teacher Turnover by School Type (2005-2012) ........................................98
Table 4.6: Pass Rate—English Language Arts Exam ...................................................................99
Table 4.7: Pass Rate—Math Exam .............................................................................................100
Table 4.8: Parent Satisfaction Measure ......................................................................................101
Table 4.9: Percentage of Teacher’s with Master’s Degree Plus 30 Hours (or Doctorate) ..........102
Table 4.10: Percentage of Teacher’s Out of Certification ..........................................................103
Table 4.11: Percentage of Teacher’s with Fewer Than Three Years of Experience ..................104
Table 4.12: Participative Management .......................................................................................105
Table 4.13: Managerial Feedback ...............................................................................................105
Table 4.14: Client Oriented Management ...................................................................................105
Table 4.15: Credible Commitment .............................................................................................106
Table 4.16: Goal Oriented Management .....................................................................................107
Table 5.1: Descriptive Statistics .................................................................................................128
Table 5.2: Correlation Matrix .....................................................................................................129

xii
Table 5.3: Effect of Personnel Instability on Performance .........................................................130
Table 5.4: Effect of Personnel Instability on ELA Exam Performance ......................................131
Table 5.5: Effect of Succession on Math Performance Contingent on Past Performance .........132
Table 5.6: Effect of Succession on ELA Performance Contingent on Past Performance .........132
Table 5.7: Performance’s Relationship with Future Collective Teacher Turnover ....................133
Table 5.8: Performance’s Relationship with Future Principal Succession .................................134
Table 6.1: Collective Turnover and Future Human Capital Quality ..........................................150
Table 6.2: Human Capital, Principal Succession, and Future Collective Turnover ...................151
Table 7.1: Descriptive Statistics of the Social Climate and Management Indicators .................175
Table 7.2: Personnel Instability and Organizational Social Climate ..........................................176
Table 7.3: Personnel Instability and Management ......................................................................177
Table 7.4: Factor Model of Common Variation Among all Items (Halo Effect) .......................178
Table 7.5: Regressions Estimates Used to Generate Halo Corrected Measures .........................179
Table 7.6: Personnel Instability and General Satisfaction w/Management and Climate ............180
Table 7.7: Personnel Instability and Social Climate Indicator (Halo Corrected) .......................181
Table 7.8: Personnel Instability and Management (Halo Corrected) .........................................182
Table 8.1: Summary of Findings ................................................................................................198

xiii
LIST OF FIGURES
Page
Figure 5.1: Collective Turnover’s Effect on Math Exam Performance ......................................135
Figure 5.2: Collective Turnover’s Effect on ELA Exam Performance ......................................136
Figure 5.3: ELA Exam Performance’s Effect on Collective Teacher Turnover .........................137
Figure 5.4: Parent Satisfaction’s Effect on Collective Teacher Turnover ..................................138
Figure 5.5: ELA Exam Performance’s Effect on Principal Succession ......................................139
Figure 5.6: Parent Satisfaction’s Effect on Principal Succession ...............................................140
Figure 6.1: Collective Teacher Turnover and Human Capital Quality .......................................152
Figure 6.2: Teacher Inexperience and Future Teacher Turnover ...............................................153
Figure 6.3: Teachers Out of Certification and Future Teacher Turnover ...................................154

1
CHAPTER 1
INTRODUCTION
In this dissertation, I examine two sources of organizational personnel instability,
managerial succession and collective frontline employee turnover, and their relationships with
the performance, human capital, internal climate, and management of public organizations.
Managerial succession refers to a discrete change in the manager of a group, team, unit or
organization (see Boyne, James, John, & Petrovsky, 2011; Hill, 2005). Collective turnover is a
term referring to turnover at any level of analysis higher than the individual. Aggregated
turnover from groups, teams, units or organizations are all examples of collective turnover
(Hausknecht & Trevor, 2011; Meier & Hicklin, 2008).
Over the course of the dissertation, I examine the relationships among the key variables
of interest in New York City elementary, intermediate (K-8), and middle schools. I begin by
investigating both managerial succession’s and collective frontline employee turnover’s
relationships with organizational performance. In this dissertation, managerial succession refers
to a discrete change in a school’s principal from the previous year. Collective frontline
employee turnover refers to the aggregate teacher turnover in a school. Next, I consider the
relationship between organizational turnover and organizations’ human capital quality. Becker
(1964) defines human capital as the knowledge, training, skills, abilities and other intangibles,
such as personality, that allow individuals to accomplish, or perform, a task. In this dissertation
organizational human capital quality refers to the percentage of a school’s teachers with

2
advanced degrees, more than three years of teaching experience, and all of the appropriate
certifications and teaching credentials.
Finally, I investigate both managerial succession’s and organizational turnover’s
relationships with the organizational social climates and management of public organizations.
Organizational climate is broadly defined as the organizational or situational characteristics
perceived by an organization’s employees (Rentsch, 1990). Specifically, I examine how both
managerial succession and organizational turnover might serve as social disruptions that
undermine collective perceptions of trust, respect and collaboration among an organization’s
members. With respect to management, I examine how managerial succession and collective
frontline employee turnover might be related to the presence of specific management practices in
the organization.
Managerial Succession
Hill (2005) observes that there is little empirical literature that specifically looks at the
relationship between managerial succession and performance in public management scholarship.
This is surprising given the interest of public management scholars in the relationship between
management and performance (p. 585-586). The current literature on managerial succession’s
organizational consequences is limited in several important ways. First, public administration
scholars have only examined managerial succession in the top echelons of public organizations,
focusing empirical analyses on the succession or turnover of chief executives and top
management teams. For instance, Boyne and Dahya (2002) develop a theoretical framework for
top-managerial succession, without considering the implications of lower-level managerial
successions for organizations. There is a need to consider the relationship between managerial

3
successions and performance in lower levels of the organization. I will provide such a discussion
in the conclusion of this dissertation.
There are two ways of conceptualizing school principals relative to the schools they
manage. One might consider principals the top manager of their own organization. From this
perspective principals are analogous to the top manager of a public organization. On the other
hand, principals are nested in a larger organizational structure. In this study, all schools are part
of the New York City Department of Education. From this perspective the principal is a middle
manager and the schools they manage are a production unit of the larger organization. To add to
the existing literature, I will develop and test the theoretical implications of New York City
school principals as the top managers of their own organizations, but I will keep in mind the
conceptualization of principals as middle managers in charge of overseeing the production units
of a larger organizational system when I interpret and discuss my results.
Second, public administration scholars have only looked at the effects of managerial
successions in three empirical contexts: U.S. Attorney’s Offices, Texas school districts, and
English local governments. Building on past research and prior theory, I will examine the effect
of management succession (principals) on the performance of their units (schools) nested within
one large public organization (New York City schools).
Finally, while past research has found that managerial succession is related to
performance (Boyne et al., 2011; Hill, 2005; Whitford, 2002a), no scholars have directly
analyzed the effects of managerial succession on employee perceptions of management or the
social relationships within the organization. New managers might need time to put in place their
own policies and systems within the organization or unit, and it might take employees time to
adjust to the change in the leadership and to adapt to these new systems. New management

4
might disrupt the social environment of the organization as employees are forced to change and
adapt, causing a short-term decrease in indicators of organizational social climate. Additionally,
new managers might change how the organization is managed by increasing formalization and
attention to the internal processes of the organization.
Collective Frontline Employee Turnover
Models of individual-level employee turnover have been widely studied in both the
general management and public management literatures (e.g. J. L. Cotton & Tuttle, 1986;
Mobley, 1977; Mobley, Griffeth, Hand, & Meglino, 1979), but there is an increasing interest in
turnover at the group, unit and organizational levels (Hausknecht & Trevor, 2011). Specifically,
researchers have focused on collective turnover’s relationship with organizational performance
(e.g. Hancock, Allen, Bosco, McDaniel, & Pierce, 2011; Meier & Hicklin, 2008; Jason D Shaw,
Gupta, & Delery, 2005; Ton & Huckman, 2008). According to Hausknecht and Trevor (2011),
the study of collective turnover is a consequence of interest by researchers in strategic human
resource management (SHRM). P. M. Wright and McMahan (1992) define SHRM “as the
pattern of planned human resource deployments and activities intended to enable an organization
to achieve its goals” (p. 298).
Collective employee turnover might have a number of consequences for organizations.
The direct costs of collective turnover include employee severances, as well as the cost of
recruiting, selecting, and training new employees (e.g. Darmon, 1990; Jones, 1990; Staw, 1980).
The indirect costs of collective frontline employee turnover might include human capital leaving
the organization (e.g. Becker, 1962; Schultz, 1961), the loss of an organization’s social capital
embedded in employees’ relationships with one another (e.g. Dess & Shaw, 2001; Leana & Van
Buren, 1999), as well as a general decrease in morale and commitment among those who remain

5
in the organization (e.g. Steers, Mowday, & Porter, 1979). These indirect costs and social
disruptions are commonly thought to have deleterious effects on the performance of the
organization.
Other scholars have argued that collective turnover could have positive effects for an
organization, up to a point, and that collective turnover is not an entirely disruptive process (see
Abelson & Baysinger, 1984). From this perspective, when employees exit an organization they
are replaced with new employees who introduce new ideas and an outside perspective that can
contribute to organizational innovations and enhance the organization’s performance (e.g.
Guidice, Heames, & Wang, 2009; Price, 1989). These scholars have theorized that the
functional relationship between collective turnover and organizational performance is non-linear.
From this perspective, lower-levels of turnover are associated with an increase in innovativeness
and thus performance, but there is an optimal level of turnover—once collective turnover crosses
this threshold the effects on performance become negative.
Employee Turnover in the Public Administration Literature
While the focus of this dissertation will be on organization-level turnover, much of the
research on turnover—or turnover intent—in public administration scholarship examines the
antecedents of turnover at the individual-level (e.g. Bertelli, 2007; Bright, 2008; Cho & Lewis,
2012; Kim, 2005; G. Lee & Jimenez, 2011; S. Y. Lee & Whitford, 2008; Pitts, Marvel, &
Fernandez, 2011). These studies often model job satisfaction, personal characteristics (i.e.
gender, race, age, etc.), and characteristics of an employee’s work environment as determinants
of employees’ likelihoods of leaving an organization. One major limitation of individual
turnover intention research is that we do not know whether the individual actually decides to
leave the organization.

6
Recently, several studies have sought to explain actual—not intended—turnover at the
individual level. In several studies scholars identified employee and manager gender—and
racial—congruence as a predictors of retention (Grissom & Keiser, 2011; Grissom, Nicholson-
Crotty, & Keiser, 2012). Additionally, employees who perceived high levels of regular feedback
from their managers were more likely to be retained by their organization (Grissom, 2012). As
with studies of individual turnover intention, however, these studies do not inform our
knowledge of collective turnover’s consequences for organizational performance or an
organization’s internal management and social environment.
Within public administration, only a few scholars have examined managerial succession
and collective turnover, and have done so only in the context of organizational performance
(Boyne et al., 2011; Hill, 2005; Meier & Hicklin, 2008; O'Toole & Meier, 2003; Whitford,
2002a).1 While we need to continue to explore the relationship between these two dimensions of
personnel instability and performance in different organizational contexts and at different
organizational levels, public administration scholars need to begin looking at the other ways in
which personnel instability might affect public organizations. This dissertation examines the
relationship between personnel instability and performance, but also personnel instability’s
relationships with an organization’s human capital, management, and social climate.
Research Questions
In recent years, public management scholars have developed an extensive literature
examining the relationship between management and performance. A number of studies have
drawn on formal models to generate hypotheses with respect to management’s effect on
organizational performance, while accounting for governance structures, environmental
1 The opposite of collective turnover has been conceptualized in public administration scholarship as employee, or
personnel, stability (O'Toole & Meier, 2003).

7
constraints and resources, and client characteristics (e.g. Lynn, Heinrich, & Hill, 2002; O'Toole
& Meier, 1999). While scholars have established that management matters with respect to
organizational performance as an outcome, there is still room to build on our theoretical and
empirical understanding of how internal organizational variables are causally related to one
another.
If managerial successions and collective turnover are disruptions to the functioning of
organizational units, both might have negative effects on the performance of the organization.
Likewise, if collective turnover is a disruption to the organization, we might expect the
disruption to have consequences for a public manager’s maintenance of their organizational
human capital. We might also expect disruptions from managerial succession and frontline
employee turnover to have deleterious effects on the organization’s internal social climate,
including diminishing perceptions of respect and support among the remaining members and
new entrants to the organization. To date there has been no examination of how personnel
instability and turnover might have deleterious effects on a public organization’s internal social
climate.
It is not clear, however, that both managerial successions and collective turnover are
always disruptions. In fact, research on group turnover suggests that there might be an optimal
level of turnover that enhances performance (Abelson & Baysinger, 1984; Meier & Hicklin,
2008). Additionally, managerial succession’s effects on performance might be contingent on
past performance (Boyne et al., 2011), and mediated by factors such as the new manager’s
experience and whether the new manager is an internal or external hire (Andrews, Boyne, Law,
& Walker, 2012). In certain contexts, managerial succession might enhance performance and
positively affect certain organizational attributes, such as climate and management quality.
8
To build on past research, and begin to fill gaps in extant research, this dissertation is
designed to answer the following sets of research questions:
What is personnel instability’s relationship with performance? Is there a non-linear
relationship between collective frontline employee turnover and performance? Is it
possible that an organization’s poor performance causes employees to exit the
organization?
What is personnel instability’s relationship with an organization’s human capital (i.e.
aggregate skills and experience of the workforce)? What are the temporal dynamics of
this relationship?
What is personnel instability’s relationship with an organization’s internal social climate,
as reflected in employee perceptions of respect and support? What is personnel
instability’s relationship with the establishment of management practices, such as goal
setting, participative decision making, and managerial feedback?
As indicated by these questions, the relationships between organizational turnover and
the variables of interest might be reciprocal over time. This possibility poses methodological
challenges that are problematic when trying to isolate the causal relationships among the
variables. However, according to Judge and Ilies (2002), theoretical and empirical examinations
of reciprocal relationships can lead to more complete frameworks in which to study the
variables. An essential part of making sense of the relationships among variables in this
dissertation is to allow for complexity and reciprocity in the research design.

9
Dissertation Structure and Organization
I begin Chapter 2 by providing conceptual and historical context for studying personnel
instability. In addition to personnel instability, I summarize other sources of administrative and
environmental instability faced by public organizations. I also discuss interest in personnel
instability by administration scholars and practitioners over the past century. Specifically, I look
at the early works of Max Weber, Henri Fayol, and Luther Gulick and their early treatments of
both managerial succession and personnel stability. I then briefly discuss New Public
Management and the advocates of innovation and change, who viewed personnel stability and
managerial tenure as barriers to effective public service performance. Finally, I discuss the
renewed interest in organizational stability, specifically research on personnel stability’s and
managerial succession’s relationships with organizational performance.
In Chapter 3 I discuss the theories relevant to answering my research questions and I
generate the hypotheses to be tested in subsequent chapters. I also include a summary of extant
empirical findings scholars have found testing the same (or similar) hypotheses. While I will
mention findings from general management research, I will focus my discussion of empirical
findings to public administration scholarship.
Following my review of the literature and generation of hypotheses, Chapter 4 provides
an in-depth discussion and description of the data that are used to analyze the hypotheses
generated in three chapters of theoretical and analytical analysis. In this chapter, I first describe
the New York City public school context in which the study is conducted. The unit of analysis
for all parts of the study is the school, and all variables are examined at the school level. While
New York City public schools are unique in many ways, a close look demonstrates that they
share a great number of characteristics with other public employment contexts. Second, I discuss

10
my strategy for generating latent variables from teacher survey responses to create measures of a
school’s internal social climate and management. Finally, I provide a description of my general
modeling strategy for testing the hypothesized relationships among the variables.
Chapter 5 reports the analysis of the relationship among personnel instability and
organizational performance. I test the specific hypotheses on the relationships between
managerial succession and performance, as well as collective frontline employee turnover and
performance. While these questions have been previously examined in the public administration
literature (Boyne et al., 2011; Hill, 2005; Meier & Hicklin, 2008; O’Toole & Meier, 2003;
Whitford, 2002a), there is still a need to study the relationship in different contexts and employ
different methodological treatments in order to examine the effect of turnover from multiple
previous periods over time. Previous studies in public administration have looked at how
collective turnover affects the performance of school districts across a state. In contrast, this
dissertation will examine schools within one large urban school district.
Additionally, while there has been statistical evidence suggesting that turnover drives
performance at the organizational level (Meier & Hicklin, 2008), evidence of a reciprocal
relationship has been found in other research contexts examining unit-level turnover (Van
Iddekinge et al., 2009) and will be explored further. Thus, while the first set of research
questions have been examined in the literature, the lack of consensus on the nature of the
relationship and the need for investigations in different research contexts justifies continued
inquiry (Hausknecht & Trevor, 2011).
Chapter 6 presents the results of the examination of the relationship between personnel
instability and organizational human capital. I begin by examining collective frontline employee
turnover’s relationship with several indicators of organizations’ human capital quality found

11
archival data available from the New York State Department of Education. These measures
include: 1) the percentage of teachers out of certifications; 2) the percentage of teachers with
fewer than three years teaching experience; and 3) the percentage of teachers with a master’s or
doctorate.
This chapter empirically evaluates two sets of research questions. First, are managers of
organizations with higher levels of collective turnover forced to turn to less qualified employees
to staff the organization? Second, are organizations with less qualified employees also the ones
that are most likely to have higher levels of organizational turnover? These questions imply a
possible reciprocal causality between the variables. This analysis examines the degree to which
managers of high turnover organizations are caught in a trap. On one hand, managers may be
forced to use less qualified employees to meet the staffing needs of the organization as a result of
high levels of organizational turnover. On the other hand, by depending on these less qualified
employees who are also more likely to quit, managers might fail to ameliorate organizational
turnover in future periods. Finally, I consider the relationship between the two dimensions of
instability and test whether managerial succession triggers higher level of collective frontline
employee turnover in future periods.
Chapter 7 presents an analysis of the relationship between personnel instability and an
organization’s internal social climate and management. Traditional models of employee
turnover have viewed organizational participation (e.g. Grissom, 2012) as well as co-worker
respect and support (e.g. D. G. Allen, Shore, & Griffeth, 2003; Ducharme, Knudsen, & Roman,
2007) as variables positively related to individual employee retention--or negatively related to
turnover. While the previous research on individual turnover has looked at the relationship
between these characteristics of internal work climate as a determinant of employee turnover,
12
few scholars have examined whether collective turnover might a have a deleterious effect on the
organization’s internal social climate and, thus, contribute to deterioration of the social system.
Additionally, new managers might adopt a number of new organizational strategies that could
affect employee perceptions the organization’s management.
Finally, Chapter 8 provides a discussion of the results. The chapter will highlight the key
contributions of the study to public administration research and theory as well as general
management studies. Following a discussion of the dissertation’s limitations, I provide an
outline for future research on collective employee turnover and managerial succession.
This dissertation provides an opportunity to build our understanding of how managerial
succession and collective turnover affects public organizations with respect to performance, and
also the implications for human capital quality, internal social climate, and management. The
study adds to our knowledge of managerial succession and change in public organizations. The
findings also contribute to the literature pertaining to the management of front-line employees in
public service organizations, but also will speak to collective turnover and organizations,
generally. Finally, by utilizing panel data I can examine the temporal dynamics of the
relationships among variables. Examining multiple causal directions is rarely done in public
administration, given the dependence on cross-sectional data sets. While time-series modeling
introduces other challenges, it also presents an opportunity to build a more complete
understanding of the relationships among variables.
13
CHAPTER 2
PERSONNEL INSTABILITY: CONTEXTUAL AND HISTORICAL PERSPECTIVES
In this chapter, I provide both conceptual and historical contexts to my examination of
personnel instability in public organizations. First, I take an inventory of the various sources of
administrative and environmental instability encountered by organizations and examined in the
general and public management literatures. Second, I explore Weber’s (1947), Fayol’s (1949),
and Gulick and Urwick’s (1937) examinations of personnel instability and managerial change in
the early management scholarship. Despite being dismissed by mid-century scholars as
nonscientific, or heuristic, in nature (e.g. Simon, 1946; Simon & Barnard, 1976), these early
scholars provide important insights on the organizational consequences of both managerial
change and personnel instability. Finally, I discuss the notable absence of both studies of
managerial succession and collective frontline employee turnover from the public administration
scholarship during the second half of the twentieth century, especially in the wake of New Public
Management and efforts to “reinvent” government (e.g. Barzelay, 1992; Kettl, 2000; O'Toole &
Meier, 2003, pp. 43-45; Osborne & Gaebler, 1992).
Organizations and Stability
Personnel Instability
Stability is defined as the quality or state of something that is not easily changed or likely
to change.2 I examine two sources of instability occurring as a result of changes in the
personnel of organizations, teams, or work units: managerial succession and collective personnel
turnover. In their description of personnel instability, O'Toole and Meier (2003) state:
2 Retrieved on January 14
th, 2014 from http://www.merriam-webster.com/dictionary/stability.

14
Bureaucracy, according to Weber, is characterized by career employees, so the people
who occupy positions within the organization are an additional element of stable
administration. If the positions or their relationships shift over time, a system
experiences instability. But even if the structural and procedural aspects remain constant
and the goal of a public agency persists, changes in personnel can represent an important
variety of instability. (pp. 44-45)
Scholars have examined the effects of personnel instability on the organization in number
of administrative contexts, including executive agencies (e.g. Cohen, 1986), military units (e.g.
C. A. Cotton, Mannheim, & Moskos, 1983; Griffith, 1989), education (e.g. Meier & Hicklin,
2008; O'Toole & Meier, 2003) and English local government (e.g. Boyne et al., 2011).
The most ubiquitous source of personnel instability is employee turnover. Turnover
occurs when an individual exits an organization. Griffeth and Hom (2001) provide an in depth
description of the different types of turnover and its consequences for the organization (pp. 3-7).
Turnover might include a voluntary exit or an involuntary dismissal. Voluntary turnover can be
both functional and dysfunctional for an organization. Functional turnover includes the
departure of substandard employees, whereas dysfunctional turnover includes the turnover
employees that are highly skilled and difficult to replace. Finally, dysfunctional turnover might
be either unavoidable or avoidable. Unavoidable quits are the departures from the organization
that a manager cannot control, such as a family move, medical disability, retirement, or death.
Avoidable quits are the ones that could be resolved by employers providing training
opportunities and retention programs, life-style friendly practices such as flextime, job-sharing
and telecommuting, and other programs that mitigate work-life conflicts.

15
However, personnel instability and employee changes resulting from turnover do not
always lead to negative consequences for organizations. According to Roseman (1981), turnover
can remove malcontents and troublemakers from an organization. Turnover can break up
informal employee cliques that might waste time and resist change. Turnover might cause
organizations to reevaluate the content of jobs and the overall structure of the organization.
Finally, there might be financial benefits when high-priced employee talent can be traded for
lower-priced employee talent with equal capabilities, as employees with longer tenure accrue
greater levels of costly fringe benefits and pensions (pp.7-8).
While the key variables of interest in this dissertation are dimensions of personnel
instability, there are other sources of administrative and environmental instability that an
organization might encounter. I will now discuss these additional sources of instability before
discussing the historical context of personnel stability in public management scholarship.
Sources of Administrative Instability
In addition to personnel stability, O'Toole and Meier (2003) observe four additional
sources of administrative instability encountered by public organizations. Structural stability is
“the preservation of organizational features over time,” including size, span of control,
formalization, and task differentiation. Mission stability is the consistency of an administrative
unit’s goals over time. For public organizations, the mission is inextricably linked to the
demands of external stakeholders and political principals. Technological/production stability is
the absence of changes in core technology used by an organization. Finally, procedural stability
refers to the rules and operating procedure of an organization (O'Toole & Meier, 2003, p. 44).
The drivers of instability to the administrative systems of public organizations are often external
16
in nature and responses to the requirements or demands of political principals and external
stakeholder groups.
Environmental Instability
Theoretical interest in environmental instability emerged out of research on the
relationship between organizations and their task environments (Cyert & March, 1963; Pfeffer &
Salancik, 1978; Starbuck, 1973; Thompson, Scott, & Zald, 2003). There have been many
attempts at describing organizational environments. Most of these efforts include stability,
instability, or turbulence, as an environmental characteristic (e.g. Aldrich, 2008; Child, 1972;
Dess & Beard, 1984; Mintzberg, 1979; Sharfman & Dean, 1991; Thompson, 2003). For
instance, Thompson (2003) argues that organizational environments are characterized by both
heterogeneity/ homogeneity, describing whether the elements of the environment are similar to
each other, and stability/dynamism, describing whether or not environmental elements change
unexpectedly. Similarly, Child (1972) describes environmental variability as, “…the degree of
change which characterizes environmental activities relevant to an organization’s operations” (p.
3). Dess and Beard (1984) specify three dimensions of an organization’s task environment:
munificence, dynamism, and complexity. Dynamism is the dimension that includes both
stability/instability and turbulence. Sharfman and Dean (1991) argue for a more complex
conceptualization of environmental instability, suggesting that when operationalizing instability,
or turbulence, scholars should consider both market and technological instability, arguing that
the two are independent constructs.
Aldrich (2008) contends that “environmental turbulence leads to externally induced
changes…that are obscure to administrators and difficult to plan for” (p. 69). Aldrich’s
conceptualization of turbulence also emphasizes the interconnectedness among organizations.
17
Pfeffer and Salancik (1978) suggest that interconnectedness among organizations generates
environmental uncertainty and instability, and that “[C]hanges can come from anywhere without
notice and produce consequences unanticipated by those initiating the changes and those
experiencing the consequences” (cited in Dess & Beard, 1984, p. 56).
Related to an organization’s task environment, network stability might have
consequences for organizations. According to O'Toole (1997), “Networks are structures of
interdependence involving multiple organizations or parts thereof, where one unit is not merely
the formal subordinate of the others in some larger hierarchical arrangement” (p. 45). In a
network governance structure, administrative changes in one organization might lead to
environmental turbulence for another. Furthermore, the stability of networks can have
implications for the performance of organizations as well as the network’s overall performance
(e.g. Burns & Stalker, 1961; Emery & Trist, 1965; Pfeffer & Salancik, 1978; Whetten, 1987).
According to Provan and Milward (1995):
Other things being equal, network effectiveness will be enhanced under conditions of
general system stability, although stability is not a sufficient condition for effectiveness.
Networks that have recently undergone substantial change will be significantly less
effective than stable ones. The impact of stability on network effectiveness will be
greater to the extent that the clients of the network are themselves adversely affected by
instability and uncertainty. (p. 25)
Relationships among Sources of Instability
The multiple sources of instability discussed above are likely to have significant
relationships and interactions with each other (Johnston & Romzek, 2008; O'Toole & Meier,
2003). According to Johnston and Romzek (2008), “Instability can create cyclical effects, so

18
that one source of instability can introduce more (and sometimes different types of)
instability…” (p. 119). With respect to technological stability, Thompson et al. (2003) argue,
“Environmental stability offers assurances that the technology previously used will be relevant in
the future” (p. 93), and thus environmental stability can promote technological stability. In
contrast, environmental instability might destabilize the goals and mission of the organization.
Thompson and McEwen (1958) argue that, “Because the setting of goals is essentially a problem
of defining desired relationships between an organization and its environment, change in either
requires review and perhaps alteration of goals” (p. 23). The adoption of a new technology or
production process may facilitate the organization expanding or changing its goals or mission,
and lead to the formation of additional partnerships and governance arrangements with other
outside organizations (Osborn & Baughn, 1990). Furthermore, whether or not the consequences
of administrative instability and stability are positive or negative are likely context specific and
highly contingent on both administrative and environmental characteristics of the organization
(Benner & Tushman, 2003; Boyne et al., 2011; Donaldson, 1987; Meier, O'Toole, Boyne, &
Walker, 2007).
Specifically, how might personnel instability interact with, or be related to, other sources
of administrative and environmental instability? While little attention has been given to this
exact question in the literature, there are number of ways we might expect personnel instability
to be related to other dimensions stability/instability. First, when there is a change in an
organization’s leadership, we might see that organizational procedures are destabilized as
employees begin to anticipate changes made by the new leaders to old routines. It is also
possible that an organization’s goals and missions shift as the new leaders align the goals of the
organization with their own personal values (see Boyne & Dahya, 2002; Hambrick & Mason,

19
1984). At the same time, when an organization’s mission changes, employees who strongly
identified with the previous mission might choose to leave in order to find employment at an
organization with a mission that is a closer fit to their own personal interests, values, beliefs, or
long-term professional goals (see Chatman, 1989; O'Reilly, Chatman, & Caldwell, 1991; B. E.
Wright & Pandey, 2008).
For public organizations, instability in the task environment might result in personnel
leaving to seek positions in organizations with more stable task environments where the goals are
less ambiguous (see Chun & Rainey, 2005; Frank, 1958; Rizzo, House, & Lirtzman, 1970;
Sawyer, 1992) or where goals are perceived as more readily attainable, even if difficult (see
Locke & Latham, 1990; B. E. Wright, 2001). Furthermore, changes in technology might change
the human capital needs of the organization, which could trigger personnel instability until
equilibrium is reached between the technology adopted and the skills of the personnel in the
organization.
While a complete inventory of personnel instability’s relationships with all other sources
of administrative and environmental instability is well beyond the scope of this discussion, these
few examples demonstrate the interrelatedness among sources of instability. The remainder of
Chapter 2 provides a historical overview of academic interest in the study of personnel instability
in public administration scholarship.
Personnel Stability in Public Administration Scholarship
Early Management Theorists and Personnel Stability
Personnel stability was an important point of emphasis and drew a lot of attention from
the early management and organization theorists. Weber’s (1947) bureaucratic organization,
based on rational-legal authority, includes as part of its ideal type a merit-based system of tenure
20
where individuals advanced predictably and systematically over time. Weber envisioned
employees as professionals whose vocation constituted a career. The system of merit-based
advancement is one that, in principle, should limit the unexpected exit of individuals from an
organization and promote personnel stability at all levels of organization (pp. 333-341). In
Weber’s view, a rational-legal basis of authority was preferable to traditional and charismatic
systems of authority in a modern, industrialized society (pp. 341-392). While Weber’s rational-
legal basis for organizing is often a straw-man for critics of government, bureaucracy is still the
single most common mode of organizing both public and private life throughout the world.
Of the early management theorists discussed here, Fayol (1916; republished in 1949) is
the scholar most explicit in his call for personnel stability in organizations. The emphasis that
Fayol places on personnel stability is captured in the following excerpt from his work titled,
General and Industrial Management:
Time is required for an employee to get used to new work and succeed in doing it well,
always assuming that he possesses the requisite abilities. If when he has got used to it, or
before then, he is removed, he will not have had time to render worthwhile service. If
this be repeated indefinitely the work will never be properly done. The undesirable
consequences of such insecurity of tenure are especially to be feared in large concerns
where the settling of managers is generally a lengthy matter. Much time is needed indeed
to get to know men and things in a large concern in order to be in a position to decide on
a place of action, to gain confidence in oneself, and inspire it in others. Hence it has
often been recorded that a mediocre manager who stays is infinitely preferable to
managers that come and go.
21
Generally, the managerial personnel of prosperous concerns is stable, that of
unsuccessful ones is unstable. Instability of tenure is at one both cause and effect of bad
running. The apprenticeship of a higher manager is generally a costly matter.
Nevertheless, changes in personnel are inevitable; age, illness, retirement, death, disturb
the human make-up of the firm, certain employees are no longer capable of carrying out
their duties, whilst others become fit to assume greater responsibilities. In common with
all the other principles, therefore, stability of tenure and personnel is also a question of
proportion. (Fayol 1916, pp. 58-59)
Fayol makes several important observations about personnel instability. First, it takes
employees and managers time to learn and understand their jobs. If an employee leaves prior to
completing training, the organization incurs the cost of that employee’s training as well as the
cost of recruiting and training someone else to replace them (see Abelson & Baysinger, 1984;
Darmon, 1990; Jones, 1990; Tziner & Birati, 1996). The result of high levels of personnel
instability can be the misallocation of organizational resources and managerial attention.
Furthermore, in the context of public services and street level bureaucrats (see Lipsky, 2010),
high levels of employee turnover might negatively affect both citizen engagement (see Bingham,
Nabatchi, & O'Leary, 2005; T. L. Cooper, Bryer, & Meek, 2006; Graham & Phillips, 1997) and
the organization’s ability to form meaningful relationships with clients to enhance service
outcomes (see Douglass & Gittell, 2012; Gittell & Douglass, 2012).
Fayol admits there are times when managers, or employees, are no longer capable of
fulfilling their duties and a change is, in fact, necessary and/or inevitable. There are
circumstances where a change might lead to the immediate enhancement of organizational
performance. However, Fayol does not provide theoretical guidance on when such a change is

22
necessary, or would be advantageous for the organization. I will revisit this issue in Chapter 3 of
this dissertation and my discussion of the extant research literature.
Management Instability and the Unity of Command
Instability among the top-level management in an organization can also result in the
breakdown in the unity of command. Gulick and Urwick, as well as Fayol, discuss the
importance of the unity of command in organizations.3 In his discussion of unity of command,
Fayol says, “for any action whatsoever, an employee should receive orders from one superior
only…should it be violated, authority is undermined, discipline is in jeopardy, order disturbed
and stability threatened.” Fayol goes on to distinguish unity of direction from unity of
command. The author describes unity of command as one employee receiving one set of orders
from one individual and unity of direction as one head (leader) giving one set of directions. The
distinction, however, is subtle and not necessarily important for my argument that succession or
change in top leadership is going to create a disruption for organizations.
In the times both before and after a change in an organization’s top management, we
might expect employees to have confusion over whether to continue following past procedures
and protocol, as well as confusion among employees as new leaders take time to specify and
communicate their own organizational goals. Thus, a change in leadership might bring, albeit
temporarily, disunity of command in an organization. Speaking directly about the issue of unity
of command, Gulick and Urwick (1937) argue that, “A workman subject to orders from several
3 This principle drew the ire of Simon (1946) who argues the principle is incongruent with the principle of
specialization. According to Simon, “if an accountant in a school department is subordinate to an educator, and if
unity of command is then observed, then the finance department cannot issue direct orders to him regarding the
technical, accounting aspects of his work” (p. 55). Simon does, however, suggest that “The principle of unity of
command is perhaps more defensible if narrowed down to the following: In case two authoritative commands
conflict, there should be a single determinate person whom the subordinate is expected to obey; and the sanctions of
authority should be applied against the subordinate only to enforce his obedience to that one person” (p. 56). Gulick
(1937), however, acknowledges the difficulties of the principle, arguing that “The rigid adherence to the principle
may have its absurdities; these are, however, unimportant in comparison with the certainty of confusion inefficiency
and irresponsibility that arise from violation of the principle” (Gulick & Urwick, 1937, p. 83).

23
superiors will be confused, inefficient, and irresponsible; a workman subject to orders from but
one superior may be methodical, efficient and responsible” (p. 82).
To be clear, these early authors did not consider the time before and after a managerial
transition in their discussion of unity of command. They were much more literal, envisioning
two managers tasked with overseeing one subordinate. However, the basic principle can be
extended to managerial successions and when there is a shift of control from an old manager to
the new manager of an organization. In the time preceding the anticipated managerial
succession, employees are supposed to be following the rules, procedures, and directions put in
place by the managers, but might not be committed to rules and procedures as they anticipate
changes implemented by new managers. Likewise, we might see disunity of command in the
time immediately following a managerial succession as employees are trying to incorporate new
procedures that have been changed into the remnants of the previous system. Furthermore, there
is a well-developed literature discussing the fact that many employees are resistant to
organizational changes, including those of their own managers (see Bordia, Hobman, Jones,
Gallois, & Callan, 2004; Fernandez & Rainey, 2006; Ford, Ford, & D'Amelio, 2008; Oreg, 2003;
Piderit, 2000). While Fayol, Gulick, and Urwick, never explicitly considered managerial
succession’s effect on the organization with respect to unity of command, it is clear that
managerial succession can introduce confusion around the issue of command and control within
an organization in the times preceding and immediately following changes in managers.
By the mid-twentieth century, however, the principles of the classic management
literature fell out of vogue among a new generation of more “scientific” researchers. The early
management principles were characterized by some scholars as being “proverbial” in nature
(Simon, 1946). Personnel instability and managerial succession never became topics of interest

24
as public administration emerged as a self-aware field of research. In fact, research on
managerial succession and personnel stability in public administration journals has just started to
appear within the past fifteen years (Boyne & Dahya, 2002; Boyne, James, John, & Petrovsky,
2010; Boyne et al., 2011; Hill, 2005; Meier & Hicklin, 2008; O'Toole & Meier, 2003; Whitford,
2002a). O'Toole and Meier (2003) observe the dearth of attention paid to personnel stability, as
either an independent or dependent variable of interest, in public administration research. The
authors point out that while the study of employee selection criteria, motivation, and incentive
systems have all been examined, “The stability of personnel over time, however, has received far
less attention” in an era where governmental reforms were intended to make public organizations
more like their private sector counterparts, arguing that “Stability…rusts at the bottom of the
public manager’s toolbox” (p. 44). This stands in stark contrast to the well-developed literature
on the determinants of individual employee turnover and turnover intention that has proliferated
in public administration scholarship.
Scholars in other fields, however, have been paying attention to personnel stability in
organizations. Mainstream sociology, both directly and indirectly, has addressed the issue of
both managerial change and personnel instability (e.g. Blau, 1960; Carlson, 1962; Gouldner,
1954; Grusky, 1963; Guest, 1962). The general management literature has also given some
attention to both managerial succession (e.g. M. P. Allen & Panian, 1982; Brown, 1982; Huson,
Malatesta, & Parrino, 2004; Pfeffer & Davis-Blake, 1986) and general employee stability (or
collective employee turnover) (e.g. Abelson & Baysinger, 1984; Dess & Shaw, 2001; Hancock et
al., 2011; Hausknecht & Trevor, 2011; Price, 1989; Shaw et al., 2005; Ton & Huckman, 2008).
I will revisit many of these works as I develop hypotheses among personnel instability and the
main variables of interest in Chapter 3 of this dissertation.

25
Personnel Instability in the Era of Government Reform
The latter half of the twentieth century saw the American public grow increasingly
distrustful of governing institutions, and by the late 1960’s there was a general view that
American public administration had failed (Schick, 1974). By the early 1970’s the United States
government had been engaged in Vietnam, Nixon had been impeached, and the previous decade
had seen social conflict and the assassination of major political and civil rights leaders. By the
1980’s this growing skepticism toward government and the use of federal programs to solve
society’s problems had begun to shape not only the public’s attitudes toward public institutions,
but also their views of individual bureaucrats (Goodsell, 2003).
At the same time, outside of the United States New Public Management constituted a
sweeping wave of reforms intended to slow down, or reverse, the growth of government,
privatize the provision of public services, and automate processes through technological
innovations (Hood, 1991). By the 1990’s distrust of bureaucrats and government institutions
resulted in a global movement of major policy reforms designed to make the public sector more
like the private sector and make government more market oriented (Osborne, 1993). It is against
this backdrop that the United States began its own version of reforms that would have potential
consequences for civil service systems and employee stability in public organizations.
Even though the United States never wholeheartedly adopted NPM reforms, the Clinton
Administration’s commitment to the National Performance Review demonstrated an attempt to
increase marketization and efficiency in the delivery of public goods and services. In the United
States, the popular sentiment of the early 1990’s was that government should be reformed, even
if it was not clear what these reforms look like. The sentiment is reflected in the fact that
Osborne and Gaebler’s (1992) work, Reinventing Government, became a national best seller. In

26
contrast to countries such as New Zealand and the United Kingdom, however, reforms in the
United States were highly politicized. As a consequence of politicization, reforms in the United
States were geared toward controlling bureaucrats’ behavior—not fundamentally changing the
structure and processes of government to improve public service outcomes (Hood & Peters,
2004, p. 271; Kettl, 2000, p. 15). According to Hood and Peters (2004), in the United States
“the central thrust of administrative reform was to make civil servants more responsive to elected
politicians rather than depoliticize administration” (p. 271).
One of the key tenets of the New Public Management reforms was the need to give
managers the ability to act as change agents and give them more flexibility in the day-to-
operations (Meier & O'Toole, 2009, p. 11). According to Kettl (2000), six core areas of
governmental reforms occurred across the globe over the past twenty years: 1) Productivity; 2)
Marketization; 3) Service Orientation; 4) Decentralization; 5) Policy; and 6) Accountability for
Results (pp. 1-2). Of the areas of reform, marketization and decentralization might be the two
with the most immediate consequences for personnel instability in the United States. What were
the implications of these reforms for personnel stability in government organizations?
The rise of the marketization of public goods and services has led to increased use of
contractors to provide public goods and services over the last several decades in the United
States (e.g. P. J. Cooper, 2003; Milward & Provan, 2000, 2003; Peters & Pierre, 1998; Salamon,
1987). In most places, these contractors do not fall under the civil service protection afforded
public employees. These employees might be limited in the duration of their employment and
terminated without the guarantee of procedural due process afforded by law under traditional
merit service systems.

27
Furthermore, we have also seen movements in many states to decentralize traditional
systems of merit and tenure. Laws governing tenure and merit were thought to constrain
managers’ abilities to terminate bad employees and reward good ones, and an effort to
decentralize state civil service systems have given more discretion to managers. As a
consequence a number of civil service reforms decentralizing the state human resources
management occurred to give managers more flexibility in the hiring and firing of employees
including Georgia, Florida, and Texas (Condrey, 2002; Walters, 2002). As of 2012, renewed
efforts to decentralize or restructure the employment conditions of public service employees
through changes to public sector unions were occurring or had occurred in a number of states,
including New Jersey, Ohio, Michigan, and Wisconsin. In theory, managers in states where
these reforms have taken place might have more discretion in hiring and firing employees.
Additionally, the removal of merit service protections might reduce the opportunity costs for
public employees who leave the organization. Both of these factors might contribute to
personnel instability.
Research has found employees are critical of these reforms and the effects of reforms on
various personnel practices (Kellough & Nigro, 2002, 2006). Five years after personnel reforms
in Georgia, a survey found that nearly 75 percent of employees agreed that reforms made it
easier for managers to fire people, nearly 70 percent agreed that there was no job security, and 79
percent agreed that it was “risky” to move from a classified job covered under merit protections
to an unclassified position without merit protections (Kellough & Nigro, 2006, p. 456). In short,
privatization and decentralization might be seen as blows to traditional systems of merit and
tenure: systems that promote personnel stability over time.

28
Chapter Summary
This chapter describes personnel instability, as well as other potential sources of
environmental and administrative instability encountered by public organizations. I have
provided a brief review of personnel instability in the classic management literature. Finally, I
concluded the chapter with a brief description of the possible implications of the principles of
New Public Management and government reforms in the United States for personnel instability
in public organizations. In the following chapter, I begin my empirical examination of personnel
instability and the main variables of interest in the dissertation by drawing on theory and
developing hypotheses among the variables.

29
CHAPTER 3
PERSONNEL INSTABILITY AND PUBLIC ORGANIZATIONS:
LITERATURE AND HYPOTHESES
In this chapter I examine personnel instability’s specific, theoretical relationships with
public organizational performance, human capital quality, and organizational social climate and
management. I examine the organizational consequences of two dimensions of personnel
instability: managerial succession (change) and collective frontline employee turnover. An
important component of this chapter is to build on previous public management scholarship
examining personnel instability’s relationship with organizational performance (Boyne et al.,
2010, 2011; Hill, 2005; Meier & Hicklin, 2008; O'Toole & Meier, 2003; Whitford, 2002a) by
examining the relationship in a new research context: New York City’s elementary, intermediate
(K-8), and middle schools. In addition, this is the first effort in public administration scholarship
to explore personnel instability’s relationships with organizational human capital and an
organization’s internal social climate and management.
This chapter consists of three sections: 1) Personnel instability and public organization
performance; 2) Personnel instability and organizational human capital; and 3) Personnel
instability and organizational climate and management. The three sections correspond to
following groups of research questions that I posed in this dissertation’s introduction:
What is personnel instability’s relationship with performance? Is there a non-linear
relationship between collective frontline employee turnover and performance? Is it

30
possible that an organization’s poor performance causes employees to exit the
organization?
What is personnel instability’s relationship with an organization’s human capital? What
are the temporal dynamics of this relationship?
What is personnel instability’s relationship with an organization’s internal social climate,
as reflected in employee perceptions of respect and support? What is personnel
instability’s relationship with the establishment of management practices, such as goal
setting, participative decision making, and managerial feedback?
In each section of this chapter I discuss the relevant theoretical perspectives useful in
answering these questions. I use the theoretical perspectives to develop hypotheses that will be
tested empirically using the data I present in Chapter 4. Table 3.1 includes a summary of all the
hypotheses I develop in this chapter. Finally, as I develop my hypotheses I will summarize the
empirical findings of prior research, and pay special attention to findings reported in the public
management literature.
Personnel Instability and Performance
Managerial Succession and Performance
There is relatively little scholarship that examines top management instability’s
relationship with public organization performance. According to Boyne et al. (2011), “Very few
studies examine the effects of staff turnover on the success or failure of public organizations, let
alone the effects of top management turnover” (p. 572). This is a surprising fact given the large

31
amounts of attention public management scholars have given to the importance of both
leadership (e.g. Behn & Bozeman, 1993; Fernandez, 2005, 2008; Fernandez, Cho, & Perry,
2010; Getha-Taylor, Holmes, Jacobson, Morse, & Sowa, 2011; Moynihan, Pandey, & Wright,
2009; Rainey & Steinbauer, 1999; Riccucci, Rainey, & Thompson, 2006; Trottier, Van Wart, &
Wang, 2008; Van Wart, 2003) and management in the last two decades (e.g. Heinrich, 1999,
2002; Hicklin, O'Toole, & Meier, 2008; G. Lee & Jimenez, 2011; Meier & O'Toole, 2001, 2002;
Meier et al., 2007; Moynihan & Pandey, 2005, 2010; O'Toole & Meier, 1999; O'Toole & Meier,
2004b; Stazyk & Goerdel, 2010; Walker, Damanpour, & Devece, 2011).
How might instability resulting from a discrete change in manager affect an organization?
According to Boyne et al. (2011), “Top managers occupy the positions with the most formal
power in the organization; so when one set of top managers replaces another, this should have
consequences for performance” (p. 572). There are, however, two disparate views on the
direction of the relationship between managerial succession and organizational performance.
Succession and Performance: A Negative Relationship
The first theoretical perspective suggests that the relationship between managerial
succession and performance is negative. According to Hannan and Freeman (1984), all
organizational change—whether it is a change in policies, personnel, environment, or top
management—is a disruptive process for organizations. Drawing on this perspective, Boyne et
al. (2011) argue that the introduction of new management might destabilize relationships internal
to the organization, as well as processes and routines that employees use to simplify tasks and
make decisions about their time allocation. As a consequence, a change in the top management
will result in a decrease in the organization’s performance (p. 572).

32
With respect to the stability of management over time, O'Toole and Meier (2003)4 argue
that:
Top managers navigate in a complex environment and need time to learn the basic
demands of the job. Assessing the surroundings, both in and outside the administrative
system can take time. Even the most skillful managers can be expected to improve
efficacy by learning their institution, policy, resource, personnel and administrative
contexts. (p. 46)
Similarly, Miller (1993) notes, that “common traditions, explicitly articulated objectives, and
strategies whose elements are harmonized all help integration, but they require organizational
continuity and stability” (p. 646). However, the integration of processes in an organization
might be hindered by changes in top managers.
If organizational processes change as a consequence of managerial succession, this might
create uncertainty for frontline employees. This organizational limbo, one might argue, is akin
to an absence of “unity of command” within an organization in the time period following a
managerial succession (see Fayol, 1949; Gulick & Urwick, 1937). Employee uncertainty about a
new manager’s priorities with respect to tasks, goals, and outcomes might have deleterious
consequences for organizational performance. In his study of U.S. Attorney’s Offices, Whitford
(2002a) argues that offices experiencing turnover will have lower levels of case clearance than
offices where the appointed U.S. Attorney remains from the previous year. According to
Whitford (2002a), “cases in process remain in process because of uncertainty about the
preferences, interests, and leadership style of the next appointee” (p. 18).
4 O’Toole and Meier (2003) operationalize managerial stability as the duration of a top manager’s tenure in an
organization at any level.

33
A slightly different perspective on managerial succession suggests that it is difficult for
new managers to make changes that will improve performance to highly inertial, bureaucratic
organizations. Hill (2005) states:
It takes time for a relatively static, entrenched bureaucracy to adapt to new managers and
their strategies. When a manager is changed and a replacement is instituted, the
hierarchical structure will take some time to adapt to the new mode of leadership. Thus,
the relationship between the bureaucrat and manager changes, leading to instability and a
decrease in performance. (p. 588)
Drawing on these theoretical perspectives that suggest managerial succession has a
negative relationship with performance, I will test the following hypothesis:
H1a: Managerial succession is negatively related to organizational performance.
Succession and Performance: A Positive Relationship
There is, however, an alternative theoretical perspective that suggests that a change
management and the destabilization of an organization’s top managers might, in fact, have
positive consequences for the organization. Boyne et al. (2011) point to a school of thought
originating in the private sector literature that suggests the replacement of an organization’s top
leadership might produce improvements in organizational performance (p. 571). Drawing on
Hambrick and Mason’s (1984) upper echelon model of management, Boyne et al. (2011) argue
that “…a new management team might be expected to make a positive difference in performance
by bringing new ideas and a better fit with the political and economic environment” (p. 572).
The basic implication is that new management can refresh and rejuvenate an organization where
the former managers had, perhaps, grown complacent.

34
According to Boyne and Dahya (2002), the longer a top manager is in office, the less
likely that manager will be to take on new initiatives, realign the organization’s strategies, and
take on new goals or objectives (p. 185). In the general management scholarship, Miller (1993)
points to several factors contributing to the “stagnation” of an organization under a long-serving
CEO. First, a long-tenured CEO accumulates power and legitimacy that can lead to a myopic
vision for the organization and unilateral decision making (e.g. Miller, 1991, 1992). Second, a
long-tenured CEO may get increasingly confident in what they understand about the
environment and challenges facing their organization, resulting in declining information
gathering and processing (e.g. Miller, 1991). Finally, long-serving CEO’s might be committed
to the administrative arrangements they put in place as a means of appearing resolute and
consistent (pp. 645- 647). New CEO’s are unencumbered by these factors when they take the
reins of an organization. From this perspective, a change in top management is adaptive and can
positively enhance organizational performance. Based on this logic, I will test the following
hypothesis:
H1b: Managerial succession is positively related to organizational performance.
Testing hypotheses 1a and 1b will allow me to examine and, potentially, adjudicate
among competing perspectives on the relationship between managerial succession and
organizational performance. However, I will now discuss a recent attempt to reconcile these
competing perspectives.
Past Performance, Managerial Succession, and Future Performance
Conflicting evidence on the nature of the relationship between managerial succession and
performance emerged in the early sociology literature. For instance, Gouldner (1954) observed
that managerial succession in a gypsum plant had a disruptive effect, ultimately culminating in
35
labor unrest and strikes. On the other hand, Guest (1962) found that managerial succession had
positive effects on the performance of a large automobile manufacturing plant. Guest attempted
to explain the apparent contradiction in findings. M. P. Allen, Panian, and Lotz (1979)
summarize Guest’s conclusion:
[Guest] argued that the different results obtained in each plant were attributable to the
different types of administrative actions taken by each manager. Moreover, Guest
concluded that these different courses of action were dictated by the conditions within
each plant. Although these two case studies identified the impact of managerial
succession on organizational performance as an important problem in the sociology of
organizations, they were unable to establish any systematic relationship between
succession and performance. (p. 168)
As a consequence of this “theoretical impasse,” Boyne et al. (2011) put forward a
contingency approach to understanding the effects of top management turnover, arguing that
organizational consequences are likely a function of prior performance. According to the
authors, when prior performance is low, the positive adaptive effects of managerial succession
will outweigh the negative, disruptive effects. On the other hand, when the prior performance of
the organization is high, the balance of these consequences will be reversed (p. 573). The
authors base their argument on Donaldson’s (1987) contingency theory and the role the
organization’s environment plays with respect to performance. It is important to point out,
however, that Boyne et al. (2011) do not actually look at environmental factors. Instead, the
authors argue that the effect of managerial succession is contingent on past performance.
For high performing organizations, employees might view the leader leaving as a major
loss and have concerns about the ability of the organization to maintain high levels of

36
performance moving forward. Boyne et al. (2011) argue that “for high performing organizations,
turnover can be damaging, creating change when the organization has learned to play the game
and losing the key personnel that created the success in the first place” (p. 574). To test whether
or not a negative effect of managerial turnover on performance is contingent on high levels of
past performance, I will test the following hypothesis:
H2a: Managerial succession has negative effects on performance when the previous
performance of the organization is high.
For low performing organizations a change in management might refocus the
organization on its mission and establish new goals. The cost of realigning the organization’s
strategies and forming new policies, processes, and routines might be less than the benefits that
are accrued in doing so. Additionally, if an organization is failing to perform, it might be the
case that policies, processes, and routines need to change. Managers in low performing
organizations might become complacent with respect to performance and comfortable with
maintaining the status quo. In these circumstances I expect that a managerial succession might
have positive consequences for performance. Thus, I will test the following hypothesis:
H2b: Managerial succession has positive effects on performance when the previous
performance of the organization is low.
Empirical Findings: Managerial Succession and Performance
While I focus my discussion of empirical findings on managerial succession’s
relationship with performance in public organizations, successions of both management and
leadership have been studied in a number of different contexts, including private corporations
(e.g. M. P. Allen & Panian, 1982; Huson et al., 2004), professional football teams (e.g. Brown,
1982), professional basketball teams (e.g. Pfeffer & Davis-Blake, 1986), and professional

37
baseball teams (e.g. M. P. Allen et al., 1979; Grusky, 1963; Hill, 2009). Public administration
scholars, however, have examined the consequences of managerial succession for performance
in only a few organizational and public service contexts. To date, the only public management
studies to specifically examine the effects of managerial succession on performance have been
conducted using data from U.S. Attorneys’ Offices (Whitford, 2002a), Texas School districts
(Hill, 2005), and English local governments (Boyne et al., 2011).5
Whitford (2002a) finds that the succession of appointed U.S. Attorneys, conceived as the
top manager of U.S. Attorney’s Offices, has negative effects on the number of matters handled
(workload) and the number of cases concluded by each office. Whitford points to these findings
as support for the theory that a change in the top manager “creates uncertainty about appropriate
action” for lower-level employees and, thus, is detrimental to aspects of agency performance (p.
19).
Hill (2005) finds that school superintendent succession has no statistically significant
relationship with performance in the short-term even though the coefficient was in the
hypothesized direction (negative). The author also examines the long-term consequences of
managerial succession and finds managerial succession in Texas school districts has both a
positive and significant effect on district level pass rates over a four-year time period. Over the
time-period examined, the average pass rate for all schools increased. However, the average
increase for districts with no superintendent succession was only four percent compared to a
nearly nine percent for districts with new superintendents (Hill, 2005). The findings indicate that
5O'Toole and Meier (2003) operationalize managerial stability as the length of their tenure in the district in any
position. The authors found that the length of tenure of the school district superintendents was positively and
significantly related to overall school district pass rate, the Latino pass rate, the Black pass rate, the Anglo pass rate,
and the low income pass rate.

38
long-term benefits of succession were significant, despite an initial negative, insignificant
relationship.
In an analysis of English local governments, Boyne et al. (2011) find that CEO
succession has no significant direct effect, neither positive nor negative, on the Core Service
Performance Scores6 or the Comprehensive Performance Assessment.
7 The authors also find no
direct relationship between top management team turnover and either measure of performance.
However, the authors do find that top management team turnover’s effect is contingent on prior
levels of performance. The authors describe that their findings:
… are in accordance with our theoretical argument that top management turnover is
beneficial at low baseline levels of organizational performance and harmful at high
baseline levels, while it is of ambiguous or no effect at medium levels of baseline
performance. The evidence is consistent with the view that placing unsuccessful
organizations under new management can make a positive difference to performance that
outweighs any short term disruption to structures and processes. On the other hand, top
management turnover is harmful to high performers. (Boyne et al., 2011, p. 577)
Interestingly, the authors do not examine whether or not a CEO succession’s relationship with
performance is contingent on previous organizational performance.
6According to Boyne et al. (2011), the Core Service Performance Scores are a summary measure of performance
“that ranges from 0 (worst) to 100 (best). It is based on a range of performance information, including Best Value
Performance Indicators, and covers all major services (e.g., education, housing, social services, transport, planning,
and waste collection) and a variety of dimensions of performance such as service quantity, quality, and
effectiveness” (pp. 574-575). 7 According to Boyne et al. (2011), “The CPA is based equally on the service performance score and judgments by
Audit Commission inspectors of a local government’s “ability to improve.” It is a summary rating of a local
government’s performance” (p. 575)

39
Collective Frontline Employee Turnover and Performance
The determinants of individual turnover have received a lot of attention in the public
administration literatures (e.g. Bertelli, 2007; Caillier, 2011; Cho & Lewis, 2012; Choi, 2009;
Grissom & Keiser, 2011; Grissom et al., 2012; Kim, 2005; G. Lee & Jimenez, 2011; Pitts et al.,
2011). Only a few studies in the public administration scholarship, however, consider the effect
of collective frontline employee turnover on public service performance (Meier & Hicklin, 2008;
O'Toole & Meier, 2003).
The direct costs of collective turnover include employee severances, as well as the cost of
recruiting, selecting and training new employees (e.g. Darmon, 1990; Jones, 1990; Staw, 1980).
The indirect costs of collective turnover include human capital leaving the organization (e.g.
Becker, 1962; Schultz, 1961), the loss of an organization’s social capital embedded in
employees’ relationships with one another (e.g. Dess & Shaw, 2001; Leana & Van Buren, 1999),
as well as a general decrease in morale and commitment among those who remain in the
organization (e.g. Steers et al., 1979).
On the other hand, many scholars have argued that collective turnover could have
positive effects for an organization up to a point and that collective turnover is not an entirely
disruptive process (e.g. Abelson & Baysinger, 1984; Glebbeek & Bax, 2004; Meier & Hicklin,
2008). From this perspective, when employees exit the organization they are replaced with new
employees who introduce new ideas and an outside perspective that can contribute to
organizational innovations and enhance the organization’s performance (e.g. Guidice et al.,
2009; Kellough & Osuna, 1995; Price, 1989). These scholars have theorized that the functional
relationship between collective turnover and organizational performance is not direct and
negative, but instead may be non-linear in nature.

40
I will now consider the direct and nonlinear relationships between frontline employee
turnover and organizational performance.
Direct Negative Relationship
For public service organizations, one of the major costs associated with collective
turnover is the loss of experience from the organization. For public service agencies, such as
schools, hospitals, and social welfare organizations, experienced employees may develop
relationships with the clients and citizens they serve. It is through these relationships that
frontline employees might gain specific knowledge to the situation of a client, or group of
clients, that can be used to provide higher levels of public services.
Lipsky (1980) argues that street-level bureaucrats, including teachers, undertake a
number of routines that help them to simplify and complete their work. According to Feldman
and Pentland (2003, p. 171), “An organizational routine is a repetitive, recognizable pattern of
interdependent actions, involving multiple actors,” and might be either formal or informal. In
the context of street-level bureaucrats, these routines arise from bureaucratic discretion and are
informal to the organization. When working in a complex system, these routines may help
street-level bureaucrat’s work through the “noise” they encounter and focus on the tasks most
important to delivering services to the clients. Developing routines and systems to better handle
workload likely takes both time and experience in an organization. High turnover can undermine
the ability of employees to establish routines in an organization and might have negative
implications for the delivery of services to clients as new members go through the learning curve
associated with balancing the workload and integrating into the organization’s social system.
Similarly, collective frontline employee turnover might be detrimental to a public service
organization’s ability to gather and utilize information. “Organizations are consumers,

41
managers, and purveyors of information” (Feldman & March, 1981, p. 171), and if the frontline
personnel of a public organization are unstable, and constantly in flux, we might expect the
organization’s overall ability to gather, consume, manage, and generate information will be
degraded. If experience helps individuals understand information and generate useful
information, some degree of organizational information gathering and use is diminished when
employees leave an organization.
O'Toole and Meier (2003) discuss frontline employee stability’s relationship with
performance in the context of public education. According to the authors:
…extended time in high-stress, front-line positions can lead to burnout and departure, of
course; but for those who endure, the multifaceted skills acquired in the trenches can
make a significant difference in performance. Classroom teaching surely fits this pattern.
Veteran teachers learn how to juggle the many tasks involved in delivering quality
instruction. They gradually see how to translate pedagogical theories into workable
practices in their own particular settings. They also learn how to sort through the
distractions that can absorb energy and attention during a school day. They have
developed experiences with difficult cases and multicultural nuances. (p. 47)
This experience can be translated into higher levels of performance. On the other hand, when
there are high levels of collective employee turnover, past information and the establishment of
routines accruing from employee experience will be much lower in an organization. A
consequence will be lower levels of organizational performance. To examine the relationship
between collective frontline employee instability and performance, I will test the following
hypothesis:

42
H3: Collective frontline employee turnover is negatively related to organizational
performance.
Nonlinear Relationship
Both general and public management scholars have considered the possibility that the
relationship between employee stability and organizational performance is non-linear—or the
shape of an inverted “U.” This functional relationship would indicate that there is an optimal
level of organizational turnover (Abelson & Baysinger, 1984; Alexander, Bloom, & Nuchols,
1994; Glebbeek & Bax, 2004; Hausknecht, Trevor, & Howard, 2009; Meier & Hicklin, 2008;
Price, 1977; Jason D Shaw et al., 2005; Siebert & Zubanov, 2009; Ton & Huckman, 2008).
Meier and Hicklin (2008) suggest several ways that turnover might be beneficial to the
organization. First, turnover is one way to replace poor performers with employees that will
perform better. In some cases, the cost of replacing an employee will be surpassed by the
benefits of the performance of a new employee. Second, the replacement of low performers
might motivate the remaining employees to raise their level of performance. Finally, new
employees might bring new ideas and innovations with them to the organization (p. 575).
According to Meier and Hicklin (2008), whether or not the relationship between turnover
and performance is negative or curvilinear depends on the nature of the task. For the more basic,
less difficult, and highly routine tasks, employee replacement costs are not offset by the
productivity gained from the new employee. In this case we should expect a direct negative
relationship. On the other hand, “As tasks become more difficult to achieve or the skill levels
and creativity of employees becomes more crucial, then differences in quality and experience of
employees are likely to become more important to performance” (pp. 575-577). For creative—
or high skill—tasks, the introduction of new employees is likely to be beneficial with respect to

43
performance. It is only at higher levels that turnover will become disruptive. When a task is
more difficult, the relationship between turnover and performance is more likely to resemble the
functional form originally specified by Abelson and Baysinger (1984). To examine the theory of
an optimal collective turnover rate, I will test the following hypothesis:
H4: Collective frontline employee turnover has a nonlinear relationship with
organizational performance.
Empirical Findings: Direct Negative Relationship
In the public management scholarship, only two studies have examined the relationship
between frontline employee turnover and organizational performance (Meier & Hicklin, 2008;
O'Toole & Meier, 2003). In their study of personnel stability, O'Toole and Meier (2003) find
that district-level teacher stability is positively related with the overall pass rate in Texas school
districts. Employee stability had a number of relationships with other, secondary measures of
performance as well. It was positively and significantly related to the pass rates of Black
students, the average SAT score, and the average attendance rate. In a test of the relationship
between aggregate frontline employee turnover and school district performance, Meier and
Hicklin (2008) find that collective teacher turnover has a direct, negative relationship to the
overall pass rate of the school district. The authors describe the overall pass rate as a routine, or
low difficulty, task. The authors test for a nonlinear relationship between collective teacher
turnover and overall school district performance, but find no statistical evidence of a curvilinear
relationship. Therefore, the finding is consistent with their theory that turnover has a direct,
negative relationship to performance on routine tasks.
In addition to these two studies, general management scholars have found negative
relationships between collective frontline employee turnover and a number of different
44
organizational outcomes. Scholars have found evidence that collective turnover negatively
affects profits (e.g. McElroy, Morrow, & Rude, 2001; Peterson & Luthans, 2006), sales (e.g.
McElroy et al., 2001; J. D. Shaw, Duffy, Johnson, & Lockhart, 2005; Siebert & Zubanov, 2009),
and service quality (e.g. Hausknecht et al., 2009).
Empirical Findings: Nonlinear Relationship
Within the public administration literature, I have identified only a single study (Meier &
Hicklin, 2008) examining the nonlinear relationship between turnover and performance in the
context of public organizations. As previously mentioned, the authors find a direct, negative
relationship among a school districts’ total teacher turnover and the district’s overall pass rate.
The scholars, however, also go on to find statistically significant, nonlinear relationships
between teacher turnover and outputs associated with greater task difficulty, such as college
admissions scores (i.e., ACT and the SAT). The authors took this as evidence that turnover is
negatively related to performance on low difficulty tasks, but has a nonlinear relationship with
performance on tasks that are more difficult in nature.
However, Hausknecht and Trevor (2011) suggest that “despite longstanding arguments
that organizations possess an optimal turnover rate, research evidence is mixed” (p. 382). In
their review of the literature, they find only two studies (in addition to Meier & Hicklin, 2008)
with evidence supporting the “optimal turnover hypothesis.” Glebbeek and Bax (2004) find an
optimal turnover rate of temporary workers on two of three measures of a company’s economic
performance. Siebert and Zubanov (2009) also observe a nonlinear relationship in their study of
sale assistant turnover rate and the labor productivity of a large UK department store over a four
year period. To examine these reported findings, Hausknecht and Trevor (2011) graph the
results of these analyses (as well as Meier & Hicklin, 2008) reporting the inverted-U. The

45
authors describe the results as looking like “the right half of an inverted-U.” In contrast to the
inverted-U conceptualization, the authors suggest the more appropriate interpretation is that a
zero turnover rate is not bad for performance and some turnover may even yield a modest
improvement before becoming detrimental to performance (pp. 365-366).
An attenuated negative relationship has been found far more often in the general
management literature. This functional form suggests that an optimal level of turnover is zero
and turnover begins to impede organizational performance even at very low levels. As the curve
moves from low to moderate turnover, the relationship grows increasingly negative in
magnitude. The attenuated negative relationship between collective turnover rates and
performance has been found in studies of nursing turnover and hospital efficiency (Alexander et
al., 1994), the turnover rates at a concrete pipe facility and both labor efficiency and accident
rates (Jason D Shaw et al., 2005), the turnover rates of truck drivers and revenue per driver,
accident ratio, and the percentage of time out of service (Jason D Shaw et al., 2005), and retail
store employees turnover rates and both customer service and profit margin (Ton & Huckman,
2008).
Hancock et al. (2011) conducted a statistical meta-analysis of the relationship between
collective firm performance and employee turnover, and found that across studies there is
general support for a negative direct relationship, but also a weak nonlinear relationship. The
authors are quick to caution the reader that these results could be sample-specific and more
research is needed to understand the true nature of the relationship among collective turnover
rates and organizational performance.
46
Does Performance Drive Personnel Instability?
It is also possible that performance affects whether there will likely be a change in an
organization’s top manager. While the relationship between managerial succession and
performance has been understudied, the question of whether performance matters for a
manager’s job security has also been largely neglected (Boyne et al., 2010, p. i262). There are
two perspectives that inform how we might think about the relationship between organizational
performance and managerial replacement.
According to the first perspective, those who govern organizations can use performance
information to either reward or punish managers. Summarizing the private sector management
literature, Boyne et al. (2010) argue that “if performance falls below the standard achieved by
competitors, or is less than has recently been achieved by the firm, then board members take
steps to ease out or move aside the chief executive or the entire senior management team in an
attempt to turn the tide” (p. i262). Thus, termination might be the resulting sanction for low-
performing managers.
There is an alternative explanation, however, that might be more appropriate to
understand the relationship between school performance and principal turnover in the New York
City school context. Some scholars suggest that principals accept jobs at lower performing
schools as “stepping stones” into school administration, and in the future these principals will
pursue vacancies in higher performing schools as they become available (Béteille, Kalogrides, &
Loeb, 2012). Both perspectives on organizational performance and manager turnover provide
ample reason to explore the following hypothesis:
H5a: Organizational performance is negatively related to the likelihood of a managerial
succession.

47
The direction of the relationship between collective turnover and performance also
warrants investigation. Just as principals might use an administrative position as a foot in the
door to get better jobs in administration, teachers might also try to move to “better” positions in
higher performing schools when the opportunities arise. Alternatively, teachers in low
performing schools might suffer from burnout associated with emotional labor and, ultimately,
decide to leave the teaching profession (e.g. Chang, 2009; Farber, 1991; Hughes, 2001). Teacher
attrition from low-performing schools has received significant attention in the education
literature and is considered a major challenge for both administrators and policymakers (e.g.
Boyd, Hamilton, Loeb, & Wyckoff, 2005; Clotfelter, Ladd, Vigdor, & Diaz, 2004; Grissmer &
Kirby, 1997; Lankford, Loeb, & Wyckoff, 2002). To build a more complete picture of the
temporal dynamics among frontline employee instability and performance, I will test the
following hypothesis:
H5b: Organizational performance is negatively related to collective frontline employee
turnover.
Empirical Findings
Few empirical studies consider the effects of performance on personnel instability (either
managerial succession or turnover among frontline personnel). Boyne et al. (2010) find evidence
that performance on the Comprehensive Performance Appraisal (CPA) (see footnote 4) is
negatively related to the likelihood of executive succession in English local governments.
Citizen perceptions of performance were not significantly related to executive succession. An
interesting finding emerging out of this study is that both CPA performance and citizen appraisal
scores were both negatively related to the total turnover rate of senior managers in English local
governments. In comparing the substantive effects, the authors conclude the effect of poor

48
performance is greater for senior managers than for chief executive officers in English local
governments.
While certain research contexts provide statistical evidence that the most likely
relationship among the variables is that turnover affects performance and not vice versa (e.g.
Meier & Hicklin, 2008), other researchers have provided evidence that performance might drive
collective turnover at the unit level (e.g. Van Iddekinge et al., 2009). A Granger test provides
evidence that frontline personnel instability drives performance in Texas school districts (Meier
& Hicklin, 2008). However, most analyses that use schools as the unit of analysis consistently
report that lower performing schools do, in fact, have higher levels of teacher attrition (e.g. Boyd
et al., 2005; Clotfelter et al., 2004; Grissmer & Kirby, 1997; Lankford et al., 2002). While not
all these studies make causal claims, the direction is assumed to run from school performance
(IV) to teacher turnover rates (DV). It is not clear whether the authors considered the alternative
relationship in their analyses or simply took the direction of the relationship for granted.
Personnel Instability and Organizational Human Capital
While many authors have noted that one of the costs of turnover is the loss of human
capital from an organization (e.g. Abelson & Baysinger, 1984; Becker, 1962; J. L. Cotton &
Tuttle, 1986; Darmon, 1990; Mobley et al., 1979; Muchinsky & Morrow, 1980; Price, 1977;
Roseman, 1981; Schultz, 1961; Tziner & Birati, 1996), no one in either the general or public
management literatures has tested whether collective frontline employee turnover leads to a less-
skilled workforce in subsequent periods. This is a considerable empirical void, given the
existing interest in both strategic human resource management and succession planning (e.g.
Delery & Doty, 1996; Groves, 2007; Jacobson, Rubin, & Selden, 2002; Perry, 1993; P. M.
Wright & McMahan, 1992).

49
Before I state hypotheses, I provide a general discussion of the labor market for teachers.
While findings from both the New York City school and education contexts might not be
generalizable to all settings, the data are available (see Chapter 4) to test empirically how
employee instability might be related to organizational human capital. I will also consider the
possibility that managerial succession could destabilize the frontline employee workforce of a
public organization, yet another consequence for the human capital management of the
organization.
Human Capital in Schools
Human capital has been defined as the knowledge, training, skills, abilities and other
intangibles, such as personality and experience that allows individuals to accomplish or perform
tasks (Becker, 1964). From the resource-based view of the firm, the aggregated human capital
located of a firm is a resource that the organization can use and develop to meet its goals or
objectives (e.g. Barney, 1991; Peteraf, 1993; Wernerfelt, 1984; P. M. Wright, McMahan, &
McWilliams, 1994). However, since the human capital is not owned by the firm, individuals
who have higher levels of “human capital” will seek the most desirable employment
opportunities. In other words, the most qualified candidates for jobs will often take the most
attractive jobs (Schultz, 1961). According to Clotfelter et al. (2004), “labor economists
generally model a worker’s choice of workplace as a utility-maximizing effort to select the
position offering the best combination of monetary compensation, including both current and
future compensation, and workplace amenities” (p. 252).
With respect to the teacher labor market, school performance plays an important role in
teacher attraction, selection, and attrition. This has become especially true in the era of “high-
stakes” testing. Clotfelter et al. (2004) argues that in an era characterized by accountability,

50
schools deemed effective are likely to be rewarded while those in failing schools are likely to be
subject to sanctions. As a result, “an accountability system increases the financial and
professional incentives for teachers to favor schools serving more advantaged students and
makes schools serving low-performing students even less attractive than they otherwise would
be” (Clotfelter et al., 2004, p. 254 ).
For teachers in a single-school district where salary schedules are likely to have little
variation across schools, the preferred school will be one with “easier to teach” students.
Guarino, Santibanez, and Daley (2006) find that minority, low-income and low-performing
schools had the highest levels of teacher attrition, or turnover. Furthermore, as teachers with
jobs at low-performing schools develop their own human capital (i.e. experience, training,
certification, specialization, etc.), they might themselves leave for more attractive jobs at higher
performing schools. The “sorting” of teachers creates a problem for principals of schools with
low-achieving students who can become dependent on the least qualified instructors to staff their
schools (Lankford et al., 2002).
The main point I want to illustrate by this discussion of the teacher labor market is that
any model examining the effect of collective turnover on the human capital quality of a school
must control for the past performance of a school, since school performance plays such a vital
role in how human capital is allocated among schools.8
Frontline Employee Turnover and Human Capital Quality
The empirical question I am interested in is: Even after controlling for past performance,
does collective frontline employee instability lead to lower levels of human capital quality in
future periods? High levels of employee turnover might create strain for organizations in terms
8 While a complete discussion of the teacher labor market is beyond the scope of this dissertation, I believe a limited
discussion is warranted. I will discuss modeling in greater depth in Chapter 4 and in Chapter 6 when I analyze the
relationship between turnover and organizational human capital.

51
of maintaining base levels of human capital in the wake of high turnover, especially if their
organization’s reputation or past performance makes it undesirable or difficult to attract highly
qualified workers. Any manager that has ever managed a frontline staff, whether it is a seasonal
crew of lifeguards or hourly employees at a fast food restaurant, knows that when one employee
leaves it usually is not completely disruptive to an organization. Managers can rely on remaining
members and slack resources to cover shifts and tasks with minimal disruption to the
organization while they take the time to find a suitable replacement (see Bourgeois, 1981;
Williamson, 1976). Given the fact that low levels of frontline employee turnover are minimally
disruptive, managers can take more time and be more selective in bringing in a replacement to
the organization.
However, when frontline employee turnover is high, managers and organizations might
not have the administrative slack to buffer an organization from the disruptive effect of collective
turnover on performance. As a consequence, managers might feel pressure to hire more
employees as soon as possible in order to minimize the disruption to the organization. As a
result of having less administrative slack with respect to employees, the higher turnover rates
might force the manager to hire less qualified employees. Even though bringing less qualified
employees into the organization might have negative consequences for performance, managers
of organizations facing large staffing shortages might perceive the consequences of not hiring
them as being worse. To examine the relationship between collective frontline employee
turnover and human capital quality in organizations, I will test the following hypothesis:
H6: Collective frontline employee turnover is negatively related to levels of human
capital quality in the organization.

52
Alternatively, there might be a reciprocal—or reverse—causal relationship that needs to
be examined between human capital quality and personnel instability. Scholars have observed
that the teachers most likely to turnover are those without the proper training or high-levels of
experience (e.g. Chapman, 1984; Chapman & Green, 1986). Why might this be the case?
According to Holland and Nichols (1964) individuals will seek careers in which they have both
experience and aptitude and leave vocations in which they do not. Thus, we might expect
schools with higher levels of young, inexperienced teachers to have higher levels of teacher
turnover. For young teachers without high levels of training or experience, the opportunity cost
of leaving teaching is much lower than career teachers who are vested and have spent
considerable money on maintaining their training and certifications.9 Additionally,
inexperienced teachers might not have the training required to cope with the highly involved and
highly emotional labor associated with being a teacher and, as a consequence, will burn out and
leave the profession. For all these reasons, we might expect see that the lower levels of training
and experience drive turnover. I will test the following hypothesis:
H7: Human capital quality is negatively related to levels of frontline employee turnover
in future periods.
Empirical Findings
Neither Hypothesis 6 nor Hypothesis 7 has been studied by public management scholars.
However, tangentially related questions have been explored in the education policy literature.
With respect to Hypothesis 6, education researchers have found that past school performance is,
generally, negatively related to aggregate-levels of teacher experience, training and certification.
These researchers, however, have not considered the independent effect of teacher turnover on
9 See Holzer and LaLonde (2000) for a more general discussion on the relationship between low-skill workers and
less educated workers and employment stability.

53
aggregate levels of a schools human capital quality (e.g. Clotfelter et al., 2004; Grissmer &
Kirby, 1997; Hughes, 2001; Ingersoll, 2001; Loeb, Darling-Hammond, & Luczak, 2005; Thaker
et al., 2008). When education researchers examine the relationship between collective teacher
turnover and human capital quality they model teacher education, experience, training, and/or
certifications as determinants of turnover (consistent with Hypothesis 7) (e.g. Boe, Sunderland,
& Cook, 2008; Chapman, 1984; Chapman & Green, 1986; Grissmer & Kirby, 1997; Guin, 2004;
Ingersoll, 2001; Loeb et al., 2005). The researchers fail to consider that high levels of frontline
employee turnover might degrade the aggregate human capital of the organization in future
periods.
Managerial Succession and Frontline Employee Turnover
It is also possible that frontline employee turnover will increase in the period following
the departure of a top manager from the organization. There are several possible explanations
for this relationship. First, as discussed earlier in this chapter, the departure of a manager and the
introduction of a new manager might mean change to the internal routines, goals, and
expectations present in an organization (see M. P. Allen & Panian, 1982; Boyne et al., 2011;
Miller, 1993). For employees who worked under the replaced manager, the opportunity costs
associated with learning new routines, goals, and expectations in a different organization are
much lower considering that a new manager is likely to introduce internal changes to the current
organization.
Second, it is also possible that a new manager will have a preference towards starting
fresh, and give some preference to bringing in “their own people” (Boyne et al., 2010, p. i265).
This, too, might result in the eventual alienation and departure of the frontline employees of the
organization present under the former manager. Finally, we might expect those employees with

54
a sense of loyalty to the departing manager to leave for several reasons. First, it is possible that
frontline employees might follow the former manager to a new organization. Second, extremely
loyal employees might leave simply out of spite or resentment towards the incoming manager.
While I cannot be certain which causal mechanism might be driving the relationship, I have
ample reason to test the following hypothesis.
H8: Managerial succession is positively related to frontline employee turnover in future
periods.
Empirical Findings
The relationship between managerial successions and frontline employee turnover has not
been examined in public administration scholarship. Boyne et al. (2010), however, examine the
relationship between chief executive officer (CEO) succession and top-management turnover
rates in English local governments. The authors find a strong negative relationship between
CEO succession and top-management turnover rates. A CEO succession from the prior year
leads an increase in the average-level of top-management turnover of seven percent. A CEO
succession is even associated with an average increase in top-management turnover of six
percent two years later.
Personnel Instability and Organizational Climate and Management
Traditional models of turnover and performance use human capital theory as the lens to
examine the relationship among the variables (e.g.Abelson & Baysinger, 1984; Byrt, 1957; J. L.
Cotton & Tuttle, 1986; Merwe & Miller, 1975; Mobley, 1977, 1982; Mobley et al., 1979; Price,
1977, 1989; Roseman, 1981; Staw, 1980; Steel, 2002). J. D. Shaw et al. (2005), however, argue
that scholars should begin to consider organizational social capital loss as an important lens

55
through which to understand turnover’s relationship with performance (see also Dess & Shaw,
2001).
Public administration scholars have recently been interested in how both managerial
(Boyne et al., 2011; Hill, 2005; O'Toole & Meier, 2003) and frontline employee (Meier &
Hicklin, 2008; O'Toole & Meier, 2003) instability are related to organizational performance. To
date, however, public management scholarship has not directly examined how disruptions caused
by personnel instability might affect both the internal social climate and management of public
organizations. There are two perspectives that might be useful in understanding these
relationships.
On one hand, it is possible that personnel changes might reap positive consequences for
certain aspects of an organization’s management (Hambrick & Mason, 1984; Miller, 1992,
1993). As I argued earlier in this chapter, a change in managers might have positive
consequences for an organization that has become stagnant and in need of innovation. Some
turnover among frontline employees might also have positive effects as low performers depart
and are replaced with employees that might bring new ideas and energy to the organization.
Getting rid of the “bad apples” might serve to strengthen existing social relationships and
facilitate the establishment of effective management systems.
On the other hand, both managerial succession and collective frontline employee
turnover might undermine organizational social integration (e.g. Blau, 1960) and social capital
(e.g. Dess & Shaw, 2001; Leana & Van Buren, 1999; J. D. Shaw et al., 2005) and, thus, degrade
aspects of an organization’s social climate and management. In addition to less integration and
organizational social capital in organizations with high levels of personnel instability, we might

56
expect collective turnover to exacerbate existing problems as remaining employees might
become disinterested and disengaged (e.g. J. D. Shaw et al., 2005; Steers et al., 1979).
I will now discuss group integration (e.g. Blau, 1960) and organization social capital
(e.g. Dess & Shaw, 2001; Leana & Van Buren, 1999; J. D. Shaw et al., 2005) before formulating
hypotheses on the relationships among personnel instability and indicators of the organization’s
social climate.
Group Integration
Personnel instability might negatively affect an organization’s social climate by hindering
the integration of coworkers into a cohesive organizational system. According to Blau (1960),
“A person is considered to be integrated in a group if the other members find him sufficiently
attractive to associate with him freely and accept him in their midst as one of them” (p. 546).
Relationships, both primary and secondary, are essential to understanding integration. A primary
relationship is emotionally involved, biased, and governed by ascribed criteria and a secondary
relationship is emotionally neutral, impartial and focuses on achieved criteria (Price, 1968, p.
146). In organizations, most of the relationships among coworkers are somewhere between
extreme primary and extreme secondary in nature, and are closer to a friend or a close friend
(Price, 1977, pp. 70-71). Close friendships are the type of relationships developed through
integration in an organizational setting.
Price (1977, p. 100) observes that high employee turnover is likely to lead to lower
amounts of integration. Price draws on prior scholarship as evidence of this relationship. Uyeki
(1960) finds that frequent transfers among draftees during the cold war lead to reduced levels of
social integration within military units. Moskos (1970) argues that the year-long tours of combat
soldiers during Vietnam created the rapid turnover of personnel, and “hindered the development
57
of primary group ties” (p. 142). Finally, in a study of nurses, Burlington, Lentz, and Wilson
(1956, p. 106; quoted in Price (1977)) observe:
…that where nurses had worked together for a long periods of time, they came to feel
that they ‘belonged’ to that floor and had a vested interest in maintaining its reputation.
Along with the individual’s desire to live up to her own standards was a reluctance to let
her team down. Where turnover was acute, on the other hand, this second impetus to
moral conduct was missing. Each individual felt isolated and perhaps discouraged in her
fight to maintain standards.
Price (1977) argues that with respect to group integration:
…the intervening mechanism, mostly implicit, appears to be the amount of interaction.
Individuals who are members of an organization for a long time have a large amount of
interaction with other individuals in the organization, and some of this interaction results
in the formation of close friends. When turnover is high, this opportunity to interact
declines, and few close friends are formed. The amount of interaction appears to be the
means whereby variations in turnover promote variations in integration. (p. 101)
Drawing on this prior work examining group integration, we might expect that employees
report lower levels of respect and support in organizations where the personnel are highly
unstable. This is a consequence of the inability of individuals to bond and integrate, and develop
friendships with coworkers. Furthermore, we might expect that it takes time for new managers
to themselves integrate into an organization.
Organizational Social Capital
Organizational social capital theory is the second perspective that might also be useful in
understanding the detrimental effects of personnel instability to the social climate of an

58
organization. Leana and Van Buren (1999) broadly define organizational social capital as a
“resource reflecting the character of the social relationships within a firm… realized through
members’ collective goal orientation and shared trust” (p. 538). According to Leana and Van
Buren (1999), “unlike other kinds of capital, social capital cannot be traded on an open market;
rather it is a form of capital that can change as relationships and rewards change over time, and it
disappears when the relations cease to exist” (p. 539).
Leana and Van Buren (1999) argue that there are two key components to organizational
social capital: associability and trust. Associability demonstrates a willingness and ability to
participate in collective action within an organization, and trust is the willingness to make your
own self vulnerable. The authors also argue that social capital is a byproduct of other
organizational activities and experience (p. 541). Leana and Van Buren (1999) suggest that one
of the most effective ways to enhance and maintain stores of organizational social capital is to
maintain stability in the relationships that already exist. Thus, personnel stability is a key
component in maintaining and cultivating organizational social capital. This is particularly true
since trust and associability are developed out of interactions and reciprocity among coworkers.
Personnel Instability and Organizational Social Climate
Following the discussion of organizational integration and social capital, we should
expect instability among coworker relationships to have a negative effect on variables that might
serve as indicators for different aspects of social climate, specifically employee perceptions of
coworker support and coworker respect. Drawing on the early theoretical statements on
integration (Blau, 1960; Price, 1977) and the development of organizational social capital (Leana
& Van Buren, 1999), I will examine the following hypotheses:
H9a: Collective frontline employee turnover is negatively related to coworker trust.

59
H9b: Collective frontline employee turnover is negatively related to coworker support.
H9c: Collective frontline employee turnover is negatively related to coworker respect.
A change in the organization’s top manager is also likely to have effects on the
organization’s social climate. According to Leana and Van Buren (1999), the loss of key
organizational members, such as top managers, can have major consequences for organizational
social capital, since it leads to dynamic changes in the social patterns and socials structures
within an organization. At the organizational level, it takes managers time to negotiate and build
working relationships with employees, and time for employees to trust and feel genuine support
from new managers. Thus, I will test the following hypothesis:
H10: Managerial succession is negatively related to perceptions of managerial support.
Empirical Findings
Sociologists have conducted case studies suggesting that turnover is negatively related to
coworker integration (e.g. Burlington et al., 1956; Moskos, 1970; Uyeki, 1960). In both general
and public management scholarship there has yet to be a quantitative study of the hypotheses I
have specified. In quantitative analyses, the aspects of organizational climate have only been
studied as determinants of individual turnover or turnover intention. Traditionally, models of
employee turnover view indicators of coworker respect and support as variables positively
related to employee retention—or negatively related to turnover (e.g. D. G. Allen et al., 2003;
Ducharme et al., 2007).
Managerial Succession and Formalization
Decreases in organizational integration and the loss of social capital are not the only
consequences that we might expect as a result of managerial succession. Early organizational
theorists suggested that new managers are likely to introduce higher degrees of formalization to
60
an organization (Carlson, 1962; Gouldner, 1954). According to Gouldner (1954, p. 94), “There
is a close connection between succession and of bureaucratic development, particularly in the
direction of formal rules.” New managers are unaware of the informal systems of arrangements,
norms and procedures in the organization that the frontline employees have in place when they
arrive in an organization. As I discussed earlier in this chapter, the development of these
informal routines are important to frontline public service employees who face a complex task
environment (e.g. Feldman & Pentland, 2003; Lipsky, 1980; O'Toole & Meier, 2003). While
these informal routines might facilitate public service performance, these informal routines can
threaten a new manager’s control of the organization. One way that new managers might
attempt to gain control of the organization is by increasing formalization, and introducing new
rules and formal procedures (Gellard, 1967, p. 24).
Gouldner (1954) describes the process through which managerial succession increased
the formalization at a gypsum plant:
The new manager from outside the plant was oriented to rational norms, whereas the old
manager and workers were oriented to traditional norms…The arrival of the new
manager reduced the consensus which formerly existed between the manager and the
workers. Because they did not share the manager’s rational norms, the workers reduced
their informal interaction with him and were not motivated to conform to his
norms….From the perspective of the new manager, the plant’s control of the worker was
threatened. To maintain control the new manager began to enforce existing rules, which
hitherto had been unenforced, and to establish new rules. (cited in Price, 1977, pp. 98-
99).

61
Keeping in mind the increase in formalization that might occur following a managerial
succession, as well as my discussion of social integration and social capital, I will now consider
the ways managerial succession might affect frontline employee perceptions of management
practices in public organizations.
Personnel Instability and Client Orientation
I define a client orientation as the degree to which a public organization seeks to gather
information from the citizens it serves and then uses the information to better meet client needs.
As an example, a client-oriented public school is one where teachers and administrators obtain
information from parents/guardians about the learning needs of students. Furthermore, the
organization is proactive in sharing information with parents/guardians.
Following a managerial succession, we might expect management to focus on the
processes internal to the organization, such as implementing new policies and procedures
(Gouldner, 1954). Likewise, the attention and focus of other frontline personnel might be inward
as they try to learn the expectations of new managers in the wake of new uncertainty (Whitford,
2002a). Changes in management might force employees to focus on relationships internal to the
organization, as opposed to those external to the organization. As a consequence, we might
expect that frontline employees have less external focus and interaction with the clients
following a change in the organization’s top management. To test this relationship, I will
examine the following hypothesis:
H11a: Managerial succession is negatively related to employee perceptions of client
oriented management.
High frontline employee turnover might lead to an internal organization focus, even when
there is no change in manager. New employees might focus on integrating and fitting in with

62
organizational members, as well as the learning the organization’s formal and informal policies,
procedures, and routines. As a consequence, new frontline employees might spend less time
directly engaging with clients. Thus, I will test the following hypothesis:
H11b: Collective frontline employee turnover is negatively related to employee
perceptions of client oriented management.
Managerial Succession and Employee Feedback
Feedback is one tool new managers can use to communicate changes in policies and
procedures, as well as clarify organizational goals in complex task environments (Favero, Meier,
& O'Toole, 2012). Providing feedback is also one way a new manager might assert control over
the organization. Feedback can be a means to communicate new organizational priorities in the
wake of ambiguity arising from the change in leadership (see Whitford, 2002a). Providing
feedback is a way that new managers might create a shared understanding of changes in
expectations with employees that have gotten used to the policies and procedures of the former
manager. I will test the following hypothesis:
H12: Managerial succession is positively related to employee perceptions of managerial
feedback.
Managerial Succession and Goal Oriented Management
The ability of managers to set clear, challenging goals for employees has emerged as a
key determinant of individual employee performance in the second half of the twentieth century
(Locke & Latham, 1990, 2006). Goals and goal clarity have received a lot of attention in public
administration scholarship as determinants of both job satisfaction and employee performance
(e.g. Bozeman & Gordon, 1998; Caillier, 2010; Chan & Rainey, 2011; Chun & Rainey, 2005;
Lan & Rainey, 1992; Moynihan & Pandey, 2005; Paarlberg & Perry, 2007; Park & Rainey,

63
2008; Stazyk & Goerdel, 2010; B. E. Wright, Moynihan, & Pandey, 2012; B. E. Wright &
Pandey, 2011). Interestingly, scholars have not considered the effect of top manager change on
employee perceptions of goal clarity within an organization.
How might managerial succession affect the frontline employee perceptions of goals
within an organization? As Whitford (2002a) argues, when a top manager leaves an
organization, the remaining employees might be uncertain or unclear about the priorities of the
new or incoming manager. Furthermore, as the new manager learns the organization, it might
take time for them to identify what the organizational goals should be (e.g. Hannan & Freeman,
1984). This might be particularly true of bureaucratic organizations that are highly inertial and
where internal change can take both considerable time and effort (Hill, 2005).
As the new manager takes time to learn the landscape of the organization, it might take
time before they communicate organizational goals. With time, the new manager’s goals might
be communicated and understood throughout an organization, but the period following a
managerial succession might be characterized by uncertainty. On the other hand, if the former
manager had grown stale and uninspired, new management might be able to immediately and
effectively communicate new goals to frontline employees (e.g. Miller, 1991, 1992; Miller,
1993). Given the theoretical reasons to expect either a positive or negative relationship, I will
test the following non-directional hypothesis:
H13: Managerial succession is associated (positively or negatively) with employee
perceptions of goal oriented management. 10
10
I also recognize that the relationships between managerial succession and employee perceptions of management
might be contingent on a number of factors, including past performance (Boyne et al., 2011), the previous manager’s
tenure (Hill, 2005), and whether the new manager is an internal or external hire (Hill, 2005). This is true of all the
measures of management. However, examining these relationships lie outside the scope of this dissertation.

64
Managerial Succession and Credible Commitment
According to Favero et al. (2012), “Credible commitment in organizations has three
parts: the belief that the manager represents the interests of the organization, rather than his or
her own personal interests; clear communication by the manager; and the development of trust in
the manager by subordinates” (p. 9). On one hand, we might expect new managers to show a
renewed commitment to the success of an organization (Miller, 1991, 1992, 1993). This might
be demonstrated by the establishment of new policies and procedures (Gouldner, 1954).
On the other hand, it is not clear how new rules might be interpreted by employees
within an organization, as they might be disruptive in the short-term (Hannan & Freeman, 1984).
It is possible that frontline employees in the organization interpret changes as self-serving to new
managers—and not beneficial to the organization. This might be especially true if employee
routines that were once informal are now governed by formal policies and procedures perceived
by employees as burdensome. One could also argue that the loss of organizational integration
and social capital might make all employees somewhat skeptical of new management. Since
there are reasons to think the relationship between managerial succession and credible
commitment could be either positive or negative, I will test the following associational
hypothesis:
H14: Managerial succession is associated (positively or negatively) with employee
perceptions of a manager’s credible commitment to the organization.
Personnel Instability and Participative Decision Making
When a new manager enters the organization he or she will try to assert control over the
organization (Gouldner, 1954). New managers focused on their own agenda might not be
inclined to incorporate frontline employees into decision making. It will take time for new

65
managers to build relationships with employees and incorporate these relationships into the
management of the organization in meaningful ways. In particular, it very likely takes time to
build relationships with employees based on trust, respect and shared understanding of
organizational goals. However, organizational integration and social capital are going to be
required before new managers can put in place effective systems that encourage employee
participation and collaboration (e.g. Gittell & Douglass, 2012). Thus, I will test the following
hypothesis.
H15a: Managerial succession is negatively related to employee perceptions of
participative decision making.
Before managers include frontline employees in the decision making process, they need
to trust that the employee is going to contribute to the achievement of organizational goals. If
the manager does not really know an employee, they likely will not include them in the decision
making process. New employees might need to integrate into an organization before a manager
will allow them to participate in decision making. Perhaps more importantly, in order for
frontline employees to work together effectively, they must trust and respect each other. If high
turnover diminishes integration and, thus, trust and respect, we might expect that they will be
less likely to engage each other and work together. I will test the following hypothesis:
H15b: Collective frontline employee turnover is negatively related to employee
perceptions of participative decision making.
Empirical Findings
While the management practices discussed above have all received some attention in
public management scholarship, no public administration scholar has considered the ways that
personnel instability might be related to the establishment of these practices.

66
Chapter Summary
In this chapter, I have reviewed the relevant research literature necessary to answer the
research questions posed in this dissertation. Drawing on the literature, I have developed
hypotheses to test relationships among personnel instability and key variables of interest. In the
chapters that follow, I describe the data and method I use to test the hypotheses. I also present
and discuss the findings among the key independent and dependent variables.
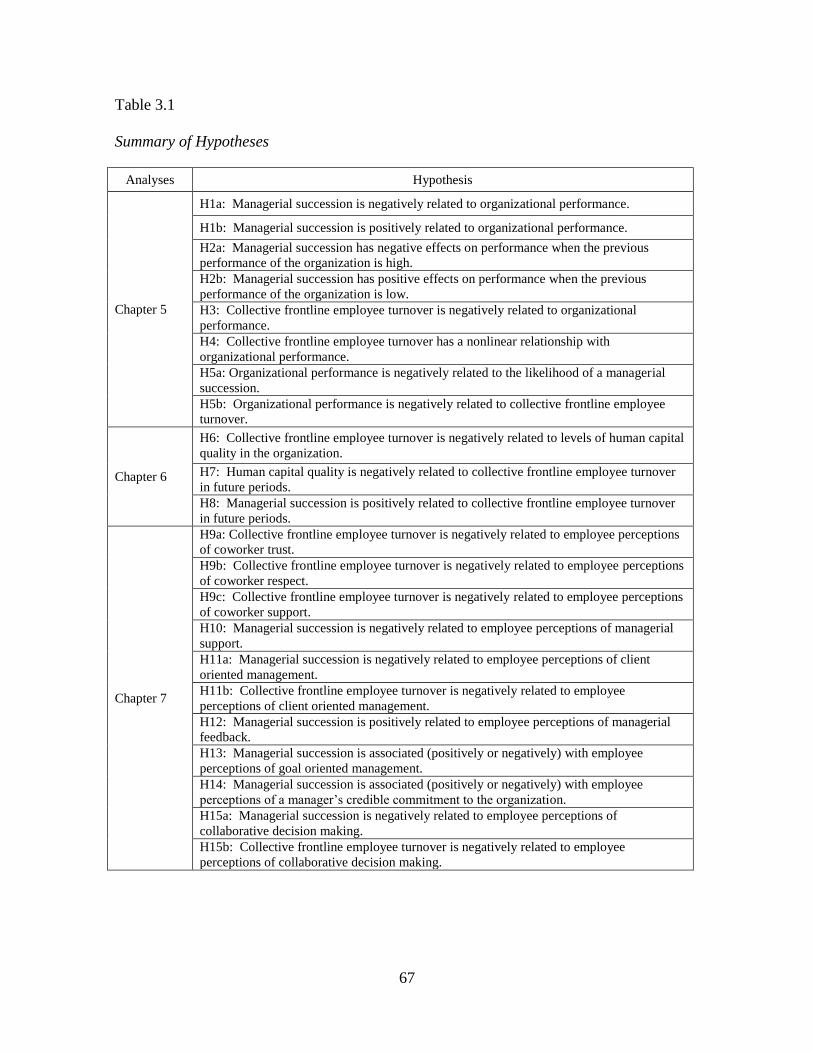
67
Table 3.1
Summary of Hypotheses
Analyses Hypothesis
Chapter 5
H1a: Managerial succession is negatively related to organizational performance.
H1b: Managerial succession is positively related to organizational performance.
H2a: Managerial succession has negative effects on performance when the previous
performance of the organization is high. H2b: Managerial succession has positive effects on performance when the previous
performance of the organization is low. H3: Collective frontline employee turnover is negatively related to organizational
performance. H4: Collective frontline employee turnover has a nonlinear relationship with
organizational performance. H5a: Organizational performance is negatively related to the likelihood of a managerial
succession. H5b: Organizational performance is negatively related to collective frontline employee
turnover.
Chapter 6
H6: Collective frontline employee turnover is negatively related to levels of human capital
quality in the organization.
H7: Human capital quality is negatively related to collective frontline employee turnover
in future periods. H8: Managerial succession is positively related to collective frontline employee turnover
in future periods.
Chapter 7
H9a: Collective frontline employee turnover is negatively related to employee perceptions
of coworker trust.
H9b: Collective frontline employee turnover is negatively related to employee perceptions
of coworker respect. H9c: Collective frontline employee turnover is negatively related to employee perceptions
of coworker support. H10: Managerial succession is negatively related to employee perceptions of managerial
support. H11a: Managerial succession is negatively related to employee perceptions of client
oriented management. H11b: Collective frontline employee turnover is negatively related to employee
perceptions of client oriented management. H12: Managerial succession is positively related to employee perceptions of managerial
feedback. H13: Managerial succession is associated (positively or negatively) with employee
perceptions of goal oriented management. H14: Managerial succession is associated (positively or negatively) with employee
perceptions of a manager’s credible commitment to the organization. H15a: Managerial succession is negatively related to employee perceptions of
collaborative decision making. H15b: Collective frontline employee turnover is negatively related to employee
perceptions of collaborative decision making.

68
CHAPTER 4
DATA, MEASURES, AND RESEARCH METHODS
To test the hypotheses I specified in the previous chapter, I will use data from New York
City schools. The analyses I present in the following chapters draw on two key data sources: 1)
Archival data available from the New York State Department of Education (NYS-DOE) and the
New York City Department of Education (NYC-DOE); and 2) Teacher and parent responses to
the NYC-DOE’s annual school environment survey.11
The school is the unit of analysis and all
variables are measured at the school level. This is a unique data source that is just beginning to
be used in public management scholarship examining the relationship between management and
performance (Favero & Meier, 2012; Favero & Meier, 2013; Favero et al., 2012; Sun & Van
Ryzin, 2012). I will now briefly discuss the New York City schools research context.
New York City Schools
The New York City Department of Education (NYC-DOE) is the largest system of public
education in the United States. As of 2012, the system served more than 1.1 million students in
nearly 1,700 elementary, intermediate (K-8), middle, high, alternative, special education, and
charter schools. NYC-DOE employed more than 75,000 teachers and had an annual budget of
approximately $24 billion.12
11
One complication with merging data from the NYS-DOE and NYC-DOE is that they utilize different school
codes, or identification numbers. For data from the State of New York, a city database code had to be generated for
each school from both the entity id and the district id provided by the state for each school. As a rule, all data were
matched NYC-DOE school database number and the year. 12
Statistics retrieved on October 12, 2013 from http://schools.nyc.gov/AboutUs/default.htm.

69
System Governance
The NYC-DOE is headed by the New York City Schools Chancellor. Beginning in 2002,
the Mayor of New York City was given direct control of the NYC-DOE. Since 2002, the
Chancellor has been appointed by the Mayor of New York City. The Chancellor oversees all
schools across New York City’s five boroughs (Manhattan, Bronx, Brooklyn, Queens, and Staten
Island).
Community School Districts
There are 32 Community School Districts (CSDs) across the five boroughs that oversee
the elementary, K-8, and middle schools within a specific geographic area. Each CSD has its
own superintendent. The superintendents are responsible for performing their statutory duties,
which include appointing principals in districts, approving teacher tenure decisions, and
approving school budgets. Not included in these CSD’s are the high school superintendents. In
total, there are eight high school superintendents that supervise all the high schools across the
five boroughs.
Each CSD is represented by a Community Education Council (CEC). CECs have 11
voting members and are composed of nine parents and two additional members who are
appointed by borough presidents. Appointees must either own or operate a business in the
district or be a district resident. Since 2005, parent selections and appointments by borough
presidents have taken place every two years.13
While CEC’s provide district-level advocacy and representation for community schools
serving students in all grades from kindergarten through eighth, Citywide Councils were
established to advocate on behalf of high school students, English language learners, special
education students, and students attending alternative schools. The Citywide Councils oversee
13
Statistics retrieved on July 9, 2013 from http://schools.nyc.gov/Offices/CEC/default.htm.

70
schools spread throughout the five boroughs. Unlike CECs, the Citywide Councils are not bound
to a specific single geographic area. The governance of New York City Schools is complex,
containing both independent and overlapping levels of community oversight and accountability.
School Choice
New York City parents have some degree of choice in where students go to school. The
NYS-DOE and the NYC-DOE determine which students can participate in the Public School
Choice (PSC) program. As of 2013, students are eligible to transfer is they are in a school
labeled as “Priority” or “Focus” as a consequence of being “among the lowest performing
statewide in terms of overall performance, graduation rate, and/or other criteria,” or if the school
is being phased out by the NYC-DOE due to low performance and/or low demand.14
New York City School Teachers
Maintaining the number of qualified teachers needed to staff all the schools in the system
is a persistent challenge for the NYC-DOE. In 2012, for instance, the NYC-DOE expected to
hire approximately 5,000 teachers. The NYC-DOE website notes a high demand for teachers in
special education, speech, the sciences, English as a second language, as well as Chinese. In
addition to these specific subject areas, teachers are needed for schools designated as “high
need” due their high percentages of students with special needs, including high percentages of
English language learners and/or low-income students.
There are several different paths to certification for New York City School teachers. One
path is for individuals who train in college to be teachers. Upon graduating from a program with
a State approved university curriculum in education these teachers are eligible for their Initial
Certification. After five years of teaching, these teachers are then eligible to receive their
Professional Teacher License. In addition to traditional paths to teacher certification, there are a
14
Retrieved on June 31, 2013 from http://schools.nyc.gov/ChoicesEnrollment/ChangingSchools/default.htm
71
number of alternative paths to certification that might put teachers who did not receive training
as part of a State approved curriculum in the classroom. These programs include the New York
City Teaching Residency, New York City Teaching Fellows, and Teach for America (TFA).
Transitional Licenses allow teachers to be in the classroom while they participate in these
alternative paths to teaching and meet the criteria for full certification. Teachers in these
programs receive a provisional certification and are included in a school’s count of certified
teachers.
New York City has in place an “Open Market Hiring Transfer System” that allows
current teachers, as well as guidance counselors, school secretaries, lab specialists, school
psychologists, speech improvement therapists, school social workers, attendance teachers and
United Federation of Teachers paraprofessionals to seek positions in different schools throughout
the system. In essence, this gives hiring preference to teachers that are already part of the union.
Since elementary and middle school students use a common testing format different than
high school students, this research will only include the population of elementary, intermediate
(K-8), and middle schools, and excludes all high schools. Furthermore, I exclude all District 75
schools from the study since these schools only provide specialized services to disabled students.
All of the schools examined are part of a CSD with its own CEC.
After excluding the high schools and District 75 schools, there are between
approximately 800 to 1,100 schools, and thus observations for each year from 2002 and 2012.15
I provide some basic summary statistics to give the reader a better sense of the distribution of
schools over time, and across both boroughs and CSDs.
15
Not all variables are available for all years. For instance, the NYCDOE annual environment survey was
conducted beginning in the 2006-07 school year.
72
Table 4.1 demonstrates the distribution of observations by school type for each year from
2002 to 2012. Table 4.2 shows the distribution of the observations by CSD from 2005 to 2012 to
provide a general sense of the distribution of the total number of schools across CSDs and
boroughs. Finally, Table 4.3 provides basic descriptive information on the schools in each
borough by school type for the year 2012.
Main Variables of Interest
There are two forms of personnel instability in NYC schools that I examine in relation
with other performance and organizational variables: managerial succession and collective
personnel turnover. I now discuss the operationalization of these two important variables.
Managerial Succession
Following past public administration scholarship, I treat managerial succession as a
discrete change in an organization’s top manager (Boyne et al., 2011; Hill, 2005). In each NYC
school the top manager is the principal. This variable, however, is not a part of the data reported
by either NYS-DOE or the NYC-DOE. To generate this variable, I constructed a list of each
principal for all New York City schools from the Basic Education Data System (BEDS) provided
by the NYS-DOE for the years 2002 to 2012. I went through the list of principals for each
school and coded a discrete change in the principal from the previous year as a “1,” and coded
the variable as “0” if there was no change. If there was no observation for the school in the
previous year, the variable is coded as missing.
Table 4.4 provides summary statistics of the variable from 2003 to 2012 for each type of
school (elementary, middle, K-8). While there are fluctuations over this range, on average
twelve percent of schools change principals in any given year. All school types experienced

73
fluctuations over this time period. Interestingly, in 2009 there were very few changes in school
principals, which might, in part, be attributed to the economic recession that began in 2008.
Limitations of Managerial Succession Measure
There are several important limitations to this measure as a dimension of personnel
instability. First, I have no measure of a principal’s length of service in a school since the
records of school principals only go back to 2002. Past studies have used length of principal
tenure as a dimension of personnel stability (O'Toole & Meier, 2003). Second, I have no way of
determining whether the new principal was an internal promotion within the school, such as an
assistant principal being promoted to the principal, or an external transfer. We might expect
external transfers to introduce more instability to an administrative system than internal transfers
and, as discussed in Chapter 3, Hill (2005) found this variable was, in fact, related to
organizational performance following a managerial succession.
Collective Frontline Employee Turnover
Collective frontline employee turnover is the percentage of teachers who leave a school
on an annual basis. The NYS-DOE defines teacher turnover as the number of teachers in that
school year who were not teaching in the following school year divided by the number of
teachers in the specified school year expressed as a percentage.16
Thus, the turnover reported in
the 2007 -2008 school year is a function of the number of teachers who did not return to the
school in the following 2008-2009 school year. The formula is expressed mathematically as:
Price (1977) calls the measure an instability rate. However, other scholars have used
this measure in the labor turnover literature, but have called it by other names. Brissenden and
16
Definition comes from the State of New York at https://reportcards.nysed.gov/statewide/2011statewideAOR.pdf

74
Frankel (1922) call the measure a “skill wastage index,” Byrt (1957) refers to the measure as an
“experience dilution factor,” while Samuel (1969) calls it a “skill conservation factor.” Scholars
used this measure in previous public administration research examining the relationship between
employee instability (or turnover) and performance (Hill, 2005; Meier & Hicklin, 2008; O’Toole
& Meier, 2003).17
There are several advantages to using this measure. First, it is easy to compute, requiring
only a list of organizational members at two points in time, and might be more reliably measured
than alternative measures. Second, the measure is readily understandable, as higher instability
indicates higher levels of turnover. Finally, instability has a very precise meaning, since the rate
is based on a number of specific members measured at two points in time (Price, 1977, pp. 17-
18). Descriptive statistics of collective employee turnover, disaggregated by school type and by
year, are included in Table 4.5.
Limitations of Collective Turnover Measure
The instability rate, however, does have several limitations as a measure. In
organizations with many levels of hierarchy there is a tendency undercount turnover among
lower-level employees. As an example, if the instability rate were calculated over one year
between two specified dates, any employee hired after the initial count would not be counted in
the measure. Also, many lower-level employees might both begin their service after the initial
count and exit before the final count. The result might be an underestimation of the actual
personnel instability and, thus, attenuate the relationships observed in my analyses. With respect
to New York City teachers, however, I do not expect either of these issues to be a problem, since
turnover is calculated based on teacher rosters taken every December and most teacher exits are
17
In addition to instability rates and its variants, there are a number of alternative measures used in the literature to
calculate turnover, including average length of service, accession rates, separation rates, survival rates. For a
complete discussion of these different measures see Price (1977, pp. 12-23) and (Merwe & Miller, 1975, pp. 3-30).

75
likely to occur at points between school years (summer). As a consequence of the structure of
the school year, most of the teacher turnover is likely accounted for in the measure.
A third limitation of the measure is that it does not distinguish between those who leave
the organization voluntarily (quit/retire) and those that are fired (discharged) by the organization
(Hausknecht & Trevor, 2011). While I do not have data on the percentage of quits versus
terminations, anecdotal evidence suggests that firing a teacher in NYC is difficult.18
As a result,
I believe that the percentage of involuntary turnover to be relatively low compared to voluntary
turnover.
While the employment context of NYC school teachers guards, to some extent, against
usual shortcomings from using an instability rate, there are two shortcomings that are not
addressed by the research context. First, the measure does not take into account the average
length of a teacher’s service in the organization (Price, 1977, p. 18). The second, and most
significant, limitation of the measure is that it does not account for internal transfers of teachers
within a school over the course of a year. As an example, the measure does not account for the
possibility that one teacher might be assigned to three different classrooms over the course of a
year within the same school. Arguably, this type of within-school classroom instability over the
course of the school year is at least as, if not more, important than instability that occurs when
individuals leave the school. As a result, the formula I use to calculate instability is likely a
“shortened” measure and does not capture the full range of instability that might exist. This
might attenuate the relationships that I observe between the instability rate and the other
variables of interest.
18
In 2010, National Public Radio (NPR) reported on “rubber rooms,” locations where suspended teachers would sit
during the school day in order to continue to collect their salary. The complete story was retrieved December 25,
2013 from http://www.npr.org/templates/story/story.php?storyId=126055157.

76
Organizational Performance
All students in grades three through eight are required to take both an English Language
Arts (ELA) and a Mathematics (MATH) standardized exam. These data are available from both
the NYS-DOE and NYC-DOE. These data are used to create the math pass rate and ELA pass
rate variables for each elementary and middle school.19
The same measures are used by Sun and
Van Ryzin (2012) in their single-year, cross-sectional examination of the relationship between
performance management practices and school performance. Table 4.6 and Table 4.7 provide
summary statistics of test scores from 2005 to 2012.
Student pass rates have been used as measures of performance in previous public
administration research (e.g. Meier & Hicklin, 2008; Meier & O'Toole, 2002, 2003; O'Toole &
Meier, 1999, 2004a; O’Toole & Meier, 2003). For policymakers, pass rates provide highly
salient measures of performance and are used in making decisions with respect to curriculum,
funding, and other resource allocations. Furthermore, pass rates are often used by individual
citizens to make decisions about what constitutes a “good” or “bad” school.
However, public management scholars also acknowledge that the performance of public
organizations is, in fact, a multidimensional construct (e.g. Amirkhanyan, Kim, & Lambright,
2014; Andrews, Boyne, & Walker, 2006; Boyne, 2002; Favero & Meier, 2012; Selden & Sowa,
2004). Some scholars, such as Radin (2006), have been very critical of using limited
assessments of performance to make sweeping judgments about organizations and the people
working in them. Recognizing the multidimensional nature of public organization performance,
19
In addition to the indicators of performance among elementary and middle school students, school pass rates are
available for the New York State Regents’ exams administered to high school students. The state reports the
percentage of students passing the exams. Since grades three through eight use a different test format from high
school students, middle and elementary schools will have to be modeled separately from high schools, or a common
index will need to be created among all of the schools based on pass rates (see Favero et al., 2012). However, in
this dissertation I only look at elementary, intermediate, and middle schools.

77
I attempt to create an alternative measure of performance that measures clients’ perceptions of
the quality of the organization. I construct a parent satisfaction variable using parent responses
to the NYC-DOE School Environment Survey (sample of the instrument in Appendix A). The
items used are the average parent response on a four-point Likert scale. Parent response rates to
the survey were 26 percent in the 2006-07 school year, 40 percent in the 2007-08 school year, 45
percent in the 2008-09 school year, 49 percent in the 2009-10 school year, and 52 percent in the
2010-11 school year. Table 4.8 shows all the items used to construct this alternative measure of
organizational performance for the five year period of time ranging from the 2006-07 to the
2010-11 school years. Together these items have a Cronbach’s alpha of .98. Bartlett scoring is
used to extract a measure of parent satisfaction.
Human Capital Quality
The NYS-DOE staffing data contain a number of measures that I might use to assess the
different levels of human capital quality in each school. The percentage of teachers with a
master’s+30 hours or doctorate consists of: 1) teachers with a master’s degree plus another 30
credits that were taken after completing the master’s degree but not as part of their master’s
credits; and/or 2) teachers holding a doctorate.20
The percentage of teachers out of certification includes both teachers whose certification
has expired as well as teachers that have never held a valid teaching certificate. The data also
includes the percentage of teachers with fewer than three years teaching experience Table 4.9,
Table 4.10, Table 4.11 provide summary measures of these three measures from 2005-2012.
Additional Measures of Human Capital Quality in the Data
The percentage of teachers with no valid teaching certificate is defined by the State of
New York as the percentage of individuals teaching without certification and doing so on more
20
Description of the status was retrieved from http://www.uft.org/our-rights/salary-differentials
78
than an incidental basis. One concern with this measure is that the percentage of teachers with
no valid teaching certificate does not appear to be consistently reported and there are lots of
missing data. One peculiar pattern that emerges is that one year a school might have a very high
percentage of teachers with no certification, report zero percent of the teachers as holding no
certification the following year, and once again report a very high percentage of teachers holding
no certification in the next year. As a result, I will not include this variable as a control or
explanatory variable in my final model specifications.
The percentage of core classes not taught by “highly qualified” teachers is calculated
using the number of courses taught by teachers that: 1 ) do not have a bachelor’s degree; 2) are
not certified to teach in a subject area or otherwise in accordance with state standards; or 3) have
not shown subject matter competency. A teacher who has taught outside of their subject area is
considered highly qualified if: 1) the teacher had been determined by the school or district
through the Highly Objective Uniform State Standards of Evaluation (HOUSSE) process, or
other state-accepted methods, to demonstrate acceptable subject knowledge and teaching skills;
and/or 2) the class in question was not the sole assignment reported.21
Additionally, the data
includes the percentage of courses taught by teachers without the appropriate certification.
A reason to exclude the percentage of courses taught by teachers without appropriate
certification and the percentage of courses not taught by highly qualified teachers from my
analyses is that they are calculated as a function of the total number of courses offered (a
variable related to school size and one I discuss below with other controls), and other human
capital quality measures, including percentage of teachers out of certification, percentage of
teachers with fewer than three years teaching experience and percentage of teachers with a
21
Descriptions retrieved from https://reportcards.nysed.gov/statewide/2011statewideAOR.pdf

79
master’s+30 or doctorate. However, I do explore these excluded measures of human capital
quality as alternative dependent variables in Chapter 6.
Internal Social Climate and Management
Early scholarship defined an organization’s climate as, “the enduring organizational or
situational characteristics that organizational members perceive” (Rentsch, 1990, p. 668; see
Schneider & Bartlett, 1968). Previous scholarship identified organizational climate as both an
antecedent and mediating variable of important employee outcomes, including employee work
attitudes, motivation, and performance (Parker et al., 2003). In this dissertation, I operationalize
New York City school teachers’ perceptions of several broad characteristics of their schools’
internal social climate: coworker support, coworker respect, coworker support, and managerial
support. I also recognize that an organizational setting is characterized by employee perceptions
of managerial behaviors and certain managerial behavior might be undermined by personnel
instability. I operationalize client oriented management, collaborative decision making,
managerial feedback, credible commitment, and goal oriented management in New York City’s
public schools.
Since 2007, all New York City schools have participated in the NYC School
Environment Survey. All parents and teachers, as well as students in grades six through twelve,
are invited to participate in the survey. Information from the survey is used to gather feedback
from key stakeholders (parents, teachers and students) about each school’s learning environment.
According to the NYC-DOE, “The information captured by the survey is designed to support a
dialogue among all members of the school community about how to make the school a better
place to learn.”22
22
Retrieved on January 15, 2013 from http://schools.nyc.gov/Accountability/tools/survey/default.htm.

80
The survey measures students’, teachers’, and parents’ opinions of their school’s level of
academic expectations, communication, engagement, safety, and respect among members. The
survey is intended to assist in assessing school performance beyond simple standardized test
scores. The survey was initially conducted in the 2006-07 school year and continues today.
Teacher response rates were 44 percent in the 2006-07 school year, 61 percent in the 2007-08
school year, 73 percent in the 2008-09 school year, 76 percent in the 2009-10 school year, and 82
percent in the 2010-11 school year. While there have been changes to the survey since its initial
implementation, the items I use have been administered consistently across years. While it would
be preferable to have individual-level teacher responses, as opposed to aggregated data, other
researchers have aggregated items to construct measures. Using the New York School
Environment Survey, Favero and Meier (2013) and Favero et al. (2012) use the average parent,
teacher and student responses to create measures used to assess organizational performance and
management. A sample of the survey instrument is provided in Appendix B. The value of each
item reported in the data is the average teacher response on a four-point Likert scale.
Coworker Trust
A variable for coworker trust will be examined using a single-item measure constructed
from the average teacher responses to the following survey item:
Teachers in this school trust each other
The single-item measure of the variable is standardized in deviation units around a mean of zero.
Coworker Respect
A variable for coworker respect is constructed by average school-level responses to the
following two survey items:
Teachers in my school respect teachers who take the lead in school improvement efforts

81
Teachers in my school recognize and respect colleagues who are the most effective
teachers
Together these items have a Cronbach’s alpha of .94. The variable is standardized in deviation
units around a mean of zero.
Coworker Support
A variable for coworker support will be examined using a single-item measure
constructed from the average teacher responses to the following survey item:
I feel supported by fellow teachers
The single-item measure of the variable is standardized in deviation units around a mean of zero.
Manager Support
Rather than construct a composite measure of school support that includes both managers
and peers, conceptually, perceptions of coworker support and perceptions of manager support are
likely to differ and should be treated differently. Thus, managerial support is measured using the
average teacher responses to the following item:
I feel supported by my principal
The variable is standardized in deviation units around a mean of zero.
In addition to organizational social climates characterized by respect and support, I am
interested in examining the degree to which managerial processes related to collaborative
decision making, managerial feedback, client oriented management, credible commitment, and
goal oriented management are undermined by personnel instability. I report both a measure of
internal consistency among the items (Cronbach’s alpha) and a common factor model of the
items used to construct the measure.

82
Participative Decision Making
I construct a measure for participative decision making for each school by replicating
Favero et al.’s (2012) factor analysis of the average teacher response to the following survey
items:
The principal has confidence in the expertise of teachers
School leaders invite teachers to play a meaningful role in setting goals and making
important decisions for the school
School leaders provide time for collaboration among teachers
Together these items have a Cronbach’s alpha of .93. Table 4.12 demonstrates the common
factor analysis of these three items. I use Bartlett scoring to extract a measure of collaborative
decision making.
Managerial Feedback
Following the work of Favero et al. (2012), I use teachers’ average survey responses to
construct a measure of managerial feedback for each school. The managerial feedback measure
consists of the following items:
School leaders visit the classroom to observe the quality of teaching
School leaders give me regular and helpful feedback
School leaders celebrate learning successes at the school
Together these items have an alpha coefficient of .94. Bartlett scoring is used to extract a
measure of managerial feedback. Table 4.13 provides the results of the factor analysis.
Client Oriented Management
I construct a measure of client oriented management using a common factor model of the
following survey items:

83
Obtaining information from parents is a priority at my school
Teachers and administrators in my school use information from parents to improve
performance
My school effectively communicates with parents when students misbehave
The items have a Cronbach’s alpha of .94. I use Bartlett scoring to extract a measure of
externally oriented management. Table 4.14 reports the results of the common factor model.
Credible Commitment
To construct a credible commitment measure, I reconstruct Favero et al.’s (2012) factor
analysis of the following items:
School leaders communicate a clear vision for the school
School leaders let staff know what is expected of them
School leaders encourage open communication on important school issues
Curriculum and instruction are aligned within and across grade-levels
The principal places learning needs above all other interests
The principal is an effective manager who makes the school run smoothly
I trust the principal at his/her word
The items have a Cronbach’s alpha of .98. I use Bartlett scoring to extract the measure of
credible commitment. Table 4.15 reports the results of the common factor model.
Goal Oriented Management
To create a measure of goal oriented management, I reconstruct Favero et al.’s (2012)
conceptual grouping of the following items:
My school has high expectations for all students
Teachers in this school set high students for student work in their classes

84
This school has clear measures of progress to help students achieve over the course of a
year
This school makes it a priority for students to achieve their learning goals
This school makes it a priority to find ways to help students achieve their learning goals
The items have a Cronbach’s alpha of .96. I use Bartlett scoring to extract measures from the
common factor model. Table 4.16 provides results of an analysis of the items.
Limitations to the Measures from Survey Responses
There are several limitations to these data. First, since I rely on secondary data, I have to
group items together conceptually or use single-item indicators. It would be far more desirable
to have used previously validated instruments to measure the constructs of interest. Second, I
only have the aggregated data (average response across all respondents at each school), as
opposed to individual-level responses. In the future, it would be interesting to examine the
effects of organizational-level personnel instability on individual-level perceptions of the
environment.
Third, social desirability might threaten the validity of teacher responses to the survey
items. It is important to note, however, that the survey questions do not ask employees to self-
report their own behaviors. Instead, they are asked to evaluate teachers in the school generally.
The teachers might be more honest when reporting on the behaviors of others than if they were
asked about their own specific behaviors. While this mitigates some of my concerns about social
desirability, there might still be a positive response bias in the average school-level responses.
Finally, there might be a “halo” effect—or a common factor—that drives the responses to all of
the items related to the internal work climate and school management. Simply, teachers’
85
responses might not be driven by answers to specific questions, but from a general impression
about their school.
Robustness Check and Halo Effect
Favero et al. (2012) use a “correction” for a halo effect in the survey responses. If a halo
effect is present, all of the survey items used in the creation of the measurers will have
significant loadings on the first factor of a common factor model. If this is the case, I will extract
the factor and create a variable called general satisfaction with management and climate. Next, I
will regress each measure (coworker respect, coworker support, manager support, collaborative
decision making, goal oriented management, client oriented management, and managerial
feedback) separately on each school’s measure of general satisfaction with management and
climate. I will use the residual in each case as a “halo” adjusted measure for each variable. This
procedure removes all the common variation of the survey items from each of the management
measures. One shortcoming of this procedure is that I cannot statistically distinguish the halo
effect from the common variation we would normally expect among the constructs. Removing
all common variation makes this procedure an overcorrection.
In addition to the main independent variables and dependent variables of interest, the
analyses account for a number of controls that might be related to organizational performance,
human capital quality, organizational climate, and personnel instability.
School Demographic & Student Characteristics Data
Client characteristics are important variables in the performance of public organizations
(Lynn, Heinrich, & Hill, 2000) and there is evidence of this from previous research in the
performance of Texas schools (e.g. Meier & Hicklin, 2008; Meier & O'Toole, 2002, 2003;
O'Toole & Meier, 2003). Additionally, the education literature has found that student

86
characteristics are important determinants of teacher turnover that need be controlled for when
examining the independent effect of turnover on performance (e.g. Ingersoll, 2001). The NYS-
DOE provides the following demographic variables for each New York City school: percentage
of black students, percentage of Asian students, percentage of white students, percentage of
Hispanic students, percentage of multiracial students, percentage of students with limited
English proficiency (referred to as English language learners), percentage of students eligible
for free or reduced lunch, and the percentage of students enrolled the previous year (referred to
as student stability). In addition to characteristics of the student body, NYS-DOE provides each
school’s total enrollment and student to teacher ratio.
Previous scholarship has consistently found that attendance is positively related to
student achievement and exam performance (Marburger, 2006). Annual attendance rate is
calculated by dividing the school’s total actual attendance by the total possible attendance for a
school year. A school’s actual attendance is the sum of the number of students in attendance on
each day the school was open during the school year. Possible attendance is the sum of the
number of enrolled students who should have been in attendance on each day the school was
open during the school year.
Previous research has found that violence and danger in schools is negatively related to
school performance (Bowen & Bowen, 1999; Burdick-Will, 2013). One measure that might
capture violence and/or danger in schools is the student suspension rate. The NYS-DOE
calculates student suspension rate by dividing the number of students who were suspended from
school (not including in-school suspensions) for one full day or longer anytime during the school
year by the Basic Educational Data System (BEDS) day enrollments for that school year. The
student suspension rate is likely indicative of environmental factors related to safety in the
87
schools. A student is counted only once, regardless of whether the student was suspended one or
more times during the school year.
While these variables provide many possible controls, one hazard that might emerge are
multicollinearity and overspecification. I will pay careful attention to these issues as I specify
models in Chapter 5, Chapter 6, and Chapter 7.
School Type
The State of New York classifies schools serving grades three through eight into three
different categories: elementary schools, middle schools, and intermediate schools (K-8). Every
year, each school falls into one category and is coded as “1” for that category, and as a “0” for all
other categories.
School Location
Schools are located throughout New York’s five boroughs: Brooklyn, Bronx Manhattan,
Queens, and Staten Island. A dummy variable is created for each school to designate its location
in a specific borough. When a school is located in a specific borough it is coded with a “1” and,
if not, it is coded with a “0.”
Community School District
All elementary, middle, and K-8 schools are governed by a Community School District
(CSD). School’s location in a specific CSD a coded as a “1” and then coded as a “0” for all
other CSDs, to create a dummy variable indicating a schools location in a specific CSD. In sum,
thirty-two dummy variables are generated. The final models will include thirty-one of these
dummies and exclude one as a comparison group.

88
Year Dummy Variables
I include dummy variables for each year in the models. For each year, I create a variable
and code all observations occurring in that year as a “1” and then code all other observations as a
“0.” One year is excluded and serves as the comparison group for all the other dummy variables.
Models
In Chapter 5, Chapter 6, and Chapter 7, I provide a detailed description of each of the
models used to test hypotheses. However, there are several general modeling strategies that I
follow throughout my analyses that I will now describe.
Panel Data in Public Administration Scholarship
The use of panel data in this dissertation is an important contribution to public
management research. According to Zhu (2013), public administration scholarship can be
enriched by the increased use of panel data methods, as methods that utilize both space and time
can help control against many of threats common to cross-sectional studies, such as causal order
and constant unit-level effects (random or fixed) There are, however, a number of panel data
methods that can be utilized, which is why Zhu (2013, p. 396) describes panel data analysis as an
“art” as opposed to an exact science.
The O’Toole and Meier model of management and performance is the general basis for
all the models used to test the hypotheses I generated in Chapter 3 (e.g. Meier & Hicklin, 2008;
Meier & O'Toole, 2002; O'Toole & Meier, 1999; O’Toole & Meier, 2003). A key attribute of
the O’Toole and Meier model of management and performance is the idea that public service
organizations, programs, and delivery systems can be characterized as inertial (O'Toole & Meier,
1999, p. 512),” and are therefore autoregressive. Whitford (2002a) has described the
autoregressive nature of bureaucratic outcomes as “stickiness.”

89
Meier and O'Toole (2001) model the autoregressive system by including a lagged
dependent variable in OLS regression, a technique both they and other scholars use in the
analyses of Texas school districts. One of the reasons why they use a lagged dependent variable
in an OLS regression is the nature of the data used. The Texas Superintendent Survey responses
are pooled back across time periods and, thus, the management variables the authors use do not
vary over time. The pooled OLS regression is the most appropriate strategy in these instances
since not all variables have variation over time.
The challenge in estimating models that include lagged dependent variables, or outcomes,
arises with true panel data and the estimation of fixed or random effects regression. One might
be tempted to simply include a lagged dependent variable, but this creates a bias in the
coefficient estimate of the lagged dependent variable that is not mitigated by increasing the
number of units, especially when a data set has many observations over a relatively short time
period (Nickell, 1981).
Generalized Estimating Equations
As Zhu (2013) points out, there are a number of ways to estimate panel data models. In
considering the relationships, I want to use a panel estimator that allows flexibility in accounting
for the unique characteristics of schools. First, I expect that dependent variables are correlated
over time. Second, I know that schools have unique cultures and characteristics that cannot be
measured and thus remain unobserved. Third, I am interested in the average effect of the
independent variable on the dependent variable across the population of NYC elementary,
intermediate (K-8) and middle schools. My goal is not to generate a point estimate for a specific
unit. This could be done using dynamic panel data estimators that utilize instrumental variable

90
approaches such as those suggested by Anderson and Hsiao (1982) and Arellano and Bond
(1991), but this is not what I am interested in estimating.
Given the true panel nature of the data, I can use alternative estimators that account for
the diverse constraints found in the panel data of the schools. I use Generalized Estimating
Equations (GEE) to estimate the models, a semi-parametric technique originally developed to
estimate limited dependent variables in the analysis of panel data, and used commonly in
epidemiology and other biological sciences (Zeger & Liang, 1986). The results of these models
are marginal, or population averaged effects and differ from the more commonly-used cluster
specific (or conditional models). Zorn (2001) summarizes the difference:
Cluster-specific approaches model the probability distribution of the dependent variable
as a function of the covariates and a parameter specific to each cluster. This latter term
may be estimated concurrently with the model (as in the fixed effects approach) or be
assumed to follow some stochastic distribution (as in the random effects). Marginal
models, by contrast, model the marginal (or population-averaged) expectation of the
dependent variable as a function of the covariates…No individual (i.e. cluster-specific
effects are included in the model. Instead, intracluster correlation is accounted for by
adjusting the covariance matrix of the estimated parameters to account for
nonindependence across observations or time points… (p. 475)
While GEE’s have not been widely used in public administration scholarship (for an
exception see Whitford, 2002a), scholars from both organizational studies (Ballinger, 2004) and
political science (Whitford, 2002b; Whitford & Yates, 2003; Zorn, 2001) have started to
advocate their use. Furthermore, they are flexible and can be used to model population average
effects on both limited and continuous dependent variables. The advantages of using GEE

91
models in this situation are three-fold: 1) The technique addresses unobserved school-level
effects; 2) I can estimate a population average effect without using the degrees of freedom
needed to estimate unit specific effects (random or fixed); and 3) I can leverage the data to adjust
for the correlation structure that actually exists—not the one I assume exists and I impose on the
model.
Heteroskedasticity
Heteroskedasticity is a violation of the assumption that all errors have the same variance.
Heteroskedasticity occurs when different subgroups of observations have different error
variances. This is a major concern because the presence of heteroskedasticity can invalidate tests
of statistical significance by providing incorrect estimates of the standard error. The NYC
school data might be subject to the threats of heteroskedastic errors both from scale (i.e. school
size drives the size of the errors) and unequal error variance between panels (Huber, 1967;
White, 1980). I estimate robust standard errors to address this threat.
Logistic Transformation of the Dependent Variable
In many of the hypotheses I test, the dependent variable is a percentage (or proportion or
ratio) bounded between zero and one. It is important to fit a line that does not go below zero or
above one. One problem with treating a proportion as interval level data is that predicted values
might fall outside of this range. One option that would allow me to use an OLS estimator in the
GEE framework is to perform a logistic transformation on the dependent variable measured as a
percentage before an analysis. According to McDowell and Cox (2001), if I assume:
(
) ,
the logistic transformation of the dependent variable is represented by the following equation:
.
92
The original variable is now mapped onto a real line.
One challenge is that cases with values of one or zero cannot be transformed and will be
dropped from the analysis. To handle this, I recode all one values to .9999 and all zero values to
.0001 prior to the variable transformation. After predicting a line with the values from the GEE
estimator and transforming the values back to percentages, the line will be bounded between zero
and one.
Granger Causality
The hypotheses I specified in Chapter 3 assume a temporal dynamic among the
independent and dependent variables over time. For instance, I hypothesize that while employee
turnover is likely to affect performance, performance is likely to affect future turnover. Drawing
on theory and utilizing both lag and lead variables in my models are ways to assess the causal
relationships among the variables over time. In addition to theory and temporal sequencing of
variables in my models, I can also use Granger tests to statistically examine the temporal
dynamics among the variables of the interest.
Granger (1969) observed that there are often times when it is difficult to determine the
direction of causality among two related variables. According to Granger (1969), an independent
variable (X) is said to cause the dependent variable (Y) if, given past values of the dependent
variable (Y), past values of the independent variable (X) can improve the prediction of the
dependent variable (Y). A common method for testing Granger causality is to regress the
dependent variable (Y) on its own lagged values and on the lagged values of the independent
variable (X). I will use a Wald-test to test the null hypothesis that the estimated coefficients on
the lagged values of the independent variable (X) are all jointly equal to zero. Failure to reject

93
this null hypothesis is the same as failing to reject the hypothesis that the independent variable
does not Granger-cause the dependent variable.
Only a few public administration scholars have used Granger causality as a tool to
investigate the temporal sequence of relationships between variables. Meier and Hicklin (2008)
use a Granger test in their examination of employee turnover and organizational performance.
Other public administration scholars used Granger tests to examine the relationships among
organizations’ centralized bureaucracies and the percentage of their annual budgets spent on
contracting (O'Toole & Meier, 2004a; Rho, 2013).
Chapter Summary
In this chapter, I have provided a description of the New York City schools research
context. Second, I have discussed the data and measures I use to operationalize the independent,
dependent, and control variables that I include in the analyses I report in the subsequent chapters
of this dissertation. Finally, I have provided an overview and a justification of my general
modeling strategy.

94
Table 4.1
Distribution of School Type by Year
2002 2003 2004 2005 2006 2007 2008 2009 2010 2011 2012 Total
Elementary 533 540 567 580 575 583 592 597 589 583 584 6,323
K-8 99 99 113 118 118 120 129 130 136 141 140 1,343
Middle 175 182 224 259 258 318 354 365 366 366 361 3,228
Total 807 821 904 957 951 1,021 1,075 1,092 1,091 1,090 1,085 10,894

95
Table 4.2
Community School District by Borough (2006-2011)
Borough District # Obs. Percent
New York (Manhattan) 1 128 2.48
2 233 4.52
3 216 4.19
4 182 3.53
5 116 2.25
6 195 3.78
Bronx 7 133 2.58
8 172 3.34
9 243 4.71
10 290 5.63
11 189 3.67
12 181 3.51
Brooklyn 13 125 2.42
14 99 1.92
15 155 3.01
16 99 1.92
17 184 3.57
18 100 1.94
19 178 3.45
20 136 2.64
21 180 3.49
22 133 2.58
23 215 4.17
32 93 1.8
Queens 24 125 2.42
25 150 2.91
26 94 1.82
27 220 4.27
28 105 2.04
29 167 3.24
30 150 2.91
Staten Island 31 169 3.28
Total 5,155 100
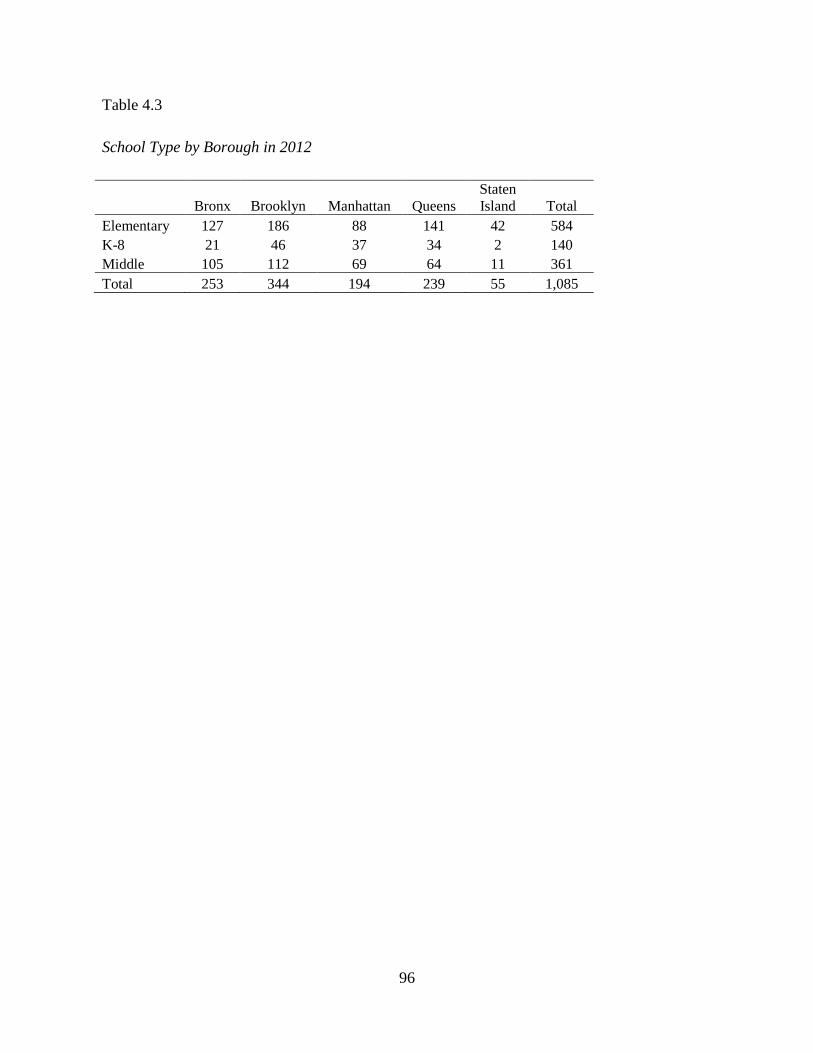
96
Table 4.3
School Type by Borough in 2012
Bronx Brooklyn Manhattan Queens
Staten
Island Total
Elementary 127 186 88 141 42 584
K-8 21 46 37 34 2 140
Middle 105 112 69 64 11 361
Total 253 344 194 239 55 1,085
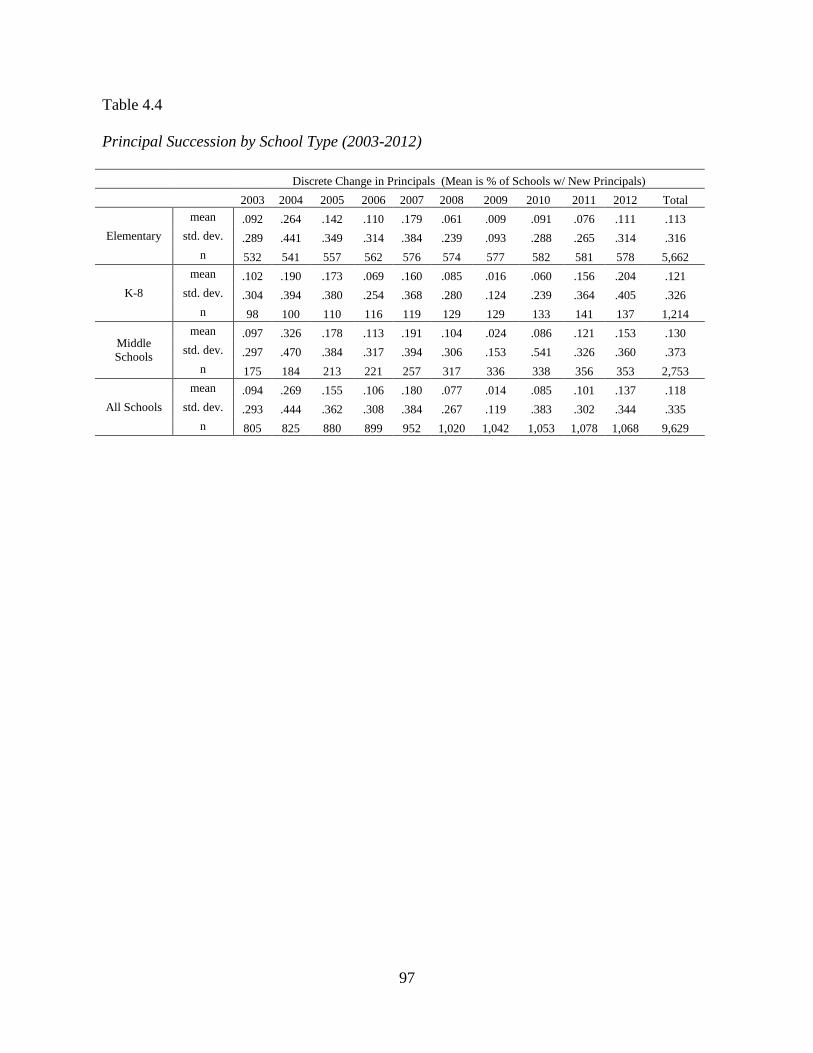
97
Table 4.4
Principal Succession by School Type (2003-2012)
Discrete Change in Principals (Mean is % of Schools w/ New Principals)
2003 2004 2005 2006 2007 2008 2009 2010 2011 2012 Total
Elementary
mean .092 .264 .142 .110 .179 .061 .009 .091 .076 .111 .113
std. dev. .289 .441 .349 .314 .384 .239 .093 .288 .265 .314 .316
n 532 541 557 562 576 574 577 582 581 578 5,662
K-8
mean .102 .190 .173 .069 .160 .085 .016 .060 .156 .204 .121
std. dev. .304 .394 .380 .254 .368 .280 .124 .239 .364 .405 .326
n 98 100 110 116 119 129 129 133 141 137 1,214
Middle
Schools
mean .097 .326 .178 .113 .191 .104 .024 .086 .121 .153 .130
std. dev. .297 .470 .384 .317 .394 .306 .153 .541 .326 .360 .373
n 175 184 213 221 257 317 336 338 356 353 2,753
All Schools
mean .094 .269 .155 .106 .180 .077 .014 .085 .101 .137 .118
std. dev. .293 .444 .362 .308 .384 .267 .119 .383 .302 .344 .335
n 805 825 880 899 952 1,020 1,042 1,053 1,078 1,068 9,629

98
Table 4.5
Collective Teacher Turnover by School Type (2005-2012)
2005 2006 2007 2008 2009 2010 2011 2012 Total
Elementary
mean .193 .162 .149 .148 .126 .124 .127 .130 .145
std. dev. .085 .078 .080 .078 .069 .077 .075 .078 .080
n 558 575 579 575 576 582 577 581 4,603
K-8
mean .201 .204 .177 .178 .152 .162 .143 .140 .168
std. dev. .097 .100 .082 .082 .093 .108 .088 .080 .094
n 110 118 120 129 129 134 138 139 1,017
Middle Schools
mean .266 .249 .238 .240 .218 .189 .202 .201 .222
std. dev. .124 .109 .132 .131 .116 .116 .125 .117 .124
n 213 258 295 322 335 337 334 348 2,442
All Schools
mean .211 .191 .179 .181 .159 .150 .153 .155 .171
std. dev. .102 .098 .106 .106 .099 .099 .101 .098 .103
n 881 951 994 1,026 1,040 1,053 1,049 1,068 8,062
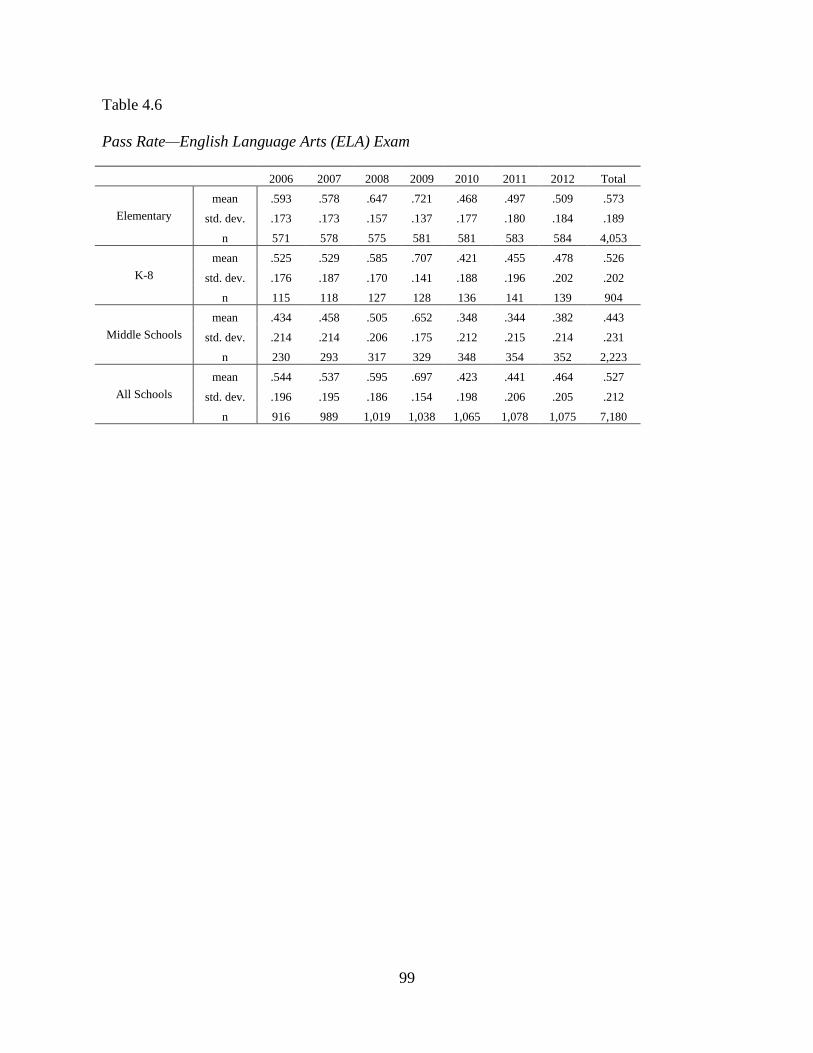
99
Table 4.6
Pass Rate—English Language Arts (ELA) Exam
2006 2007 2008 2009 2010 2011 2012 Total
Elementary
mean .593 .578 .647 .721 .468 .497 .509 .573
std. dev. .173 .173 .157 .137 .177 .180 .184 .189
n 571 578 575 581 581 583 584 4,053
K-8
mean .525 .529 .585 .707 .421 .455 .478 .526
std. dev. .176 .187 .170 .141 .188 .196 .202 .202
n 115 118 127 128 136 141 139 904
Middle Schools
mean .434 .458 .505 .652 .348 .344 .382 .443
std. dev. .214 .214 .206 .175 .212 .215 .214 .231
n 230 293 317 329 348 354 352 2,223
All Schools
mean .544 .537 .595 .697 .423 .441 .464 .527
std. dev. .196 .195 .186 .154 .198 .206 .205 .212
n 916 989 1,019 1,038 1,065 1,078 1,075 7,180
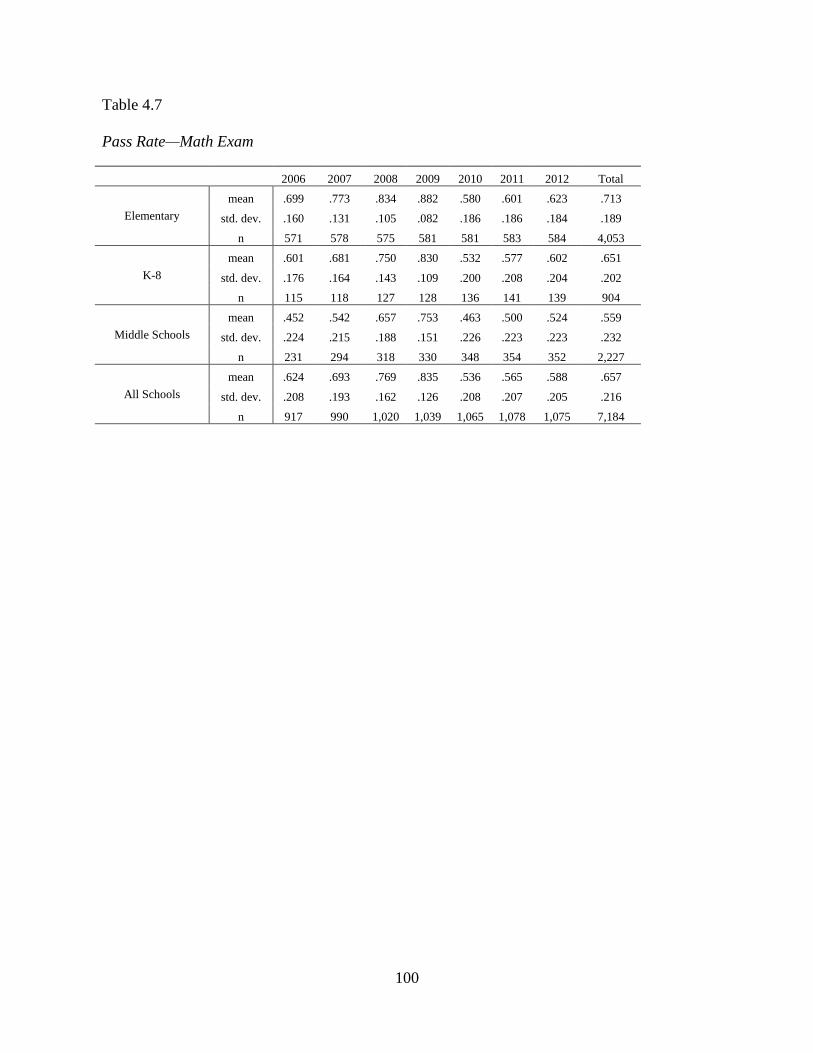
100
Table 4.7
Pass Rate—Math Exam
2006 2007 2008 2009 2010 2011 2012 Total
Elementary
mean .699 .773 .834 .882 .580 .601 .623 .713
std. dev. .160 .131 .105 .082 .186 .186 .184 .189
n 571 578 575 581 581 583 584 4,053
K-8
mean .601 .681 .750 .830 .532 .577 .602 .651
std. dev. .176 .164 .143 .109 .200 .208 .204 .202
n 115 118 127 128 136 141 139 904
Middle Schools
mean .452 .542 .657 .753 .463 .500 .524 .559
std. dev. .224 .215 .188 .151 .226 .223 .223 .232
n 231 294 318 330 348 354 352 2,227
All Schools
mean .624 .693 .769 .835 .536 .565 .588 .657
std. dev. .208 .193 .162 .126 .208 .207 .205 .216
n 917 990 1,020 1,039 1,065 1,078 1,075 7,184

101
Table 4.8
Parent Satisfaction Measure
Item Factor Uniqueness
The quality of your child's teacher this year .907 .177
The level of assistance your child receives when he or she needs extra
help with classwork or homework .949 .099
How well your child's school communicates with you .954 .090
Your opportunities to be involved in your child's education .930 .136
The education your child has received this year .944 .109
The school has high expectations for my child .833 .306
The school clearly communicates its expectations for my child's
learning to me and my child .931 .134
My child's teacher gives helpful comments on work and tests .924 .147
My child is learning what he or she needs to know to succeed in later
grades or after graduating high school .913 .160
Eigenvalue= 7.642

102
Table 4.9
Percent of Teachers’ with Master’s Degree plus 30 Hours (or Doctorate)
2005 2006 2007 2008 2009 2010 2011 2012 Total
Elementary
mean .373 .363 .374 .380 .400 .433 .466 .488 .410
std. dev. .138 .143 .139 .145 .144 .148 .151 .151 .151
n 558 575 583 580 589 589 583 584 4,641
K-8
mean .327 .309 .333 .339 .362 .398 .434 .448 .372
std. dev. .138 .123 .121 .120 .122 .121 .123 .131 .134
n 110 118 120 129 129 136 141 140 1,023
Middle
Schools
mean .298 .280 .281 .284 .314 .341 .375 .384 .323
std. dev. .127 .135 .132 .142 .151 .160 .161 .152 .152
n 213 258 318 341 350 360 361 361 2,562
All Schools
mean .349 .334 .340 .344 .367 .398 .432 .448 .378
std. dev. .139 .143 .141 .148 .149 .155 .157 .156 .155
n 881 951 1,021 1,050 1,068 1,085 1,085 1,085 8,226

103
Table 4.10
Percent of Teachers Out of Certification
2005 2006 2007 2008 2009 2010 2011 2012 Total
Elementary
mean .139 .117 .079 .067 .055 .040 .030 .029 .069
std. dev. .067 .067 .056 .059 .054 .043 .037 .040 .065
n 558 575 583 580 589 589 583 584 4,641
K-8
mean .169 .149 .102 .089 .083 .057 .063 .074 .095
std. dev. .093 .087 .075 .073 .075 .052 .053 .057 .080
n 110 118 120 129 129 136 141 140 1,023
Middle
Schools
mean .221 .199 .165 .162 .127 .121 .097 .168 .152
std. dev. .095 .114 .118 .125 .100 .116 .082 .102 .113
n 213 258 318 341 350 360 361 361 2,562
All Schools
Total .162 .144 .108 .100 .082 .069 .057 .081 .098
std. dev. .085 .092 .091 .097 .081 .084 .065 .093 .093
n 881 951 1,021 1,050 1,068 1,085 1,085 1,085 8,226

104
Table 4.11
Percent of Teachers w/ Fewer Than Three Years’ Experience
2005 2006 2007 2008 2009 2010 2011 2012 Total
Elementary
mean .149 .151 .143 .141 .123 .074 .041 .054 .109
std. dev. .087 .093 .095 .095 .098 .081 .051 .063 .095
n 558 575 583 580 589 589 583 584 4641
K-8
mean .175 .191 .192 .174 .154 .086 .044 .063 .131
std. dev. .096 .097 .098 .085 .084 .067 .046 .063 .098
n 110 118 120 129 129 136 141 140 1023
Middle
Schools
mean .237 .243 .261 .249 .219 .162 .097 .124 .194
std. dev. .145 .154 .173 .167 .167 .152 .121 .114 .161
n 213 258 318 341 350 360 361 361 2562
All Schools
mean .174 .181 .185 .180 .158 .104 .060 .078 .138
std. dev. .111 .120 .136 .131 .131 .116 .085 .089 .126
n 881 951 1021 1050 1068 1085 1085 1085 8226

105
Table 4.12
Participative Management
Item Factor Uniqueness
The principal has confidence in the expertise of teachers .895 .198
The principal invites teachers to play a meaningful role in setting goals .969 .061
School leaders provide time for collaboration among teachers .873 .238
Eigenvalue= 2.5
Table 4.13
Managerial Feedback
Item Factor Uniqueness
School leaders visit the classroom to observe the quality of teaching .921 .152
School leaders give me regular and helpful feedback .961 .077
School leaders celebrate learning successes at the school .906 .180
Eigenvalue= 2.59
Table 4.14
Client Oriented Management
Item Factor Uniqueness
Obtaining information from parents is a priority at my school .963 .072
Teachers and administrators in my school use information from parents to
improve performance .988 .024
My school effectively communicates with parents when students
misbehave .834 .304
Eigenvalue= 2.60

106
Table 4.15
Credible Commitment
Item Factor Uniqueness
School leaders communicate a clear vision for the school .944 .100
School leaders let staff know what is expected of them .933 .129
School leaders encourage open communication on important school
issues .927 .141
Curriculum and instruction is aligned within and across grade-levels .812 .339
The principal places learning needs above all other interests .953 .093
The principal is an effective manager who makes the school run
smoothly .963 .073
I trust the principal at his/her word .948 .101
Eigenvalue= 6.014
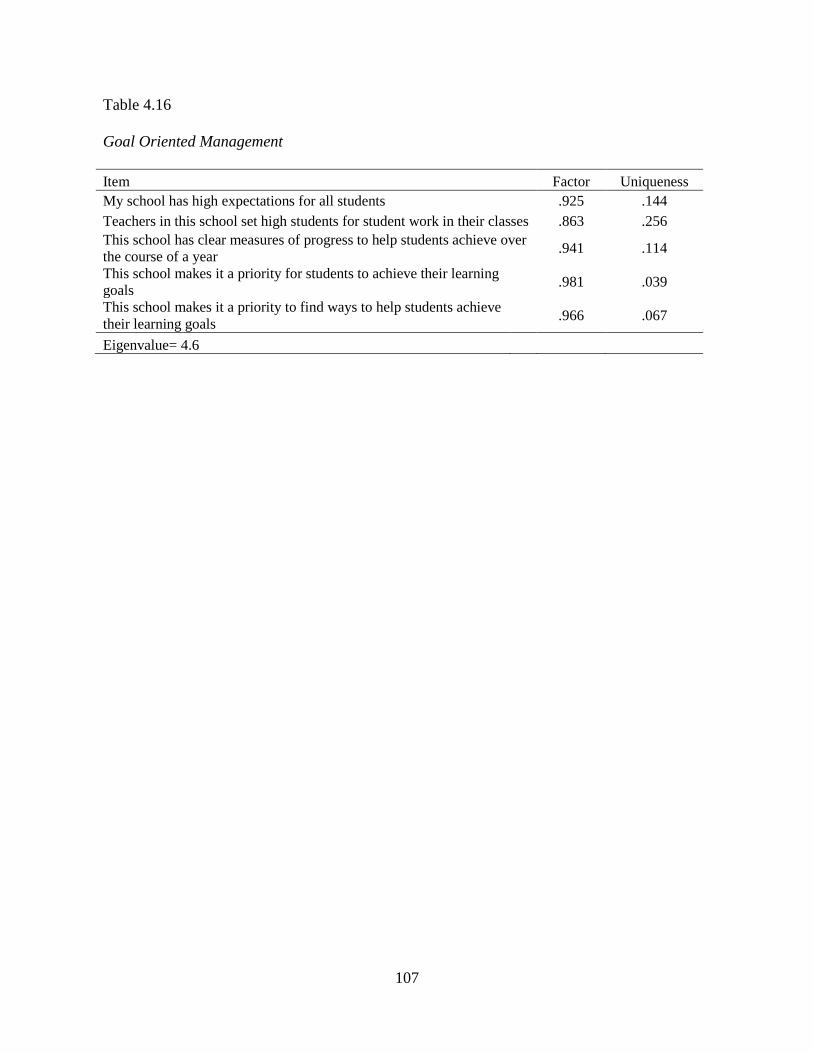
107
Table 4.16
Goal Oriented Management
Item Factor Uniqueness
My school has high expectations for all students .925 .144
Teachers in this school set high students for student work in their classes .863 .256
This school has clear measures of progress to help students achieve over
the course of a year .941 .114
This school makes it a priority for students to achieve their learning
goals .981 .039
This school makes it a priority to find ways to help students achieve
their learning goals .966 .067
Eigenvalue= 4.6

108
CHAPTER 5
ANALYSIS OF PERSONNEL INSTABILITY AND
ORGANIZATIONAL PERFORMANCE
In this chapter I analyze the relationship between personnel instability and organizational
performance in New York City elementary, intermediate (K-8), and middle schools. I begin by
examining both principal succession and collective teacher turnover’s effect on a school’s
performance. Second, I investigate whether principal succession’s effect on school performance
is contingent on the previous level of school performance. As I have discussed, public
management scholars have argued that in a low performing organization a change in manager
might give a boost to the performance of the organization. On the other hand, for high
performing organizations a change in manager might disrupt the systems in place and lead to a
decrease in performance (Boyne et al., 2011). Third, I investigate whether organizational
performance might drive future personnel instability. In all the analyses, I limit my substantive
interpretation to statistically significant coefficients that test the relationships hypothesized in
Chapter 3. I will conclude with a brief summary of the important findings and discuss the
hypotheses I test.
Variables
There are three school-level performance outcomes that I examine in the models that
follow: 1) math exam pass rate; 2) English Language Arts (ELA) exam pass rate; and 3) parent
satisfaction. The exam pass rates are proportions bounded by zero and one. Parent satisfaction
is a factor score measured in standard deviation units (see Chapter 4). The two dimensions of
109
personnel instability that I examine in these models of performance are: 1) principal succession;
and 2) collective teacher turnover.
As discussed in Chapter 4, there are a number of other variables that are likely to affect
school performance that I must control for. Client (student) characteristics are controlled for
with the following variables: student stability, White (%), Black (%), Asian (%), Hispanic (%),
special education (%), English language learners (%), students receiving free or reduced lunch
(%), students receiving suspension (%), and the annual attendance rate. To capture the internal
school characteristics, I include teachers with master’s plus 30 hours (%), teachers with less than
three years’ experience (%), teachers out of certification (%), total enrollment, and the student to
teacher ratio.
To capture the environmental and geographic contexts in which the school is located, I
include two sets of dummy variables to control for the community school district (CSD dummies)
and the borough (borough dummies). Additionally, I include year dummies to control for
differences in exam pass rates on a year-to-year basis. Although I will not report the coefficients
of the CSD dummy, borough dummy, or year dummy variables, I will discuss their significance as
groups as appropriate.
Finally, in the generalized estimating equation (GEE) models the school specific effects
are accounted for by adjusting the covariance matrix of the estimated parameters to account for
non-independent errors (Zorn, 2001, p. 474). This is important as it helps account for the
unobserved, unmeasured, and unique characteristics of each specific school. Furthermore, by
accounting for these unobserved characteristics, the GEE models leverage the panel data to help
guard against findings driven by spurious relationships or omitted variables.

110
Table 5.1 provides basic descriptive statistics for select independent, dependent, and
control variables. Table 5.2 is a bivariate correlation matrix of the key variables in the models I
estimate. Table 5.1 illustrates that for most variables I have 5,361 observations with complete
data.23
These variables are observed over six school years (2006-07, 2007-08, 2008-09, 2009-10,
2010-11, and 2011-12). I only have five years of observations for the parent satisfaction
performance indicator (2006-07, 2007-08, 2008-09, 2009-10, and 2010-11) and a total of 4,557
observations, and this explains the decrease in observations among the models.
Model Estimation
I use GEE to model the relationship between the independent and dependent variables.
All of the models are estimated using the XTGEE command in Stata 13 (StataCorp, 2013b). I
estimate models using an identity (y = y) function24
and assuming a Gaussian, or normal,
distribution when the dependent variable is a bound proportion between zero and one.
Functionally, this is the same as estimating a direct, linear relationship in OLS. GEE begins by
estimating the linear model and assuming observations within the subjects are independent of
each other. Residuals from the basic linear model are generated and a working correlation
matrix is estimated from those residuals.25
Appendix 3 includes the corresponding working
correlation matrices estimated and used to adjust the coefficients in the models I present in this
chapter. An iterative process is used to refit the coefficients and correct for the correlation
23
There are several sources for the discrepancy in the total number of groups observed in the analyses and the
number of schools observed in Chapter 4. First, there are elementary schools where no students could take either the
ELA or the Math exam because the school only serves pre-kindergarten through 2nd
grade. Second, schools do not
report a demographic variable if the number of students for that category is so small that they might be identifiable.
As a robustness check, I replaced the missing demographic data with a zero and re-ran the models. This had
negligible effects on the coefficient estimates. Since I do not know whether the data is truly missing or just a low
value, I chose to present the estimates only for the observations with complete data. 24
The dependent variables that are proportions are logit transformed prior to the estimation of the linear models
using the following formula: 25
Alternatively, the working correlation matrix could have be specified rather than estimated. However, rather than
specifying a correlation structure, such as autoregressive or independent errors, I freely estimate the actual
correlation structure.
111
among dependent variables over time (Twisk, 2013). Similarly, when the dependent variable is a
binary indicator, such as principal succession, I use a logistic function to estimate a dependent
variable with a binomial distribution. Once again, GEE estimates a correlation structure and
then corrects the coefficients using the adjusted correlation matrix. I conduct and report two-
tailed tests of statistical significance for the coefficient estimates.
The population averaged coefficients of the GEE model represent the average effect in
the population of a one-unit shift in the dependent variable. The logistic transformation of the
dependent variable prior to model estimation complicates the interpretation of the coefficients in
many of the models that I present (McDowell & Cox, 2001). I can use the coefficients estimated
in the model to generate a linear predictor (ŷ) of the dependent variable. However, I must
transform the linear predictor back into a proportion with the following equation:
As a consequence, I only provide a substantive interpretation for the coefficients that test
the hypotheses I stated Chapter 3. I use R Statistical Software to calculate predicted values and
generate graphical representations of the relationships of interest. In the graphical
representations of the relationships, I calculate the predicted values for the hypothetical range of
independent variables of interest measured as a proportion (zero to one). However, the actual
range, from the minimum value to the maximum value, of each variable can be found in Table
5.1.
The scale parameter reported is the denominator used to estimate the correlation
parameters. A change in the estimates of the scale parameters will lead to slightly different
regression coefficient estimates (Hardin, 2005). The presence of heteroskedasticity is possible
due to variance in each panel as well as variation in scale among units (schools). To address this

112
issue, I calculate robust standard errors and relax the assumption of the independence of
observations by clustering them by school (Whitford, 2002a). Assessing the goodness of fit has
been problematic for scholars because the residuals in GEE models are correlated and, therefore,
these models do not lend themselves to standard measures of fit (Ballinger, 2004; Zorn, 2001).
Given this limitation, scholars have used a Wald statistic to assess model fit (Whitford,
2002a, 2002b).
Personnel Instability and Performance
Tables 5.3 and 5.4 show the results of the models estimating the relationships between
personnel instability and school performance. It is important to note that both measures of
personnel instability temporally precede the measurement of the performance variables. If a new
principal enters the school in the fall of the beginning of the school year, that observation of
principal succession is matched to pass rates on the ELA and math exams administered the
following spring. Collective teacher turnover also occurs in the period prior to the measurement
of performance. For instance, collective teacher turnover data measured from January 2010 to
December 2010 are matched to exams and parent satisfaction surveys administered and
completed in the spring of 2011.
The four models in Table 5.3 demonstrate an acceptable level of fit based on their Wald
statistics. Model 1 and Model 2 examine the relationship between personnel instability and
math exam pass rate. In Model 1, neither principal succession nor collective teacher turnover
has a direct effect on the math exam pass rate. Several of the control variables26
have a positive
statistically significant relationship with math exam pass rate, including student stability, White
(%), Asian (%), and attendance rate.
26
The coefficients on all the control variables are estimated with a logistic transformed dependent variable and
cannot be interpreted as a unit to unit change. In my discussion of the controls, I am simply commenting on the
direction and significance of the relationship.

113
There are also control variables with statistically significant, negative relationships with
math exam pass rates. These include teachers w/ less than three years’ experience (%), special
education (%), English language learners (%), students receiving free or reduced lunch (%),
student suspensions (%), total enrollment, and middle and intermediate schools relative to
elementary schools. A test of joint significance shows that the borough dummy variables in the
model are not significantly related to performance as a group ( = 7.10, p > .10). With respect
to the CSD dummy variables, only five have significant effects compared to the excluded group,
but together they are jointly significant ( = 63.54, p < .01) providing evidence of an effect that
occurs as the CSD-level. The year dummy variables are also jointly significant ( = 8,925.83, p
< .01). Changes to the test on any given year likely explain the presence of a year fixed effect.
Model 2 also provides no evidence of a direct relationship between principal succession
and math exam pass rates. However, an interesting relationship emerges with respect to
collective teacher turnover. The direct effect of collective teacher turnover is both significant
and positive (β = .324, p < .05), while the squared term is both significant and negative (β =
-.827, p < .01). A test of joint significance provides evidence of a nonlinear relationship between
collective teacher turnover and Math exam pass rates ( = 7.53, p < .05). I estimate the
predicted values of math exam pass rate to provide substantive insight into the relationship.
Figure 5.1 plots the predicted pass rate on the math exam at different levels of employee
turnover, holding all other variables constant at their mean or modal values. 27
The result of this
prediction is an estimate for an average elementary school in the population located in Brooklyn
27
The predicted values describe the nature of the relationship between the variables. Obviously, the predicted
values shift up and down as different categorical values are used to calculate the predicted values. One might
wonder why the predicted value for Math exam pass rates seems high relative to the population mean (68.6 percent).
The answer is that the predicted values are dependent on the categorical values I use in the calculation. For
example, the predicted values of math exam pass rate shifts down uniformly when they are calculated for a middle
school instead of an elementary school, or for the year 2008 instead of 2006.

114
in the year 2006. For simplicity, I use the same values for all predicted values presented in this
dissertation. The relationship is the average effect of a one-unit shift in collective employee
turnover on a school’s math exam pass rate.
In Figure 5.1 collective teacher turnover has an optimal relationship with math exam pass
rates when it reaches 21 percent. At this level of turnover the predicted math exam pass rate is
76.947 percent. This relationship is illustrated by the intersection of two lines drawn on the
figure. To illustrate the small substantive significance of relationship, I predict math exam pass
rates at the collective turnover rate mean (approximately 16 percent) and one standard deviation
(approximately nine percent) above and below the mean. At 16 percent collective teacher
turnover the predicted math exam pass rate is 76.916 percent. At a standard deviation above the
mean the predicted value is virtually identical, at 76.919 percent. At a standard deviation below
the mean the predicted value is 76.675 percent. Furthermore, at the largest value of turnover
actually observed in the data, 73 percent, the predicted Math exam pass rate is 72.668 percent.28
For most of the predicted values, a percentage increase or decrease in the collective
teacher turnover rate results in a change of less than a tenth of one-percent. It is important note,
however, that performance is measured as a rate bounded between zero and one, not an
unbounded production function, and the predicted change on a year to year basis is likely to be
very small. Additionally, the model does provide us with statistical evidence that the nature of
the relationship between the teacher turnover and pass rates is nonlinear. In describing the
relationship, it is accurate to say that collective teacher turnover is not disruptive at low-levels
28
As a robustness check on the nonlinear relationship, I reran the model and restricted the observations to those with
less than 40 percent turnover to make sure that the relationship is not driven by outliers. Both collective teacher
turnover and collective teacher turnover 2 are statistically significant at the .05-level. A second robustness check was
conducted to see if the right skew of the distribution of collective teacher turnover affected the estimates. Similar
results were found when the collective teacher turnover is transformed to its natural log to correct for the right skew
in distribution adding further evidence to the robustness of the results.
115
and might even have a small, positive effect on performance, but as collective teacher turnover
increases beyond 21 percent it has an increasingly detrimental effect on the math exam pass rate.
The control variables negatively related to math exam pass rate in Model 2 are teachers
w/ less than 3 years’ experience, student to teacher ratio, total enrollment, status as either an
intermediate or a middle school (compared to elementary schools), special education (%),
English language learners (%), students receiving free or reduced lunch (%), and students
receiving suspensions (%). Student stability, White (%), Asian (%), and attendance rate are all
positively related to math exam pass rate. Together, the borough dummy variables are not
statistically significant ( = 6.99; p >.10). Both the year dummy ( = 8,905.90, p < .01) and
CSD dummy variables ( = 79.63, p < .01) were each jointly significant as groups.
Personnel Instability and Parent Satisfaction
In Table 5.3 I also examine the relationship between personnel instability and parent
satisfaction. Since I expect that parent satisfaction is, at least partially, a function of a school’s
objective performance, I add the ELA exam pass rate and math exam pass rate to the models. In
Table 5.3, Model 3 and Model 4 show that principal succession has no direct relationship with
parent satisfaction. Neither direct nor nonlinear relationships between collective teacher
turnover and parent satisfaction are observed in results. Control variables with significant,
negative relationships include student to teacher ratio, total enrollment, status as an intermediate
or middle school (compared to elementary schools), special education (%), English language
learners (%), students receiving free or reduced lunch (%), and students receiving suspensions
(%). White (%), Black (%), Hispanic (%), and attendance rates are all positively related to
parent satisfaction in both of these models. As expected, the math exam pass rate and the ELA
exam pass rate are both positively and significantly related to parent satisfaction. In both

116
models the CSD dummy and year dummy variables were each significant as a group (p < .05),
while the borough dummy variables were not significant as a group in either model.
Personnel Instability and ELA Performance
The models estimating effects of managerial succession and collective teacher turnover
rates on the logistic transformed ELA exam pass rate failed to converge on a solution after 100
iterations. I reset the maximum number of iterations to 500, but the model still failed to
converge on a solution. 29
While Stata 13 still reports coefficients and standard error estimates
that I include in Model 1 and Model 2 of Table 5.4, the findings are inconclusive. To attempt to
better understand the relationship, I deviate from the logistic transformation of the dependent
variable and simply estimate a model predicting ELA exam pass rate. The models do converge
and provide me with some understanding of the nature of the relationship between personnel
instability and ELA exam pass rates. The coefficients are reported in Model 3 and Model 4.
The Wald statistics demonstrate that both Model 3 and Model 4 have an acceptable
level of fit. Neither Model 3 nor Model 4 provides evidence of a direct relationship between
managerial succession and ELA exam pass rates. However, Model 3 does provide evidence of a
direct negative relationship between collective teacher turnover and ELA exam pass rates (β =
-.030; p < .05). Since the dependent variable is not transformed, the coefficients can be
interpreted in the same way as I would interpret a one-unit change in an OLS regression model.
A one percent increase in collective teacher turnover will result in a .03 percent increase in the
ELA exam pass rate.
A number of controls are significant in Model 3. Total enrollment, status as either an
intermediate or middle school (compared to elementary schools), special education (%), English
29
According to Zorn (2001), “Convergence of GEE models becomes more difficult as sample size decreases, as the
number of correlation parameters being estimated increases, and as the size of the intracluster correlation increases”
(p. 476).

117
language learners (%), students receiving free or reduced lunch (%), and student receiving
suspensions (%) are all negatively related to ELA exam pass rate. White (%), Asian (%), and
attendance rate are all positively related to the ELA exam pass rate. As groups, the borough
dummy ( = 16.28; p < .01), year dummy ( = 6,603.69; p < .01) and CSD dummy variables
( = 93.28; p < .01) are each jointly significant in the model.
I add the squared term of collective teacher turnover to Model 4 of Table 5.4. Principal
succession has no significant relationship with performance in this model. Interestingly, the
direct effect of collective teacher turnover becomes positive, but the effect is no longer
statistically significant (β = .023; p > .10). The quadratic term, however, is both statistically
significant and negative (β = -.122; p < .05). A test shows that the two terms are jointly
significant ( = 11.34; p < .01). I plot the quadratic relationship between collective teacher
turnover and ELA exam pass rates in Figure 5.2.
Figure 5.2 illustrates predicted ELA exam pass rate at different levels of collective
teacher turnover, holding all other variables constant at their mean or model values (the same
values were used to predict the values in Figure 5.1). At very low-levels, collective teacher
turnover has a negligible, albeit positive, effect on ELA exam pass rates. The optimal rate of
collective teacher turnover relative to a school’s ELA exam pass rate is 10 percent. When
collective teacher turnover is 10 percent, the predicted ELA exam pass rate is 54.821 percent.
The mean value of collective teacher turnover in the observations is approximately 16 percent.
At this level, the ELA exam pass rate’s predicted value is 54.783 percent. Increasing collective
teacher turnover by approximately one standard deviation predicts an ELA exam pass rate of
54.460 percent.30
30
To test the robustness of the relationship, I exclude observations with more than 40 percent collective teacher
turnover. In this robustness check, the squared term is significant at the .10-level, but the joint effect loses

118
In Model 4, total enrollment, status as either an intermediate or middle school, special
education (%), English language learners (%), students receiving free or reduced lunch (%), and
students receiving suspensions (%) are all negatively related to a school’s ELA exam pass rate.
White (%), Asian (%), and attendance rate are all positively related to the ELA exam pass rate.
Finally, the CSD dummy ( = 93.36; p < .01), borough dummy ( = 16.10; p < .01) and the
year dummy variables = 6,576.64; p < .01) are each jointly significant as groups.
The findings in Table 5.3 and Table 5.4 provide some evidence of a nonlinear relationship
among collective teacher turnover and organizational performance.
While I have been careful to sequence the data temporally (see discussion above),
Granger (1969) tests can be used to provide additional statistical evidence of the direction of the
relationship.31
To do this, I regress the dependent variable of interest on its own lagged values
and on the lagged values of the independent variable and test whether the coefficients on the
lagged values of the independent variable are jointly equal to zero (StataCorp, 2013a). If the
coefficients of the lagged independent variable are jointly significant and not equal to zero, I can
say that collective teacher turnover is useful for predicting future math exam pass rate. I use
values of math exam pass rates and collective teacher turnover lagged three periods. A test of
joint significance of the lagged values of collective teacher turnover provides some statistical
evidence (F 4.59; p < .01) that collective teacher turnover Granger causes, or precedes,
changes in math exam pass rates. Following the same procedure, a second test provides
significance. The finding suggests that the results in Model 4 of Table 5.4 are sensitive to outliers in the data.
Similar results were found when the collective teacher turnover is transformed to its natural log to correct for the
right skew in its distribution. 31
The Granger test I use is limited to establishing time order of the relationship among variables. This should not be
confused with true causality. Causal order defines time order, but time order does not define causality. Just because
there is evidence that a variable precedes another, this does not mean it causes it. I utilize lagged and lead variables
to establish temporal sequencing among the independent and dependent variables, and Granger tests can add
statistical support to the sequence of the relationship among variables. The Granger tests, however, should not be
interpreted as “proof” of a causal relationship.

119
evidence that collective teacher turnover also Granger causes, or precedes, changes in ELA exam
pass rates (F 9.00; p < .01).
Past Performance and the Effects of Managerial Succession
To examine whether the relationship between principal succession and performance is
contingent on past performance, I introduce two interaction terms to the models following the
work of Boyne et al. (2011). For both the math exam pass rate and the ELA exam pass rate, I
construct a dummy variable to indicate whether the school was in the top 25th
percentile when
performance was measured the previous year. For both exams, I also construct a measure to
indicate whether the school was in the bottom 25th
percentile of performance the previous year.
This gives me a math exam high in t-1 and a math exam low in t-1 dummy variables, as well as
the ELA exam high in t-1 and ELA exam low in t-1 dummy variables.
In Table 5.5 I present coefficient estimates of the effect of principal succession on math
exam pass rates (logistic trans.) contingent on past performance.32
The baseline effect of
principal succession in schools with math exam pass rates in the middle 50 percent on the math
exam the previous year is indicated by the coefficient on the principal succession variable. The
coefficient is not statistically significant (β = .025; p > .10). To test the hypothesis that
managerial succession will have a negative effect on high performing organizations, I include the
principal succession and Math high performance in t-1 interaction term. The coefficient of the
interaction term is not statistically significant (β = .053; p > .10), relative to the baseline group. I
include principal succession multiplied by Math low performance in t-1 in order to test the
hypothesis that principal succession will have a positive effect on the future performance of low
performing organizations. The coefficient on the interaction term is statistically significant, but
32
Table 5.5 and 5.6 show coefficients estimated with the same set of controls presented in Table 5.3 and Table 5.4.

120
negative (β = -0.088; p < .05), relative to the baseline group. Interestingly, neither of the
coefficients is in the hypothesized direction.
These coefficients, however, do not tell me whether the marginal effects of the
interaction terms are statistically significant. Since the effect of the interaction is a product of
both principal succession and the interaction term, I must calculate both the marginal effect
(dy/dx) of each product, the standard errors for the product of the interaction term, and the
statistical significance of each product. In Table 5.5, I report the marginal effects (dy/dx) of the
interactions on the linear predictor of the dependent variable as well as each marginal effect’s
standard error and statistical significance.
According to Table 5.5, the marginal effect of the interaction between principal
succession and Math high performance in t-1 on the linear predictor is both positive and
statistically significant (dy/dx = .078; p < .05), providing additional evidence that in high
performing schools principal succession actually provides a slight boost to performance. A
change in principal in a high performing school is going to increase math exam pass rates in the
following period is approximately 1.44 percent. The marginal effect of the interaction between
principal succession and Math low performance in t-1 on the linear predictor is negative and
statistically significant (dy/dx = -.063; p < .05). The effect translates into about a 1.22 percent
decrease in the math exam pass rate for the average low performing school in the period
following a principal succession.
As with my previous models estimating the ELA exam pass rate, the interactive model
would not converge with a logistic transformed dependent variable. As a consequence, I
estimate the effect of principal succession contingent on past performance on the ELA exam pass
rate measured as a proportion and not logistic transformed. Table 5.6 shows estimated

121
coefficients of the effect of principal succession on ELA exam pass rates contingent on prior
performance. The baseline relationship is not statistically significant (β = .003; p > .10).
However, when principal succession is interacted with the ELA high performance in t-1 dummy
variable, the relationship is positive and marginally significant (β = .013; p < .10), relative to the
baseline group. The principal succession and ELA low performance in t-1 interaction term is
negative and statistically significant (β = -.016; p < .01), relative to the baseline group.
Table 5.6 also calculates the marginal effect and standard errors for the interaction
products. Since the dependent variable was not logistic transformed, I can interpret the
coefficients directly. The marginal effect of the interaction between principal succession and
ELA high performance in t-1 is both positive and statistically significant (dy/dx = .015; p < .01),
providing evidence that in high performing schools principal succession actually provides a
slight boost of about 1.50 percent to the ELA exam pass rate. The marginal effect of the
interaction between principal succession and ELA low performance in t-1 is negative and
statistically significant (dy/dx = -.014; p < .05). The marginal effect indicates that principal
succession has a negative effect of about 1.4 percent on the ELA exam pass rate in low
performing schools.
As with Table 5.5, Table 5.6 provides statistical evidence contradicting my original
hypothesis that managerial succession would have positive consequences for low-performing
organizations and negative consequences for high-performing organizations. I provide a
complete discussion of these unanticipated findings in Chapter 8.
Does Performance Drive Instability?
I now test whether performance drives future collective teacher turnover. To do so, I
have structured the data in a way that, for instance, matches performance assessed in spring of

122
2008 with the turnover that occurs in the period from January 2008 to December 2008. The
measure of collective teacher turnover does overlap temporally, albeit in a very limited way, with
the measurement of performance. However, I assume that the majority of the turnover measured
in the period from January 2008 to December 2008 occurs after the completion of the 2007-08
school year. Thus, performance measured in spring 2008 is used to predict turnover measured in
a period from January 2008 to December 2008. I still assume that the change in principal occurs
in between the school years. School performance measured in spring 2008 is used to predict the
presence of a new principal in a school at the beginning of the 2008-09 school year. All the data
are restructured this way across years.
Performance and Future Employee Turnover
Table 5.7 presents analyses of the relationships between three measures of performance
and future collective employee turnover. All of the models have Wald statistics providing
evidence of acceptable model fit. As with all the previous dependent variables that are bounded
proportions between zero and one, I perform a logistic transformation on the dependent variable
prior to the estimation of the model. Model 1, Model 2, and Model 3 show the effects of ELA
exam pass rates, math exam pass rates, and parent satisfaction on the collective teacher turnover
rate modeled separately.
When modeled separately, ELA exam pass rate (β = -.779; p < .01), Math exam pass rate
turnover (β = -.594; p < .01), and parent satisfaction (β = -.071; p < .01) all have statistically
significant negative relationships with future collective employee turnover, suggesting that as
test scores and parent satisfaction increase, teacher turnover goes down. Across these three
models, I see that teachers w/ less than 3 years’ experience (%), teachers out of certification,
student to teacher ratio, classification as an intermediate school, special education (%), and

123
students receiving suspensions (%) are all positively related to collective teacher turnover in the
period following exams. Only attendance rate and total enrollment are negatively related to
performance. The borough dummy, CSD dummy, and year dummy variables were each
statistically significant as a group (p < .05) in Model 1, Model 2, and Model 3 in Table 5.7.
Model 4 in Table 5.7 presents a more robust test of the independent effects of each
measure of school performance on collective teacher turnover by including all three performance
measures. Both ELA exam pass rates (β = -.614; p < .05) and parent satisfaction (β = -.053; p <
.05) are negative and significantly related to future collective teacher turnover. Math exam pass
rate is no longer statistically significant.
Figure 5.3 plots the predicted value of future collective teacher turnover at different ELA
exam pass rate. The mean ELA exam pass rate in the population of schools is approximately 55
percent. When the ELA exam pass rate is 55 percent the predicted value of collective teacher
turnover is 4.440 percent. Following a standard deviation increase, approximately 21 percent, in
the mean value of the ELA exam pass rate, the predicted value of collective turnover in a future
period is 3.924 percent. At a standard deviation below the mean the predicted value is 5.001
percent.
Figure 5.4 plots the predicted value of future collective teacher turnover at different
levels of aggregated parent satisfaction factor scores. The plot shows another substantively
small negative relationship. At the mean parent satisfaction score (zero), the predicted value of
collective teacher turnover is 4.421 percent. One standard deviation increase above the mean, the
predicted value of collective teacher turnover is 4.201. One standard deviation below the mean,
the predicted value is 4.651 percent.

124
With respect to control variables in Model 4, teachers with less than 3 years’ experience
(%), teachers out of certification (%), special education (%) and students receiving suspensions
(%) are all positively related to future collective teacher turnover. Total enrollment is negatively
related to teacher turnover. In Model 4, the CSD dummy variables were only marginally
significant as a group = 39.80, p < .10), while both the borough dummy = 22.85, p < .01)
and year dummy = 21.92, p < .01) variables were each significant as a group.
As I mentioned, I expect the majority of teacher turnover to occur between school years.
While the results above provide evidence that today’s performance is related to future turnover, I
probe this relationship further with a Granger test (see discussion above). I predict collective
teacher turnover with three lags of the dependent variable and independent variables. In the
analysis of three lags, ELA exam pass rates Granger causes future collective teacher turnover
( 44.48; p < .01) and parent satisfaction Granger causes future collective teacher turnover
(F 9.28; p < .01).
Performance and Managerial Succession
I now test whether performance is negatively related to future principal succession.
Since the dependent variable is coded as either a zero to indicate no change, or a one to indicate a
change, I must use an estimator that is appropriate for this binary variable. The GEE model is
flexible, and I can specify the estimation of a logit model and a binomial distribution of the
dependent variable. As with all the other GEE models, the model above is corrected with a
correlation structure. With respect to timing, the indicator of principal succession is whether or
not a new principal is observed in the school year following the school year in which the
performance was assessed.

125
Table 5.8 reports four models of performance’s relationship with future principal
succession. The Wald statistic for each model suggests acceptable fit. As with collective
teacher turnover, I begin by modeling the relationships between performance and future
principal succession separately in Model 1, Model 2, and Model 3. Only two of these three
variables, however, have significant negative relationships with likelihood of managerial change
in the future period. ELA exam pass rate (β = -1.493; p < .10) and parent satisfaction (β =
-.218; p < .01) are negatively and significantly related to the likelihood of managerial succession
when the relationships are modeled individually.
A more robust test of the relationship between performance and the likelihood of
principal succession is presented in Model 4. In Model 4, I include all three measures of
performance. In this model, the effect of the ELA pass rate on performance is significant, but
only at the .10-level (β = -1.864; p < .10). Parent satisfaction also retains a negative and
statistically significant relationship with the probability of a principal succession (β = -.176; p <
0.05).
As with all the predicted values I present, the predictions are estimates for an elementary
school located in Brooklyn in the year 2006 with mean (average) values of all other independent
variables measured at the interval level or as proportions. Figure 5.5 demonstrates that as the
ELA exam pass rate increases, the predicted probability of a principal succession decreases. The
mean ELA exam pass rate in the population of schools studied is approximately 55 percent. At
the mean value, the predicted probability of a change in principal is 3.795 percent. Following a
standard deviation increase, approximately 21 percent, in the mean value of the ELA exam pass
rate, the predicted probability of a principal succession in the following period is 2.598 percent.

126
At a standard deviation below the mean, the predicted probability of a change in principal is
5.531 percent.
Figure 5.6 shows that as parent satisfaction in a school increases the probability of a
principal succession occurring in the following period decreases. When the parent satisfaction
score is zero (population mean), the predicted probability of a principal succession occurring is
3.750 percent. When the parent satisfaction score increases one standard deviation above the
mean the predicted probability of a principal succession occurring is 3.165 percent. When the
parent satisfaction is one standard deviation below the mean, the predicted probability of a
principal succession occurring is 4.438 percent.
Of all the control variables included in Table 5.8, only teachers out of certification, as
well as borough dummy, CSD dummy, and year dummy variables are significant across all four
models.
Chapter Summary
While I will provide a much more in depth discussion of these results and their
implications for research in Chapter 8, I now summarize the empirical findings that test the
hypotheses I generated in Chapter 3. In the analyses, I found no direct relationship between
principal succession and ELA exam performance, Math exam performance, or parent
satisfaction. Thus, there is no evidence to support Hypotheses 1a or 1b (see Table 3.1).
Interestingly, when I test whether the relationship between principal succession and school
performance is contingent upon performance in the previous period an interesting finding
emerges. The findings provide evidence contradicting Hypotheses 2a and 2b. In New York City
elementary, intermediate (K-8), and elementary schools it appears that principal succession has a
positive effect on performance for previously high performing organizations and a negative

127
effect on performance for previously low performing organizations. I discuss this unexpected
finding in far greater depth in Chapter 8.
I found no evidence of a direct relationship between collective teacher turnover and
organizational performance and, thus, no support for Hypothesis 3. However, collective teacher
turnover does appear to have statistically significant nonlinear relationships with the both the
Math exam pass rate and ELA exam pass rate, and the analyses provide statistical support for
Hypothesis 4. There are, however, three caveats to the statistical finding. First, while models
provide statistical evidence of the nonlinear relationship, the substantive relationship is very
small. Second, in the case of the ELA exam pass rate, the predicted relationships seem to be
driven by outlier values of collective teacher turnover. Finally, the findings are not in the shape
of an inverted-U suggested in the literature, as Figures 5.1 and 5.2 illustrate. The relationship
can be described as lower levels of turnover not hurting organizational performance, perhaps
giving it even a slight boost. However, as turnover increases past a certain level, the relationship
becomes increasingly negative.
Finally, I find evidence that organizational performance is related to future levels of
collective teacher turnover and principal succession. When I use current performance to predict
personnel instability in future periods, both the ELA exam pass rates and parent satisfaction are
significantly related to future collective teacher turnover and managerial succession. The
findings provide support for both Hypotheses 5a and 5b, and suggest that in addition to personnel
instability affecting performance, in New York City schools organizational performance drives
personnel instability in the future.

128
Table 5.1
Descriptive Statistics
Variable Obs. Mean Std. Dev. Min Max
School Performance
Parent satisfaction 4,557 0.030 0.927 -4.90 3.81
ELA exam pass rate (%) 5,361 0.553 0.205 0.065 1
Math exam pass rate (%) 5,361 0.686 0.207 0.062 1
Personnel Instability
Principal succession 5,361 0.090 0.286 0 1
Collective teacher turnover (%) 5,361 0.157 0.089 0 0.71
Internal School Characteristics
Teachers with Master's plus (%) 5,361 0.387 0.147 0 0.88
Teachers with less than 3 years exp. (%) 5,361 0.125 0.105 0 0.69
Teachers out of certification (%) 5,361 0.082 0.075 0 0.53
Total enrollment (per 10 students) 5,361 69.498 32.741 10.8 225
Student to teacher ratio 5,361 13.533 2.255 4.32 25.67
School type
Elementary 5,361 0.603 0.489 0 1
Intermediate (K-8) 5,361 0.132 0.339 0 1
Middle 5,361 0.265 0.441 0 1
Student Characteristics
Student stability (% returning) 5,361 0.889 0.090 0 1
White (%) 5,361 0.153 0.217 0.001 0.944
Black (%) 5,361 0.317 0.290 0.001 0.968
Asian (%) 5,361 0.129 0.178 0.001 0.933
Hispanic (%) 5,361 0.391 0.258 0.007 0.992
Special education (%) 5,361 0.154 0.059 0.002 0.513
English language learners (%) 5,361 0.133 0.112 0 0.662
Free or reduced lunch (%) 5,361 0.715 0.224 0.024 1
Suspensions (%) 5,361 0.034 0.047 0 0.44
Attendance rate (%) 5,361 0.923 0.026 0.78 0.99
External Environment
Borough
Bronx 5,361 0.205 0.404 0 1
Brooklyn 5,361 0.326 0.469 0 1
Manhattan 5,361 0.166 0.372 0 1
Queens 5,361 0.245 0.430 0 1
Staten Island 5,361 0.058 0.233 0 1
Notes: Parent Satisfaction is observed in only five periods, whereas all other variables are
observed in six. This explains the discrepancy between the numbers of observations.
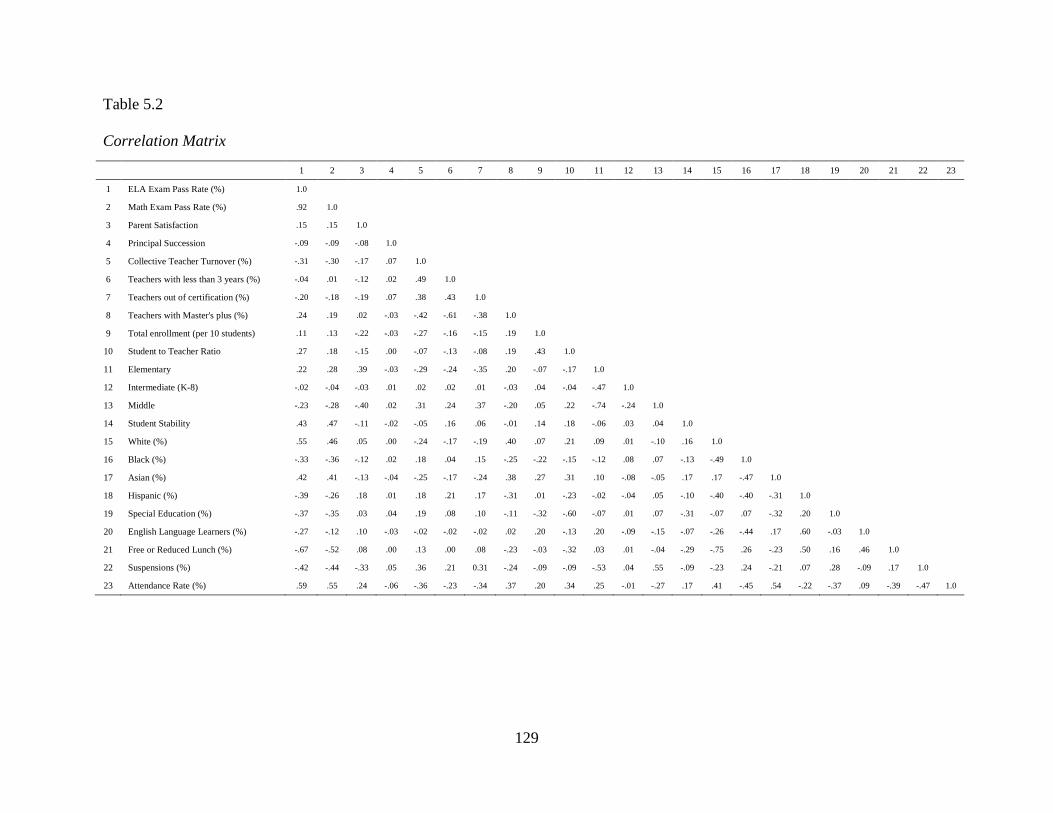
129
Table 5.2
Correlation Matrix
1 2 3 4 5 6 7 8 9 10 11 12 13 14 15 16 17 18 19 20 21 22 23
1 ELA Exam Pass Rate (%) 1.0
2 Math Exam Pass Rate (%) .92 1.0
3 Parent Satisfaction .15 .15 1.0
4 Principal Succession -.09 -.09 -.08 1.0
5 Collective Teacher Turnover (%) -.31 -.30 -.17 .07 1.0
6 Teachers with less than 3 years (%) -.04 .01 -.12 .02 .49 1.0
7 Teachers out of certification (%) -.20 -.18 -.19 .07 .38 .43 1.0
8 Teachers with Master's plus (%) .24 .19 .02 -.03 -.42 -.61 -.38 1.0
9 Total enrollment (per 10 students) .11 .13 -.22 -.03 -.27 -.16 -.15 .19 1.0
10 Student to Teacher Ratio .27 .18 -.15 .00 -.07 -.13 -.08 .19 .43 1.0
11 Elementary .22 .28 .39 -.03 -.29 -.24 -.35 .20 -.07 -.17 1.0
12 Intermediate (K-8) -.02 -.04 -.03 .01 .02 .02 .01 -.03 .04 -.04 -.47 1.0
13 Middle -.23 -.28 -.40 .02 .31 .24 .37 -.20 .05 .22 -.74 -.24 1.0
14 Student Stability .43 .47 -.11 -.02 -.05 .16 .06 -.01 .14 .18 -.06 .03 .04 1.0
15 White (%) .55 .46 .05 .00 -.24 -.17 -.19 .40 .07 .21 .09 .01 -.10 .16 1.0
16 Black (%) -.33 -.36 -.12 .02 .18 .04 .15 -.25 -.22 -.15 -.12 .08 .07 -.13 -.49 1.0
17 Asian (%) .42 .41 -.13 -.04 -.25 -.17 -.24 .38 .27 .31 .10 -.08 -.05 .17 .17 -.47 1.0
18 Hispanic (%) -.39 -.26 .18 .01 .18 .21 .17 -.31 .01 -.23 -.02 -.04 .05 -.10 -.40 -.40 -.31 1.0
19 Special Education (%) -.37 -.35 .03 .04 .19 .08 .10 -.11 -.32 -.60 -.07 .01 .07 -.31 -.07 .07 -.32 .20 1.0
20 English Language Learners (%) -.27 -.12 .10 -.03 -.02 -.02 -.02 .02 .20 -.13 .20 -.09 -.15 -.07 -.26 -.44 .17 .60 -.03 1.0
21 Free or Reduced Lunch (%) -.67 -.52 .08 .00 .13 .00 .08 -.23 -.03 -.32 .03 .01 -.04 -.29 -.75 .26 -.23 .50 .16 .46 1.0
22 Suspensions (%) -.42 -.44 -.33 .05 .36 .21 0.31 -.24 -.09 -.09 -.53 .04 .55 -.09 -.23 .24 -.21 .07 .28 -.09 .17 1.0
23 Attendance Rate (%) .59 .55 .24 -.06 -.36 -.23 -.34 .37 .20 .34 .25 -.01 -.27 .17 .41 -.45 .54 -.22 -.37 .09 -.39 -.47 1.0

130
Table 5.3
The Effect of Personnel Instability on Performance
Math Pass (Logistic Trans.) Parent Satisfaction
(1) (2) (3) (4)
b se b se b se b se
Personnel Instability
Principal Succession 0.000 (0.01) 0.001 (0.01) 0.010 (0.03) 0.011 (0.03)
Collective Teacher Turnover -0.040 (0.06) 0.324* (0.15) -0.002 (0.14) 0.522 (0.32)
Collective Teacher Turnover2
-0.827** (0.31)
-1.247 (0.80)
Internal School Characteristics
Teachers with master's plus 30 hours (%) -0.044 (0.09) -0.038 (0.09) -0.188 (0.14) -0.182 (0.14)
Teachers with less than 3 years exp. (%) -0.343*** (0.10) -0.335*** (0.10) -0.062 (0.16) -0.038 (0.16)
Teachers out of certification (%) -0.092 (0.10) -0.084 (0.10) -0.403+ (0.23) -0.385+ (0.23)
Total Enrollment (Per 10 Students) -0.003*** (0.00) -0.003*** (0.00) -0.007*** (0.00) -0.006*** (0.00)
Student to Teacher Ratio -0.010+ (0.01) -0.010+ (0.01) -0.030*** (0.01) -0.030*** (0.01)
Intermediate School (Comp. to Elem.) -0.194*** (0.05) -0.195*** (0.05) -0.220*** (0.05) -0.222*** (0.05)
Middle School (Comp. to Elem.) -0.456*** (0.04) -0.453*** (0.04) -0.521*** (0.06) -0.519*** (0.06)
Client Characteristics
Student Stability 0.221*** (0.07) 0.226*** (0.07) -0.037 (0.15) -0.031 (0.15)
White (%) 1.599*** (0.56) 1.579** (0.57) 1.602* (0.80) 1.570+ (0.80)
Black (%) -0.576 (0.55) -0.600 (0.55) 1.613* (0.79) 1.573* (0.79)
Asian (%) 1.666*** (0.56) 1.648*** (0.57) 1.008 (0.82) 0.974 (0.82)
Hispanic (%) 0.217 (0.55) 0.194 (0.55) 2.413*** (0.80) 2.372*** (0.80)
Special Education (%) -2.987*** (0.30) -2.982*** (0.30) -0.329 (0.36) -0.325 (0.36)
English Language Learners (%) -1.600*** (0.22) -1.598*** (0.22) 0.140 (0.24) 0.144 (0.24)
Free or Reduced Lunch (%) -0.215* (0.09) -0.214* (0.09) 0.029 (0.14) 0.033 (0.14)
Suspensions (%) -0.829*** (0.22) -0.829*** (0.22) -1.334*** (0.42) -1.331*** (0.42)
Attendance Rate (%) 8.019*** (0.64) 8.022*** (0.64) 3.640*** (0.87) 3.675*** (0.87)
Student Performance
ELA Exam Pass (%)
0.964*** (0.18) 0.967*** (0.18)
Math Exam Pass (%)
0.580*** (0.14) 0.577*** (0.14)
Constant -5.959*** (0.78) -5.984*** (0.78) -4.352*** (1.10) -4.399*** (1.10)
Observations 5,361 5,361 4,557 4,557
Groups 1,016 1,016 1,016 1,016
Obs./ Group 5.3 5.3 4.5 4.5
Link Function Identity Identity Identity Identity
Family Gaussian Gaussian Gaussian Gaussian
Working Correlation Matrix Unstructured Unstructured Unstructured Unstructured
Wald Chi-Square 18,782.00*** 18,716.10*** 2,709.71*** 2,715.42***
Scale Parameter 0.342 0.341 0.436 0.437
Notes: All models include Community School District (CSD), borough, and year dummy variables (coefficients excluded from the table)
All standard errors adjusted for clustering on the school identifier
+ indicates significance at p < .10, *at p < .05, ** at p < .01, ***at p < .005 (two-tailed tests of significance)

131
Table 5.4
The Effect of Personnel Instability on ELA Exam Performance
ELA Pass Rate (Logistic Trans.)
**MODELS FAILED TO CONVERGE** ELA Pass Rate (%)
(1) (2) (3) (4)
b se b se b se b se
Personnel Instability
Principal Succession 0.006 (0.02) -0.002 (0.01) -0.000 (0.00) -0.000 (0.00)
Collective Teacher Turnover -0.040 (0.07) 0.076 (0.16) -0.030* (0.01) 0.023 (0.02)
Collective Teacher Turnover2
-0.394 (0.33)
-0.122* (0.05)
Internal School Characteristics
Teachers with master's plus 30 hours (%) 0.004 (0.09) 0.015 (0.08) -0.000 (0.01) 0.001 (0.01)
Teachers with Less than 3years (%) -0.063 (0.10) -0.065 (0.09) -0.016 (0.01) -0.014 (0.01)
Teachers out of certification (%) 0.073 (0.10) 0.085 (0.09) -0.006 (0.02) -0.005 (0.02)
Total Enrollment (Per 10 Students) -0.001+ (0.00) -0.001* (0.00) -0.000* (0.00) -0.000** (0.00)
Student to Teacher Ratio 0.007 (0.01) 0.007 (0.01) 0.001 (0.00) 0.001 (0.00)
Intermediate School (Comp. to Elem.) -0.218*** (0.06) -0.198*** (0.04) -0.035*** (0.01) -0.035*** (0.01)
Middle School (Comp. to Elem.) -0.450*** (0.04) -0.441*** (0.03) -0.075*** (0.01) -0.074*** (0.01)
Client Characteristics
Student Stability 0.164 (0.14) 0.147 (0.11) 0.017 (0.01) 0.018 (0.01)
White (%) 1.351+ (0.77) 1.492* (0.62) 0.190* (0.09) 0.190* (0.09)
Black (%) -0.364 (0.77) -0.207 (0.61) -0.134 (0.09) -0.134 (0.09)
Asian (%) 1.133 (0.74) 1.310* (0.60) 0.160+ (0.09) 0.160+ (0.09)
Hispanic (%) 0.243 (0.74) 0.408 (0.60) -0.010 (0.09) -0.010 (0.09)
Special Education (%) -2.881*** (0.28) -2.897*** (0.27) -0.526*** (0.04) -0.525*** (0.04)
English Language Learners (%) -2.043*** (0.20) -2.066*** (0.20) -0.395*** (0.03) -0.396*** (0.03)
Free or Reduced Lunch (%) -0.595*** (0.10) -0.613*** (0.09) -0.076*** (0.01) -0.076*** (0.01)
Suspensions (%) -0.792*** (0.26) -0.742*** (0.23) -0.130*** (0.04) -0.131*** (0.04)
Attendance Rate (%) 7.381*** (0.59) 7.493*** 0.64 1.440*** (0.10) 1.437*** (0.10)
Constant -5.893*** (1.00) -5.984** (0.78) -0.610*** (0.13) -0.612*** (0.13)
Observations 5,361 5,361 5,361 5,361
Groups 1,016 1,016 1,016 1,016
Obs./ Group 5.3 5.3 5.3 5.3
Link Function Identity Identity Identity Identity
Family Gaussian Gaussian Gaussian Gaussian
Working Correlation Matrix Unstructured Unstructured Unstructured Unstructured
Wald Chi-Square
28,936.39*** 28,861.27***
Scale Parameter
.007 .007
Notes: All models include Community School District (CSD), borough, and year dummy variables (coefficients excluded from the table)
All standard errors adjusted for clustering on the school identifier
+ indicates significance at p < .10, *at p < .05, ** at p < .01, ***at p < .005 (two-tailed tests of significance)

132
Table 5.5
Effect of Succession on Math Performance Contingent on Past Performance
b se dy/dx
Std. Err.
(Delta Method) z p
Principal Succession 0.025 (0.02) 0.025 0.022 1.15 0.251
Principal Succession X Previous High Performance (Top 25%) 0.053 (0.05) 0.078* 0.041 1.96 0.050
Principal Succession X Previous Low Performance (Bottom 25 %) -0.088* (0.04) -0.063* 0.032 1.96 0.050
Constant -7.599*** (0.87)
Observations 4,558
Groups 1,016
Obs./ Group 4.5
Link Function Identity
Family Gaussian
Working Correlation Matrix Unstructured
Wald Chi-Square 17,126.19***
Scale Parameter 0.337
Notes: Contains the same controls as model 2 in Table 5.3.
Logistic transformation of the dependent variable.
All standard errors adjusted for clustering on the school identifier.
+ indicates significance at p < .10, *at p < .05, ** at p < .01, ***at p < .005 (two-tailed tests of significance)
Table 5.6
Effect of Succession on ELA Performance Contingent on Past Performance
b
se dy/dx Std. Err.
(Delta Method) z p
Principal Succession 0.002 (0.00) 0.002 0.004 0.50 0.615
Principal Succession X Previous High Performance (Top 25%) 0.013+ (0.01) 0.015** 0.005 3.02 0.003
Principal Succession X Previous Low Performance (Bottom 25%) -0.016** (0.01) -0.014** 0.004 -3.36 0.001
Constant 0.579*** (0.09)
Observations 4,550
Groups 1,016
Obs./ Group 4.5
Link Function Identity
Family Gaussian
Working Correlation Matrix Unstructured
Wald Chi-Square 27,535.45
Scale Parameter 0.007
Notes: Contains the same controls as Model 4 in Table 5.4.
Model failed to converge with a logistic transformed dependent variable; predicted with bounded proportion as DV.
All standard errors adjusted for clustering on the school identifier.
+ indicates significance at p < .10, *at p < .05, ** at p < .01, ***at p < .005 (two-tailed tests of significance)

133
Table 5.7
The Effect of Performance on Future Collective Teacher Turnover
(1) (2) (3) (4)
b se b se b se b se
Performance
ELA Exam Pass (%) -0.779*** (0.15) -0.614* (0.25)
Math Exam Pass (%)
-0.594*** (0.13) -0.113 (0.23)
Parent Satisfaction
-0.071*** (0.02) -0.053* (0.02)
School Characteristics
Teachers with master's plus 30 hours (%) -0.215 (0.16) -0.231 (0.16) -0.284 (0.18) -0.285 (0.18)
Teachers with Less than 3years (%) 2.026*** (0.20) 2.035*** (0.21) 1.944*** (0.23) 1.914*** (0.23)
Teachers out of certification (%) 0.485* (0.20) 0.447* (0.20) 0.485* (0.24) 0.510* (0.24)
Total Enrollment (Per 10 Students) -0.002*** (0.00) -0.002*** (0.00) -0.002*** (0.00) -0.002*** (0.00)
Student to Teacher Ratio 0.098*** (0.01) 0.096*** (0.01) 0.095*** (0.01) 0.096*** (0.01)
Intermediate School (Comp. to Elem.) 0.090* (0.04) 0.085* (0.04) 0.081+ (0.05) 0.060 (0.05)
Middle School (Comp. to Elem.) -0.010 (0.05) -0.005 (0.05) -0.041 (0.06) -0.078 (0.06)
Client Characteristics
Student Stability -0.287 (0.20) -0.245 (0.20) -0.370+ (0.22) -0.301 (0.23)
White (%) -0.699 (1.47) -0.749 (1.47) -0.664 (1.63) -0.614 (1.62)
Black (%) -0.459 (1.47) -0.465 (1.47) -0.247 (1.62) -0.374 (1.61)
Asian (%) -0.458 (1.44) -0.511 (1.42) -0.471 (1.58) -0.419 (1.57)
Hispanic (%) -0.601 (1.46) -0.620 (1.46) -0.403 (1.61) -0.450 (1.60)
Special Education (%) 2.200*** (0.40) 2.357*** (0.39) 2.534*** (0.42) 2.161*** (0.44)
English Language Learners (%) 0.192 (0.21) 0.327 (0.20) 0.516* (0.21) 0.194 (0.22)
Free or Reduced Lunch (%) -0.048 (0.14) 0.059 (0.13) 0.066 (0.16) -0.016 (0.16)
Suspensions (%) 1.482*** (0.37) 1.529*** (0.37) 1.792*** (0.40) 1.606*** (0.40)
Attendance Rate (%) -1.424+ (0.76) -1.649* (0.78) -2.665*** (0.80) -1.338 (0.85)
Constant -1.034 (1.45) -2.247 (1.41) -0.705 (1.58) -1.445 (1.57)
Observations 5,361 5,361 4,557 4,557
Groups 1,016 1,016 1,016 1,016
Obs./ Group 5.3 5.3 4.5 4.5
Link Function identity identity identity identity
Family Gaussian Gaussian Gaussian Gaussian
Working Correlation Matrix Unstructured Unstructured Unstructured Unstructured
Wald Chi-Square 1,864.81*** 1,925.00*** 1,637.38*** 1,742.52***
Scale Parameter .743 .744 .791 .788
Notes: All models include Community School District (CSD), borough, and year dummy variables (coefficients excluded from the table)
All standard errors adjusted for clustering on the school identifier
+ indicates significance at p < .10, *at p < .05, ** at p < .01, ***at p < .005 (two-tailed tests of significance)

134
Table 5.8
Performance's Relationship with Future Principal Succession
(1) (2) (3) (4)
b se b se b se b se
Performance
ELA Exam Pass (%) -1.493** (0.58) -1.864+ (1.00)
Math Exam Pass (%)
-0.633 (0.48) 0.087 (0.82)
Parent Satisfaction
-0.218** (0.08) -0.176* (0.08)
School Characteristics
Teachers with master's plus 30 hours (%) -0.266 (0.47) -0.281 (0.47) -0.265 (0.57) -0.241 (0.57)
Teachers with Less than 3years (%) -1.064 (0.65) -1.033 (0.65) -1.107 (0.78) -1.179 (0.77)
Teachers out of certification (%) 1.858* (0.75) 1.770* (0.75) 2.369** (0.92) 2.516** (0.91)
Total Enrollment (Per 10 Students) -0.001 (0.00) -0.001 (0.00) -0.002 (0.00) -0.002 (0.00)
Student to Teacher Ratio 0.029 (0.03) 0.026 (0.03) 0.042 (0.04) 0.047 (0.04)
Intermediate School (Comp. to Elem.) 0.097 (0.15) 0.132 (0.15) 0.204 (0.17) 0.150 (0.18)
Middle School (Comp. to Elem.) -0.243 (0.17) -0.180 (0.16) -0.206 (0.19) -0.301 (0.20)
Client Characteristics
Student Stability 0.463 (0.78) 0.441 (0.78) 0.621 (0.87) 0.768 (0.91)
White (%) 3.508 (4.34) 3.482 (4.34) 0.510 (4.81) 0.698 (4.83)
Black (%) 3.320 (4.32) 3.502 (4.33) 0.682 (4.77) 0.408 (4.78)
Asian (%) 3.033 (4.34) 3.002 (4.34) 0.461 (4.78) 0.670 (4.80)
Hispanic (%) 3.337 (4.30) 3.438 (4.31) 0.808 (4.74) 0.730 (4.75)
Special Education (%) 0.766 (1.23) 1.266 (1.21) 1.650 (1.40) 0.748 (1.45)
English Language Learners (%) -0.394 (0.79) 0.005 (0.78) 0.137 (0.89) -0.721 (0.98)
Free or Reduced Lunch (%) -0.646 (0.51) -0.433 (0.49) -0.481 (0.58) -0.752 (0.62)
Suspensions (%) 2.680* (1.33) 2.807* (1.33) 1.051 (1.46) 0.706 (1.46)
Attendance Rate (%) 0.851 (3.09) -0.802 (3.06) -6.212+ (3.18) -3.240 (3.40)
Constant -5.246 (5.09) -4.481 (5.07) 2.544 (5.68) 0.959 (5.81)
Observations 5,351 5,351 4,548 4,548
Groups 1,014 1,014 1,013 1,013
Observ/ Group 5.3 5.3 5.3 4.5
Link Function logit logit logit logit
Family binomial binomial binomial binomial
Working Correlation Matrix unstructured unstructured unstructured unstructured
Wald Chi-Square 232.68*** 229.15*** 197.77*** 202.76***
Scale Parameter 1 1 1 1
Notes: All models include Community School District (CSD), borough, and year dummy variables (coefficients excluded from the table)
All standard errors adjusted for clustering on the school identifier
+ indicates significance at p < .10, *at p < .05, ** at p < .01, ***at p < .005 (two-tailed tests of significance)

135
Figure 5.1

136
Figure 5.2

137
Figure 5.3

138
Figure 5.4

139
Figure 5.5
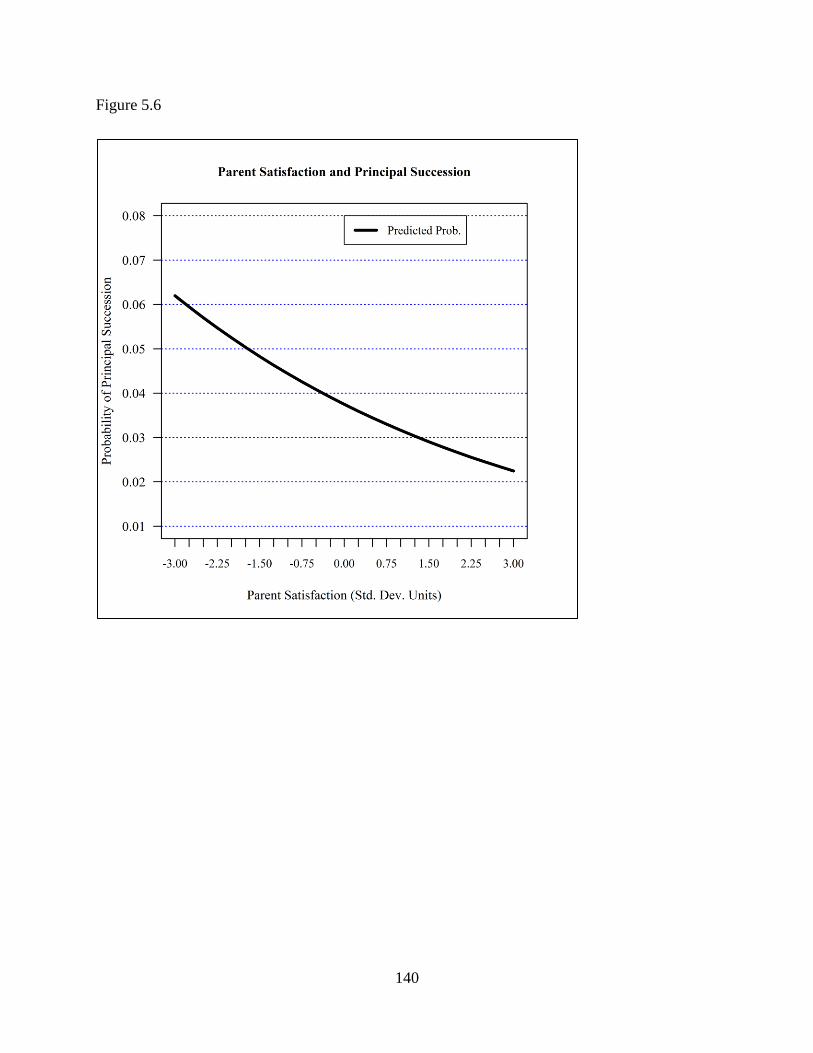
140
Figure 5.6

141
CHAPTER 6
ANALYSIS OF PERSONNEL INSTABILITY AND
ORGANIZATIONAL HUMAN CAPITAL
In this chapter I analyze the relationship between personnel instability and organization
human capital in New York City’s elementary, intermediate (K-8), and middle schools. I begin
by testing whether collective teacher turnover is related to lower levels of organizational human
capital quality in future periods. Drawing on my review of previous education research, I will
also consider the possibility that schools with lower levels of human capital quality will also
have higher rates of teacher turnover in future periods. Finally, I conclude the chapter by
examining of whether principal succession is related to higher levels of collective teacher
turnover in the future.
Collective Employee Turnover and Organizational Human Capital
I use the same GEE modeling strategy as well as the same data and variables reported and
described in Chapter 4 and Chapter 5 (see Table 5.1 and Table 5.2). The adjusted correlation
matrices used to correct the estimated coefficients in the GEE models are reported in Appendix
3. I estimate robust standard errors clustered by unit (schools) and discuss the statistically
significant coefficients resulting from two-tailed tests.
In this Chapter I examine three indicators of human capital quality: teachers with
master’s plus 30 hours (%), teachers with less than three years’ experience (%), teachers out of
certification (%). I perform a logistic transformation on all of the dependent variables measured
as bounded proportions. While I am interested in the effect of collective teacher turnover on

142
these indicators of human capital quality, I also include the principal succession indicator
variable in the models.
I control for a number of variables in the models analyzing the relationship between
collective teacher turnover and human capital quality. I capture client characteristics with the
following variables: student stability, White (%), Black (%), Asian (%), Hispanic (%), special
education (%), English language learners (%), students receiving free or reduced lunch (%),
students receiving suspension (%), and the annual attendance rate. To capture the internal
school characteristics that are not indicators of human capital quality, I include total enrollment
and student to teacher ratio, as well as dummy indicator variables measuring whether the school
is an intermediate or middle school. I include two sets of dummy variables to control for the
community school district (CSD dummies) and the borough (borough dummies). Together these
two sets of dummy variables capture the variance specific to a school’s geographic location.
Additionally, I include year dummies to control for differences in pass rates on a year-to-year
basis. Although I do not show the coefficients of the CSD dummy, borough dummy, or year
dummy variables in my tables, I briefly discuss their joint significance as appropriate. Since the
literature suggests that school performance is related to the human capital quality in schools, I
control for past performance using three measures of performance: ELA pass rates, math pass
rates, and parent satisfaction.33
Finally, in the GEE models the school-specific effects are
accounted for by adjusting the covariance matrix of the estimated parameters to account for non-
independent errors (Zorn, 2001, p. 474). This helps account for the unobserved, unmeasured,
and unique characteristics of each specific school, and helps me guard against spurious
relationships caused by unobserved or omitted variables.
33
See Table 5.1 and Table 5.2 in Chapter 3 for descriptive statistics and bivariate correlations of the variables used
in the following analyses.

143
The Effect of Collective Teacher Turnover on Human Capital Quality
I begin by testing whether collective teacher turnover predicts the level of human capital
quality in the following period. Since I assume that the majority of turnover measured from
January 2008 to December 2008 occurs in the summer between school years (June, July, and
August), I match collective teacher turnover measured in this time frame to measures of human
capital indicators measured and reported in the 2008-09 school year.34
In Table 6.1, the Wald test statistic of each model suggests acceptable fit. Model 1,
Model 2, and Model 3 show tests of the relationships between collective teacher turnover and
indicators of human capital quality. The results indicate that collective teacher turnover is
negatively related to teachers with a Master’s plus 30 hours (%), but the result is only
marginally significant (β = .162, p < .10). Collective teacher turnover has a significant and
positive relationship with teachers with less than 3 years’ experience (%) (β = 2.238, p < .01).
Together the results suggest that as turnover increases schools become increasingly dependent on
less experienced teachers.35
Models 1-3 provide preliminary support for the hypothesis that collective employee
turnover undermines an organization’s human capital quality. A more stringent test, however, of
the independent effect of collective teacher turnover on each human capital quality indicator
controls for the other measures of human capital quality since these measures are likely not
independent of each other as outcomes. For instance, a school with high levels of teachers with
less than 3 years’ experience is likely to have low levels of highly credentialed employees as
34
I recognize that there are times when teachers change or transfer schools outside of the time frame that I assume.
However, even if teacher turnover occurs evenly throughout the year, by structuring the data this way I ensure that
eight months of collective teacher turnover are measured prior to the measurement of human capital quality in the
following school year. 35
I reran the models and corrected for a right-skewed distribution in the e main independent variable of interest,
collective teacher turnover, by logging the measure. The only change to the relationships among variables was that
the relationship between collective teacher turnover and teachers with a master’s plus 30 hours (%) became
significant at the .05-level (two-tailed test).

144
reflected by the measure of teachers with a master’s plus 30 hours (%). Likewise, a school with
a high percentage of highly credentialed employees, as reflected by the measure of teachers with
a master’s plus 30 hours (%), might have lower levels of teachers out of certification (%).
Models 4, Model 5, and Model 6 add the future values of human capital indicators not used as
the dependent variables in the model as controls, creating a more robust test of the independent
effect of collective teacher turnover on each individual indicator.
In Table 6.1, Model 4, Model 5, and Model 6 have Wald test statistics providing
evidence of acceptable fit. Of these three models of collective teacher turnover and indicators
of human capital quality, only Model 5 demonstrates a significant relationship between the
variables of interest. Collective teacher turnover is positively related to teachers w/less than 3
years’ experience (%) (β = 1.885; p < .01).36
I use the coefficients estimated in the model to
generate a linear predictor (ŷ) of the dependent variable. For all the figures I calculate the
predicted value for a hypothetical range of the independent variable of interest measured as a
proportion (zero to one). However, the actual range, from the minimum value to the maximum
value, of each variable can be found in Table 5.1. Following the prediction, I transform the
predictor back into a proportion.37
Figure 6.1 shows a positive relationship between collective teacher turnover and teachers
w/less than 3 years’ experience (%).38
The figure supports the hypotheses that collective teacher
turnover is related to higher levels of inexperience among the frontline employees in the
organization in future periods. At the mean value of collective teacher turnover (approximately
36
I also estimated the models after correcting for a right skew in the collective teacher turnover variable, as well as
each human capital indicator treated as independent variables in each model. There was no change in the
significance or direction of any of the relationships, suggesting robustness of the original model. 37
I use the following equation to transform the linear prediction back to a proportion: /( 38
To ensure consistency, the values used to calculate predicted values in this chapter are the same as those used in
all figures in Chapter 5. All predicted values are calculated at the mean of each independent variable (or modal
value of categorical independent variables). The result is the predicted probability for an average elementary school,
located in Brooklyn in the 2006-07 school year.
145
16 percent) the predicted percentage of inexperienced teachers is 8.902 percent. When collective
teacher turnover increases one standard deviation from the mean (approximately nine percent)
the predicted value of teachers w/less than 3 years’ experience (%) is 10.399 percent. Finally, a
standard deviation decrease from the mean of collective teacher turnover results in a predicted
value of teachers w/less than 3 years’ experience (%) is 7.064 percent.
In Model 5, teachers with a master’s plus 30 hours (%) is significant and negatively (β =
-3.577; p < .10) related to teachers w/less than 3 years’ experience (%). Teachers out of
certification (%) is also significant and positively (β = .975; p < .10) related to teachers w/less
than 3 years’ experience (%). By including these variables in the model I am more confident
that I have isolated the relationship between collective teacher turnover and teachers w/less than
3 years’ experience (%).
Among the other control variables in Model 5, the attendance rate and the middle school
dummy variable are each positively associated with teachers w/less than 3 years’ experience
(%). The ELA exam pass rates are negatively related to the percentage of teachers with less than
3 years’ experience (%). Tests of joint significance show that year dummy ( = 678.64; p <
.01), CSD dummy ( = 51.827; p < .01), and borough dummy ( = 22.50; p < .01) variables are
each jointly significant as a group in Model 5. To test the temporal sequencing of the model, I
perform a Granger test on three periods of lagged values of collective teacher turnover and
teachers with less than 3 years’ experience.39
As expected, the test provides statistical support
(F = 22.50; p < .01) for my temporal sequencing of the data and the statement that collective
teacher turnover Granger causes lower levels of employee experience in the organization.
39
As I discuss in Chapter 5, I regress the dependent variable of interest (Y) on its own lagged values and on the
lagged values of the independent variable (X) and test whether the coefficients on the lagged values of the
independent variable are jointly equal to zero (StataCorp, 2013a). If the coefficients of the lagged independent
variable are jointly significant and not equal to zero, I can say that X Granger causes Y.

146
Does Human Capital Quality Drive Future Turnover?
The education literature also suggests that teachers without proper levels of training,
education, and experience are the ones most likely to exit a school. Thus, human capital quality
might be related to higher collective turnover rates in future periods. While the data are
measured at the organizational-level, and I cannot make inferences about who is leaving the
organization, there is ample reason to expect that organizations with lower levels of human
capital quality are likely to have higher levels of turnover. To model this relationship, I used
human capital quality measured in the 2007-2008 school year to predict turnover that occurs
between January 2008 and December 2008. I assume that the majority of the turnover takes
place in the summer and between school years. Thus, the human capital quality measured during
the school year is used to predict turnover that occurs after that school year.
The model in Table 6.2 has a Wald test statistic that indicates acceptable model fit. In
Table 6.2, teachers w/ less than 3 years’ experience (%) (β = 1.922, p < .01) and teachers out of
certification (%) (β = .492; p < .05) are both positively and significantly related to future
collective teacher turnover.40
To probe the causal order, I conduct a Granger test on three
periods. The test provides statistical evidence (F = 24.11; p < .01) that teachers out of
certification (%) Granger causes, or precedes, collective teacher turnover in future periods. A
second test also provides statistical evidence (F = 31.91; p < .01) that teachers with less than
three years exp. (%) Granger causes, or precedes, collective teacher turnover in future periods.
In Figure 6.2 I plot the relationship between teachers w/less than 3years’ experience and
collective teacher turnover in a future period. At the mean value of teachers w/less than 3 years’
experience (approximately 13 percent) the predicted value of collective employee turnover is
40
As a robustness check, I logged the measures of organizational human capital used as predictors (X) of collective
human turnover (Y) in Table 6.2 to correct for a right skew in their distribution. The significance levels of the
coefficients on each variable increased only slightly.

147
approximately 11.725 percent. One standard deviation (approximately 11 percent) above the
mean the predicted value of collective teacher turnover is 14.096 percent. One standard
deviation below the mean, the predicted value is approximately 9.708 percent. The figure
suggests that as experience decreases within the school, the collective teacher turnover rate
increases.
Figure 6.3 plots the relationship between teachers out of certification and collective
teacher turnover. The figure shows that at a mean value of about 8 percent, the collective
teacher turnover rate is predicted to be 11.693 percent. One standard deviation (approximately 8
percent) below the mean the predicted value of collective teacher turnover is 11.342 percent.
Finally, when the value of teachers out of certification (%) is about one standard deviation above
the mean the predicted value of collective teacher turnover is 12.106 percent.
A number of other variables are significant in the model shown in Table 6.2, including
principal succession (discussed below), total enrollment, student to teacher ratio, suspensions
(%), ELA exam pass rate, and parent satisfaction. Tests of joint significance provide evidence
that both the borough dummy ( = 22.72; p < .01) and year dummy ( = 21.79; p < .01) are
statistically significance, while the CSD dummy ( = 39.92; p < .10) variables are only
marginally significant as a group.
Managerial Succession and Future Employee Turnover
Table 6.2 also displays the results of testing my hypothesis that managerial succession
will destabilize an organizational system and initiate higher levels of collective teacher turnover
in future periods. The results indicate an increase in turnover in the period following a new
principal in a school (β =.075; p < .05).41
When I calculate the substantive meaning of this beta
41
One might reasonably assume that collective teacher turnover might increase as a result of teachers learning about
a change in management. As a robustness check, I ran a model that used principal succession to predict teacher
148
coefficient’s effect on the logistic transformed collective teacher turnover variable, the result is
that principal succession is followed by a 1.875 percent increase in collective teacher turnover in
the following period.
Chapter Summary
In this Chapter I have examined the relationship between personnel instability and
organizational human capital quality. While I will discuss the findings with respect to the extant
literature and research in greater depth in Chapter 8, I will now discuss these findings as they
relate to the hypotheses I generated in Chapter 3.
In this Chapter I presented evidence that as collective teacher turnover increases, the
level of employee experience in the organization decreases in future periods. This finding
suggests that schools turn to a less experienced employee pool to replace those that leave. The
finding provides statistically significant evidence in support of Hypothesis 6 (see Table 3.1) and
the negative relationship between collective employee turnover and organizational human capital
quality in the following period. I have also explored the relationship from the opposite causal
direction by restructuring the data in a way that tries to ensure that human capital quality
indicators are measured in the period prior to the measurement of collective teacher turnover. I
find statistically significant evidence that schools with lower levels of human capital quality will
have higher levels of collective teacher turnover in the future. Table 6.2 shows that both
teachers out of certification (%) and teachers with less than 3 years’ experience (%) are
associated with increases in collective teacher turnover measured in the following period.
Support for both hypotheses suggests the presence of a reciprocal relationship that plays out over
turnover reported in the same year, prior to the placement of a new principal in the school. The result was that the
coefficient was not statistically significant, suggesting that the spike in collective employee turnover occurs after a
period of time in which the new principal has been leading the school—not in the period prior to the placement of
the new principal.

149
time between the variables in New York City elementary, intermediate (K-8), and middle
schools. Not only are schools with high collective employee turnover more dependent on less
experienced teachers, but also schools with higher levels of less experienced teachers are likely
to have higher levels of collective teacher turnover.
Finally, in this chapter I tested whether principal succession is related to higher levels of
collective teacher turnover in future periods. I found statistically significant evidence of a
positive relationship, indicating that in the period following a principal succession the collective
teacher turnover increases. Therefore, I have support for Hypothesis 8 and evidence of a
positive relationship between a change in manager and higher levels of employee turnover in the
period that following the new manager’s arrival in the organization.

150
Table 6.1
Collective Teacher Turnover and Future Human Capital Quality
(1) (2) (3) (4) (5) (6)
Master's Plus 30 <3 Years Exp. Out of Cert. Master's Plus 30 <3 Years Exp. Out of Cert.
b se b se b se b se b se b se
Personnel Instability
Collective teacher turnover -0.162+ (0.09) 2.238*** (0.18) 0.246 (0.19) 0.105 (0.09) 1.885*** (0.17) -0.082 (0.20)
Principal succession 0.002 (0.01) -0.020 (0.04) 0.035 (0.05) 0.013 (0.01) -0.013 (0.04) 0.036 (0.05)
Client Characteristics
Student stability -0.031 (0.05) 0.148 (0.16) 0.211 (0.17) -0.039 (0.06) 0.103 (0.15) 0.218 (0.17)
White (%) 1.775*** (0.46) -3.275*** (1.10) -3.084* (1.32) 1.158* (0.45) -0.493 (1.09) -2.514+ (1.30)
Black (%) 1.076* (0.45) -3.363*** (1.10) -2.810* (1.33) 0.451 (0.45) -1.201 (1.08) -2.308+ (1.31)
Asian (%) 1.862*** (0.46) -3.400*** (1.08) -3.445** (1.32) 1.220** (0.46) -0.563 (1.08) -2.881* (1.31)
Hispanic (%) 1.049* (0.45) -2.800* (1.09) -2.810* (1.33) 0.489 (0.45) -0.711 (1.08) -2.385+ (1.31)
Special education (%) 0.715* (0.30) -0.308 (0.47) 1.199* (0.47) 0.357 (0.26) 0.179 (0.41) 1.385*** (0.47)
English language learners (%) 0.160 (0.15) -0.270 (0.29) 0.783** (0.29) 0.113 (0.15) -0.192 (0.26) 0.882*** (0.29)
Free or reduced lunch (%) 0.137 (0.09) 0.026 (0.18) -0.146 (0.17) 0.166* (0.08) 0.203 (0.16) -0.121 (0.17)
Suspensions (%) -0.550*** (0.20) 1.031* (0.47) 1.681*** (0.45) -0.628*** (0.19) 0.152 (0.41) 1.508*** (0.44)
Attendance rate (%) -0.172 (0.54) 2.721** (1.04) -1.585 (1.04) -0.084 (0.47) 2.292* (0.94) -1.938+ (1.04)
School Characteristics
Total enrollment (per 10 students) 0.001* (0.00) -0.001 (0.00) -0.001 (0.00) 0.001+ (0.00) -0.000 (0.00) -0.001 (0.00)
Student to teacher ratio -0.015* (0.01) 0.015 (0.01) 0.029** (0.01) -0.012* (0.01) 0.009 (0.01) 0.027* (0.01)
Intermediate school (comp. to elem.) -0.087** (0.03) 0.173*** (0.06) 0.467*** (0.07) -0.060+ (0.03) 0.099+ (0.05) 0.448*** (0.06)
Middle School (comp to elem.) -0.230*** (0.04) 0.377*** (0.06) 1.064*** (0.06) -0.142*** (0.04) 0.166*** (0.05) 1.011*** (0.06)
Performance
ELA exam pass (%) 0.290** (0.11) -0.707*** (0.24) -0.380 (0.25) 0.204* (0.10) -0.442* (0.22) -0.273 (0.25)
Math exam pass (%) -0.107 (0.08) 0.265 (0.19) 0.724*** (0.20) -0.138+ (0.07) 0.091 (0.18) 0.682*** (0.20)
Parent satisfaction -0.037*** (0.01) 0.047* (0.02) 0.025 (0.02) -0.038*** (0.01) 0.008 (0.02) 0.018 (0.02)
Human Capital Indicators
Teachers with less than 3years (%) (in T+1) -1.775*** (0.12) 1.112*** (0.23)
Teachers out of certification (%) (in T+1) -0.099 (0.10) 0.975*** (0.22)
Teachers with master's plus 30 (%) (in T+1) -3.577*** (0.15) -0.445* (0.18)
Constant -0.595 (0.68) -3.507** (1.34) -0.435 (1.61) 0.011 (0.62) -3.253* (1.29) -0.372 (1.61)
Observations 4,548 4,548 4,548 4,548 4,548 4,548
Groups 1,013 1,013 1,013 1,013 1,013 1,013
Obs./ Group 4.5 4.5 4.5 4.5 4.5 4.5
Link Function Identity Identity Identity Identity Identity Identity
Family Gaussian Gaussian Gaussian Gaussian Gaussian Gaussian
Working Correlation Matrix Unstructured Unstructured Unstructured Unstructured Unstructured Unstructured
Wald Chi-Square 2243.67.*** 3577.04*** 2203.32*** 2690.37*** 5504.01*** 2275.95**
Scale Parameter .247 .725 .769 .201 .594 .758
Notes: All models include Community School District (CSD), borough, and year dummy variables (coefficients excluded from the table)
Logistic transformation of all dependent variables. All standard errors adjusted for clustering on the school identifier
+ indicates significance at p < .10, *at p < .05, ** at p < .01, ***at p < .005 (two-tailed tests of significance)

151
Table 6.2
Human Capital, Principal Succession, and Future Collective Turnover
(1)
b se
Principal succession 0.075* (0.04)
Human Capital Quality Measures
Teachers with master's plus 30 hours (%) -0.284 (0.18)
Teachers with less than 3years (%) 1.922*** (0.23)
Teachers out of certification (%) 0.492* (0.24)
School Characteristics
Total enrollment (per 10 students) -0.002*** (0.00)
Student to teacher ratio 0.096*** (0.01)
Intermediate school (comp. to elem.) 0.061 (0.05)
Middle school (comp. to elem.) -0.075 (0.06)
Client Characteristics
Student stability -0.306 (0.23) White (%) -0.630 (1.62)
Black (%) -0.389 (1.61)
Asian (%) -0.434 (1.57)
Hispanic (%) -0.465 (1.60)
Special education (%) 2.144*** (0.44)
English language learners (%) 0.200 (0.22)
Free or reduced lunch (%) -0.012 (0.16)
Suspensions (%) 1.597*** (0.40)
Attendance rate (%) -1.347 (0.85)
Performance ELA exam pass (%) -0.604* (0.25)
Math exam pass (%) -0.112 (0.23)
Parent satisfaction -0.053* (0.02)
Constant -0.669 (1.54)
Observations 4,557
Groups 1,016
Obs./ Group 4.5
Link Function Identity
Family Gaussian
Working Correlation Matrix Unstructured
Wald Chi-Square 1740.85***
Scale Parameter 0.787
Notes: All models include Community School District (CSD), borough, and year dummy variables
(coefficients excluded from the table)
Logistic transformation of dependent variable.
All standard errors adjusted for clustering on the school identifier
+ indicates significance at p < .10, *at p < .05, ** at p < .01, ***at p < .005 (two-tailed tests of significance)

152
Figure 6.1

153
Figure 6.2

154
Figure 6.3
155
CHAPTER 7
ANALYSIS OF PERSONNEL INSTABILITY, SOCIAL CLIMATE, AND MANAGEMENT
This chapter examines personnel instability’s relationships with an organization’s social
climate and internal management. As I discussed in Chapter 3, there is a body of literature that
suggests employee instability might have a deleterious effect on the integration of employees and
the establishment of meaningful, supportive workplace behaviors in organizations. The
disruption caused by personnel instability likely affects both the social climate as well as certain
managerial practices of an organization.
I begin by briefly discussing the data and measures I use to analyze personnel
instability’s relationships with an organization’s internal social climate and management. A
more complete discussion of the creation of the variables, as well as the weaknesses of the
measures, is available in Chapter 4. Second, I present models examining the relationships
between personnel instability and social climate, as well as personnel instability and specific
management practices. I test all the hypotheses with two-tailed tests of statistical significance.
Third, I retest all the relationships with halo corrected measures of an organization’s internal
social climate and management. For each of the internal social climate and management
indicators, the halo corrected measure removes all of the common variation among all the items
used to construct the measures. Simply, the goal is to remove the general attitude, feeling, or
impression that might be driving the variation in all the measures. Finally, I conclude with a
discussion of the findings and the main conclusions from the analyses.

156
Variables and Models
The two dimensions of personnel instability that I examine in these are: 1) principal
succession; and 2) collective teacher turnover. These variables serve as the key explanatory
variables of interest in the models I test.
I explore a number of dependent variables in this chapter. All of the social climate and
management indicators are constructed from school-level aggregated teacher responses to survey
items (discussed in detail in Chapter 4). In the dataset, each item’s value is the average of all the
teacher responses in the designated school. I create a two- item summative index to serve as an
indicator of coworker respect, and I use single-item indicators of coworker trust, coworker
support, and managerial support. To simplify the interpretation of the results, I standardize the
values of each of the measures. Descriptive statistics of the social climate indicators are reported
in Table 7.1.
I construct several indicators of a school’s management using factor scores created from
the average teacher response to each survey item at a school. In Chapter 4, I discussed the
creation of measures of participative management, managerial feedback, client oriented
management, credible commitment, and goal oriented management in New York City schools
drawing on Favero et al.’s (2012) conceptual groupings of aggregated teacher responses to
survey items. Table 7.1 includes the descriptive statistics of these variables. As with the social
climate indicators, all the management measures are measured in standard deviation units.
Student characteristics are controlled for with the following variables: student stability,
White (%), Black (%), Asian (%), Hispanic (%), special education (%), English language
learners (%), students receiving free or reduced lunch (%), students receiving suspension (%),
and the annual attendance rate. To capture the internal school characteristics, I include

157
teachers with master’s plus 30 hours (%), teachers with less than three years’ experience (%),
teachers out of certification (%), total enrollment, student to teacher ratio, and status as either a
middle school or intermediate school. To capture the environmental and geographic contexts in
which the school is located, I include two sets of dummy variables to control for the community
school district (CSD dummies) and the borough (borough dummies). Additionally, I include year
dummies to control for differences in exam pass rates on a year-to-year basis. Although I will
not report the coefficients of the CSD dummy, borough dummy, or year dummy variables, I will
discuss their significance as groups as appropriate.
Also, one might argue that an organization’s social climate is facilitated by good
performance and that good performance will facilitate social cohesion and possibly reduce
conflict among coworkers as well as reduce tension between management and frontline
employees. Thus, I include ELA exam pass rate, Math exam pass rate, and parent satisfaction in
the models.
I use five years of data from the 2006-07, 2007-08, 2008-09, 2009-10, 2010-11 school
years. A managerial succession indicated by a new principal in the fall is matched to measures
of social climate and management constructed from aggregated survey responses collected the
following spring. Likewise, collective teacher turnover occurring between January 2007 and
December 2007 is matched to measures of social climate and management constructed from
aggregated survey responses collected in spring of 2008. As a consequence, all measures of
personnel instability precede temporally the perceptual measures of social climate and
management.
I use the same GEE modeling strategy used in the previous two chapters of the
dissertation. The coefficient estimates are the population average effect of a one unit change in

158
the dependent variable. The GEE models allow me to control for unobserved and unmeasured
school-level effects that could otherwise drive spurious results. The adjusted correlation
matrices used to correct the estimated coefficients in the GEE models are reported in Appendix
3. I estimate robust standard errors clustered by unit (schools) and discuss the significant
coefficients resulting from two-tailed tests of statistical significance.
Personnel Instability and Social Climate
Table 7.2 presents the relationships between personnel instability and organizational
social climate. The Wald Chi-square test statistics demonstrate an acceptable level of fit across
the four models.
Personnel Instability and Coworker Trust
In Model 1, collective teacher turnover is not significantly related to coworker trust.
Thus, I find no support for Hypothesis 9a (see Table 3.1). Interestingly, the other dimension of
personnel instability, principal succession, is marginally significant (p < .10). The beta
coefficient indicates that principal succession will have a population average effect of a .065
standard deviation decrease in the indicator for coworker trust. While I did not hypothesize on
the nature of this relationship, the finding suggests that a change in manager might deteriorate
the social relationships among coworkers in the organization.
Control variables with significant negative relationships with coworker trust include total
enrollment, English language learners (%), and students receiving suspensions (%). Variables
positively related to coworker trust include status as a middle school, ELA exam pass rates,
parent satisfaction, and student to teacher ratio. With respect to the dummy variables not shown
in the table, the borough dummy variables were not jointly significant in the model. The CSD

159
dummy (χ2
= 45.33; p < .05) and the year dummy variables (χ2
= 188.97; p < .01) were each
jointly significant as a group.
Personnel Instability and Coworker Respect
In Model 2 of Table 7.2, I test whether collective teacher turnover is negatively related to
employee perceptions of coworker respect. The findings suggest that collective employee
turnover is not related to change in employee perceptions of respect and, thus, I have no support
for Hypothesis 9b. A number of controls, however, do have statistically significant relationships
with coworker respect. Teachers w/less than three years’ exp. (%), student to teacher ratio,
status as a middle school, ELA exam pass rate, and parent satisfaction are positively related to
coworker respect. Total enrollment, English language learners (%), and students receiving
suspensions (%) were each negatively related to coworker respect. Neither the CSD dummy
variables nor the borough dummy variables are jointly significant in Model 2. The year dummy
variables, however, were jointly significant (χ2
= 240.08; p < .01).
Personnel Instability and Coworker Support
In Model 3 of Table 7.2, I examine the relationship between collective teacher turnover
and coworker support, but I find no relationship and, therefore, no evidence to support
Hypothesis 9c. Interestingly, the findings suggest that principal succession will shift the
coworker support measure by -.079 standard deviations. Other variables negatively related to
this indicator of an organization’s social climate are total enrollment, English language learners
(%), and student’s receiving suspension (%). Controls negatively related are student to teacher
ratio, parent satisfaction, and ELA exam pass rate. Also jointly significant in the model are the
CSD dummy (χ2
= 42.33; p <.01) and year dummy (χ2
= 215.68; p < .01) variables. The borough
dummies were not significant as a group.

160
Personnel Instability and Managerial Support
In Model 4 of Table 7.2, I examine the effects of personnel instability on employee
perceptions of managerial support. In this model principal succession does not have a
statistically significant effect on managerial support. Thus, I have no support for Hypothesis 10.
Among the controls, status as a middle school, attendance rates, students receiving free or
reduced lunch (%), ELA exam pass rates, and parent satisfaction were positively and
significantly related to perceptions of managerial support. The total enrollment of the school is
negatively related to perceptions of manager support. With respect to the dummy variables,
only the year dummy variables were jointly significant as a group (χ2
= 59.03; p < .01).
The findings in Table 7.2 provide no support for the relationships hypothesized in
Chapter 4. Upon reflection, however, these null findings suggest the need for future research. It
is possible that the effect of personnel instability on the social climate is contingent on past
performance—or other environmental and institutional factors. I will discuss this in more detail
in Chapter 8. Despite the non-findings, an interesting relationship emerges with respect to
principal succession and employee perceptions of coworker trust and coworker support. It
appears that a change in manager can disrupt the social environment among front-line workers.
Personnel Instability and Management
Table 7.3 provides the results of the models testing personnel instability’s effects on an
organization’s management. The Wald chi-square test statistic demonstrates that each of the five
models has an acceptable level of fit.
Personnel Instability and Client Oriented Management
In Model 1 of Table 7.3, I find only marginal support (p < .10) for Hypothesis 11a and a
negative relationship between managerial succession and client oriented management. The

161
coefficient indicates that a principal succession will decrease the client oriented management
measure approximately .054 standard deviations. Collective teacher turnover has no relationship
with client oriented management and, therefore, I find no support for Hypothesis 11b and a
negative relationship between collective teacher turnover and client oriented management.
Several control variables have significant relationships with the measure of school’s
client oriented management. Total enrollment and student suspensions (%) are negatively
related to client oriented management. Attendance rate, status as a middle school, ELA exam
pass rate, and parent satisfaction are each positively related to client orientated management.
Among the groups of dummy variables included in the model, only the year dummy variables are
statistically significant (χ2
=313.57; p < .01).
Personnel Instability and Managerial Feedback
In Model 2 of Table 7.3, I examine the relationship between personnel instability and
employee perceptions of managerial feedback. However, I find no relationship between
principal succession and managerial feedback, and no evidence to support Hypothesis 12 and a
positive relationship between managerial succession and employee perceptions of feedback from
management. Several control variables were, however, significant. Status as a middle school,
White (%), free or reduced lunch, ELA exam pass rate, and parent satisfaction are each
positively related to managerial feedback. In this model the CSD dummy variables (χ2
= 62.38;
p < .01), borough dummy (χ2
= 15.59; p < .01), and year dummy variables (χ2
= 79.84; p < .01)
are each jointly significant as a group.
Personnel Instability and Goal Oriented Management
In Model 3 of Table 7.3, I examine the relationship between principal succession and
goal oriented management. Given theoretical reasons to expect a positive or a negative

162
relationship among the variables (discussed in Chapter 3), I test an associational hypothesis on
the relationship among managerial succession and goal oriented management. However, I found
no evidence of a relationship between principal succession and goal oriented management and,
therefore, no evidence in support of Hypothesis 13. Among the control variables, teachers out of
certification (%), total enrollment, and students receiving suspensions (%) are each negatively
related to employee perceptions of goal oriented management. The attendance rate, ELA exam
pass rate, and parent satisfaction each have a significant and positive relationship with goal
oriented management. The CSD dummy (χ2
= 41.01; p <.05) and the year dummy (χ2
= 184.32; p
< .01) variables were each jointly significant as a group.
Personnel Instability and Credible Commitment
In Model 4 of Table 7.3, I test the relationship between principal succession and a
manager’s credible commitment to the organization. Given theoretical reasons to expect a
positive or a negative relationship between managerial succession and credible commitment (see
Chapter 3), I examine an associational hypothesis among the variables. In the model, however, I
find no evidence of an associational relationship among principal succession and credible
commitment, and no support for Hypothesis 14. Among variables in the model that are
significant, attendance rate, students receiving free or reduced lunch (%), status as a middle
school, ELA exam pass rate, and parent satisfaction are each positively related to the measure of
credible commitment. The borough dummy (χ2 = 10.26; p < .05) and the year dummy (χ
2 =
66.00; p < .01) variables are each jointly significant as a group.
Personnel Instability and Participative Management
In Model 5 of Table 7.3, I examine the relationship between personnel instability and
participative management. Neither principal succession nor collective teacher turnover has a

163
significant relationship with participative management. As a consequence, I have no evidence to
support Hypothesis 15a or Hypothesis 15b. Status as a middle school, ELA exam pass rate, and
parent satisfaction are each positively related to participative management in the school. The
borough dummy (χ2 = 8.51; p <.10) and the year dummy (χ
2 = 62.96; p <.01) variables are each
jointly significant as a group in the model.
As the models show, neither collective teacher turnover nor principal succession is
related to a collaborative decision making, managerial feedback, credible commitment and goal
oriented management in New York City schools as I hypothesized in Chapter 3.42
While this
lack of support for the relationships is certainly not what I had anticipated, there are a number of
possible explanations for these null findings, as well as opportunities for future research beyond
this dissertation, that I will discuss at length in Chapter 8.
Halo Correction
One could reasonably argue that the findings above are a function of a positive or
negative impression of teachers towards their school—not the constructs I attempted to identify.
To correct for this problem, I will remove all of the common variation among the items from the
measures of social climate and management. To test whether the relationships observed are
driven by general impression of the teachers towards the management and social climate of their
school—or a halo effect—I next remove the common variation from all the conceptual
measures.
42
I performed a number of alternative specifications of the models presented in Table 7.2 and Table 7.3, but none
led to noteworthy differences from the models presented. First, I logged collective employee turnover to correct for
the right skew in the distribution. This made no difference in the model. Second, I ran models examining a possible
nonlinear relationship between collective employee turnover and the measures of social climate and management,
but the results were not significant. Third, I considered the possibility that the model is overspecified, and that by
including the objective measures of performance as controls I created too high of a threshold with respect to
identifying relationships among the measures of personnel instability and measures of social climate and
management. However, even when I removed the measures of performance, the findings were parallel to those
presented above.
164
One limitation of this technique is that there is no way of determining what percentage of
the common variation among items is the actual common variation—or variation driven by the
teachers’ overall impressions of a school (halo effect). In the context of the null findings I just
presented, the presence of a halo effect unrelated to personnel instability might have created
noise in the models that prevented me from identifying relationships among the variables of
interest. Since I cannot isolate the halo effect (the teachers’ general attitudes toward the social
climate and management) from the actual shared variation among the survey items, I must
overcorrect—purging the measures of all the shared variation among the items used to construct
them. There is no way to remove only the halo effect. One problem with this technique is that I
almost certainly remove too much variation from the social climate and management measures.
Estimating the Halo Effect
I factor analyze all the individual items used to construct my measures of social climate
and management. The results are found in Table 7.4.43
Table 7.4 shows that the items share a
significant proportion of their variation with a common factor. I extract the factor using the
maximum likelihood generation of Bartlett scores for each school. The predicted Barlett score is
the measure of the general impression of management and social climate—or the halo effect—
for each school.
Personnel Instability and the Halo Effect
I begin by examining whether principal succession and collective employee turnover are
systematically related to teachers’ overall impressions of management and social climate, or the
halo effect. The results of this analysis are presented in Table 7.5. Model 1 in Table 7.5
43
Alternatively, I could have chosen to include all of the survey items, following Favero et al.’s (2012) correction.
However, by focusing on the common variation found only in the items used, I remove more variation than what I
would expect by removing the variation common to all teacher responses to the NYC-DOE School Environment
survey.

165
indicates that principal succession and collective teacher turnover are not systematically related
to a teacher’s general attitude, or halo effect, toward the school.44
Control variables positively
related to the halo effect include students receiving free or reduced lunch (%), attendance rate,
ELA exam pass rates, and parent satisfaction scores. Variables with significant negative
relationships include the total enrollment of the school and students receiving suspensions (%).
As groups, the borough dummy (χ2 = 8.44; p < .10) and year dummy (χ
2 = 123.05; p < .01)
variables were each jointly significant as groups.
The non-finding between the measures of personnel instability and the halo effect
warrants a brief discussion because it has implications for the analyses that follow. The non-
finding indicates that neither collective teacher turnover nor principal succession has a
significant relationship with this general attitude toward the organization’s management and
social climate. With respect to the measurement of the individual indicators of social climate
and management, the findings above and the absence of a relationship between personnel
instability and the general attitude above might be the consequence of the presence of a halo
effect that is not systematically related to the two independent variables of interest. In other
words, the presence of the halo effect might have created noise in the models that hindered my
ability to identify relationships between personnel instability and the measures of social climate
and management.
Before estimating the models again, I remove the variation of each indicator that is
explained by the general measure of social climate and management—the halo effect—from each
measure. To remove the halo effect, I regress each measure for social climate and each measure
of management on the halo effect measure. I then predict the residuals following each
44
Interestingly, secondary analyses not presented show that the halo effect (general impression of social climate and
management) is, in fact, positively and significantly related to collective employee turnover in the future. No
relationship exists between the halo effect and the likelihood of future principal succession.
166
regression. The residual is the variance in Y not explained by X. The residual of each individual
regression provides a measure of social climate or management purged of halo effect. Thus, the
variation common to all the items used in the measures is now removed from each individual
measure. Table 7.6 provides the results of the individual regression models used to create
individual measures without the halo effect. In Table 7.6, the r-squared values of each regression
shows that, in most cases, the halo effect explains a significant proportion of the variation of each
measure of social climate and management.
In order to further probe the relationship between personnel instability and organizational
social climate and management, I use the halo adjusted measures as the dependent variables and
re-estimate the models found in Table 7.2 and Table 7.3.
Social Climate Indicators with the Halo Correction
In Table 7.7 I present models with the social climate indicators purged of the halo effect.
Based on the Wald chi-square test statistics, all of the models demonstrate an acceptable level of
fit.
Personnel Instability and Coworker Trust (Halo Corrected)
In Model 1 of Table 7.7, I test the relationship between personnel instability and
coworker trust. The findings are consistent with the previous models I presented. Collective
teacher turnover has no relationship with coworker trust (halo corrected) and, thus, I have no
evidence to support Hypothesis 9a. Principal succession, however, has a significant, negative
relationship with coworker trust. A principal succession is followed by a decrease in coworker
trust (halo corrected) of approximately .073 standard deviations (p < .05). Among the control
variables, teachers w/less than three years exp. (%) is positively related to coworker trust, while
English language learners (%), special education (%), students receiving suspensions (%), and

167
attendance rate were negatively related to coworker trust. A test of joint significance shows that
the CSD dummy (χ2 = 75.91; p < .01), borough dummy (χ
2 = 7.95; p < .10), and year dummy (χ
2 =
91.84; p < .01) variables are each statistically significant as groups.
Personnel Instability and Coworker Respect (Halo Corrected)
In Model 2 of Table 7, I test the relationship between collective teacher turnover and
perceptions of coworker respect (halo corrected), but find no relationship. Once again, there is
no evidence to support Hypothesis 9b. Principal succession also has no relationship with the
halo corrected dependent variable. The control variables positively related to coworker respect
(halo corrected) include teachers w/less than 3 years exp. (%), status as a middle school, ELA
exam pass rates and parent satisfaction. As groups, the CSD dummy (χ2 = 54.34; p < .01),
borough dummy (χ2 = 14.07; p < .01) and year dummy (χ
2 = 135.58; p < .01) variables are each
jointly significant as a group.
Personnel Instability and Coworker Support (Halo Corrected)
In Model 3 of Table 7.7, I test the relationship among collective teacher turnover and
perceptions of coworker support (halo corrected), but I find no relationship and no evidence in
support of hypothesis 9c. Interestingly, principal succession is negatively related to coworker
support (halo corrected). According to the model, principal succession will reduce the coworker
support (halo corrected) measure by .088 standard deviations. In the model, teachers w/less
than 3 years exp. (%), student to teacher ratio, and parent satisfaction were all positively related
to coworker support (halo corrected). Total enrollment, status as a middle school, English
language learners (%), and attendance rate are all negatively related to the measure of coworker
support. The CSD dummy (56.76; p < .01), borough dummy (12.09; p < .05) and the year dummy
(131.77; p < .01) variables are each jointly significant as groups.

168
Personnel Instability and Managerial Support (Halo Corrected)
In Model 4 of Table 7.7, I find no evidence that principal succession has a negative effect
on employee perceptions of managerial support (halo corrected) and, thus, no support for
Hypothesis 10. In the model, teachers w/less than 3 years exp. (%) and parent satisfaction are
both negatively related to the measure of manager support (halo corrected). Status as a middle
school and status as an intermediate school were each positively related to employee perceptions
of managerial support (halo corrected). Of the groups of dummy variables included, only the
year dummy variables (χ2 = 52.60; p < .01) were significant as a group.
While I find no evidence supporting Hypotheses 9a, 9b, 9c, 10, I do find additional
support for a negative relationship between principal succession and employee perceptions of
both coworker trust and coworker support. While the finding was not hypothesized, it is
important because it provides additional evidence that managerial succession and change can
destabilize the social relationships among frontline employees in public organizations.
Management Indicators with the Halo Correction
In Table 7.8 I report the results of my examination of the relationships among personnel
instability and the halo corrected measures of management. According the Wald chi-square test
statistics, each of the models demonstrates an acceptable level of fit.
Personnel Instability and Client Oriented Management (Halo Corrected)
In Model 1 of Table 7.8, I find additional support for Hypothesis 11a and a negative
relationship between principal succession and client oriented management (halo corrected). The
finding suggests that principal succession will decrease the client oriented management (halo
corrected) measure by .056 standard deviations (p < .01). Based on this evidence, it appears that
following a succession the new managers pay less attention to the clients and the relationships

169
with those that they serve. This is potentially due to managers focusing their limited attention to
learning the internal routines, processes, procedures, as well as establishing meaningful working
relationships with their new employees. With respect to Hypothesis 11b, there is no evidence
supporting a relationship between collective teacher turnover and client oriented management.
Among the controls, the total enrollment, status as a middle or intermediate school, Hispanic
(%), students receiving free or reduced lunch (%), and Math exam pass rate are all negatively
related to the halo corrected measure of externally oriented management. Teachers out of
certification (%), student to teacher ratio, attendance rate, and ELA exam pass rates are each
positively related to the halo corrected measure of client oriented management. Only the year
dummy variables were statistically significant as a group (χ2
= 313.57; p < .01).
Personnel Instability and Managerial Feedback (Halo Corrected)
In Model 2 of Table 7.8, I examine the relationship among personnel instability and
managerial feedback (halo corrected). However, I found no evidence of a positive relationship
between managerial succession and the dependent variable and, thus, no support for Hypothesis
12. There is, however, evidence of a positive relationship between collective teacher turnover
and managerial feedback (halo corrected) (β = .181; p < .01). While I failed to consider this
relationship in Chapter 3, there is some intuition behind this finding. In high turnover
organizations, I expect there will be larger numbers of new employees. It is likely that managers
have to provide more instructions, direction, and feedback with respect to performance. As a
consequence, employees perceive higher levels of managerial feedback. Among the control
variables in the model, teachers with a master plus 30 hours (%), White (%), Black (%),
Hispanic (%), and free and reduced lunch (%) are each positively related to employee
perceptions of managerial feedback (halo corrected). The students receiving suspensions (%)
170
and status as a middle school are both negatively related to managerial feedback (halo
corrected). The CSD dummy (χ2
= 62.38; p < .01), borough dummy (χ2 = 15.59; p < .05), and
year dummy (χ2 = 79.84; p < .00) are each jointly significant as groups.
Personnel Instability and Goal Oriented Management (Halo Corrected)
In Table 7.8, Model 7.3 examines the relationship between personnel instability and goal
oriented management (halo corrected). There is no support for Hypothesis 13—a relationship,
either positive or negative, between principal succession and the dependent variable. Among the
controls, total enrollment, students receiving suspensions (%), and status as a middle school are
negatively related to the dependent variable, while the attendance rate has a positive
relationship. The CSD dummy (χ2
= 41.01; p < .05) and the year dummy (χ2 = 184.32; p < .01)
variables are each jointly significant as groups.
Personnel Instability and Credible Commitment (Halo Corrected)
In Table 7.8, Model 7.4 examines the relationship between personnel instability and
credible commitment (halo corrected). Hypothesis 14 is a non-directional, associational
relationship between principal succession and the dependent variable. The model provides
evidence that employee perceptions of a manager’s credible commitment to the organization
increases following a managerial succession and, thus, provides support for Hypothesis 14.
Following a principal succession, credible commitment (halo corrected) will increase .039
standard deviations (p < .05). Among the control variables, English language learners (%),
students receiving free lunch (%), students receiving suspensions (%), math exam pass rate and
status as either an intermediate or middle school are each positively related to credible
commitment (halo corrected). Teachers w/less than three years exp. (%), student to teacher
ratio, student stability are each negatively related to credible commitment (halo corrected). The

171
borough dummy (χ2 = 10.26; p < .05) and the year dummy (χ
2 = 66.00; p <.01) variables are each
jointly significant as a group.
Personnel Instability and Participative Public Management (Halo Corrected)
Model 5 in Table 7.8 examines the relationship between personnel instability and a halo
corrected measure of participative management. In the model, I find evidence that a principal
succession is followed by a .045 standard deviation increase in participative management (halo
corrected) (p < .01). The evidence suggests that new managers are more likely to encourage
participation among the employees, and contradicts my Hypothesis H15a. Interestingly,
however, I find that collective teacher turnover is, in fact, negatively related to participative
management (halo corrected) and, thus, I have evidence supporting Hypothesis 15b. Among
the control variables in the model, teachers with a master’s plus 30 (%), White (%), Black (%),
Asian (%), Hispanic (%), attendance rate, and math exam pass rate are all negatively related to
participative management (halo corrected). Teachers w/ less than 3 years exp. (%) and status as
a middle school are both positively related to the dependent variable in the model. Finally, both
the year dummy (χ2
= 62.96, p < .01) and borough dummy (χ2
= 8.51; p < .10) variables are each
jointly significant as a group.
Chapter Summary
My initial models in Table 7.2 and Table 7.3 provide little evidence of any relationships
among personnel instability and the measures of organizational social climate and management.
However, when I remove the common variation—or the halo effect—found in the individual
items used to create my measures of an organization’s social climate and management,
interesting and significant findings emerged (see Table 7.7 and Table 7.8). However, the halo
172
corrected measures might remove too much variation from the measures and, therefore, should
be interpreted very cautiously.
While I have found no evidence that collective employee turnover has a deleterious effect
on the social climate and no support for Hypotheses 9a, 9b, or 9c, principal succession emerged
as being significantly related to coworker trust and coworker support in the models I estimated
both before and after the halo correction. Interestingly, however, principal succession was not
related to employee perceptions of managerial support and, thus, I have found no evidence to
support Hypothesis 10.
To test Hypotheses 11a and 11b, I have examined both principal succession’s and
collective employee turnover’s effects on client oriented management. While principal
succession was marginally significant in models estimated prior to the halo correction, the
variable became highly significant after the halo correction. Thus, I have some general support
for Hypothesis 11a. It appears that new managers are less focused on their relationships with
organization’s clients in the period following their entrance into the organization—perhaps as a
consequence of learning the systems, routines, processes, and personnel they are now in charge
of leading. Interestingly, no findings have emerged in any of the analyses in support of
Hypothesis 11b and a relationship between collective employee turnover and client oriented
management.
In the models I have presented in Table 7.3 and 7.8, I have found no support for
Hypothesis 12 and a negative relationship between principal succession and employee
perceptions of managerial feedback. In Table 7.8, however, following the halo correction, I did
find preliminary evidence of a positive relationship between collective employee turnover and
perceptions of managerial feedback. While I did not hypothesize on the nature of this
173
relationship, the finding provides some evidence that managers provide more feedback in
organizations where there are higher levels of turnover. This makes sense as managers in these
organizations likely need to provide more direct supervision and feedback to new members of
the organization.
I have found no evidence to support Hypothesis 13 and a relationship between
managerial succession and goal oriented management. Table 7.8, however, provided preliminary
evidence of a positive relationship between managerial succession and employee’s perceptions
of a manager’s credible commitment to the organization. This makes sense, since we might
expect new managers to clearly lay out their own vision for the organization and the means by
which he or she will achieve the organization’s goals. Despite the limitations of the halo
corrected models, the finding does lend some support to Hypothesis 14.
Finally, following the halo correction in Table 7.8, I found evidence contradicting my
original Hypothesis 15a which stated that a managerial succession would lead to lower levels of
participative management in an organization. In fact the halo corrected models suggest that
following a managerial succession, participative management actually increases. In hindsight,
this relationship does make some sense. New managers might try to achieve buy-in to their new
vision for the organization by encouraging employee participation. Table 7.8 has provided
support for Hypothesis 15b, and a negative relationship between collective employee turnover
and participative management. The finding cautiously supports the notion that participative
management is undermined my frequent changes in personnel, possibly leading managers to be
less willing to include new employees they don’t know or trust in participatory decision making.
I discuss the limitations to these analyses Chapter 8. While there are certainly limitations due to
my use of aggregated measures, my use of conceptual groupings to construct measures, and the
174
reliance on secondary data, this inquiry represented the first quantitative inquiry into the effect of
personnel instability on the social climate and management of public organizations and is an
important step forward for research on the organizational consequences of turnover.

175
Table 7.1
Descriptive Statistics of the Social Climate and Management Indicators
Variable Obs. Mean Std. Dev. Min Max
Social Climate Indicators
Coworker Trust 4,550 0.00 1.00 -3.44 2.61
Coworker Respect 4,550 0.00 1.00 -5.18 2.57
Coworker Support 4,550 0.00 1.00 -4.76 2.25
Managerial Support 4,550 0.00 1.00 -4.42 1.74
Management Indicators
Client Oriented Management 4,549 0.00 1.00 -3.91 2.76
Managerial Feedback 4,545 0.01 0.97 -5.42 2.33
Goal Oriented Management 4,545 0.04 0.97 -4.72 2.17
Credible Commitment 4,545 0.00 0.98 -4.11 2.01
Participative Management 4,550 -0.01 0.98 -4.00 2.06

176
Table 7.2
Personnel Instability and Organizational Social Climate
(1) (2) (3) (4)
Dependent Variable Coworker Trust Coworker Respect Coworker Support Managerial Support
b se b se b se b se
Personnel Instability
Collective Teacher Turnover -0.069 (0.14) -0.153 (0.14) 0.023 (0.16) 0.060 (0.15)
Principal Succession -0.065+ (0.03) -0.059 (0.04) -0.079* (0.04) 0.040 (0.05)
School Characteristics
Teachers with Master's plus (%) -0.213 (0.16) -0.101 (0.16) -0.178 (0.16) -0.007 (0.18) Teachers with Less than 3years (%) 0.489** (0.18) 0.785*** (0.19) 0.449* (0.20) -0.185 (0.20)
Teachers out of certification (%) -0.078 (0.21) -0.065 (0.21) -0.214 (0.25) -0.202 (0.24)
Total Enrollment (Per 10 Students) -0.005*** (0.00) -0.004*** (0.00) -0.003*** (0.00) -0.002+ (0.00) Student to Teacher Ratio 0.014 (0.01) 0.023* (0.01) 0.019+ (0.01) 0.001 (0.01)
Intermediate School (Comp. to Elem.) -0.001 (0.06) 0.016 (0.06) -0.004 (0.07) 0.067 (0.07)
Middle School (Comp to Elem.) 0.230*** (0.06) 0.303*** (0.06) 0.081 (0.07) 0.391*** (0.07)
Client Characteristics
Student Stability 0.002 (0.12) -0.059 (0.12) -0.052 (0.13) -0.098 (0.15)
White (%) -0.072 (0.98) 0.367 (0.96) 0.149 (1.09) 1.068 (1.09) Black (%) -0.801 (0.95) -0.285 (0.93) -0.400 (1.08) 0.509 (1.08)
Asian (%) -0.301 (0.94) 0.062 (0.93) 0.133 (1.08) 0.785 (1.06) Hispanic (%) -0.392 (0.96) -0.155 (0.94) 0.049 (1.09) 0.566 (1.07)
Special Education (%) -0.664 (0.41) -0.261 (0.42) -0.222 (0.43) 0.540 (0.47)
English Language Learners (%) -0.984*** (0.28) -0.845*** (0.27) -0.930*** (0.27) -0.519 (0.33) Free or Reduced Lunch (%) 0.179 (0.17) 0.177 (0.17) 0.029 (0.18) 0.381* (0.19)
Suspensions (%) -1.037** (0.39) -1.067** (0.39) -0.777+ (0.45) -0.468 (0.43)
Attendance Rate (%) -0.104 (1.07) -0.410 (1.02) -0.348 (1.10) 2.212+ (1.30)
Performance
ELA Exam Pass (%) 0.750*** (0.20) 0.590*** (0.21) 0.716*** (0.23) 0.730*** (0.22)
Math Exam Pass (%) -0.087 (0.17) 0.085 (0.16) -0.112 (0.18) 0.077 (0.18) Parent Satisfaction 0.197*** (0.02) 0.219*** (0.02) 0.228*** (0.02) 0.236*** (0.03)
Constant 0.712 (1.42) 0.411 (1.34) 0.520 (1.49) -3.292* (1.65)
Observations 4,549 4,549 4,549 4,549
Groups 1,016 1,016 1,016 1,016 Observ/ Group 4.5 4.5 4.5 4.5
Link Function Identity Identity Identity Identity
Family Gaussian Gaussian Gaussian Gaussian Working Correlation Matrix Unstructured Unstructured Unstructured Unstructured
Wald Chi-Square 1,510.19*** 1,626.61*** 1,385.57*** 715.94***
Scale Parameter .676 .678 0.700 0.802
Notes: All models include Community School District (CSD), borough, and year dummy variables (coefficients excluded from the table)
All standard errors adjusted for clustering on the school identifier
+ indicates significance at p<0.1, * at p<.05, ** at p<.01, ***at p<.005 (two-tailed tests of significance)

177
Table 7.3
Personnel Instability and Management
(1) (2) (3) (4) (5)
Dependent Variable Client Oriented
Management
Managerial
Feedback.
Goal Oriented
Management
Credible
Commitment
Participative
Management
b se b se b se b se b se
Personnel Instability
Principal Succession -0.054+ (0.03) -0.002 (0.04) -0.026 (0.03) 0.051 (0.05) 0.056 (0.05)
Collective Teacher Turnover -0.015 (0.12) 0.133 (0.15) -0.082 (0.14) 0.029 (0.14) -0.125 (0.14)
School Characteristics
Teachers with Master's plus (%) 0.035 (0.14) 0.130 (0.18) 0.077 (0.15) -0.038 (0.18) -0.204 (0.18)
Teachers with Less than 3years (%) -0.017 (0.15) -0.107 (0.20) -0.074 (0.17) -0.183 (0.19) 0.173 (0.19)
Teachers out of certification (%) 0.068 (0.19) -0.277 (0.23) -0.352+ (0.19) -0.191 (0.22) -0.139 (0.21)
Total Enrollment (Per 10 Students) -0.002*** (0.00) -0.001 (0.00) -0.003*** (0.00) -0.001 (0.00) -0.002* (0.00)
Student to Teacher Ratio 0.013 (0.01) 0.004 (0.01) 0.001 (0.01) -0.002 (0.01) 0.010 (0.01)
Intermed. School (Comp. to Elem.) -0.030 (0.06) -0.024 (0.06) -0.039 (0.05) 0.048 (0.07) 0.046 (0.06)
Middle School (Comp to Elem.) 0.141* (0.06) 0.197*** (0.07) 0.084 (0.06) 0.339*** (0.07) 0.339*** (0.07)
Client Characteristics
Student Stability -0.104 (0.13) -0.014 (0.14) -0.140 (0.12) -0.024 (0.15) 0.022 (0.15)
White (%) 0.903 (0.83) 1.763+ (1.02) 1.177 (0.82) 1.173 (1.04) 0.573 (0.93)
Black (%) -0.126 (0.83) 1.235 (1.02) 0.358 (0.82) 0.629 (1.04) -0.063 (0.98)
Asian (%) 0.209 (0.83) 1.433 (1.01) 0.820 (0.82) 0.825 (1.02) 0.243 (0.96)
Hispanic (%) -0.122 (0.83) 1.150 (1.01) 0.519 (0.83) 0.646 (1.03) -0.144 (0.97)
Special Education (%) 0.332 (0.38) 0.540 (0.46) 0.225 (0.39) 0.426 (0.45) 0.612 (0.46)
English Language Learners (%) -0.340 (0.26) -0.302 (0.31) -0.387 (0.25) -0.360 (0.33) -0.452 (0.31)
Free or Reduced Lunch (%) -0.068 (0.14) 0.508** (0.19) 0.240 (0.15) 0.469** (0.18) 0.304+ (0.18)
Suspensions (%) -0.827* (0.38) -1.096** (0.42) -1.093** (0.39) -0.433 (0.41) -0.516 (0.40)
Attendance Rate (%) 3.165*** (0.98) 1.599 (1.26) 4.020*** (1.02) 2.402* (1.17) 1.494 (1.25)
Measures of Performance
ELA Exam Pass (%) 0.958*** (0.18) 0.884*** (0.21) 1.045*** (0.19) 0.807*** (0.21) 0.906*** (0.21)
Math Exam Pass (%) -0.188 (0.15) -0.032 (0.17) 0.177 (0.15) 0.162 (0.17) -0.145 (0.18)
Parent Satisfaction 0.264*** (0.02) 0.280*** (0.02) 0.281 *** (0.02) 0.258*** (0.02) 0.259*** (0.02)
Constant -3.046* (1.22) -3.656* (1.52) -4.645*** (1.21) -3.752* (1.50) -1.924 (1.51)
Observations 4,548 4,544 4,544 4,544 4,549
Groups 1,016 1,016 1,016 1,016 1,016
Obs. / Group 4.5 4.5 4.5 4.5 4.5
Link Function Identity Identity Identity Identity Identity
Family Gaussian Gaussian Gaussian Gaussian Gaussian
Working Correlation Matrix Unstructured Unstructured Unstructured Unstructured Unstructured
Wald Chi-Square 2,567.80*** 830.25*** 2,681.72*** 845.95*** 843.94***
Scale Parameter 0.544 0.744 .520 .770 .762
Notes: All models include Community School District (CSD), borough, and year dummy variables (coefficients excluded from the table)
All standard errors adjusted for clustering on the school identifier
+ indicates significance at p < .10, *at p < .05, ** at p < .01, ***at p < .005 (two-tailed tests of significance)
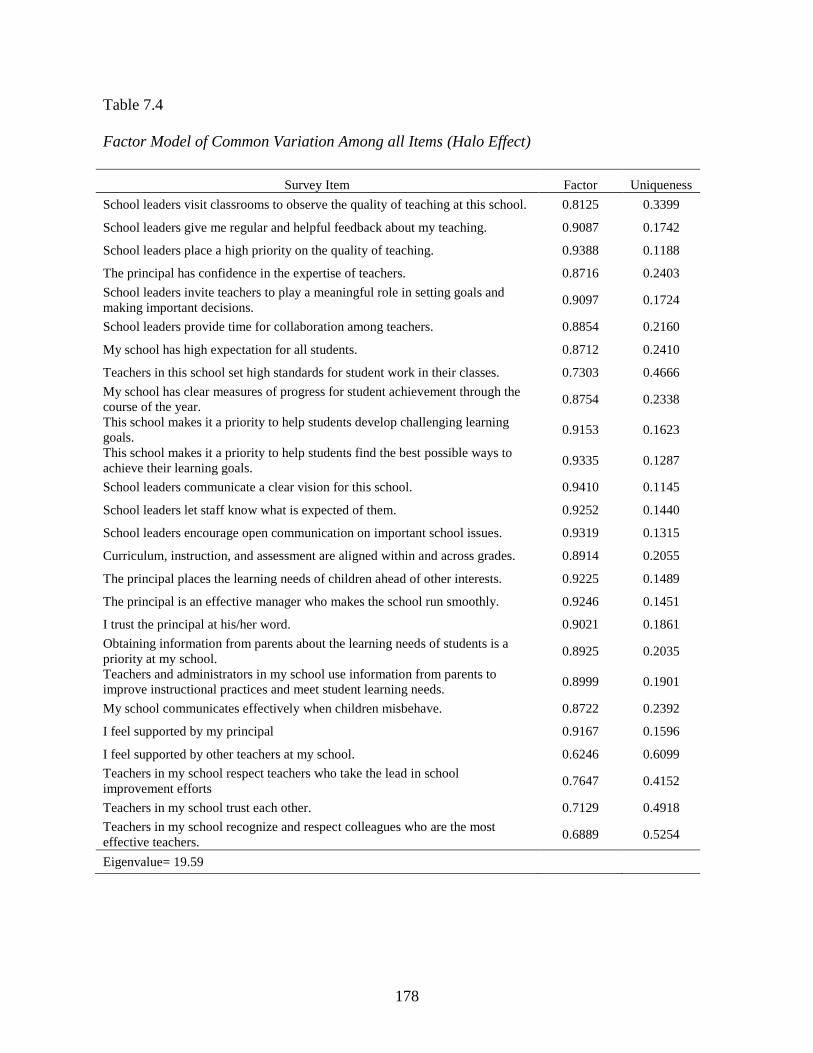
178
Table 7.4
Factor Model of Common Variation Among all Items (Halo Effect)
Survey Item Factor Uniqueness
School leaders visit classrooms to observe the quality of teaching at this school. 0.8125 0.3399
School leaders give me regular and helpful feedback about my teaching. 0.9087 0.1742
School leaders place a high priority on the quality of teaching. 0.9388 0.1188
The principal has confidence in the expertise of teachers. 0.8716 0.2403
School leaders invite teachers to play a meaningful role in setting goals and
making important decisions. 0.9097 0.1724
School leaders provide time for collaboration among teachers. 0.8854 0.2160
My school has high expectation for all students. 0.8712 0.2410
Teachers in this school set high standards for student work in their classes. 0.7303 0.4666
My school has clear measures of progress for student achievement through the
course of the year. 0.8754 0.2338
This school makes it a priority to help students develop challenging learning
goals. 0.9153 0.1623
This school makes it a priority to help students find the best possible ways to
achieve their learning goals. 0.9335 0.1287
School leaders communicate a clear vision for this school. 0.9410 0.1145
School leaders let staff know what is expected of them. 0.9252 0.1440
School leaders encourage open communication on important school issues. 0.9319 0.1315
Curriculum, instruction, and assessment are aligned within and across grades. 0.8914 0.2055
The principal places the learning needs of children ahead of other interests. 0.9225 0.1489
The principal is an effective manager who makes the school run smoothly. 0.9246 0.1451
I trust the principal at his/her word. 0.9021 0.1861
Obtaining information from parents about the learning needs of students is a
priority at my school. 0.8925 0.2035
Teachers and administrators in my school use information from parents to
improve instructional practices and meet student learning needs. 0.8999 0.1901
My school communicates effectively when children misbehave. 0.8722 0.2392
I feel supported by my principal 0.9167 0.1596
I feel supported by other teachers at my school. 0.6246 0.6099
Teachers in my school respect teachers who take the lead in school
improvement efforts 0.7647 0.4152
Teachers in my school trust each other. 0.7129 0.4918
Teachers in my school recognize and respect colleagues who are the most
effective teachers. 0.6889 0.5254
Eigenvalue= 19.59

179
Table 7.5
Regressions Estimates Used to Generate Halo Corrected Measures
b se t-value sig. r-square
Social Climate Coworker Trust 0.737 0.011 67.99 0.000 0.504
Coworker Respect 0.766 0.010 73.94 0.000 0.545
Coworker Support 0.640 0.012 52.86 0.000 0.381
Principal Support 0.959 0.006 165.68 0.000 0.858
Management Indicators
Client Oriented Management 0.945 0.006 149.65 0.000 0.831
Managerial Feedback 0.963 0.006 172.66 0.000 0.868
Goal Oriented Management 0.960 0.006 167.67 0.000 0.861
Credible Commitment 1.006 0.004 277.66 0.000 0.944
Participative Management 0.967 0.006 174.81 0.000 0.871

180
Table 7.6
Personnel Instability and General Satisfaction w/Management and Climate (Halo Effect)
(1)
b se
Personnel Instability
Principal Succession 0.007 (0.04)
Collective Teacher Turnover -0.023 (0.13)
School Characteristics
Teachers with Master's plus (%) -0.048 (0.16)
Teachers with Less than 3years (%) -0.016 (0.17)
Teachers out of certification (%) -0.209 (0.20)
Total Enrollment (Per 10 Students) -0.002** (0.00)
Student to Teacher Ratio 0.004 (0.01)
Intermediate School (Comp. to Elem.) 0.011 (0.06)
Middle School (Comp to Elem.) 0.261*** (0.06)
Client Characteristics
Student Stability -0.041 (0.13)
White (%) 1.272 (0.91)
Black (%) 0.591 (0.90)
Asian (%) 0.918 (0.89)
Hispanic (%) 0.637 (0.90)
Special Education (%) 0.365 (0.41)
English Language Learners (%) -0.427 (0.28)
Free or Reduced Lunch (%) 0.327* (0.16)
Suspensions (%) -0.715+ (0.38)
Attendance Rate (%) 2.538* (1.09)
School Performance
ELA Exam Pass (%) 0.891*** (0.19)
Math Exam Pass (%) 0.083 (0.16)
Parent Satisfaction 0.270*** (0.02)
Constant -3.578** (1.36)
Observations 4,543
Groups 1,016
Observ/ Group 4.5
Link Function Identity
Family Gaussian
Working Correlation Matrix Unstructured
Wald Chi-Square 1,403.44
Scale Parameter 0.623
Notes: All models include Community School District (CSD), borough, and year dummy variables (coefficients excluded from the table)
All standard errors adjusted for clustering on the school identifier
+ indicates significance at p < .10, *at p < .05, ** at p < .01, ***at p < .005 (two-tailed tests of significance)

181
Table 7.7
Personnel Instability and Social Climate Indicator (Halo Corrected)
(1) (2) (3) (4)
Dependent Variable Coworker Trust Coworker Respect Coworker Support Managerial Support
b se b se b se b se
Personnel Instability
Principal Succession -0.073* (0.03) -0.059 (0.04) -0.088* (0.04) 0.031 (0.02)
Collective Teacher Turnover -0.016 (0.12) -0.153 (0.14) 0.068 (0.15) 0.010 (0.07)
School Characteristics
Teachers with Master's plus (%) -0.168 (0.13) -0.101 (0.16) -0.158 (0.14) 0.025 (0.07)
Teachers with Less than 3years (%) 0.523*** (0.17) 0.785*** (0.19) 0.515*** (0.18) -0.173* (0.08)
Teachers out of certification (%) 0.031 (0.17) -0.065 (0.21) -0.025 (0.22) -0.026 (0.10)
Total Enrollment (Per 10 Students) -0.003*** (0.00) -0.004*** (0.00) -0.002*** (0.00) 0.000 (0.00)
Student to Teacher Ratio 0.012 (0.01) 0.023* (0.01) 0.017+ (0.01) -0.004 (0.00)
Intermediate School (Comp. to Elem.) -0.006 (0.05) 0.016 (0.06) -0.011 (0.06) 0.063* (0.03)
Middle School (Comp to Elem.) 0.040 (0.05) 0.303*** (0.06) -0.108+ (0.06) 0.155*** (0.03)
Client Characteristics
Student Stability 0.019 (0.11) -0.059 (0.12) -0.005 (0.13) -0.016 (0.06)
White (%) -1.230 (0.88) 0.367 (0.96) -0.555 (0.95) -0.242 (0.46)
Black (%) -1.426 (0.87) -0.285 (0.93) -0.709 (0.95) -0.104 (0.46)
Asian (%) -1.190 (0.85) 0.062 (0.93) -0.343 (0.94) -0.163 (0.45)
Hispanic (%) -1.032 (0.86) -0.155 (0.94) -0.258 (0.95) -0.097 (0.46)
Special Education (%) -0.887*** (0.31) -0.261 (0.42) -0.515 (0.38) 0.099 (0.18)
English Language Learners (%) -0.639*** (0.22) -0.845*** (0.27) -0.647* (0.26) -0.014 (0.12)
Free or Reduced Lunch (%) -0.089 (0.14) 0.177 (0.17) -0.190 (0.15) -0.001 (0.08)
Suspensions (%) -0.570+ (0.31) -1.067** (0.39) -0.308 (0.40) 0.178 (0.18)
Attendance Rate (%) -2.155* (0.84) -0.410 (1.02) -1.796+ (0.95) -0.490 (0.46)
School Performance
ELA Exam Pass (%) 0.134 (0.17) 0.590*** (0.21) 0.078 (0.21) -0.148 (0.09)
Math Exam Pass (%) -0.096 (0.14) 0.085 (0.16) -0.138 (0.16) 0.001 (0.07)
Parent Satisfaction -0.004 (0.02) 0.219*** (0.02) 0.039+ (0.02) -0.029*** (0.01)
Constant 3.741*** (1.14) 0.411 (1.34) 2.642* (1.27) 0.592 (0.62)
Observations 4543 4543 4543 4543
Groups 1015 1015 1015 1015
Observ/ Group 4.5 4.5 4.5 4.5
Link Function identity identity identity identity
Family Gaussian Gaussian Gaussian Gaussian
Working Correlation Matrix unstructured unstructured unstructured unstructured
Wald Chi-Square 653.14*** 765.09*** 497.02*** 658.89***
Scale Parameter 0.4051 0.3623 0.538 0.1176
Notes: All models include Community School District (CSD), borough, and year dummy variables (coefficients excluded from the
table)
All standard errors adjusted for clustering on the school identifier
+ indicates significance at p < .10, *at p < .05, ** at p < .01, ***at p < .005 (two-tailed tests of significance)

182
Table 7.8
Personnel Instability and Management (Halo Corrected)
(1) (2) (3) (4) (5)
Dependent Variable Client Oriented
Management
Managerial
Feedback
Goal Oriented
Management
Credible
Commitment
Participatory
Management
b se b se b se b se b se
Personnel Instability
Principal Succession -0.056** (0.02) -0.013 (0.02) -0.030 (0.02) 0.039*** (0.01) 0.045** (0.02)
Collective Teacher Turnover 0.023 (0.07) 0.181** (0.07) -0.044 (0.06) -0.001 (0.04) -0.150* (0.06)
School Characteristics
Teachers with Master's plus (%) 0.055 (0.07) 0.138* (0.07) 0.088 (0.07) -0.009 (0.04) -0.185** (0.07)
Teachers with Less than 3years (%) 0.064 (0.09) -0.027 (0.08) 0.044 (0.08) -0.135*** (0.05) 0.207* (0.08)
Teachers out of certification (%) 0.314** (0.11) -0.077 (0.10) -0.144 (0.09) -0.011 (0.05) 0.041 (0.09)
Total Enrollment (Per 10 Students) -0.001* (0.00) 0.000 (0.00) -0.001*** (0.00) 0.001*** (0.00) 0.000 (0.00)
Student to Teacher Ratio 0.011* (0.00) 0.003 (0.00) -0.000 (0.00) -0.006* (0.00) 0.007 (0.00)
Intermediate School (Comp. to Elem.) -0.065* (0.03) -0.036 (0.02) -0.057* (0.02) 0.041*** (0.01) 0.033 (0.03)
Middle School (Comp to Elem.) -0.147*** (0.03) -0.064* (0.03) -0.190*** (0.02) 0.097*** (0.01) 0.096*** (0.03)
Client Characteristics
Student Stability -0.034 (0.06) 0.059 (0.06) -0.095+ (0.06) 0.035 (0.03) 0.066 (0.07)
White (%) -0.517 (0.53) 0.863+ (0.45) 0.486 (0.42) -0.082 (0.27) -0.836* (0.40)
Black (%) -0.862 (0.52) 0.952* (0.44) 0.266 (0.41) 0.079 (0.27) -0.750+ (0.40)
Asian (%) -0.802 (0.52) 0.884* (0.45) 0.465 (0.41) -0.074 (0.27) -0.750+ (0.40)
Hispanic (%) -0.871+ (0.53) 0.835+ (0.45) 0.397 (0.41) 0.034 (0.27) -0.867* (0.41)
Special Education (%) 0.027 (0.19) 0.126 (0.18) -0.173 (0.17) 0.065 (0.10) 0.265 (0.18)
English Language Learners (%) -0.005 (0.12) 0.136 (0.12) -0.026 (0.11) 0.122+ (0.07) 0.008 (0.11)
Free or Reduced Lunch (%) -0.385*** (0.07) 0.177* (0.08) -0.057 (0.07) 0.105** (0.04) -0.078 (0.07)
Suspensions (%) -0.025 (0.21) -0.388* (0.17) -0.333* (0.16) 0.257* (0.11) 0.163 (0.21)
Attendance Rate (%) 0.784+ (0.47) -1.015* (0.50) 1.688*** (0.47) -0.323 (0.23) -1.146* (0.46)
Performance
ELA Exam Pass (%) 0.252* (0.10) -0.064 (0.09) 0.128 (0.09) -0.090+ (0.05) 0.080 (0.09)
Math Exam Pass (%) -0.357*** (0.08) -0.060 (0.08) 0.089 (0.07) 0.072+ (0.04) -0.266*** (0.07)
Parent Satisfaction -0.000 (0.01) 0.007 (0.01) 0.010 (0.01) -0.011* (0.01) 0.000 (0.01)
Constant 0.543 (0.67) -0.266 (0.62) -1.685*** (0.59) 0.082 (0.33) 1.975*** (0.55)
Observations 4,543 4,543 4,543 4,543 4,543
Groups 1,015 1,015 1,015 1,015 1,015
Observ/ Group 4.5 4.5 4.5 4.5 4.5
Link Function Identity Identity Identity Identity Identity
Family Gaussian Gaussian Gaussian Gaussian Gaussian
Working Correlation Matrix Unstructured Unstructured Unstructured Unstructured Unstructured
Wald Chi-Square 1,044.80*** 409.87*** 1,205.37*** 1,027.24*** 462.08***
Scale Parameter 0.123 0.105 0.095 0.040 0.106
Notes: All models include Community School District (CSD), borough, and year dummy variables (coefficients excluded from the table)
All standard errors adjusted for clustering on the school identifier
+ indicates significance at p < .10, *at p < .05, ** at p < .01, ***at p < .005 (two-tailed tests of significance)
183
CHAPTER 8
DISCUSSION AND CONCLUSION
In this dissertation, I have built a more complete understanding of the consequences of
personnel instability for public organizations. While turnover research has proliferated in public
administration scholarship, the focus has been on the determinants of individual turnover or
turnover intention (e.g. Bertelli, 2007; Bright, 2008; Cho & Lewis, 2012; Kim, 2005; G. Lee &
Jimenez, 2011; S. Y. Lee & Whitford, 2008; Pitts et al., 2011). Surprisingly, there have been
relatively few studies examining how changes in managers or frontline employees actually affect
the management and performance of public organizations (for exceptions see Boyne et al., 2010,
2011; Hill, 2005; Meier & Hicklin, 2008; O’Toole & Meier, 2003; Whitford, 2002a).
Furthermore, the extant public administration scholarship on the subject has emphasized the
relationship between personnel instability and performance, leaving the relationships between
personnel instability and other organizational consequences unexplored. This dissertation is a
major contribution that begins to address these important but unanswered questions in the current
public administration scholarship.
Additionally, while theorists have suggested that turnover’s relationship with
organizational performance is a consequence of human capital loss (e.g. Becker, 1964; Price,
1989) and social capital deterioration (e.g. Blau, 1960; Price, 1989), prior to this dissertation no
public administration scholarship had empirically examined how managerial succession and
collective frontline employee turnover might directly affect these variables in public service
organizations. This dissertation fills this void by investigating the effects of both managerial

184
succession and collective frontline employee turnover on the organizational human capital, social
climate, and management in New York City schools.
In the remainder of this chapter, I provide a summary of the findings from Chapter 5,
Chapter 6, and Chapter 7. In Table 8.1, I provide a list of the hypotheses I formed in Chapter 3
and the findings for each of the hypotheses I have tested. As I discuss the findings and major
contributions of this dissertation, I provide a discussion of the limitations and point out
opportunities for future research.
Personnel Instability and Organizational Performance
In Hypotheses 1a and 1b, I tested competing theories in the literature of the direct effect
of managerial succession on organizational performance. On one hand, scholars have argued
that a change in manager can have positive effects for an organization (Hambrick & Mason,
1984; Miller, 1991, 1992, 1993). These authors argue that a new manager can realign the
organization to the environment and introduce new ideas and innovations to an organization that
might have become ossified or stagnant under previous leadership. On the other hand, there are
scholars that argue that leadership changes are disruptive to the norms, routines, and processes of
organizations (Hannan & Freeman, 1984; Whitford, 2002a). Thus, the direct effect of
managerial succession on organizational performance will be negative, at least in the short term.
In Chapter 5, I presented models in an attempt to adjudicate these competing perspectives.
However, the findings were statistically insignificant and I found no evidence supporting a direct
effect, either positive or negative, between managerial succession and any measure of
organizational performance.
What might explain the absence of a direct relationship between managerial succession
and performance in New York City schools? First, as I mentioned in the introduction, New York

185
City school principals might be seen as middle managers. Principals might not be able to
immediately come into an organization and make drastic changes that effect performance one
way or the other. One theoretical limitation to considering school principals as top managers is
that they might be limited in the changes they can actually implement in a school without having
to get approval from central administration. Perhaps the changes principals can make are limited
to smaller, insignificant changes— and are not the broad sweeping changes envisioned by the
introduction of a new CEO of a public organization (see Boyne & Dahya, 2002; Boyne et al.,
2011).
Second, it is possible that the relationship between managerial succession and
performance in New York City schools takes time to develop. Outcomes in public schools are
highly inertial, and if principals are limited to making smaller, more subtle changes over time,
the effect on performance is not likely to show up in the short term. In fact, in secondary
analyses not included in this dissertation, I found a direct negative relationship between
managerial succession and performance, when the managerial succession variable was lagged
one period. This finding suggests that it takes new principals some time to trigger the
organizational changes that will have a negative effect on performance. Building a better
understanding the effects of middle management succession remains an exciting direction for my
future research.
Recently, Boyne et al. (2011) argued that the effect of a managerial succession is likely
contingent on the past performance of an organization. For high-performing organizations, the
consequence of a change in top manager is likely to be disruptive. On the other hand, new
managers might bring new ideas and innovations to low-performing organizations. Furthermore,
if the relationship is contingent on past performance that might explain why no statistically

186
significant direct effect is observed. Hypotheses 2a and 2b were stated to test the relationship.
To test these hypotheses, I interacted principal succession with a dummy indicator of whether the
organization was high or low-performing in the previous period for both the ELA exam and
Math exam. A fascinating and important relationship did indeed emerge, but not the one I had
expected. For both the ELA exam and the Math exam pass rates, I found that the effect of
managerial succession was statistically significant, but the relationships were not in the
hypothesized directions. The findings suggest that low-performing organizations are hurt by
managerial succession, and high-performing organizations are positively affected by the
presence of a new manager. The statistically significant findings contradict Hypotheses 2a and
2b.
This finding is a major contribution to current public administration scholarship because
it directly contradicts previous research, and sheds light on how managerial succession might
affect organizational performance in different public service contexts, especially in the delivery
of education, healthcare, and other social welfare services. What might explain these unexpected
findings? First, this finding might be a function of principals using jobs in lower performing
schools as an entry opportunity for an administrative position in a large, urban school district.
The new principals might be inexperienced and using the position in a low-performing school as
a foot in the door (see Béteille et al., 2012). Over their careers, the principals might gain
experience and skills that they carry with them as they advance and pursue jobs in higher
performing schools within the same district. Future public administration research should
explore this phenomenon in additional public service contexts.
This finding adds nuance to our previous understanding of the relationship between
managerial succession and organizational performance. In future research, I will gain access to

187
employee records to get more information about the experience of the new principal.
Specifically, I want to operationalize: 1) Whether it is the new principal’s first job; 2) How many
years of experience the new principal has as a principal or assistant principal; 3) The
performance of the new principal’s previous school; 5) Whether the new principal previously
worked in the school as either a teacher or assistant principal; 6) Whether the new principal’s
previous position was outside of New York City schools. Collecting these data will allow me to
add more detail to my understanding of the nature of the relationship between principal
succession and organizational performance and will build on previous public management
research that has explored these contingencies (Hill, 2005).
In my examination of the relationship between collective employee turnover and
organizational performance, I found that collective teacher turnover has a significant nonlinear
relationship with ELA and math exam pass rates, and this provides support for Hypothesis 4.
However, when the relationship is plotted the positive effect of turnover on performance is
nominal, with the deleterious effect growing larger following a point of optimality. Clearly, the
figures are not of the inverted-U that results hypothesized by Abelson and Baysinger (1984) and
found in previous public management scholarship (Meier & Hicklin, 2008). In fact, a visual
plotting of the relationships (see Figure 5.1 and Figure 5.2) shows that the positive affect of
turnover on performance is negligible. The findings are best summarized as turnover providing a
negligible boost to performance at lower levels, but as the rate of the collective turnover
increases, the effect becomes increasingly negative.
What might explain this deviation from previous public administration scholarship on the
relationship between collective employee turnover and performance? First, this is a different
employment context for teachers. Meier and Hicklin (2008) examined collective turnover
188
operationalized as teachers leaving a school district. Teacher transfers to different schools in the
same district were not examined. It might be the case that the likelihood of a teacher switching
to a new school within a school district is greater than a teacher switching to a new school in a
different district. Thus, by examining collective turnover at the school-level, turnover’s
relationship with performance might be fundamentally different because of the different labor
market options teachers. This also points to an important limitation of not just my own
dissertation, but most research on collective employee turnover and performance. I discussed in
Chapter 4 the inability of most researchers to operationalize why an employee leaves an
organization. Understanding how the different types of employee turnover (voluntary versus
involuntary, quits versus transfers, termination versus retirements) affect performance is an
important step to take in future research on the topic.
Second, in schools with high collective turnover, informal systems might be in place that
buffer against the deleterious effects of turnover. One example might be to assign new teachers
to elementary school grades that do not take the standardized tests, such as Kindergarten through
2nd
grade. While I currently do not have access to this level of data, future research should
attempt to better understand the relationship between the tasks new employees are assigned to
and the measures used to assess performance. Finally, if high turnover schools are equipped to
handle expected levels of turnover, it might be necessary to measure turnover “shocks”—or a
specified turnover percentage above and beyond what school leaders might expect. In future
research, I plan on operationalizing a turnover “shock” as an increase in turnover beyond what
would be predicted based on demographics, human capital quality, and the location for each
school.

189
Interestingly, neither collective employee turnover nor managerial succession was related
to parent satisfaction. The finding with respect to employee turnover is not surprising. Parents
might be buffered from the effects of aggregate changes in teacher on a year-to-year basis since
they might expect their child to have a new teacher every year anyways. Likewise, parents are
likely to base their assessments of schools on the teachers and staff they interact with the most—
such as their child’s teacher. If this is the case, it is not surprising that a new principal will have
little effect on the average parent’s overall satisfaction with the school. Furthermore, without
knowing more information about the parents, such as involvement levels, it is difficult to assess
parents’ abilities to effectively evaluate the schools and the validity of the parent satisfaction
measure.
In addition, the literature suggested that there might be a reciprocal relationship between
turnover and performance that plays out over time in urban school districts. Since the majority
of teacher turnover likely occurs between school years, I could use lag and lead variables to help
ensure that the independent variable was measured or occurred in a period prior to the
measurement of the dependent variable. This would allow me to restructure the data to see if
performance affected collective teacher turnover and managerial succession in the following
period. In Chapter 5, I found support for Hypothesis 5a and 5b, and a negative relationship
between performance and both dimensions of personnel instability.
Given the theory, the structuring of the data, and the statistical support from the Granger
tests, I believe there is ample evidence suggesting a reciprocal relationship between personnel
instability and performance that plays out over time. By considering the temporal dynamics
among variables and the possibility of reciprocal relationships, this dissertation takes an

190
important step forward in building a more complete understanding of the relationships among
personnel instability and performance.
Personnel Instability and Organizational Human Capital
In Chapter 6 I presented my analyses of the relationships between personnel instability
and organizational human capital. While scholars have long argued that human capital loss is an
important consequence of turnover, there has yet to be an investigation of whether or not human
capital loss could potentially put strain on public organizations and force them, ultimately, to
become staffed with lower-skilled employees. By examining this relationship, this dissertation
begins to answer a question that has implications for both public personnel management and
strategic human resource management scholarship.
The analyses provided some support for Hypothesis 6 and I found evidence that
collective employee turnover is negatively related to certain dimensions of organizational human
capital quality. The analysis showed that of the three indicators I use, collective employee
turnover had the largest effect on the percentage of employees with less than three years’
experience. The finding indicates that in New York City schools, increases in collective teacher
turnover will result in an increase in the presence of less experienced employees Interestingly, I
did not find evidence that collective teacher turnover was related to the percentage of teachers
with master’s degrees plus thirty additional credit hours or the percentage of teachers in the
school working without the appropriate certification.
I also restructured the data and probed the relationship from the opposite direction. The
education literature has found that teachers with less experience and less training are also more
likely to leave the organization (e.g. Ballou & Podgursky, 1999; Chapman, 1984; Clotfelter et
al., 2004; Guarino et al., 2006; Theobald, 1990). Even though the variables are measured at the

191
school level and I do not know who is actually leaving the organization, I find evidence that
schools with lower levels of aggregated human capital do, in fact, have higher levels of turnover
in the future period. Therefore, I have support for Hypothesis 7. Specifically, both the
percentage of teachers with less than three years’ experience and teachers out of certification
were positively related to turnover in the following period. The findings from Hypothesis 6 and
Hypothesis 7 were supported by theory, statistical findings, and evidence from Granger tests.
The findings suggest a reciprocal relationship over time between collective employee turnover
and levels of organizational human capital quality in public organizations. By integrating
multiple research literatures, this dissertation built a more nuanced understanding of the
relationship between personnel instability and organizational human capital quality over time.
This dissertation also considered the possibility that a managerial succession might
trigger higher levels of front-line employee turnover. I found support for Hypothesis 8 and
evidence of a positive relationship between principal succession and collective teacher turnover.
The finding suggests that more teachers will leave a school in the period following the entrance
of a new principal to the school. The finding is consistent with management literature suggesting
organizational changes can disrupt employees’ understanding of the organization and create
uncertainty (e.g. Bordia et al., 2004; Piderit, 2000). These feelings might result in lower levels
of satisfaction and, thus, increase the likelihood of exit. This is an important lesson for new
managers to understand when they take over an organization. A manager who is aware of this
can make an effort to mitigate increases in employee turnover, but can also be proactive in
planning for it.

192
Personnel Instability, Organizational Social Climate, and Management
This dissertation was the first time a public scholar has empirically examined the
relationship between personnel instability and organizational social climate and management.
Drawing on considerable theoretical work from both management (e.g. Gittell & Douglass,
2012; Leana & Van Buren, 1999) and sociology (e.g. Blau, 1960), I crafted a theoretical
rationale for the important implications of personnel instability for both the social climate and
management of a public organization. This is an important step forward for building a more
complete understanding of the organizational consequences of personnel instability and turnover.
There are, however, several important limitations to the data used to construct the
measures of organizational social climate and management that I use in this dissertation. First,
there is the issue of timing and when the variables are measured in relation to one another. If
the personnel instability measures are measured too far in advance of the measurement of social
climate and management, it is possible that any change driven by personnel instability that
occurs in social climate or management will be unobserved—or not present in the data. To
illustrate this point, consider principal succession in a New York City school. The moment
immediately following the introduction of the new manager to the organization is when I might
expect the largest disruption to the organization to occur. Over time, however, I expect the
disruption to dissipate. Likewise, if the majority of collective teacher turnover occurs between
school years, I expect the social disruption to be larger if measured at the beginning of the school
year, as opposed to the end of a school year. Over the course of the year, it is likely the case that
employees bond, and form relationships, and the social relationships normalize. In my analyses,
my measures of managerial feedback, credible commitment, collaborative decision making, and
goal clarity are measured in the spring following a managerial change and the majority of teacher
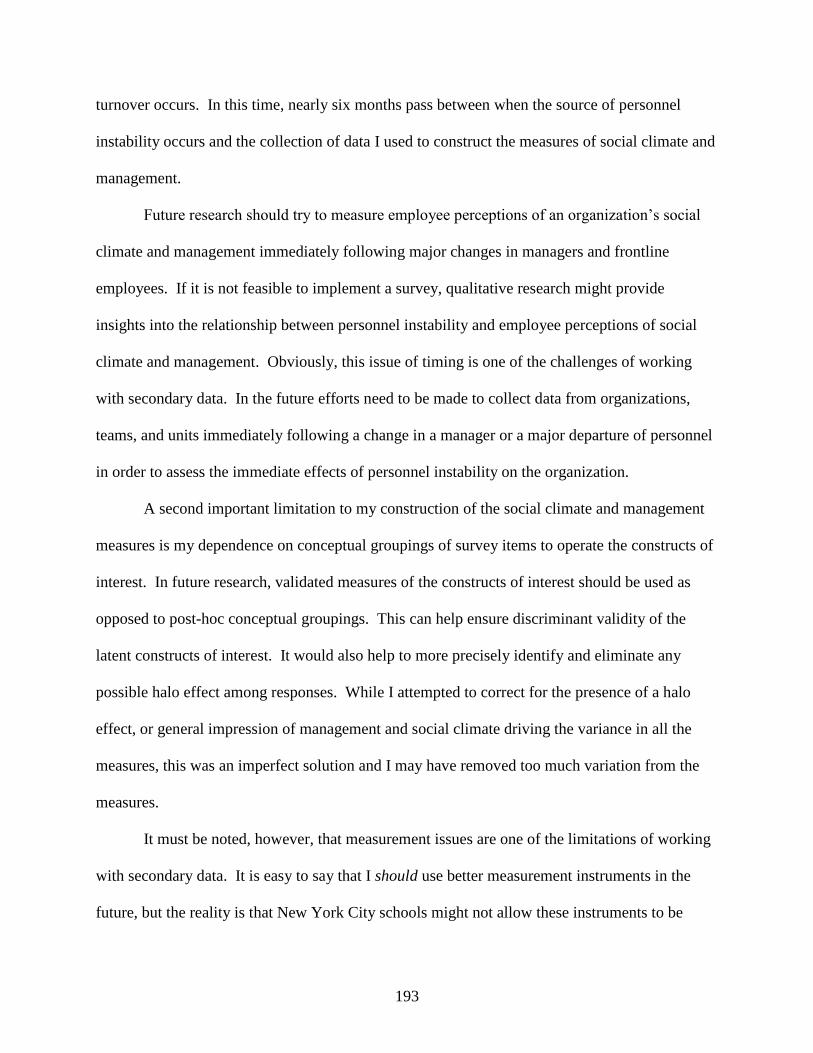
193
turnover occurs. In this time, nearly six months pass between when the source of personnel
instability occurs and the collection of data I used to construct the measures of social climate and
management.
Future research should try to measure employee perceptions of an organization’s social
climate and management immediately following major changes in managers and frontline
employees. If it is not feasible to implement a survey, qualitative research might provide
insights into the relationship between personnel instability and employee perceptions of social
climate and management. Obviously, this issue of timing is one of the challenges of working
with secondary data. In the future efforts need to be made to collect data from organizations,
teams, and units immediately following a change in a manager or a major departure of personnel
in order to assess the immediate effects of personnel instability on the organization.
A second important limitation to my construction of the social climate and management
measures is my dependence on conceptual groupings of survey items to operate the constructs of
interest. In future research, validated measures of the constructs of interest should be used as
opposed to post-hoc conceptual groupings. This can help ensure discriminant validity of the
latent constructs of interest. It would also help to more precisely identify and eliminate any
possible halo effect among responses. While I attempted to correct for the presence of a halo
effect, or general impression of management and social climate driving the variance in all the
measures, this was an imperfect solution and I may have removed too much variation from the
measures.
It must be noted, however, that measurement issues are one of the limitations of working
with secondary data. It is easy to say that I should use better measurement instruments in the
future, but the reality is that New York City schools might not allow these instruments to be

194
used. Additionally, given the length of a number of validated measures, it is likely not feasible
to operationalize all the measures of interest with psychometrically validated instruments in a
setting similar to New York City schools.
A third limitation to the measures is the use of aggregated employee responses to survey
items. The problem is that without the individual responses I cannot assess interrater reliability
among the items. This is an important limitation, but one faced by many researchers working
with publicly available data aggregated to the organizational level by the data’s owner in order to
limit the possibility of identifying individuals (e.g. Amirkhanyan et al., 2014; Favero & Meier,
2013). In the future, I will try to gain access to individual level teacher responses to the items.
Doing so will might allow me to study the individual employee perceptions of social climate in a
multilevel model, where I look at the perceptions of individuals (teachers) nested in larger units
(schools). Multilevel modeling has been used in previous public administration research (see
Heinrich & Lynn, 2001) and is well suited for the education context.
Despite the limitations to the data that I used, the data allowed me test the relationships
among personnel instability and social climate and management. This is an important step for
constructing a more complete understanding of the organizational consequences of personnel
instability.
With respect to the analyses, I did not find evidence to support Hypotheses 9a, 9b, or 9c
and a negative relationship between collective employee turnover and employee perceptions of
coworker trust, coworker respect and coworker support. Interestingly, managerial succession
was negatively related to employee perceptions of coworker trust and employee perceptions of
coworker support in both the uncorrected and the halo corrected models. While I did not
consider this relationship when I developed my hypotheses, it provides evidence that a change in

195
an organization’s or work unit’s top leader might create a disruption in the relationships among
lower-level frontline employees, and is an important finding to emerge out of this dissertation. It
is possible that employees feel as though they must compete with each other to make a positive
impression on a new manager and this creates a social tension. Interestingly, while managerial
succession might disrupt the social relationships among coworkers, I found no evidence that
managerial succession affects employee perceptions of managerial support and, therefore, no
evidence to support Hypothesis 10.
With respect to the relationship between personnel instability and an organization’s
management several interesting findings emerged. First, in both the uncorrected and halo
corrected models, I found support for Hypothesis 11a and the presence of a negative relationship
between managerial succession and client oriented management. The finding provides some
evidence that new managers will focus on the internal policies, procedures, and management of
an organization, rather than building relationships with the clients they serve. However, I found
no support for Hypothesis 11b and a negative relationship between collective employee turnover
and client oriented management in both the halo corrected and uncorrected model.
I found no evidence of a relationship between managerial succession and managerial
feedback and, thus, I have no support for Hypothesis 12. I did, however, find a positive
relationship between collective employee turnover and perceptions of managerial feedback in the
halo corrected model. While I did not form a hypothesis on this relationship, it is logical that
high turnover organizations are going to have more new members. As a consequence of many
new members, managers of these organizations might be more involved in providing oversight,
instruction, and feedback to employees who are in the process of learning, adapting and
integrating into the organization’s processes and routines.

196
I found no support for Hypothesis 13 and no evidence of an associational relationship
between managerial succession and goal oriented management in either the uncorrected or the
halo corrected models. I did however find support for Hypothesis 14 and a positive relationship
between managerial succession and credible commitment in the halo corrected model, but not the
uncorrected model. The relationship makes sense since I expect new managers to clearly lay out
their own vision for the organization and the means by which he or she will achieve the
organization’s goals.
Finally, I found evidence contradicting Hypothesis 15a and indicating a positive
relationship between managerial succession and participative management. While I
hypothesized that new managers might not put participative management practices in place
immediately, it appears that participative management might be a tool they use to learn the
organization and gain employee “buy-in” as they implement new policies. Interestingly, in the
halo corrected model, I found evidence of a negative relationship between collective employee
turnover and participative management. This finding suggests that in organizations with high
levels of churn among frontline employees, managers might, in fact, be unwilling to trust and
include their frontline employees in the decision making and management of the organization
Conclusion
This dissertation is an important step forward for public administration scholarship that
has long focused on the determinants of employee turnover, but not the consequences of
employee turnover, change, and instability for public organizations. But this is only one small
step. While some research questions have been answered, new and more interesting puzzles
have emerged over the course of this project and it is obvious to me that this study is just my first

197
step down the path of future research where I continue to examine the consequences of personnel
instability in public organizations.

198
Table 8.1
Summary of Findings
Analysis Hypothesis Findings
Chapter 5
H1a: Managerial succession is negatively related to organizational
performance. No support
H1b: Managerial succession is positively related to organizational performance.
No support
H2a: Managerial succession has negative effects on performance
when the previous performance of the organization is high.
Contradictory evidence. Managerial
succession drives higher performance in already high performing organizations.
H2b: Managerial succession has positive effects on performance when the previous performance of the organization is low.
Contradictory evidence. Managerial succession
drives higher performance in already high
performing organizations.
H3: Collective frontline employee turnover is negatively related to
organizational performance. No support
H4: Collective frontline employee turnover has a nonlinear relationship with organizational performance.
Support. Evidence supports a statistically
significant nonlinear relationship between collective employee turnover and
organizational performance
H5a: Organizational performance is negatively related to the likelihood of a managerial succession.
Support. Evidence of a statistically significant relationship among the variables.
H5b: Organizational performance is negatively related to collective
frontline employee turnover.
Support. Evidence of statistically significant
relationship
Chapter 6
H6: Collective frontline employee turnover is negatively related to
levels of human capital quality in the organization.
Support. Evidence that collective employee turnover leads to less experienced workers in
the following period.
H7: Human capital quality is negatively related to collective frontline
employee turnover in future periods.
Support. Evidence that organizations with higher levels of inexperienced employees and
teachers without the appropriate certifications
have higher levels of collective turnover.
H8: Managerial succession is positively related to collective frontline
employee turnover in future periods.
Support. Evidence that a managerial succession is followed by higher levels of
collective employee turnover
Chapter 7
H9a: Collective frontline employee turnover is negatively related to employee perceptions of coworker trust.
No support
H9b: Collective frontline employee turnover is negatively related to
employee perceptions of coworker support. No support
H9c: Collective frontline employee turnover is negatively related to employee perceptions of coworker respect.
No support
H10: Managerial succession is negatively related to employee
perceptions of managerial support. No support
H11a: Managerial succession is negatively related to employee perceptions of client oriented management.
Support. Supporting evidence found in the halo corrected and uncorrected model.
H11b: Collective frontline employee turnover is negatively related to
employee perceptions of client oriented management. No support
H12: Managerial succession is positively related to employee perceptions of managerial feedback.
No support.
H13: Managerial succession is associated (positively or negatively)
with employee perceptions of clear organizational goals. No support
H14: Managerial succession is associated (positively or negatively)
with employee perceptions of a manager’s credible commitment to the
organization.
Mixed Support. Supporting evidence found in
the halo corrected but not the uncorrected
model.
H15a: Managerial succession is negatively related to employee
perceptions of collaborative decision making.
Mixed Contradictory Evidence. Contradictory evidence found in the halo corrected but not the
uncorrected model.
H15b: Collective frontline employee turnover is negatively related to
employee perceptions of collaborative decision making.
Mixed Support. Supporting evidence found in
the halo corrected but not the uncorrected model.

199
REFERENCES
Abelson, M. A., & Baysinger, B. D. (1984). Optimal and dysfunctional turnover: Toward an
organizational level model. The Academy of Management Review, 9(2), 331-341.
Aldrich, H. (2008). Organizations and Environments. Palo Alto, CA: Stanford University Press.
Alexander, J. A., Bloom, J. R., & Nuchols, B. A. (1994). Nursing turnover and hospital
efficiency: An organization-level analysis. Industrial Relations: A Journal of Economy
and Society, 33(4), 505-520.
Allen, D. G., Shore, L. M., & Griffeth, R. W. (2003). The role of perceived organizational
support and supportive human resource practices in the turnover process. Journal of
Management, 29(1), 99-118.
Allen, M. P., & Panian, S. K. (1982). Power, performance and succession in the large
corporation. [Article]. Administrative Science Quarterly, 27(4), 538-547.
Allen, M. P., Panian, S. K., & Lotz, R. E. (1979). Managerial succession and organizational
performance: A recalcitrant problem revisited. Administrative Science Quarterly, 24(2),
167-180.
Amirkhanyan, A. A., Kim, H. J., & Lambright, K. T. (2014). The performance puzzle:
Understanding the factors influencing alternative dimensions and views of performance.
Journal of Public Administration Research and Theory, 24(1), 1-34.
Anderson, T. W., & Hsiao, C. (1982). Formulation and estimation of dynamic models using
panel data. Journal of Econometrics, 18(1), 47-82.
Andrews, R., Boyne, G. A., Law, J., & Walker, R. M. (2012). Strategic Management and Public
Service Performance. New York: Palgrave MacMillan.

200
Andrews, R., Boyne, G. A., & Walker, R. M. (2006). Subjective and objective measures of
organizational performance: An empirical exploration. In G. A. Boyne, K. J. Meier, L. J.
O'Toole, Jr. & R. M. Walker (Eds.), Public Service Performance: Perspectives on
Measurement and Management (pp. 14-34). New York: Cambridge University Press.
Arellano, M., & Bond, S. (1991). Some tests of specification for panel data: Monte Carlo
evidence and an application to employment equations. The Review of Economic Studies,
58(2), 277-297.
Ballinger, G. A. (2004). Using generalized estimating equations for longitudinal data analysis.
Organizational Research Methods, 7(2), 127-150.
Ballou, D., & Podgursky, M. (1999). Teacher recruitment and retention in public and private
schools. Journal of Policy Analysis and Management, 17(3), 393-417.
Barney, J. (1991). Firm resources and sustained competitive advantage. Journal of Management,
17(1), 99-120.
Barzelay, M. (1992). Breaking Through Bureaucracy: A New Vision for Managing in
Government. Berkely, CA: University of California Press.
Becker, G. S. (1962). Investment in human capital: A theoretical analysis. The Journal of
Political Economy, 70(5), 9-49.
Becker, G. S. (1964). Human Capital: A Theoretical and Empirical Analysis, with Special
Reference to Education (3rd ed.). Chicago: University of Chicago Press.
Behn, R., & Bozeman, B. (1993). Case-analysis research and managerial effectiveness: Learning
how to lead organizations up sand dunes. In B. Bozeman (Ed.), Public Management: The
State of The Art (pp. 40-54). San Francisco, CA: Jossey-Bass.

201
Benner, M. J., & Tushman, M. L. (2003). Exploitation, exploration, and process management:
The productivity dilemma revisited. Academy of Management Review, 28(2), 238-256.
Bertelli, A. M. (2007). Determinants of bureaucratic turnover intention: Evidence from the
Department of the Treasury. Journal of Public Administration Research and Theory,
17(2), 235-258.
Béteille, T., Kalogrides, D., & Loeb, S. (2012). Stepping stones: Principal career paths and
school outcomes. Social Science Research, 41(4), 904-919.
Bingham, L. B., Nabatchi, T., & O'Leary, R. (2005). The new governance: Practices and
processes for stakeholder and citizen participation in the work of government. Public
Administration Review, 65(5), 547-558.
Blau, P. M. (1960). A theory of social integration. American Journal of Sociology, 65(6), 545-
556.
Boe, E. E., Sunderland, R. J., & Cook, L. H. (2008). Teacher turnover: Examining exit attrition,
teaching area transfer, and school migration. Exceptional Children, 75(1), 7-31.
Bordia, P., Hobman, E., Jones, E., Gallois, C., & Callan, V. J. (2004). Uncertainty during
organizational change: Types, consequences, and management strategies. Journal of
Business and Psychology, 18(4), 507-532.
Bourgeois, L. J. (1981). On the measurement of organizational slack. Academy of Management
Review, 6(1), 29-39.
Bowen, N. K., & Bowen, G. L. (1999). Effects of crime and violence in neighborhoods and
schools on the school behavior and performance of adolescents. Journal of Adolescent
Research, 14(3), 319-342.

202
Boyd, D., Hamilton, L., Loeb, S., & Wyckoff, J. (2005). Explaining the short careers of high-
achieving teachers in schools with low-performing students. The American Economic
Review, 95(2), 166-171.
Boyne, G. A. (2002). Concepts and indicators of local authority performance: An evaluation of
the statutory frameworks in England and Wales. Public Money and Management, 22(2),
17-24.
Boyne, G. A., & Dahya, J. (2002). Executive succession and the performance of public
organizations. Public Administration, 80(1), 179-200.
Boyne, G. A., James, O., John, P., & Petrovsky, N. (2010). Does public service performance
affect top management turnover? Journal of Public Administration Research and Theory,
20(supplement 2), i261-i279.
Boyne, G. A., James, O., John, P., & Petrovsky, N. (2011). Top management turnover and
organizational performance: A test of a contingency model. Public Administration
Review, 71(4), 572-581.
Bozeman, B., & Gordon, K. (1998). Risk culture in public and private organizations. Public
Administration Review, 58(2), 109-118.
Bright, L. (2008). Does public service motivation really make a difference on the job satisfaction
and turnover intentions of public employees? The American Review of Public
Administration, 38(2), 149-166.
Brissenden, P. F., & Frankel, E. (1922). Labor Turnover in Industry: A Statistical Analysis. New
York: MacMillan Co.
Brown, M. C. (1982). Administrative succession and organizational performance: The
succession effect. Administrative Science Quarterly, 27(1), 1-16.

203
Burdick-Will, J. (2013). School violent crime and academic achievement in Chicago. Sociology
of Education, 86(4), 343-361.
Burlington, T., Lentz, E., & Wilson, R. N. (1956). The Give and Take in Hospitals. New York:
Putman.
Burns, T., & Stalker, G. M. (1961). The Management of Innovation Academy for
Entrepreneurial Leadership Urbana-Champaign, IL: University of Illinois.
Byrt, W. J. (1957). Methods of Measuring Labour Turnover. United Kingdom: Department of
Labour and National Service.
Caillier, J. G. (2010). Factors affecting job performance in public agencies. Public Performance
& Management Review, 34(2), 139-165.
Caillier, J. G. (2011). I want to quit: A closer look at factors that contribute to the turnover
intentions of state government employees. State & Local Government Review, 43(2),
110-122.
Carlson, R. O. (1962). Executive Succession and Organizational Change: Placebound and
Career-bound Superintendents of Schools. University of Chicago, Chicago, IL.
Chan, S. J., & Rainey, H. G. (2011). Organizational goal characteristics and public duty
motivation in U.S. federal agencies. Review of Public Personnel Administration, 31(1),
28-47.
Chang, M. L. (2009). An appraisal perspective of teacher burnout: Examining the emotional
work of teachers. Educational Psychology Review, 21(3), 193-218.
Chapman, D. W. (1984). Teacher retention: The test of a model. American Educational Research
Journal, 21(3), 645-658.

204
Chapman, D. W., & Green, M. S. (1986). Teacher retention: A further examination. The Journal
of Educational Research, 79(5), 273-279.
Chatman, J. A. (1989). Improving interactional organizational research: A model of person-
organization fit. Academy of Management Review, 14(3), 333-349.
Child, J. (1972). Organizational structure, environment and performance: the role of strategic
choice. Sociology, 6(1), 1-22.
Cho, Y. J., & Lewis, G. B. (2012). Turnover intention and turnover behavior implications for
retaining federal employees. Review of Public Personnel Administration, 32(1), 4-23.
Choi, S. (2009). Diversity in the US federal government: Diversity management and employee
turnover in federal agencies. Journal of Public Administration Research and Theory,
19(3), 603-630.
Chun, Y. H., & Rainey, H. G. (2005). Goal ambiguity and organizational performance in US
federal agencies. Journal of Public Administration Research and Theory, 15(4), 529-557.
Clotfelter, C. T., Ladd, H. F., Vigdor, J. L., & Diaz, R. A. (2004). Do school accountability
systems make it more difficult for low-performing chools to attract and retain high-
quality teachers? Journal of Policy Analysis and Management, 23(2), 251-271.
Cohen, J. E. (1986). On the tenure of appointive political executives: The American cabinet,
1952-1984. American Journal of Political Science, 30(3), 507-516.
Condrey, S. E. (2002). Reinventing state civil service systems: The Georgia experience. Review
of Public Personnel Administration, 22(2), 114-124.
Cooper, P. J. (2003). Governing by Contract: Challenges and Opportunities for Public
Managers. Washington, DC: Congressional Quarterly Press.

205
Cooper, T. L., Bryer, T. A., & Meek, J. W. (2006). Citizen-centered collaborative public
management. Public Administration Review, 66(s1), 76-88.
Cotton, C. A., Mannheim, K., & Moskos, C. C. (1983). Institution building in the all-volunteer
force. Air University Review, 24(6), 38-49.
Cotton, J. L., & Tuttle, J. M. (1986). Employee turnover: A meta-Analysis and review with
implications for research. The Academy of Management Review, 11(1), 55-70.
Cyert, R. M., & March, J. G. (1963). A Behavioral Theory of the Firm. University of Illinois at
Urbana-Champaign's Academy for Entrepreneurial Leadership Historical Research
Reference in Entrepreneurship.
Darmon, R. Y. (1990). Identifying sources of turnover costs: A segmental approach. The Journal
of Marketing, 54(2), 46-56.
Delery, J. E., & Doty, D. H. (1996). Modes of theorizing in strategic human resource
management: Tests of universalistic, contingency, and configurational performance
predictions. Academy of Management Journal, 39(4), 802-835.
Dess, G. G., & Beard, D. W. (1984). Dimensions of organizational task environments.
Administrative Science Quarterly, 29(1), 52-73.
Dess, G. G., & Shaw, J. D. (2001). Voluntary turnover, social capital, and organizational
performance. Academy of Management Review, 26(3), 446-456.
Donaldson, L. (1987). Strategy and structural adjustment to regain fit and performance: in
defence of contingency theory. Journal of Management Studies, 24(1), 1-24.
Douglass, A., & Gittell, J. H. (2012). Transforming professionalism: Relational bureaucracy and
parent–teacher partnerships in child care settings. Journal of Early Childhood Research,
10(3), 267-281.

206
Ducharme, L. J., Knudsen, H. K., & Roman, P. M. (2007). Emotional exhaustion and turnover
intention in human service occupations: The protective role of coworker support.
Sociological Spectrum, 28(1), 81-104.
Emery, F. E., & Trist, E. L. (1965). The causal texture of organizational environments. Human
Relations, 18(1), 21-32.
Farber, B. A. (1991). Crisis in Education: Stress and Burnout in the American Teacher. San
Francisco, CA: Jossey-Bass.
Favero, N., & Meier, K. J. (2012). Public Schools as Multidimensional Institutions: Examining
Parent and Teacher Evaluations. Paper presented at the Annual Midwest Political
Science Association Conference, Chicago, IL.
Favero, N., & Meier, K. J. (2013). Evaluating urban public schools: Parents, teachers, and state
assessments. Public Administration Review.
Favero, N., Meier, K. J., & O'Toole, L. J., Jr. (2012). Goals, communication, participation and
feedback: Mid-level management and traditional public administration. Paper presented
at the Americal Political Science Association Annual Meeting, New Orleans.
Fayol, H. (1949). General and Industrial Management.
Feldman, M. S., & March, J. G. (1981). Information in organizations as signal and symbol.
Administrative Science Quarterly, 26(2), 171-186.
Feldman, M. S., & Pentland, B. T. (2003). Reconceptualizing organizational routines as a source
of flexibility and change. Administrative Science Quarterly, 48(1), 94-118.
Fernandez, S. (2005). Developing and testing an integrative framework of public sector
leadership: Evidence from the public education arena. Journal of Public Administration
Research and Theory, 15(2), 197-217.

207
Fernandez, S. (2008). Examining the effects of leadership behavior on employee perceptions of
performance and job satisfaction. Public Performance & Management Review, 32(2),
175-205.
Fernandez, S., Cho, Y. J., & Perry, J. L. (2010). Exploring the link between integrated leadership
and public sector performance. The Leadership Quarterly, 21(2), 308-323.
Fernandez, S., & Rainey, H. G. (2006). Managing successful organizational change in the public
sector. Public Administration Review, 66(2), 168-176.
Ford, J. D., Ford, L. W., & D'Amelio, A. (2008). Resistance to change: The rest of the story.
Academy of Management Review, 33(2), 362-377.
Frank, A. G. (1958). Goal ambiguity and conflicting standards: An approach to the study of
organization. Human Organization, 17(4), 8-13.
Gellard, J. (1967). Determinants and Consequences of Executive Succession in Governmental
Finance Agencies. University of Chicago, Chicago, IL.
Getha-Taylor, H., Holmes, M. H., Jacobson, W. S., Morse, R. S., & Sowa, J. E. (2011). Focusing
the public leadership lens: Research propositions and questions in the minnowbrook
tradition. Journal of Public Administration Research and Theory, 21(suppl 1), i83-i97.
Gittell, J. H., & Douglass, A. (2012). Relational bureaucracy: Structuring reciprocal relationships
into roles. Academy of Management Review, 37(4), 709-733.
Glebbeek, A. C., & Bax, E. H. (2004). Is high employee turnover really harmful? An empirical
test using company records. Academy of Management Journal, 47(2), 277-286.
Goodsell, C. T. (2003). The Case For Bureaucracy: A Public Administration Polemic
Washington, DC: Congressional Quarterly Press.
Gouldner, A. W. (1954). Patterns of Industrial Bureaucracy. New York, NY: Free Press.

208
Graham, K. A., & Phillips, S. D. (1997). Citizen engagement: Beyond the customer revolution.
Canadian Public Administration, 40(2), 255-273.
Granger, C. W. J. (1969). Investigating causal relations by econometric models and cross-
spectral methods. Econometrica: Journal of the Econometric Society, 37(3), 424-438.
Griffeth, R. W., & Hom, P. W. (2001). Retaining Valued Employees. Thousand Oaks, CA: Sage.
Griffith, J. (1989). The Army's new unit personnel replacement and its relationship to unit
cohesion and social support. Military Psychology, 1(1), 17.
Grissmer, D., & Kirby, S. (1997). Teacher turnover and teacher quality. The Teachers College
Record, 99(1), 45-56.
Grissom, J. A. (2012). Revisiting the impact of participative decision making on public
employee retention: The moderating influence of effective managers. The American
Review of Public Administration, 42(4), 400-418.
Grissom, J. A., & Keiser, L. R. (2011). A supervisor like me: Race, representation, and the
satisfaction and turnover decisions of public sector employees. Journal of Policy Analysis
and Management, 30(3), 557-580.
Grissom, J. A., Nicholson-Crotty, J., & Keiser, L. R. (2012). Does my boss's gender matter?
Explaining job satisfaction and employee turnover in the public sector. Journal of Public
Administration Research and Theory, 22(4), 649-673.
Groves, K. S. (2007). Integrating leadership development and succession planning best practices.
Journal of Management Development, 26(3), 239-260.
Grusky, O. (1963). Managerial succession and organizational effectiveness. American Journal of
Sociology, 69(1), 21-31.

209
Guarino, C. M., Santibanez, L., & Daley, G. A. (2006). Teacher recruitment and retention: A
review of the recent empirical literature. Review of Educational Research, 76(2), 173-
208.
Guest, R. H. (1962). Managerial succession in complex organizations. American Journal of
Sociology, 68(1), 47-56.
Guidice, R. M., Heames, J. T., & Wang, S. (2009). The indirect relationship between
organizational-level knowledge worker turnover and innovation: an integrated application
of related literature. The Learning Organization, 16(2), 143-167.
Guin, K. (2004). Chronic teacher turnover in urban elementary schools. Education Policy
Analysis Archives, 12(42), 1-42.
Gulick, L., & Urwick, L. (1937). Paper on the science of administration. New York: Institution of
Public Administration, Columbia University.
Hambrick, D. C., & Mason, P. A. (1984). Upper echelons: The organization as a reflection of its
top managers. Academy of Management Review, 9(2), 193-206.
Hancock, J. I., Allen, D. G., Bosco, F. A., McDaniel, K. R., & Pierce, C. A. (2011). Meta-
analytic review of employee turnover as a predictor of firm performance. Journal of
Management, 39(3), 573-603.
Hannan, M. T., & Freeman, J. (1984). Structural inertia and organizational change. American
Sociological Review, 49(2), 149-164.
Hardin, J. W. (2005). Generalized Estimating Equations (GEE). Wiley Online Library.
Hausknecht, J. P., & Trevor, C. O. (2011). Collective turnover at the group, unit, and
organizational levels: Evidence, issues, and implications. Journal of Management, 37(1),
352-388.

210
Hausknecht, J. P., Trevor, C. O., & Howard, M. J. (2009). Unit-level voluntary turnover rates
and customer service quality: implications of group cohesiveness, newcomer
concentration, and size. Journal of Applied Psychology, 94(4), 1068-1075.
Heinrich, C. J. (1999). Do government bureaucrats make effective use of performance
management information? Journal of Public Administration Research and Theory, 9(3),
363 -394
Heinrich, C. J. (2002). Outcomes–based performance management in the public sector:
implications for government accountability and effectiveness. Public Administration
Review, 62(6), 712-725.
Heinrich, C. J., & Lynn, L. E. (2001). Means and Ends: A Comparative Study of Empirical
Methods for Investigating Governance and Performance. Journal of Public
Administration Research And Theory, 11(1), 109-138.
Hicklin, A., O'Toole, L. J., Jr., & Meier, K. J. (2008). Serpents in the sand: Managerial
networking and nonlinear influences on organizational performance. Journal of Public
Administration Research and Theory, 18(2), 253.
Hill, G. C. (2005). The effects of managerial succession on organizational performance. Journal
of Public Administration Research and Theory, 15(4), 585-597.
Hill, G. C. (2009). The effect of frequent managerial turnover on organizational performance: A
study of professional baseball managers. The Social Science Journal, 46(3), 557-570.
Holland, J. L., & Nichols, R. C. (1964). Explorations of a theory of vocational choice: A
longitudinal study of change in major field of study. The Personnel and Guidance
Journal, 43(3), 235-242.
211
Holzer, H. J., & LaLonde, R. J. (2000). Job change and job stability among less skilled young
workers. In D. Card & R. M. Blank (Eds.), Finding Jobs: Work and Welfare Reform (pp.
125-159). New York: The Russel Sage Foundation.
Hood, C. (1991). A public management for all seasons? Public Administration, 69(1), 3-19.
Hood, C., & Peters, G. (2004). The middle aging of new public management: Into the age of
paradox? Journal of Public Administration Research And Theory, 14(3), 267-282.
Huber, P. J. (1967). The behavior of maximum likelihood estimates under nonstandard
conditions. Paper presented at the Proceedings of the fifth Berkeley symposium on
mathematical statistics and probability.
Hughes, R. E. (2001). Deciding to leave but staying: Teacher burnout, precursors and turnover.
International Journal of Human Resource Management, 12(2), 288-298.
Huson, M. R., Malatesta, P. H., & Parrino, R. (2004). Managerial succession and firm
performance. Journal of Financial Economics, 74(2), 237-275.
Ingersoll, R. M. (2001). Teacher turnover and teacher Shortages: An organizational analysis.
American Educational Research Journal, 38(3), 499-534.
Jacobson, W. S., Rubin, E. V., & Selden, S. C. (2002). Examining training in large
municipalities: Linking individual and organizational training needs. Public Personnel
Management, 31(4), 485-506.
Johnston, J. M., & Romzek, B. S. (2008). Social welfare contracts as networks: The impact of
network stability on management and performance. Administration & Society, 40(2),
115-146.
Jones, C. B. (1990). Staff nurse turnover costs: Measurements and results. Journal of Nursing
Administration, 20(5), 27-32.

212
Judge, T. A., & Ilies, R. (2002). Relationship of personality to performance motivation: A meta-
analytic review. Journal of Applied Psychology, 87(4), 797-807.
Kellough, J. E., & Nigro, L. G. (2002). Pay for performance in Georgia: State government
employee perspectives on GeorgiaGain after 5 years. Review of Public Personnel
Administration, 22(2), 146-166.
Kellough, J. E., & Nigro, L. G. (2006). Dramatic reform in the public service: At-will
employment and the creation of a new public workforce. Journal of Public
Administration Research and Theory, 16(3), 447-466.
Kellough, J. E., & Osuna, W. (1995). Cross-agency comparisons of quit rates in the federal
service: Another look at the evidence. Review of Public Personnel Administration, 15(4),
58-68.
Kettl, D. F. (2000). The Global Public Management Revolution: A Report on the Transformation
of Governance. Washington, DC: Brookings Institution Press.
Kim, S. (2005). Factors affecting state government information technology employee turnover
intentions. The American Review of Public Administration, 35(2), 137-156.
Lan, Z., & Rainey, H. G. (1992). Goals, rules, and effectiveness in public, private, and hybrid
organizations: More evidence on frequent assertions about differences. Journal of Public
Administration Research And Theory, 2(1), 5-28.
Lankford, H., Loeb, S., & Wyckoff, J. (2002). Teacher sorting and the plight of urban schools: A
descriptive analysis. Educational Evaluation and Policy Analysis, 24(1), 37-62.
Leana, C. R., & Van Buren, H. J. (1999). Organizational social capital and employment
practices. Academy of Management Review, 24(3), 538-555.

213
Lee, G., & Jimenez, B. S. (2011). Does performance management affect job turnover intention in
the federal government? The American Review of Public Administration, 41(2), 168.
Lee, S. Y., & Whitford, A. B. (2008). Exit, voice, loyalty, and pay: Evidence from the public
workforce. Journal of Public Administration Research and Theory, 18(4), 647-671.
Lipsky, M. (1980). Street-Level Bureaucracy: Dilemmas of the Individual in Public Services.
New York: Russell Sage Foundation Publications.
Lipsky, M. (2010). Street-level bureaucracy: Russell Sage Foundation.
Locke, E. A., & Latham, G. P. (1990). A theory of goal setting & task performance: Prentice-
Hall, Inc.
Locke, E. A., & Latham, G. P. (2006). New directions in goal-setting theory. Current Directions
in Psychological Science, 15(5), 265-268.
Loeb, S., Darling-Hammond, L., & Luczak, J. (2005). How Teaching Conditions Predict Teacher
Turnover in California Schools. Peabody Journal of Education, 80(3), 44-70.
Lynn, J., L. E., Heinrich, C. J., & Hill, C. J. (2000). Studying Governance and Public
Management: Challenges and Prospects. Journal of Public Administration Research &
Theory, 10(2), 233-261.
Lynn, J., L. E., Heinrich, C. J., & Hill, C. J. (2002). Improving Governance: A New Logic for
Empirical Research. Washington, DC: Georgetown University Press.
Marburger, D. R. (2006). Does Mandatory Attendance Improve Student Performance? [Article].
Journal of Economic Education, 37(2), 148-155.
McDowell, A., & Cox, N. J. (2001). Logit transformation. from STATA: Data Analysis and
Statistical Software

214
McElroy, J. C., Morrow, P. C., & Rude, S. N. (2001). Turnover and organizational performance:
a comparative analysis of the effects of voluntary, involuntary, and reduction-in-force
turnover. Journal of Applied Psychology, 86(6), 1294-1299.
Meier, K. J., & Hicklin, A. (2008). Employee turnover and organizational performance: Testing
a hypothesis from classical public administration. Journal of Public Administration
Research and Theory, 18(4), 573-590.
Meier, K. J., & O'Toole, L. J., Jr. (2001b). Managerial strategies and behavior in networks: A
model with evidence from US public education. Journal of Public Administration
Research and Theory, 11(3), 271-294.
Meier, K. J., & O'Toole, L. J., Jr. (2002). Public management and organizational performance:
The effect of managerial quality. Journal of Policy Analysis and Management, 21(4),
629-643.
Meier, K. J., & O'Toole, L. J., Jr. (2003). Public management and educational performance: The
impact of managerial networking. Public Administration Review, 63(6), 689-699.
Meier, K. J., & O'Toole, L. J., Jr. (2009). The proverbs of new public management: Lessons
from an evidence-based research agenda. The American Review of Public Administration,
39(1), 4-22.
Meier, K. J., O'Toole, L. J., Jr., Boyne, G. A., & Walker, R. M. (2007). Strategic management
and the performance of public organizations: Testing venerable ideas against recent
theories. Journal of Public Administration Research and Theory, 17(3), 357-377.
Merwe, R. v. d., & Miller, S. (1975). The measure of labour turnover. In B. O. Pettman (Ed.),
Labour Turnover and Retention (pp. 1-30). New York: Halsted Press.

215
Miller, D. (1991). Stale in the saddle: CEO tenure and the match between organization and
environment. Management Science, 37(1), 34-52.
Miller, D. (1992). The Icarus paradox: How exceptional companies bring about their own
downfall. Business Horizons, 35(1), 24-35.
Miller, D. (1993). Some organizational consequences of CEO succession. Academy of
Management Journal, 36(3), 644-659.
Milward, H. B., & Provan, K. G. (2000). Governing the hollow state. Journal of Public
Administration Research and Theory, 10(2), 359-380.
Milward, H. B., & Provan, K. G. (2003). Managing the hollow state collaboration and
contracting. Public Management Review, 5(1), 1-18.
Mintzberg, H. (1979). The Structuring of Organizations: A Synthesis of the Research.
Englewood Cliffs, NJ: Prentice-Hall
Mobley, W. H. (1977). Intermediate linkages in the relationship between job satisfaction and
employee turnover. Journal of Applied Psychology, 62(2), 237-240.
Mobley, W. H. (1982). Some unanswered questions in turnover and withdrawal research.
Academy of Management Review, 7(1), 111-116.
Mobley, W. H., Griffeth, R. W., Hand, H. H., & Meglino, B. M. (1979). Review and conceptual
analysis of the employee turnover process. Psychological Bulletin, 86(3), 493-522.
Moskos, C. C. (1970). The American Enlisted Man: The Rank and File in Today's Military. New
York: Russell Sage Foundation
Moynihan, D. P., & Pandey, S. K. (2005). Testing how management matters in an era of
government by performance management. Journal of Public Administration Research
and Theory, 15(3), 421-439.

216
Moynihan, D. P., & Pandey, S. K. (2010). The big question for performance management: Why
do managers use performance information? Journal of Public Administration Research
and Theory, 20(4), 849-866
Moynihan, D. P., Pandey, S. K., & Wright, B. E. (2009). Pulling the levers: Leadership, public
service motivation and mission valence. Paper presented at the International Public
Service Research Conference Bloomington, IN.
Muchinsky, P. M., & Morrow, P. C. (1980). A multidisciplinary model of voluntary employee
turnover. Journal of Vocational Behavior, 17(3), 263-290.
Nickell, S. (1981). Biases in dynamic models with fixed effects. Econometrica: Journal of the
Econometric Society, 41(6), 1417-1426.
O'Reilly, C. A., Chatman, J., & Caldwell, D. F. (1991). People and organizational culture: A
profile comparison approach to assessing person-organization fit. Academy of
Management Journal, 34(3), 487-516.
O'Toole, L. J., Jr. (1997). Treating networks seriously: Practical and research-based agendas in
public ddministration. Public Administration Review, 57(1), 45-52.
O'Toole, L. J., Jr., & Meier, K. J. (1999). Modeling the impact of public management:
Implications of structural context. Journal of Public Administration Research and
Theory, 9(4), 505-526.
O'Toole, L. J., Jr., & Meier, K. J. (2003). Plus ça change: Public management, personnel
stability, and organizational performance. Journal Of Public Administration Research
And Theory, 13(1), 43-64.

217
O'Toole, L. J., Jr., & Meier, K. J. (2004a). Parkinson's law and the new public management?
Contracting determinants and service-quality consequences in public education. Public
Administration Review, 64(3), 342-352.
O'Toole, L. J., Jr., & Meier, K. J. (2004b). Public management in intergovernmental networks:
Matching structural networks and managerial networking. Journal of Public
Administration Research and Theory, 14(4), 469-494.
O’Toole, L. J., Jr., & Meier, K. J. (2003). Plus ça change: Public management, personnel
stability, and organizational performance. Journal of Public Administration Research and
Theory, 13(1), 43-64.
Oreg, S. (2003). Resistance to change: Developing an individual differences measure. Journal of
Applied Psychology, 88(4), 680-693.
Osborn, R. N., & Baughn, C. C. (1990). Forms of interorganizational governance for
multinational alliances. Academy of Management Journal, 33(3), 503-519.
Osborne, D. (1993). Reinventing government. Public Productivity & Management Review,
16(4), 349-356.
Osborne, D., & Gaebler, T. (1992). Reinventing Government: How the Entrepreneurial Spirit is
Transforming Government. New York: Plume.
Paarlberg, L. E., & Perry, J. L. (2007). Values management: Aligning employee values and
oganization goals. [Article]. American Review of Public Administration, 37(4), 387-408.
Park, S. M., & Rainey, H. G. (2008). Leadership and public service motivation in U.S. Federal
agencies. International Public Management Journal, 11(1), 109-142.

218
Parker, C. P., Baltes, B. B., Young, S. A., Huff, J. W., Altmann, R. A., Lacost, H. A., & Roberts,
J. E. (2003). Relationships between psychological climate perceptions and work
outcomes: A meta-analytic review. Journal of Organizational Behavior, 24(4), 389-416.
Perry, J. L. (1993). Strategic human resource management. Review of Public Personnel
Administration, 13(4), 59-71.
Peteraf, M. A. (1993). The cornerstones of competitive advantage: A resource-based view.
Strategic Management Journal, 14(3), 179-191.
Peters, B. G., & Pierre, J. (1998). Governance without government? Rethinking public
administration. Journal of Public Administration Research And Theory, 8(2), 223-243.
Peterson, S. J., & Luthans, F. (2006). The impact of financial and nonfinancial incentives on
business-unit outcomes over time. Journal of Applied Psychology, 91(1), 156-165.
Pfeffer, J., & Davis-Blake, A. (1986). Administrative succession and organizational
performance: How administrator experience mediates the succession effect. Academy of
Management Journal, 29(1), 72-83.
Pfeffer, J., & Salancik, G. R. (1978). The external control of organizations: A resource
dependence approach. New York: Harper and Row Publishers.
Piderit, S. K. (2000). Rethinking resistance and recognizing ambivalence: A multidimensional
view of attitudes toward an organizational change. Academy of Management Review,
25(4), 783-794.
Pitts, D., Marvel, J., & Fernandez, S. (2011). So hard to say goodbye? Turnover intention among
US federal employees. Public Administration Review, 71(5), 751-760.
Price, J. L. (1968). Organizational Effectiveness: An Inventory of Propositions. Homewood,
Illinois: RD Irwin.

219
Price, J. L. (1977). The Study of Turnover. Ames, Iowa: Iowa State University Press
Price, J. L. (1989). The impact of turnover on the organization. Work and Occupations, 16(4),
461-473.
Provan, K. G., & Milward, H. B. (1995). A preliminary theory of interorganizational network
effectiveness: A comparative study of four community mental health systems.
Administrative Science Quarterly, 40(1), 1-33.
Radin, B. (2006). Challenging the Performance Movement: Accountability, Complexity, and
Democratic Values. Washington, DC: Georgetown University Press.
Rainey, H. G., & Steinbauer, P. (1999). Galloping elephants: Developing elements of a theory of
effective government organizations. Journal of Public Administration Research and
Theory, 9(1), 1-32.
Rentsch, J. R. (1990). Climate and culture: Interaction and qualitative differences in
organizational meanings. Journal of Applied Psychology, 75(6), 668-681.
Rho, E. (2013). Contracting revisited: Determinants and consequences of contracting out for
public education services. Public Administration Review, 73(2), 327-337.
Riccucci, N. M., Rainey, H. G., & Thompson, J. (2006). Leadership and the transformation of a
major institution: Charles Rossotti and the Internal Revenue Service. Public
Administration Review, 66(4), 596-604.
Rizzo, J. R., House, R. J., & Lirtzman, S. I. (1970). Role conflict and ambiguity in complex
organizations. Administrative Science Quarterly, 15(2), 150-163.
Roseman, E. (1981). Managing Employee Turnover: A Positive Approach: AMACON.

220
Salamon, L. M. (1987). Of market failure, voluntary failure, and third-party government: Toward
a theory of government-nonprofit relations in the modern welfare state. Nonprofit and
Voluntary Sector Quarterly, 16(1), 29-49.
Samuel, P. J. (1969). Labour Turnover? Towards a Solution. London: Institute of Personnel
Management.
Sawyer, J. E. (1992). Goal and process clarity: Specification of multiple constructs of role
ambiguity and a structural equation model of their antecedents and consequences.
Journal of Applied Psychology, 77(2), 130-142.
Schick, A. (1974). The Trauma of Politics: National Association of Schools of Public Affairs and
Administration.
Schneider, B., & Bartlett, C. J. (1968). Individual differences and organziational climate: The
research plan and questionnaire development. Personnel Psychology, 21(3), 323-333.
Schultz, T. W. (1961). Investment in Human Capital. The American Economic Review, 51(1), 1-
17.
Selden, S. C., & Sowa, J. E. (2004). Testing a multi-dimensional model of organizational
performance: Prospects and problems. Journal of Public Administration Research and
Theory, 14(3), 395-416.
Sharfman, M. P., & Dean, J. W. (1991). Conceptualizing and measuring the organizational
environment: A multidimensional approach. Journal of Management, 17(4), 681-700.
Shaw, J. D., Duffy, M. K., Johnson, J. L., & Lockhart, D. E. (2005). Turnover, social capital
losses, and performance. Academy of Management Journal, 48(4), 594-606.

221
Shaw, J. D., Gupta, N., & Delery, J. E. (2005). Alternative Conceptualizations of the
Relationship between Voluntary Turnover and Organizational Performance. Academy of
Management Journal, 48(1), 50-68.
Siebert, W. S., & Zubanov, N. (2009). Searching for the optimal level of employee turnover: A
study of a large UK retail organization. Academy of Management Journal, 52(2), 294-
313.
Simon, H. A. (1946). The proverbs of administration. Public Administration Review, 6(1), 53-67.
Simon, H. A., & Barnard, C. I. (1976). Administrative behavior (3rd ed.). New York: Cambridge
University Press.
Starbuck, W. H. (1973). Organizations and Their Environments: International Institute of
Management.
StataCorp. (2013a). Stata 13 Base Reference Manual
StataCorp. (2013b). Stata Statistical Software: Release 13. College Station, TX: StataCorp LP.
Staw, B. M. (1980). The consequences of turnover. Journal of Occupational Behaviour, 1(4),
253-273.
Stazyk, E. C., & Goerdel, H. T. (2010). The benefits of bureaucracy: Public managers’
perceptions of political support, goal ambiguity, and organizational effectiveness Journal
of Public Administration Research and Theory, 21(4), 645-672.
Steel, R. P. (2002). Turnover theory at the empirical interface: Problems of fit and function.
Academy of Management Review, 27(3), 346-360.
Steers, R. M., Mowday, R. T., & Porter, L. W. (1979). Employee Turnover and Post Decision
Accommodation Processes. Eugene, Oregone: University of Oregon School of
Management and Business.

222
Sun, R., & Van Ryzin, G. G. (2012). Are performance management practices associated with
better public outcomes? Empirical evidence from New York public schools. The
American Review of Public Administration. doi: 10.1177/0275074012468058
Thaker, S., Steckler, A., Sánchez, V., Khatapoush, S., Rose, J., & Hallfors, D. D. (2008).
Program characteristics and organizational factors affecting the implementation of a
school-based indicated prevention program. Health Education Research, 23(2), 238-248.
Theobald, N. D. (1990). An examination of the influence of personal, professional, and school
district characteristics on public school teacher retention. Economics of Education
Review, 9(3), 241-250.
Thompson, J. D. (2003). Organizations in Action: Social Science Bases of Administrative
Theory. Edison, NJ: Transaction.
Thompson, J. D., & McEwen, W. J. (1958). Organizational goals and environment: Goal-setting
as an interaction process. American Sociological Review, 23(1), 23-31.
Thompson, J. D., Scott, W. R., & Zald, M. N. (2003). Organizations in action: Social science
bases of administrative theory: Transaction Books.
Ton, Z., & Huckman, R. S. (2008). Managing the impact of employee turnover on performance:
The role of process conformance. Organization Science, 19(1), 56-68.
Trottier, T., Van Wart, M., & Wang, X. H. (2008). Examining the nature and significance of
leadership in government organizations. Public Administration Review, 68(2), 319-333.
Twisk, J. W. (2013). Applied longitudinal data analysis for epidemiology: a practical guide:
Cambridge University Press.
Tziner, A., & Birati, A. (1996). Assessing employee turnover costs: A revised approach. Human
Resource Management Review, 6(2), 113-122.

223
Uyeki, E. S. (1960). Draftee behavior in the cold-war army. Social Problems, 8(2), 151-158.
Van Iddekinge, C. H., Ferris, G. R., Perrewé, P. L., Perryman, A. A., Blass, F. R., & Heetderks,
T. D. (2009). Effects of selection and training on unit-level performance over time: A
latent growth modeling approach. Journal of Applied Psychology, 94(4), 829-843.
Van Wart, M. (2003). Public-sector leadership theory: An assessment. Public Administration
Review, 63(2), 214-228.
Walker, R. M., Damanpour, F., & Devece, C. A. (2011). Management innovation and
organizational performance: The mediating effect of performance management. Journal
of Public Administration Research and Theory, 21(2), 367 -386
Walters, J. (2002). Life after civil service reform: The Texas, Georgia, and Florida experiences.
Human Capital Series. IBM Endowment for the Business of Government.
Weber, M. (1947). The Theory of Social and Economic Organization
Wernerfelt, B. (1984). A resource-based view of the firm. Strategic Management Journal, 5(2),
171-180.
Whetten, D. A. (1987). Organizational growth and decline processes. Annual Review of
Sociology, 13, 335-358.
White, H. (1980). A heteroskedasticity-consistent covariance matrix estimator and a direct test
for heteroskedasticity. Econometrica: Journal of the Econometric Society, 48(4), 817-
838.
Whitford, A. B. (2002a). Bureaucratic discretion, agency structure, and democratic
responsiveness: The case of the United States attorneys. Journal of Public Administration
Research and Theory, 12(1), 3-27.

224
Whitford, A. B. (2002b). Decentralization and political control of the bureaucracy. Journal of
Theoretical Politics, 14(2), 167-193.
Whitford, A. B., & Yates, J. (2003). Policy signals and executive governance: Presidential
rhetoric in the war on drugs. Journal of Politics, 65(4), 995-1012.
Williamson, O. E. (1976). The economics of internal organization: Exit and voice in relation to
markets and hierarchies. The American Economic Review, 87(3), 369-377.
Wright, B. E. (2001). Public-sector work motivation: A review of the current literature and a
revised conceptual model. Journal of Public Administration Research and Theory, 11(4),
559-586.
Wright, B. E., Moynihan, D. P., & Pandey, S. K. (2012). Pulling the levers: Transformational
leadership, public service motivation, and mission valence. Public Administration
Review, 72(2), 206-215.
Wright, B. E., & Pandey, S. K. (2008). Public service motivation and the assumption of person--
organization fit: testing the mediating effect of value congruence. Administration &
Society, 40(5), 502-521.
Wright, B. E., & Pandey, S. K. (2011). Public organizations and mission valence: When does
mission matter? Administration & Society, 43(1), 22-44.
Wright, P. M., & McMahan, G. C. (1992). Theoretical perspectives for strategic human resource
management. Journal of Management, 18(2), 295-320.
Wright, P. M., McMahan, G. C., & McWilliams, A. (1994). Human resources and sustained
competitive advantage: A resource-based perspective. International Journal of Human
Resource Management, 5(2), 301-326.

225
Zeger, S. L., & Liang, K. Y. (1986). Longitudinal data analysis for discrete and continuous
outcomes. Biometrics, 42(1), 121-130.
Zhu, L. (2013). Panel Data Analysis in Public Administration: Substantive and Statistical
Considerations. Journal of Public Administration Research and Theory, 23(2), 395-428.
doi: 10.1093/jopart/mus064
Zorn, C. J. W. (2001). Generalized estimating equation models for correlated data: A review
with applications. American Journal of Political Science, 45(2), 470-490.

226
APPENDIX A
NYC-DOE PARENT SURVEY INSTRUMENT45
45
All NYC-DOE parent surveys are available at http://schools.nyc.gov/Accountability/tools/survey/default.htm

227

228

229

230

231
APPENDIX B
NYC-DOE TEACHER SURVEY INSTRUMENT46
46
All NYC-DOE teacher surveys are available at http://schools.nyc.gov/Accountability/tools/survey/default.htm

232

233
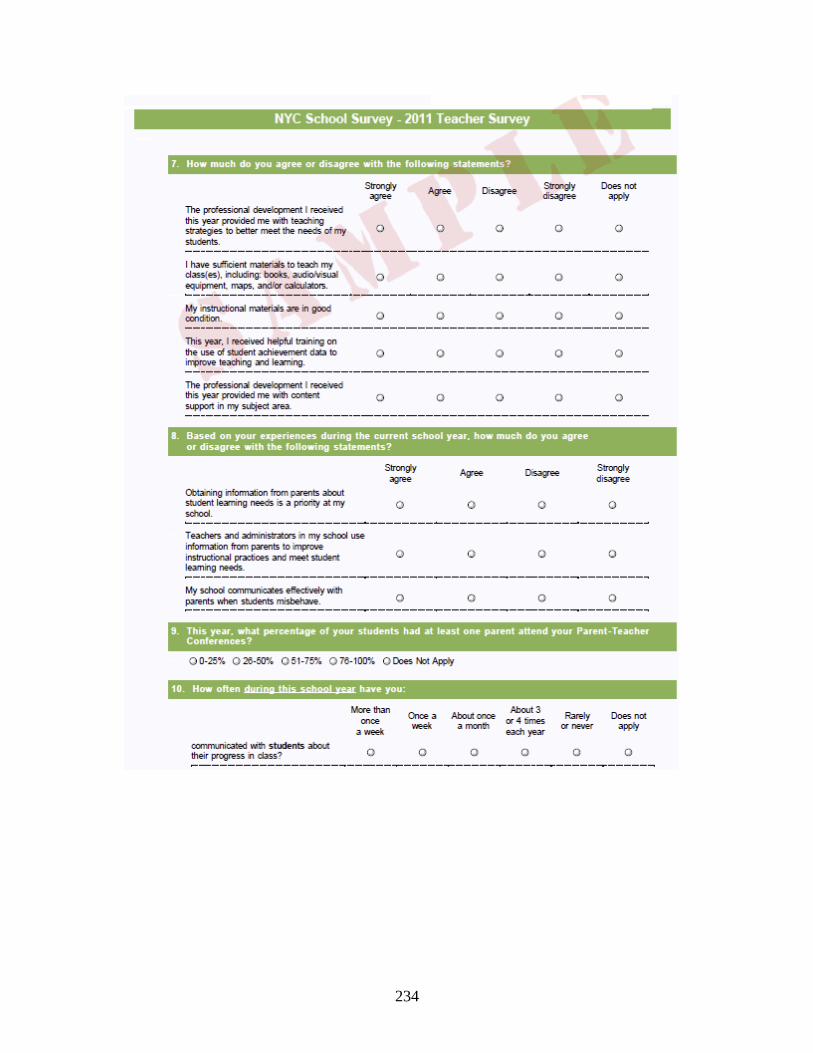
234

235

236
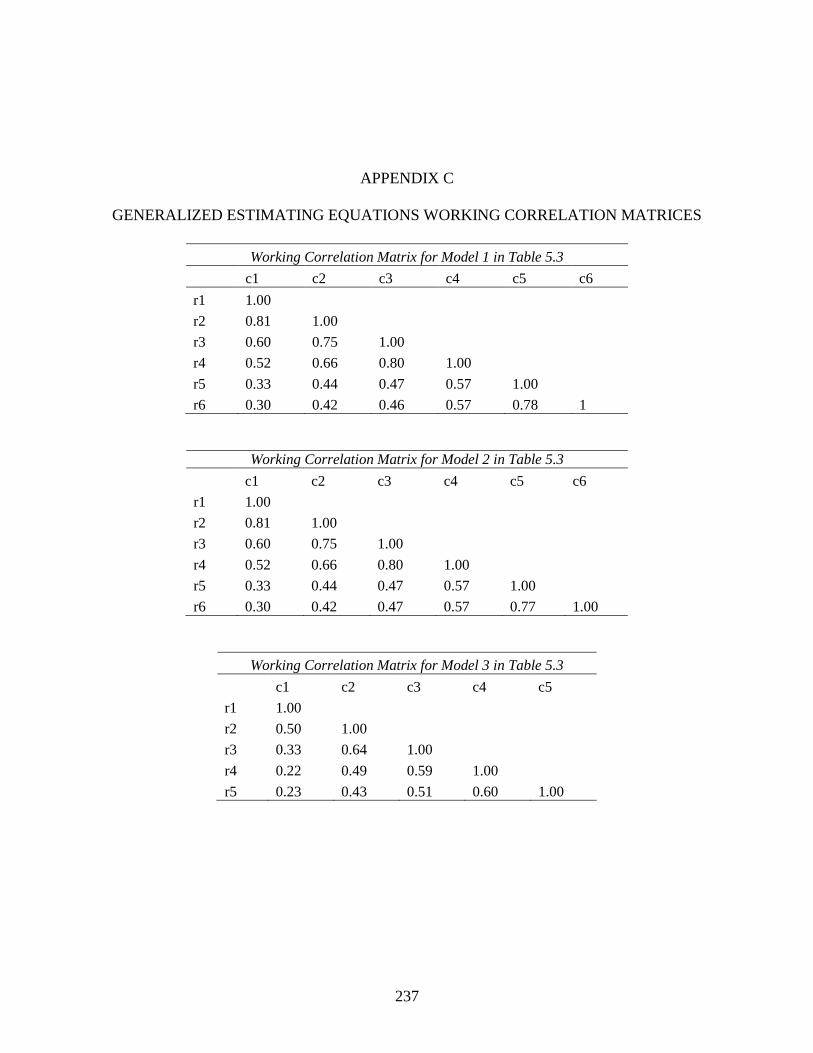
237
APPENDIX C
GENERALIZED ESTIMATING EQUATIONS WORKING CORRELATION MATRICES
Working Correlation Matrix for Model 1 in Table 5.3
c1 c2 c3 c4 c5 c6
r1 1.00
r2 0.81 1.00
r3 0.60 0.75 1.00
r4 0.52 0.66 0.80 1.00
r5 0.33 0.44 0.47 0.57 1.00
r6 0.30 0.42 0.46 0.57 0.78 1
Working Correlation Matrix for Model 2 in Table 5.3
c1 c2 c3 c4 c5 c6
r1 1.00
r2 0.81 1.00
r3 0.60 0.75 1.00
r4 0.52 0.66 0.80 1.00
r5 0.33 0.44 0.47 0.57 1.00
r6 0.30 0.42 0.47 0.57 0.77 1.00
Working Correlation Matrix for Model 3 in Table 5.3
c1 c2 c3 c4 c5
r1 1.00
r2 0.50 1.00
r3 0.33 0.64 1.00
r4 0.22 0.49 0.59 1.00
r5 0.23 0.43 0.51 0.60 1.00

238
Working Correlation Matrix for Model 4 in Table 5.3
c1 c2 c3 c4 c5
r1 1.00
r2 0.50 1.00
r3 0.33 0.64 1.00
r4 0.22 0.49 0.59 1.00
r5 0.23 0.44 0.51 0.60 1.00
Working Correlation Matrix for Model 3 in Table 5.4
c1 c2 c3 c4 c5 c6
r1 1.00
r2 0.72 1.00
r3 0.60 0.67 1.00
r4 0.25 0.40 0.49 1.00
r5 0.52 0.58 0.55 0.50 1.00
r6 0.58 0.59 0.56 0.43 0.84 1.00
Working Correlation Matrix for Model 4 in Table 5.4
c1 c2 c3 c4 c5 c6
r1 1.00
r2 0.72 1.00
r3 0.60 0.67 1.00
r4 0.26 0.40 0.49 1.00
r5 0.52 0.58 0.56 0.50 1.00
r6 0.58 0.59 0.56 0.43 0.85 1.00
Working Correlation Matrix for Table 5.5
c1 c2 c3 c4 c5
r1 1.00
r2 0.77 1.00
r3 0.68 0.81 1.00
r4 0.43 0.46 0.54 1.00
r5 0.40 0.44 0.53 0.73 1.00
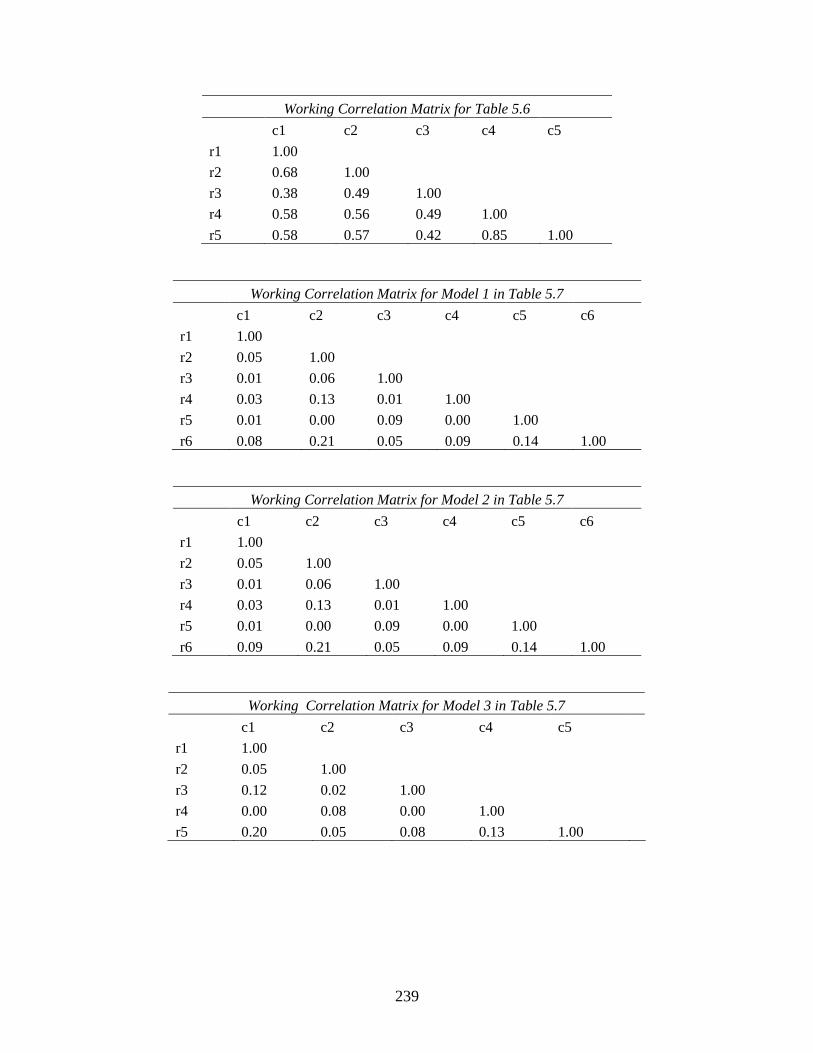
239
Working Correlation Matrix for Table 5.6
c1 c2 c3 c4 c5
r1 1.00
r2 0.68 1.00
r3 0.38 0.49 1.00
r4 0.58 0.56 0.49 1.00
r5 0.58 0.57 0.42 0.85 1.00
Working Correlation Matrix for Model 1 in Table 5.7
c1 c2 c3 c4 c5 c6
r1 1.00
r2 0.05 1.00
r3 0.01 0.06 1.00
r4 0.03 0.13 0.01 1.00
r5 0.01 0.00 0.09 0.00 1.00
r6 0.08 0.21 0.05 0.09 0.14 1.00
Working Correlation Matrix for Model 2 in Table 5.7
c1 c2 c3 c4 c5 c6
r1 1.00
r2 0.05 1.00
r3 0.01 0.06 1.00
r4 0.03 0.13 0.01 1.00
r5 0.01 0.00 0.09 0.00 1.00
r6 0.09 0.21 0.05 0.09 0.14 1.00
Working Correlation Matrix for Model 3 in Table 5.7
c1 c2 c3 c4 c5
r1 1.00
r2 0.05 1.00
r3 0.12 0.02 1.00
r4 0.00 0.08 0.00 1.00
r5 0.20 0.05 0.08 0.13 1.00

240
Working Correlation Matrix for Model 4 in Table 5.7
c1 c2 c3 c4 c5
r1 1.00
r2 0.05 1.00
r3 0.12 0.01 1.00
r4 0.00 0.08 0.00 1.00
r5 0.20 0.04 0.08 0.13 1.00
Working Correlation Matrix for Model 1 in Table 5.8
c1 c2 c3 c4 c5 c6
r1 1.00
r2 -0.12 1.00
r3 0.01 -0.02 1.00
r4 -0.01 -0.05 0.01 1.00
r5 -0.04 -0.08 -0.02 -0.08 1.00
r6 -0.10 0.01 0.03 0.01 -0.04 1.00
Working Correlation Matrix for Model 2 in Table 5.8
c1 c2 c3 c4 c5 c6
r1 1.00
r2 -0.12 1.00
r3 0.01 -0.02 1.00
r4 -0.01 -0.05 0.01 1.00
r5 -0.04 -0.08 -0.02 -0.08 1.00
r6 -0.10 0.02 0.03 0.01 -0.04 1.00
Working Correlation Matrix for Model 3 in Table 5.8
c6 c7 c8 c9 c10
r1 1
r2 -0.02 1.00
r3 -0.05 0.00 1.00
r4 -0.08 -0.02 -0.08 1.00
r5 0.00 0.04 0.01 -0.06 1.00

241
Working Correlation Matrix for Model 4 in Table 5.8
c1 c2 c3 c4 c5
r1 1.00
r2 -0.02 1.00
r3 -0.05 0.00 1.00
r4 -0.08 -0.02 -0.08 1.00
r5 -0.01 0.03 0.00 -0.05 1.00
Working Correlation Matrix for Model 1 in Table 6.1
c1 c2 c3 c4 c5
r1 1.00
r2 0.81 1.00
r3 0.67 0.80 1.00
r4 0.59 0.65 0.78 1.00
r5 0.52 0.53 0.65 0.81 1.00
Working Correlation Matrix for Model 2 in Table 6.1
c1 c2 c3 c4 c5
r1 1.00
r2 0.45 1.00
r3 0.21 0.56 1.00
r4 0.12 0.19 0.46 1.00
r5 0.09 0.13 0.23 0.58 1.00
Working Correlation Matrix for Model 3 in Table 6.1
c1 c2 c3 c4 c5
r1 1.00
r2 0.45 1.00
r3 0.23 0.36 1.00
r4 0.25 0.22 0.32 1.00
r5 0.13 0.07 0.20 0.30 1.00
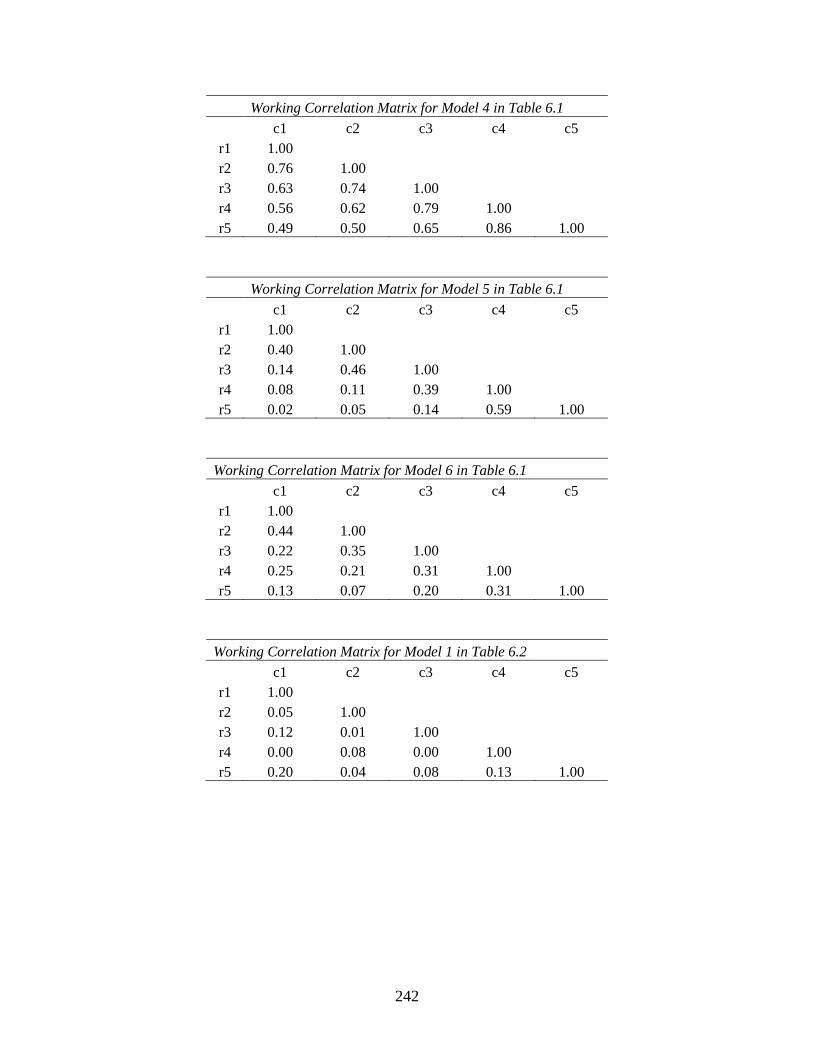
242
Working Correlation Matrix for Model 4 in Table 6.1
c1 c2 c3 c4 c5
r1 1.00
r2 0.76 1.00
r3 0.63 0.74 1.00
r4 0.56 0.62 0.79 1.00
r5 0.49 0.50 0.65 0.86 1.00
Working Correlation Matrix for Model 5 in Table 6.1
c1 c2 c3 c4 c5
r1 1.00
r2 0.40 1.00
r3 0.14 0.46 1.00
r4 0.08 0.11 0.39 1.00
r5 0.02 0.05 0.14 0.59 1.00
Working Correlation Matrix for Model 6 in Table 6.1
c1 c2 c3 c4 c5
r1 1.00
r2 0.44 1.00
r3 0.22 0.35 1.00
r4 0.25 0.21 0.31 1.00
r5 0.13 0.07 0.20 0.31 1.00
Working Correlation Matrix for Model 1 in Table 6.2
c1 c2 c3 c4 c5
r1 1.00
r2 0.05 1.00
r3 0.12 0.01 1.00
r4 0.00 0.08 0.00 1.00
r5 0.20 0.04 0.08 0.13 1.00

243
Working Correlation Matrix for Model 1 in Table 7.2
c1 c2 c3 c4 c5
r1 1.00
r2 0.61 1.00
r3 0.43 0.62 1.00
r4 0.38 0.51 0.67 1.00
r5 0.32 0.44 0.56 0.63 1.00
Working Correlation Matrix for Model 2 in Table 7.2
c1 c2 c3 c4 c5
r1 1.00
r2 0.56 1.00
r3 0.40 0.59 1.00
r4 0.34 0.49 0.65 1.00
r5 0.30 0.43 0.58 0.63 1.00
Working Correlation Matrix for Model 3 in Table 7.2
c1 c2 c3 c4 c5
r1 1.00
r2 0.51 1.00
r3 0.36 0.48 1.00
r4 0.32 0.42 0.51 1.00
r5 0.30 0.35 0.45 0.51 1.00
Working Correlation Matrix for Model 4 in Table 7.2
c1 c2 c3 c4 c5
r1 1.00
r2 0.66 1.00
r3 0.47 0.64 1.00
r4 0.40 0.50 0.61 1.00
r5 0.32 0.43 0.49 0.61 1.00

244
Working Correlation Matrix for Model 1 in Table 7.3
c1 c2 c3 c4 c5
r1 1.00
r2 0.50 1.00
r3 0.38 0.60 1.00
r4 0.32 0.51 0.66 1.00
r5 0.32 0.49 0.62 0.70 1.00
Working Correlation Matrix for Model 2 in Table 7.3
c1 c2 c3 c4 c5
r1 1.00
r2 0.59 1.00
r3 0.40 0.60 1.00
r4 0.35 0.46 0.58 1.00
r5 0.30 0.40 0.50 0.59 1.00
Working Correlation Matrix for Model 3 in Table 7.3
c1 c2 c3 c4 c5
r1 1.00
r2 0.53 1.00
r3 0.39 0.57 1.00
r4 0.30 0.48 0.57 1.00
r5 0.28 0.42 0.52 0.62 1.00
Working Correlation Matrix for Model 4 in Table 7.3
c1 c2 c3 c4 c5
r1 1.00
r2 0.65 1.00
r3 0.51 0.67 1.00
r4 0.40 0.54 0.66 1.00
r5 0.32 0.46 0.54 0.66 1.00

245
Working Correlation Matrix for Model 5 in Table 7.3
c1 c2 c3 c4 c5
r1 1.00
r2 0.67 1.00
r3 0.48 0.67 1.00
r4 0.39 0.54 0.65 1.00
r5 0.30 0.46 0.52 0.60 1.00
Working Correlation Matrix for Table 7.6
c1 c2 c3 c4 c5
r1 1.00
r2 0.62 1.00
r3 0.46 0.65 1.00
r4 0.37 0.53 0.65 1.00
r5 0.31 0.46 0.56 0.67 1.00
Working Correlation Matrix for Model 1 in Table 7.7
c1 c2 c3 c4 c5
r1 1.00
r2 0.69 1.00
r3 0.51 0.64 1.00
r4 0.47 0.51 0.57 1.00
r5 0.36 0.41 0.44 0.51 1.00
Working Correlation Matrix for Model 2 in Table 7.7
c1 c2 c3 c4 c5
r1 1.00
r2 0.63 1.00
r3 0.47 0.57 1.00
r4 0.40 0.46 0.54 1.00
r5 0.33 0.36 0.45 0.51 1.00

246
Working Correlation Matrix for Model 3 in Table 7.7
c1 c2 c3 c4 c5
r1 1.00
r2 0.49 1.00
r3 0.39 0.49 1.00
r4 0.36 0.45 0.47 1.00
r5 0.34 0.37 0.40 0.51 1.00
Working Correlation Matrix for Model 4 in Table 7.7
c1 c2 c3 c4 c5
r1 1.00
r2 0.57 1.00
r3 0.34 0.48 1.00
r4 0.40 0.39 0.51 1.00
r5 0.33 0.28 0.35 0.45 1.00
Working Correlation Matrix for Model 1 in Table 7.8
c1 c2 c3 c4 c5
r1 1.00
r2 0.47 1.00
r3 0.31 0.36 1.00
r4 0.25 0.31 0.40 1.00
r5 0.15 0.25 0.27 0.34 1.00
Working Correlation Matrix for Model 2 in Table 7.8
c1 c2 c3 c4 c5
r1 1.00
r2 0.57 1.00
r3 0.37 0.52 1.00
r4 0.32 0.40 0.42 1.00
r5 0.30 0.34 0.35 0.42 1.00
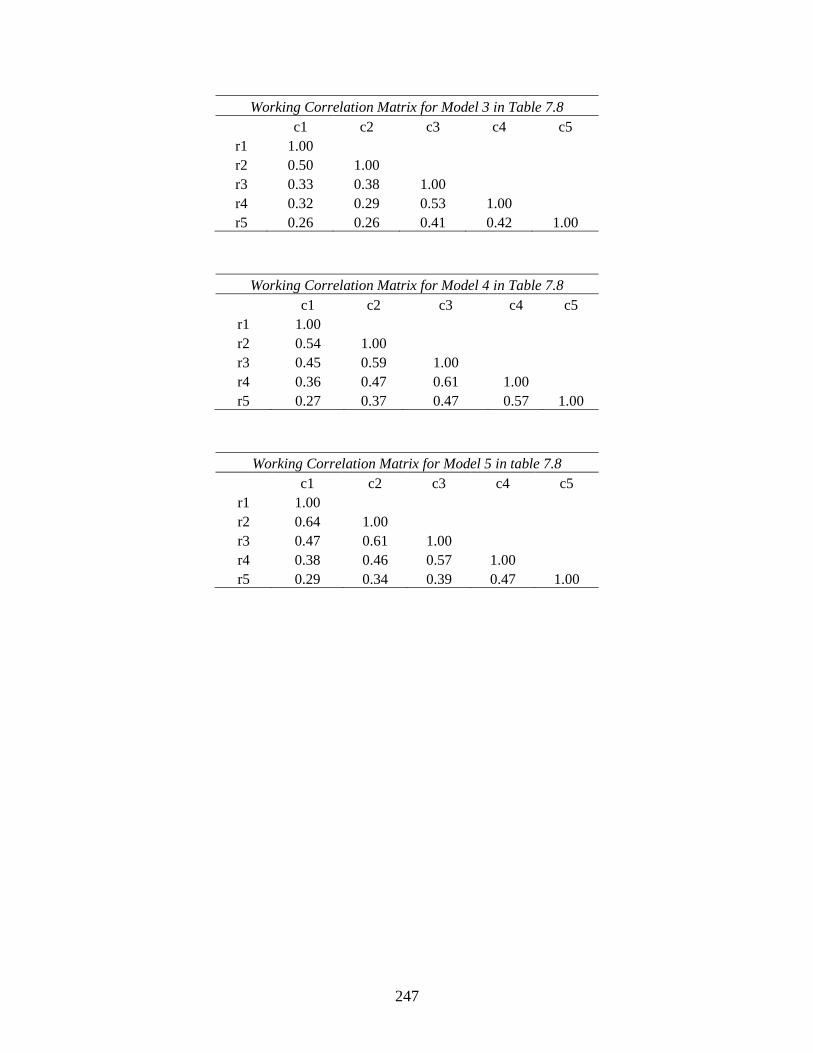
247
Working Correlation Matrix for Model 3 in Table 7.8
c1 c2 c3 c4 c5
r1 1.00
r2 0.50 1.00
r3 0.33 0.38 1.00
r4 0.32 0.29 0.53 1.00
r5 0.26 0.26 0.41 0.42 1.00
Working Correlation Matrix for Model 4 in Table 7.8
c1 c2 c3 c4 c5
r1 1.00
r2 0.54 1.00
r3 0.45 0.59 1.00
r4 0.36 0.47 0.61 1.00
r5 0.27 0.37 0.47 0.57 1.00
Working Correlation Matrix for Model 5 in table 7.8
c1 c2 c3 c4 c5
r1 1.00
r2 0.64 1.00
r3 0.47 0.61 1.00
r4 0.38 0.46 0.57 1.00
r5 0.29 0.34 0.39 0.47 1.00