an examination of individual and organizational factors
TRANSCRIPT

Louisiana State UniversityLSU Digital Commons
LSU Doctoral Dissertations Graduate School
2003
An examination of individual and organizationalfactors related to emotional laborRobin Hughes GosserandLouisiana State University and Agricultural and Mechanical College
Follow this and additional works at: https://digitalcommons.lsu.edu/gradschool_dissertations
Part of the Psychology Commons
This Dissertation is brought to you for free and open access by the Graduate School at LSU Digital Commons. It has been accepted for inclusion inLSU Doctoral Dissertations by an authorized graduate school editor of LSU Digital Commons. For more information, please [email protected].
Recommended CitationGosserand, Robin Hughes, "An examination of individual and organizational factors related to emotional labor" (2003). LSU DoctoralDissertations. 2079.https://digitalcommons.lsu.edu/gradschool_dissertations/2079

AN EXAMINATION OF INDIVIDUAL AND ORGANIZATIONAL FACTORS RELATED TO EMOTIONAL LABOR
A Dissertation
Submitted to the Graduate Faculty of the Louisiana State University and
Agricultural and Mechanical College in partial fulfillment of the
requirements for the degree of Doctor of Philosophy
in
The Department of Psychology
by Robin Hughes Gosserand
B.S., Louisiana State University, 1997 M.A., Louisiana State University, 1999
May 2003
ii
ACKNOWLEDGEMENTS
I would like to send a special thanks to all of those people who encouraged, supported,
and guided me throughout the years.
First, I would like to thank my doctoral committee, Dr. Irv Lane, Dr. Gary Greguras,
Dr. Janet McDonald, and Dr. Marcia Simmering, for their insightful contributions to my
dissertation. Also, my deepest gratitude goes to my chair, Dr. Jim Diefendorff, who always
challenged and motivated me and stretched me to my fullest potential. I enjoyed every
minute of working with him. Finally, thanks to the entire Psychology office, especially Sally
Allen and Chantelle Collier, for their gracious assistance in keeping me on track and in line
with all of the policies and deadlines throughout my years of graduate school.
I also wish to thank my I/O classmates who were there with me through the ups and
downs and helped make my graduate experience enjoyable. I look forward to our annual
reunions at SIOP for many years to come. A very special thanks to Paula Adams, Bobby
Baker, Aletta Barnard, Hope Ladner, and Keith McCook for their constant support and
encouragement and especially their friendship.
I would like to express my sincere gratitude to the Global Employee Research team at
IBM, particularly Lise Saari, Joe Colihan, Skip Dalessio, and Sara Weiner, for allowing me to
take days off to stay home and work on my dissertation and for holding me accountable
weekly by inquiring about the progress I was making on my dissertation. Without the support
of this team, I probably would not have been able to finish in the time period that I did. Also,
I would like to especially thank Mat Osicki, my officemate and friend, who was there for me
to vent to during the difficulties and to celebrate the small accomplishments along the way.

iii
Finally, I am forever grateful to my wonderful family, especially my parents, who
always helped me through the trying times and never failed to inspire and encourage me.
Last, but certainly not least, to my best friend and dear husband, John Lang Gosserand, thank
you so much for putting up with me during my emotional roller coasters, for always believing
in me and helping me to continue to believe in myself, and for your unconditional love and
support.

iv
TABLE OF CONTENTS
Acknowledgements…………………………………………………………………………….ii
List of Tables…………………………………………………………………………………..v
List of Figures…………………………………………………………………………….…...vi
Abstract……………………………………………………………………………………….vii
Introduction…………………………………………………………………………………….1
Method………………………………………………………………………………………..41
Results………………………………………………………………………………………...55
Discussion…………………………………………………………………………………….76
References…………………………………………………………………………………….98
Appendix A: Survey Measures…………………………………………………………..…106
Appendix B: Student Letter………………………………………………………………...110
Appendix C: Employee Letter…………………………………………………………...…112
Appendix D: Supervisor Letter……………………………………………………………..114
Appendix E: Item-Testlet Relationships……………………………………………………115
Appendix F: Jaccard and Wan’s (1995) Five Constraints for Interaction Analyses………..116
Vita…………………………………………………………………………………………..117

v
LIST OF TABLES
1. Fit Indices for Measurement Models with No Interaction Terms…………………….56
2. Fit Indices for Measurement Models with Interaction Terms………………………...60
3. Completely Standardized Indicator Loadings for the Final Measurement Model……62
4. Means, Standard Deviations, Reliabilities, and Intercorrelations Among Scales….…64
5. Fit Indices for Measurement Model and Structural Models………………………….67
6. Summary of Results by Hypothesis…………………………………………………..73

vi
LIST OF FIGURES
1. Hypothesized model of emotional labor………………………………………...……16
2. Hypothesized structural model……………………………………………………….66
3. Alternative structural model #1………………………………………………………69
4. Alternative structural model #2……………………………………………………....70

vii
ABSTRACT
Managing emotions in the workplace, termed emotional labor (Hochschild, 1983), is
becoming increasingly important as the economy continues to become more service-oriented.
Grandey (2000) defines emotional labor as the process of regulating feelings and expressions
of emotions in order to achieve organizational goals. The regulation of observable
expressions of emotions is known as surface acting, and the regulation of felt emotions is
called deep acting. The current study tested a model of emotional labor including factors
hypothesized to be related to surface acting and deep acting. Proposed antecedents include
perceived display rule demands, commitment to display rules, positive and negative
affectivity, perceived organizational support, and three service interaction characteristics
(frequency, duration, and task routineness). Outcomes of emotional labor include job
satisfaction and customer service performance. A total of 318 employee and supervisor dyads
were surveyed in order to examine the relationships among these constructs. Structural
equation modeling results showed that display rules for hiding negative emotions,
commitment to display rules, positive and negative affectivity, and duration of interactions
were all predictors of at least one of the emotional labor strategies. In addition, individuals
who are high on positive affectivity, low on negative affectivity, and feel supported by their
organizations are likely to be satisfied with their jobs. Finally, employees who surface act
tend to have lower job satisfaction, which in turn relates to their customer service
performance. Implications, limitations, and directions for future research are discussed.

1
INTRODUCTION
Emotions are a central part of everyday work life. Arvey, Renz, and Watson (1998)
suggested that, until recently, emotions in the workplace had not been studied much for two
major reasons. First, emotions had been considered the antithesis of rationality (Arvey et al.,
1998; Ashforth & Humphrey, 1993). That is, emotions were viewed as dysfunctional and
irrational, and treated as an interference to work (Ashforth & Humphrey, 1993). Emphasizing
rationality over emotionality led to the belief that emotions were disadvantageous and should
be removed or controlled. However, Ashforth and Humphrey (1993) argued that this belief is
simplistic and researchers should not ignore the role emotions play in organizational life. A
second reason emotions have not been studied much is that emotions, by their nature, are
challenging to study and measure (Arvey et al., 1998). Because emotions are subjective
feeling states (Ashforth & Humphrey, 1995), they are difficult to assess using common
organizational research tools. Since the publication of Hochschild’s 1983 book The Managed
Heart, there has been a growing interest in the role of emotions in the workplace, and research
regarding this topic has become rapidly more abundant in the past several years (e.g., Arvey
et al., 1998). Studying emotions and incorporating them into our theories may broaden our
understanding of organizational behavior (Fisher & Ashkanasy, 2000).
Research involving emotions in the workplace covers a wide range of domains, such
as the effects of mood on work-related outcomes (e.g., George & Brief, 1996), the importance
of emotional intelligence for individual success (e.g., Mayer & Salovey, 1995), and the
antecedents and consequences of workplace romance (e.g., Pierce, Byrne, & Aguinis, 1996).
Another area of emotion research that has increased rapidly in the past few years is the
management of emotions as part of the work role, which has been labeled emotional labor

2
(Hochschild, 1983). Many researchers share the view that managing emotional expressions is
important for successful performance in numerous jobs and that emotional displays have
become a marketplace commodity (Ashforth & Humphrey, 1993; Grandey, 2000; Hochschild,
1983; Morris & Feldman, 1996).
An important assumption of most research on emotional labor is that organizations
have display rules that serve as standards for the appropriate expressions of emotions
(Ashforth & Humphrey, 1993; Grandey, 2000; Hochschild, 1983; Morris & Feldman, 1996).
Display rules have been defined as standards of behavior that spell out which emotions are
appropriate in particular situations as well as how those emotions should be expressed to
others (Ekman, 1973). These rules may be explicitly stated in selection and training
materials, or may be derived from social, occupational, and organizational norms (Grandey,
2000; Rafaeli & Sutton, 1989). Emotional labor entails following these display rules
regardless of one’s felt (or experienced) emotions, which may involve enhancing an existing
emotion, faking an unfelt emotion, or suppressing a felt emotion (Grandey, 2000). For
example, customer service employees usually are expected to display positive emotions such
as cheerfulness, so they sometimes must enhance or fake these positive emotions in addition
to possibly suppressing negative emotions when they are not feeling so cheery. On the other
hand, bill collectors sometimes are required to display negative emotions such as angriness,
which also may involve enhancing an existing emotion or faking the expected emotion. The
main objective of displaying these emotions is to be effective on the job (Grandey, 2000).
The study of emotional labor is important because it is a part of any job requiring
interpersonal contact and it may impact many individual and organizational outcomes. On the
positive side, managing emotions consistent with display rules may lead to better job

3
performance as well as more effective interpersonal interactions and group functioning
(Adelmann, 1995; Ashforth & Humphrey, 1993; Arvey et al., 1998). However, emotional
labor has also been linked to some negative effects on employees, such as burnout, job stress,
and job dissatisfaction (Grandey, 2000; Hochschild, 1983; Morris & Feldman, 1996).
Because emotional labor is considered to be related to such important individual and
organizational outcomes, additional research on emotional labor and its antecedents and
consequences is needed.
The purpose of the current research is to test a portion of a model of emotional labor
developed by Grandey (2000) and to extend it in several ways. Antecedents proposed to be
related to emotional labor in the present study are perceived demands of display rules,
employee commitment to display rules, positive and negative affectivity, perceived
organizational support, and characteristics of interactions with customers (i.e., frequency,
duration, and task routineness). In addition, emotional labor is proposed to be related to
outcomes such as job satisfaction and customer service performance.
The organization of this paper is as follows. First, because several conceptualizations
of emotional labor exist in the literature, the four major models influencing this research are
discussed. Next, empirical evidence supporting the present study’s hypothesized model is
reviewed. Following this, the method and results of the study are presented. Finally, this
paper concludes with a discussion of the findings, including possible limitations and ideas for
future research.
Conceptualizations of Emotional Labor
Since the introduction of the concept of emotional labor by Hochschild in 1983, there
have been four main conceptualizations of emotional labor in the literature (Ashforth &

4
Humphrey, 1993; Grandey, 2000; Hochschild, 1983; Morris & Feldman, 1996). All four of
these perspectives agree that the management of emotions is an important aspect of work, and
that organizationally-derived display rules serve as a guide for displays of emotions on the
job. In addition, each of the four conceptualizations set forth individual and organizational
outcomes related to emotional labor. Despite the common ground these perspectives share,
there are some key differences among them that cause confusion in the literature. In an
attempt to shed light on these differences and build support for the model tested in the
proposed investigation, each of the main conceptualizations is now described.
Hochschild’s (1983) Conceptualization
In her book The Managed Heart about the management of human feelings and
emotions in organizations, Hochschild (1983) coined the term emotional labor. She defined
emotional labor as “the management of feeling to create a publicly observable facial and
bodily display” for a wage (Hochschild, 1983, p. 7). Hochschild (1983) argued that managing
emotions, which was once mostly done in the private sphere of people’s lives, is now a large
part of many people’s work lives. Specifically, many organizations include display rules as
part of the requirements of a job. For example, customer service providers are often required
to display happy and cheerful emotions in their interactions with customers in hopes of
delivering satisfactory customer service.
Borrowing from the dramaturgical perspective involving social interactions (Goffman,
1959), Hochschild (1983) suggested that the employee is the actor, the customer is the
audience, and the workplace serves as the stage upon which these interactions take place. She
argued that managing emotions may be accomplished by two basic methods: surface acting
and deep acting. Surface acting refers to the process of modifying one’s expressions, such as

5
putting on a smile despite feelings of negativity. Deep acting refers to the process of actually
trying to change one’s feelings, rather than simply the surface appearance, in order to display
the appropriate emotions. Employees may have to engage in one of these two methods to
meet the display rule demands of an organization (Hochschild, 1983).
One of Hochschild’s (1983) main arguments is that emotional labor leads to primarily
negative outcomes, such as job stress and burnout. She suggested that one primary cause of
these negative outcomes is the presence of emotional dissonance, which occurs when a person
must display emotions that are inconsistent with his/her true feelings. It is important to note
that emotional dissonance is primarily associated with surface acting in that employees are
only modifying their expressions and not their actual emotions, as with deep acting
(Hochschild, 1983). In addition to emotional dissonance, the exertion of effort caused by
constantly having to regulate emotions on the job may have detrimental effects on employees
(Hochschild, 1983). Both surface acting and deep acting are considered effortful. The
negative effects of emotional labor were illustrated in a qualitative study involving flight
attendants and bill collectors, in which Hochschild (1983) reported that emotional labor led to
such outcomes as substance abuse, headaches, and absenteeism.
Coming from a sociological perspective, Hochschild (1983) operationalized emotional
labor by categorizing jobs based on their emotional labor requirements (e.g., jobs involving
frequent customer interactions and display rules for emotions). Jobs were included in the
taxonomy based on meeting three job characteristics criteria: (a) the presence of voice or
facial contact with the public, (b) a requirement for the worker to produce an emotional state
in a client or customer, and (c) the employer exercises a degree of control over the emotional
activities of employees. Using these criteria, Hochschild (1983) identified 44 jobs involving

6
emotional labor across the following six main occupational groups: (a) professional and
technical workers (e.g., lawyers, physicians), (b) managers and administrators, (c) sales
workers, (d) clerical workers, (e) service workers who work inside private households (e.g.,
housekeepers), (f) and service workers who work outside private households (e.g., waiters,
hairdressers).
Although Hochschild (1983) discussed surface acting and deep acting as key features
of emotional labor, her operationalization does not directly incorporate these concepts.
Instead, she categorized jobs as either having or not having emotional labor requirements
(e.g., Wharton, 1993). The primary problems with this approach are that it (a) assumes that
all jobs within a category have the same emotional demands, and (b) ignores the person and
how he or she would perceive and respond to emotional display requirements. In addition,
relevant organizational variables, job-specific variables, and other contextual factors are
ignored. Hochschild (1983) herself recognized that this taxonomy of jobs is not sufficient in
obtaining a full understanding of emotional labor in the workplace stating that it is “...no more
than a sketch, a suggestion of a pattern that deserves to be examined more closely” (p. 234).
Using this dichotomous operationalization, Wharton (1993) found no significant relationship
between emotional labor and emotional exhaustion, but did find a significant negative
relationship between emotional labor and job satisfaction (i.e., individuals in jobs categorized
as involving high levels of emotional labor reported lower satisfaction than those in jobs
involving low levels of emotional labor).
Ashforth and Humphrey’s (1993) Conceptualization
Ashforth and Humphrey (1993) defined emotional labor as the act of expressing
expected emotions during service interactions. Similar to Hochschild’s (1983) work, these

7
researchers stated that emotional labor may be considered a type of impression management
in that employees attempt to portray certain perceptions of themselves to others. Ashforth and
Humphrey (1993) agreed that in doing this, employees must sometimes surface act or deep act
in order to express the expected emotions.
However, Ashforth and Humphrey (1993) took the definition of emotional labor a step
further by including a third category of emotional labor (beyond surface acting and deep
acting) called expression of genuine emotion. These researchers stated that conceptualizing
emotional labor as surface acting and deep acting alone dismisses the possibility of employees
spontaneously and genuinely experiencing and displaying appropriate emotions. For instance,
a social worker may truly feel sympathetic towards an abused child and, therefore, has no
need to surface act or deep act. These researchers view this genuine emotional expression as
emotional labor in that the person still is displaying the organizationally desired emotions
(Ashforth & Humphrey, 1993).
Ashforth and Humphrey (1993) also discussed the role of effort in emotional labor.
They believe that surface acting and deep acting can be effortful, but in some cases (due to the
repetitive and habitual nature of many service interactions) these emotional labor strategies
may become routine or proceduralized and develop into an effortless process. Together, the
ideas that sometimes individuals can express genuine emotions and that some emotional labor
can be effortless imply that the requirements to display particular emotions may be less
stressful and have fewer negative effects than previously thought (e.g., Hochschild, 1983).
A key contribution of Ashforth and Humphrey’s (1993) theory of emotional labor is
their emphasis on the observable expressions of emotions rather than the internal management
of emotions. Therefore, although they discussed surface acting and deep acting, they focused
8
on the outcomes of these processes instead of the actual processes themselves. They argued
that surface acting and deep acting by themselves focus on the effort of trying to express the
desired emotions, and ignore the outcomes such as how genuine or sincere the emotion
appears to customers and the effects this effort has on customers (Ashforth & Humphrey,
1993).
Ashforth and Humphrey’s (1993) perspective also considered the outcomes of
emotional labor. They stated that one of the main reasons their operationalization of
emotional labor focuses on observable behavior rather than internal emotions is that the actual
behavior is what influences customers. Although these researchers acknowledged that
emotional labor may lead to emotional dissonance and self-alienation if a discrepancy exists
between expected emotions and felt emotions, they emphasized the positive effects of
managing visible displays of emotions on task effectiveness and self-expression.
Furthermore, they proposed that these visible displays must be perceived as sincere by others
in order to be effective. This is a more optimistic view than Hochschild’s (1983), which
focused on the negative effects of emotional labor on employees’ health and job stress.
Morris and Feldman’s (1996) Conceptualization
Morris and Feldman (1996) defined emotional labor as the effort, planning, and
control required to display the organizationally appropriate emotions during interpersonal
interactions. One unique feature of Morris and Feldman’s (1996) theory of emotional labor
involves the role of effort. Contrary to Ashforth and Humphrey (1993), they argued that even
when no discrepancy exists between an employee’s felt emotion and the organizational
display rules, some effort (though not as much if a discrepancy exists) still is needed to ensure
that the felt emotion is expressed in an organizationally desired fashion.

9
Similar to the works of Hochschild (1983) and Ashforth and Humphrey (1993), Morris
and Feldman’s (1996) conceptualization of emotional labor stems from an interactionist
perspective whereby importance is given to individual characteristics and work-related
environmental factors in determining the individual’s expression of emotion. This
perspective recognizes that although individuals can manage their emotions, the
appropriateness of any given emotional display is at least somewhat defined by environmental
factors. Morris and Feldman (1996) proposed a model of emotional labor, in which they
explicitly identified many work-related factors influencing emotional labor, such as the
explicitness of display rules and task routineness (i.e., routineness of interactions).
In addition, Morris and Feldman (1996) proposed four dimensions of emotional labor
focusing on characteristics of the work situation. The first dimension is the frequency of the
emotional display, which is basically equivalent to how often employees and other individuals
(e.g., customers or clients) interact. Morris and Feldman (1996) stated that the more often
individuals interact with others, the more they must conform to organizational display rules,
resulting in higher emotional labor requirements. The second dimension is the attentiveness
to required display rules, which consists of the duration and intensity of required emotional
displays. The longer the emotion is to be displayed and the stronger the emotion to be
displayed, the more attention a person must pay to managing his or her emotions (Morris &
Feldman, 1996). The third dimension is the variety of emotions required to be expressed.
The larger the number of emotions to be expressed, the greater the need for emotional labor
(Morris & Feldman, 1996). The fourth dimension is emotional dissonance, which as
mentioned previously, occurs when conflict exists between organizationally desired emotions
and an individual’s felt emotions. When display rules and feelings are incongruent, more
10
emotional labor is required (Morris & Feldman, 1996). Morris and Feldman (1996) proposed
that increases in all four dimensions of emotional labor leads to greater emotional exhaustion,
but only emotional dissonance impacts job satisfaction.
In addition to these dimensions of emotional labor, Morris and Feldman (1996)
identified many possible individual difference variables, job characteristics, and
organizational characteristics that may serve as antecedents of emotional labor. Some of the
proposed individual difference antecedents include gender and positive and negative
affectivity. For example, it is hypothesized that individuals high on negative affectivity
experience more emotional dissonance when the display rules require the expression of
positive emotion because there is less congruence between felt emotions and organizationally
desired emotions (Morris & Feldman, 1996). Job-related antecedents include factors such as
task routineness and job autonomy. For instance, job autonomy is proposed to be negatively
related to emotional dissonance because individuals with more job autonomy may have more
flexibility in meeting display rule requirements, enabling them to utilize their own
interpersonal style and reduce the amount of dissonance (Morris & Feldman, 1996).
Organizational antecedents include such variables as explicitness of display rules and
closeness of monitoring by supervisors, both of which are hypothesized to be positively
related to frequency of emotional displays.
Morris and Feldman (1997) tested part of their proposed model (Morris & Feldman,
1996). In this study, they conceptualized emotional labor as the frequency of interactions,
duration of interactions, and emotional dissonance. They found that task routineness, power
of role recipients (i.e., people who are targets of the emotional expressions), and job
autonomy were most highly related to emotional labor. Specifically, task routineness was

11
positively correlated with frequency of emotional labor and emotional dissonance, and
negatively correlated with duration. Power of role recipients was positively related to
frequency, and job autonomy was negatively related to emotional dissonance. Of the
emotional labor dimensions, emotional dissonance accounted for the most variance in the
consequences of emotional labor, having a positive relationship with emotional exhaustion
and a negative relationship with job satisfaction (Morris & Feldman, 1997).
Grandey’s (2000) Conceptualization
Grandey (2000) defined emotional labor as the process of regulating feelings and
expressions of emotions in order to achieve organizational goals. Drawing upon Hochschild’s
(1983) work, she suggested that this regulation of emotions consists of both surface acting
(the regulation of observable expressions of emotions) and deep acting (the regulation of felt
emotions). This way of conceptualizing emotional labor incorporates more of an internal
emotion regulation approach, rather than focusing on occupational categorization
(Hochschild, 1983), observable expressions of emotions (Ashforth & Humphrey, 1993),
characteristics of the situation (Morris & Feldman, 1996), or emotional dissonance (Morris &
Feldman, 1996).
In addition, Grandey (2000) proposed an integrative model of emotional labor from
the works of Hochschild (1983), Morris and Feldman (1996), and Ashforth and Humphrey
(1993). For instance, she argued that characteristics of the job (e.g., frequency, duration,
variety), which are a major part of Morris and Feldman’s (1996) definition of emotional labor,
may serve more appropriately as antecedents of emotional labor. Furthermore, observable
expressions of emotions, part of Ashforth and Humphrey’s (1993) definition, are more likely

12
to be proximal goals of emotional labor (measured as part of performance) with gaining loyal
customers as the more distal goal (Grandey, 2000).
Grandey’s (2000) model of emotional labor includes situational, individual, and
organizational factors influencing emotional labor, as well as long-term consequences of
emotional labor. Situational antecedents of emotional labor include interaction expectations
(consisting of the frequency, duration, and variety of interactions, as well as the display rules)
and emotional events (positive and negative events). Individual difference antecedents
include gender, emotional expressivity, emotional intelligence, and affectivity.
Organizational factors included in her model are job autonomy, supervisor support, and
coworker support. Grandey (2000) identified burnout, job satisfaction, job performance, and
withdrawal behavior as consequences of emotional labor.
The primary contribution of Grandey’s (2000) model is that she highlighted the
importance of surface acting and deep acting in the emotional labor process. There are three
main advantages of defining emotional labor in terms of surface acting and deep acting
(Grandey, 2000). First, by focusing on surface acting and deep acting as two distinct methods
for performing emotional labor, it is possible for emotional labor to have both positive and
negative outcomes. For instance, surface acting may be negatively related to job satisfaction
due to the dissonance that individuals may experience, whereas deep acting may be positively
related to job satisfaction because those individuals may feel a sense of personal
accomplishment in effectively displaying the appropriate emotions. This conceptualization is
counter to previous thinking where emotional labor is viewed as resulting in primarily
negative outcomes (e.g., definition of emotional labor as emotional dissonance where results
are inherently negative) (Abraham, 1998; Hochschild, 1983; Morris & Feldman, 1996).

13
Second, this conceptualization of emotional labor as the internal regulation of
emotions suggests that engaging in emotional labor involves skills that can be learned.
Therefore, individuals can be trained on strategies to manage their emotions and display the
appropriate emotions in specific circumstances. For example, if organizations believe that
deep acting is more effective in providing good customer service than surface acting, they
may want to train employees on how to engage in deep acting. In addition, employees can be
trained to engage in either deep acting or surface acting depending on the situational
requirements. That is, characteristics of the situation may dictate which emotion regulation
technique is needed. For instance, physicians must sometimes be cautious in becoming too
emotionally involved with patients to avoid burnout. Therefore, it may be advantageous for
them to be trained to surface act in order to remain detached.
Finally, conceptualizing emotional labor as surface acting and deep acting has roots in
an established theoretical model of emotion regulation (Gross, 1998a, 1998b). According to
Gross’ (1998a) model, emotion regulation is defined as “the processes by which individuals
influence which emotions they have, when they have them, and how they experience and
express these emotions” (Gross, 1998b, p.275). Gross (1998a, 1998b) proposed a model of
emotion regulation, in which emotional cues from the environment lead to an individual’s
emotional response tendencies (behavioral, experiential, and physiological). Furthermore,
these emotional response tendencies may be modified or regulated, which determines the final
emotional responses and expressions (Gross, 1998a, 1998b). According to Gross, emotions
may be regulated either at the input from the environment (antecedent-focused emotion
regulation) or at the output after emotion response tendencies have been triggered (response-

14
focused emotion regulation). Grandey (2000) argued that these two types of emotion
regulation correspond to deep acting and surface acting, respectively.
Antecedent-focused emotion regulation occurs when an individual modifies the
situation or the perception of the situation in an attempt to alter his or her felt emotions
(Gross, 1998a, 1998b). It is similar to deep acting in that it focuses on modifying feelings,
which subsequently impacts expressions (Grandey, 2000). Gross (1998b) identified four
different types of strategies that could be used to engage in antecedent-focused emotion
regulation: situation selection (choosing or avoiding certain situations), situation modification
(physically changing the situation), attentional deployment (changing the focus of one’s
attention in the situation), and cognitive change (reappraising the situation so it is interpreted
differently). The first two involve changing the situation, and the second two involve
changing one’s perception of the situation. Because many jobs involving emotional labor
(e.g., customer service jobs) do not have much flexibility regarding the situation, situation
selection and modification are not as relevant to emotional labor as the remaining two
strategies (Grandey, 2000). Specifically, attentional deployment refers to changing the
attentional focus of personal thoughts about the situation, and may involve such strategies as
calling to mind events that bring about the emotions needed in a certain situation (e.g.,
thinking about a fun wedding to produce positive thoughts) (Gross, 1998b). Cognitive change
refers to changing the appraisal of the situation, and may involve interpreting events more
positively than they are in actuality (e.g., telling oneself that the irate customer is just having a
bad day and is usually a nice person) (Gross, 1998b).
Response-focused emotion regulation, or response modulation, occurs once an
emotional response tendency has been initiated, and the individual must modify his or her

15
emotional expression instead of attempting to alter actual feelings (Gross, 1998b). This type
of emotion regulation is similar to surface acting in that it involves managing observable
expressions of emotions (Grandey, 2000). This technique may be performed by adjusting the
intensity of the expressed emotion or by completely faking emotional expressions.
Given the advantages of conceptualizing emotional labor as surface acting and deep
acting, the present research adopts this perspective. This study’s proposed model is presented
next.
The Present Investigation
Building on the work of Grandey (2000) and other researchers, the current study
examines several antecedents and consequences of emotional labor. The proposed
antecedents include perceived display rule demands, employee commitment to display rules,
positive and negative affectivity, perceived organizational support, and characteristics of the
service interaction (frequency, duration, and task routineness). In addition, the effects of
emotional labor on job satisfaction and customer service performance are examined. These
hypothesized links are represented by solid lines in Figure 1. Dashed lines represent
alternative paths, which are described in more detail in a later section.
Perceived Display Rule Demands
Display rules refer to the organizational expectations about the appropriate emotional
expressions on the job. Perceptions of display rules may develop from social, occupational,
and organizational norms (Grandey, 2000; Rafaeli & Sutton, 1989). Rafaeli and Sutton
(1987) identified three aspects of the organization that create and maintain these norms. First,
recruitment and selection processes may be used to seek and hire people who seem likely to
be able to display the organizationally desired emotions. In addition, socialization practices

16
DR
COMM
PA
NA
POS
FREQ
DUR
ROUT
SA
DA
SAT
CSP
Figure 1. Hypothesized model of emotional labor. Alternative hypotheses are represented with dashed arrows. DR = display rule demands; COMM = commitment to display rules; DRCOM = DR*COMM product term for testing interactions; PA = positive affectivity; NA = negative affectivity; POS = perceived organizational support; FREQ = frequency of interactions; DUR = duration of interactions; ROUT = task routineness; SA = surface acting; DA = deep acting; SAT = job satisfaction; CSP = customer service performance.
DRCOM
PA
H1a (+)
H1b (+) H2a (+)
H2b (+)
H2c
H3a (-)
H3b (-) H3c (+)
H3d (+) H4a (+)
H4b (+) H5a (+)
H5b (+)
H6a (-) H6b (+)
H7a (+)
H7b (-)
H8a (-)
H9a (-)
H8b (+)
H9b (+)
AH13 (+)
AH10a (+)
AH10b (+)
AH11a (-)
AH11b (-)
AH12a (+)
AH12b (+)

17
(e.g., handbooks, training) are a good way to teach employees which emotions should and
should not be displayed in various situations. Finally, rewards and punishments (e.g., through
the use of performance appraisals) are a third way organizations may maintain the desired
expressions of emotions.
Three main types of emotional displays have been proposed in the literature (Wharton
& Erickson, 1993). First, integrative emotional displays refer to expressing positive
emotions, such as cheerfulness, which many customer service employees must display.
Second, differentiating emotional displays refer to displaying negative emotions, such as fear
or anger, which bill collectors must sometimes express. Third, emotional masking refers to
expressing neutral emotions, which judges and therapists must often portray. To be consistent
with most customer service jobs, this study focuses on display rules to express integrative (or
positive) emotions and to hide or suppress differentiating (or negative) emotions. Because
few service jobs have rules to express neutral emotions, this category of displays is not
examined.
There is some research examining the relationship between display rules and
emotional labor (Brotheridge & Grandey, 2002; Grandey, in press; Grandey, 2002; Morris &
Feldman, 1996; Schaubroeck & Jones, 2000). Morris and Feldman (1996) proposed a
positive relationship between the explicitness of display rules and the frequency of emotional
displays during interactions. They argued that organizations are more likely to try to control
employees’ emotional behavior through explicit display rules when there is a high frequency
of contact with customers. However, these researchers did not support their hypothesis in an
empirical study (Morris & Feldman, 1997). In fact, they found a significant negative
relationship between these variables in that the more explicit the display rules, the lower the

18
frequency of emotional displays during interactions (Morris & Feldman, 1997). They
attempted to explain this unpredicted relationship by stating that more senior employees may
know the display rules but have work roles in which fewer interactions with customer occur.
In support of this explanation, there was a positive relationship between job tenure and
explicitness of display rules and a negative relationship between job tenure and frequency of
emotional labor.
Schaubroeck and Jones (2000) explored the relationship between an occupational
categorization of emotional labor, similar to Hochschild’s (1983) taxonomy, and individuals’
perceptions of role expectations to express positive and suppress negative emotions. These
authors hypothesized that whether or not individuals’ occupations required interpersonal
interaction would be related to their perceptions of demands to express positive and suppress
negative emotions. They found that individuals whose occupations required higher levels of
interpersonal interaction perceived higher demands to express positive emotions, but did not
perceive greater demands to suppress negative emotions (Schaubroeck & Jones, 2000). This
latter non-significant relationship may be due to a restriction of range of display rules for
suppressing negative emotions in that all employees were from the same organization, which
may have had strict norms against displaying negative emotions.
Similarly, Diefendorff and Richard (in press) examined the relationship between job-
based interpersonal requirements and perceived display rule demands, yet unlike Schaubroeck
and Jones (2000), these researchers found significant and positive relationships for demands
for both expressing positive and suppressing negative emotions. Whereas Schaubroeck and
Jones (2000) asked participants to pick their job category from a list of 35 occupations,
Diefendorff and Richard (in press) used a more objective measure of job-based interpersonal

19
requirements (i.e., participants indicated the type of company for which they worked and
described their jobs by listing their primary duties in order of importance, and then trained
individuals rated each person’s job based on the interpersonal requirements). This type of
measure perhaps provided finer distinctions in interpersonal requirements than simply picking
an occupation, which may help explain their significant findings. In addition, Diefendorff and
Richard (in press) sampled across a variety of occupations and organizations, which decreased
the possibility for range restriction due to the norms of a single organization.
Brotheridge and Grandey (2002) and Grandey (in press, 2002) specifically examined
the relationship between display rules (expressing positive and hiding negative emotions) and
emotional labor (surface acting and deep acting). These researchers found significant positive
correlations between the perceived display rules (demands for expressing positive emotions
and hiding negative emotions) and the amounts of surface acting and deep acting performed
(Brotheridge & Grandey, 2002; Grandey, in press, 2002). Therefore, it appears that if an
individual perceives high demands to express positive or hide negative emotions, he or she
may be more likely to engage in emotional labor via surface or deep acting. Interestingly, in
Brotheridge and Grandey’s (2002) research, surface acting was more strongly related to
display rules requiring the hiding of negative emotions, whereas deep acting was more
strongly related to display rules requiring the expression of positive emotions (Note: Grandey,
in press, 2002, only examined a measure of display rules that combines these perceptions). It
appears that the type of emotion regulation undertaken (i.e., surface acting or deep acting)
may depend somewhat on whether expressing positive emotions or hiding negative emotions
is needed to display the appropriate emotions. Because deep acting often involves thinking
positive thoughts (e.g., when jobs are customer-based) or cognitively reappraising the

20
situation in order to genuinely feel a desired emotion, it seems reasonable to argue that this
type of emotional labor is more consistent with the expression of emotions than with hiding
emotions. In addition, surface acting often involves hiding one’s true feelings and faking an
unfelt emotion, and therefore, may be more likely to relate to display rule demands for hiding
negative emotions rather than expressing positive emotions. In general, it is proposed that the
greater one’s perception of display rule demands, the more emotional labor is performed.
However, the following specific predictions are made also.
Hypothesis 1a: There is a positive relationship between the perceptions of
organizational display rule demands (expressing positive emotions and hiding negative
emotions) and surface acting.
Hypothesis 1b: There is a positive relationship between the perceptions of
organizational display rule demands (expressing positive emotions and hiding negative
emotions) and deep acting.
Hypothesis 1c: Display rule demands for expressing positive emotions are more
strongly related to deep acting than surface acting.
Hypothesis 1d: Display rule demands for hiding negative emotions are more strongly
related to surface acting than deep acting.
Commitment to Display Rules
In order for display rules to influence behavior, the employees must be committed to
the display rules (Diefendorff & Gosserand, 2002). Borrowing from the goal-setting literature
(Locke & Latham, 1990), Diefendorff and Gosserand (2002) argued that display rules are
analogous to goals that individuals strive to achieve. A robust finding in the goal-setting
literature (Klein, Wesson, Hollenbeck, & Alge, 1999; Locke & Latham, 1990) is that goal

21
commitment moderates the goal-performance relationship. Specifically, a person who is high
on goal commitment shows a strong positive relationship between goal level and
performance, whereas a person who is low on goal commitment may show no goal-
performance relationship. Extending this notion to emotional labor, it is argued that
commitment to display rules moderates the relationships between display rule demands for
expressing positive and hiding negative emotions and emotional labor (i.e., in order for
display rule demands to influence behavior, the person must be committed to displaying
organizationally desired emotions). Thus, commitment to display rules reflects a person’s
intention to extend effort toward displaying organizationally desired emotions, persist in
displaying these emotions over time, and not abandon the desired emotional displays under
difficult conditions.
Previous research on emotional labor has neglected to assess commitment to display
rules and has simply assumed that if display rules are present, individuals will follow them
(Brotheridge & Grandey, 2002; Grandey, in press). This assumption has led to ambiguity in
interpreting responses to emotional labor questions. For example, individuals indicating that
they engage in little deep acting may be doing so because (a) they are committed to display
rules, but do not need to engage emotional labor (i.e., they naturally feel what is expected by
the organization), or (b) they are not committed to display rules and do not attempt to regulate
their emotions or emotional displays. Such a problem is inherent in some of Grandey’s (e.g.,
in press, 2002) work, where she measured surface acting and deep acting on a frequency
scale, suggesting that a high response indicates that the person engages in much emotional
labor and a low response means that the person engages in little emotional labor. However, it
is unclear as to whether indicating a low frequency of emotional labor is a result of naturally

22
feeling the desired emotions or a lack of commitment to display rules. Therefore, consistent
with goal-setting theory’s suggestion (Klein et al., 1999; Locke & Latham, 1990), it is crucial
that commitment be assessed before substantive hypotheses are tested.
In reviewing the goal commitment literature, Klein et al. (1999) stated that the primary
function of goal commitment is to moderate the relationship between goal level and
performance. Applied to the present investigation, commitment to display rules is expected to
moderate the relationship between perceived display rule demands and emotional labor (i.e.,
surface acting and deep acting). That is, individuals who are committed to the display rules
are hypothesized to exhibit a stronger relationship between the perceived amount of display
rule demands and the frequency of emotional labor. Little or no relationship is expected
between display rule demands and emotional labor when commitment is low. It is important
to note that in order for this moderation to occur, there must be sufficient variance in both the
perceived display rule demands and commitment to display rules. If the perceived display
rule demands are uniformly high (i.e., there is little variance in display rules), commitment to
display rules is anticipated to have a main effect on emotional labor. If commitment to
display rules is uniformly high, only a main effect for display rule demands is expected, with
no main or moderating effects for commitment. However, with sufficient variance in both
display rule demands and commitment to display rules, an interaction is likely to be detected;
and given the expected uncrossed nature of this interaction, there may also be significant (and
interpretable) main effects for both variables.
The strategy in the present investigation is to sample broadly in order to enhance the
likelihood that sufficient variability would be present in both of these variables, increasing the
likelihood of detecting these main effects and the interaction. Thus, in this study it is
23
proposed that commitment to display rules is positively related to emotional labor (surface
acting and deep acting), but also moderates the relationship between perceived display rule
demands and emotional labor (particularly when a full range of these antecedents is present).
The following hypotheses are proposed.
Hypothesis 2a: There is a positive relationship between commitment to display rules
and surface acting.
Hypothesis 2b: There is a positive relationship between commitment to display rules
and deep acting.
Hypothesis 2c: Commitment to display rules moderates the relationship between
display rule demands and emotional labor such that if there is low commitment, there
is little or no relationship between the display rule demands (expressing positive and
hiding negative emotions) and emotional labor (surface acting and deep acting).
Positive and Negative Affectivity
Positive affectivity (PA) and negative affectivity (NA) are defined as stable,
dispositional traits in individuals which reflect the tendency to experience positive or negative
emotional states, respectively (Watson & Clark, 1984). Although recently there has been
some debate (Russell & Carroll, 1999; Spector, VanKatwyk, Brannick, & Chen, 1997), most
researchers have argued that PA and NA are not opposite points on a continuum; rather, they
are two separate, independent dimensions (Cropanzano, James, & Konovsky, 1993; Watson &
Clark, 1984). Individuals with high levels of PA are characterized as optimistic and
enthusiastic, whereas individuals with low levels of PA are more likely to be listless and
apathetic (not necessarily negative). On the other hand, individuals with high levels of NA

24
are likely to be pessimistic or anxious, while individuals low on NA seem to be more calm
and contented (Cropanzano et al., 1993).
Weiss and Cropanzano (1996) stated that affective dispositions of individuals
influence the intensity of their emotional responses to work events. Therefore, an employee
who is high on NA may respond more negatively to a negative affective event at work than
someone low on NA. To this end, in customer service jobs requiring positive emotional
displays, employees with high levels of NA may need to perform more emotional labor in
order to display the appropriate emotions when negative affective events occur (Grandey,
2000). Following this same line of reasoning, individuals high on PA may respond more
positively to all situations, including ones in which negative affective events occur.
Therefore, these individuals may have to perform less emotional labor to display
organizationally desired emotions.
In Morris and Feldman’s (1996) model, PA and NA were proposed to influence
emotional dissonance, which they considered an aspect of emotional labor. More specifically,
PA was hypothesized to be positively correlated with emotional dissonance when the display
rules require negative emotional expressions. In addition, NA was predicted to be positively
related to emotional dissonance when the display rules require positive emotional expressions
(Morris & Feldman, 1996). Taking these relationships a step further, it makes sense
(considering the link between surface acting and dissonance) that when display rules are
positive, individuals high on positive affectivity may do less surface acting (and perhaps less
deep acting) while individuals high on negative affectivity may do more surface acting (and
perhaps more deep acting).

25
Two known empirical studies have examined affectivity in relation to surface acting
and deep acting (Brotheridge & Grandey, 2002; Grandey, 2002). Brotheridge and Grandey
(2002) studied the effects of surface acting and deep acting on burnout, controlling for the
effects of NA and interpersonal demands (i.e., interaction expectations including frequency
and duration of interactions, intensity and variety of emotional expressions, and perception of
display rules from the organization). They found that individuals who reported higher levels
of NA also reported higher levels of burnout, but surface acting and deep acting accounted for
unique variance beyond NA. Although a relationship between NA and emotional labor was
not hypothesized, some interesting correlations surfaced from this study. For instance, there
was a positive relationship between NA and surface acting, but no significant relationship was
found between NA and deep acting. Perhaps individuals high on NA are more likely to
surface act than deep act because of its response-focused nature (Gross, 1998a, 1998b). That
is, it may be easier for high NA individuals, who have a tendency to react to difficult
situations more negatively, to modify their expressions by faking a smile than it is for them to
modify their feelings by thinking positive thoughts or cognitively reappraising the situation in
a more positive light. Grandey (2002) found that surface acting was positively related to NA
(as hypothesized), and negatively related to PA (although she made no a priori hypothesis
about this relationship); deep acting was not related to either affectivity dimension. Because
Brotheridge and Grandey (2002) did not hypothesize the effects of NA or PA on emotional
labor and Grandey (2002) only hypothesized the relationship between NA and emotional
labor, more research is needed to clarify the relationships between these variables. The
following hypotheses are proposed regarding the relationship between affectivity and
emotional labor when display rules are positive.

26
Hypothesis 3a: There is a negative relationship between PA and surface acting.
Hypothesis 3b: There is a negative relationship between PA and deep acting.
Hypothesis 3c: There is a positive relationship between NA and surface acting.
Hypothesis 3d: There is a positive relationship between NA and deep acting.
Hypothesis 3e: NA is more strongly related to surface acting than deep acting.
Perceived Organizational Support
Perceived organizational support (POS) refers to an individual’s global beliefs
regarding the extent to which an organization values the individual’s contributions and cares
about his or her well-being (Eisenberger, Huntington, Hutchison, & Sowa, 1986). It is
influenced by various factors related to how an organization treats the employee, including
the frequency, extremity, and perceived sincerity of organizational acts of praise and approval
(Eisenberger et al., 1986). In addition, POS raises an employee’s expectancy that increased
effort towards meeting organizational goals will be rewarded by the organization (effort-
outcome expectancy) (Eisenberger et al., 1986).
POS is grounded in social exchange theory (Blau, 1964) and the norm of reciprocity
(Gouldner, 1960), which suggest that when one party acts in beneficial ways to another party,
there is an implicit obligation for some future act of reciprocity. In other words, when an
organization does something beneficial for an employee, that employee feels obligated to
return the favor. Therefore, employees with high levels of POS feel high levels of
commitment from their organizations, and also feel an obligation to reciprocate that
commitment by performing behaviors that support organizational goals (Wayne, Shore, &
Liden, 1997). Furthermore, because individuals with high POS believe that their organization
values their contributions and cares about their well-being, they trust that their organization

27
will hold up its end of the social exchange by rewarding these organizationally desired
attitudes and behaviors (Wayne et al., 1997).
There are no published empirical studies examining the effects of POS on emotional
labor. Interestingly, Grandey (2000) proposed a negative relationship between support and
emotional labor, but she operationalized support in a different way than the current study.
She argued that social support from coworkers and supervisors consists of an emotional
component that creates a positive work environment. This positive work environment, in
turn, may result in less emotional labor because employees may be naturally feeling the
positive emotions required by the display rules. This way of conceptualizing support differs
from the idea of POS in that social (or emotional) support is more affective in nature, whereas
POS is more cognitive (or evaluative). That is, POS, by definition, is a cognitive evaluation
of an employee’s relationship with the organization rather than an affective reaction to the
support. Based on social exchange theory, employees who are high on POS may feel an
obligation to their organization to put forth much effort (in terms of surface acting or deep
acting) in order to meet the demands of the display rules. This leads to the following
hypothesis.
Hypothesis 4a: There is a positive relationship between POS and surface acting.
Hypothesis 4b: There is a positive relationship between POS and deep acting.
Characteristics of Service Interactions
A salient feature of customer service jobs is the interaction with customers.
Hochschild (1983) indicated that certain job (or situational) characteristics may require
employees to engage in higher levels of emotional labor. It is important to understand the
situational requirements in order to determine the extent to which emotion regulation is

28
needed on the job (Arvey et al., 1998). Some of the characteristics thought to be related to
emotional labor are the frequency of interactions, the duration of interactions, and task
routineness (Brotheridge & Grandey, 2002; Morris & Feldman, 1996).
Frequency of Interactions. The frequency of interactions refers to how often
employees interact with customers at work. Morris and Feldman (1996, 1997) argued that the
more a job requires contact with others, the greater the organization’s need for regulated
emotions to ensure compliance with organizational goals. It follows that the more frequent
the interactions with customers, the more emotional labor may be needed. Grandey (2002)
found a positive relationship between frequency and surface acting, yet no relationship
between frequency and deep acting. Brotheridge and Grandey (2002) found that frequency of
interactions was positively related to both surface acting and deep acting, but it was more
strongly related to surface acting. This makes logical sense considering that with frequent
interactions, it may be easier just to fake a positive emotion rather than taking the time to alter
one’s felt emotions. Therefore, the following hypotheses are proposed.
Hypothesis 5a: There is a positive relationship between frequency of interactions and
surface acting.
Hypothesis 5b: There is a positive relationship between frequency of interactions and
deep acting.
Hypothesis 5c: Frequency of interactions is more strongly related to surface acting
than deep acting.
Duration of Interactions. The duration of interactions is defined as the amount of time
spent interacting with each customer. Morris and Feldman (1997) provided two reasons why
duration should be related to emotional labor. First, interactions may become less scripted the

29
longer they last, which may require greater attention, effort, and emotional stamina. Second,
the longer the interactions, the more likely it is that employees will learn personal information
about their customers, which may cause the employees to feel the need to regulate their felt
emotions (e.g., if an employee discovers that he or she does not like the customer). In
addition, research conducted by Sutton and Rafaeli (1988) and Rafaeli (1989) suggested that
interactions with customers of short duration often consist of highly scripted interaction
formats (e.g., a simple smile or thank you), which indicates that the effort required in
regulating emotions for these interactions is often quite low.
Generally speaking, Morris and Feldman (1996, 1997) argued that the longer the
duration of an interaction, the more emotional labor is required. However, the literature
presented above seems to indicate that duration may be differentially related to deep acting
and surface acting. For instance, during shorter interactions, it may be more convenient for an
employee to surface act, whereas deep acting may be the strategy of choice during longer
interactions when more effort is needed to regulate one’s emotions. Brotheridge and Grandey
(2002) found that duration of interactions was positively correlated with deep acting, but was
unrelated to surface acting. This leads to the following hypotheses.
Hypothesis 6a: There is a negative relationship between duration of interactions and
surface acting.
Hypothesis 6b: There is a positive relationship between duration of interactions and
deep acting.
Task Routineness. Task routineness is a job characteristic that refers to the habitual
nature of interactions. Jobs that require scripted formats for frequent interactions and little
personalization are thought of as routine jobs (Morris & Feldman, 1996). For example,

30
employees taking menu orders at fast food restaurants are likely to perceive a high level of
task routineness in their jobs (Rafaeli & Sutton, 1989). In contrast, a real estate agent may
perform a variety of interpersonal tasks that are less routine or scripted.
Research has examined the relationships between task routineness and other job
characteristics (e.g., frequency, duration) proposed to influence emotional labor (Morris &
Feldman, 1996, 1997). As mentioned above, it appears that the key elements of many routine
service jobs are that the interactions with customers are quick and uniform. On the other
hand, the longer the interactions between employees and customers, the less likely the
interactions are routine (Morris & Feldman, 1996, 1997). Therefore, it seems reasonable to
expect a relationship between task routineness and such factors as frequency and duration of
interactions. Morris and Feldman (1997) found that task routineness was positively related to
frequency and emotional dissonance, and negatively related to duration. It is important to
note, however, that task routineness is not a proxy for the frequency or duration of
interactions. For example, it is possible to have frequent, yet non-routine interactions (e.g., a
doctor or nurse working in a busy emergency room) and long, yet routine interactions (e.g., a
therapist conducting a lengthy, highly structured interview with a patient or client).
Task routineness has not been examined specifically in relation to surface acting and
deep acting. It makes intuitive sense that for jobs involving high levels of task routineness
where frequent and scripted interactions are prevalent, surface acting may be the emotion
regulation technique of choice. That is, there may not be enough time or even need to modify
one’s actual feelings in those situations. However, in longer interactions with lower levels of
task routineness, deep acting may be more effective. Therefore, it is hypothesized that task

31
routineness is positively correlated with surface acting and negatively correlated with deep
acting.
Hypothesis 7a: There is a positive relationship between task routineness and surface
acting.
Hypothesis 7b: There is a negative relationship between task routineness and deep
acting.
Job Satisfaction
Job satisfaction is defined as an evaluative judgment of one’s job, which results from a
combination of an employee’s affective experiences and belief structures (Weiss &
Cropanzano, 1996). Research regarding the relationship between emotional labor and job
satisfaction has been contradictory. Some researchers have argued that emotional labor is
positively related to job satisfaction (Adelmann, 1995; Ashforth & Humphrey, 1993;
Wharton, 1993). For instance, Adelmann and Zajonc (1989) suggested that based on the
facial feedback hypothesis, which proposes that the expression of positive emotions, such as
smiling, actually may put a person in a good mood, a positive relationship between emotional
labor and job satisfaction can be expected. Other researchers have argued that the relationship
between emotional labor and job satisfaction is negative because regulating something as
personal as emotions inhibits personal expression, and therefore, is bound to lead to negative
consequences (Hochschild, 1983; Pugliesi, 1999). In addition, some researchers have
indicated that the effort and dissonance involved in performing emotional labor can result in
lower levels of job satisfaction (Grandey, 2000; Hochschild, 1983). Consistent with the goals
of the present investigation, it is suggested that in order to understand the relationship

32
between emotional labor and job satisfaction, researchers should examine surface acting and
deep acting separately.
Several empirical studies support the negative relationship between surface acting and
job satisfaction. Both Abraham (1998) and Morris and Feldman (1997) found that emotional
dissonance (associated with surface acting in that employees who surface act are likely to
experience emotional dissonance) was negatively related to job satisfaction. In another
empirical study, Rutter and Fielding (1988) found that prison officers who suppressed true
emotions had higher levels of stress and lower levels of job satisfaction. In addition,
Adelmann (1995) found that table servers who expressed their genuinely positive emotions at
work were more satisfied than those who faked the desired emotions (a surface acting
technique). Grandey (in press) was the first to examine the relationship specifically between
emotional labor (surface acting and deep acting) and job satisfaction. However, she tested a
model with job satisfaction as an antecedent of emotional labor arguing that people with
lower levels of satisfaction will need to engage in emotional labor more frequently than those
who are satisfied. She found a negative relationship between surface acting and job
satisfaction. Therefore, the evidence suggests that surface acting is negatively related to job
satisfaction.
The relationship between deep acting and job satisfaction is less clear. As mentioned
previously, Hochschild (1983) adamantly argued that any organizational management of
emotions leads to job dissatisfaction. If an employee is not naturally experiencing the
organizationally desired emotion in a situation, he/she must exert extra effort in order to meet
the display rules. This extra effort may be unpleasant and lead to dissatisfaction. Based on
this argument, Grandey (2000) proposed a negative relationship between deep acting and job

33
satisfaction. Interestingly, in a later paper, Grandey (in press) argued that job satisfaction is a
predictor of deep acting in that individuals who are less satisfied will need to engage in more
effortful acting than those who are satisfied; she found a negative relationship between these
two variables. However, there is some evidence that these two variables may not be
negatively related. For instance, Brotheridge and Grandey (2002) found that deep acting was
positively related to personal accomplishment (which is thought to be a key determinant of
job satisfaction; Hackman & Lawler, 1971; Locke & Latham, 1990), whereas surface acting
was not. In addition, Kruml and Geddes (2000b) found that higher levels of effort in emotion
regulation (conceptually similar to deep acting) were positively related to personal
accomplishment, while higher levels of emotional dissonance (conceptually similar to surface
acting) were negatively related to personal accomplishment. Because deep acting is
positively related to personal accomplishment and does not result in emotional dissonance,
there is reason to believe that deep acting is positively related to job satisfaction. Therefore,
the current study makes the following predictions.
Hypothesis 8a: There is a negative relationship between surface acting and job
satisfaction.
Hypothesis 8b: There is a positive relationship between deep acting and job
satisfaction.
Customer Service Performance
Customer service performance consists of both technical and functional service quality
aspects (Gronroos, 1990). Technical quality refers to outcomes that often have tangible
aspects, such as a good meal or an on-time flight. Functional quality refers to the style in
which the service is delivered, such as when employees act friendly and sincere. Kelley,

34
Donnelly, and Skinner (1990) indicated that functional service quality consists of the
interpersonal contributions that employees make during interactions with customers. In the
current study, customer service performance refers to the functional service quality delivered
by employees.
Despite its importance to organizations, the relationship between emotional labor and
customer service performance has not received much attention. The customer service
literature repeatedly has argued that displays of friendliness and enthusiasm may result in
higher customer satisfaction, increased sales, and more repeat business (Hochschild, 1983;
Rafaeli & Sutton, 1987, 1989; Schneider & Bowen, 1985). In fact, it is a common managerial
belief that displays of positive emotions by employees may increase organizational
performance (Rafaeli & Sutton, 1989). Studies have shown that positive emotional displays
such as smiling tend to result in higher tips for table servers, indicating good customer service
performance (Adelmann, 1995; Tidd & Lockard, 1978). Pugh (2001) found that positive
emotional displays by bank employees are related to customers’ displays of positive affect,
which positively impact their evaluations of overall service quality. Overall, the literature
seems to suggest that there is a positive relationship between positive emotional displays and
customer service performance. Therefore, it reasonably follows that managing emotions in
order to achieve these positive emotional displays desired by organizations also may enhance
customer service performance.
There is some evidence that surface acting and deep acting may not be equally
effective in producing positive emotional displays (Ashforth & Humphrey, 1993; Grandey, in
press). One of Ashforth and Humphrey’s (1993) main tenets is that for there to be a positive
relationship between emotional labor and performance, the emotional expressions must be

35
perceived as sincere. On the flip side, if the emotional expressions are not perceived as
sincere, then emotional labor may be negatively related to performance (Rafaeli & Sutton,
1987). In fact, in a lab study by Grandey, Fisk, Mattila, and Sideman (2002), observers
posing as customers were able to discriminate between fake and authentic smiles of a hotel
clerk and were more satisfied with the authentic smiles (when task performance of the service
provider was good across conditions). By definition, surface acting refers to faking the
desired emotions, whereas deep acting involves changing felt emotions to match the desired
emotions. Therefore, surface acting may be more likely to be perceived as insincere, while
deep acting is more likely to be perceived as sincere (Grandey, 2000).
There has been only one published empirical study testing the relationship between
surface acting and deep acting and customer service performance. With a sample of
university administrative assistants, Grandey (in press) found a significant negative
relationship between surface acting and coworker ratings of customer service performance.
Deep acting was positively related to customer service performance, although the correlation
was only marginally significant. In another unpublished study, Grandey (2002) again found a
negative relationship between surface acting and customer service delivery (employees rated
themselves on the quality of their interactions with customers) and a positive relationship
between deep acting and customer service delivery. Based on the research presented and
Grandey’s (in press, 2002) findings, the following hypotheses are proposed.
Hypothesis 9a: There is a negative relationship between surface acting and customer
service performance.
Hypothesis 9b: There is a positive relationship between deep acting and customer
service performance.

36
Alternative Model
In addition to the hypothesized model, an alternative model is examined in the present
investigation. This alternative model adds direct paths from the affectivity and POS variables
to the outcome variables, as well as a path from job satisfaction to customer service
performance. Specifically, the alternative model proposes that PA and POS are directly
positively related to job satisfaction and customer service performance, NA is directly
negatively related to both of these outcomes, and job satisfaction is positively related to
customer service performance. The inclusion of these additional paths is based on prior
theory and research suggesting that such links might exist. Furthermore, structural equation
modeling (SEM) researchers recommend comparing a hypothesized model to alternative
models that are built upon theoretical rationale (MacCallum & Austin, 2000; Schumacker &
Lomax, 1996).
A large body of existing research has shown that dispositional affect is related to job
satisfaction (Connolly & Viswesvaran, 2000; Cropanzano et al., 1993). In a recent meta-
analysis, Connolly and Viswesvaran (2000) found that job satisfaction is positively related to
PA and negatively related to NA. Furthermore, it is expected in the present investigation that
dispositional affect might relate to job satisfaction independent of its relationships with SA
and DA. Regardless of whether or not a person engages in emotional labor, the predominant
feelings of people who are high on PA (e.g., optimism, enthusiasm) are likely to positively
influence their affective reactions to their work environment (i.e., job satisfaction), whereas
people who experience negative emotions often (high on NA; e.g., pessimism, anxiousness)
are less likely to be satisfied with their jobs. In other words, dispositional affect may be

37
related to job satisfaction both directly and indirectly through its relationship with the
emotional labor strategies.
Research also has demonstrated that dispositional affect is related to performance
(Cropanzano et al., 1993; Grandey, 2002). For example, Cropanzano et al. (1993) showed
that PA is positively related to job performance and NA is negatively related to performance
in a sample of nurses. The present study examines customer service performance in
particular. Because individuals high on PA more often experience positive emotions (Watson
& Clark, 1984), they are more likely to be predisposed to deliver friendly and sincere
customer service, whereas the opposite is likely true for individuals high on NA. In partial
support of this argument, Diefendorff and Richard (in press) found neuroticism (which is
conceptually similar to negative affectivity) was directly and negatively related to coworkers’
ratings of emotional displays (similar to this study’s supervisor-rated customer service
performance variable). In addition, bivariate correlations in a study by Grandey (2002)
revealed that self-rated affective customer service delivery (very similar to this study’s
customer service performance variable) is positively related to PA and negatively related to
NA. Therefore, in addition to the current investigation’s hypothesized links from affectivity
to emotional labor strategies and emotional labor strategies to customer service performance,
the alternative model proposes a direct relationship between affectivity and customer service
performance. That is, some degree of customer service performance may be explained by a
person’s affectivity (e.g., a person high on PA generally experiences positive emotions which
may translate directly into superior customer service behaviors), independent of the extent to
which he/she engages in emotional labor.

38
The alternative model also proposes that POS is directly and positively related to job
satisfaction and customer service performance. Individuals high on POS perceive that their
organization values their contributions and cares about their well-being. Prior research has
demonstrated that people who perceive that their organization supports them are more likely
to be satisfied with their jobs (Eisenberger, Cummings, Armeli, & Lynch, 1997). This
relationship may be at least partially independent of their use of emotional labor strategies. In
addition, high POS also produces the expectation that superior performance will be
recognized and rewarded (Eisenberger et al., 1997); therefore, based on the norm of
reciprocity, individuals high on POS are likely to put forth effort to perform well on their jobs
(Eisenberger et al., 1986). POS creates feelings of obligation to one’s organization, leading to
more effort expenditure, which may or may not be accomplished through the emotional labor
strategies of SA or DA. In other words, POS may be related to customer service performance
both directly and indirectly through emotional labor.
Finally, the alternative model proposes that job satisfaction is positively related to
customer service performance. Several researchers have demonstrated that a positive
relationship exists between satisfaction and performance (e.g., Iaffaldano & Muchinsky,
1985; Judge, Thoresen, Bono, & Patton, 2001). Taking this a step further, if individuals are
happy with their jobs, they may also be more likely to deliver friendly, cheery, sincere
customer service (see Figure 1 for the hypothesized structural model in addition to the paths
for the alternative hypotheses). Therefore, this leads to the following alternative hypotheses
(AH).
AH10a: There is a positive relationship between PA and job satisfaction.

39
AH10b: There is a positive relationship between PA and customer service
performance.
AH11a: There is a negative relationship between NA and job satisfaction.
AH11b: There is a negative relationship between NA and customer service
performance.
AH12a: There is a positive relationship between POS and job satisfaction.
AH12b: There is a positive relationship between POS and customer service
performance.
AH13: There is a positive relationship between job satisfaction and customer service
performance.
The Importance of Sample Variability
As with any scientific investigation, the power to detect a real effect in hypothesis
testing depends on the sample data exhibiting variability on the constructs of interest
(Schwab, 1999). Johns (1991, 2001) has argued that organizations and occupations, by their
nature, operate to constrain behaviors in order to create a more homogenous, reliable product
or service. That is, organizational characteristics (e.g., culture) and the design of jobs operate
to reduce the variability between individuals on many constructs of interest to researchers.
The result of these constraints is that key variables may have restricted ranges, resulting in
decreased power and a reduced probability of detecting an effect if one actually is present.
Furthermore, the extent to which sample data reflect the idiosyncrasies of a particular
organization or occupation can limit the external validity of the study (Johns, 1991).
The concern of range restriction applies to several constructs examined in the
proposed investigation. For example, it is to be expected that individuals within the same

40
occupation may encounter similar customer interactions (i.e., have similar frequency,
duration, and level of routineness for interactions), face similar display rule demands, and
possibly use similar methods of displaying emotions (i.e., similar emotional labor tactics). If
only one occupation is sampled in this investigation, these situational variables and display
rules might be unnecessarily restricted, resulting in low power and a decreased ability to
detect significant effects. This same logic of decreased sample variability also applies to
sampling individuals from the same organization. Culture, organizational norms, and formal
organizational systems (e.g., performance appraisals) may all act to constrain the types of
emotional displays that are desired by the organization, the types of interactions that
employees experience, and the methods of emotion regulation employed by individuals. For
instance, Schaubroeck and Jones (2000) sampled employees from one organization and failed
to find a significant effect for display rules requiring the suppression of negative emotions,
perhaps largely due to the restricted range on that variable. In contrast, researchers who have
sampled a variety of occupations from a variety of organizations have found greater
variability in display rule demands and characteristics of the interaction (Brotheridge &
Grandey, 2002; Morris & Feldman, 1997). Given the importance of sample variability to any
study and the real potential for range restriction on several key variables in this study, the
current investigation sampled a variety of service occupations across many different
organizations.

41
METHOD
Participants
Participants in this study were full-time employees (i.e., work at least 30 hours per
week) whose jobs consist of significant amounts of “people work.” In addition, each
employee’s supervisor also participated. Although there are no set rules for sample size
requirements in structural equation modeling (SEM), many researchers have offered
guidelines regarding appropriate minimum sample sizes. For example, Schumacker and
Lomax (1996) suggested that a sample size of 200 is generally considered the minimum
requirement with SEM. With the large number of constructs and parameters in the present
study, the goal was to obtain a minimum of 300 employee-supervisor dyads.
A total of 1020 pairs of employee and supervisor surveys (i.e., 2040 potential
respondents in all) were distributed. Employees returned 406 surveys (39.8% response rate),
394 of which were usable [participants were eliminated if they were missing data for an entire
scale or more of the survey (for usable surveys, missing data was replaced with the mean), if
there were missing identification numbers on the surveys, or if the employee worked less than
30 hours/week]. Supervisors returned 363 surveys (35.6% response rate), 357 of which were
usable. A total of 769 out of the 2040 employee and supervisor surveys distributed were
returned (37.7% overall response rate), of which 331 were matching dyads (32.5%).
Complete data were obtained for 318 employee-supervisor dyads (31.2%), who had worked
together for an average of 4.57 years (SD = 5.52). These dyads were recruited from a variety
of organizations and occupations [service/sales (36.2%), professional/technical/management
(21.1%), clerical (19.8%), education (12.3%), healthcare (10.1%), and other (.3%)], which
involve considerable amounts of “people work” and emotional labor (Hochschild, 1983).

42
Employees included in the matched dyads had an average age of 37.65 years (SD =
11.57), 73.3% of them were females, 83.6% were White, 11.3% were African American,
1.9% were Asian American, and 1.6% were Hispanic. Regarding education, 21.7% had
completed high school (or had their GED), 33.6% had completed some college, 26.1% had a
bachelor’s degree, 4.1% had completed some graduate work, and 12.3% held a graduate
degree. In addition, these employees worked an average of 41.81 hours per week (SD =
7.95), had been employed by their current organization an average of 7.49 years (SD = 8.04),
and had held their current job position an average of 5.34 years (SD = 6.11). Supervisors
included in the matched dyads had an average age of 42.93 years (SD = 9.83), 49.4% of them
were females, 84.9% were White, 9.7% were African American, 1.9% were Hispanic, and
1.6% were Asian American.
Measures
Employee Measures
Employees responded to items measuring each of the following constructs. All items
included in these employee measures may be found in Appendix A.
Perceived Display Rule Demands. Display rules are defined as perceived
organizational expectations about the appropriate emotional expressions on the job. This
study focuses on display rules for expressing positive emotions and hiding negative emotions.
The seven-item scale used to measure this construct consists of a combination of items
adapted from scales used by Brotheridge and Grandey (2002) and Schaubroeck and Jones
(2000). Four items were taken from Brotheridge and Grandey’s (2002) scale, with three items
assessing participants’ perceptions of display rules for expressing positive emotions and one
item assessing perceptions of requirements to hide negative emotions. These authors found a

43
coefficient alpha of .94 for their scale. Also, to more fully cover all aspects of the construct,
two items assessing the suppression of negative emotions and one item assessing the
expression of positive emotions adapted from a scale by Schaubroeck and Jones (2000) were
also included. Responses to this scale range from “strongly disagree” = 1 to “strongly agree”
= 5. Sample items include, “This organization would say that part of the product to customers
is friendly, cheerful service,” and “This organization expects me to try to pretend that I am not
upset or distressed.”
Commitment to Display Rules. Commitment to display rules refers to one’s
determination to meet the display rule requirements. The five-item scale used to measure
commitment is adapted from a goal commitment scale originally developed by Hollenbeck,
Williams, and Klein (1989) and further validated by Klein, Wesson, Hollenbeck, Wright, and
DeShon (2001), who reported a coefficient alpha of .74. Respondents were asked to rate the
extent to which they agreed with each statement (“strongly disagree” = 1 to “strongly agree”
= 5). Sample items include, “I am committed to displaying the organizationally desired
emotions on the job,” and “I think displaying the organizationally desired emotions on the job
is a good goal to shoot for.”
Positive and Negative Affectivity. Positive affectivity (PA) and negative affectivity
(NA) refer to stable, dispositional traits in individuals that reflect the tendency to experience
positive or negative emotional states, respectively (Watson & Clark, 1984). The Positive and
Negative Affectivity Schedule (PANAS) (Watson, Clark, & Tellegen, 1988) was used to
measure these constructs. The PANAS consists of 20 mood-relevant adjectives, with 10
positive (e.g., excited, proud) and 10 negative (e.g., afraid, irritable) mood words. The
directions informed participants to indicate the extent (“very slightly or not at all” = 1 to

44
“extremely” = 5) to which they feel each emotion in general, or on average, across situations.
Past research using this scale has shown reliability estimates of .84 and .83 for PA and NA,
respectively (Cropanzano et al., 1993).
Perceived Organizational Support. Perceived organizational support (POS) is defined
as an individual’s global beliefs regarding the extent to which an organization values an
individual’s contributions and cares about one’s well-being (Eisenberger et al., 1986). The
Survey of Perceived Organizational Support (SPOS) (Eisenberger et al., 1986; Eisenberger et
al., 1997), consisting of eight items, was used to measure POS. Previous research has shown
a reliability estimate of .90 for this scale (Eisenberger et al., 1997). Participants responded on
a 5-point scale with anchors of “strongly disagree” = 1 and “strongly agree” = 5. Sample
items include, “My organization really cares about my well-being,” and “Help is available
from my organization when I have a problem.”
Frequency of Interactions. The frequency of interactions refers to how often
employees interact with customers at work. Three items were generated for the purposes of
this study. Participants responded to these three Likert-type items using a scale ranging from
“strongly disagree” = 1 to “strongly agree” = 5. A sample item is, “I interact with many
different customers on a daily basis.”
Duration of Interactions. The duration of interactions is defined as the amount of time
spent interacting with each customer. Three items were developed for the purposes of this
study. Participants responded to these three Likert-type items using a scale ranging from
“strongly disagree” = 1 to “strongly agree” = 5. A sample item is, “I spend a lot of time with
each customer I interact with.”

45
Task Routineness. Task routineness is a job characteristic that refers to the uniformity
of interactions between employees and customers. The current study’s scale measures task
routineness with three items adapted from a five-item scale by Withey, Daft, and Cooper
(1983), who reported an internal consistency reliability of .81 for their scale. The three items
were adapted to fit the context of customer interactions. Two of the original five items were
not included because they were very repetitive once reworded for the customer service
context. Responses to this scale range from “strongly disagree” = 1 to “strongly agree” = 5.
Sample items include, “My work with customers is fairly routine,” and “I perform repetitive
activities in my interactions with customers.”
Emotional Labor: Surface Acting and Deep Acting. Emotional labor is conceptualized
as the process of regulating both observable expressions (surface acting) and feelings (deep
acting). The emotional labor scale used in the present investigation consists of seven surface
acting items and four deep acting items (see scale development work reported in Diefendorff,
Croyle, & Gosserand, 2002). Five of the seven surface acting scales were adapted from
Grandey (in press). The remaining two surface acting items were taken from Kruml and
Geddes’ (2000a) emotive dissonance scale. The present study’s deep acting scale consists of
three items used by Grandey (in press) and one item developed by Diefendorff and colleagues
(2002). All of these items measure the frequency of surface acting and deep acting behaviors
on a 5-point scale (“never” = 1 to “always” = 5). A sample surface acting item is, “I fake the
emotions I show when dealing with customers,” and a sample deep acting item is, “I try to
actually experience the emotions that I must show to customers.”
Job Satisfaction. Job satisfaction refers to an evaluative judgment of one’s job, which
results from a combination of an employee’s affective experiences and belief structures

46
(Weiss & Cropanzano, 1996). The present study examines overall job satisfaction, which was
measured using the three-item Michigan Organizational Assessment Questionnaire Job
Satisfaction Subscale (Cammann, Fichman, Henkins, & Klesh, 1979). Cammann et al. (1979)
reported an internal consistency reliability of .77, but more recent studies have found higher
reliabilities (e.g., .87; Jex & Gudanowski, 1992). This scale was originally used with a 7-
point scale; however, the current study used a 5-point scale (“strongly disagree” = 1 to
“strongly agree” = 5) for consistency throughout the measures. A sample item is, “All in all I
am satisfied with my job.”
Supervisor Measure
Supervisors responded to items measuring the following construct. The items on this
scale may be found in Appendix A.
Customer Service Performance. Customer service performance is defined as the
functional service quality (i.e., interpersonal style of service delivery) performed by
employees in their interactions with customers (e.g., clients, patients, students, and coworkers
who are internal customers). This construct was rated by the supervisor of each employee
participant, using an adaptation of a six-item scale originally developed by McLellan, Schmit,
Amundson, and Blake (1998). Grandey (in press) reported a coefficient alpha of .93 for this
scale. The supervisor responded based on the extent (“strongly disagree” = 1 to “strongly
agree” = 5) to which he or she agreed with the items regarding the employee’s interactions
with customers. Sample items include, “This person shows friendliness and warmth to
customers,” and “This person treats customers with courtesy, respect, and politeness.”

47
Additional Measures
In addition to the employee and supervisor measures described above, both the
employee and supervisor surveys requested demographic information (e.g., gender, age,
occupation, tenure) about the respondents.
Procedure
As mentioned previously, to examine constructs such as interaction characteristics and
organizational display rules, a wide variety of occupations and organizations needed to be
sampled. Johns (1991) stated that the goal of a sampling strategy should be to increase the
sensitivity of statistical tests when there is the potential for restricted variance in the
constructs being measured. To obtain the diverse sample needed in this study, the following
procedure was used.
Data for this study was collected from full-time employee-supervisor dyads. These
working adults were surveyed by trained undergraduate psychology students, who received
extra credit for distributing the survey packets to employees who work in jobs where a large
amount of their time is spent interacting with customers, clients, or patients. Some examples
of these jobs include waiters/waitresses, fast food workers, flight attendants, grocery checkout
clerks, healthcare workers, childcare workers, human service workers, bank tellers,
receptionists, movie theater workers, and retail sales (clothes, cars, real estate) workers.
These types of jobs vary on display rule requirements and interaction characteristics. For
instance, fast food workers may encounter frequent and short interactions with high levels of
task routineness, whereas childcare workers are more likely to engage in interactions that are
much longer and have less routine tasks. The students distributing the surveys were provided

48
with a letter, which included detailed instructions on distributing the surveys (see Appendix B
for the student letter).
Each employee was given a survey packet that contained an employee survey packet
and a supervisor survey packet, both of which included a letter providing a description of the
purpose of the study, informed consent information, and instructions on how to complete and
return the survey (see Appendix C for the employee letter and Appendix D for the supervisor
letter). Employees completed the employee survey and returned it in a postage-paid business
reply envelope. In addition, employees were asked to give their immediate supervisors the
supervisor packet. The supervisors completed their survey and returned it in a separate
postage-paid business reply envelope. All surveys were coded so that returned surveys from
employee-supervisor dyads could be identified and matched up. In addition, 10% (n=32) of
the employee respondents included in the matched dyads were randomly contacted by phone
to verify completion of the surveys, all of whom verified their participation.
Several studies have demonstrated that this type of data collection, in which survey
data is collected via trained undergraduate students, results in findings comparable with data
collected in more traditional ways (e.g., researchers distributing surveys in organizations).
More specifically, Smith and her colleagues (e.g., Reeve & Smith, 2000; Smith & Sulsky,
1995; Smith, Tisak, Hahn, & Schmieder, 1997; Smith, Tisak, & Schmieder, 1993)
continuously have shown that results of data administered by students to employees in a
variety of jobs and organizations are consistent with those collected by researchers in
organizations. For example, these authors found similar results across a student-administered
sample, a group of social service workers, and employees at a manufacturing firm (Smith et
al., 1993); a student-administered sample, faculty and administrative staff at a community

49
college, and salaried personnel in a small heavy metal foundry (Smith & Sulsky, 1995); two
student-administered samples and production workers and support staff from an industrial
fittings plant (Smith et al., 1997); and four different student-administered samples and a
sample of social service workers from a large public service agency (Reeve & Smith, 2000).
Because these studies consistently demonstrate comparable findings between data
administered by students to employees in organizations and data administered by researchers
to employees in organizations, there is reason to have confidence in the findings of the present
study as well. Furthermore, this data collection procedure was the most practical way to
obtain the type of data needed and to meet the sample size requirements in this investigation.
Analytic Strategy
Structural equation modeling (SEM) was used to test the proposed models in the
present study. Before reporting the results of each step in detail, a discussion of some issues
in SEM is warranted. The measurement and structural models in the present study were
tested using LISREL 8.3, and the covariance matrices used to test the models were obtained
through the PRELIS program within LISREL (Joreskog & Sorbom, 1993). In addition, all
procedures used maximum-likelihood (ML) estimation.
Evaluating Model Fit
A number of metrics are used in assessing the fit of hypothesized measurement and
structural models to the data. The chi-square statistic is an inferential test statistic that is used
for traditional hypothesis testing to determine whether the null hypothesis should be rejected.
The null hypothesis for a chi-square test states that the model fits the data well (MacCallum,
Browne, & Sugawara, 1996). Therefore, a non-significant p-value for a chi-square statistic
indicates a good fitting model. Although this statistic is commonly reported in research,

50
recent trends have shown a decrease in reliance on the chi-square as a measure of the absolute
fit of a model due to its suboptimal performance in a variety of practical applications (Bollen
& Long, 1993). For instance, the chi-square statistic becomes inflated with increases in
model complexity and sample sizes (Garson, 2002).
The present study reports the chi-square statistic for each model tested, but this
statistic mostly is relied upon as a metric in comparing the fit of various models to each other
using chi-square difference tests (i.e., examining the change in chi-square and degrees of
freedom from one model to another). This test allows researchers to determine if one model
fits the data statistically significantly better than another alternative model (Schumacker &
Lomax, 1996). In addition, chi-square difference tests are performed to compare the fit of
each structural model to the fit of the appropriate measurement model in order to assess the
impact of applying structural constraints on the model (Joreskog & Sorbom, 1993).
The fit of the measurement and structural models in the current investigation also were
assessed via various fit indices reported in the output provided by LISREL. These fit indices
can be grouped into two broad categories: absolute fit indices and incremental fit indices
(Bollen, 1989; Gerbing & Anderson, 1993; Hu & Bentler, 1999). Absolute fit indices assess
how well the hypothesized model fits the obtained data compared to a perfectly fitting model.
Examples of these fit indices include the root mean square of approximation (RMSEA), the
standardized root mean squared residual (SRMR), and the goodness-of-fit index (GFI).
Incremental fit indices assess the improvement in fit of the hypothesized model over the null
model, which assumes that all measured variables in the model are uncorrelated. Examples of
this type of fit index include the comparative fit index (CFI), the non-normed fit index (NNFI;
also known as the Tucker-Lewis Index, TLI), and the normed fit index (NFI).

51
No consensus exists in the literature as to which fit indices provide the best measure of
fit for models, but researchers do agree that some combination of fit indices should used
rather than relying on a single fit index (Gerbing & Anderson, 1993; Vandenberg & Lance,
2000). To evaluate the fit of the hypothesized models, the present study used four commonly
recommended and reported fit indices (Hu & Bentler, 1999; Vandenberg & Lance, 2000):
two absolute fit indices (RMSEA and SRMR) and two incremental fit indices (CFI and
NNFI). In order to minimize Type I and Type II error rates, Hu and Bentler (1999)
recommended two combinational rules for assessing model fit. The first rule proposes that a
model should be rejected when the NNFI or CFI is less than .96 and the SRMR is greater than
.09. The second rule states that a model should be rejected when the RMSEA is greater than
.06 and the SRMR is greater than .09. Vandenberg and Lance (2000) suggested that Hu and
Bentler’s (1999) criteria for a good-fitting model may be too stringent. Therefore, following
the recommendations of Vandenberg and Lance (2000), this study sets the upper bounds of
good fit for the RMSEA and the SRMR at .08 and .10, respectively, and the lower bound of
good fit for the CFI and NNFI at .90.
In addition to assessing the overall fit of the proposed models with the chi-square
statistic and these other absolute and incremental fit indices, parameter estimates were
examined to evaluate the strength and direction of the individual paths in the structural
models. These individual paths correspond to this study’s hypotheses described in the
introduction. Assuming the structural model demonstrates adequate fit to the data,
statistically significant parameter estimates in the hypothesized direction indicate support for
the associated hypotheses. Parameter estimates provide additional insights in that they may
52
assist in deciding upon alternative models that may fit the data better (e.g., removing non-
significant parameter estimates may increase the fit of the model) (Joreskog, 1993).
Creating and Using Testlets
As recommended by Williams and Anderson (1994), testlets, or item parcels, were
formed by randomly grouping items within each scale to serve as the indicators of each latent
variable, rather than having each individual item on the scales as a separate indicator. This
approach reduces the number of parameters estimated in the model, increases the indicator
reliabilities, and stabilizes parameter estimates. Two to four testlets (consisting of two to
three items each) were formed for the majority of the scales. For example, the seven-item
surface acting scale was divided into three testlets, two of which consisted of two items each
[1) SA2 and SA4, and 2) SA6 and SA7] and one of which consisted of three items (SA1,
SA3, and SA5) (see Appendix E for a complete list of the item-testlet relationships). Five
scales (display rule demands for hiding negative emotions, frequency of interactions, duration
of interactions, task routineness, and job satisfaction) were comprised of only three items
each, and therefore, forming testlets for these scales was not possible. Instead, each of the
items on these scales served as a separate indicator of its respective scale.
Testing Interactions in SEM
Hypothesis 2c states that commitment to display rules moderates the relationship
between display rule demands and emotional labor such that if there is low commitment, there
is little or no relationship between the display rule demands (expressing positive and hiding
negative emotions) and emotional labor (surface acting and deep acting). This hypothesis
requires testing interaction effects by including product terms (i.e., multiplying main effect
indicators together) in the hypothesized model.

53
Several methods of testing interaction effects in SEM exist (e.g., Algina & Moulder,
2001; Bollen, 1996; Jaccard & Wan, 1995; Jaccard & Wan, 1996; Joreskog & Yang, 1996;
Ping, 1996), and there has been much debate over which method is the best to use (Joreskog,
1998; Moulder & Algina, 2002). The present study chose to follow Jaccard and Wan’s (1995)
method based on a comparative review of many of these existing methods by Moulder and
Algina (2002), who concluded that Jaccard and Wan’s (1995) method was one of the most
effective methods available (e.g., in terms of power and controlling for Type I and Type II
errors).
A brief discussion of Jaccard and Wan’s (1995) maximum-likelihood estimation
method for interaction analysis in SEM is relevant. These researchers advocate mean-
centering (deviating variables from their mean) the main effect variables (i.e., display rule
demands – expressing positive and hiding negative emotions, and commitment to display
rules) before computing the product term. Mean-centering main effect variables is
recommended by Cohen and Cohen (1983) as a basic regression procedure, and it serves to
reduce the collinearity between the main effect variables and the interaction terms.
In addition, Jaccard and Wan (1995) recommend using multiple product term
indicators for a latent product variable. Joreskog and Yang (1996) demonstrated that a model
could be identified (meaning that there is a unique set of parameters consistent with the data
so that the parameters may be estimated and the model tested; a model may be identified by
adding constraints) with a single product indicator for the latent product variable. However,
as Moulder and Algina (2002) note, including all possible indicators for the interaction is
appealing in that one is making use of all available information. The problem with using all
possible indicators is that this approach increases the nonnormality that accompanies each

54
additional product indicator (Moulder & Algina, 2002). Therefore, following the suggestion
of Jaccard and Wan (1995) and Moulder and Algina (2002), the present study compromised
(between having one product indicator versus all possible product indicators) by using four
product term indicators for the latent product variable.
Finally, Jaccard and Wan (1995) set forth five constraints that must be included in the
structural models when testing interaction effects. The current investigation modeled these
constraints, which are presented in Appendix F. The interested reader is referred to Jaccard
and Wan (1995) for a full description of these constraints and their method.

55
RESULTS
Overview
SEM was conducted using a two-step process to test the proposed measurement and
structural models (Bollen, 1989; Schumacker & Lomax, 1996). First, a series of confirmatory
factor analyses were performed to assess the factor structure of all scales. Next, the
hypothesized structural model was tested to examine the proposed relationships among the
latent variables. This hypothesized structural model then was compared to alternative
structural models to determine which model provided the best fit to the data.
Measurement Model
As mentioned previously, the first step in SEM is to determine the best-fitting
measurement model for the data (matched dyad cases = 318) by performing confirmatory
factor analyses (CFA). Two sets of measurement model analyses were performed. The first
set did not include the product terms in the models in order to examine the true measurement
properties of this study’s scales (i.e., how well items load on their respective scales). Product
terms tend to have low reliability, which can have a negative effect on the overall fit of a
model (Jaccard & Wan, 1995). However, a second set of CFA’s were performed that
included the product terms; the final measurement model from these analyses was the one the
structural models were compared against using the chi-square difference tests.
First, the results from the measurement model analyses without the product terms
included in the models are presented. The hypothesized measurement model consisted of 12
latent factors: display rule demands (expressing positive + hiding negative emotions),
commitment to display rules, positive affectivity (PA), negative affectivity (NA), perceived
organizational support (POS), frequency of interactions, duration of interactions, task

56
routineness, surface acting, deep acting, job satisfaction, and customer service performance.
CFA results for this hypothesized model did not quite meet the criteria for a good-fitting
model for two of the four fit indices (χ2 = 1285.87, df = 636; RMSEA = .057; SRMR = .073;
CFI = .89; NNFI = .88). Table 1 compares the fit indices of this hypothesized measurement
model and alternative measurement models.
Table 1
Fit Indices for Measurement Models with No Interaction Terms
Model χ2 df p RMSEA SRMR CFI NNFI
Hyp. Model 1285.87 636 .00 .057 .073 .89 .88
DR2 Model 1082.74 624 .00 .048 .057 .92 .91
DR2 + 1 Attitude 2547.15 657 .00 .095 .080 .76 .73
DR2 + 1 Situation 1707.98 647 .00 .072 .070 .86 .84
DR2 + Method 924.52 588 .00 .042 .049 .94 .92 __
Note. The Hypothesized Model contains 1 Display Rule Demands (DR) factor (Expressing Positive and Hiding Negative Emotions as one factor). The DR2 Model contains 2 DR factors (1 Expressing Positive Emotions and 1 Hiding Negative Emotions as separate factors). The DR2 + 1 Attitude model consists of the DR2 Model plus collapsing PA, NA, POS, and job satisfaction into a single affectivity/attitude factor. The DR2 + 1 Situation model consists of the DR2 Model plus collapsing frequency, duration, and task routineness into a single situational characteristics factor. The DR2 + Method model consists of the DR2 Model plus adding a separate method factor onto which all constructs load in order to check for mono-method bias.
In order to identify the best-fitting model, the hypothesized measurement model was
tested against several alternative measurement models. Because recent research has shown
that display rule demands for expressing positive emotions versus hiding negative emotions
are distinct constructs (e.g., Diefendorff & Richard, in press), rather than using one single
display rule construct as proposed in the originally hypothesized model, the first alternative
57
model tested split the display rule construct into two constructs (demands for expressing
positive and demands for hiding negative emotions). All the other constructs remained the
same as in the original model. This first alternative model (hereafter referred to as the DR2
measurement model) satisfied all four criteria for a good-fitting model (χ2 = 1082.74, df =
624; RMSEA = .048; SRMR = .057; CFI = .92; NNFI = .91), and fit the data significantly
better than the originally hypothesized measurement model (∆χ2 (12) = 203.13, p < .05).
This DR2 measurement model then was tested against three additional alternative
models. First, it was tested against a model where all of the affectivity/attitude factors (PA,
NA, POS, and job satisfaction) were combined into a single factor, with all other factors
remaining the same as in the DR2 measurement model (this affectivity/attitude model
hereafter is referred to as the DR2 + 1 Attitude model). This model was tested to determine if
these affectivity/attitude factors are indeed distinct constructs or if they are considered more
appropriately as a general affectivity/attitude factor. The DR2 + 1 Attitude measurement
model did not fit the data well (χ2 = 2547.15, df = 657; RMSEA = .095; SRMR = .080; CFI =
.76; NNFI = .73), and fit the data significantly worse than the DR2 measurement model (∆χ2
(33) = 1464.41, p < .05).
Next, the DR2 measurement model was evaluated against an alternative model in
which all of the situational characteristics (frequency of interactions, duration of interactions,
and task routineness) were consolidated into a single factor, with all other factors remaining
the same as in the DR2 measurement model (this situational characteristics model hereafter is
referred to as the DR2 + 1 Situation model). This model was tested to determine whether
these situational characteristics are more appropriately considered as a single factor rather
than three separate factors. The DR2 + 1 Situation model did not meet all the criteria for a

58
good fitting model (χ2 = 1707.98, df = 647; RMSEA = .072; SRMR = .070; CFI = .86; NNFI
= .84), and fit the data significantly worse than the DR2 measurement model (∆χ2 (23) =
625.24, p < .05).
Finally, as recommended in Williams, Cote, and Buckley (1989) and used by Facteau,
Dobbins, Russell, Ladd, and Kudisch (1995), analyses were conducted to determine if
common method bias was playing an important role in the current investigation. To do this,
the DR2 measurement model was compared to a DR2 + Method model (i.e., measurement +
method model), which included the 13 constructs (“traits”) of interest in this study plus a
single uncorrelated method factor. All measures collected from the employees were allowed
to load on their corresponding trait factors and the method factor. The supervisor rating of
customer service performance was not allowed to load on the method factor because percept-
percept bias was not a concern for this construct. If a method factor exists, this DR2 +
Method model should fit the data significantly better than the DR2 measurement model. In
addition to comparing the fit of these two models to assess the role of method variance, it is
recommended to examine the variance accounted for by trait factors, method factors, and
unique sources (i.e., item specific and random error). For each observed variable, the square
of the trait factor loading and that of the method factor loading equal the amount of variance
due to trait and method factors, respectively. The average of the squared factor loadings
indicate the total amount of variance in the model due to trait and method factors.
The results of the present study concerning method variance are as follows. Although
the DR2 measurement model fit the data well according to all fit criteria (see Table 1), the
DR2 + Method model also satisfied all criteria for a good-fitting model (χ2 = 924.52, df =
588; RMSEA = .042; SRMR = .049; CFI = .94; NNFI = .92), and fit significantly better than

59
the DR2 measurement model (∆χ2 (36) = 158.22, p < .05). This finding suggests that the
measurement model does benefit from the addition of a method factor. However, even
though the method model fit the data statistically significantly better, the improvements in the
fit indices were minimal [i.e., the differences in comparing the measurement model to the
measurement plus method model for this study’s fit indices were all .02 or less, whereas the
median difference in the fit index used for Williams et al.’s (1989) 11 studies was .10].
The variance in the DR2 + Method model accounted for by the trait factors, the
method factors, and the unique variance were then examined. The trait factors accounted for
56% of the total variance, while the method factor only accounted for 6% of the variance.
The unique variance was 38%. The variance results for the method factor are much less than
those in Williams et al. (1989), who found that the average amount of variance accounted for
by a method factor across nine samples was 27% (ranged from 16% to 42%).
In sum, these analyses suggest that although the fit of the DR2 measurement model
improves by adding a method factor, the gain in fit is fairly small. In addition, the method
factor accounts for only a small amount of the total variation in the model. Together these
analyses demonstrate that common method bias is not a serious concern in the present study.
The set of CFA analyses just presented demonstrate that the most appropriate
measurement model (without product terms included) is the DR2 measurement model.
However, as mentioned previously, a measurement model that includes the product terms is
needed in order to compare the hypothesized structural models (which include the product
terms) to a nested measurement model to assess the impact of applying structural constraints.
Therefore, a second set of measurement models were tested with the addition of product
terms. The measurement model with product terms was the same as the DR2 measurement

60
model with the addition of two latent product term variables and four product term indicators.
The DR2 measurement model with product terms met the criteria for a good-fitting model for
most of the fit indices (χ2 = 1387.44, df = 765; RMSEA = .051; SRMR = .067; CFI = .90;
NNFI = .88). Furthermore, after testing the DR2 plus product terms measurement model
against the same three other alternative models as previously tested, this DR2 model was
retained as the final measurement model (see Table 2 for the fit indices for the measurement
models with interaction/product terms).
Table 2
Fit Indices for Measurement Models with Interaction Terms
Model χ2 df p RMSEA SRMR CFI NNFI
DR2 Model (Final)* 1387.44 765 .00 .051 .067 .90 .88
DR2 + 1 Attitude 2846.58 804 .00 .090 .085 .75 .71
DR2 + 1 Situation 2021.86 792 .00 .070 .077 .83 .81
DR2 + Method 1194.49 722 .00 .045 .050 .92 .90 __
Note. See the caption under Table 1 for a description of each model. * Although the DR2 + Method model fit the data significantly better than the DR2 Model, the DR2 Model (including the interaction/product terms) was retained as the final measurement model due to reasons explained previously in the text.
Some comments regarding the acceptance of the DR2 measurement model with
product terms as the final model despite one of its fit indices not quite reaching the acceptable
level of .90 (NNFI = .88) are necessary. Product terms tend to have low reliability because
they are combinations of indicators from two distinct constructs that do not measure the same
thing. This low reliability will have a negative effect on overall model fit. This can be seen in
the present data where the factor loadings for the product term indicators were relatively low

61
(see Table 3 for factor loadings for all indicators in the final DR2 measurement model) and
most of the error variances were high, indicating low reliabilities. Consequently, the
measurement models including the product terms did not fit as well as the measurement
models without the product terms (see Tables 1 & 2). Without the product terms included, the
DR2 measurement model fit the data well across the board (see Table 1), so it is apparent that
the measurement of the constructs in this study are adequate. In addition, the RMSEA,
SRMR, and CFI for the DR2 measurement model with the product terms were all at
acceptable levels (RMSEA = .051; SRMR = .067; CFI = .90). This DR2 measurement model
also met Hu and Bentler’s (1999) stringent decision rule stating that good fit is present when
the RMSEA is less than .06 and the SRMR is less than .09. Based on this assessment, the
DR2 measurement model with product terms was accepted as the final measurement model to
be used in the structural analyses.
Descriptive Statistics
Table 4 presents the means, standard deviations, internal consistency reliabilities, and
intercorrelations of all scales for the matched dyads. Most scales exhibited acceptable
reliabilities with the majority of the coefficient alphas ranging from .81 to .89. The
reliabilities of display rule demands for expressing positive emotions, commitment to display
rules, and task routineness were somewhat lower than the others ( = .64 to .69). Generally,
the reliabilities in this study are consistent with those found in previous research. For
example, the reliability of POS found by Eisenberger et al. (1997) was .90, and the POS
coefficient alpha in the present study is .88. In addition, Jex and Gudanowski (1992) found
the reliability of job satisfaction to be .87, and it is .86 in the current investigation.

62
Table 3
Completely Standardized Indicator Loadings for the Final Measurement Model
Indicator Loading
Display Rule Demands – Expressing Positive Emotions 1 .71
Display Rule Demands – Expressing Positive Emotions 2 .70
Display Rule Demands – Hiding Negative Emotions 1 .63
Display Rule Demands – Hiding Negative Emotions 2 .91
Display Rule Demands – Hiding Negative Emotions 3 .87
Commitment to Display Rules 1 .55
Commitment to Display Rules 2 .78
Positive Affectivity 1 .72
Positive Affectivity 2 .77
Positive Affectivity 3 .85
Positive Affectivity 4 .90
Negative Affectivity 1 .77
Negative Affectivity 2 .52
Negative Affectivity 3 .60
Negative Affectivity 4 .61
Perceived Organizational Support 1 .86
Perceived Organizational Support 2 .85
Perceived Organizational Support 3 .66
Perceived Organizational Support 4 .79
Frequency of Interactions 1 .74
Frequency of Interactions 2 .73
Frequency of Interactions 3 .87
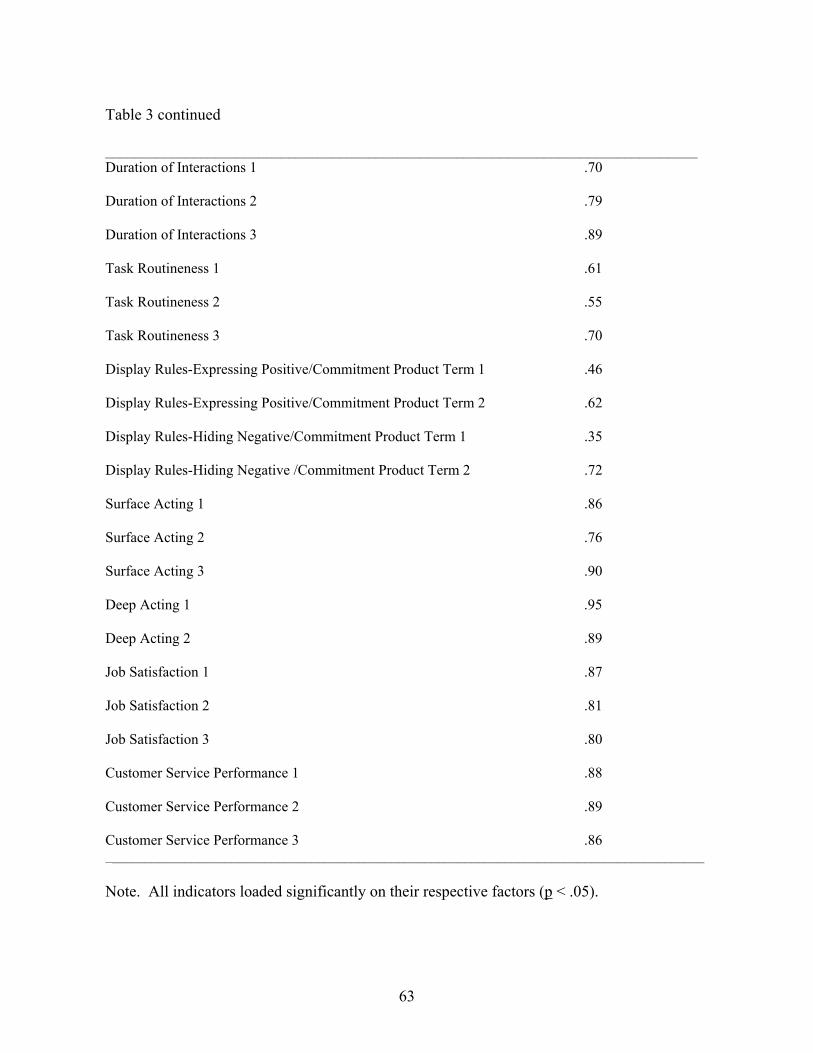
63
Table 3 continued
_________________________________________________________________________________ Duration of Interactions 1 .70
Duration of Interactions 2 .79
Duration of Interactions 3 .89
Task Routineness 1 .61
Task Routineness 2 .55
Task Routineness 3 .70
Display Rules-Expressing Positive/Commitment Product Term 1 .46
Display Rules-Expressing Positive/Commitment Product Term 2 .62
Display Rules-Hiding Negative/Commitment Product Term 1 .35
Display Rules-Hiding Negative /Commitment Product Term 2 .72
Surface Acting 1 .86
Surface Acting 2 .76
Surface Acting 3 .90
Deep Acting 1 .95
Deep Acting 2 .89
Job Satisfaction 1 .87
Job Satisfaction 2 .81
Job Satisfaction 3 .80
Customer Service Performance 1 .88
Customer Service Performance 2 .89
Customer Service Performance 3 .86 __________________________________________________________________________________________ Note. All indicators loaded significantly on their respective factors (p < .05).

64
Table 4
Means, Standard Deviations, Reliabilities, and Intercorrelations Among Scales Scale Mean SD 1 2 3 4 5 6 7 8 9 10 11 12 13
1 DRPOS 4.42 .68 .69
2 DRNEG 3.62 1.04 .38* .83
3 COMM 4.18 .69 .40* .15* .69
4 PA 3.82 .64 .11* -.08 .31* .88
5 NA 1.50 .46 -.12* .12* -.33* -.23* .81
6 POS 4.10 .75 .09 -.24* .35* .31* -.28* .88
7 FREQ 4.18 1.02 .40* .22* .15* .09 -.05 -.02 .81
8 DUR 3.12 1.05 .15* .04 .09 .18* -.04 -.07 .38* .83
9 ROUT 3.54 .91 .20* .11* -.01 -.09 .00 -.03 .20* -.19* .64
10 SA 2.07 .71 -.03 .26* -.26* -.40* .42* -.29* .11 -.00 .09 .89
11 DA 2.96 1.04 .23* .05 .29* .27* -.02 .12* .21* .18* .08 .03 .85
12 SAT 4.47 .77 .19* -.13* .39* .53* -.35* .51* .05 .12* -.03 -.43* .15* .86
13 CSP 4.59 .51 .09 -.10 .19* .21* -.10 .20* .05 .10 -.06 -.10 .07 .25* .89
Note. n = 318. * p < .05. Internal consistency reliabilities are reported on the diagonal for all scales. DRPOS = Display Rule Demands-Expressing Positive Emotions; DRNEG = Display Rule Demands-Hiding Negative Emotions; COMM = Commitment to Display Rules; PA = Positive Affectivity; NA = Negative Affectivity; POS = Perceived Organizational Support; FREQ = Frequency of Interactions; DUR = Duration of Interactions; ROUT = Task Routineness; SA = Surface Acting; DA = Deep Acting; SAT = Job Satisfaction; CSP = Customer Service Performance.
The scale means and standard deviations in the present study are also similar to those
in previous research. For example, means and standard deviations for PA and NA in the
present study are consistent with those in Cropanzano et al. (1993) (Study 1 – PA: M = 3.70,
SD = .49; NA: M = 1.61, SD = .46; Study 2 – PA: M = 3.94, SD = .58; NA: M = 1.64, SD =

65
.57). Also, the mean and standard deviation for customer service performance in the present
study are similar to those found by Grandey (in press) (M = 4.69, SD = .61).
To test for multivariate normality of the data, Mardia’s (1970) PK statistic was
calculated. Based on functions of skewness and kurtosis, this statistic should be less than 3.00
in order for the assumption of multivariate normality in SEM to be met (Mardia, 1970;
Romeu & Ozturk, 1993). In the present investigation, Mardia’s statistic (PK) equals 1.15,
thereby meeting the assumption of overall multivariate normality.
Full Structural Model
The next step in SEM is to evaluate the full structural model, which contains both the
final DR2 measurement model as well as the hypothesized structural paths among the latent
variables. It is important to note that the fit of the structural model can only be as good as the
measurement model fit allows. Therefore, while fit indices are still important to examine, the
critical test for assessing the impact of applying structural constraints to a model is to perform
a chi-square difference test (Joreskog & Sorbom, 1993). In order for a structural model to be
retained, the change in chi-square between the structural model and the measurement model
should be nonsignificant.
Hypothesized Structural Model
The hypothesized full structural model (see Figure 2) consists of paths from all the
antecedents (display rule demands for expressing positive emotions, display rule demands for
hiding negative emotions, commitment to display rules, PA, NA, POS, frequency of
interactions, duration of interactions, task routineness), including the two interaction terms
(display rule demands-expressing positive/commitment, and display rule demands-hiding
negative/commitment), to surface acting and deep acting, which in turn have links to job

66
COMM
PA
NA
POS
FREQ
DUR
ROUT
SA
DA
SAT
CSP
Figure 2. Hypothesized structural model. * p < .05. DRPOS = display rule demands for expressing positive emotions; DRNEG = display rule demands for hiding negative emotions; COMM = commitment to display rules; PDRCOM = DRPOS*COMM product term; NDRCOM = DRNEG*COMM product term; PA = positive affectivity; NA = negative affectivity; POS = perceived organizational support; FREQ = frequency of interactions; DUR = duration of interactions; ROUT = task routineness; SA = surface acting; DA = deep acting; SAT = job satisfaction; CSP = customer service performance.
PDRCOM
ROUT
DRPOS
DRNEG
COMM
NDRCOM
-.02
-.21 .23*
-.10 -.15
.57*
-.33*
.19* .32*
.28*
.00
-.09
.18*
.16*
.10
.00
.00
.21
.04
-.15
-.06
.26*
-.55*
-.17*
.21*
.10*

67
satisfaction and customer service performance. The results of this model revealed significant
paths from display rule demands for hiding negative emotions to surface acting, commitment
to display rules to deep acting, PA and NA to both surface acting and deep acting, frequency
to surface acting, duration to deep acting, and one significant interaction term (commitment
moderating the relationship between display rule demands for hiding negative emotions and
deep acting). In addition, there were significant paths from both surface acting and deep
acting to both job satisfaction and customer service performance. This model met Hu and
Bentler’s (1999) decision rule stating that good fit is present when the RMSEA is less than .06
and the SRMR is less than .09 (χ2 = 1523.14, df = 788; RMSEA = .054; SRMR = .080; CFI =
.88; NNFI = .86); however, it resulted in a significant decrement in fit in comparison to the
measurement model (∆χ2 (23) = 135.70, p < .05). Table 5 presents the fit indices for the
measurement model, hypothesized structural model, and alternative structural models, which
are discussed next.
Table 5
Fit Indices for Measurement Model and Structural Models
Model χ2 df p RMSEA SRMR CFI NNFI ∆χ2 to MM
MM 1387.44 765 .00 .051 .067 .90 .88 --
Hyp. SM 1523.14 788 .00 .054 .080 .88 .86 135.70*
Alt. SM 1 1414.45 781 .00 .051 .068 .89 .88 27.01*
Alt. SM 2 1416.04 784 .00 .050 .068 .89 .88___ __28.60 __
Note. MM = measurement model; SM = structural model; * p < .05.

68
Alternative Structural Models
As proposed in the introduction of this paper, an alternative model (Alternative SM 1)
was tested that retained all paths from the hypothesized structural model and added direct
paths from PA, NA, and POS to job satisfaction and customer service performance as well as
a path from job satisfaction to customer service performance (see Figure 3, where solid lines
represent paths from the hypothesized model and dashed lines represent the alternative direct
paths). This model contained significant paths from display rule demands for hiding negative
emotions to surface acting; commitment to display rules to deep acting; PA and NA to surface
acting, deep acting, and job satisfaction; POS to job satisfaction; duration to deep acting; one
significant interaction term (commitment moderating the relationship between display rule
demands for hiding negative emotions and deep acting); surface acting to job satisfaction; and
job satisfaction to customer service performance. Alternative SM 1 met Hu and Bentler’s
(1999) stringent decision rule regarding the RMSEA and the SRMR (χ2 = 1414.45, df = 781;
RMSEA = .051; SRMR = .068; CFI = .89; NNFI = .88), and it fit the data significantly better
than the hypothesized structural model (∆χ2 (7) = 108.69, p < .05). However, it resulted in a
significant decrement in fit compared to the measurement model (∆χ2 (16) = 27.01, p < .05).
An examination of the paths in Alternative SM 1 revealed that three of the alternative
paths that had been added to the originally hypothesized structural model were non-significant
(PA, NA, and POS to customer service performance). Therefore, a second alternative model
(Alternative SM 2) was tested in which these three non-significant paths were dropped (see
Figure 4). Alternative SM 2 met Hu and Bentler’s (1999) stringent decision rule stating that
good fit is present when the RMSEA is less than .06 and the SRMR is less than .09 (χ2 =
1416.04, df = 784; RMSEA = .050; SRMR = .068; CFI = .89; NNFI = .88), and it was not

69
COMM
PA
NA
POS
FREQ
DUR
ROUT
SA
DA
SAT
CSP
Figure 3. Alternative structural model #1. * p < .05. DRPOS = display rule demands for expressing positive emotions; DRNEG = display rule demands for hiding negative emotions; COMM = commitment to display rules; PDRCOM = DRPOS*COMM product term; NDRCOM = DRNEG*COMM product term; PA = positive affectivity; NA = negative affectivity; POS = perceived organizational support; FREQ = frequency of interactions; DUR = duration of interactions; ROUT = task routineness; SA = surface acting; DA = deep acting; SAT = job satisfaction; CSP = customer service performance.
PDRCOM
ROUT
DRPOS
DRNEG
COMM
NDRCOM
.00
-.25
.22*
-.11 -.14
.61*
-.31*
.17* .33*
.30*
.04
-.12
.17
.17*
.11
.02
.00
.21
.05
-.17
-.05
.27*
-.12*
.04
.01
.01
.19*
.38*
.11
-.16*
.02
.34*
.10

70
COMM
PA
NA
POS
FREQ
DUR
ROUT
SA
DA
SAT
CSP
Figure 4. Alternative structural model #2. * p < .05. DRPOS = display rule demands for expressing positive emotions; DRNEG = display rule demands for hiding negative emotions; COMM = commitment to display rules; PDRCOM = DRPOS*COMM product term; NDRCOM = DRNEG*COMM product term; PA = positive affectivity; NA = negative affectivity; POS = perceived organizational support; FREQ = frequency of interactions; DUR = duration of interactions; ROUT = task routineness; SA = surface acting; DA = deep acting; SAT = job satisfaction; CSP = customer service performance.
PDRCOM
ROUT
DRPOS
DRNEG
COMM
NDRCOM
.00
-.25
.22*
-.12 -.14
.61*
-.31*
.17* .33*
.30*
.04
-.11
.17
.17*
.11
.01
.00
.21
.05
-.17
-.05
.27*
-.12*
.02
.01
.03
.30*
.39*
-.16*
.35*

71
significantly different from the measurement model (∆χ2 (19) = 28.60, p > .05). Therefore,
Alternative SM 2 was retained as the final model. It should be noted that the fit of this
structural model could be enhanced further by removing other nonsignificant paths, but these
paths were left in for the sake of completeness.
In regards to the hypotheses in the current study, the following paths from the final
structural model were statistically significant. Display rule demands for hiding negative
emotions is positively related to surface acting (partially supporting H1a); commitment to
display rules is positively related to deep acting (supporting H2b); PA is negatively related to
surface acting (supporting H3a), positively related to deep acting (not supportive of H3b
because it is significant in the opposite direction of the hypothesis), and positively related to
job satisfaction (supporting AH10a); NA is positively related to both surface acting and deep
acting (supporting H3c and H3d, respectively), and negatively related to job satisfaction
(supporting AH11a); POS is positively related to job satisfaction (supporting AH12a);
duration is positively related to deep acting (supporting H6b); one significant interaction term
indicating that commitment moderates the relationship between display rule demands for
hiding negative emotions and deep acting (partially supporting H2c); surface acting is
negatively related to job satisfaction (supporting H8a); and job satisfaction is positively
related to customer service performance (supporting AH13).
Additional Analyses
Four of the present study’s hypotheses (H1c, H1d, H3e, and H5c) proposed that a
particular variable would be more strongly related to surface acting than deep acting or vice
versa. To test each of these hypotheses, models were tested in which the paths from the
variable of interest to surface acting and from the same variable to deep acting were

72
constrained to be equal. This model then was compared to the final structural model via a
chi-square difference test. If the change in chi-square is significant (i.e., the model with the
two paths constrained to be equal fits significantly worse than the final structural model) and
the original paths are in the expected direction, then the hypothesis is supported.
For Hypothesis 1c, which states that display rule demands for expressing positive
emotions are more strongly related to deep acting than surface acting, and Hypothesis 5c,
which states that the frequency of interactions is more strongly related to surface acting than
deep acting, none of the relevant paths were significant in the final structural model.
Therefore, it was not necessary to test these models by constraining the paths to be equal and
comparing them to the final structural model. Hence, these two hypotheses were not
supported.
Regarding Hypothesis 1d, which states that display rule demands for hiding negative
emotions are more strongly related to surface acting than deep acting, the path to surface
acting was significant (.22) and the path to deep acting was not (-.12). After constraining
these two paths to be equal and comparing this model to the final structural model, the results
showed a significant change in chi-square (∆χ2 (1) = 4.00, p < .05). Therefore, Hypothesis 1d
is supported.
Hypothesis 3e states that NA is more strongly related to surface acting than deep
acting. Both of these paths were significant (.33 and .30, respectively). A model in which
these two paths were constrained to be equal was compared to the final structural model, and
the results revealed a non-significant change in chi-square (∆χ2 (1) = 2.01, p > .05). Thus,
Hypothesis 3e is not supported. Table 6 provides a summary of the results pertaining to each
hypothesis in the present study.

73
Table 6
Summary of Results by Hypothesis
Hypothesis Result
H1a: There is a positive relationship between the perceptions of
organizational display rule demands (expressing positive emotions
and hiding negative emotions) and surface acting. Partially supported
H1b: There is a positive relationship between the perceptions of
organizational display rule demands (expressing positive emotions
and hiding negative emotions) and deep acting. Not supported
H1c: Display rule demands for expressing positive emotions are more
strongly related to deep acting than surface acting. Not supported
H1d: Display rule demands for hiding negative emotions are more
strongly related to surface acting than deep acting. Supported
H2a: There is a positive relationship between commitment to display
rules and surface acting. Not supported
H2b: There is a positive relationship between commitment to display
rules and deep acting. Supported
H2c: Commitment to display rules moderates the relationship between
display rule demands and emotional labor such that if there is low
commitment, there is little or no relationship between the display rule
demands (expressing positive and hiding negative emotions) and emotional
labor (surface acting and deep acting). Partially supported
H3a: There is a negative relationship between PA and surface acting. Supported
H3b: There is a negative relationship between PA and deep acting. Not supported
H3c: There is a positive relationship between NA and surface acting. Supported
H3d: There is a positive relationship between NA and deep acting. Supported
H3e: NA is more strongly related to surface acting than deep acting. Not supported

74
Table 6 continued
_________________________________________________________________________________________
H4a: There is a positive relationship between POS and surface acting. Not supported
H4b: There is a positive relationship between POS and deep acting. Not supported
H5a: There is a positive relationship between frequency of interactions
and surface acting. Not supported
H5b: There is a positive relationship between frequency of interactions
and deep acting. Not supported
H5c: Frequency of interactions is more strongly related to surface acting
than deep acting. Not supported
H6a: There is a negative relationship between duration of interactions and
surface acting. Not supported
H6b: There is a positive relationship between duration of interactions and
deep acting. Supported
H7a: There is a positive relationship between task routineness and surface acting. Not supported
H7b: There is a negative relationship between task routineness and deep acting. Not supported
H8a: There is a negative relationship between surface acting and job satisfaction. Supported
H8b: There is a positive relationship between deep acting and job satisfaction. Not supported
H9a: There is a negative relationship between surface acting and customer
service performance. Not supported
H9b: There is a positive relationship between deep acting and customer
service performance. Not supported
AH10a: There is a positive relationship between PA and job satisfaction. Supported
AH10b: There is a positive relationship between PA and customer service
performance. Not supported
AH11a: There is a negative relationship between NA and job satisfaction. Supported

75
Table 6 continued
_________________________________________________________________________________________
AH11b: There is a negative relationship between NA and customer service
performance. Not supported
AH12a: There is a positive relationship between POS and job satisfaction. Supported
AH12b: There is a positive relationship between POS and customer service
performance. Not supported
AH13: There is a positive relationship between job satisfaction and customer
service performance. Supported _________________________________________________________________________________________

76
DISCUSSION
The goal of the present study was to test a model of emotional labor including various
factors thought to be related to the emotional labor strategies of surface acting and deep
acting. Several of the paths in the final structural model were significant, indicating support
for those corresponding hypotheses proposed in the current investigation. The following
sections present a discussion of this study’s findings, implications for research and practice,
limitations of the current study, and potential directions for future research.
Relationships between Antecedents and Emotional Labor
Perceived Display Rule Demands
Recent research (Diefendorff & Richard, in press) and confirmatory factor analyses in
the present study demonstrate that display rule demands for expressing positive emotions and
those for hiding negative emotions are distinct constructs. This study proposed that both of
these types of display rule demands would be positively related to surface acting and deep
acting. Results from the structural analyses revealed only a positive relationship between
display rule demands for hiding negative emotions and surface acting. This significant path is
consistent with the research results of Brotheridge and Grandey (2002), who also found a
positive relationship between these two variables. This finding suggests that employees who
perceive that their organization has display rules requiring that they hide their negative
emotions are likely to engage in surface acting (i.e., faking and/or suppressing emotions).
Display rule demands for hiding negative emotions did not have a direct relationship with
deep acting, but did interact with commitment to display rules to predict deep acting. This
interaction is discussed in more detail in the next section.

77
Contrary to expectations and past research (e.g., Brotheridge & Grandey, 2002;
Grandey, in press, 2002), there were no direct or moderated relationships between display rule
demands for expressing positive emotions and surface acting or deep acting. Although
bivariate correlations showed a significant positive relationship between display rule demands
for expressing positive emotions and deep acting, this path was not significant in the final
structural model. These results indicate that this antecedent does not explain any unique
variance in deep acting above and beyond that accounted for by other antecedents. For
example, the significant relationships between the affectivity variables and display rules for
expressing positive emotions may have accounted for any relationship between these display
rules and deep acting. Another possible contributor to these nonsignificant findings is that
there may have been a restriction of range for display rule demands for expressing positive
emotions in that all employees who participated in this study were in service-related jobs
where norms for displaying positive emotions may be fairly explicit and uniform. Descriptive
statistics for the display rule demands for expressing positive emotions variable lend support
to this explanation, with an average rating of 4.42 on a five-point scale and a standard
deviation of .68. Display rule demands for hiding negative emotions, on the other hand, had a
lower mean and more variance (M = 3.62; SD = 1.04), which may have contributed to
detecting a significant relationship.
Commitment to Display Rules
A notable contribution of this paper is that it measured whether or not employees were
actually committed to display rules, which previous studies have neglected to do. Measuring
commitment is important because if an employee is not committed to the display rules, then
these display rules should not affect behavior (Diefendorff & Gosserand, 2002). The current

78
study proposed both main effects of commitment on the emotional labor strategies as well as
moderating effects on the relationship between perceived display rule demands and the
emotional labor strategies. For moderation to occur, sufficient variance in both display rule
demands and commitment to display rules is needed. If display rule demands are uniformly
high (i.e., small variance in display rules), commitment should have a main effect on
emotional labor. If commitment is uniformly high, only display rule demands should have a
main effect on emotional labor, with no main or moderating effects for commitment. Having
sufficient variance in both display rule demands and commitment to display rules should
allow for main effects for both variables as well as an interaction between the variables in
predicting emotional labor.
Results revealed a main effect of commitment to display rules on deep acting, but no
main effect on surface acting. The path from commitment to deep acting (.61) was the
strongest of all of the path coefficients in the model. Thus, an employee who is highly
committed to displaying organizationally desired emotions is likely to engage in deep acting
(e.g., think positive thoughts to get in a good mood with the goal of expressing genuinely
positive emotions) in order to express the appropriate emotions in service interactions. The
nonsignificant relationship between commitment and surface acting indicates that individuals
who are highly committed to the display rules are just as likely to surface act as individuals
low on commitment. These findings imply that individuals do not have to be committed to
display rules to fake their emotions, yet some level of commitment is needed in order for
individuals to attempt to transform their actual feelings so that they match the organizationally
desired emotions.

79
As mentioned previously, an important function of commitment to a goal (in this case,
display rules are the goal) is to moderate the relationship between the goal and the behaviors
that follow (i.e., surface acting and deep acting) (Klein et al., 1999). Results showed that
there was one significant interaction involving these relationships: commitment to display
rules moderated the relationship between display rule demands for hiding negative emotions
and deep acting. Specifically, the interaction showed that for highly committed people, there
is a strong positive relationship between display rules for hiding negative emotions and deep
acting. That is, a person with a strong commitment to display rules who perceives high
demands for hiding negative emotions deep acts more frequently than a person who does not
perceive high demands for hiding negative emotions. In other words, perceiving display rule
demands for hiding negative emotions and making this a personal goal is related to
individuals’ attempts to get rid of their negative emotions via deep acting techniques. At low
levels of commitment, the relationship between display rule demands for hiding negative
emotions and deep acting is negligible.
The lack of main or interactive effects for display rule demands for expressing positive
emotions may be due to the uniformly high ratings for and lack of variance in this particular
variable. As mentioned before, this may be explained by the fact that all employees in the
current investigation were in service-related jobs that may have had fairly explicit norms for
displaying positive emotions. Another possible reason for the lack of other moderating
effects of display rule commitment is that statistical interactions in field studies often are
difficult to detect (McClelland & Judd, 1993). Research has shown that the statistical power
for detecting interactions in field studies is relatively low compared to that of experimental
studies (McClelland & Judd, 1993). In order to detect an interaction, a full range of responses

80
for the variables is needed; however, field studies, without the benefit of manipulated
variables, are more likely to experience range restriction than experimental studies. This fact
makes it harder to detect significant interactions.
In sum, commitment to display rules is strongly related to deep acting and moderates
the relationship between display rules for hiding negative emotions and deep acting in the
expected fashion. These results suggest that there is a motivational component influencing
whether employees engage in behaviors to conform to organizational display rules. Past
research has ignored the possibility of a motivational component (e.g., Grandey, in press,
2002). The findings in the current study suggest that the mere presence of display rules may
not result in attempts to regulate one’s emotions and emotional displays to conform to those
display rules; an individual must be personally committed to following those display rules for
them to affect behavior. This is the first study to examine this commitment construct in the
context of emotional labor and to show that is indeed a critical aspect in this arena.
Positive and Negative Affectivity
Positive affectivity (PA) and negative affectivity (NA) were significantly related to
both surface acting and deep acting in the present study. As predicted, PA was negatively
related to surface acting. This result is consistent with past empirical research by Grandey
(2002), who found a negative correlation between these two variables. Therefore, it appears
that individuals high on PA are less likely to manage their emotions by surface acting than
individuals low on PA. The present study also hypothesized that PA would be negatively
related to deep acting because it was assumed that individuals high on PA would rarely have
to engage in any type of emotional labor due to their tendency to experience positive emotions
naturally most of the time. However, this was not the case. In fact, results showed the

81
opposite in that PA was positively related to deep acting. Although this positive relationship
was not expected, it is not altogether surprising. A potential explanation for this finding is
that every person, regardless of inherent dispositions, may experience negative emotions in
response to difficult work events. However, in these situations, people high on PA may be
more likely to attempt to modify their actual feelings to be more positive (deep acting) than
people low on PA.
The significant paths from NA to surface acting and deep acting indicated positive
relationships between these variables. The finding of a significant positive relationship
between NA and surface acting is consistent with previous research (Brotheridge & Grandey,
2002; Grandey, 2002). Although this past research also has hypothesized a positive
relationship between NA and deep acting, this is the first study to find such a relationship.
These findings demonstrate that individuals high on NA, whose natural dispositions include
pessimism and anxiousness, are more likely to engage in emotional labor (both deep acting
and surface acting) to manage their emotions and expressions so that they are consistent with
the organizationally desired emotions and expressions. (Note: The relationships between
these affectivity variables and the outcome variables are discussed in a later section.)
Perceived Organizational Support
This is the first study that has examined the relationship between POS and emotional
labor. Contrary to hypotheses, POS was not significantly related to either surface acting or
deep acting. Although significant bivariate correlations suggest relationships exist between
these variables, the POS paths to the emotional labor strategies in the structural model were
nonsignificant when taking all other predictors of surface acting and deep acting into

82
consideration. These results indicate that POS did not account for any additional unique
variance in emotional labor beyond that accounted for by the other antecedents.
These nonsignificant findings do not support the idea that employees who feel high
levels of POS also feel an obligation to reciprocate by performing behaviors that support
organizational goals, which they believe will in turn be rewarded by the organization (Wayne
et al., 1997). It is possible that employees in this study simply did not consider regulating
their emotions as a way to “repay” an organization for its support; doing so may have more to
do with their commitment to or involvement in their jobs, rather than their feelings toward the
organization. (Note: The relationships between POS and the outcome variables are discussed
in a later section.)
Service Interaction Characteristics
Out of the six paths from the service interaction characteristics (frequency, duration,
and task routineness) to the emotional labor strategies, only one path was significant. Results
showed that duration of interactions was positively related to deep acting, as expected. Thus,
the longer the interaction with a customer, the more likely an employee will engage in deep
acting to regulate his/her emotions. The results for duration are consistent with Brotheridge
and Grandey (2002), who found a positive relationship between duration and deep acting, but
no relationship between duration and surface acting. The nonsignificant path to surface acting
suggests that individuals who choose to surface act will do so regardless of the length of the
typical interaction with customers.
There were no significant relationships from frequency or routineness of interactions
to either surface acting or deep acting. The findings involving frequency are surprising given
that Brotheridge and Grandey (2002) demonstrated positive relationships between this

83
variable and both surface acting and deep acting and Grandey (2002) found that frequency
was positively related to surface acting (but not deep acting). There are a couple of possible
reasons for these discrepant results. First, the significant relationships found in the two
previous studies just mentioned were based on bivariate correlations. Bivariate correlations in
the present study show a significant and positive relationship between frequency and deep
acting, but the path in the structural model was not significant, indicating that frequency did
not account for significant, unique variance in deep acting beyond that of the other
antecedents (e.g., duration). Therefore, it is possible that if more comprehensive analyses had
been used in past research, those studies may have found results similar to the present study.
A second possible explanation for the discrepant results may be due to frequency of
interactions being measured differently in past research than in this study. In particular,
Grandey (2002) used one open-ended question asking for the average number of customers
that employees interacted with per hour, whereas the present study had three Likert-type items
generated for this study (Brotheridge & Grandey, 2002, used one Likert-type item that asked
respondents to rate the extent to which they interacted with customers on an average day). It
is possible that open-ended questions allow for more variance in the responses, which may
explain the significant results using this type of item to measure frequency in Grandey (2002).
As for task routineness, past research has suggested that this variable may be related to
emotional labor (Morris & Feldman, 1996, 1997), but no previous research has examined its
relationship with surface acting and deep acting specifically. The present study showed no
evidence for a direct relationship between task routineness and either surface acting or deep
acting. Therefore, these results indicate that task routineness did not make a difference in

84
whether individuals engaged in surface acting or deep acting in service interactions. More
research is needed to decipher how service interaction characteristics impact emotional labor.
Relationships with Outcome Variables
The findings related to the outcome variables, job satisfaction and customer service
performance, are now discussed. The paths proposed as alternative hypotheses are presented
first, followed by the hypothesized paths from the emotional labor strategies to the outcomes.
Results are discussed in this order because the findings for the alternative paths aid in
understanding the relationships between emotional labor and the outcome variables.
Alternative Path from Job Satisfaction to Customer Service Performance
The final structural model demonstrated a significant path from job satisfaction to
customer service performance. This finding is consistent with a large body of past research,
which also has shown a positive relationship between satisfaction and performance (e.g.,
Judge et al., 2001). In fact, the magnitude of this study’s finding ( = .30) is the same as
reported in Judge et al.’s (2001) meta-analysis of 312 independent samples from 254 studies.
This result indicates that if employees are happy with their jobs, then they are more likely to
deliver quality customer service (in terms of affective style of service delivery), as rated by
supervisors.
Alternative Paths from Affectivity and POS to Outcomes
In the first alternative structural model tested, paths were added from PA, NA, and
POS directly to job satisfaction and customer service performance. The paths from these
variables to job satisfaction were significant, but the paths to customer service performance
were nonsignificant and dropped for the final model. Consistent with expectations, PA was
positively related to job satisfaction, whereas NA was negatively related to job satisfaction.

85
These results corroborate the findings from past research (Connolly & Viswesvaran, 2000;
Cropanzano et al., 1993), indicating that the predominantly positive feelings of high PA
individuals and negative feelings of high NA individuals may spill over into their satisfaction
with their jobs. These findings occurred independent of surface acting and deep acting,
suggesting that regardless of whether or not an individual engages in emotional labor, natural
dispositions of people are related to satisfaction with their jobs. In examining the full model,
affectivity has direct effects on job satisfaction as well as indirect effects through surface
acting (supplemental analyses showed that when the path from surface acting to satisfaction
was dropped, the paths from PA and NA to satisfaction increased in magnitude, indicating
partial mediation). In addition, POS was positively related to job satisfaction, as expected,
and this finding was independent of surface and deep acting. This finding supports the idea
that employees who perceive that their organization values their contributions and cares about
their well-being are more likely to be satisfied with their jobs (Eisenberger et al., 1997).
Although the paths from these variables to customer service performance in the final
model were not significant, bivariate correlations showed that PA and POS were positively
and significantly related to customer service performance. Furthermore, supplemental
analyses demonstrated that when the path from job satisfaction to customer service
performance was removed from the model, the paths from PA and POS to customer service
performance were significant ( = .19 and .17, respectively). These results suggest that job
satisfaction mediates the relationship between these two antecedents and performance. That
is, PA and POS may relate to customer service performance through job satisfaction.

86
Hypothesized Paths from Surface Acting and Deep Acting to Outcomes
Surface acting and deep acting were proposed to be related to both job satisfaction and
customer service performance in the present study. However, the only support for these
relationships in the final model was a significant negative path from surface acting to job
satisfaction, indicating that suppressing or faking one’s emotions may result in lower job
satisfaction. This finding is consistent with recent research by Grandey (in press), who also
found a negative relationship between surface acting and job satisfaction. Past research also
has supported the negative relationship between job satisfaction and emotional dissonance,
which is conceptually similar to surface acting in that employees who surface act are likely to
experience emotional dissonance (e.g., Abraham, 1998; Morris & Feldman, 1997).
Deep acting was unrelated to job satisfaction in the final structural model. However,
prior to adding the alternative paths from PA, NA, and POS to job satisfaction, deep acting
had a significant and positive path to satisfaction, as hypothesized (bivariate correlation also
showed a significant positive relationship). Supplemental analyses showed that PA was
primarily responsible for the reduction in variance in that the deep acting and job satisfaction
path became nonsignificant when the PA and satisfaction path was included. Deep acting did
account for unique variance in job satisfaction beyond that accounted for by NA and POS.
Exploratory analyses shed some additional insight on the relationship between deep
acting and job satisfaction in that PA moderated this relationship ( = -.71, p = .03, ∆R2 =
.01). Specifically, a negative relationship exists between deep acting and satisfaction for
individuals high on PA, yet a positive relationship exists between these variables for
individuals low on PA. It might be the case that if an individual is high on PA and reports
deep acting frequently, that person may be doing so because he/she experiences an inordinate

87
amount of negative events on the job. That is, a person high on PA may deep act frequently
because he/she holds a job involving high levels of stress, negative affective events, or other
environmental constraints. These negative circumstances may cause the individual to report
low job satisfaction (Hochschild, 1983; Weiss & Cropanzano, 1996). Conversely, if an
individual is low on PA and reports high levels of deep acting, that person may be doing so
simply because he/she is in a naturally downbeat state, rather than the job having a great deal
of negative characteristics. Thus, when this type of person deep acts, it may be a result of a
naturally negative disposition rather than negative affective events. For a person low on PA,
deep acting should improve his/her affect beyond base-line levels, resulting in more positive
affect than usual and increased satisfaction. These findings suggest that high PA people may
deep act because of situational factors (e.g., negative events), whereas low PA people may
deep act because of their natural dispositions (e.g., listless, apathetic). Due to the exploratory
nature of these findings, future research should attempt to test these relationships more
systematically (e.g., testing the impact of negative events and stressful jobs on job satisfaction
for individuals with different dispositions).
Another intriguing finding related to the relationship between emotional labor and
customer service performance is that in the originally hypothesized model, surface acting was
significantly and negatively related to customer service performance and deep acting was
significantly and positively related to customer service performance (both as expected).
Supplemental analyses were conducted in which the final structural model was tested without
the path from satisfaction to performance to see if the paths from the emotional labor
strategies to performance became significant again. The path from surface acting to customer
service performance became significant, but the path from deep acting did not. Perhaps the

88
reason the path from deep acting to performance remained nonsignificant in these
supplemental analyses is that this path was only slightly above conventional significance
levels in the hypothesized structural model. With the additional alternative paths from PA,
NA, and POS to job satisfaction, the path from deep acting to performance dropped to slightly
below significance levels and remained nonsignificant even when the path from satisfaction to
performance was dropped. Maximum-likelihood estimation in SEM is a full information
estimation technique, and therefore, changes in one part of a model can lead to changes in
other parts of the model. These supplemental analyses support the argument that job
satisfaction mediated the relationship between surface acting and customer service
performance in the present study.
The nonsignificant paths from the emotional labor strategies directly to customer
service performance in the final structural model contradict past research (e.g., Grandey, in
press, 2002), which demonstrated that a relationship exists between these variables. Grandey
(2002) found that surface acting and deep acting significantly predicted affective delivery
(similar to this study’s customer service performance construct), even after controlling for the
effects of PA and NA. One possible reason for the nonsignificant paths from the emotional
labor strategies to performance in the present study is that the ratings of customer service
performance were uniformly high. This construct had the highest mean (M = 4.59) and nearly
the smallest variance (SD = .51) of all the variables in the model. Thus, range restriction may
have caused truly significant relationships between these variables to go undetected.
However, ratings of performance in both Grandey (in press) and Grandey (2002) had small
variances also.

89
There are at least two potential explanations for the differences in the findings of past
research and the present study. First, in Grandey’s (2002) study, employees rated themselves
on their affective delivery and emotional labor strategies, which may have artificially inflated
the relationship between these variables. In the present investigation, employees rated their
emotional labor strategy use, whereas supervisors rated employees’ customer service
performance. Second, the analytic approach (SEM) in this study allowed for job satisfaction
to act as a mediator of the relationship between surface acting and customer service
performance. As previously stated, the current investigation showed that surface acting did
not account for any unique variance in customer service performance beyond that accounted
for by job satisfaction; that is, job satisfaction mediated the relationship between surface
acting and performance. Job satisfaction may have acted similarly as a mediator in Grandey’s
(in press, 2002) research if it had been examined as such in her studies. This study
demonstrates that job satisfaction may be an important link between emotional labor and
customer service performance.
Implications
The present investigation has several implications for research and practice. On the
research front, the current study makes several contributions to the existing organizational
literature. First, the analytic approach in this study and the inclusion of several new variables
provide a more stringent test of an emotional labor model than past research (e.g., Grandey, in
press, 2002). In particular, SEM allows for simultaneous estimation of several relationships,
whereas regression is additive in nature (i.e., variables are added to an equation) and does not
allow for relational specification of multiple variable relationships (Schumacker & Lomax,

90
1996). The tests in the present investigation allow for a more complete examination of factors
related to emotional labor than past research.
Second, a major theoretical contribution is that this is the first study to assess
commitment to display rules and to examine job satisfaction as an outcome of surface acting
and deep acting. Commitment and job satisfaction proved to be integral pieces of the puzzle
in understanding emotional labor and its relationships with other variables. This study
showed that the only relationship that emotional labor had with customer service performance
was through the mediating effect of satisfaction. In addition, this was the first study to
measure commitment to display rules, which showed that at least in the case of display rules
for hiding negative emotions, it is critical for employees to be truly committed to this type of
display rule in order for it to impact the use of deep acting as an emotional labor strategy.
In addition, the present investigation confirmed and extended past research regarding
the relationship between affectivity, emotional labor, and job satisfaction. First, this study
confirmed findings of past research that surface acting is negatively related to PA and
positively related to NA (Brotheridge & Grandey, 2002; Grandey, 2002). Furthermore, this
study was the first to show significant relationships between PA and NA with deep acting. In
addition, results demonstrated that affectivity has direct effects on job satisfaction as well as
indirect effects through surface acting. One surprising finding was that PA was positively
related to deep acting, which contradicts Grandey’s (2000) argument (and the current study’s
hypothesis) that people who naturally feel positively most of the time do not need to engage
in emotional labor to display organizationally desired emotions. Finally, previous research
has been unclear as to the relationship between deep acting and job satisfaction. Some
researchers have suggested that this relationship is negative due to the effort involved in deep

91
acting (e.g., Hochschild, 1983; Grandey, 2000), while others (including this study) have
argued that the relationship may be positive (e.g., Kruml & Geddes, 2000b). The present
study indicated that affectivity plays a role in this relationship, which may provide some
insight into these opposing views. Specifically, exploratory analyses showed that a negative
relationship exists between deep acting and satisfaction for individuals high on PA, yet a
positive relationship exists between these variables for individuals low on PA. Future
research should measure negative affective events and other stressful aspects of jobs to
determine whether they interact with dispositional affect to influence job satisfaction and the
use of emotional labor strategies. All in all, these theoretical contributions serve to increase
our knowledge of the nomological network of emotional labor.
The current study also made some methodological contributions. First, individuals
were sampled from many different types of service-related occupations across a wide variety
of organizations. This sampling methodology decreases the possible impact of contextual
constraints inherent in a particular occupation or organization as well as increases the
generalizability of the results. However, even with the wide variety of occupations and
organizations, range restriction still may have had an effect on some variables (e.g., uniformly
high ratings and low variance of display rule demands for expressing positive emotions).
Second, much emotional labor research has collected data only from a single source, the
employee (e.g., Brotheridge & Grandey, 2002; Grandey, 2002; Schaubroeck & Jones, 2000).
However, in the present study, supervisors rated employees’ customer service performance,
thereby decreasing the chances for percept-percept inflation in these correlations.
Several practical implications of this study also exist for organizations with employees
in service-related jobs. Because research has shown a link from employee satisfaction to

92
customer satisfaction and bottom-line organizational productivity (Colihan, 2001, 2002;
Schneider & Bowen, 1985), the findings of the present study may be of interest to
organizations that wish to improve these business outcomes. First, it is important that
organizations are aware of the messages they send to employees about which types of
emotional displays are appropriate in service interactions. The employees’ perceptions of
these display rules may impact the ways in which they choose to manage their emotional
expressions. For example, people who perceive a high level of display rule demands for
hiding negative emotions may prefer to surface act (especially if they are low on commitment
to display rules) by simply faking a smile. Furthermore, organizations should make an effort
to ensure that their employees are committed to the display rules. This may be done through
socialization practices (e.g., orientations, training) and by providing a clear link between
effective emotional displays and organizational rewards.
So what type of employees should organizations recruit and hire in order to maximize
job satisfaction and customer service performance? The present study indicates that PA and
NA may be important traits related to these outcomes. Individuals high on PA are less likely
to surface act (which negatively relates to job satisfaction), more likely to deep act, and tend
to be more satisfied with their jobs, which in turn positively relates to customer service
performance. Individuals low on NA are less likely to have to perform any type of emotional
labor at all and are more satisfied with their jobs, relating to increased customer service
performance. Therefore, organizations should recruit and select individuals high on PA and
individuals low on NA.
Another way that organizations can increase their employees’ job satisfaction, thereby
enhancing their customer service performance, is to make efforts to raise employees’

93
perceptions of organizational support. One way to achieve this goal is to recognize and
reward employees for their contributions and desired behaviors. Another way is to let the
employees know that the organization cares for their well-being (e.g., through effective work-
life balance programs). Although this variable did not relate to emotional labor in the current
study, it still appears to be an important indicator of job satisfaction.
Finally, the skills involved in managing one’s emotions and expressions through
emotional labor may be learned. Thus, organizations may benefit from training their
employees on effective strategies to display the appropriate emotions in service interactions.
The present study showed that surface acting was negatively related to job satisfaction, which
in turn was related to performance. Although there was no unique relationship in the present
study between deep acting and the outcomes, past research and theory suggest that these
variables may be positively related (Ashforth & Humphrey, 1993; Brotheridge & Grandey,
2002; Grandey, in press). Therefore, deep acting may be a better alternative than surface
acting if an employee is in a situation where his/her emotions need to be modified.
Organizations may wish to train their employees on the avoidance of surface acting and the
effective use of deep acting techniques (e.g., how to cognitively reappraise a difficult situation
in a more positive light), including the types of situations in which it may be appropriate to
use these deep acting techniques (e.g., in interactions of long duration, it may be helpful to
utilize their deep acting skills). Research exists examining various strategies for regulating
one’s emotions to alleviate negative moods and training individuals on emotion regulation
techniques (Totterdell & Parkinson, 1999).
94
Limitations and Directions for Future Research
As with most research, the present study has its limitations. First, this study utilizes a
cross-sectional design, rather than a longitudinal design. Therefore, causality cannot be
inferred regarding the variables in the path model because all the data was collected at one
point in time. Thus, the current investigation provides estimates of the strength of the
relationships among several constructs important in the workplace. Although the data may be
interpreted in different ways, the model is based on theory and past research, thereby
justifying the causal ordering suggested in this study. Future research could test the
relationships presented in this study in a longitudinal design to examine the effects, for
example, of emotional labor on job satisfaction and customer service performance over time.
An emerging technique in emotional labor research is the use of experience sampling
methodology (ESM), whereby individuals respond to questions regarding their mood,
emotional displays, and emotion regulation repeatedly in real time involving natural work
contexts (Glomb, Miner, & Tews, 2002; Hormuth, 1986). This technique holds a great deal
of promise for emotional labor research.
An additional limitation is the potential for method bias due to participants completing
self-report measures for most of the constructs in the model. One exception is the construct of
customer service performance, which was measured by supervisors. Analyses were
conducted to determine if method variance is a concern in this study by creating a method
factor on which all employee measures loaded. Although a method factor model in
conjunction with the measurement model fit the data significantly better than the
measurement model alone, the gain in the fit indices and the variance accounted for by the
method factor were fairly small. Therefore, it was determined that common method bias is

95
not a serious concern in this investigation. To make method bias even less of an issue in
future studies, researchers could have more measures collected from sources other than the
employees. For example, supervisors could rate their perceptions of display rule demands, as
done in Diefendorff and Richard (in press). Also, researchers might consider looking for
some objective measures of service interaction characteristics (frequency, duration, and task
routineness) based on job type.
Another limitation involves the relatively low reliabilities of some of the measures in
the present study. Specifically, display rule demands for expressing positive emotions,
commitment to display rules, and task routineness had reliabilities that fell slightly below the
acceptable level of .70. A major benefit of structural equation modeling (SEM) is that it
accounts for (corrects for) measurement error in its estimations. This may help in
understanding why some of the path coefficients seemed large enough to be significant, but
were not (e.g., path from task routineness to deep acting was .21 which was not significant).
SEM corrected for the low reliabilities of these measures while demonstrating that these
relationships truly are not significant. Future research should attempt to develop better, more
reliable measures of these variables.
Finally, there is always the possibility for model misspecification when a limited
number of constructs are included in a model. Including other related constructs may increase
the variance accounted for in the model, but it is not possible to include every single relevant
construct. Along these lines, Bentler and Chou (1987) suggest that including too many
variables may decrease the interpretability of the model. The best solution is to hypothesize a
model grounded in theory and previous empirical research, which the present study has done.
One particularly interesting variable that future research should include in models involving

96
emotional labor is the expression of genuine emotions to see how this construct relates to
surface acting, deep acting, and the antecedents and outcomes related to these emotional labor
strategies. In addition, further exploration of additional variables related to emotional labor
(e.g., personality factors, organizational commitment) is needed.
Additional ideas for future research involve the measurement of certain variables,
including that of emotional labor itself. Construct validity studies should be conducted to
make sure that surface acting and deep acting are being effectively operationalized.
Diefendorff et al. (2002) as well as Grandey (2002) have begun some work in this area (e.g.,
examining the relationship between general versus event-specific deep acting items), but
continued efforts are strongly encouraged. Also, this study operationalized commitment to
display rules as commitment to organizationally desired emotions in general, without
reference to a particular type of display rule. This was done because display rule demands
were originally proposed as one factor, but recent research (e.g., Diefendorff & Richard, in
press) and confirmatory factor analyses in this study showed that display rules for expressing
positive emotions and display rules for hiding negative emotions were two distinct constructs.
It would be interesting to see future research measure commitment specific to the types of
display rules of interest (e.g., commitment to display rules for expressing positive emotions).
Finally, there are several avenues for future research related to the results of current
investigation. First, future studies are needed to determine how various characteristics of
service interactions inherent in different types of jobs may require differences in emotional
labor strategies (e.g., surface acting may actually be effective and even preferred in some
types of jobs such as cashiers who frequently deal with many customers back-to-back and
doctors who often are trained not to get too emotionally involved in patient cases). Further,

97
the lack of situational influences in the present study was surprising and deserves greater
attention in future research. Second, future research should take a closer look at possible
moderators (e.g., affectivity) of the relationship between emotional labor and outcomes such
as job satisfaction and customer service performance to more fully understand these
relationships. Finally, future research should continue efforts to determine the most effective
(and ineffective) ways of managing emotions (e.g., cognitive reappraisal, thinking happy
thoughts) so that organizations can train employees on effective emotional labor strategies. In
sum, emotional labor is a relatively young topic in the psychological and business literatures
and full of possibilities for future research.
Conclusion
The present study tested a portion of Grandey’s (2000) model of emotional labor and
extended it in several ways (e.g., including variables not proposed in her model, testing
interaction effects). Results showed that display rules for hiding negative emotions,
commitment to display rules, PA, NA, and duration of interactions were all important
predictors of at least one of the emotional labor strategies. In addition, individuals who are
high on PA, low on NA, and feel supported by their organizations are likely to be satisfied
with their jobs. Finally, employees who surface act tend to have lower job satisfaction, which
in turn relates to their customer service performance. Thus, organizations aiming to improve
employee and customer satisfaction should focus on hiring the right kinds of people, training
them on effective emotional regulation techniques, and creating a climate in which employees
understand the display rule requirements and feel supported by their organizations. Overall,
this study serves to enhance our understanding of emotional labor and the antecedents and
outcomes related to this construct.

98
REFERENCES
Abraham, R. (1998). Emotional dissonance in organizations: Antecedents, consequences, and moderators. Genetic, Social, and General Psychology Monographs, 124 (2), 229-246.
Adelmann, P. K. (1995). Emotional labor as a potential source of job stress. In S. L. Sauter
& L. R. Murphy (Eds.), Organizational risk factors for job stress (pp. 371-381). Washington, DC: American Psychological Association.
Adelmann, P. K., & Zajonc, R. B. (1989). Facial efference and the experience of emotion.
Annual Review of Psychology, 40, 249-280. Algina, J., & Moulder, B. C. (2001). A note on estimating the Joreskog-Yang model for
latent variable interaction using LISREL 8.3. Structural Equation Modeling, 8 (1), 40-52.
Arvey, R. D., Renz, G. L., & Watson, T. W. (1998). Emotionality and job performance:
Implications for personnel selection. Research in Personnel and Human Resources Management, 16, 103-147.
Ashforth, B. E., & Humphrey, R. H. (1993). Emotional labor in service roles: The influence
of identity. Academy of Management Review, 18 (1), 88-115. Ashforth, B. E., & Humphrey, R. H. (1995). Emotion in the workplace: A reappraisal.
Human Relations, 48 (2), 97-125. Bentler, P. M., & Chou, C. P. (1987). Practical issues in structural modeling. Sociological
Methods and Research, 16, 78-117. Blau, P. M. (1964). Exchange and power in social life. New York: Wiley. Bollen, K. A. (1989). Structural equations with latent variables. New York: Wiley. Bollen, K. A. (1996). An alternative two-stage least squares (2SLS) estimate for latent
variable equation. Psychometrika, 61, 109-121. Bollen, K. A., & Long, J. S. (Eds.). (1993). Testing structural equation models. Newbury
Park, CA: Sage. Brotheridge, C. M., & Grandey, A. A. (2002). Emotional labor and burnout: Comparing two
perspectives of ‘people work’. Journal of Vocational Behavior, 60, 17-39. Cammann, C., Fichman, M., Henkins, D., & Klesh, J. (1979). The Michigan Organizational
Assessment Questionnaire. Unpublished manuscript, University of Michigan at Ann Arbor.

99
Cohen, J., & Cohen, P. (1983). Applied multiple regression/correlational analysis for the behavioral sciences (2nd ed). Hillsdale, NJ: Erlbaum.
Colihan, J. (2001). Customer satisfaction relative to competition: Superior criterion in
linkage research?. Paper presented at the 16th Annual Conference of the Society for Industrial and Organizational Psychology. San Diego, CA.
Colihan, J. (2002). Well-being, effectiveness, and job type: Differential effects in linkage
research. Paper presented at the 18th Annual Conference of the Society for Industrial and Organizational Psychology. Orlando, FL.
Connolly, J. J., & Viswesvaran, C. (2000). The role of affectivity in job satisfaction: A meta-
analysis. Personality and Individual Differences, 29 (2), 265-281. Cropanzano, R., James, K., & Konovsky, M. A. (1993). Dispositional affectivity as a
predictor of work attitudes and job performance. Journal of Organizational Behavior, 14, 595-606.
Diefendorff, J. M., Croyle, M. H., & Gosserand, R. H. (2002). Dispositional and situational
antecedents of genuine emotional expressions and emotional labor strategies. Paper presented at the 18th Annual Conference of the Society for Industrial and Organizational Psychology. Orlando, FL.
Diefendorff, J. M., & Gosserand, R. H. (2002, August). A control theory conceptualization of
the emotional labor process. In R. J. Aldag (Chair), Emotions at work: Types and consequences. Symposium conducted at the 62nd annual Academy of Management meeting, Denver, CO.
Diefendorff, J. M., & Richard, E. (in press). Antecedents and consequences of emotional
display rule perceptions. Journal of Applied Psychology. Eisenberger, R., Cummings, J., Armeli, S., & Lynch, P. (1997). Perceived organizational
support, discretionary treatment, and job satisfaction. Journal of Applied Psychology, 82, 812-820.
Eisenberger, R., Huntington, R., Hutchison, S., & Sowa, D. (1986). Perceived organizational
support. Journal of Applied Psychology, 71, 500-507. Ekman, P. (1973). Cross culture studies of facial expression. In P. Ekman (Ed.), Darwin and
facial expression: A century of research in review (pp. 162-222). New York: Academic Press.
Facteau, J. D., Dobbins, G. H., Russell, J. E. A., Ladd, R. T., & Kudisch, J. D. (1995). The
influence of general perceptions of the training environment on pretraining motivation and perceived training transfer. Journal of Management, 21 (1), 1-25.

100
Fisher, C. D., & Ashkanasy, N. M. (2000). The emerging role of emotions in work life: An introduction. Journal of Organizational Behavior, 21, 123-129.
Garson, G. D. (2002). Structural Equation Modeling [On-line]. Available:
http://www2.chass.ncsu.edu/garson/pa765/structur.htm. George, J. M., & Brief, A. P. (1996). Motivational agendas in the workplace: The effects of
feelings on focus of attention and work motivation. Research in Organizational Behavior, 18, 75-109.
Gerbing, D. W., & Anderson, J. C. (1993). Monte Carlo evaluations of goodness-of-fit
indices for structural equation models. In K. A. Bollen & J. S. Long (Eds.), Testing structural equation models (pp. 40-65). Newbury Park, CA: Sage.
Glomb, T. M., Miner, A. G., & Tews, M. J. (2002). An experience sampling analysis of
emotional dissonance at work. Paper presented at the 17th Annual Conference of the Society for Industrial and Organizational Psychology. Toronto, Canada.
Goffman, E. (1959). Presentation of self in everyday life. New York: Overlook Press. Gouldner, A. W. (1960). The norm of reciprocity: A preliminary statement. American
Sociological Review, 25, 161-178. Grandey, A. A. (2000). Emotion regulation in the workplace: A new way to conceptualize
emotional labor. Journal of Occupational Health Psychology, 5 (1), 95-110. Grandey, A. A. (in press). Surface and deep acting as predictors of emotional exhaustion and
peer-rated service delivery: A dramaturgical perspective. Academy of Management Journal.
Grandey, A. A. (2002). Emotional labor as emotion regulation: A test of a framework. Paper
presented at the 17th Annual Conference of the Society for Industrial and Organizational Psychology. Toronto, Canada.
Grandey, A. A., Fisk, G., Mattila, M., & Sideman, L. (2002). Is that smile for real?
Reactions to inauthenticity in customer service. Paper presented at the 62nd annual Academy of Management meeting. Denver, CO.
Gronroos, C. (1990). Services marketing and management. Lexington, MA: Lexington
Books. Gross, J. (1998a). Antecedent- and response-focused emotion regulation: Divergent
consequences for experience, expression, and physiology. Journal of Personality and Social Psychology, 74 (1), 224-237.

101
Gross, J. (1998b). The emerging field of emotion regulation: An integrative review. Review of General Psychology, 2 (3), 271-299.
Hackman, J. R., & Lawler, E. E. (1971). Employee reactions to job characteristics. Journal
of Applied Psychology, 55 (3), 259-286. Hochschild, A. R. (1983). The managed heart: Commercialization of human feeling.
Berkeley: University of California Press. Hollenbeck, J. R., Williams, C. L., & Klein, H. J. (1989). An empirical examination of the
antecedents of commitment to difficult goals. Journal of Applied Psychology, 74, 18-23.
Hormuth, S. (1986). The random sampling of experiences in situ. Journal of Personality, 54,
262-293. Hu, L., & Bentler, P. M. (1999). Cutoff criteria for fit indexes in covariance structure
analysis: Conventional criteria versus new alternatives. Structural Equation Modeling, 6, 1-55.
Iaffaldano, M. T., & Muchinsky, P. M. (1985). Job satisfaction and job performance: A
meta-analysis. Psychological Bulletin, 97 (2), 251-273. Jaccard, J., & Wan, C. K. (1995). Measurement error in the analysis of interaction effects
between continuous predictors using multiple regression: Multiple indicator and structural equation approaches. Psychological Bulletin, 117, 348-357.
Jaccard, J., & Wan, C. K. (1996). LISREL approaches to interaction effects in multiple
regression. Sage University Paper series on Quantitative Applications in the Social Sciences, 07-114. Thousand Oaks, CA: Sage.
Jex, S. M., & Gudanowski, D. M. (1992). Efficacy beliefs and work stress: An exploratory
study. Journal of Organizational Behavior, 13 (5), 509-517. Johns, G. (1991). Substantive and methodological constraints on behavior and attitudes in
organizational research. Organizational Behavior and Human Decision Processes, 49, 80-104.
Johns, G. (2001). In praise of context. Journal of Organizational Behavior, 22, 31-42. Joreskog, K. G. (1993). Testing structural equation models. In K. A. Bollen & J. S. Long
(Eds.), Testing structural equation models (pp. 294-316). Newbury Park, CA: Sage. Joreskog, K. G. (1998). Interaction and nonlinear modeling: Issues and approaches. In R. E.
Schumacker & G. A. Marcoulides (Eds.), Interaction and Nonlinear Effects in

102
Structural Equation Modeling (pp. 239-250). Mahwah, NJ: Lawrence Erlbaum Associates.
Joreskog, K. G., & Sorbom, D. (1993). LISREL 8: Structural equation modeling with the
SIMPLIS command language. Hillsdale, NJ: Lawrence Erlbaum Associates. Joreskog, K. G., & Yang, F. (1996). Nonlinear structural equation models: The Kenny and
Judd model with interaction effects. In G. A. Marcoulides and R. E. Schumacker (Eds.), Advanced Structural Equation Modeling (pp. 57-88). Mahwah, NJ: Lawrence Erlbaum Associates.
Judge, T. A., Thoresen, C. J., Bono, J. E., & Patton, G. K. (2001). The job satisfaction-job
performance relationship: A qualitative and quantitative review. Psychological Bulletin, 127 (3), 376-407.
Kelley, S. W., Donnelly, J. H., & Skinner, S. J. (1990). Customer participation in service
production and delivery. Journal of Retailing, 66, 315-335. Klein, H. J., Wesson, M. J., Hollenbeck, J. R., Wright, P. M., & DeShon, R. P. (2001). The
assessment of goal commitment: A measurement model meta-analysis. Organizational Behavior and Human Decision Processes, 85 (1), 32-55.
Klein, H. J., Wesson, M. J., Hollenbeck, J. R., & Alge, B. J. (1999). Goal commitment and
the goal-setting process: Conceptual clarification and empirical synthesis. Journal of Applied Psychology, 84 (6), 885-896.
Kruml, S. M., & Geddes, D. (2000a). Exploring the dimensions of emotional labor: The heart
of Hochschild’s work. Management Communication Quarterly, 14 (1), 8-49. Kruml, S. M., & Geddes, D. (2000b). Catching fire without burning out: Is there an ideal way
to perform emotion labor? In N. M. Ashkanasy, C. E. Haertel, & W. J. Zerbe (Eds.), Emotions in the workplace: Research, theory, and practice (pp. 177-188). Westport, CT: Quorum Books.
Locke, E. A., & Latham, G. P. (1990). A theory of goal setting and task performance.
Englewood Cliffs, NJ: Prentice Hall. MacCallum, R. C., & Austin, J. T. (2000). Applications of structural equation modeling in
psychological research. Annual Review of Psychology, 51, 201-226. MacCallum, R. C., Browne, M. W., & Sugawara, H. M. (1996). Power analysis and
determination of sample size for covariance structure modeling. Psychological Methods, 1, 130-149.

103
Mardia, K. V. (1970). Measures of multivariate skewness and kurtosis with applications. Biometrika, 57, 519-530.
Mayer, J. D., & Salovey, P. (1995). Emotional intelligence and the construction and
regulation of feelings. Applied and Preventive Psychology, 4, 197-208. McClelland, G. H., & Judd, C. M. (1993). Statistical difficulties of detecting interactions and
moderator effects. Psychological Bulletin, 114, 376-389. McLellan, R. A., Schmit, M. J., Amundson, M., & Blake, R. (1998). Secret shopper ratings
as an individual-level criterion for validation studies. Paper presented at the 13th Annual Conference of the Society for Industrial and Organizational Psychology. Dallas, TX.
Morris, J. A., & Feldman, D. C. (1996). The dimensions, antecedents, and consequences of
emotional labor. Academy of Management Review, 21 (4), 986-1010. Morris, J. A., & Feldman, D. C. (1997). Managing emotions in the workplace. Journal of
Managerial Issues, 9 (3), 257-274. Moulder, B. C., & Algina, J. (2002). Comparison of methods for estimating and testing latent
variable interactions. Structural Equation Modeling, 9 (1), 1-19. Pierce, C. A., Byrne, D., & Aguinis, H. (1996). Attraction in organizations: A model of
workplace romance. Journal of Organizational Behavior, 17, 5-32. Ping, R. A. (1996). Latent variable interaction and quadratic effect estimation: A two-step
technique using structural equation analysis. Psychological Bulletin, 119, 166-175. Pugh, S. D. (2001). Service with a smile: Emotional contagion in the service encounter.
Academy of Management Journal, 44 (5), 1018-1027. Pugliesi, K. (1999). The consequences of emotional labor: Effects on work stress, job
satisfaction, and well-being. Motivation and Emotion, 23 (2), 125-154. Rafaeli, A. (1989). When cashiers meet customers: An analysis of the role of supermarket
cashiers. Academy of Management Journal, 32 (2), 245-273. Rafaeli, A., & Sutton, R. I. (1987). Expression of emotion as part of the work role. Academy
of Management Review, 12 (1), 23-37. Rafaeli, A., & Sutton, R. I. (1989). The expression of emotion in organizational life.
Research in Organizational Behavior, 11, 1-42.

104
Reeve, C. L., & Smith, C. S. (2000). Refining Lodahl & Kejner’s (1965) Job Involvement Scale with a convergent evidence approach: Applying multiple methods to multiple samples. Organizational Research Methods, 4 (2), 91-111.
Romeu, J. L., & Ozturk, A. (1993). A comparative study of goodness-of-fit tests for
multivariate normality. Journal of Multivariate Analysis, 46, 309-334. Russell, J. A., & Carroll, J. M. (1999). On the bipolarity of positive and negative affect.
Psychological Bulletin, 125 (1), 3-30. Rutter, D. R., & Fielding, P. J. (1988). Sources of occupational stress: An examination of
British prison officers. Work and Stress, 2 (4), 291-299. Schaubroeck, J., & Jones, J. R. (2000). Antecedents of workplace emotional labor
dimensions and moderators of their effects on physical symptoms. Journal of Organizational Behavior, 21, 163-183.
Schneider, B., & Bowen, D. E. (1985). Employee and customer perceptions of service in
banks: Replication and extension. Journal of Applied Psychology, 70, 423-433. Schumacker, R. E., & Lomax, R. G. (1996). A beginner’s guide to structural equation
modeling. Mahwah, NJ: Lawrence Erlbaum Associates. Schwab, D. P. (1999). Research methods for organizational studies. Mahwah, NJ: Lawrence
Erlbaum Associates. Smith, C. S., & Sulsky, L. M. (1995). An investigation of job-related coping strategies across
multiple stressors and samples. In Lawrence R. Murphy (Ed.), Job stress interventions (pp. 109-123). Washington, D. C.: American Psychological Association.
Smith, C. S., Tisak, J., Hahn, S. E., & Schmieder, R. A. (1997). The measurement of job
control. Journal of Organizational Behavior, 18, 225-237. Smith, C. S., Tisak, J., & Schmieder, R. A. (1993). The measurement properties of the role
conflict and role ambiguity scales: A review and extension of the empirical research. Journal of Organizational Behavior, 14, 37-48.
Spector, P. E., VanKatwyk, P. T., Brannick, M. T., & Chen, P. Y. (1997). When two factors
don’t reflect two constructs: How item characteristics can produce artificial factors. Journal of Management, 23 (5), 659-677.
Sutton, R. I., & Rafaeli, A. (1988). Untangling the relationships between displayed emotions
and organizational sales: The case of convenience stores. Academy of Management Journal, 31 (3), 461-487.

105
Tidd, K. L., & Lockhard, J. S. (1978). Monetary significance of the affiliative smile: A case for reciprocal altruism. Bulletin of the Psychonomic Society, 11, 344-346.
Totterdell, P., & Parkinson, B. (1999). Use and effectiveness of self-regulation strategies for
improving mood in a group of trainee teachers. Journal of Occupational Health Psychology, 4 (3), 219-232.
Vandenberg, R. J., & Lance, C. E. (2000). A review and synthesis of the measurement
invariance literature: Suggestions, practices, and recommendations for organizational research. Organizational Research Methods, 3, 4-69.
Watson, D., & Clark, L. A. (1984). Negative affectivity: The disposition to experience
negative emotional states. Psychological Bulletin, 96, 465-490. Watson, D., Clark, L. A., & Tellegen, A. (1988). Development and validation of brief
measures of positive and negative affect: The PANAS scales. Journal of Personality and Social Psychology, 54, 1063-1070.
Wayne, S. J., Shore, L. M., & Liden, R. C. (1997). Perceived organizational support and
leader-member exchange: A social exchange perspective. Academy of Management Journal, 40, 82-111.
Weiss, H., & Cropanzano, R. (1996). Affective events theory: A theoretical discussion of the
structure, causes, and consequences of affective experiences at work. Research in Organizational Behavior, 18, 1-74.
Wharton, A. S. (1993). The affective consequences of service work: Managing emotions on
the job. Work and Occupations, 20 (2), 205-232. Wharton, A. S., & Erickson, R. J. (1993). Managing emotions on the job and at home:
Understanding the consequences of multiple emotional roles. Academy of Management Review, 18 (3), 457-486.
Williams, L. J., & Anderson, S. E. (1994). An alternative approach to method effects by
using latent-variable models: Applications in organizational behavior research. Journal of Applied Psychology, 79, 323-331.
Williams, L. J., Cote, J. A., & Buckley, M. R. (1989). Lack of method variance in self-
reported affect and perceptions at work: Reality or artifact? Journal of Applied Psychology, 74, 462-468.
Withey, M., Daft, R. L., & Cooper, W. H. (1983). Measures of Perrow’s work unit
technology: An empirical assessment and a new scale. Academy of Management Journal, 26, 45-63.

106
APPENDIX A
SURVEY MEASURES
Employee Measures
Perceived Display Rule Demands
1. Part of my job is to make the customer feel good. (DRPOS1)
2. My workplace does not expect me to express positive emotions to customers as part of my
job. (DRPOS2) (R)
3. This organization would say that part of the product to customers is friendly, cheerful
service. (DRPOS3)
4. My organization expects me to try to act excited and enthusiastic in my interactions with
customers. (DRPOS4)
5. I am expected to hide my negative feelings from customers. (DRNEG1)
6. This organization expects me to try to pretend that I am not upset or distressed.
(DRNEG2)
7. I am expected to try to pretend I am not angry or feeling contempt while on the job.
(DRNEG3)
Commitment to Display Rules
1. It’s hard to take the requirement for displaying the organizationally desired emotions on
the job seriously. (R)
2. Quite frankly, I don’t care if I display the organizationally desired emotions on the job or
not. (R)
3. I am committed to displaying the organizationally desired emotions on the job.

107
4. It wouldn’t take much to make me abandon the requirement for displaying the
organizationally desired emotions on the job. (R)
5. I think displaying the organizationally desired emotions on the job is a good goal to shoot
for.
Positive and Negative Affectivity
1. Interested (PA1) 2. Distressed (NA1) 3. Excited (PA2) 4. Upset (NA2) 5. Strong (PA3) 6. Guilty (NA3) 7. Scared (NA4) 8. Hostile (NA5) 9. Enthusiastic (PA4) 10. Proud (PA5)
11. Irritable (NA6) 12. Alert (PA6) 13. Ashamed (NA7) 14. Inspired (PA7) 15. Nervous (NA8) 16. Determined (PA8) 17. Attentive (PA9) 18. Jittery (NA9) 19. Active (PA10) 20. Afraid (NA10)
Perceived Organizational Support
1. My organization cares about my opinions.
2. My organization really cares about my well-being.
3. My organization strongly considers my goals and values.
4. Help is available from my organization when I have a problem.
5. My organization would forgive an honest mistake on my part.
6. If given the opportunity, my organization would take advantage of me. (R)

108
7. My organization shows very little concern for me. (R)
8. My organization is willing to help me if I need a special favor.
Frequency of Interactions
1. I interact with many different customers on a daily basis.
2. I do not encounter a large number of interactions with customers during my typical work
day. (R)
3. I deal with customers on a frequent basis at work.
Duration of Interactions
1. I spend a lot of time with each customer I interact with.
2. Most of my interactions with customers are short. (R)
3. My encounters with customers usually last a while.
Task Routineness
1. My work with customers is fairly routine.
2. I perform the same tasks in the same way from day-to-day.
3. I perform repetitive activities in my interactions with customers.
Surface Acting
1. I put on an act in order to deal with customers in an appropriate way.
2. I fake a good mood when interacting with customers.
3. I put on a “show” or “performance” when interacting with customers.
4. I just pretend to have the emotions I need to display for my job.
5. I put on a “mask” in order to display the emotions I need for the job.
6. I show feelings to customers that are different from what I feel inside.
7. I fake the emotions I show when dealing with customers.

109
Deep Acting
1. I try to actually experience the emotions that I must show to customers.
2. I make an effort to actually feel the emotions that I need to display toward others.
3. I work hard to feel the emotions that I need to show to customers.
4. I work at developing the feelings inside of me that I need to show to customers.
Job Satisfaction
1. All in all I am satisfied with my job.
2. In general, I don’t like my job. (R)
3. In general, I like working here.
Supervisor Measure
Customer Service Performance
1. This person seems sincere when dealing with the public.
2. Customers seem to like interacting with this person.
3. This person shows friendliness and warmth to customers.
4. This person treats customers with courtesy, respect, and politeness.
5. This person smiles and communicates expressively with customers.
6. This person shows enthusiasm when dealing with customers.
Note. Responses to each item (except for the first frequency and first duration items, which
are open-ended) are measured on a 5-point Likert-type scale with anchors of “very slightly or
not at all” (1) and “extremely” (5), “strongly disagree” (1) and “strongly agree” (5), or
“never” (1) and “always” (5). An “(R)” indicates that an item is reverse-scored.

110
APPENDIX B
STUDENT LETTER
To Students: Thank you for participating in the data collection for this study! We are asking you to give this packet of questionnaires to a full-time working adult (at least 18 years old), who works in the service industry and who is not a student. In return for your assistance, you can (a) earn extra credit points and (b) have your name entered into a drawing where two $50 prizes will be awarded. Please carefully read the following instructions. Instructions for distributing research packets: 1. Locate one full-time working adult (i.e., works at least 30 hours per week) who is
NOT a student, and who you think might be interested in participating in this study. Important: The employee MUST work in the service industry (i.e., in a job where the primary duty is interacting with customers, clients, or patients). Some examples of these jobs include teachers, health care workers, waiters/waitresses, fast food workers, flight attendants, grocery checkout clerks, child care workers, bank tellers, receptionists, and retail sales (clothes, cars, real estate) workers.
2. Inform this person of the following: A. The purpose of the study is to explore the relationships among personality, job
attitudes, and job behaviors. B. If they agree to participate, they should open the envelope and complete the
survey labeled “Employee Survey” and return it in the self-addressed stamped envelope provided.
C. The employee should also distribute the survey packet labeled “Supervisor Survey” to their immediate supervisor.
3. Thank the employee for participating. 4. You must fill out the bottom of this form and return it to your professor in order to
receive extra credit and be entered into the $50 lottery drawing. The sheets are coded so that the researchers can monitor the process.
Extra Credit and $50 Lottery Drawing: 1. You must complete and return this page in order to receive extra credit. 2. The survey packet includes 2 surveys: a survey for the employee (the person you will
give it to) and a survey for the employee’s supervisor. One extra credit point will be given if at least 1 survey is returned. If no surveys are returned, no points will be awarded.
3. If both surveys are returned, your name will be entered into a lottery drawing in which two $50 prizes will be awarded. This drawing will take place the last week of the semester, and if you are a winner you will be contacted by phone to make

111
arrangements to receive your prize. In addition, we will contact the employee to whom you gave the survey, to verify their participation.
4. All surveys must be completed and returned by [date] to receive extra credit and to have your name included in the lottery drawing.
Your name: Your Phone #: ________
Your SS#: Course & Section #: __
Who did you give the survey packet to?
Name: Phone: __
Organization: ______________

112
APPENDIX C
EMPLOYEE LETTER
Employee Survey
We are soliciting your participation in a research project entitled “An Examination of Individual and Organizational Factors Related to Emotional Labor.” Your assistance in this project would be extremely valuable. The information that we would like to collect from you will only take approximately 15 minutes to complete. We greatly appreciate your cooperation! The purpose of this research project is to explore the relationships among personality, job attitudes, and job behaviors. We are interested in data from full-time working adults in service-related jobs (i.e., healthcare workers, teachers, retail workers, etc.) and their supervisors. Questions in this survey will ask about your personality, characteristics of your job, attitudes toward your job, and your job behaviors. Also, your immediate supervisor will complete a questionnaire about your job behaviors. Your participation is completely voluntary. Completing this survey will not expose you to any foreseeable risk or harm of any sort. The information provided by you and your supervisor will be used solely for the purposes of this study. All responses will be kept confidential, and any identifying information will be destroyed at the end of the study. If you have any questions or concerns or would like a summary of the aggregated results of the study, please contact Dr. James M. Diefendorff during work hours (8AM-5PM, M-F) at 225-388-4108 (e-mail: [email protected]), Robin H. Gosserand at 914-642-4778 (e-mail: [email protected]), or Dr. Robert C. Mathews, Chairman, Institutional Review Board at 225-578-4114. If you agree to participate in this survey, please sign your name below as your informed consent to be a part of the study. Also by signing below, you also authorize your supervisor to answer questions about you and your job behaviors. Please return this sheet with the survey. This sheet will be separated from the rest of the survey immediately after it is received by the researchers, and will never be linked to your responses in this survey. Your help in this research project is greatly appreciated! Signature:___________________________________________ Date:______________ Instructions: 1. This packet came with two manila envelopes– one contains a Supervisor Survey, the
other an Employee Survey. Please give your immediate supervisor the envelope labeled “Supervisor Survey.”

113
2. Please complete the Employee Survey and return it along with this signed letter in the enclosed self-addressed postage-paid business reply envelope by [date].
3. Please do not discuss your responses to this survey with your supervisor at least until
each of you has independently completed and returned your survey. 4. Thank you for participating in this study!

114
APPENDIX D
SUPERVISOR LETTER
Supervisor Survey We are soliciting your participation in a research project entitled “An Examination of Individual and Organizational Factors Related to Emotional Labor.” Your assistance in this project would be extremely valuable. The information that we would like to collect from you will only take approximately 10 minutes to complete. We greatly appreciate your cooperation! The purpose of this research is to explore the relationships among personality, job attitudes, and job behaviors. We are interested in data from full-time time working adults in service-related jobs (i.e., healthcare workers, teachers, retail workers, etc.) and their supervisors (you). One of your employees has agreed to participate in this research, and has authorized you to answer questions about his/her job behaviors in this survey. Your participation is completely voluntary. Completing this survey will not expose you to any foreseeable risk or harm of any sort. The information you provide will be used solely for the purposes of this study. All responses will be kept confidential, and any identifying information will be destroyed at the end of the study. If you have any questions or concerns or would like a summary of the aggregated results of the study, please contact Dr. James M. Diefendorff during work hours (8AM-5PM, M-F) at 225-388-4108 (e-mail: [email protected]), Robin H. Gosserand at 914-642-4778 (e-mail: [email protected]), or Dr. Robert C. Mathews, Chairman, Institutional Review Board at 225-388-4114. If you agree to participate in this survey, please sign your name below as your informed consent to be a part of the study. Please return this sheet with the survey. This sheet will be separated from the rest of the survey immediately after it is received by the researchers, and will never be linked to your responses in this survey. Your help in this research project is greatly appreciated! Signature:__________________________________________ Date:______________ Instructions: 1. Please complete the Supervisor Survey and return it along with this signed letter in the
enclosed self-addressed postage-paid business reply envelope by [date]. 2. Please do not discuss your responses to this survey with your subordinate at least until
each of you has independently completed and returned your survey. 3. Thank you for participating in this study!

115
APPENDIX E
ITEM-TESTLET RELATIONSHIPS Display Rule Demands-Expressing Positive Testlet 1 = DRPOS1, DRPOS3 Testlet 2 = DRPOS2, DRPOS4 Display Rule Demands-Hiding Negative DRNEG1, DRNEG2, DRNEG3 Commitment to Display Rules Testlet 1 = COMM1, COMM4 Testlet 2 = COMM2, COMM3, COMM5 Positive Affectivity Testlet 1 = PA2, PA10 Testlet 2 = PA3, PA8 Testlet 3 = PA1, PA5, PA6 Testlet 4 = PA4, PA7, PA9 Negative Affectivity Testlet 1 = NA3, NA5 Testlet 2 = NA8, NA9 Testlet 3 = NA1, NA2, NA6 Testlet 4 = NA4, NA7, NA10 Perceived Organizational Support Testlet 1 = POS1, POS3 Testlet 2 = POS2, POS6 Testlet 3 = POS4, POS8 Testlet 4 = POS5, POS7 Frequency of Interactions FREQ1, FREQ2, FREQ3
Duration of Interactions DUR1, DUR2, DUR3 Task Routineness ROUT1, ROUT2, ROUT3 Surface Acting Testlet 1 = SA2, SA4 Testlet 2 = SA6, SA7 Testlet 3 = SA1, SA3, SA5 Deep Acting Testlet 1 = DA1, DA3 Testlet 2 = DA2, DA4 Job Satisfaction SAT1, SAT2, SAT3 Customer Service Performance Testlet 1 = CSP1, CSP3 Testlet 2 = CSP2, CSP6 Testlet 3 = CSP4, CSP5 Expressing Positive/Commitment Product Testlet 1 = DRPOStestlet1 * COMMtestlet1 Testlet 2 = DRPOStestlet2 * COMMtestlet2 Hiding Negative/Commitment Product Testlet 1 = DRNEG3 * COMMtestlet1 Testlet 2 = DRNEG2 * COMMtestlet2

116
APPENDIX F
JACCARD AND WAN’S (1995) FIVE CONSTRAINTS FOR INTERACTION ANALYSES For the following constraints, X equals one main effect variable and Z equals the second main effect variable. The various X and Z variables are mean-centered before forming product terms and conducting analyses. Constraint 1: The variance of the latent product variable must equal the variance of the latent X variable times the variance of the latent Z variable plus the squared covariance of the latent X and latent Z variables. Constraint 2: The path from the latent product variable to an observed product indicator (e.g., X2Z2) must equal the path from the latent X variable to the observed X indicator in question (e.g., X2) times the path from the latent Z variable to the observed Z indicator in question (e.g., Z2). When a path is fixed at 1.0 (i.e., for a reference variable), it can be omitted from the constraint. When a constraint involves the multiplication of a free path by a path fixed at 1.0, an equality constraint can be used rather than a nonlinear equality constraint. Constraint 3: The error variance for a given product indicator (e.g., X2Z2) must equal
(px)(px)(Vx)(Ez) + (pz)(pz)(Vz)(Ex) + (Ex)(Ez), where px is the path from the latent X variable to the observed X indicator in question (e.g., X2), Vx is the variance of the latent X variable, Ex is the measurement error variance for the observed X variable in question (e.g., X2), pz is the path from the latent Z variable to the observed Z indicator in question (e.g., Z2), Vz is the variance of the latent Z variable, and Ez is the measurement error variance for the observed Z variable in question (e.g., Z2). Constraint 4: If the latent X and latent Z variables are multivariately normally distributed and mean-centered in the population, then the covariance of each with the latent product variable must be zero. Constraint 5: The measurement errors for product term indicators must be permitted to correlate if they are composed of shared observed indicators. For example, the measurement errors of the product term indicators X1Z1 and X1Z2 must be allowed to correlate because both product term indicators include the observed X1 indicator. In contrast, the measurement errors of the product term indicators X1Z1 and X2Z2 should not be correlated because there are no shared observed indicators in these product term indicators.

117
VITA
Robin Hughes Gosserand was born Robin Renee Hughes in Alexandria, Louisiana.
She grew up in Louisiana and graduated from Alexandria Senior High School with honors in
May of 1993. That fall, Robin enrolled in college at Louisiana State University in Baton
Rouge, Louisiana. In May of 1997, she graduated summa cum laude with a Bachelor of
Science degree in Psychology. In August of that same year, Robin entered the
Industrial/Organizational Psychology graduate program at Louisiana State University.
Robin earned her Master of Arts degree from Louisiana State University in December
of 1999. After completing the required doctoral coursework and proposing her dissertation,
Robin moved to New York City where she began an internship with IBM in the Global
Employee Research department of corporate Human Resources, while completing her
dissertation. Robin currently continues to work at IBM and resides in New York with her
husband, John Lang Gosserand.