an examination of exposure to environmental tobacco smoke in...
TRANSCRIPT
AN EXAMINATION OF EXPOSURE TO ENVIRONMENTAL TOBACCO SMOKE IN PUBLIC PLACES AND RISK OF
LUNG CANCER AND HEART DISEASE
Randall W. Ash B.Sc., University of British Columbia I988
Dipl. Tech., British Columbia institute of Technology 1990
PROJECT SUBMITTED IN PARTIAL FULFILLMENT OF THE REQUIREMENTS FOR THE DEGREE OF
MASTER OF ENVIRONMENTAL TOXICOLOGY
In the School
of Biological Sciences
O Randall Ash 2005
SIMON FRASER UNIVERSITY
All rights reserved. This work may not be reproduced in whole or in part, by photocopy
or other means, without permission of the author.
APPROVAL
Name: Randall Warren Ash
Degree: Master of Environmental Toxicology
Title of Project:
An examination of exposure to environmental tobacco smoke in public places and risk of lung cancer and heart disease
Examining Committee:
Chair: Dr. R. Ydenberg, Professor
Dr. F. Law, Professor, Senior Supervisor Department of Biological Sciences, S.F.U.
Dr. R. Nicholson, Associate Professor Department of Biological Sciences, S.F.U.
Dr. C. Kennedy, Associate Professor Department of Biological Sciences, S.F.U. Public Examiner
kov- 0?/26 Date Approved

- lz:; SIMON FRASER & uNlvERsrnhbrary &==&&
DECLARATION OF PARTIAL COPYRIGHT LICENCE
The author, whose copyright is declared on the title page of this work, has granted to Simon Fraser University the right to lend this thesis, project or extended essay to users of the Simon Fraser University Library, and to make partial or single copies only for such users or in response to a request from the library of any other university, or other educational institution, on its own behalf or for one of its users.
The author has further granted permission to Simon Fraser University to keep or make a digital copy for use in its circulating collection, and, without changing the content, to translate the thesislproject or extended essays, if technically possible, to any medium or format for the purpose of preservation of the digital work.
The author has further agreed that permission for multiple copying of this work for scholarly purposes may be granted by either the author or the Dean of Graduate Studies.
It is understood that copying or publication of this work for financial gain shall not be allowed without the author's written permission.
Permission for public performance, or limited permission for private scholarly use, of any multimedia materials forming part of this work, may have been granted by the author. This information may be found on the separately catalogued multimedia material and in the signed Partial Copyright Licence.
The original Partial Copyright Licence attesting to these terms, and signed by this author, may be found in the original bound copy of this work, retained in the Simon Fraser University Archive.
Simon Fraser University Library Burnaby, BC, Canada
SIMON FRASER ' UNWERS~TY~ I bra ry
STATEMENT OF ETHICS APPROVAL
The author, whose name appears on the title page of this work, has obtained, for the research described in this work, either:
(a) Human research ethics approval from the Simon Fraser University Office of Research Ethics,
(b) Advance approval of the animal care protocol from the University Animal Care Committee of Simon Fraser University;
or has conducted the research
(c) as a co-investigator, in a research project approved in advance,
(d) as a member of a course approved in advance for minimal risk human research, by the Off ice of Research Ethics.
A copy of the approval letter has been filed at the Theses Office of the University Library at the time of submission of this thesis or project.
The original application for approval and letter of approval are filed with the relevant offices. Inquiries may be directed to those authorities.
Bennett Library Simon Fraser University
Burnaby, BC, Canada
ABSTRACT
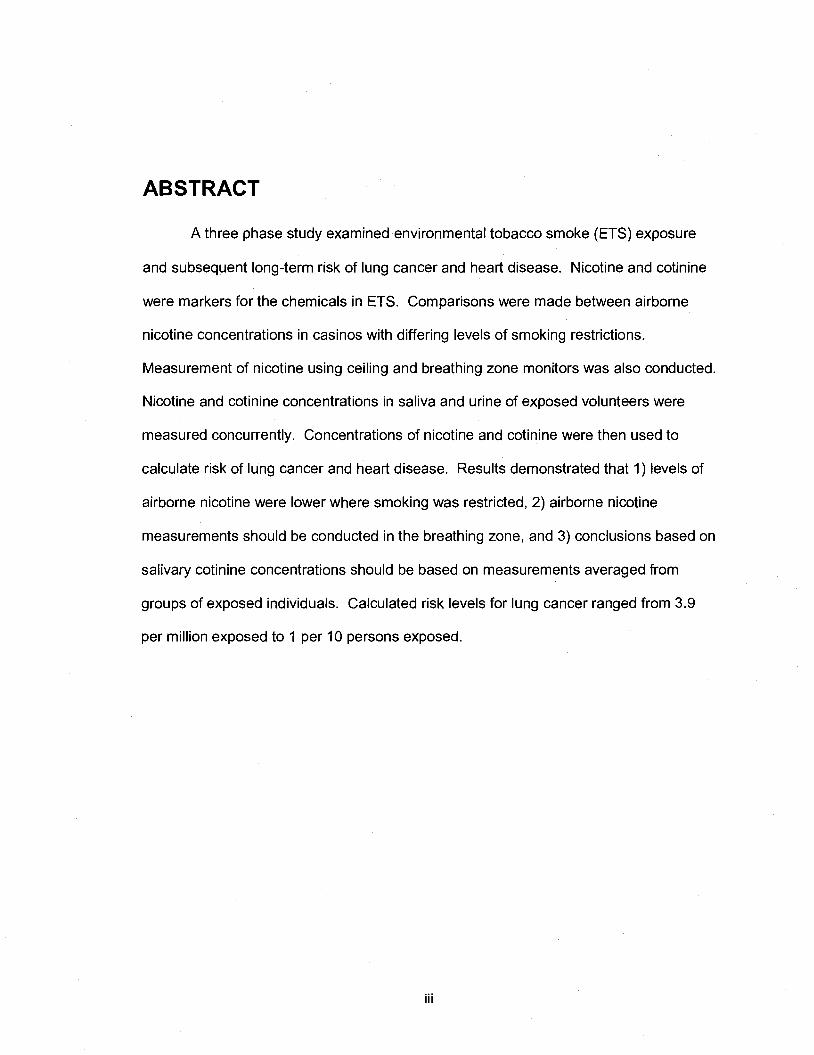
A three phase study examined environmental tobacco smoke (ETS) exposure
and subsequent long-term risk of lung cancer and heart disease. Nicotine and cotinine
were markers for the chemicals in ETS. Comparisons were made between airborne
nicotine concentrations in casinos with differing levels of smoking restrictions.
Measurement of nicotine using ceiling and breathing zone monitors was also conducted.
Nicotine and cotinine concentrations in saliva and urine of exposed volunteers were
measured concurrently. Concentrations of nicotine and cotinine were then used to
calculate risk of lung cancer and heart disease. Results demonstrated that 1) levels of
airborne nicotine were lower where smoking was restricted, 2) airborne nicotine
measurements should be conducted in the breathing zone, and 3) conclusions based on
salivary cotinine concentrations should be based on measurements averaged from
groups of exposed individuals. Calculated risk levels for lung cancer ranged from 3.9
per million exposed to 1 per 10 persons exposed.
iii

DEDICATION
This work is dedicated to my wife Heather and my sons Alec and Jonathan.
While the responsibilities of a family did present some challenges with respect to the
completion of this work, having the three of you as a part of my life, makes the
completion of the work all the more meaningful.

There are many people I would like to thank for their part in the completion of this
project. First I would like to thank my senior supervisor Dr. Francis Law for his support,
guidance and patience. My employer, Vancouver Coastal Health, and in particular my
former manager Domenic Losito were instrumental in the completion of my project let
alone my involvement in the MET program in general. I was very fortunate to have the
support and in particular the flexibility in my work schedule that I received from my place
of employment. I would also like to acknowledge my current manager, Sandra Edelman,
for her support as I balanced the time off I needed to finish my studies with the demands
of a new position. I would like to thank Dr. Russell Nicholson for participating on my
committee and for his insights and suggestions in reviewing my work. With respect to
specific assistance with aspects of the project, I would like to thank Sharon Hope for her
assistance with the scintillation counter, Dr. Parkhouse for use of his cold centrifuge, the
SFU machine shop staff for assistance with machining the spacers used to build the
windscreen of the passive monitors, and Lakshmi Vinnakota and Guanghua Gao for
their assistance analysing the filters from the passive monitors and the saliva and urine
samples with the GCIMS. The support I received from my colleagues in the Law Lab
was invaluable and I would like to thank Guanghua, Lakshmi, Dan and Jasen for both
their assistance with various aspects of my project and for their friendship. Finally, I
would like to acknowledge the support of my family. I have had the support of my
mother throughout my academic career. Lastly, and most importantly, I would like to
thank my wife Heather. Without her support and encouragement I would not have even

entered the MET program. Her continued encouragement throughout my studies kept
me going right up to the end.
TABLE OF CONTENTS
. . Approval ........................................................................................................................ 11 ... ........................................................................................................................ Abstract III
Dedication ...................................................................................................................... iv
Acknowledgements ....................................................................................................... v . .
Table of Contents ........................................................................................................ VII
List of Figures .............................................................................................................. ix
List of Tables .................................................................................................................. x
List of Abbreviations and Acronyms ........................................................................... xi
Introduction ................................................................................................................... 1
Materials and Methods ................................................................................................. 20 Passive Air Monitoring for Nicotine in Greater Vancouver Casinos: ........................... 20
Construction of Passive Air Monitors ...................................................................... 20 Location and Set Up of Passive Monitors ............................................................... 23 Filter Analysis ......................................................................................................... 27
Passive Air Monitoring with a Simultaneous Human ETS Exposure Trial in a Casino Lacking Smoking Restrictions ........................................................ 28
Ethical Approval and Volunteer Recruitment .......................................................... 29 Sample Collection .................................................................................................. 29
.................................................................................................... Sample Analysis 31 Human ETS Exposure Trial in a Bingo Smoking Room .............................................. 32
Volunteer Recruitment ........................................................................................... 33 Sample Collection .................................................................................................. 33 Physiological Fluid Analysis ................................................................................... 34 Passive Air Monitor Analysis .................................................................................. 37
Results and Discussion .............................................................................................. 40 Initial Passive Air Monitoring Trial ............................................................................. 40 Passive Air Monitoring with Simultaneous Human ETS Exposure Trial in a
Casino Lacking Smoking Restrictions ........................................................ 47 .............................................. Human ETS Exposure Trial in a Bingo Smoking Room 52
Conclusions ................................................................................................................. 69
Appendices .................................................................................................................. 72 Appendix A . Volunteer Consent Form for Human Exposure to ETS in a
........................................................ Casino Lacking Smoking Restrictions 73 Appendix B . Volunteer Information Sheet for Human Exposure to ETS in a
Casino Lacking Smoking Restrictions ........................................................ 75
Appendix C . Subject Feedback Form for Human Exposure to ETS in a Casino .................................................................... Lacking Smoking Restrictions 77
Appendix D . Guide for Suggested Saliva and Urine Sampling Times ....................... 79 Appendix E . Volunteer Consent Form for Human ETS Exposure in the
Smoking Room of a Bingo ......................................................................... 81 Appendix F . Volunteer Information Sheet for Human ETS Exposure in the
Smoking Room of a Bingo ......................................................................... 83 Appendix G . Protocol for Volunteers for Human ETS Exposure in the
Smoking Room of a Bingo ......................................................................... 85 Appendix H . Saliva and Urine Sampling Schedule for Human ETS Exposure
in the Smoking Room of a Bingo ............................................................... 87
Reference List ............................................................................................................. 89
viin
LIST OF FIGURES
Figure 1 : Components of passive monitors used for nicotine sampling .......................... 22 Figure 2: Passive monitors for nicotine sampling as constructed ................................... 22 Figure 3: Passive monitor as sealed for transport and storage ...................................... 23 Figure 4: Location of passive monitors in the casino with no smoking permitted ........... 24 Figure 5: Location of passive monitors in casino with smoking room ............................. 25 Figure 6: Location of passive monitors in casino with no smoking restrictions ............... 26 Figure 7: Passive monitors as worn by human volunteers in phase two of study ........... 30 Figure 8: Concentration of nicotine in air in casinos with three levels of smoking
restrictions ..................................................................................................... 41 Figure 9: Comparison of two separate measurements of the concentration of
nicotine in the air in a casino where smoking was not restricted .................... 48 Figure 10: Average nicotine in saliva over time for two volunteers exposed to
ETS in a casino lacking smoking restrictions ................................................. 50 Figure 11 : Average cotinine in saliva over time for two volunteers exposed to
ETS in a casino lacking smoking restrictions ................................................. 51 Figure 12: Average cumulative cotinine in urine over time from two volunteers
exposed to ETS in a casino lacking smoking restrictions ............................ 52 Figure 13: Volunteer a concentration nicotine in saliva over time .................................. 53 Figure 14: Volunteer b concentration nicotine in saliva over time .................................. 53 Figure 15: Volunteer c concentration nicotine in saliva over time ................................... 54 Figure 16: Volunteer d concentration nicotine in saliva over time .................................. 54 Figure 17: Volunteer e concentration nicotine in saliva over time .................................. 55 Figure 18: Volunteer f concentration nicotine in saliva over time ................................... 55
.................................. Figure 19: Volunteer a concentration cotinine in saliva over time 56
Figure 20: Volunteer b concentration cotinine in saliva over time .................................. 56 Figure 21 : Volunteer c concentration cotinine in saliva over time ................................... 57 Figure 22: Volunteer d concentration cotinine in saliva over time .................................. 57 Figure 23: Volunteer e concentration cotinine in saliva over time .................................. 58 Figure 24: Volunteer f concentration cotinine in saliva over time ................................... 58 Figure 25: Average concentration nicotine in saliva over time ....................................... 61 Figure 26: Average concentration cotinine in saliva over time ....................................... 65 Figure 27: Average cumulative cotinine in urine over time ............................................. 67
LIST OF TABLES
Table 1: Predicted steady state saliva cotinine levels based on average concentration of nicotine in air ....................................................................... 44
Table 2: Intake rates and risk levels for lung cancer for three casino types ................... 46 Table 3: Nicotine in air concentrations calculated from passive monitors on
ceiling of casino and from passive monitors in breathing zone of two volunteers .................................................................................................... 48
Table 4: Predicted steady state saliva cotinine levels based on average concentration of nicotine in air from passive monitors ................................... 49
LIST OF ABBREVIATIONS AND ACRONYMS
CFVR = Coronary flow velocity reserve
CO = Carbon monoxide
EPA = Environmental Protection Agency
ETS = Environmental tobacco smoke
GUMS = Gas chromatography with mass spectrometry
GSTMI = Glutathione S-transferase mu
GSTM1*2 = Glutathione S-transferase mu null
HCI = Hydrochloric acid
IARC = International Agency for Research on Cancer
IRIS = Integrated Risk Information System
MeOH = Methanol
NaOH = Sodium hydroxide
NNAL = 4-(methylnitrosamino)-1-(3-pyridy1)-I -butanol
NNAL-Gluc = glucuronides of 4-(methylnitrosamino)-I-(3-pyridy1)-I -butanol
NRS = Normal rabbit serum
OSHA = Occupational Safety and Health Administration
RSP= Respirable suspended particulate
SFU = Simon Fraser University
TWA = Time weighted average
US = United States
INTRODUCTION
Cigarette smoking is generally accepted as a cause of lung cancer as well as
several other cancers, cardiovascular disease, respiratory illnesses and various other
diseases. While the case for active smoking as the causative agent for a host of
diseases is very strong, environmental tobacco smoke (ETS), also known as second-
hand smoke or passive smoking, is still the subject of some degree of controversy with
respect to its potential as a causative agent for the variety of diseases it has been linked
with. On one hand there is a growing body of evidence, both epidemiological and
biochemical, that exposure to ETS, causes lung cancer, cardiovascular disease and
various other diseases as well. It is recognised by Health Canada (2003) as being a
cause of death and disease and is classed by the US EPA as a "Group A" carcinogen
(i.e. there is sufficient evidence that the substance causes cancer in humans) (US EPA,
1994). The US EPA (1994) goes even further and states that ETS is the only Group A
carcinogen that causes cancer at concentrations normally encountered in environmental
settings. On the other hand, despite Health Canada, the US EPA, and many other
government and non-government agencies around the world reaching this conclusion,
and the continued mounting evidence against ETS, there remains members of the
scientific community that feel that the conclusions reached by health and government
agencies are incorrect. As would be expected, the tobacco companies also take this
stance - although their opinion may be driven less by scientific uncertainty and more by
the bottom line.
In a study examining restrictive smoking legislation and cigarette consumption
1
between 1961 and 1982, the Tobacco Institute (undated but circa 1985) concluded that
21 % of the variation in cigarette consumption was due to restrictive legislation and, in
their words, those who say they work under smoking restrictions said they smoked about
1.25 fewer cigarettes per day which translates into 350 million fewer packs of cigarettes
a year in the US. Because the tobacco industry regards policy actions related to ETS
exposure as a serious threat to its viability, the industry has a strategy of funding and
promoting its own reviews on the subject that, in general, call into question the scientific
case against ETS (Chapman, 1997; Bero, Galbraith, and Rennie 1994). While the
tobacco industry, in a conscious effort, has manufactured much of the controversy, some
of the controversy arises from the methodology used to calculate the human health risks.
A variety of methods are presently used to estimate the human health risk of ETS
exposures. Because of the degree of uncertainty involved in the use of these
methodologies, there is consequently a fair degree of uncertainty surrounding the risks
from this contaminant of indoor environments.
One of the problems with trying to calculate risk from exposure to ETS stems from
the fact that cigarette smoke contains over 4000 chemicals, more than 50 of which are
known or suspected human carcinogens (Health Canada, 2003). As summarized by
Daisey (1 999), of the 4000 chemicals in second hand smoke, only about 400 have been
quantified. When people are exposed to ETS, they are exposed to a toxic "soup" for
which the information regarding its makeup is incomplete. In order to calculate risk from
exposure to ETS, it is important to be able to assess exposure. Given the number of
chemicals involved, accurately discerning the level of exposure and hence the degree of
risk related to that exposure becomes a daunting task. One of the methods used to
quantify exposure is to use a marker for ETS. Using a substance present either in the
air where tobacco products have been smoked or in the physiological fluids of
individuals exposed to ETS is one method used to accomplish this.
The National Research Council's (1 986), criteria for a valid marker of ETS dictate
that it should be unique or nearly unique for ETS so that other sources are minor in
comparison, easily detectable, emitted at similar rates for a variety of tobacco products,
and have a fairly constant ratio to other ETS components of interest under a broad range
of environmental conditions. In general, nicotine and its main metabolite, cotinine, meet
these criteria and are commonly used markers for ETS exposure. Concentration of
nicotine in air is used to represent the amount of ETS in air, while both nicotine and
cotinine concentrations in physiological fluids or hair are used as evidence of exposure
to ETS. Nicotine is a chemical that is present in all tobacco products (Benowitz, 1999)
and nicotine in air has only one source, that being the burning of tobacco (Leaderer,
1990). Similarly, cotinine in the plasma, urine or saliva of non-tobacco users has as its
only practical source the metabolism of nicotine from ETS exposure (Brown, 1999).
Both nicotine and cotinine are reported as being relatively easily quantified by a variety
of methods (LaKind et al., 1999). Consequently, these compounds have gained
widespread use for the exposure assessment required for the calculation of risk to non-
smokers from ETS exposure.
While these markers may have gained widespread use in assessing exposure to
ETS and the subsequent calculation of risk due to that exposure, there are several
aspects with respect to their use as surrogates for ETS exposure, or how that exposure
translates to risk, that may call into question the validity of the resultant calculations of
risk. Questions centre on how representative nicotine concentrations in air (or the
resulting cotinine concentration in physiological fluids) are of the myriad of chemicals
contained in ETS, and in particular those chemicals that are suspected of causing
disease, and additionally, is it reasonable to use these markers to estimate the exposure
to ETS? There is also the question of biological plausibility and further, whether the
epidemiological evidence supports that ETS is causing lung cancer and heart disease at
the levels that these markers are actually encountered? Is it biologically plausible that
ETS will cause lung cancer and heart disease at the levels that these markers that are
actually encountered, and is there epidemiological evidence that this is occurring? With
respect to the use of nicotine and cotinine concentrations to assess risk, questions have
been raised regarding the derivation of the concentrations of these markers used to
determine unacceptable levels of risk for exposed individuals and the methodology used
to perform risk assessments. Additionally, questions relate to problems with the use of
nicotine and cotinine as markers and whether there may be better methods that could be
used. This project focuses on the use concentrations of nicotine in air and/or the
subsequent concentrations of nicotine or cotinine in the physiological fluids of exposed
non-smokers to calculate their risk of lung cancer and cardiovascular disease.
The first question that must be answered in considering the use of nicotine or
cotinine concentrations in the calculation of risk, is whether it is reasonable to use
nicotine and cotinine concentrations as markers representing ETS exposure. Are these
two chemicals adequate to represent ETS as a whole and in particular the chemicals of
concern? Given the number of different chemicals found in ETS it is unlikely that there
is any one marker that will be adequately representative of all of them. Learderer and
Hammond (1991) found that nicotine concentrations were related to respirable
suspended particulate matter (RSP) concentrations with RSP concentrations about 9.8
times those of nicotine. Particulate matter is where much of the focus on the disease
causing potential of ETS exposure has been (Daisey, 1999). LaKind et al. (1999)
contend that while several of nicotine's properties make it ideally suited as a marker for
exposure to ETS (uniqueness to tobacco, abundance in sidestream smoke, and relative
ease of measurement), the fact that nicotine doesn't follow first order decay kinetics (and
thus ages differently from other ETS substances) indicates that it should not be used as
a surrogate for other substances in ETS. These authors present arguments that 3-
ethenyl pyridine (3-EP) may be a better tracer for ETS gas phase and particulate phase
components than nicotine due to its first order decay kinetics (LaKind et al., 1999). In
spite of the different decay kinetics of nicotine and 3-EP, Jenkins et al. (1996), found that
nicotine and 3-EP concentrations were highly correlated. In addition, these authors
confirmed that nicotine concentration was in fact highly correlated with concentration of
RSP - with RSP having a concentration 10.9 times that of nicotine. While nicotine does
appear to be correlated with RSP, a large portion of the organic mass, including many
biologically active components, is found in fractions of ETS other than particulate matter
(Daisey, 1999). Daisey (1 999) suggests that nicotine, in addition to being a good tracer
for particulate matter, may be useful as tracer for other ETS components provided
smoking occurs regularly in the environment, the system is at quasi-steady state, and
the sampling time is significantly longer than the characteristic times for removal
processes. Daisey (1 999) further suggests that in order to ultimately ascertain its
usefulness as a tracer for components other than particulate matter, the ratios of these
components to nicotine needs to be determined in realistic environments (Daisey, 1999).
This would also be the case for any other tracer that may be proposed for use as a
marker for ETS exposure. Benowitz (1999) in an extensive review of the use of
biomarkers for ETS exposure concluded that when a person is exposed to ETS, the
intake of nicotine is reflective of exposure to the other components of ETS.
Cotinine in physiological fluids has also been used as a marker for the amount of
ETS exposure one has been subjected to. Since cotinine is the main metabolite of
nicotine, measuring the concentration of cotinine in body fluids will give a direct
indication of the amount of nicotine that was absorbed and if absorption efficiency is
known, the amount of nicotine in the air. Jenkins and Counts (1999), contend however,
that salivary cotinine is not a good quantitative indicator of airborne nicotine exposure for
individual subjects as the results of their study indicated that there was a substantial

amount of variation between airborne nicotine concentrations and salivary cotinine
levels. The results of their study did however indicate that for larger groups of subjects,
there was a strong correlation between the levels of nicotine in air and salivary cotinine
concentrations (Jenkins and Counts, 1999). Benowitz (1 999) concludes that while inter-
individual variability may limit the value of predictions based on measurements in
individuals, the variability is compensated for in studies of large numbers of subjects, as
is the case with epidemiological studies.
Another factor requiring consideration when trying to link levels of cotinine and
nicotine, as surrogates for ETS, to the risk of lung cancer and cardiovascular disease, is
whether or not ETS is toxic at the levels being considered. Is it biologically plausible and
is there epidemiological evidence that ETS, at real levels of exposure, causes lung
cancer and cardiovascular disease in non-smokers passively exposed? With respect to
lung cancer, there is substantial evidence regarding the carcinogenic potential of ETS
and thus the biological plausibility of it as a carcinogenic agent. According to the US
EPA (1994), it is indisputable that smoking causes lung cancer in humans and there is
no evidence that there will be a threshold below which smoking will not cause cancer.
Thus even low dose exposures would increase risk of lung cancer to some degree. In
addition, although it is a dilute mixture of mainstream and sidestream smoke, ETS is
chemically similar to the smoke inhaled by smokers (containing a number of
carcinogenic compounds) and large numbers of people who do not smoke have been
demonstrated as having been exposed to, absorbing and metabolizing significant
amounts of second hand smoke (US EPA, 1994). In one study using 5 non-smokers
exposed to ETS for 3 hours, urine concentrations of a metabolite (NNAL) of a tobacco-
specific lung carcinogen (4-(methy1nitrosamino)-I-(3-pyridy1)-I-butanone) were found to
be significantly higher (almost 10 times) after exposure as compared with pre-exposure
levels (Hecht et al., 1993). Additionally, levels of NNAL and its glucuronides (NNAL-
Gluc) in ETS exposed non-smokers compared with smokers (-1.6%) are consistent with
the level of excess risk for ETS exposed non-smoking women compared to smokers (-1-
2%) giving further biochemical support for ETS as a lung carcinogen in non-smokers
(Hecht, 2002).
While the increased levels of carcinogen metabolites lend support to the biological
plausibility of ETS as a lung carcinogen, there is also evidence from laboratory studies
on animals demonstrating the ability of secondhand smoke to both cause cancer and
damage DNA, further supporting the biological plausibility of ETS as a carcinogen (US
EPA, 1994). It is one thing to find evidence of a link between ETS and cancer in animal
studies, Husgafvel-Pursiainen et al. (2000) found a significant 3-4 fold increased risk of
mutation of the p53 tumour suppressor gene in passive smoking lung cancer cases over
never-smoker lung cancer cases lending credence to the suggestion that the
mechanisms of lung carcinogenesis in ETS-exposed never-smokers include mutations in
the p53 gene similar to that seen in smokers.
In addition to the evidence of biological plausibility of ETS causing lung cancer,
there is also ample epidemiological evidence for ETS as a causative agent for lung
cancer. Of the 16 pollutants that have been designated by the US EPA as "Group A"
carcinogens, only second hand smoke has been demonstrated in studies to cause
cancer at typical environmental levels (US EPA, 1994). Numerous studies have found
an increase in the risk of cancer for those exposed to secondhand smoke vs. those that
are not exposed and, according to the US EPA (1994), there is remarkable consistency
in the studies that support a causal association between secondhand smoke and lung
cancer. In their review of the epidemiological studies on ETS the US EPA (1994), found
that in all 14 of the studies that examined the relationship between exposure and effect,
there was a trend of increasing response with increasing exposure, that the trend was
statistically significant in 10 of the 14 and that there was less than a one in a billion
probability finding a statistically significant trend in this many of the studies by chance.
More recently, Zhong, Goldberg, Gao, and Jin (1999) found that long-term occupational
exposure to ETS, either alone or in combination with home exposure, conferred an
increased risk of lung cancer among women who never smoked and that the risk
increased with increasing number of hours of daily exposure to ETS in the workplace.
Risk was also observed to increase with increasing number of smoking co-workers.
Along this same line, for the highest level of ETS exposure in the workplace and in
vehicles, there was a significant increased risk of lung cancer in a study by Kreuzer,
Krauss, Kreienbrock, Jockel, and Wichmann, (2000). Lee et al. (2000) found that ETS
exposure occurring in childhood potentiates the effect of high doses of exposure in adult
life in determining the development of lung cancer. Furthering the epidemiological case
for ETS causing lung cancer, cessation of exposure has been observed to reduce risk of
lung cancer. Boffetta et al. (1998) and Boffetta et al. (1 999) observed an association
between cessation of ETS exposure and the suggestion of a decrease in the risk of lung
cancer.
In addition to lung cancer, second hand smoke exposure has been linked to
various other cancers. Villeneuve, Johnson, Mao, Hanley, and Canadian Cancer
Registries Research Group (2004) found a weak association between pancreatic cancer
and ETS. In addition to this association with pancreatic cancer, their results suggest that
ETS smoking exposure may confound the risk of pancreatic cancer associated with
active smoking measures commonly used in epidemiologic studies. Kropp and Chang-
Claude (2002) concluded that the hypothesis of a causal relationship between active and
passive smoke exposures and breast cancer was strengthened with the results of their
study. With respect to ETS exposure and breast cancer, Gammon et al. (2004) found an
increased odds ratio among non-smokers who had lived with a smoking spouse for over
27 years.
While the case for ETS as a causative agent for lung cancer (and possibly other
cancers) is strong, can the same be said for ETS as a causative agent for cardiovascular
disease? Similar arguments can be made for the links between ETS exposure and
cardiovascular disease as were made for ETS and lung cancer. As is the case for lung
cancer, active smoking has been demonstrated to cause cardiovascular disease, with an
estimated 180,000 deaths in the US from cardiovascular disease due to active smoking
(Howard and Thun, 1999). Lower doses of tobacco smoke, as are experienced in
passive smoking, would also be expected to cause an effect, although unlike as is the
case for lung cancer, there is the possibility of a threshold below which there is no effect.
Howard and Thun (1999), reviewed several human and animal studies examining
the sequence of events involved in the development of cardiovascular disease and
concluded that the studies, which measured effects on platelets, thrombosis, vascular
endothelium and exercise tolerance, were particularly informative in demonstrating the
mechanism, dose response relationship, and biologic plausibility of ETS as a causative
agent. Otsuka et al. (2001) found that passive smoking substantially reduced coronary
flow velocity reserve (CFVR) in healthy non-smokers, and provided, in their opinion,
direct evidence that passive smoking may cause endothelial dysfunction of the coronary
circulation, an early process of atherosclerosis. Further, this change may be one reason
why passive smoking is a risk factor for cardiac disease morbidity and mortality in non-
smokers. Moffatt, Chelland, Pecott, and Stamford (2004) observed a significant
negative impact of ETS on blood lipids adding evidence that supports a role of enhanced
atherosclerosis via alterations in lipid profiles. Moffatt et al. (2004) also found that during
ETS exposure respiratory CO levels were significantly increased, as compared to
baseline and post-exposure, by almost 100% and the authors concluded that CO in
circulation may contribute to cardio-vascular disease via promotion of atherosclerosis,
hypoxia on the myocardium and increased stress due to the elevated levels of
carboxyhemoglobin.
In addition to being biologically plausible for ETS to cause cardiovascular disease,
epidemiological studies have linked ETS exposure with increased risk of coronary heart
disease. In a review of epidemiological studies of the association of ischemic heart
disease risk and ETS and a subsequent meta-analysis, Thun, Henley, and Apicella
(1 999) found that the relative risk (RR) for fatal and nonfatal coronary events among
never smokers married to smokers, compared to those with spouses who did not smoke
was 1.25 (95% confidence intervals of 1 . I 7 - 1.33). Of further interest, the authors
observed in the three studies that presented data separately for non-smokers married to
current or former smokers, the association was stronger when the spouses continued to
smoke (RR=I .16, 95% confidence intervals 1.06 - 1.28) than with former smokers
(RR=0.98, 95% confidence intervals 0.89 - 1.08).
Law, Morris, and Wald (1997) did an evaluation of the evidence of ETS and
ischaemic heart disease in an attempt to explain why the associated risk of ischaemic
heart disease caused by exposure to ETS is almost half that of smoking 20 cigarettes
per day while the level of exposure is only about 1% of smoking. They found that the
effect is explained mostly by a non-linear dose-response relation between exposure to
tobacco smoke and risk of heart disease and also found that the excess risk of smoking
one cigarette per day of 39% is similar to the risk in a non-smoker living with a smoker.
Howard and Thun (1999), report that based on pooled analyses of epidemiological
studies, non-smokers exposed to ETS in the workplace have an increased risk of
cardiovascular disease 1.35 times that of those not exposed and that the risk is 1.23
times greater for those exposed at home. Based on the relationship between ETS
exposure and lung cancer and cardiovascular disease it seems likely that ETS is a
causative agent for these two diseases at levels normally encountered in the
environment.
Nicotine and cotinine appear to be acceptable markers for exposure to ETS and as
it is biologically plausible that ETS can cause both lung cancer and cardiovascular
disease, and there is substantial epidemiological evidence that a causative relationship
for both of these diseases is likely, it leads to an examination of how the observed
concentrations of nicotine and cotinine are used in the calculation of risk. One of the
ways that nicotine and cotinine concentrations in physiological fluids are used in risk
calculation is to first utilize them to calculate exposure based on cigarette equivalents.
Once calculated, cigarette equivalents can then be used to compare how the passive
smoke exposure would compare to the exposure one would receive if it was as a result
of active smoking. Using the dose response curve for smokers (dose of cotinine vs.
response in number of lung cancers or cardiovascular disease), one can extrapolate
down to a low dose exposure level equivalent to that of passive smoke exposures. In
pooling the results from several studies, Hackshaw (1998), found that passive smokers
had, on average, about 1% of the concentration of cotinine or nicotine in urine or saliva
of that of active smokers.
A problem with using cigarette equivalents based on nicotine or cotinine
concentrations is that it may subsequently underestimate the risk of disease. Hammond,
Sorensen, Youngstrom, and Ockene (1 995), suggest that if cigarette equivalents were
based on some of the carcinogens in ETS rather than nicotine, the cigarette equivalents
would be much higher. If the 4-aminobiphenyl adduct of haemoglobin were used,
exposure to ETS would be estimated as close to 10% of that of active smoking (Dockery
and Trichopoulos, 1997; Hammond et al., 1995). Similarly, using urinary mutagenicity
would result in an estimate of 4% of active smoking while using N-nitrosodimethylamine
could result in an estimate between 33 - 50% of active smoking (Hammond et al., 1995).
These numbers are clearly much different than the levels of exposure that are calculated
when nicotine or cotinine are used to estimate cigarette equivalents. Based on these
other measures for calculating cigarette equivalents, it would seem that the use of linear
extrapolation of cotinine or nicotine concentrations based on cigarette equivalents would
thus underestimate the true risk from ETS.
Conversely Rosenbaum, Sterling, and Weinkam (1998), using RSP and factoring
in the differences in retention of particulates in the lungs of non-smokers from ETS in
comparison to the retention of particles in the lungs of smokers from active smoking,
came up with a dose for passive smokers about .001% of active smokers. These authors
contend that using nicotine for cigarette equivalents overestimates risk. In either case, it
is difficult to estimate the risk to non-smokers of lung cancer based on these results.
These estimates could be gross underestimates of risk of lung cancer when compared to
the risk using carcinogens to calculate cigarette exposure, or over estimates if using the
amount of respirable suspended particulates.
When comparing the extrapolation based on nicotine concentration produced
cigarette equivalents one gets a better picture of whether this approach is acceptable or
not. Using linear extrapolation Hackshaw (1998) estimated that passive smokers would
have about 1 % of the risk of lung cancer in active smokers, which is an estimated
relative risk of 1.1 9 or 19% excess risk. This level of risk is in general agreement with the
level of risk of lung cancer that was calculated by Hackshaw (1 998), 1.24 or 24% excess
risk, in pooling 37 epidemiological studies of non-smoking women living with smoking
husbands. In contrast, the risk of lung cancer among never smokers calculated by
Rosenbaum et al. (1998), based on extrapolation from smokers to non-smokers using
the cigarette equivalents from retained dose of RSP would lead to 1 death per 4.7 million
never smokers. The epidemiological evidence does not support the level of risk being
this small.
Cotinine is the short term marker of choice for epidemiological studies to assess
risk with levels in body fluids possibly elevated 10 or more times in the most heavily
exposed groups of non-smokers (Repace and Lowrey, 1990). While questionnaires are
frequently used for epidemiological studies, the use of cotinine or nicotine concentrations
can greatly improve the accuracy of the assessment. By using cotinine or nicotine, it is
possible to confirm the exposure groupings that participants have placed themselves in.
Confounding by non-smoker misclassification, and in particular spousal non-smoker
misclassification, is an issue that is frequently raised as a source of error to explain the
causative relationships that are seen in epidemiological studies (Lee, 1998). The use of
cotinine levels in physiological fluids to confirm smoking status can reduce this
misclassification. In general most smokers have a urine cotinine level of ~100nglml
whereas non-smokers have a level that is usually below 15 nglml (Jenkins and Counts,
1999). These levels can thus be used to confirm the non-smoking status of those
claiming to be non-smokers.
In addition to reducing non-smoker misclassification, the use of cotinine levels can
help to get a better understanding of the true risk, as for most people who claim to have
no exposure, their actual exposure when measured using cotinine is not zero. As
discussed by Repace and Lowrey (1990), few non-smokers have been found to have an
absence of cotinine in their body fluids. This may be of significant importance because
according to Hackshaw (1998), the inclusion of non-smoking women in the unexposed
group that are assumed to have zero risk but in fact are actually exposed to ETS from
people other than their spouse, both inside and outside the house, will dilute the true risk
to non-smokers from exposure to ETS in general. Additional support for the use of
cotinine or nicotine concentrations in epidemiological studies for the calculation of risk
comes from the fact that the mean levels of urinary nicotine and cotinine in body fluids
increase, both with an increasing self-reported ETS exposure, and with an increasing
number of cigarettes smoked per day by active smokers (Repace and Lowrey, 1990).
The fact that the levels go up with increasing exposure and that this is consistent with
what is observed in active smokers is indicative that the use of these markers in
epidemiological studies of ETS to measure exposure is reasonable, and to reduce
misclassification desirable.
In addition to using nicotine or continine concentrations to calculate cigarette
equivalents or for confirming the level of exposure in epidemiological studies and
ultimately, with either of these methods, to estimate risk of lung cancer or cardiovascular
disease from ETS exposure, these concentrations can also be used to build models to
predict the risk of these outcomes. These models may be used to either predict the risk
from a given level of exposure or to set levels of exposure that will ensure levels of risk
that are not exceeded. Repace and Lowrey (1993) built a model to predict the
environmental concentrations of nicotine that would lead to de minimis risk (acceptable)
and de manifestis risk (of obvious or evident concern). This sort of work may be of great
value to regulatory bodies in setting standards protective of worker health.
While their model initially used RSP concentrations in air, they later used the ratio
of RSP to nicotine in ETS, demonstrated by Leaderer and Hammond (1991), to be about
10 to 1, to convert the exposure concentrations to nicotine in air (Repace and Lowrey,
1993). Steady state cotinine levels in plasma were then related to the estimated nicotine
exposure by pharmacokinetic modelling in order to be able to assess the accuracy of the
exposure estimates (Repace and Lowrey, 1993). After validating the model and finding
that the model predicted cotinine levels to within 10-15% of the available data for median
and peak levels of cotinine measured in the body fluids of non-smokers, Repace and
Lowrey (1993) then modelled risk of lung cancer from nicotine and cotinine
concentrations. The model predicts a I e-6 (de minimis) risk of lung cancer for nicotine in
air concentration of 7.5 nglm3 (8-hr TWA), which yields a corresponding steady state
cotinine value of 2.6 e-3 nglml urine and conversely a 3e-4 (de manifestis) risk of 2.3
pg/m3 (air nicotine, 8-hr TWA), yielding a corresponding steady state cotinine
concentration of 0.8 nglml urine is also predicted (Repace and Lowrey, 1993). These
levels can then be used to set regulatory requirements for indoor air quality. The risk
model on which these values were based was successful in predicting the risk ratio
observed in the American Cancer Society Cohort study on passive smoking and lung
cancer and predicted exactly the misclassification adjusted odds ratio for spousal
passive smoking and lung cancer derived by the US EPA in its meta-analysis of 11 US
epidemiological studies (Repace and Lowrey, 1993).
Models have also been used to predict the risks to the population as a whole
based on levels of air nicotine or cotinine in body fluids representing ETS exposure. In a
recent study, by modelling the nicotine from ETS in office air and salivary cotinine in
non-smoking US workers, Repace, Jinot, Bayard, Emmons, and Hammond (1998),
estimated the percentage of ETS exposed office workers that exceed the US
Occupational Safety and Health Administration's (OSHA's) significant risk level for heart
disease and lung cancer (111000). They found that more than 95% of office workers
exceed OSHA's significant risk level for heart disease mortality and 60% exceed OSHA's
significant risk for lung cancer mortality (Repace et al., 1998). The results of this study
indicate that 4000 heart disease deaths and 400 lung cancer deaths occur annually
among US office workers at the 28% prevalence of unrestricted smoking in office
workplaces at the time of the study (Repace et al., 1998).
Given the ways in which concentrations of nicotine and cotinine are used in the
calculation of risk of disease from exposure to ETS, there are potential problems that
may be encountered. Certainly one problem could be the use of one measurement at
one point in time to determine the concentration of either nicotine in air or of nicotine or
cotinine in a physiological fluid. While the concentration in air may not be an issue if the
previously discussed criteria suggested by Daisey (1 999), are met, if they are not,
particularly if the room is not at quasi steady state, it may be impossible to determine
how biased the measured concentration is with respect to the actual level of ETS in the
air. A similar problem can be said for measurements of nicotine or cotinine in
physiological fluids. If the levels of these compounds are not at steady state, they may
not be very reflective of the true level of ETS exposure. Using nicotine in plasma (or the
corresponding levels in saliva or urine) this may be even more problematic as the half-
life of nicotine is approximately 2 hours so the timing of the sample is crucial to
determining exposure levels (Dockery and Trichopoulos, 1997). Using the levels of
nicotine or cotinine to assess cigarette equivalents may also pose some problems
particularly in trying to convey the level of risk to others. According to Repace and
Lowrey (1 99O), when using cigarette equivalents as a measure of risk, significant risks
from ETS exposure as compared to a de minimis level of risk might be concealed by
statements that relate non-smokers exposures as being orders of magnitude lower than
the exposures represented by smoking a single cigarette.
Despite the potential problems with the use of nicotine and cotinine
concentrations as markers for ETS exposure in the calculation of risk, it does appear
that their use is reasonable. It is clearly biologically plausible that ETS causes lung
cancer and cardiovascular disease at the levels of nicotine and cotinine that are
measured. In addition, it appears that despite the host of chemicals in ETS for which
ratios to nicotine are not known, and that nicotine's decay kinetics differs from many of
the chemicals for which ratios are known, provided smoking occurs regularly in the
environment, the system is at quasi-steady state and the sampling time is significantly
longer than the characteristic times for removal processes, nicotine does represent ETS
in general. Cotinine levels also appear to be representative of ETS exposure as long as
the measurements are not used individually, but rather are used as an average value
from a group of measurements. The risk assessments conducted to date appear to be
using the measurements of nicotine and cotinine in a manner that is consistent with what
is known about ETS from field measurements. One of the key pieces of evidence in
favour of the use nicotine and cotinine concentrations for risk calculation is that the
resulting calculations of the level of risk of lung cancer and heart disease related to a
concentration of nicotine or cotinine are in strong agreement with the level of excess risk
of lung cancer and heart disease that has bee observed in epidemiological studies. This
is the case both for models that predict risk as well as models using cigarette
equivalents to predict risk by linear extrapolation. In both of these cases, the risk
predictions agree with the levels of risk that were found in the epidemiological studies
that have been conducted. If levels of nicotine currently observed in cigarettes are
reduced (which is an approach suggested in order to reduce their addictiveness) the use
of nicotine and cotinine to assess exposure to ETS may have to be re-assessed. Until
such time, and until a better marker for ETS exposure is determined, nicotine and
cotinine should continue to be used for the measurement of ETS exposure allowing for
the subsequent calculation of risk of lung cancer and cardiovascular disease.
If an increase in the risk of disease is predicted from exposure to ETS, then
conversely one would expect to observe a reduction in that risk upon termination of the
exposure. Supporting this expectation, Boffetta et al. (1999) found an indication of a
protective effect after cessation of ETS exposure. Similarly the International Agency for
Research on Cancer (IARC) in a large case control study in Europe found a 16% excess
risk of lung cancer due to spousal exposure to ETS, a 15% excess risk due to workplace
exposure to ETS and a decrease in excess risk in both cases after a cessation of
exposure (Boffetta et al., 1998). Additionally, Kiyohara et al. (2003) postulate that
variability in susceptibility to carcinogens may be particularly important at low degrees of
environmental exposure. They feel that the effect of phenotype or genotype is likely to
be much more evident at a low dose of exposure than at high-dose exposure because at
high dose exposures saturation of the enzyme activity occurs among those with both
phenotypes of high and low activity, but does not at low-level exposures. This link has
been demonstrated with active smokers with a stronger association between cancer risk
and metabolic genotypes among light smokers than among heavy smokers (Kiyohara et
al., 2003). Similarly, Malats et al. (2000) found that GSTM1*2 genotype (determining a
lack of the phase II detoxifying enzyme GSTMI) is associated with an increased risk for
lung cancer in non-smokers. ETS with its corresponding very low-level exposure to the
carcinogens it contains may particularly affect the susceptible population.
Repace et al. (1998) used estimations of the uptake and metabolism of nicotine
to calculate saliva cotinine levels, which were subsequently used to estimate the risk of
lung cancer and heart disease. Similarly, the studies by Repace and Lowery (1 993) and
Repace and Lowery (1990) involved estimations of various aspects of exposure or dose
in calculation of risk from ETS exposure. In other models, the route of exposure of
nicotine was through intravenous infusion. Benowitz and Jacob (1993) used intravenous
dosing of nicotine to describe nicotine and cotinine elimination pharmacokinetics in
smokers and non-smokers. Similarly, Curvall, Vala, Enzell, and Wahren (1990) used
intravenous infusions of nicotine and cotinine measurements in body fluids to simulate
and evaluate nicotine intake during passive smoking. In the present study, the estimates
are replaced with actual measurements of air nicotine exposure and corresponding
measurements of the levels of nicotine and cotinine in urine and saliva to ascertain dose.
The use of actual measurements of these levels will ultimately allow for a more accurate
prediction of the risk of lung cancer and heart disease than what can be expected will be
obtained using the current models.
Past risk analyses like that of Repace et al. (1998) have used previously reported
measurements of the level of nicotine in air in various workplaces and compares them to
levels of cotinine in blood of workers in similar work environments from other studies in
order to calculate the theoretical risk of heart disease and lung cancer posed by
exposure to these environments. While the risk analysis done by Repace et al. (1998)
does use actual measurements of air nicotine and blood cotinine levels for the
calculation of risk, these measurements were taken from separate studies. By using
measurements from two different studies Repace and Lowery (1998) must make the
assumption that the air nicotine level in the study from which the blood cotinine levels
were taken was the same as in the study that the air nicotine levels were taken from. In
addition, the measurements of the cotinine in blood were taken at only one time point.
The use of a single point in time for the measurement of cotinine in blood has a
significant inherent assumption. By using a single time point one must assume that the
level of cotinine was at steady state at the time the sample was taken. This assumption
may have a significant impact on the resulting calculation of risk. The present study
looks at the measurement of nicotine in air to calculate risk as well as attempts to
compare the measurement of nicotine in air with subsequent cotinine levels measured in
physiological fluids at different time points to gain a better understanding of how much
nicotine is absorbed during exposure to second hand smoke. With the improved
understanding of nicotine absorption more accurate estimates of risk of lung cancer and
heart disease should be possible.
MATERIALS AND METHODS
Passive Air Monitoring for Nicotine in Greater Vancouver Casinos:
In the first phase of the project, the amount of nicotine in air was measured and
used to determine the risk of lung cancer and heart disease due to passive smoke
exposure. This portion of the study was conducted in casinos representing three
different exposure scenarios. The first exposure scenario was in a casino where
smoking was not permitted anywhere inside the facility. The second exposure scenario
was a casino where smoking was permitted only in a separately ventilated smoking
room. The third exposure scenario was a casino where smoking was permitted
throughout the facility with no restrictions other than smokers were not permitted to
smoke at designated non-smoking tables within in the facility but these tables were still
within the general area of the facility. In order to calculate risk of lung cancer and heart
disease from second hand smoke exposure in each of the facilities, nicotine levels were
measured in each of the facilities and used to represent the multitude of chemicals in
ETS.
Construction of Passive Air Monitors
Measurement of nicotine was accomplished by use of specially designed passive
monitors. The monitors were built as described by Hammond and Learderer (1 987).
Briefly, a Teflon-coated glass fibre filter (Emfab TX4Hi20ww, Pallflex Corp., Putnam, CT)
was treated with a 5% sodium bisulfate, 4% ethanol solution and allowed to dry. This
treatment had previously been found to be effective in trapping nicotine on the filter
paper (Hammond and Learderer, 1987). The treated filter paper was placed on top of a
37 mm support pad (Pall Gelman Laboratory cellulose support pad) and both were
placed in the bottom of a 37 mm diameter styrene acrylonitrile cassette (Pall Gelman 37
mm three piece air monitoring cassette catalogue number 4339). The filter paper and
support pad were held in place by a windscreen. The windscreen was constructed from
the styrene acrylonitrile spacer (the middle piece of the three piece cassette) onto which
a 10 vm pore 47 mm Poretics polycarbonate filter paper (catalogue number
K99CP04700) had been glued and the overlapping portion of the filter trimmed off. The
spacer had previously been machined in the Simon Fraser University machine shop so
that the distance from the windscreen to the filter paper was 1 .I 7 cm, this distance was
consistent with the passive monitors used by Hammond, Leaderer, Roche, and
Schenker (1987). This would ensure a sampling rate in agreement with the 25mLlmin
as had been calculated as the theoretical rate and subsequently validated by Hammond
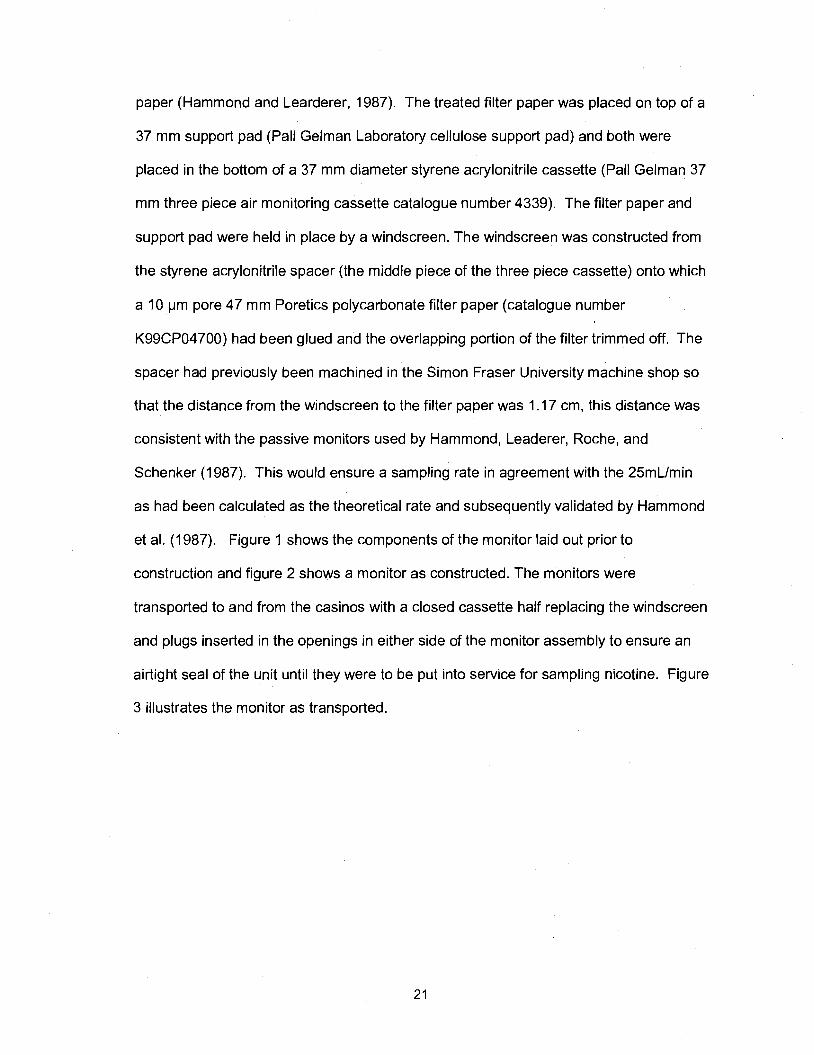
et al. (1987). Figure 1 shows the components of the monitor laid out prior to
construction and figure 2 shows a monitor as constructed. The monitors were
transported to and from the casinos with a closed cassette half replacing the windscreen
and plugs inserted in the openings in either side of the monitor assembly to ensure an
airtight seal of the unit until they were to be put into service for sampling nicotine. Figure
3 illustrates the monitor as transported.
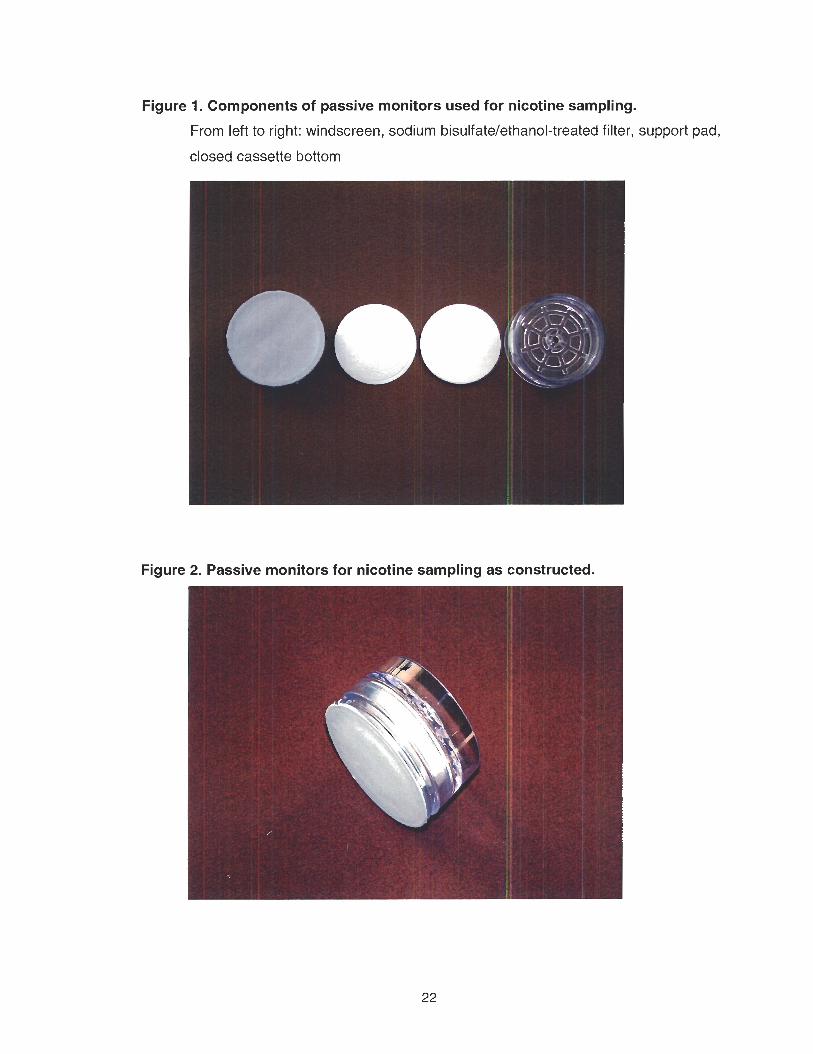
Figure 1. Components of passive monitors used for nicotine sampling.
From left to right: windscreen, sodium bisulfate/e'thanol-treated filter, support pad,
closed cassette bottom
Figure 2. Passive monitors for nicotine sampling as constructed.
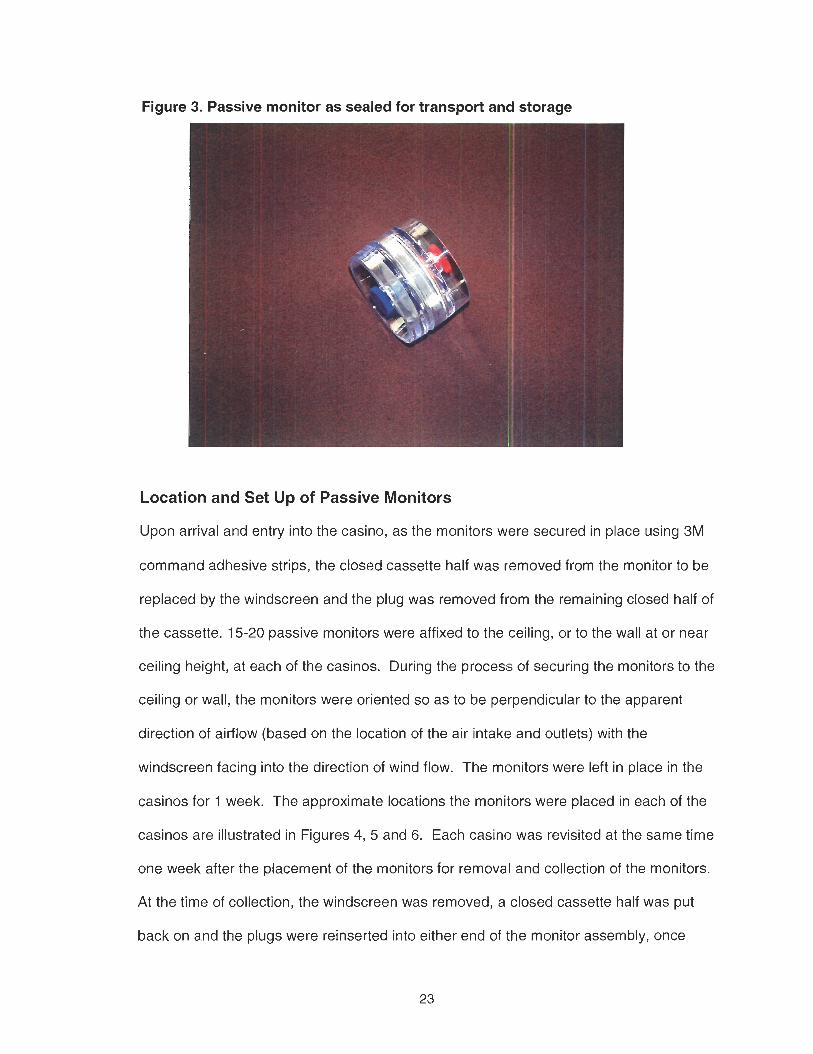
Figure 3. Passive monitor as sealed for transport and storage
w
Location and Set Up of Passive Monitors
Upon arrival and entry into the casino, as the monitors were secured in place using 3M
command adhesive strips, the closed cassette half was removed from the monitor to be
replaced by the windscreen and the plug was removed from the remaining closed half of
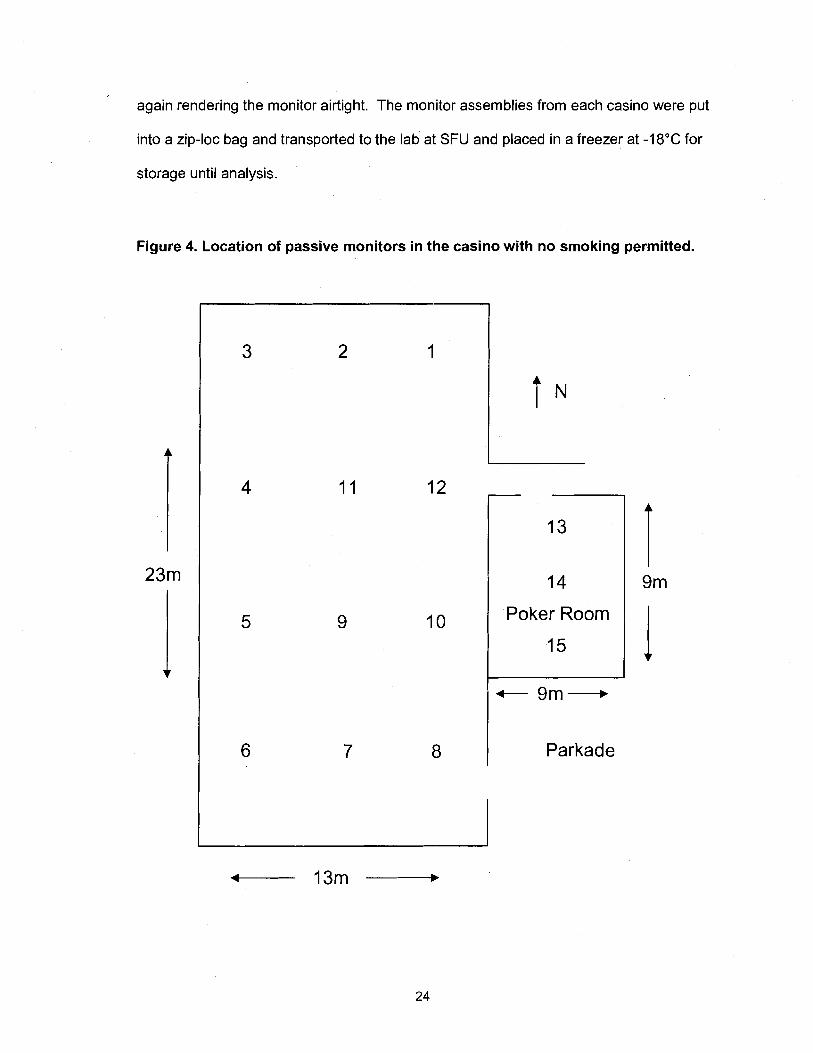
the cassette. 15-20 passive monitors were affixed to the ceiling, or to the wall at or near
ceiling height, at each of the casinos. During the process of securing the monitors to the
ceiling or wall, the monitors were oriented so as to be perpendicular to the apparent
direction of airflow (based on the location of the air intake and outlets) with the
windscreen facing into the direction of wind flow. The monitors were left in place in the
casinos for 1 week. The approximate locations the monitors were placed in each of the
casinos are illustrated in Figures 4, 5 and 6. Each casino was revisited at the same time
one week after the placement of the monitors for removal and collection of the monitors.
At the time of collection, the windscreen was removed, a closed cassette half was put
back on and the plugs were reinserted into either end of the monitor assembly, once
again rendering the monitor airtight. The monitor assemblies from each casino were put
into a zip-loc bag and transported to the lab at SFU and placed in a freezer at -18•‹C for
storage until analysis.
Figure 4. Location of passive monitors in the casino with no smoking permitted.
14
Poker Room
15
+- 9m-
Parkade
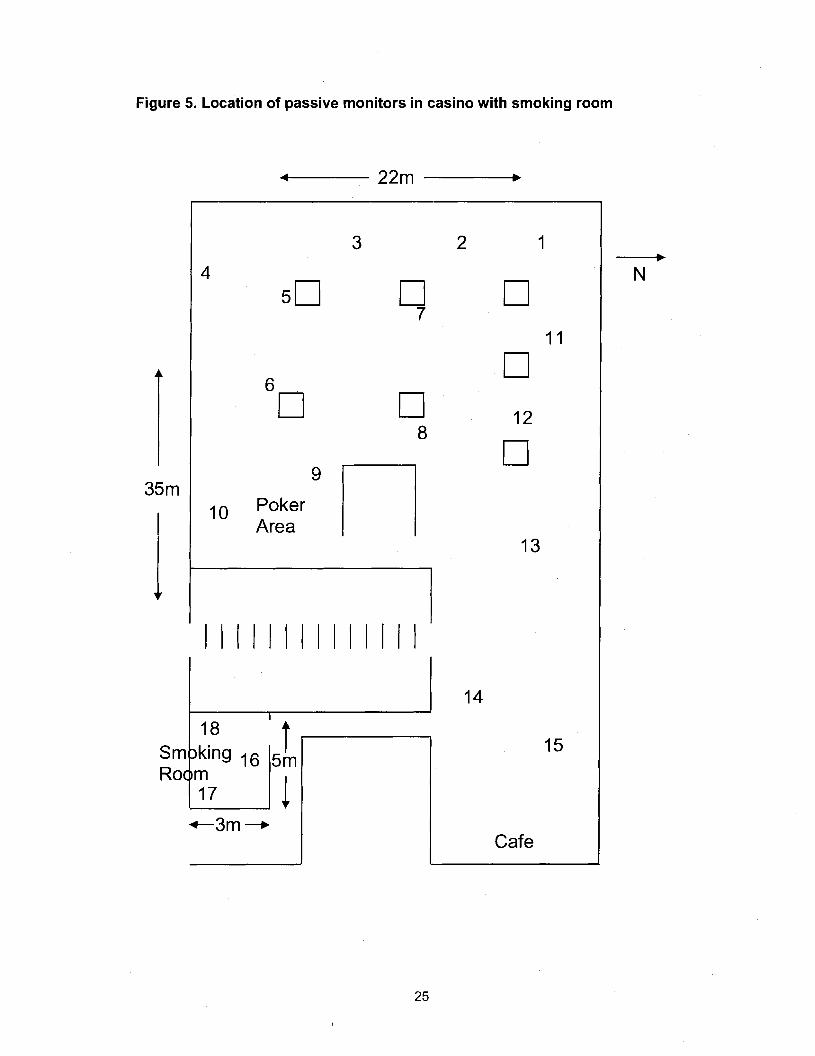
Figure 5. Location of passive monitors in casino with smoking room
10 Poker Area
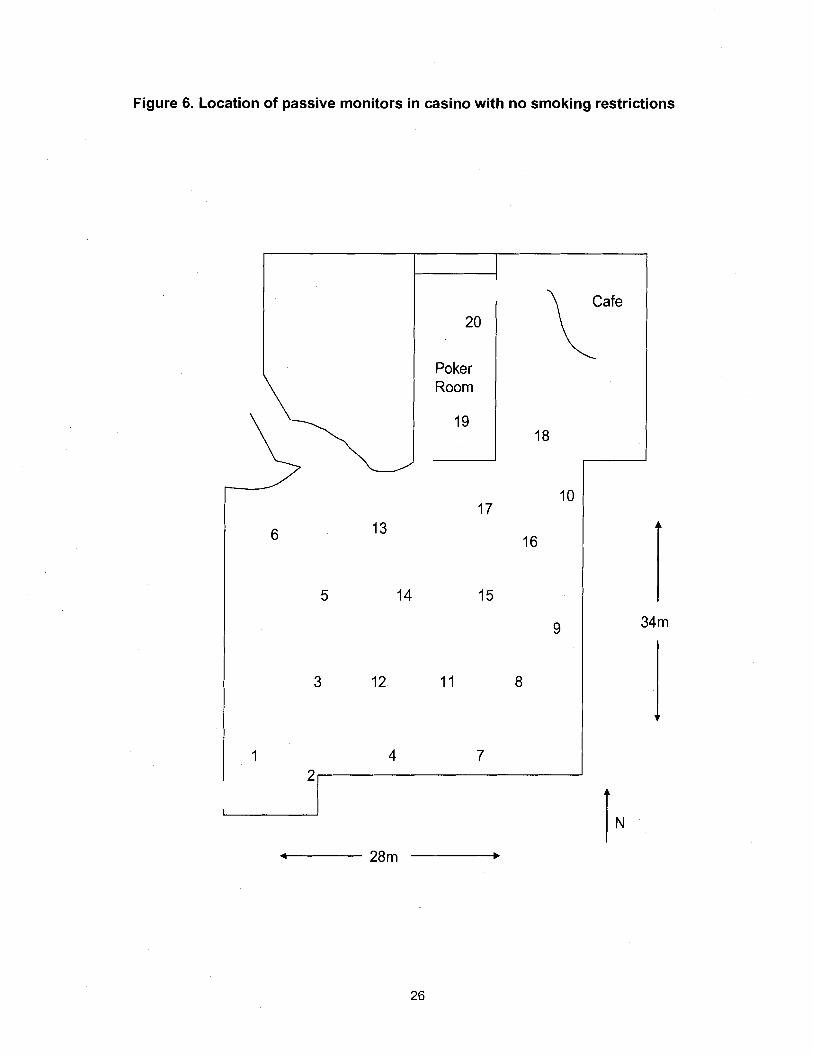
Figure 6. Location of passive monitors in casino with no smoking restrictions
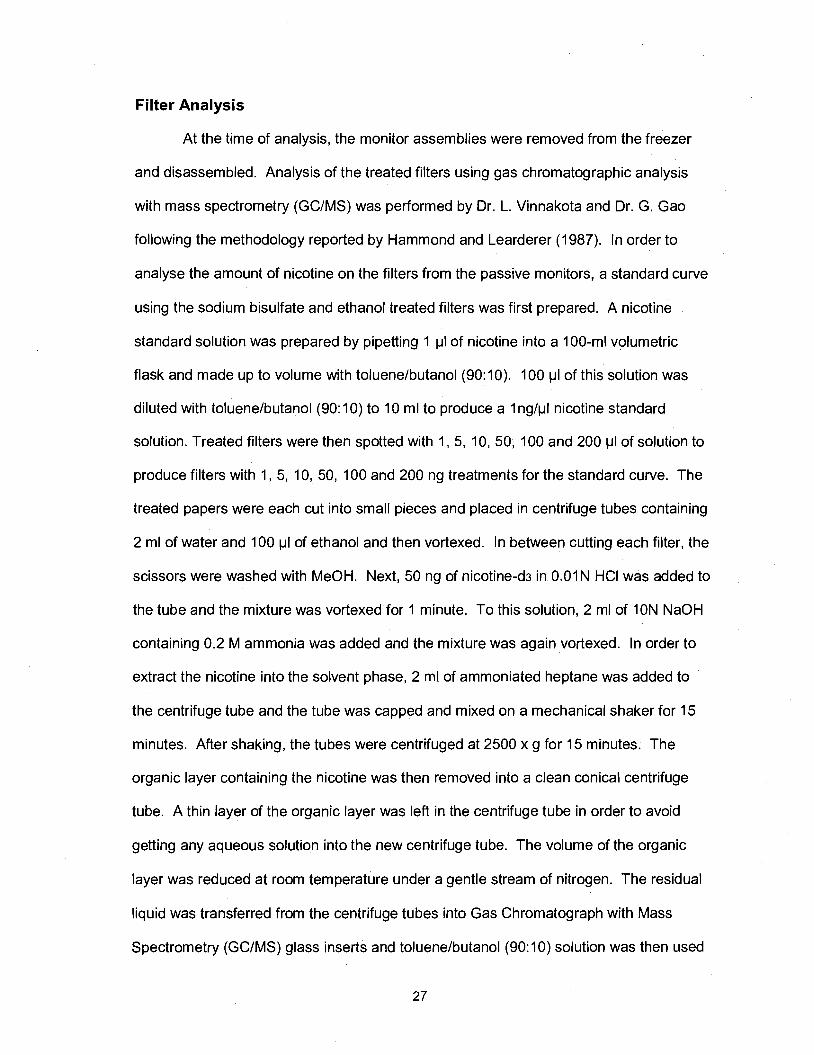
Filter Analysis
At the time of analysis, the monitor assemblies were removed from the freezer
and disassembled. Analysis of the treated filters using gas chromatographic analysis
with mass spectrometry (GCIMS) was performed by Dr. L. Vinnakota and Dr. G. Gao
following the methodology reported by Hammond and Learderer (1987). In order to
analyse the amount of nicotine on the filters from the passive monitors, a standard curve
using the sodium bisulfate and ethanol treated filters was first prepared. A nicotine
standard solution was prepared by pipetting 1 pI of nicotine into a 100-ml volumetric
flask and made up to volume with toluenelbutanol (90:lO). 100 yl of this solution was
diluted with toluenelbutanol (90:lO) to 10 ml to produce a 1 nglpl nicotine standard
solution. Treated filters were then spotted with 1, 5, 10, 50, 100 and 200 y1 of solution to
produce filters with 1, 5, 10, 50, 100 and 200 ng treatments for the standard curve. The
treated papers were each cut into small pieces and placed in centrifuge tubes containing
2 ml of water and 100 y1 of ethanol and then vortexed. In between cutting each filter, the
scissors were washed with MeOH. Next, 50 ng of nicotine-ds in 0.01 N HCI was added to
the tube and the mixture was vortexed for 1 minute. To this solution, 2 ml of ION NaOH
containing 0.2 M ammonia was added and the mixture was again vortexed. In order to
extract the nicotine into the solvent phase, 2 ml of ammoniated heptane was added to
the centrifuge tube and the tube was capped and mixed on a mechanical shaker for 15
minutes. After shaking, the tubes were centrifuged at 2500 x g for 15 minutes. The
organic layer containing the nicotine was then removed into a clean conical centrifuge
tube. A thin layer of the organic layer was left in the centrifuge tube in order to avoid
getting any aqueous solution into the new centrifuge tube. The volume of the organic
layer was reduced at room temperature under a gentle stream of nitrogen. The residual
liquid was transferred from the centrifuge tubes into Gas Chromatograph with Mass
Spectrometry (GCIMS) glass inserts and toluenelbutanol (90: 10) solution was then used
to rinse the centrifuge tubes into the GCIMS inserts. The GCIMS inserts were placed
into the automatic sampler of a Hewlett-Packard GCIMS model number 5890 for
analysis. The GCIMS was connected to and controlled by a personal computer
equipped with Hewlett-Packard Chemstation software for data storage and processing.
The GCIMS column in use had a length of 30 m and an internal diameter of .53 mm.
Helium was used as the carrier gas. The GCIMS was programmed using the selective
ion method to analyse for ions 84 (nicotine) and 87 (nicotine-ds) after a 4.5 minute
solvent delay using a 8 minute time window. The oven temperature was programmed to
50 "C. After a one minute start up, the oven was programmed to go from an oven
temperature of 70 "C to 250 "C at a rate of 25 "Clminute with the maximum oven
temperature set to 300 "C and run time set at 9.2 minutes. The injector temperature was
programmed at 250 "C and the detector temperature was set to 280 "C. The auto
sampler was programmed to perform two solvent A washes, two solvent B washes, two
sample washes, and two sample pumps.
Passive Air Monitoring with a Simultaneous Human ETS Exposure Trial in a Casino Lacking Smoking Restrictions
In this phase of the study, 2 human volunteers were exposed to environmental
tobacco smoke by having them spend time in the general area of a casino where
smoking was permitted. Additionally, overlapping the exposure of the human volunteers,
another trial was conducted with the passive monitors affixed to the ceiling of the casino
for one week, in approximately the same locations as during the initial phase of the
study. The purpose of this phase of the study was to attempt to quantify the extent of
exposure to environmental tobacco smoke given a fixed period of exposure and to
validate the initial measurement of the concentration of nicotine in this casino as
measured in the first phase of the study.
Ethical Approval and Volunteer Recruitment
Prior to conducting this portion of the experiment, details of the study and a
proposed volunteer consent form and volunteer information form had been submitted to
the SFU ethics approval committee. The volunteer consent and volunteer information
forms are attached in Appendices A & B. Two non-smoking volunteers were recruited
for participation in this phase of the study. A non-smoker was defined as a healthy
individual between the ages of 20-40, who had not smoked for the past year any tobacco
products including cigarettes, cigars or pipe tobacco, did not use chewing tobacco of any
kind, did not live with a person who smoked any tobacco products, and was not using
any form of nicotine replacement therapy. Each volunteer was required to read the
information sheet and sign the consent form. In addition each volunteer was given a
Subject Feedback form. A copy of the Subject Feedback form is located in Appendix C.
Sample Collection
In order to determine the amount of environmental tobacco smoke to which the
volunteers were exposed, passive nicotine monitors were worn by the volunteers for the
duration of the time they were inside the casino. The passive monitors worn by the
volunteers were constructed in the same fashion as those used in the first phase of the
study with the addition of an alligator clip fastened to the bottom piece of the polystyrene
cassette to allow the monitor to be affixed to the shirt collars of the volunteers. Figure 7
illustrates the passive monitors as worn by the volunteers.
In addition to the passive monitors worn by the volunteers, in order to
accommodate the determination of the actual dose of environmental tobacco smoke
each volunteer received, samples of urine and saliva were collected from each of the
volunteers. The fluids were then analysed for nicotine and its main metabolite, cotinine.
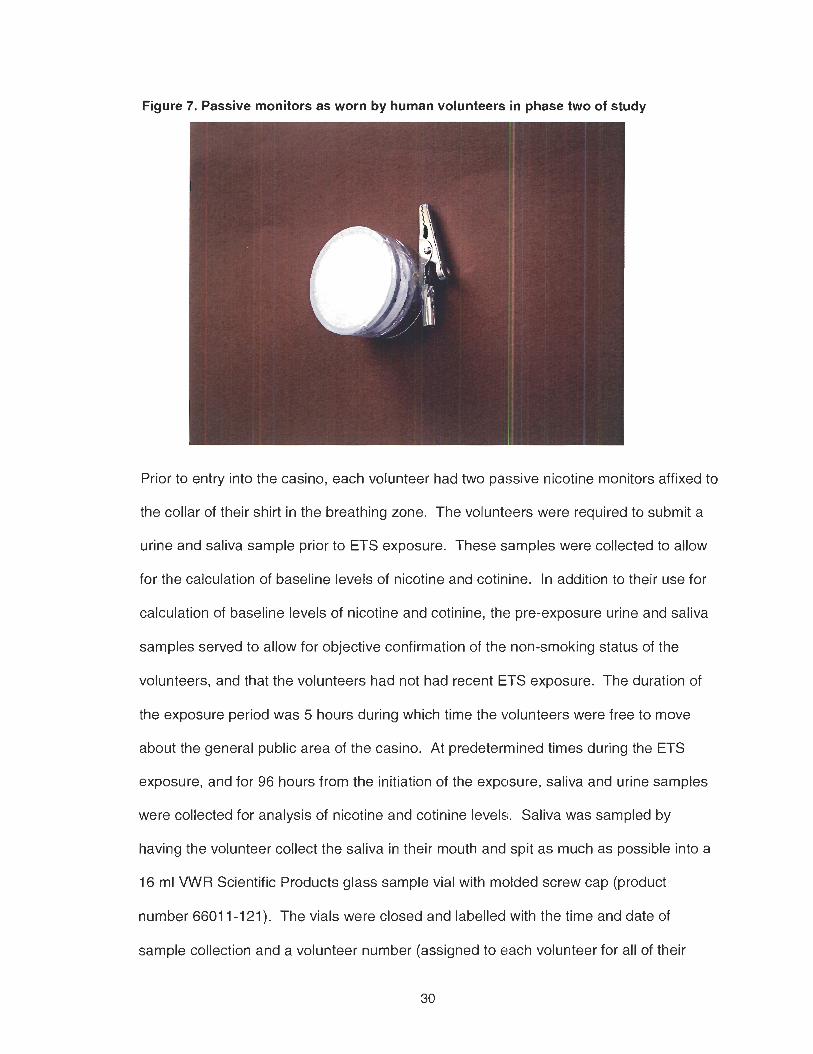
Figure 7. Passive monitors as worn by human volunteers in phase two of study
Prior to entry into the casino, each volunteer had two passive nicotine monitors affixed to
the collar of their shirt in the breathing zone. The volunteers were required to submit a
urine and saliva sample prior to ETS exposure. These samples were collected to allow
for the calculation of baseline levels of nicotine and cotinine. In addition to their use for
calculation of baseline levels of nicotine and cotinine, the pre-exposure urine and saliva
samples served to allow for objective confirmation of the non-smoking status of the
volunteers, and that the volunteers had not had recent ETS exposure. The duration of
the exposure period was 5 hours during which time the volunteers were free to move
about the general public area of the casino. At predetermined times during the ETS
exposure, and for 96 hours from the initiation of the exposure, saliva and urine samples
were collected for analysis of nicotine and cotinine levels. Saliva was sampled by
having the volunteer collect the saliva in their mouth and spit as much as possible into a
16 ml WVR Scientific Products glass sample vial with molded screw cap (product
number 6601 1-121). The vials were closed and labelled with the time and date of
sample collection and a volunteer number (assigned to each volunteer for all of their
samples prior to sample collection). The volunteers were instructed to collect the total
volume of urine they voided during the predetermined time period in a 24 hour urine
sample container, and pour off an aliquot of the urine collected for that time period into a
urine specimen container and appropriately label it with the volunteer number, the time
period of the sample and the total volume of urine collected for that time period. To aid
in the consistency of sample collection, the volunteers were each given a sample
collection guide sheet with the suggested times and date for saliva sample collection and
another for suggested time periods for urine sample collection. In addition to aiding in
timeliness of sample collection, these sheets also allowed for the actual timeltime period
of sample collection to be recorded. A copy of the sample collection sheets provided to
the volunteers can be found in appendix D. The volunteers were directed to try to
adhere to the sample collection period but more importantly, that actual sample times
were to be accurately recorded. Samples collected before and during the exposure
period were transported to the lab for storage in the freezer immediately after the
completions of the sampling period. Samples collected for the remainder of the sample
collection period were stored frozen at the volunteers' homes until delivery to the lab for
frozen storage until analysis.
Sample Analysis
Saliva and urine were analysed for nicotine and cotinine by Dr. L. Vinnakota and
Dr. G. Gao using a modified version of the method used for analysis of the filter papers.
First a standard curve was prepared by pipetting 1 ml of saliva (or 1 :4 urine) into five
different centrifuge tubes. Next, into the tubes, 25, 50, 100, 250 or 500 ng of cotinine
(dissolved in 0.01 M HCI) was added. 5, 10, 20, 50 or 100 ng of nicotine (also dissolved
in 0.01 M HCI) was also added to the tubes. Into each tube 200 ng of cotinine-d4 in 0.01
N HCI and 20 ng nicotne-d3 was added. The tubes were vortexed and then 0.5 ml of 2M
NaOH containing 0.2 M ammonia was added and the tubes were then vortexed again.
Next 3 ml of a mixture of toluene and I-butanol (70:30) was added and the tubes were
capped and mixed on a shaker for 10 minutes. After shaking, the tubes were
centrifuged at 2500 x g for 15 minutes. The top organic layer was then removed to
clean, conical centrifuge tubes containing 0.5 ml of 0.5 M sulfuric acid. Care was taken
to leave a small amount of the organic layer to avoid any chance of getting water in the
new centrifuge tube. The new tubes were capped and mixed on a shaker and then
centrifuged to separate the layers. The top organic layer was discarded using vacuum
suction. Aqueous potassium carbonate (0.5 ml of 50% wlv containing 0.2 M ammonia)
and 200 yl of 90:lO toluene-butanol were added to the centrifuge tube. The tubes were
capped and mixed on a shaker, centrifuged and placed in a dry-ice acetone bath. The
top organic layer was transferred into a GCIMS glass insert using a small amount of
90:lO toluene butanol to rinse the centrifuge tube as necessary. The tubes were then
analysed on the GCIMS to make the standard curve for the extraction. The saliva and
urine samples were then analysed using this method (other than the addition of the
nicotine or cotinine standards). For this phase of the study, the set up of the GCIMS
was the same as in phase one except for the analysis of the urine and saliva, the
instrument was programmed to detect additional ions 176 (cotinine) and 180 (cotinine-
d4).
Human ETS Exposure Trial in a Bingo Smoking Room
In this phase of the study, 6 healthy non-smoker volunteers (three males and
three females) were exposed to ETS during a 4 hour stay in the smoking room of a
bingo hall.
Volunteer Recruitment
Six healthy non-smoker volunteers (three males and three females) were
recruited for this phase of the study. Appendices E and F contain copies of the
volunteer consent form and volunteer information sheet used for this phase of the study.
The same Subject Feedback form used in the second phase was used in the third
phase. Again all volunteers were required to complete the consent form prior to
participation in the study. In addition to the consent form and information form, a week
prior to participating in the study, volunteers were given a protocol for the experiment
that they were to follow. A copy of the protocol can be found in appendix G.
Sample Collection
Similar to the exposure of volunteers in the casino in the second trial, the
volunteers were required to wear a passive monitor to sample the air for ETS nicotine
and to provide a saliva and urine samples at pre-determined times prior to, during and
after the exposure period. The schedule for collection of the samples in this phase of
the study is included in Appendix H. Urine collection was done in the same fashion as
the second phase of the study. Saliva was collected by first rinsing the mouth with water
and swallowing the water. After waiting 10 minutes, a cotton salivette (Sarstedt
catalogue number 51.1534) from the top portion of the 25 plastic tube was inserted into
the mouth. The salivette was chewed for 2-3 minutes while moving it around the mouth
and allowing it to soak up as much saliva as possible. Again without touching it, the
salivette was deposited back into the top portion of the plastic tube and the cap placed
back on. The tubes were labelled with the volunteer's pre-assigned letter and the time of
the sample from the start of exposure. As was done in the trial in the casino using
volunteers, the pre-exposure urine and saliva samples as well as the urine and saliva
samples collected during the exposure period, along with the passive monitors that were
worn during the exposure period, were transported after the exposure period to the lab
at SFU for storage in the freezer. The volunteers were instructed to keep their post
exposure samples in their freezers until the end of the sampling period at which time
they were to be transported to the lab at SFU for storage in the freezer until analysis.
Physiological Fluid Analysis
The urine and saliva samples were analysed for cotinine and nicotine using the
radioimmunoassay procedures that had been developed in the lab of Dr. Helen Van
Vunakis. The procedures used follow those described in Van Vunakis, Gjika, and
Langone (1 993). A separate radioimmunoassay kit was purchased for analysis of both
nicotine and cotinine from the Van Vunakis lab at Brandeis University. As per the
instructions on the kits, the kits arrived to the lab frozen, packed on dry ice and they
were subsequently stored frozen until use. The analysis of the urine and saliva samples
for cotinine was done as follows. First all the necessary solutions were prepared.
lsogeltris buffer was prepared to contain 0.14 M NaCI, 0.01 M tris-HCI and 0.1% gelatine
and then adjusted to a pH of 7.4 using 1 ON and 1 N NaOH. The lsogeltris buffer was
used for dilution in the preparation of all other solutions used in the radioimmunoassay.
The cotinine standards were prepared by diluting the 50 pglml standard solution from the
kit to first prepare a 50,000 pglml solution. An aliquot from this solution was then diluted
to prepare a 5,000 pglml solution. The 3H-cotinine solution from the kit was diluted to
yield approximately 10000 cpmlml. The 1:10 diluted Normal Rabbit Serum (NRS) in the
kit, for background binding of the radioimmunoassay, was further diluted 1:100. The Ra.
495D (20-41) Anti-Cotinine-CDI-Thyroglobulin in the kit was diluted 1:100. The undiluted
NRS was diluted 1:25 and the goat serum was diluted 1:4. All dilutions for preparation of
solutions for the analysis were done using the isogeltris buffer pH 7.4.
After preparation of the reagent solutions for the assay, the analysis was carried
out. Plastic tubes (Sarstedt Inc., No. 55,535 3.5 ml with caps) were placed in a tube
holder and labelled with the appropriate sample number. Each sample being analysed
in duplicate (including those tubes used for preparation of the standard curve). To each
tube 0.5 ml of lsogeltris buffer was added. Next the inhibitor was added to each tube
with the exception of those tubes used in the standard curve to determine total binding
and no binding. The inhibitor was either a known amount of cotinine (1000, 500, 200,
100, 50, 20 or 10 pg) using the appropriate amount of one of the standard cotinine
solutions to deliver the desired amount of cotinine diluted to 0.1 ml with isogeltris buffer
or 0.01 ml of a test sample of urine or saliva diluted to 0.1 ml with isogeltris buffer. The
tubes not receiving inhibitor received instead 0.1 ml of isogeltris buffer. Next O.lml of
the radio-labelled cotinine was added to each tube. After adding the radiolabelled
cotinine, 0.1 ml of antibody was added to each tube with the exception of the first two
and last two tubes which received O.lml of NRS 1:1000 as a non-specific background
control. All tubes were then vortexed and subsequently incubated at 37 O C for 1 hour.
After incubation, 0.1 ml of the 1:25 diluted NRS was added to each tube and the tubes
were again vortexed. Next O.lml of the goat serum was added to each tube and the
tubes were again vortexed. At this point the tubes were incubated at 4 O C overnight.
After the overnight incubation, the tubes were centrifuged for 45 minutes at 1000 x g at 4
O C . The supernatant was decanted from each tube and the sides of the tube were wiped
out using a cotton swab, taking care not to touch the pellet. The pellet was then
dissolved by adding 0.1 ml of 0.1 M NaOH and then 2 ml of scintillation fluid was added
to each tube and the tubes were vortexed. The tubes were placed in scintillation vials,
and the vials were capped. Prior to analysis, the tubes were left to sit in the dark
overnight to ensure that the pellet was completely dissolved. The tubes were run
through the scintillation counter and the results for the tubes containing known amounts
of cotinine were used to plot the standard curve and the standard curve was
subsequently used to determine the cotinine levels in the test samples.
The sample analysis for nicotine in urine and saliva was similar to that used for
cotinine. A nicotine radioimmunoassay kit was obtained from Dr. Helen Van Vunakis at
Brandeis University. Again, as was done with the cotinine analysis, the procedure for
nicotine analysis followed that specified by Van Vunakis et al. (1993). First all solutions
used in the analysis were prepared. The lsogeltris buffer solution was prepared to
contain 0.14 M NaCI, 0.01 M Tris-HCI and 0.1% gelatine and adjusted to pH 7.4 using
10 N and 1 N NaOH. Again the lsogeltris solution was used for the dilution to prepare all
subsequent solutions used in this radioimmunoassay. The nicotine standards were
prepared by diluting the 50 pglml standard from the kit to first prepare a 50,000 pglml
solution and then further diluting this solution to prepare a 5000 pglml solution. The
radio labelled nicotine solution was prepared by diluting the nicotine, L-(-)-[N-Methyl 3H]
solution from the kit 1:20 to approximately -10000 cpml0.lml. The antibody was
prepared, to ensure binding of 35%-50% of the total counts added, by diluting the Ra
526 D-22-38 Anti Nicotine-CDI-BSA 1 500. A non-specific background control was also
prepared by further diluting a 1:10 dilution of Normal Rabbit Serum (N.R.S.) to 1:500.
Undiluted N.R.S was prepared to a dilution of 1:25. Goat Anti-Rabbit-Gamma Globulins
was prepared by diluting previously undiluted Goat serum (lot # DESP-Ill) Anti-Rabbit-
Gamma Globulins 1 :4.
After preparation of the reagent solutions for the assay, the analysis was carried
out. Plastic tubes (Sarstedt Inc., No. 55,535 3.5 ml with caps)'were placed in a tube
holder and labelled with the appropriate sample number. Again each sample was
analysed in duplicate (including those used for the standard curve). First, 0.5 ml of
lsogeltris buffer, pH 7.4, was added to each tube. Next the inhibitor was added to each
tube with the exception of those tubes that were used in the standard curve to determine
total binding and no binding. The inhibitor was either a known amount of nicotine (5000,
2500, 1250, 500, 250, 125 or 50 pg) using the appropriate one of the standard nicotine
solution diluted to 0.1 ml with isogeltris buffer or 0.01 ml of a test sample of urine or
saliva diluted to 0.1 ml with isogeltris buffer. The tubes not receiving inhibitor, received
0.1 ml of isogeltris buffer. Next, all tubes received 0.1 ml of 3H Nicotine solution and,
with the exception of the first two and last two tubes, 0.1 ml of the antibody. The first two
and last two tubes received 0.1 ml of NRS 11500 as a non-specific background control.
Each tube was then vortexed and then all tubes were incubated at 37 "C for 60 minutes.
After incubation, 0.1 ml of the 1:25 dilution of NRS was added to each tube and they
were vortexed again. Next 0.1 ml of 1:4 dilution of Goat Anti-Rabbit-Gamma Globulins
was added to each tube and all tubes were again vortexed before being incubated at
4•‹C overnight. The next morning, the tubes were centrifuged cold (4•‹C) at 1000 x g for
45 minutes. After centrifuging the tubes, the supernatant was decanted and the sides of
the tubes were wiped off with a Q-tip taking care not to touch the pellet. The pellet
remaining in each tube was then dissolved with 0.1 ml of 0.1 M NaOH and 2ml of
scintillation fluid was then added to each tube and the tubes were vortexed. The tubes
were placed in scintillation vials, the vials capped and, prior to analysis, the tubes were
then left to sit overnight in the dark to ensure that the pellet was completely dissolved.
The tubes were run through the scintillation counter and the results for the known
amounts of nicotine were used to plot a standard curve and the standard curve was in
turn used to determine the nicotine levels in the test samples.
Passive Air Monitor Analysis
As the pure nicotine and d3-nicotine that had been used in the first two phases of
the study were no longer usable, the analysis of the filters in this phase was first
attempted using a modification of the radioimmunoassay protocol that had been used for
analysis of the saliva. The initial attempt used the procedures used for nicotine analysis
of saliva. In this case, instead of analysing urine or saliva, the aqueous solution from the
extraction of the filters was used. This was done at the point when there was an
aqueous solution to analyse (i.e. once the filters had gone through the extraction of the
nicotine into aqueous solution). The extraction of the nicotine to aqueous solution was
done using the same protocol as had been used in the first two phases for the analysis
of the filters from the passive monitors. The one difference was that the treatment of the
filters with nicotine for preparation of a standard curve (to verify that the
radioimmunoassay method could be used to analyse the filters from the passive
monitors) was done using the buffered standards prepared for the radioimmunoassay
method to spot known amounts of nicotine on the filter papers instead of using a nicotine
standard prepared from pure crystalline nicotine. This method proved unsuccessful.
Based on a discussion with Dr. Helen Van Vunakis (the developer of the
radioimmunoassay methodology for nicotine and cotinine) to determine if the
radioimmunoassay for nicotine had ever been used to analyse for nicotine captured from
air monitoring for nicotine previously it was decided that another approach was
warranted. The indication was that there was no reference in the literature of the assay
having been used in this fashion but that it had been used to analyse hair for nicotine
(Klein and Koren, 1999). The suggestion was that the methods used in that experiment
may be able to be adapted for the analysis of the filter papers in the present study. It
was also suggested that the problem could be that the buffer in the nicotine standard
solution may have been interfering with the release of the nicotine from the treated filter
papers. In an attempt to determine if the buffer in the nicotine standard was interfering
with the release of nicotine from the filter paper after spotting it on the filter paper or if
the method for analysing hair for nicotine could be modified for the analysis of the filters
from the passive monitors could be used, a trial using three methods simultaneously was
done.
In this trial of the variations in methods, the first method, for comparison sake,
again used known amounts of the buffered nicotine standard spotted on the filter paper
prior to starting the extraction process. The results of this were compared with trials
where known amounts of the buffered nicotine standard was put directly into the test
tube before carrying on with the extraction process and another trial where known
amounts of the buffered nicotine standard was put into the test tube along with 50 ul of
I N HCI. Again all three of these methods were unable to produce a consistent recovery
of nicotine.
Another trial was attempted using the full extraction of the nicotine into the
organic solvent and then extracting back into aqueous solution. This alteration of
methodology again proved unable to produce a consistent recovery of nicotine. At this
point the radioimmunoassay was abandoned as a method to analyse the filters and a
return to the use of the original methodology used to analyse the filters in the first two
phases of the study was undertaken. As there were only 6 filters to be analysed from
the exposure in the Bingo smoking room, the cost of using pure methyl-ds nicotine was
prohibitive. So for this phase, rather than preparing the internal standard using pure
methyl-ds nicotine as was the case in the initial two phases, nicotine-ds salicylate salt
was dissolved in double distilled water to prepare the internal standard. All other
procedures used in the initial phase filter analysis remained the same for analysis of the
filters from the personal passive monitors worn in the Bingo smoking room.
RESULTS AND DISCUSSION
Initial Passive Air Monitoring Trial
The passive monitors from the three different casinos in the initial phase of the
study were analysed to determine the amount of nicotine they had trapped. The results
of the analysis for mass of nicotine indicated that the concentration of nicotine in air did
not appear to be normally distributed, and so a log conversion of the data was performed
prior to averaging in order to obtain an average mass of nicotine on the filter papers.
The average concentration of nicotine in the air was then calculated using the average
mass of nicotine found on the filters, a total sampling time of 1 week=10080 minutes,
and an air sampling rate for the passive monitors of 24 mL/min. The air sampling rate of
the passive monitors used for this calculation had been previously validated by
Hammond and Leaderer (1987) and subsequently by Kuusimaki et al. (1999) and found
to be consistent with the theoretical sampling rate for the passive monitors as
constructed. For calculation of the concentration of nicotine in air, the passive monitors
in poker rooms were not included in the calculation, as the casino where smoking was
restricted to a separate smoking room did not have a separate poker room provided.
Figure 8 illustrates the average nicotine in air with the 95% confidence intervals.
As can be seen in this figure, the amount of nicotine found on the filters from passive
monitors that had been placed in the casino where smoking was permitted was
significantly greater than those in both the casino where smoking was confined to a
smoking room and the casino where smoking was not permitted anywhere inside the
facility.
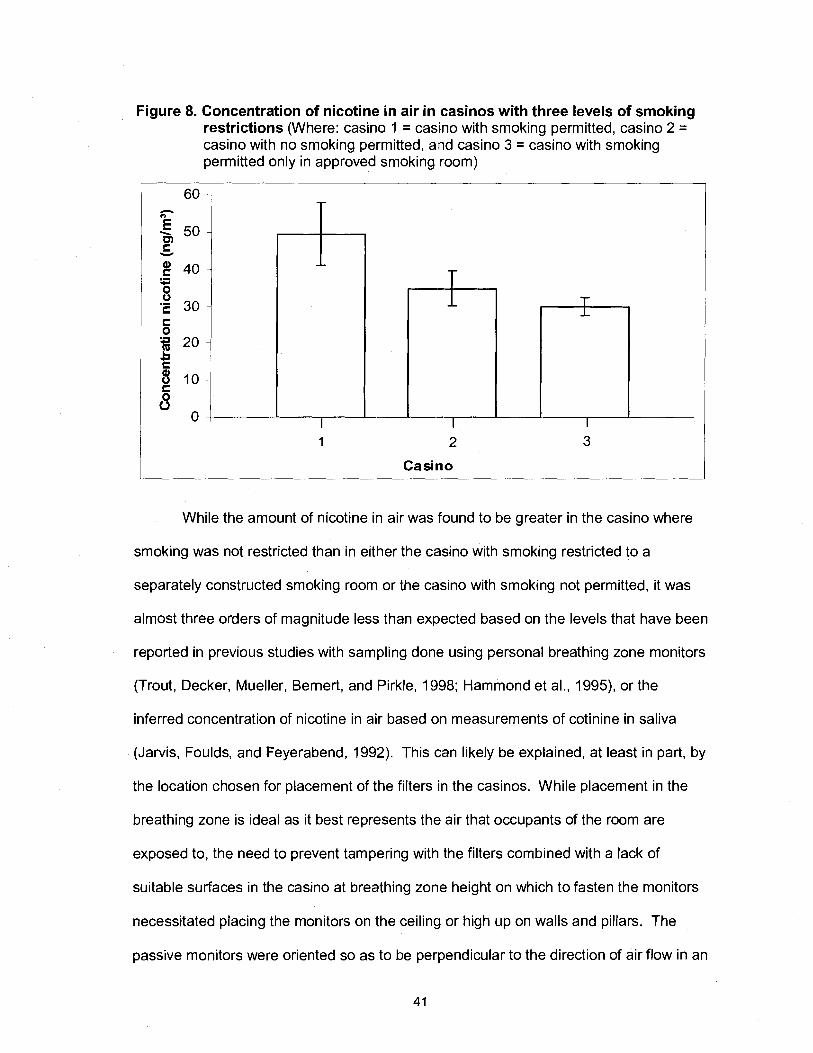
Figure 8. Concentration of nicotine in air in casinos with three levels of smoking restrictions (Where: casino 1 = casino with smoking permitted, casino 2 = casino with no smoking permitted, and casino 3 = casino with smoking permitted only in approved smoking room)
Casino
While the amount of nicotine in air was found to be greater in the casino where
smoking was not restricted than in either the casino with smoking restricted to a
separately constructed smoking room or the casino with smoking not permitted, it was
almost three orders of magnitude less than expected based on the levels that have been
reported in previous studies with sampling done using personal breathing zone monitors
(Trout, Decker, Mueller, Bernert, and Pirkle, 1998; Hammond et al., 1995), or the
inferred concentration of nicotine in air based on measurements of cotinine in saliva
(Jarvis, Foulds, and Feyerabend, 1992). This can likely be explained, at least in part, by
the location chosen for placement of the filters in the casinos. While placement in the
breathing zone is ideal as it best represents the air that occupants of the room are
exposed to, the need to prevent tampering with the filters combined with a lack of
suitable surfaces in the casino at breathing zone height on which to fasten the monitors
necessitated placing the monitors on the ceiling or high up on walls and pillars. The
passive monitors were oriented so as to be perpendicular to the direction of air flow in an
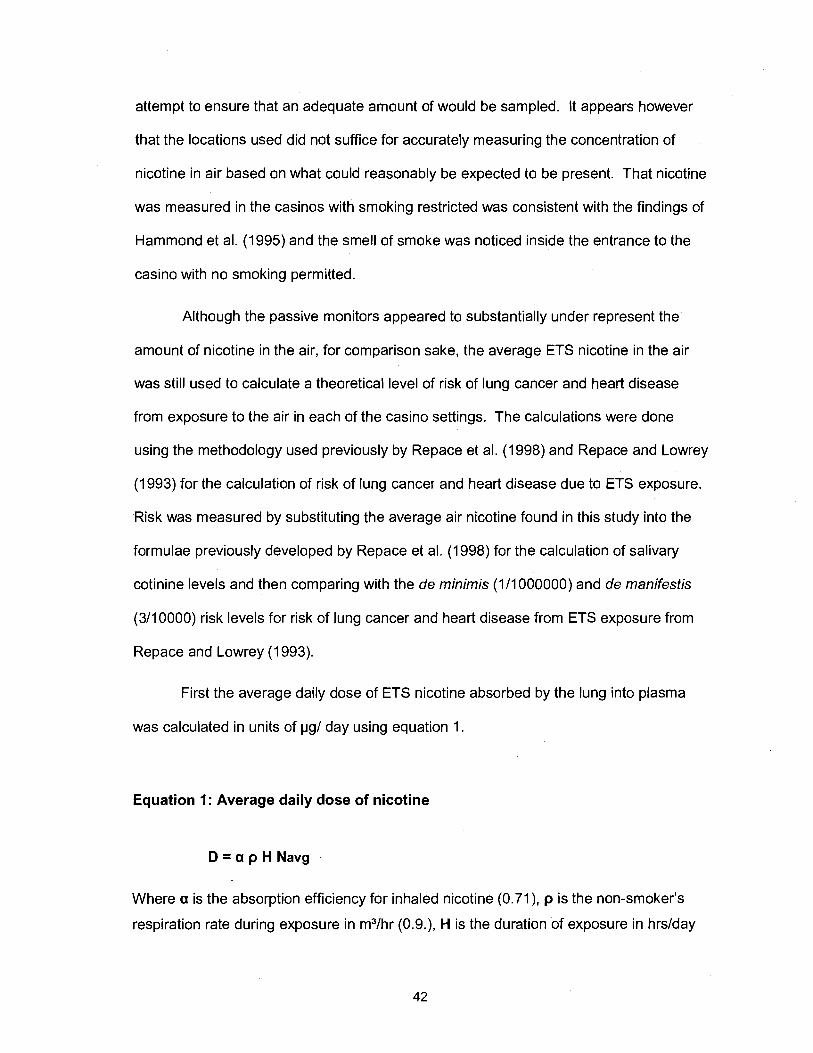
attempt to ensure that an adequate amount of would be sampled. It appears however
that the locations used did not suffice for accurately measuring the concentration of
nicotine in air based on what could reasonably be expected to be present. That nicotine
was measured in the casinos with smoking restricted was consistent with the findings of
Hammond et al. (1995) and the smell of smoke was noticed inside the entrance to the
casino with no smoking permitted.
Although the passive monitors appeared to substantially under represent the
amount of nicotine in the air, for comparison sake, the average ETS nicotine in the air
was still used to calculate a theoretical level of risk of lung cancer and heart disease
from exposure to the air in each of the casino settings. The calculations were done
using the methodology used previously by Repace et al. (1998) and Repace and Lowrey
(1 993) for the calculation of risk of lung cancer and heart disease due to ETS exposure.
Risk was measured by substituting the average air nicotine found in this study into the
formulae previously developed by Repace et al. (1998) for the calculation of salivary
cotinine levels and then comparing with the de minimis (1/1000000) and de manifestis
(311 0000) risk levels for risk of lung cancer and heart disease from ETS exposure from
Repace and Lowrey (1 993).
First the average daily dose of ETS nicotine absorbed by the lung into plasma
was calculated in units of pg/ day using equation 1.
Equation 1: Average daily dose of nicotine
D = a p H Navg
Where a is the absorption efficiency for inhaled nicotine (0.71), p is the non-smoker's
respiration rate during exposure in m3/hr (0.9.), H is the duration of exposure in hrslday
(7), and Navg is the daily average nicotine concentration (in this case taken from the
average found in the present study) (Repace et al., 1998)
These values were then used to calculate the mean plasma cotinine
concentration (P) in units of pglml using equation 2.
Equation 2: Mean plasma cotinine concentration
Where @ is the nicotine to cotinine conversion efficiency (0.78), 6 is the non-smokers'
plasma cotinine clearance in mllmin (61) and ir is the length of a day in minutes (1440)
(Repace et al., 1998)
From the mean plasma cotinine concentrations it is then possible to calculate the
steady-state saliva cotinine concentration (S), in units of pglml using equation 3
Equation 3: Steady-state saliva cotinine concentration
S = y P
Where y is the salivary-to-plasma cotinine ratio (1.16) (Repace et al., 1998)
The results of the calculations of salivary cotinine levels are listed in table 1.
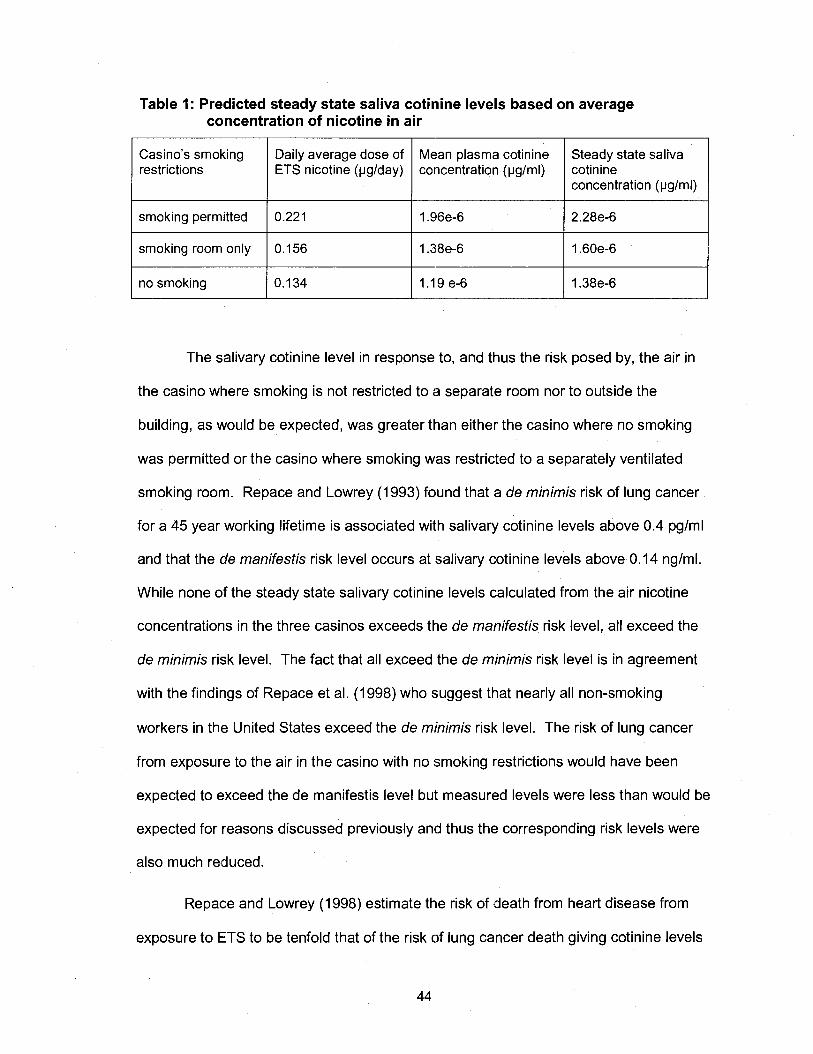
Table 1: Predicted steady state saliva cotinine levels based on average concentration of nicotine in air
restrictions concentration (vglml)
1 smoking room only 1 1:; 1; 1 I .38e-6 1 ; :~~f3~; no smoking 1 .I 9 e-6
The salivary cotinine level in response to, and thus the risk posed by, the air in
the casino where smoking is not restricted to a separate room nor to outside the
building, as would be expected, was greater than either the casino where no smoking
was permitted or the casino where smoking was restricted to a separately ventilated
smoking room. Repace and Lowrey (1 993) found that a de minimis risk of lung cancer
for a 45 year working lifetime is associated with salivary cotinine levels above 0.4 pglml
and that the de manifestis risk level occurs at salivary cotinine levels above 0.14 nglml.
While none of the steady state salivary cotinine levels calculated from the air nicotine
concentrations in the three casinos exceeds the de manifestis risk level, all exceed the
de minimis risk level. The fact that all exceed the de minimis risk level is in agreement
with the findings of Repace et al. (1998) who suggest that nearly all non-smoking
workers in the United States exceed the de minimis risk level. The risk of lung cancer
from exposure to the air in the casino with no smoking restrictions would have been
expected to exceed the de manifestis level but measured levels were less than would be
expected for reasons discussed previously and thus the corresponding risk levels were
also much reduced.
Repace and Lowrey (1998) estimate the risk of death from heart disease from
exposure to ETS to be tenfold that of the risk of lung cancer death giving cotinine levels
1 tenth those for lung cancer death. From this they also suggest salivary cotinine levels
above 0.04 nglml exceed the significant risk level, 1/1000, used by the US OSHA as a
legally defensible significant risk or regulatory action level. Again all of the salivary
cotinine levels calculated from the air nicotine concentrations in the three casinos
exceed the de minimis risk level for heart disease death, but do not exceed the de
manifestis risk level for heart disease death or the OSHA significant risk level. This is
contrary to the findings of Repace and Lowrey (1998) who claim that more than 95% of
non-smoking workers exceed not only the de manifestis risk level for death from heart
disease, but also the OSHA significant risk level.
While calculating the salivary cotinine levels from the average ETS nicotine in air
concentrations can be used to confirm through simple comparison whether the levels are
above or below the de minimis or de manifestis risk levels for reported salivary cotinine
levels, it is possible to calculate the actual risk level for each of the ETS nicotine levels
from the casinos.
Risk of lung cancer was calculated by first using equation 4 (USEPA, 1989) to
calculate the intake rate.
Equation 4: Intake rate
I = C x C R x E F x E D BW x AT
Where: I = Intake (mglkgeday), C = Chemical Concentration (e.g. mg/m3 from the study),
CR = Contact Rate (1 5.2 m3/day), EF = Exposure Frequency (250 days/ year ), ED =
Exposure Duration (45 years), BW = Body Weight (70 kg) and AT = Averaging Time
(25,500 days) (USEPA, 1989)
The intake rate was then used to calculate risk of lung cancer using equation 5 (USEPA,
1989)
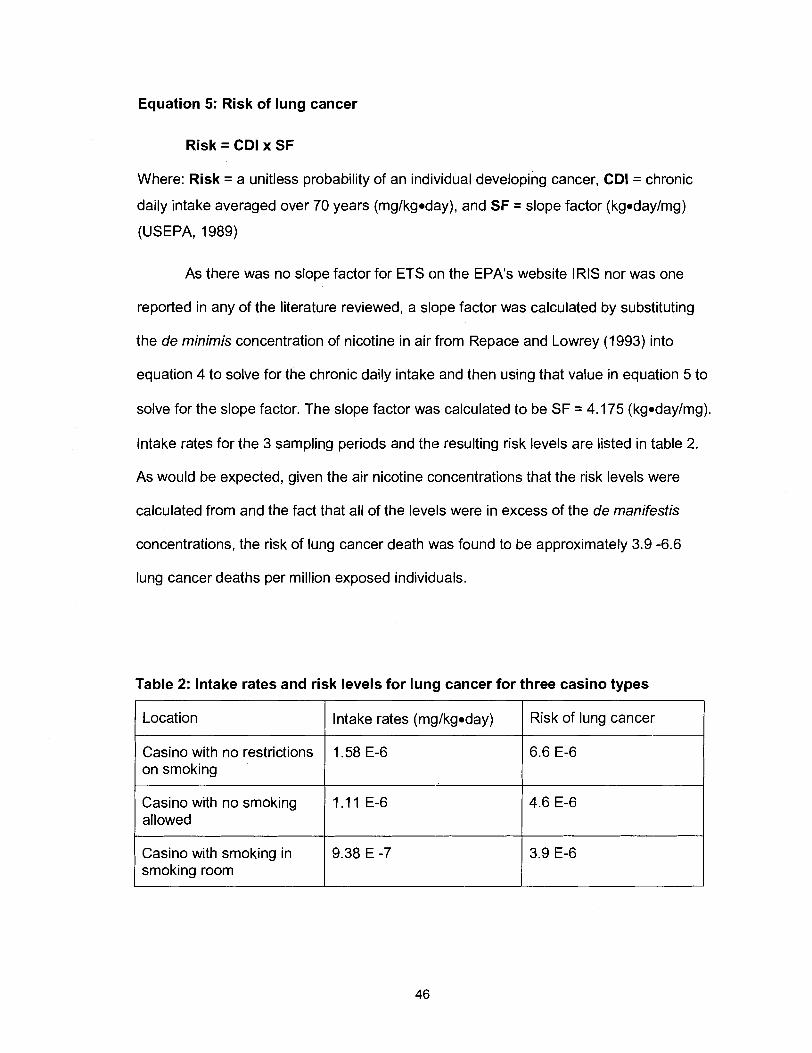
Equation 5: Risk of lung cancer
Risk = CDI x SF
Where: Risk = a unitless probability of an individual developing cancer, CDI = chronic
daily intake averaged over 70 years (mglkgoday), and SF = slope factor (kgodaylmg)
(USEPA, 1989)
As there was no slope factor for ETS on the EPA1s website IRIS nor was one
reported in any of the literature reviewed, a slope factor was calculated by substituting
the de minimis concentration of nicotine in air from Repace and Lowrey (1 993) into
equation 4 to solve for the chronic daily intake and then using that value in equation 5 to
solve for the slope factor. The slope factor was calculated to be SF = 4.175 (kgodaylmg).
lntake rates for the 3 sampling periods and the resulting risk levels are listed in table 2.
As would be expected, given the air nicotine concentrations that the risk levels were
calculated from and the fact that all of the levels were in excess of the de manifestis
concentrations, the risk of lung cancer death was found to be approximately 3.9 -6.6
lung cancer deaths per million exposed individuals.
Table 2: lntake rates and risk levels for lung cancer for three casino types
Location I Intake rates (mylkgoday) I Risk of lung cancer
Casino with no restrictions on smoking
1.58 E-6
Casino with no smoking allowed
1 . I 1 E-6
Casino with smoking in smoking room
9.38 E -7
Passive Air Monitoring with Simultaneous Human ETS Exposure Trial in a Casino Lacking Smoking Restrictions
In this phase of the study, conducted in a casino where smoking was not
restricted, the amount nicotine in air measured using passive monitors placed on the
ceiling for a one week period was compared with the amount of nicotine in air measured
using passive monitors attached in the breathing zone of two volunteers who spent 5
hours in the same casino during the hours of operation. Additionally, the urine and
saliva of the two volunteers was collected at specific time intervals to allow for the
measurement of nicotine and cotinine levels so that the extent to which the exposure to
ETS in air translated into an absorbed dose could be quantified with nicotine and its
main metabolite cotinine serving as markers for ETS. The results from the analysis of
the passive monitors used this phase of the study are illustrated in table 3. Figure 9
illustrates the comparison of the results of the concentration of the nicotine in air for in
the casino with no smoking restrictions from the first phase of the study with the results
from passive monitors placed in approximately the same location in the second phase of
the study.
The results indicate that the ETS nicotine in air level measured using the
monitors affixed to the casino ceiling did not differ significantly between the two trials.
The results also provided evidence consistent with the suspicion that the level of ETS
nicotine in air is apparently underestimated when measured using passive monitors
affixed to the ceiling. The level of ETS nicotine in air measured using the passive
monitors worn attached in the breathing zone of the volunteers was an order of
magnitude greater than that measured using monitors affixed to the ceiling although still
approximately two orders of magnitude less than what would be expected in an
environment where smoking was permitted without any effective restrictions based on
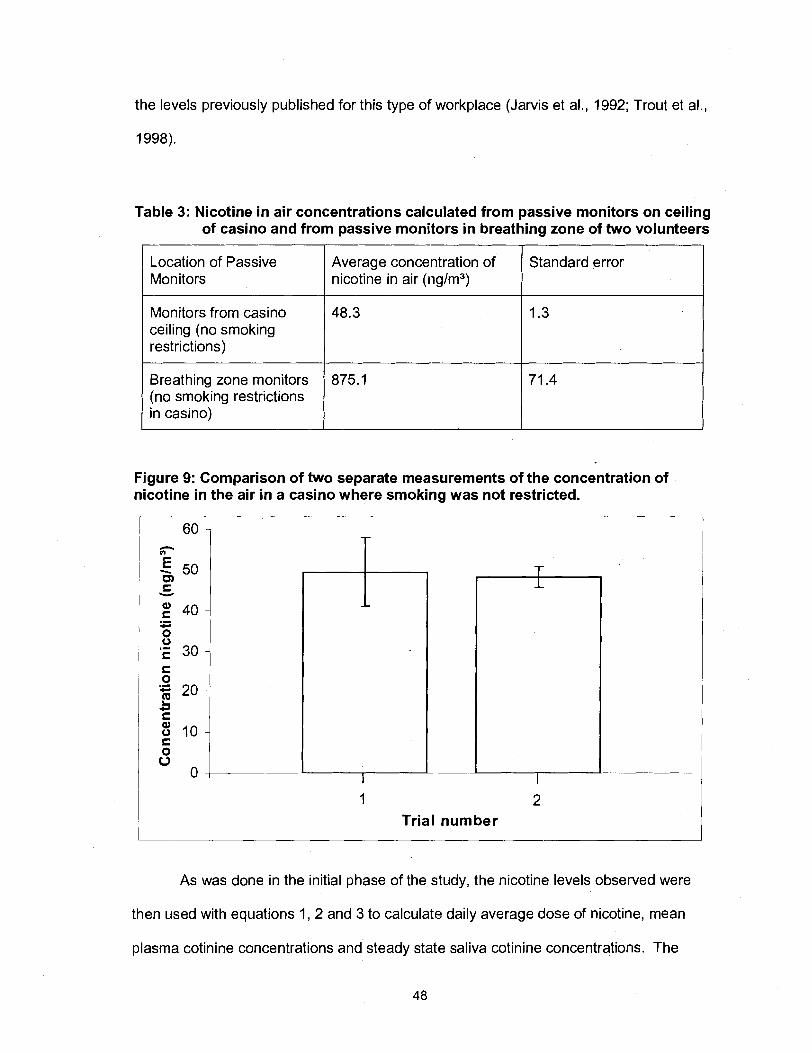
the levels previously published for this type of workplace (Jarvis et al., 1992; Trout et al.,
1998).
Table 3: Nicotine in air concentrations calculated from passive monitors on ceiling of casino and from passive monitors in breathing zone of two volunteers
Location of Passive Monitors
Average concentration of nicotine in air (nglm3)
Standard error
Monitors from casino ceiling (no smoking restrictions)
Breathing zone monitors (no smoking restrictions in casino)
Figure 9: Comparison of two separate measurements of the concentration of nicotine in the air in a casino where smoking was not restricted.
48.3
875.1
Trial number
As was done in the initial phase of the study, the nicotine levels observed were
then used with equations 1, 2 and 3 to calculate daily average dose of nicotine, mean
plasma cotinine concentrations and steady state saliva cotinine concentrations. The
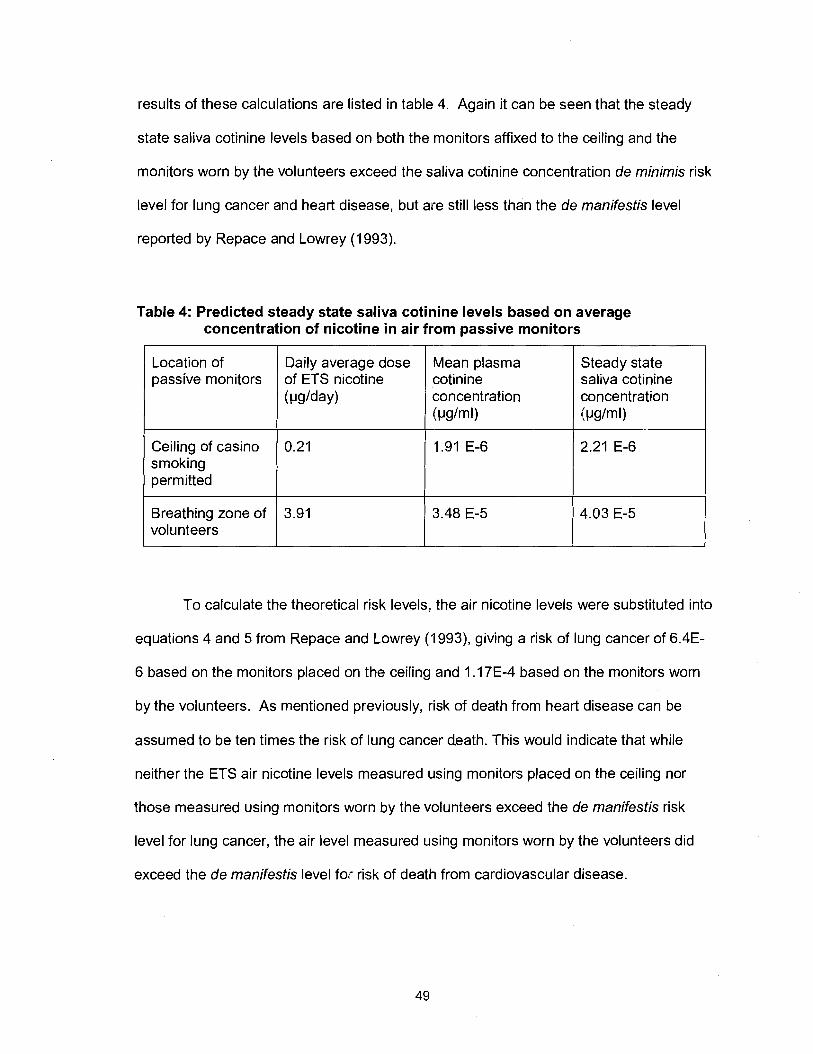
results of these calculations are listed in table 4. Again it can be seen that the steady
state saliva cotinine levels based on both the monitors affixed to the ceiling and the
monitors worn by the volunteers exceed the saliva cotinine concentration de minimis risk
level for lung cancer and heart disease, but are still less than the de manifestis level
reported by Repace and Lowrey (1 993).
Table 4: Predicted steady state saliva cotinine levels based on average concentration of nicotine in air from passive monitors
-
Steady state saliva cotinine concentration Ivg/ml)
Location of passive monitors
To calculate the theoretical risk levels, the air nicotine levels were substituted into
equations 4 and 5 from Repace and Lowrey (1993), giving a risk of lung cancer of 6.4E-
6 based on the monitors placed on the ceiling and 1 .I 7E-4 based on the monitors worn
by the volunteers. As mentioned previously, risk of death from heart disease can be
assumed to be ten times the risk of lung cancer death. This would indicate that while
neither the ETS air nicotine levels measured using monitors placed on the ceiling nor
those measured using monitors worn by the volunteers exceed the de manifestis risk
level for lung cancer, the air level measured using monitors worn by the volunteers did
exceed the de manifestis level for risk of death from cardiovascular disease.
Daily average dose of ETS nicotine ( ~ l g / d a ~ )
Ceiling of casino smoking permitted
Breathing zone of volunteers
Mean plasma cotinine concentration I W m U
0.21
3.91
'1.91 E-6
3.48 E-5
2.21 E-6
4.03 E-5
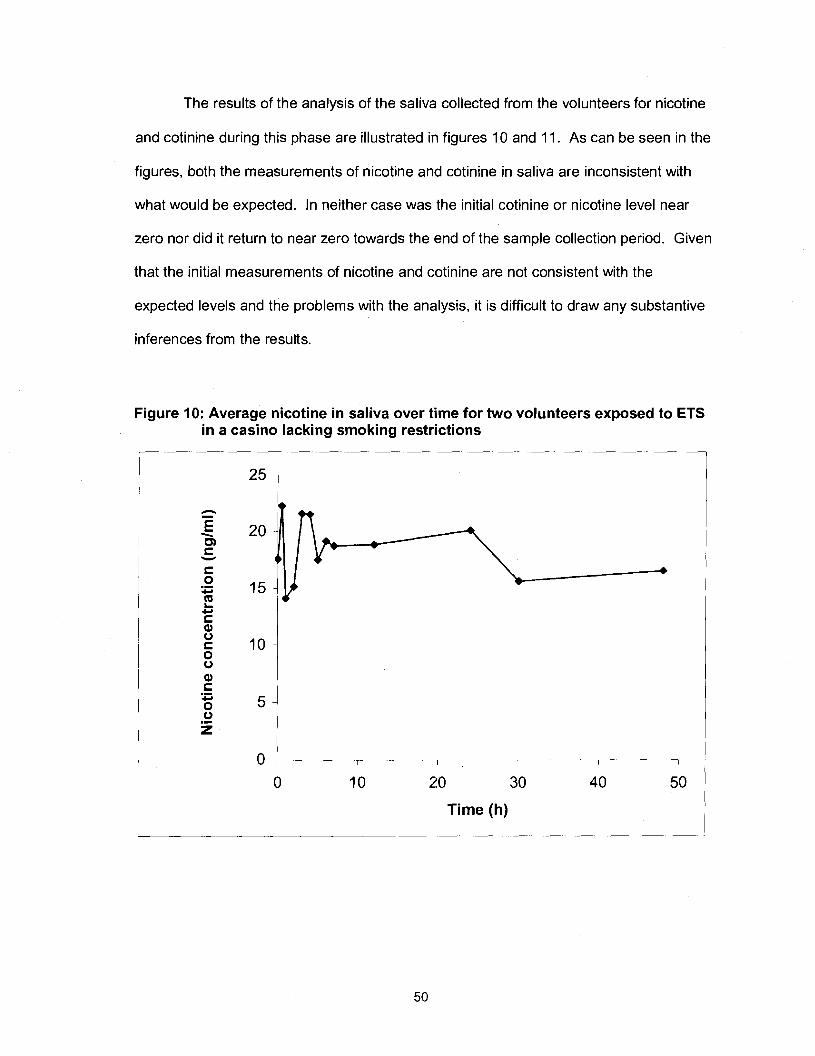
The results of the analysis of the saliva collected from the volunteers for nicotine
and cotinine during this phase are illustrated in figures 10 and 11. As can be seen in the
figures, both the measurements of nicotine and cotinine in saliva are inconsistent with
what would be expected. In neither case was the initial cotinine or nicotine level near
zero nor did it return to near zero towards the end of the sample collection period. Given
that the initial measurements of nicotine and cotinine are not consistent with the
expected levels and the problems with the analysis, it is difficult to draw any substantive
inferences from the results.
Figure 10: Average nicotine in saliva over time for two volunteers exposed to ETS in a casino lacking smoking restrictions
Time (h)
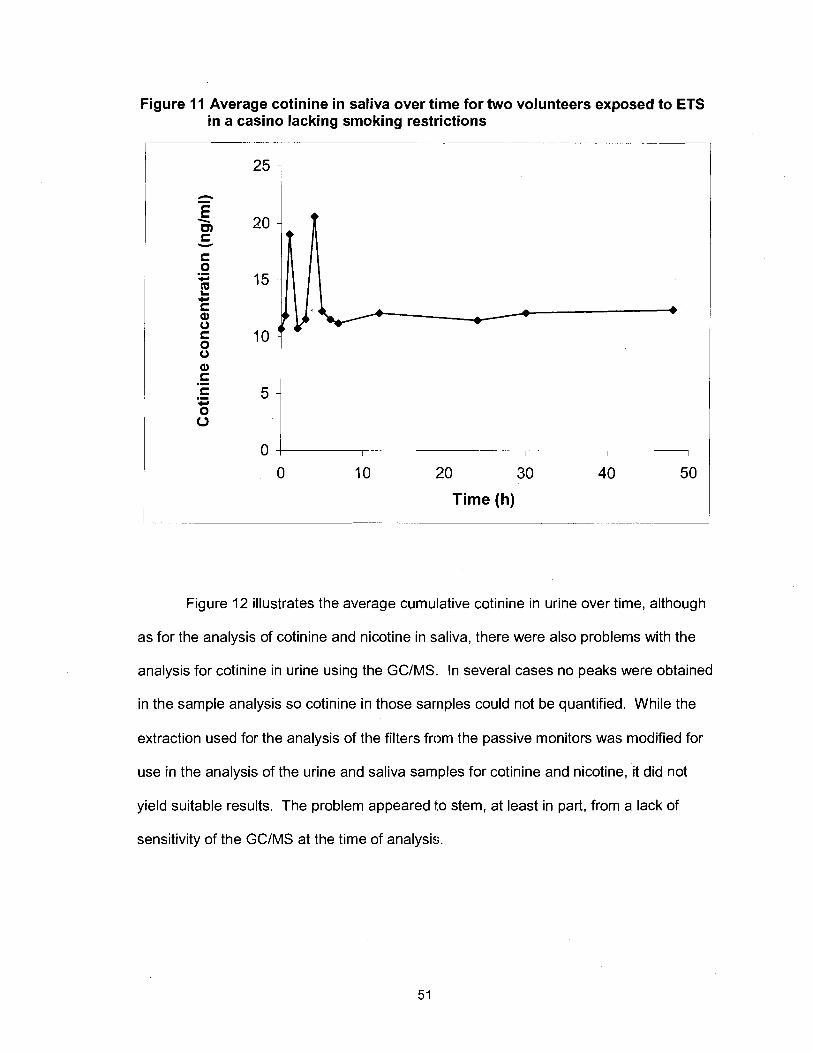
Figure 11 Average cotinine in saliva over time for two volunteers exposed to ETS in a casino lacking smoking restrictions
0 I I I
0 10 20 30 40 50
Time (h)
Figure 12 illustrates the average cumulative cotinine in urine over time, although
as for the analysis of cotinine and nicotine in saliva, there were also problems with the
analysis for cotinine in urine using the GCIMS. In several cases no peaks were obtained
in the sample analysis so cotinine in those sarnples could not be quantified. While the
extraction used for the analysis of the filters from the passive monitors was modified for
use in the analysis of the urine and saliva samples for cotinine and nicotine, it did not
yield suitable results. The problem appeared to stem, at least in part, from a lack of
sensitivity of the GCIMS at the time of analysis.
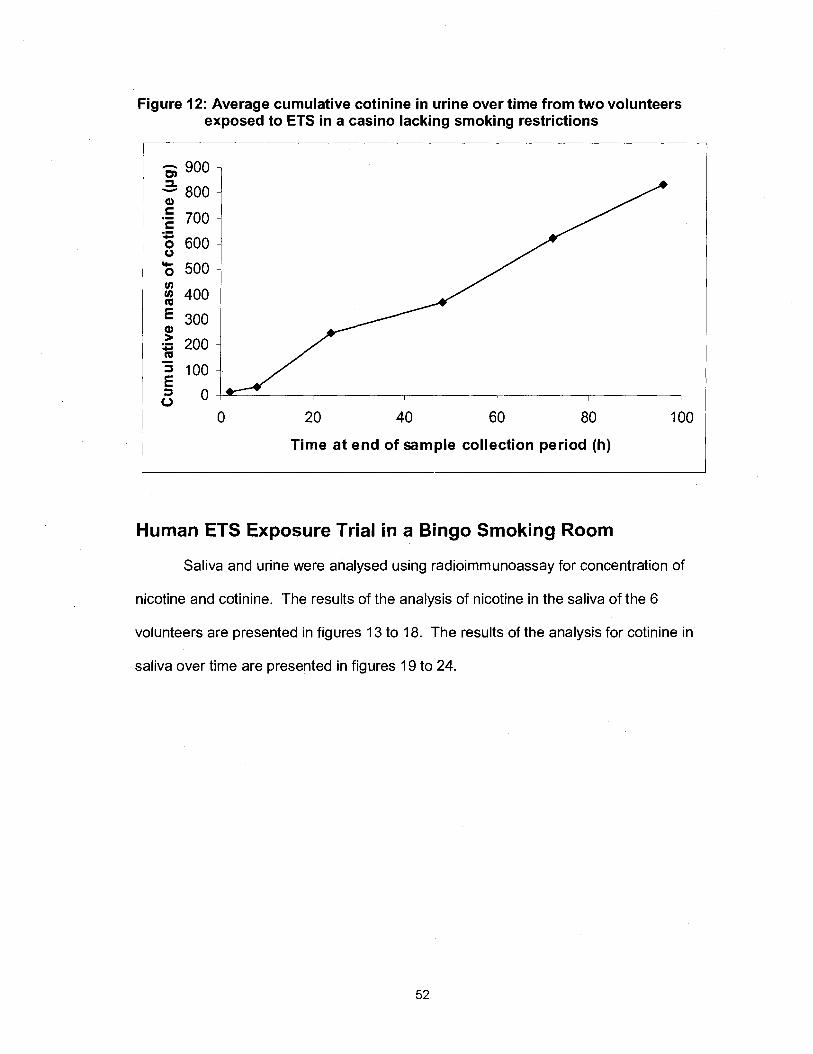
Figure 12: Average cumulative cotinine in urine over time from two volunteers exposed to ETS in a casino lacking smoking restrictions
0 20 40 60 80 100
Time at end of sample collection period (h)
Human ETS Exposure Trial in a Bingo Smoking Room
Saliva and urine were analysed using radioimmunoassay for concentration of
nicotine and cotinine. The results of the analysis of nicotine in the saliva of the 6
volunteers are presented in figures 13 to 18. The results of the analysis for cotinine in
saliva over time are presented in figures 19 to 24.
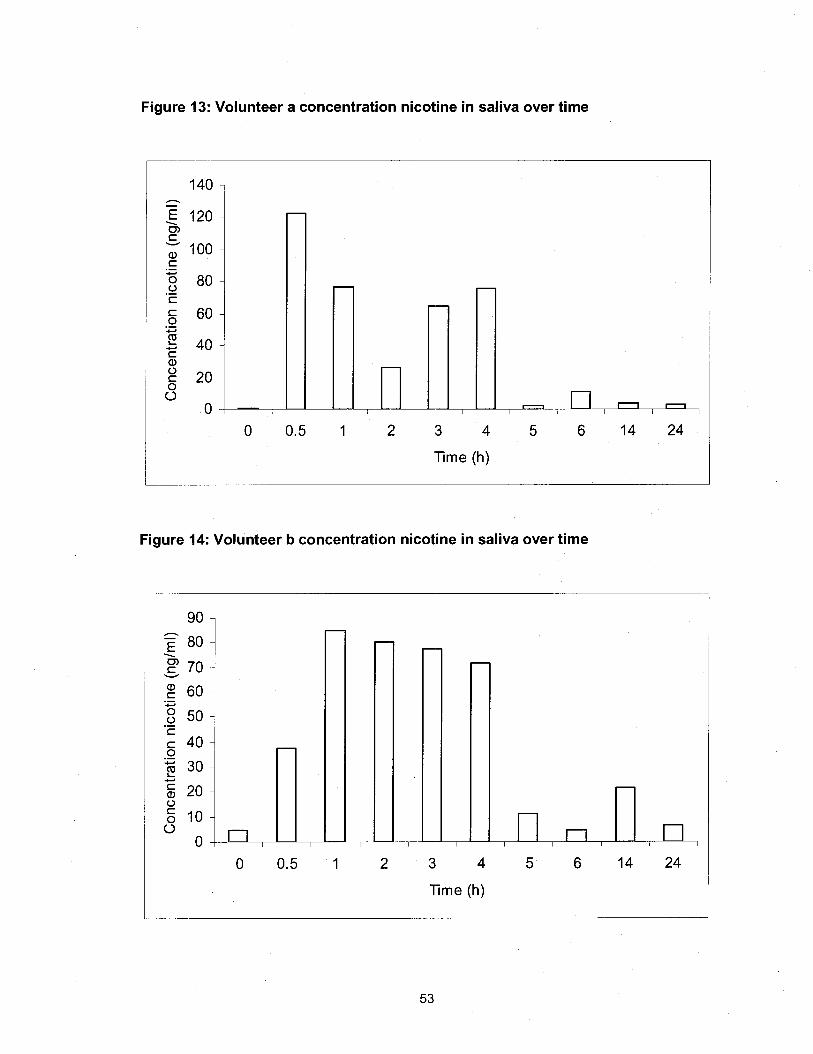
Figure 13: Volunteer a concentration nicotine in saliva over time
'Time (h)
Figure 14: Volunteer b concentration nicotine in saliva over time
77me (h)
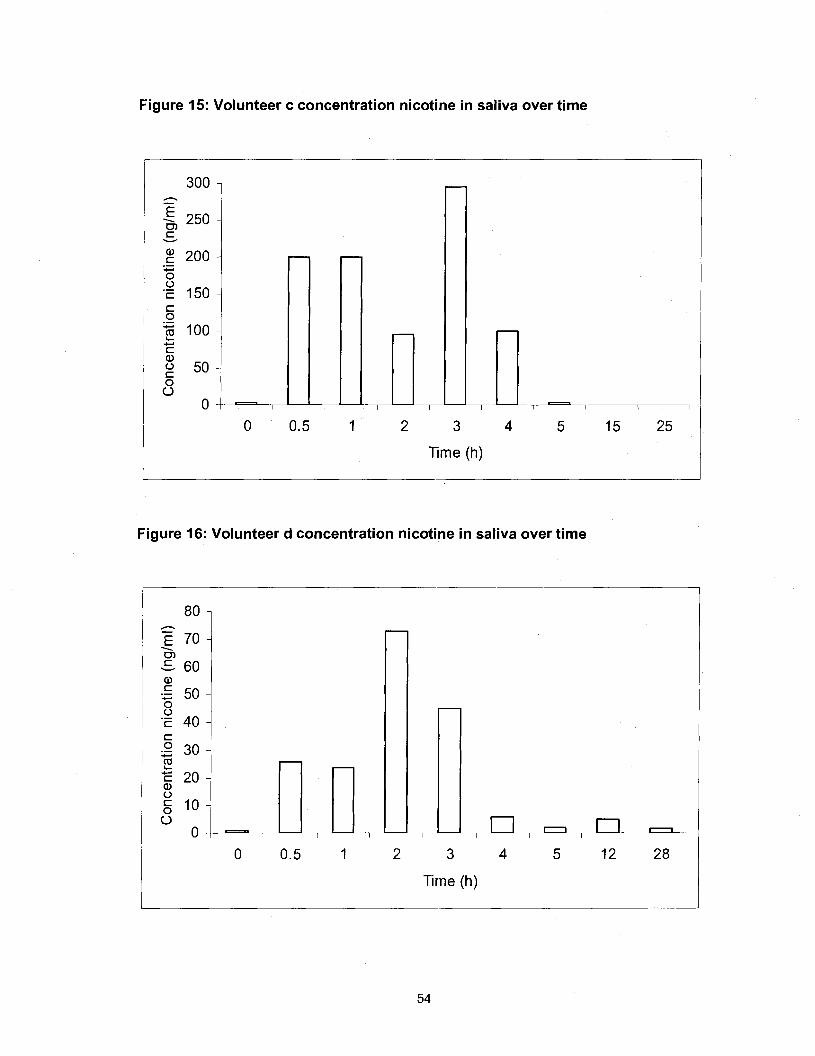
Figure 15: Volunteer c concentration nicotine in saliva over time
2 3
Time (h)
Figure 16: Volunteer d concentration nicotine in saliva over time
Time (h)
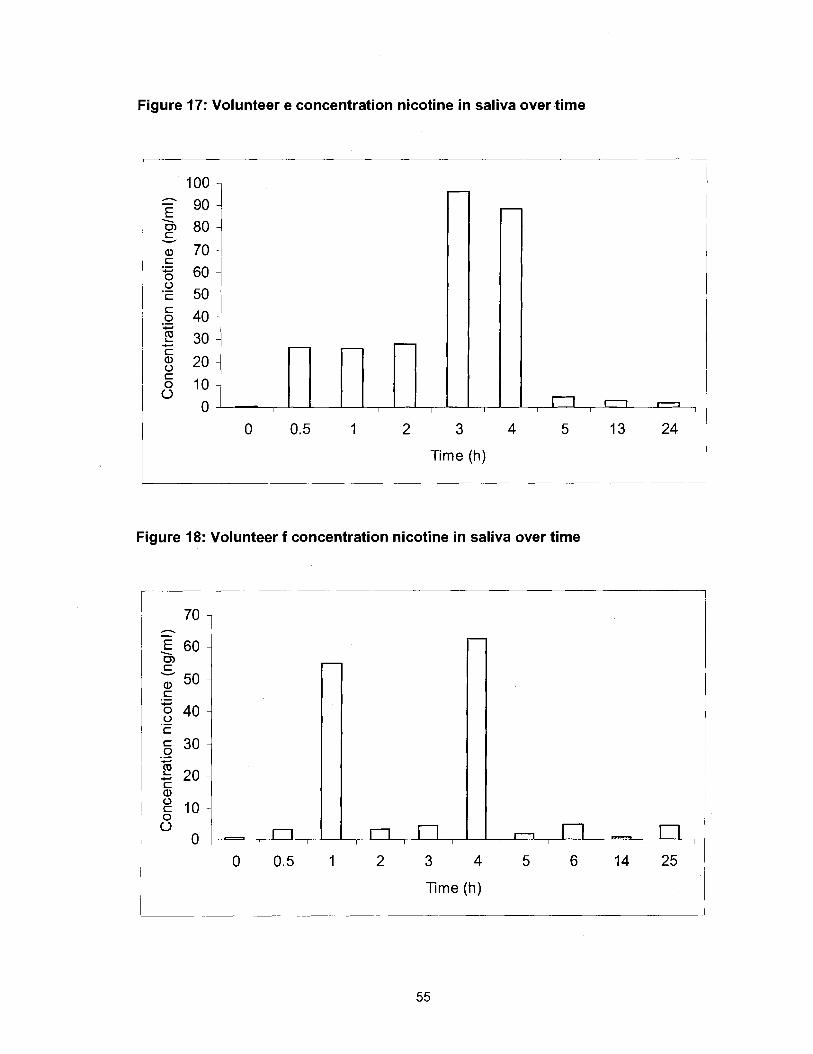
Figure 17: Volunteer e concentration nicotine in saliva over time
3
Time (h)
Figure 18: Volunteer f concentration nicotine in saliva over time
r ime (h)
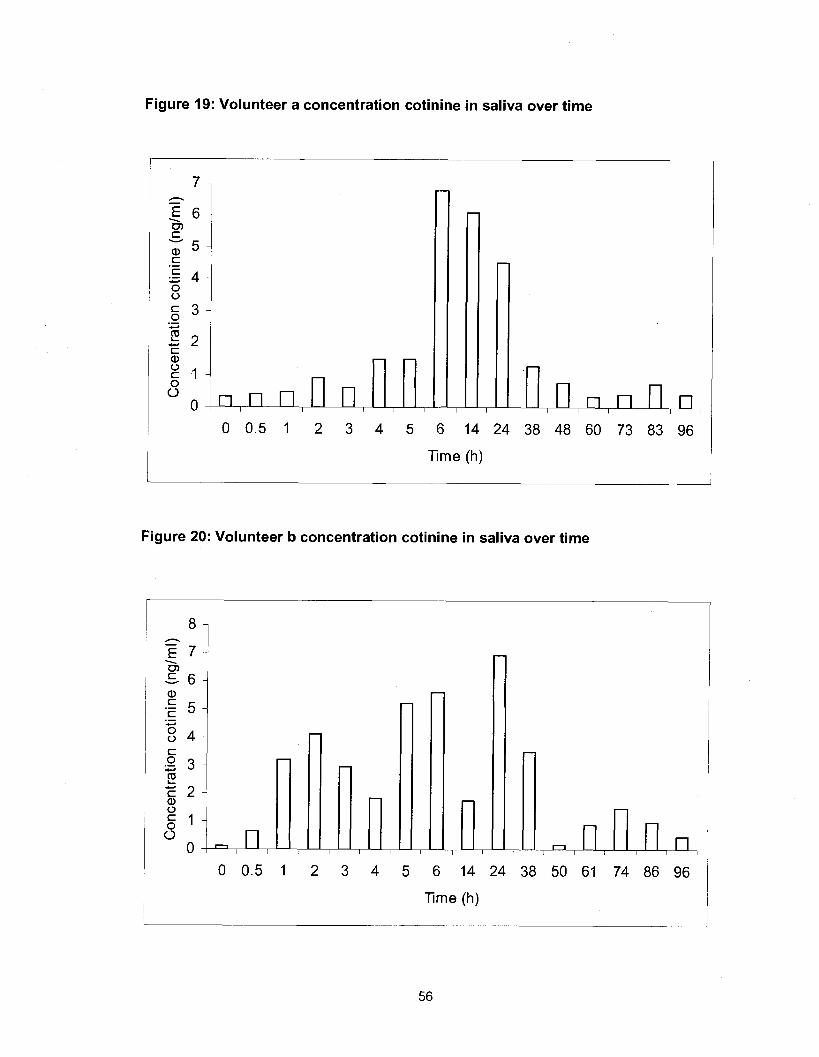
Figure 19: Volunteer a concentration cotinine in saliva over time
0 0.5 1 2 3 4 5 6 14 24 38 48 60 73 83 96
Time (h)
Figure 20: Volunteer b concentration cotiniine in saliva over time
2 3 4 5 6 1 4 2 4
Time (h)
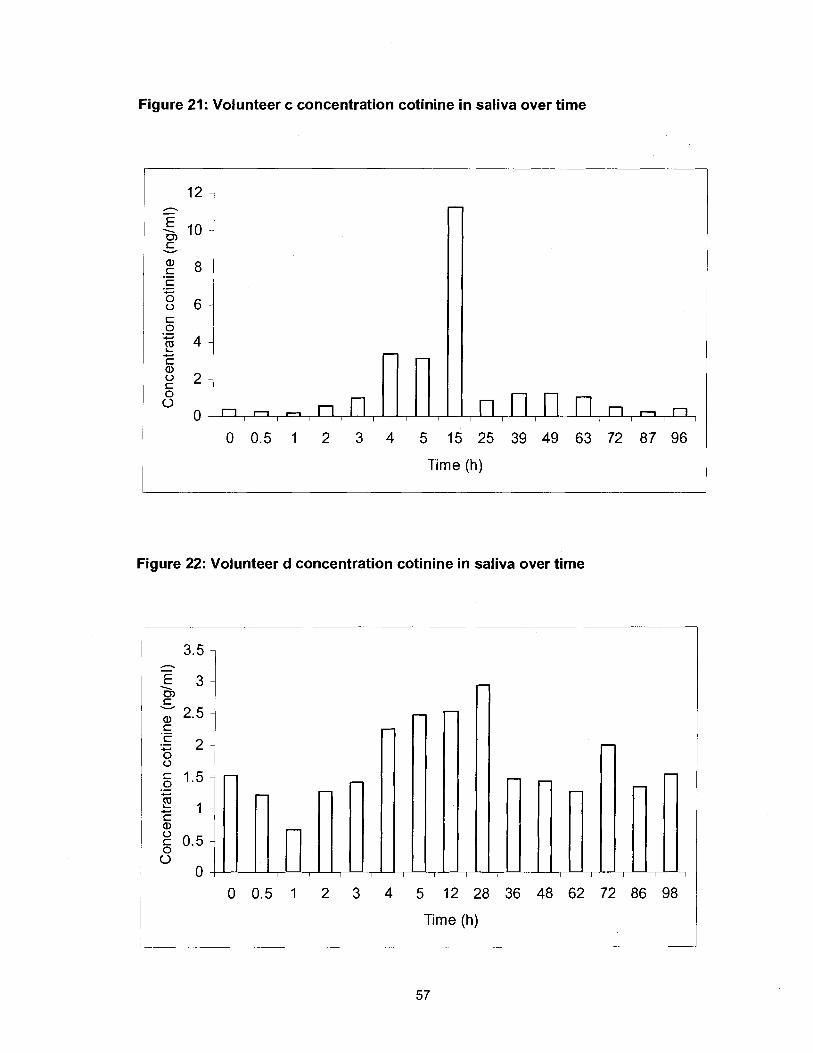
Figure 21: Volunteer c concentration cotinine in saliva over time
0 0.5 1 2 3 4 5 15 25 39 49 63 72 87 96
Time (h)
Figure 22: Volunteer d concentration cotinine in saliva over time
0 0.5 1 2 3 4 5 12 28 36 48 62 72 86 98
Time (h)
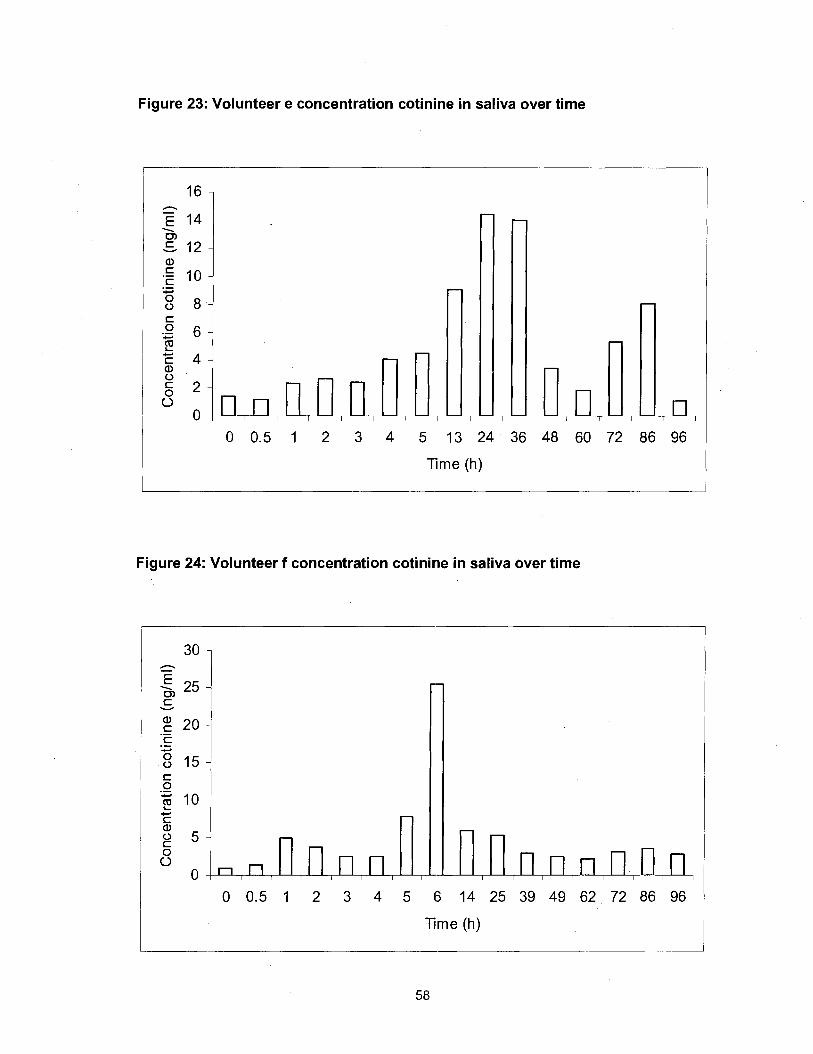
Figure 23: Volunteer e concentration cotinine in saliva over time
0 0.5 1 2 3 4 5 13 24 36 48 60 72 86 96
T'ime (h)
Figure 24: Volunteer f concentration cotinine in saliva over time
0 0.5 1 2 3 4 5 6 14 25 39 49 62 72 86 96
Time (h)
In all cases, the nicotine and cotinine levels start at or near zero. This confirms
both the non-smoking status of the volunteers as well as the lack of recent ETS
exposure prior to the commencement of the planned exposure period as a part of this
phase of the study. As can be seen in the figures, there is a large degree of individual
variability in the results for both nicotine and cotinine in saliva over time. This is
consistent with the findings of Jenkins and Counts (1999). While there is individual
variability, when the salivary concentration of cotinine and nicotine over time amongst
the volunteers is averaged, the plots are in keeping with the cotinine and nicotine levels
over time that would be expected based on what has been observed in previous studies
where nicotine was either injected or ingested (Curvall et al., 1990; De Schepper, Van
Hecken, Daenens, and Van Rossum, 1987; Robinson, Baker, and Schwartz, 1992;
Benowitz, Kuyt, Jacob, Jones, and Osman, 1983; Benowitz and Jacob, 1993). As seen
in figure 25, the average concentration of nicotine in saliva for the 6 volunteers has an
initial rapid increase corresponding with the start of exposure to second hand smoke and
a subsequent decline in nicotine level over a relatively short period of time. This is
consistent with what would be expected given the short half-life of nicotine in the body of
approximately two hours (Benowitz and Jacob, 1993). The average concentration of
nicotine over time appears to have two peaks with a slight decline in between. This may
be explained by the brief intermission that occurred in the bingo play while the
volunteers were in the smoking room. During this intermission, many of the smokers in
the smoking room left to visit the washroom or concession. During a previous visit to the
bingo hall, it was noted that some smokers also went outside during the intermission to
get some fresh air.
With respect to cotinine concentrations, figure 26 illustrates the change in
average cotinine concentration in saliva of the six volunteers over time subsequent to
initiation of exposure to second hand smoke. In this case there is a slightly delayed
increase in cotinine level after the initial exposure to second hand smoke and a much
slower decline in cotinine levels subsequent to termination of exposure. This is
consistent with the time for metabolism of nicotine to produce the cotinine resulting in a
delay in the onset of the increase of cotinine. The slower decline in cotinine level is
consistent with the longer half-life of cotinine of approximately 18 -20 hours (Benowitz
and Jacob, 1993; Benowitz et al., 1983). As was the case with the plot of average
nicotine concentration in saliva, there are two peaks in the average cotinine
concentration in saliva, with the timing of these peaks appearing to coincide with the
intermission in bingo play. The apparent presence of two peaks with only a slight
decline in cotinine levels is also consistent with the longer half-life of cotinine in that
there would be less time for cotinine levels to decline compared to what was observed
with the nicotine levels given the relatively short duration of the break.

Figure 25: Average concentration nicotine in saliva over time
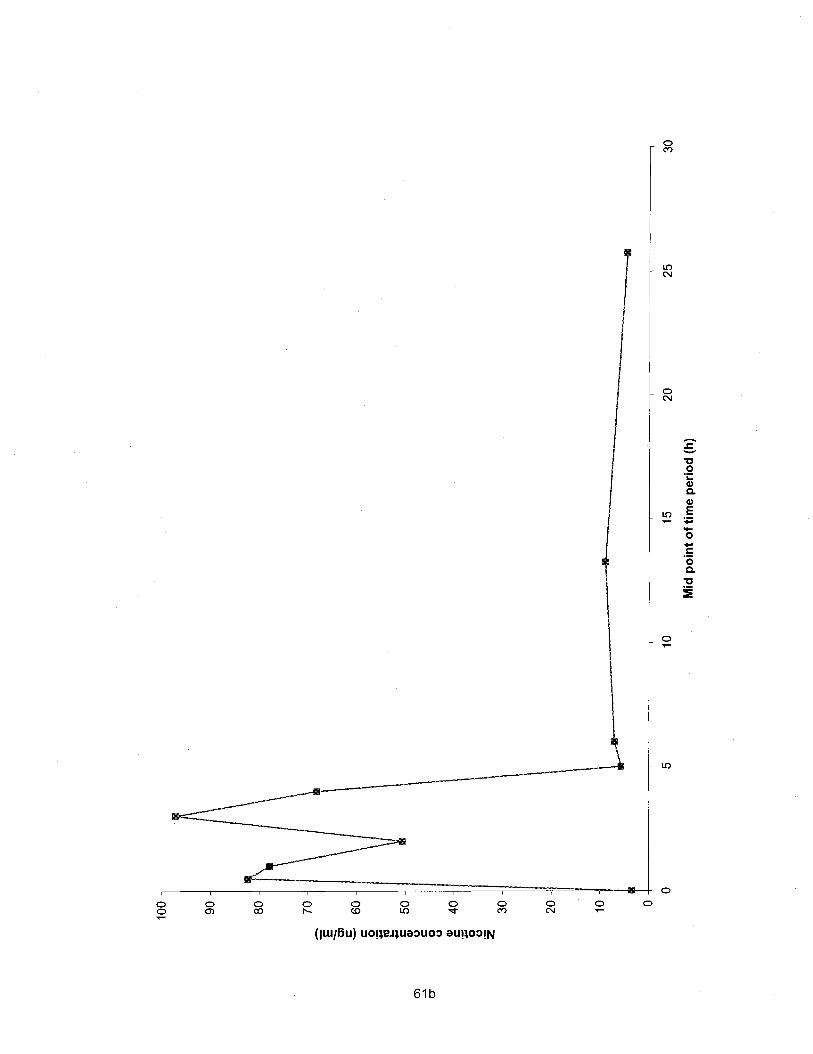

Figure 26: Average concentration cotinine in saliva over time
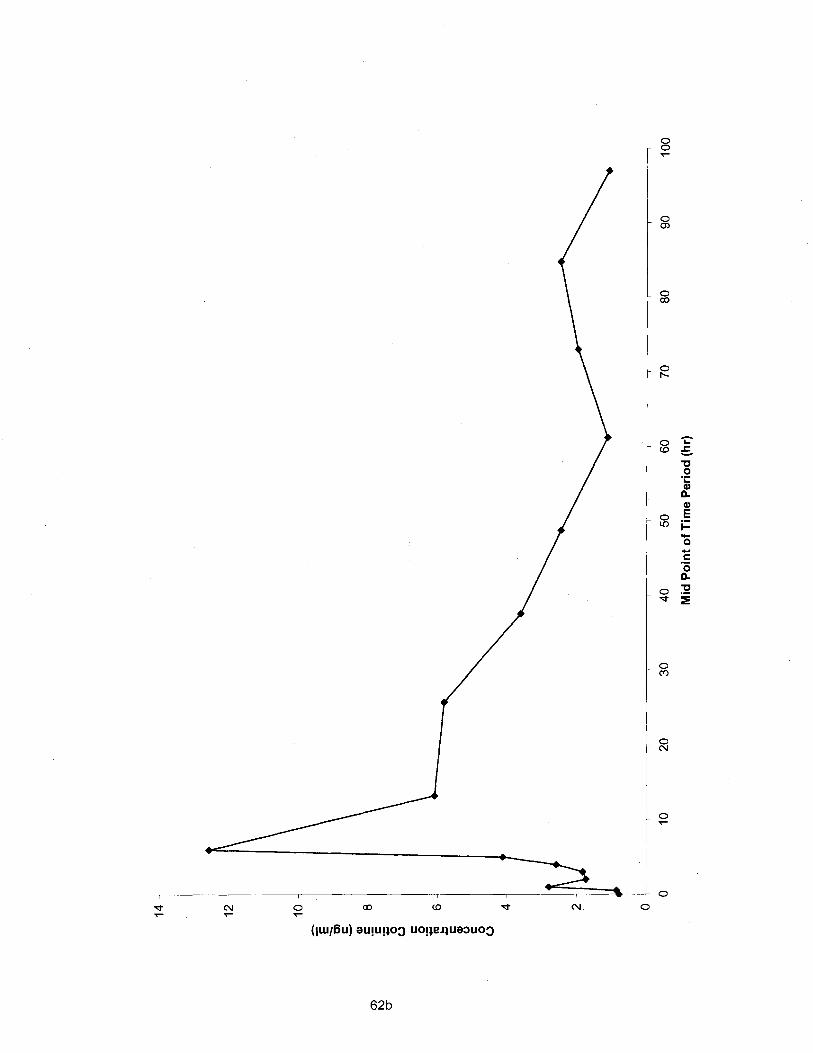
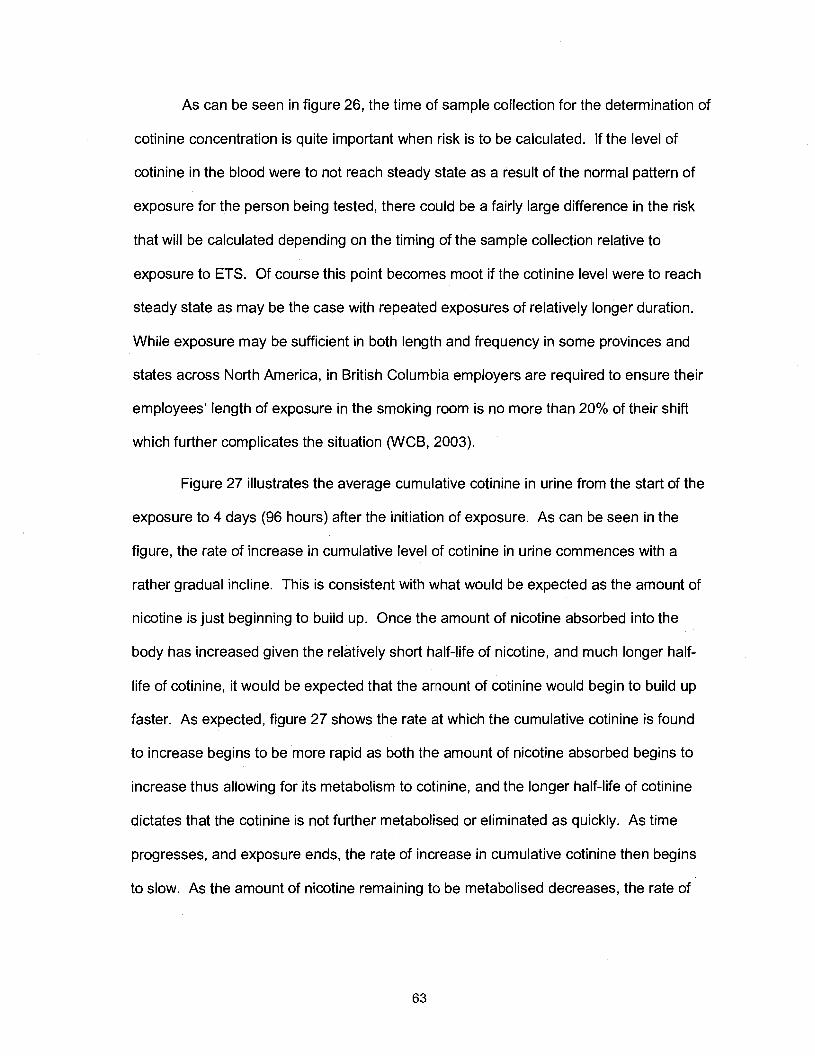
As can be seen in figure 26, the time of sample collection for the determination of
cotinine concentration is quite important when risk is to be calculated. If the level of
cotinine in the blood were to not reach steady state as a result of the normal pattern of
exposure for the person being tested, there could be a fairly large difference in the risk
that will be calculated depending on the timing of the sample collection relative to
exposure to ETS. Of course this point becomes moot if the cotinine level were to reach
steady state as may be the case with repeated exposures of relatively longer duration.
While exposure may be sufficient in both length and frequency in some provinces and
states across North America, in British Columbia employers are required to ensure their
employees' length of exposure in the smoking room is no more than 20% of their shift
which further complicates the situation (WCB, 2003).
Figure 27 illustrates the average cumulative cotinine in urine from the start of the
exposure to 4 days (96 hours) after the initiation of exposure. As can be seen in the
figure, the rate of increase in cumulative level of cotinine in urine commences with a
rather gradual incline. This is consistent with what would be expected as the amount of
nicotine is just beginning to build up. Once the amount of nicotine absorbed into the
body has increased given the relatively short half-life of nicotine, and much longer half-
life of cotinine, it would be expected that the amount of cotinine would begin to build up
faster. As expected, figure 27 shows the rate at which the cumulative cotinine is found
to increase begins to be more rapid as both the amount of nicotine absorbed begins to
increase thus allowing for its metabolism to cotinine, and the longer half-life of cotinine
dictates that the cotinine is not further metabolised or eliminated as quickly. As time
progresses, and exposure ends, the rate of increase in cumulative cotinine then begins
to slow. As the amount of nicotine remaining to be metabolised decreases, the rate of

Figure 27 Average cumulative cotinine in urine over time
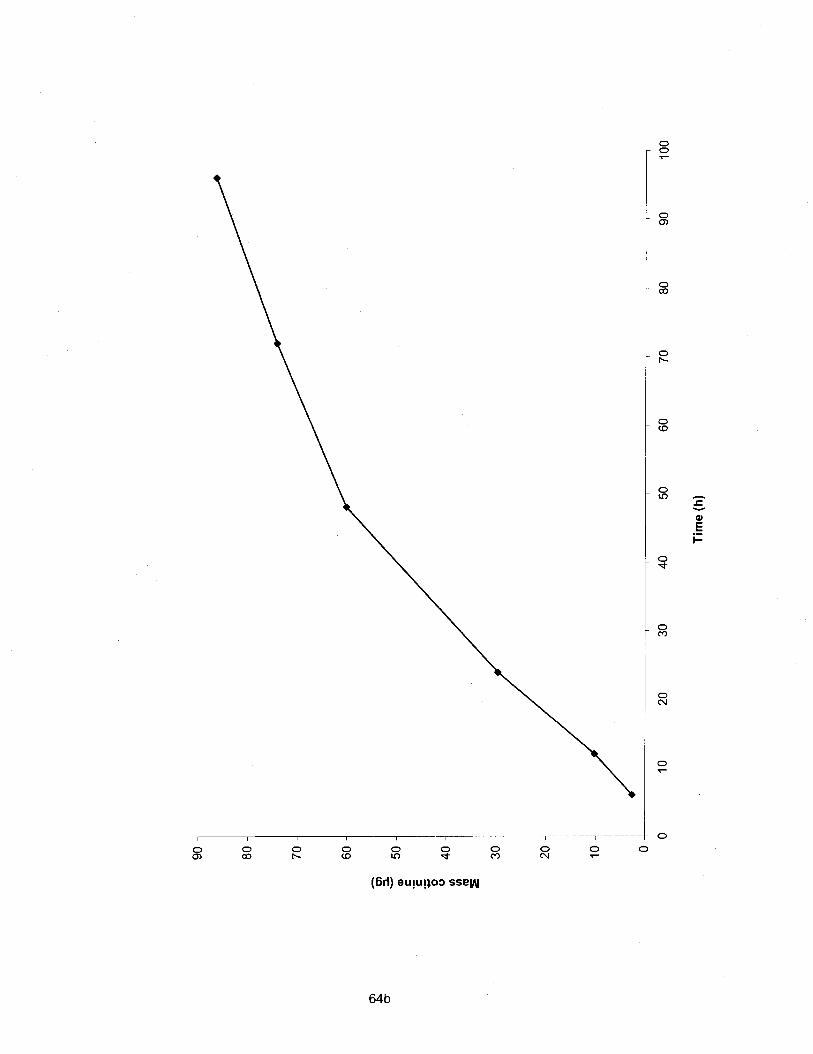
increase in cumulative cotinine is not as great. The rate of increase is still increasing as
the longer half-life of cotinine as compared to nicotine, dictates a net build up of cotinine.
In the last phase of the study, there was also an attempt to measure the
concentration of nicotine in air so that exposure as measured by the air concentration of
nicotine could be compared with the nicotine in blood as measured using the nicotine in
saliva concentrations. The nicotine in air was collected using the passive monitors as
had been used in the two previous phases of the study. Results of the analysis of the
filters from the passive monitors worn by the volunteers in the bingo smoking room are
not reported. All attempts to analyse the filters were unsuccessful and the author was
unable to get any of the methods attempted to produce a suitable standard curve which
would allow the work to proceed to the analysis of the filters. Initial attempts were
conducted using the radioimmunoassay for the analysis of nicotine on the filters. This
method had not been reported previously as having been used for this type of analysis.
Contact with the author further confirmed that to her knowledge filters from air monitoring
had not been analysed using radioimmunoassay. While she did suggest that the
method used by Klein and Koren (1999) to analyse hair for nicotine might be able to be
modified for use with filters from air sampling, she did however also indicate that there
could be problems with interference with the buffer or other parts of the immunoassay
that would prevent the analysis from being completed successfully. The analysis was
attempted using the radioimmunoassay method that had been used for this phase to
quantify the nicotine in saliva. The aqueous solution from the first part of the extraction
of the filters was analysed for nicotine using the same protocol for radioimmunoassay
that was used to analyse saliva for nicotine. 'The initial attempts proved fruitless.
Attempts to modify this protocol similar to what had been done to analyse for nicotine in
hair and as well as to try to prevent potential interference with the buffer by the sodium
bisulfate on the treated filter papers also proved fruitless as did another trial using the full
extraction of the nicotine into the organic solvent and then extracting back into aqueous
solution prior to analysis. In all cases, there was an inability to produce a consistent
recovery of nicotine.
Trials to analyse the filters from the passive monitors using the original method
for filter analysis from the first two phases of the study also proved unsuccessful in
obtaining a consistent recovery of nicotine from the filter papers. In this case the
difficulty may have been from the use of nicotine-d3 salicylate salt instead of the pure
methyl-ds nicotine as was used in phase one and two may have been the route of the
problem. Another potential cause of a lack of acceptable results in the analysis of the
filters in this phase of the project could have been insufficient trials with minor changes
to the method to get adequate results.
While the monitors weren't analysed and thus did not allow for a direct analysis of
the amount nicotine in the air in the Bingo smoking room and thus of the volunteers
exposure to nicotine compared with the amount of nicotine that was absorbed by the
volunteers based on the nicotine and cotinine levels in their saliva, it is still possible to
compare the average cotinine level found in this portion of the study with the levels set
as the de minimis and de manifestis risk levels for lung cancer and heart disease. It is
also possible to calculate the amount of nicotine in the air based on the saliva levels of
either cotinine or nicotine. From this information, it is also possible to calculate the risk
of lung cancer and heart disease that that would correlate with that level of exposure on
an ongoing basis.
De minimis and de manifestis risk levels for lung cancer based on Repace et al.
(1998) are 0.4 pglml and 0.14 nglml respectively and heart disease mortality risk levels
are about one tenth as much 0.04 pglml and 0.014 nglml. The peak average level of
cotinine (at 6 hours) measured in this portion of the study was 12.6 nglml. This clearly
exceeds the de manifestis risk level for lung cancer and heart disease. In addition, this
level exceeds the 0.4 and 0.04 nglml levels for lung cancer and heart disease
respectively that would correspond with the significant risk or regulatory action level of 1
death in 1000 workers that is frequently used by OSHA. This does however assume
that the peak average level used for this comparison, is representative of the cotinine
level that would end up as the steady state level given regular daily exposure for the full
work shift. Using equations 1 through 3 from the initial phase of the study, and again
assuming the peak average cotinine level corresponds with the steady state cotinine
level, the level of nicotine in air can be calculated to be 273.42 pg/m3. Consequently,
substituting the level of nicotine in air into equations 4 and 5 to calculate intake rate and
risk of lung cancer, a relative risk value of 0.109 is obtained. The concentration of
nicotine in air and consequently the calculated risk of lung cancer are 3 orders of
magnitude greater than the concentration of nicotine in air that was observed in the
casino during the human exposure trial, as well as the subsequent level of risk
calculated for that level of nicotine. Since all persons in the smoking room of the bingo
(other than the volunteers for this study) were smoking it is likely that the concentration
of nicotine in air that the volunteers were exposed to in the bingo was greater than that
which was present in the casino. It is however unlikely that it was actually 1000 times
greater. Part of this discrepancy may be explained by the fact that the level of nicotine
found in the air in the casino, as mentioned previously, is believed to be on the low side.
That the level of nicotine in the air measured in the casino was on the low side is
confirmed, at least in part, by the fact that the average cotinine in saliva level that was
used to calculate the theoretical nicotine in air concentration in the bingo smoking room
is within the range seen previously for non-smokers exposed to high levels of ETS, and
the concentration of nicotine in air calculated from the salivary cotinine level is consistent
with the levels seen previously (Jarvis et al., 1992; Repace and Lowery, 1993;
Maskarinec, Jenkins, Counts, and Dindal, 2000). The average salivary cotinine level
was also less than the level that has been used previously to discriminate between
nonsmokers and occasional smokers, 15 nglml (Etzel, 1990).
This leaves the calculation of risk as the source of a potential problem. Given the
concentration of nicotine in air that was calculated, a risk of 1 lung cancer death per 10
persons exposed to ETS at the level calculated for the Bingo smoking room seems high.
Repace and Lowrey (1 993) had previously estimated that for the "most exposed" non-
smokers (having a cotinine in plasma concentration of 10 nglml) risk was in the order of
2 lung cancer deaths per 100 persons exposed at that level. This points to the
possibility that the rate of increase in risk of lung cancer and heart disease decreases
with increasing ETS exposure. This would be consistent with the contention of Kiyohara
et al. (2003) who suggest that as the amount of exposure to the chemicals in tobacco
smoke increases, and one goes beyond low-dose exposure, the effect of phenotype or
genotype becomes less evident. This may thus be a similar non-linear dose-response
relationship to that contented by Law et al. (1997) with respect to the risk of ischaemic
heart disease caused by exposure to second hand smoke being almost half that of
smoking 20 cigarettes per day while the level of exposure is only about 1% of smoking.
At lower doses those that are genetically most susceptible illustrate the negative effect
under consideration, as the dose increases, those that are more susceptible are now
included as a part of the over all response and what was initially a dramatic rate of
increase in the negative effect slows.
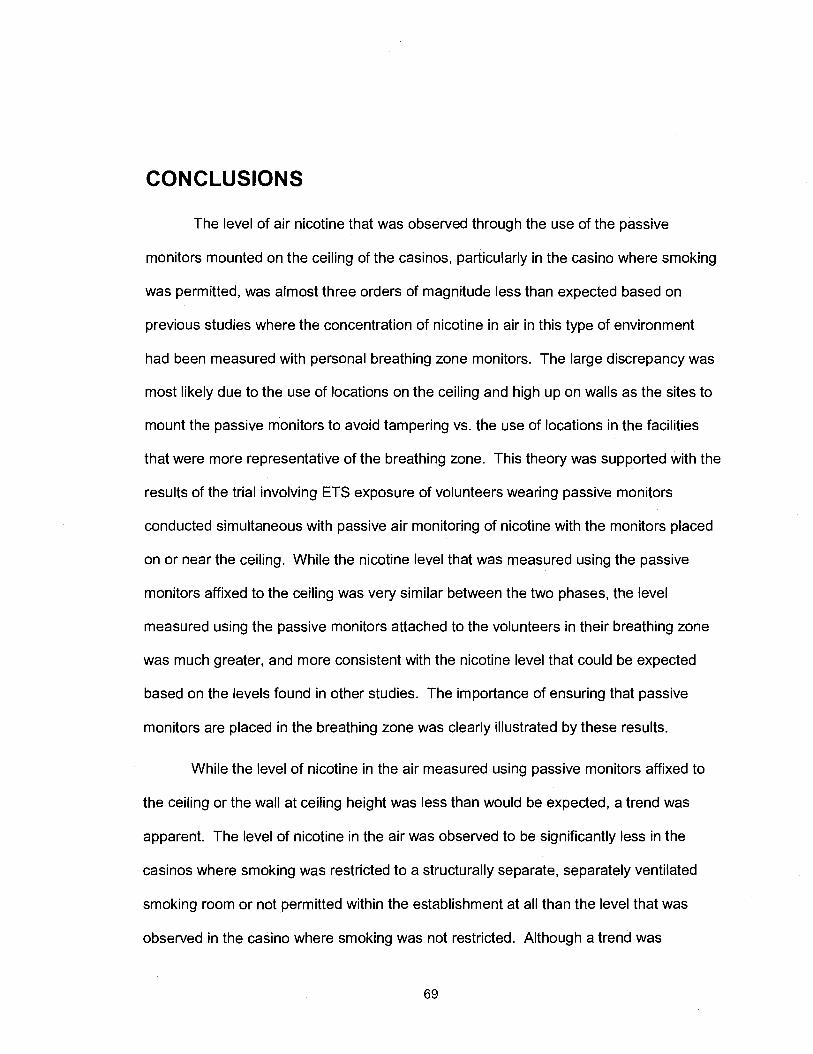
CONCLUSIONS
The level of air nicotine that was observed through the use of the passive
monitors mounted on the ceiling of the casinos, particularly in the casino where smoking
was permitted, was almost three orders of magnitude less than expected based on
previous studies where the concentration of nicotine in air in this type of environment
had been measured with personal breathing zone monitors. The large discrepancy was
most likely due to the use of locations on the ceiling and high up on walls as the sites to
mount the passive monitors to avoid tampering vs. the use of locations in the facilities
that were more representative of the breathing zone. This theory was supported with the
results of the trial involving ETS exposure of volunteers wearing passive monitors
conducted simultaneous with passive air monitoring of nicotine with the monitors placed
on or near the ceiling. While the nicotine level that was measured using the passive
monitors affixed to the ceiling was very similar between the two phases, the level
measured using the passive monitors attached to the volunteers in their breathing zone
was much greater, and more consistent with the nicotine level that could be expected
based on the levels found in other studies. The importance of ensuring that passive
monitors are placed in the breathing zone was clearly illustrated by these results.
While the level of nicotine in the air measured using passive monitors affixed to
the ceiling or the wall at ceiling height was less than would be expected, a trend was
apparent. The level of nicotine in the air was observed to be significantly less in the
casinos where smoking was restricted to a structurally separate, separately ventilated
smoking room or not permitted within the establishment at all than the level that was
observed in the casino where smoking was not restricted. Although a trend was
observed, firm conclusions can not be drawn from these results due to the
aforementioned issue with placement of the monitors on the ceiling and near the ceiling
on the walls of the facilities being studied- rather than within the breathing zone. Future
comparisons of different levels of restrictions on indoor smoking in order to determine
the benefits with respect to risk of negative outcomes, and based on measurement of
nicotine levels, should be done with all airborne nicotine measurements performed in the
breathing zone. An alternative to this would be to conduct further studies to see if a
consistent relationship could be observed between nicotine levels when measured near
the ceiling of a room and the corresponding level measured in the breathing zone.
In the trial with urine and saliva samples collected from volunteers exposed to
ETS in the bingo smoking room, there was a fair degree of variation among the various
volunteers. This was not unexpected and is consistent with the findings of Jenkins and
Counts (1 999). As outlined by Benowitz and Jacob (1 987), the rate of nicotine excretion
is dependent on the acidity of urine with the rate being higher in acidic urine due to re-
absorption. Differing rates of nicotine excretion would affect both nicotine and cotinine
levels. This illustrates the importance of having samples from a group of exposed
individuals and drawing conclusions based on average levels of such a group rather
than making any conclusions based on individual nicotine or cotinine levels.
In the present study, cotinine concentrations were examined after a single 4 hour
exposure to ETS. While this length of exposure was sufficient to observe a noticeable
change in cotinine levels beyond baseline levels, more work is needed to look at cotinine
concentrations after repeated regular exposure to ETS in order to determine if the time
of sample collection is significant with respect to determining the risk of various negative
outcomes based on concentration of cotinine in saliva. In addition, given the effects that
were under consideration (lung cancer and cardiovascular disease) are as a result of
chronic exposure to ETS, it would be important to examine the trend in cotinine levels in
those people with repeated exposures to ETS and in particular to determine if cotinine
levels reached steady state and if so what was the steady state level of cotinine in order
to have a clearer picture of the risk of long term consequences from their exposure.
The present study also illustrated the need for further work on the calculation of
risk based on the cotinine levels of those exposed. Using the formulae developed by
Repace et al. (1998) a level of risk of lung cancer of 1 in 10 was calculated based on the
peak average salivary cotinine level. This is in excess of the level of risk cited by
Repace and Lowery (1 993) of 2 lung cancer deaths per 100 persons for the most heavily
exposed non-smokers. It appears likely that there is a non-linear dose response
relationship with respect to exposure to ETS and negative health outcomes, or at least
with respect to the outcome of death from lung cancer or heart disease. Future studies
should examine more closely the relationship between level of exposure to ETS and risk
of lung cancer or heart disease death as exposure approaches the maximum that is to
be expected for those passively exposed.

APPENDICES

Appendix A - Volunteer Consent Form for Human Exposure to ETS in a Casino Lacking Smoking Restrictions
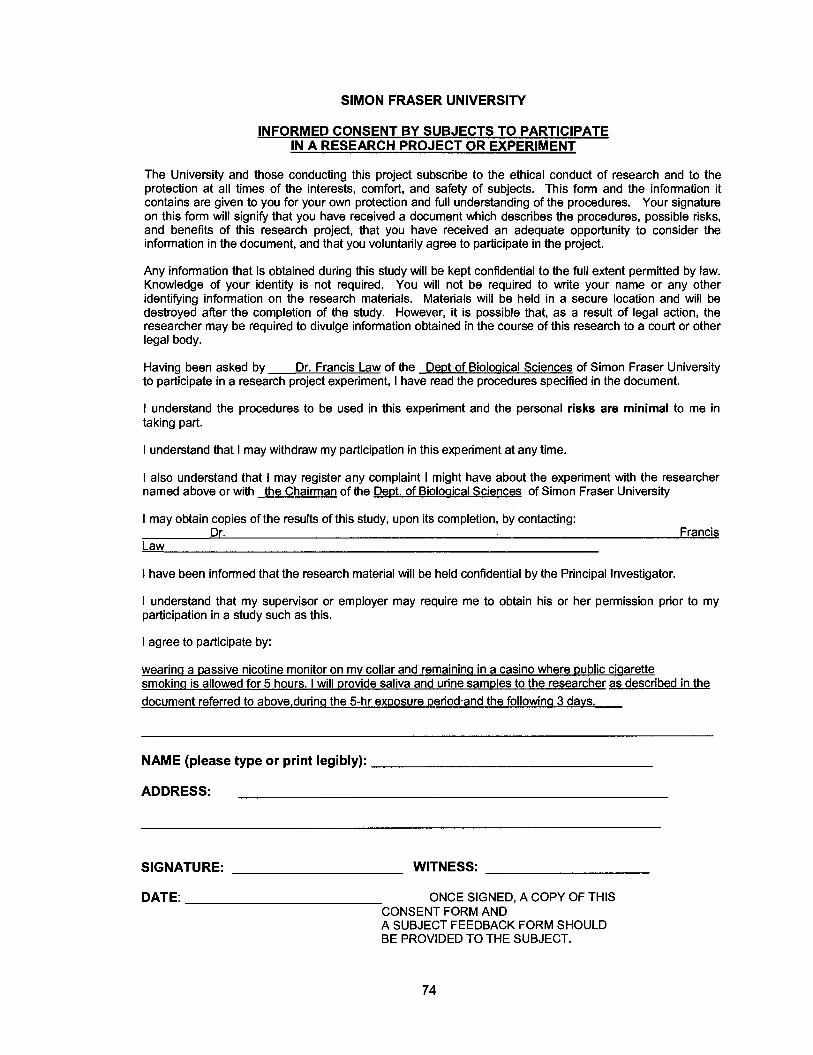
SIMON FRASER UNIVERSITY
INFORMED CONSENT BY SUBJECTS TO PARTICIPATE IN A RESEARCH PROJECT OR EXPERIMENT
The University and those conducting this project subscribe to the ethical conduct of research and to the protection at all times of the interests, comfort, and safety of subjects. This form and the information it contains are given to you for your own protection and full understanding of the procedures. Your signature on this form will signify that you have received a document which describes the procedures, possible risks, and benefits of this research project, that you have received an adequate opportunity to consider the information in the document, and that you voluntarily agree to participate in the project.
Any information that is obtained during this study will be kept confidential to the full extent permitted by law. Knowledge of your identity is not required. You will not be required to write your name or any other identifying information on the research materials. Materials will be held in a secure location and will be destroyed after the completion of the study. However, it is possible that, as a result of legal action, the researcher may be required to divulge information obtained in the course of this research to a court or other legal body.
Having been asked by Dr. Francis Law of the D e ~ t of Bioloaical Sciences of Simon Fraser University to participate in a research project experiment, I have read the procedures specified in the document.
I understand the procedures to be used in this experiment and the personal risks are minimal to me in taking part.
I understand that I may withdraw my participation in this experiment at any time.
I also understand that I may register any complaint I might have about the experiment with the researcher named above or with the Chairman of the Dept. of Bioloaical Sciences of Simon Fraser University
I may obtain copies of the results of this study, upon its completion, by contacting:
I have been informed that the research material will be held confidential by the Principal Investigator.
I understand that my supervisor or employer may require me to obtain his or her permission prior to my participation in a study such as this.
I agree to participate by:
wearina a passive nicotine monitor on mv collar and remainina in a casino where public ciaarette smokina is allowed for 5 hours. I will provide saliva and urine samples to the researcher as described in the document referred to above,durina the 5-hr exposure period.and the followina 3 days.
NAME (please type or print legibly):
ADDRESS:
SIGNATURE: WITNESS:
DATE: ONCE SIGNED, A COPY OF THIS CONSENT FORM AND A SUBJECT FEEDBACK FORM SHOULD BE PROVIDED TO THE SUBJECT.

Appendix B - Volunteer Information Sheet for Human Exposure to ETS in a Casino Lacking Smoking Restrictions
SIMON FRASER UNIVERSITY
INFORMATION SHEET FOR SUBJECTS
This form describes the proposed tests involving physical, psychological, or any other invasive
testing.
Title of Project: Assessinn Exposure of Non-Smokers to Environmental Tobacco in Public Places of Vancouver
Description of the procedures to be followed and a statement of the risks to the subjects and benefits of the research.
Six healthy male non-smokers between 20-35 years old will be recruited for the exposure study. Non-smokers are defined as those who reported no smoking of cigarettes, pipes or cigars and do not live with someone who smokes cigarettes, pipes or cigars. One sample each of saliva and urine will be collected from the volunteers immediately before the study.
The volunteer will be sent to a bingo hall or casino where public cigarette smoking is allowed and remained there for 3-5 hr. A passive monitor for nicotine will be clipped to the collar near the breathing zone of each volunteer. At different time points during and after environmental tobacco smoke exposure (0.5, I , 2, 3,4, 5, 6, 7, 8, 12, 24, 30, 48, 54, 72, 80, and 96 hr) a saliva sample (2 ml) will be collected by asking the volunteer to spit into labelled sample vials. Urine will be collected for 72 hr over the following time intervals: 0-2, 2-8, 8-24, 24-48, and 48-72. The volume of the urine samples will be measured and aliquots (20 ml) will be taken and stored at -20 O c .
The proposed study will be conducted concurrently to an environmental tobacco smoke monitoring study supported by the Vancouver/Richmond Health Board. The study will help to decrease the uncertainties involved in assessing the exposure doses of non-smokers to tobacco smoke, thus providing a more accurate estimation of lung cancer risks from chronic exposure. The risks to the experimental subjects are minimal.

Appendix C - Subject Feedback Form for Human Exposure to ETS in a Casino Lacking Smoking Restrictions
SIMON FRASER UNIVERSITY UNIVERSITY RESEARCH ETHICS REVIEW COMMITTEE
SUBJECT FEEDBACK FORM
Completion of this form is OPTIONAL, and is not a requirement of participation in the project. However, if you have served as a subject in a project and would care to comment on the procedures involved, you may complete the following form and send it to the Chair, University Research Ethics Review Committee. All information received will be treated in a strictly confidential manner.
Name of Principal Investigator: Dr. Francis Law
Title of Project: Assessinn Exposure of Non-Smokers to Environmental Tobacco Smoke in Public Places in Vancouver
Dept.lSchoollFacuIty: Bioloaical Sciences
Did you sign an Informed Consent Form before participating in the project? -
Were there significant deviations from the originally stated procedures?
I wish to comment on my involvement in the above project which took place:
(Date) (Place) (Time)
Comments:
Completion of this section is optional
Your name:
Address:
Telephone: (w) (h)
This form should be sent to the Chair, University Research Ethics Review Committee, c/o Office of the Vice-president, Research, Simon Fraser University, Burnaby, BC, V5A 1 S6.
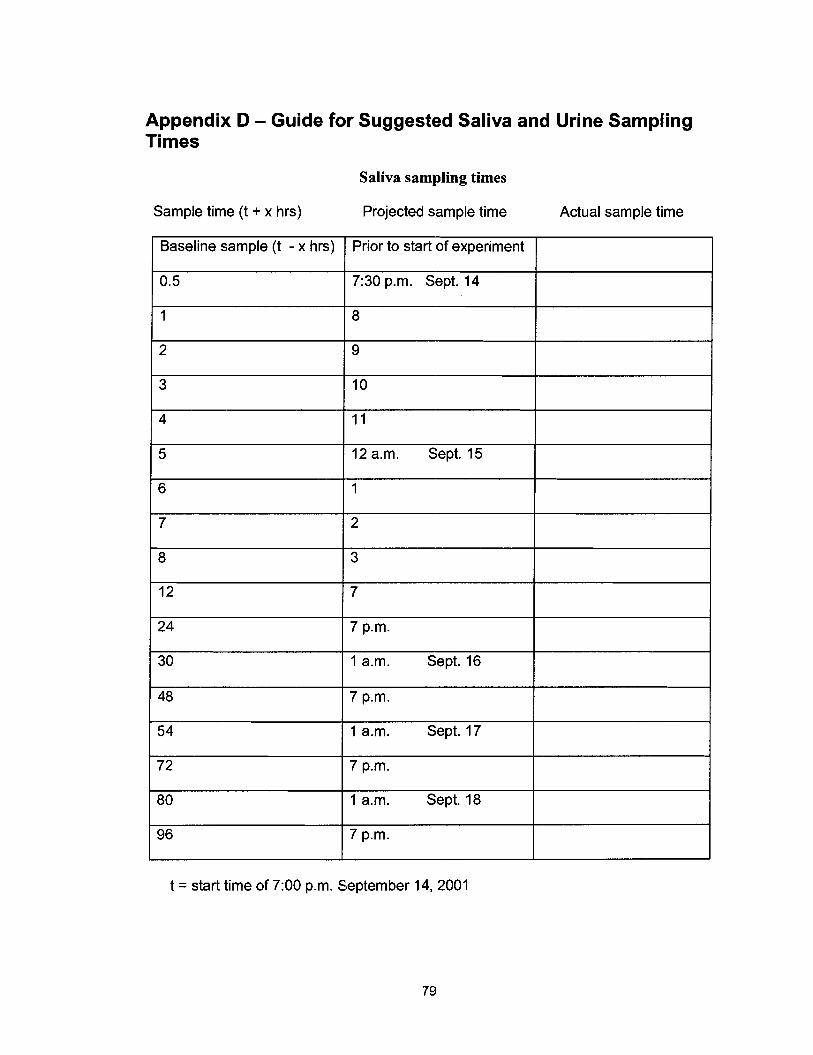
Appendix D - Guide for Suggested Saliva and Urine Sampling Times
Saliva sampling times
Sample time (t + x hrs) Projected sample time Actual sample time
Baseline sample (t - x hrs)
1 12 a.m. Sept. 15
Prior to start of experiment
0.5
1
2
3
7:30 p.m. Sept. I 4
8
9
10
I I
t = start time of 7:00 p.m. September 14, 2001
54
72
80
96
1 a.m. Sept. 17
7 p.m.
1 a.m. Sept. 18
7 p.m.
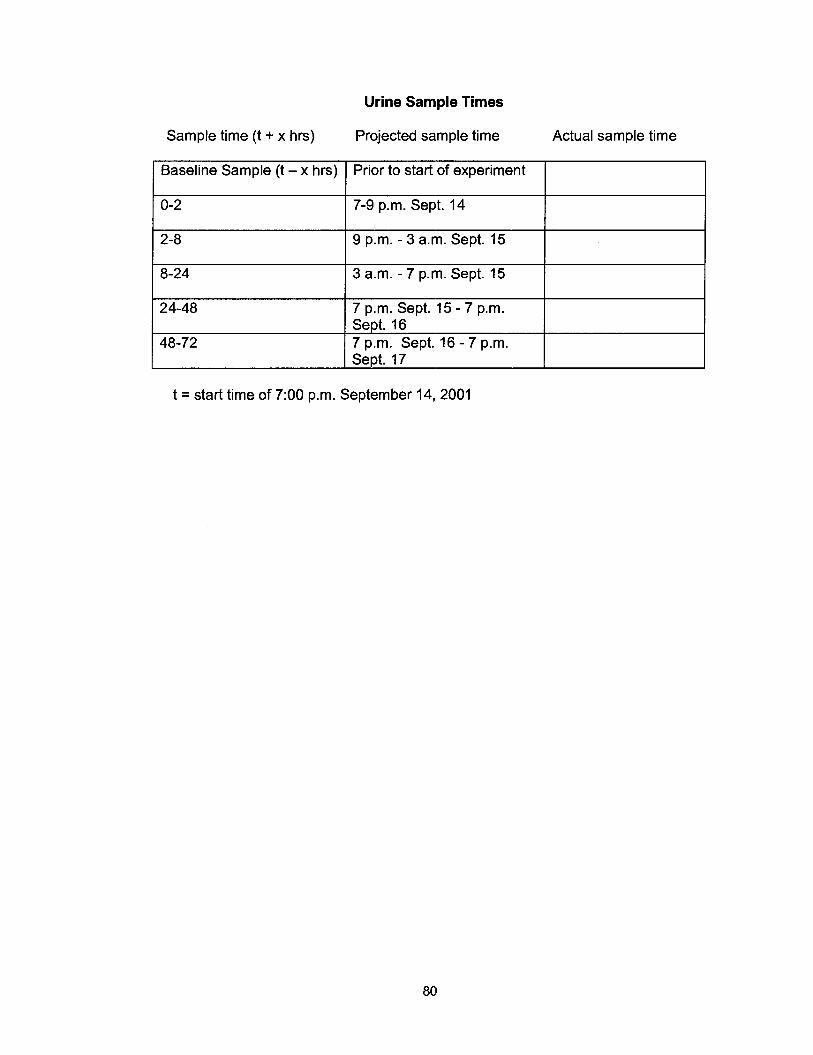
Urine Sample Times
Sample time (t + x hrs) Projected sample time Actual sample time
Baseline Sample (t - x hrs) Prior to start of experiment
0-2
1 8-24 1 3 a.m. - 7 p.m. Sept. 15
7-9 p.m. Sept. 14
2-8
7 p.m. Sept. 15 - 7 p.m.
7 p.m. Sept. 16 - 7 p.m.
9 p.m. - 3 a.m. Sept. 15
t = start time of 7:00 p.m. September 14, 2001

Appendix E - Volunteer Consent Form for Human ETS Exposure in the Smoking Room of a Bingo
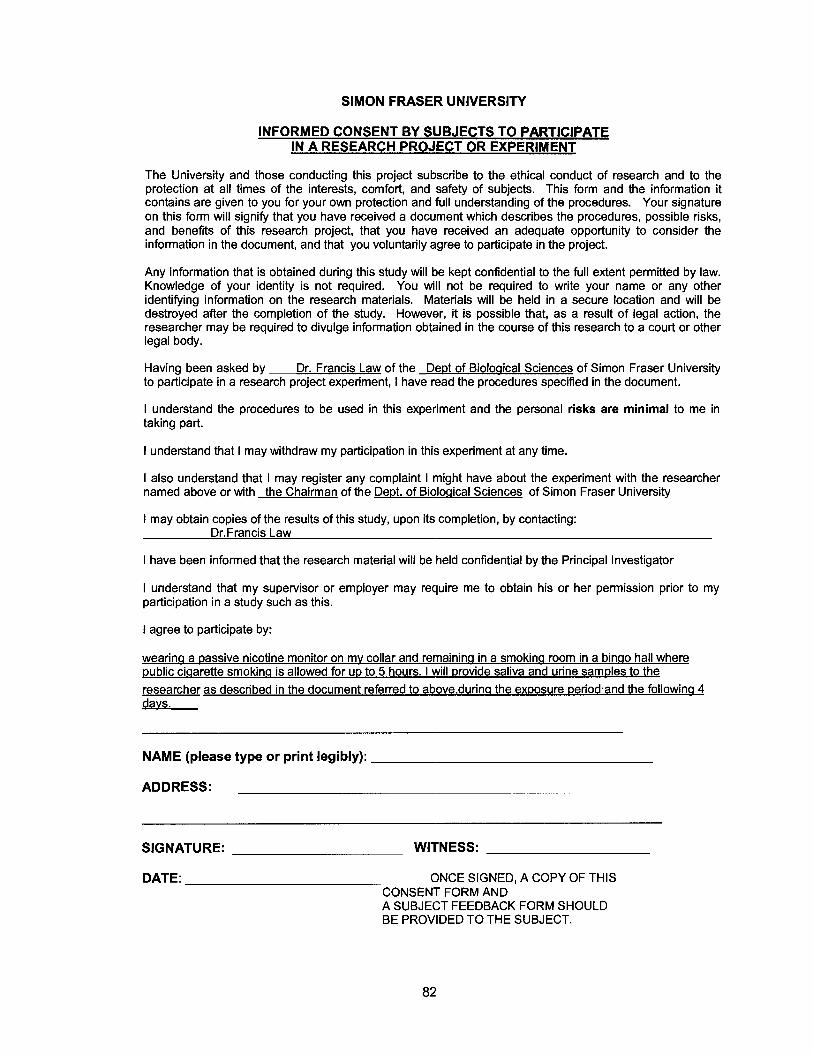
SIMON FRASER UNIVERSITY
INFORMED CONSENT BY SUBJECTS TO PARTICIPATE IN A RESEARCH PROJECT OR EXPERIMENT
The University and those conducting this project subscribe to the ethical conduct of research and to the protection at all times of the interests, comfort, and safety of subjects. This form and the information it contains are given to you for your own protection and full understanding of the procedures. Your signature on this form will signify that you have received a document which describes the procedures, possible risks, and benefits of this research project, that you have received an adequate opportunity to consider the information in the document, and that you voluntarily agree to participate in the project.
Any information that is obtained during this study will be kept confidential to the full extent permitted by law. Knowledge of your identity is not required. You will not be required to write your name or any other identifying information on the research materials. Materials will be held in a secure location and will be destroyed after the completion of the study. However, it is possible that, as a result of legal action, the researcher may be required to divulge information obtained in the course of this research to a court or other legal body.
Having been asked by Dr. Francis Law of the D e ~ t of Bioloaical Sciences of Simon Fraser University to participate in a research project experiment, I have read the procedures specified in the document.
I understand the procedures to be used in this experiment and the personal risks are minimal to me in taking part.
I understand that I may withdraw my participation in this experiment at any time.
I also understand that I may register any complaint I might have about the experiment with the researcher named above or with the Chairman of the De~ t . of Bioloaical Sciences of Simon Fraser University
I may obtain copies of the results of this study, upon its completion, by contacting: Dr.Francis Law
I have been informed that the research material will be held confidential by the Principal Investigator
I understand that my supervisor or employer may require me to obtain his or her permission prior to my participation in a study such as this.
I agree to participate by:
wearinq a passive nicotine monitor on mv collar and remainina in a smokincl room in a binao hall where public ciaarette smokincl is allowed for up to 5 hours. I will provide saliva and urine samples to the researcher as described in the document referred to above.durina the exposure period.and the followina 4 davs.
NAME (please type or print legibly):
ADDRESS:
SIGNATURE: WITNESS:
DATE: ONCE SIGNED, A COPY OF THIS CONSENT FORM AND A SUBJECT FEEDBACK FORM SHOULD BE PROVIDED TO THE SUBJECT.
Appendix F - Volunteer Information Sheet for Human ETS Exposure in the Smoking Room of a Bingo
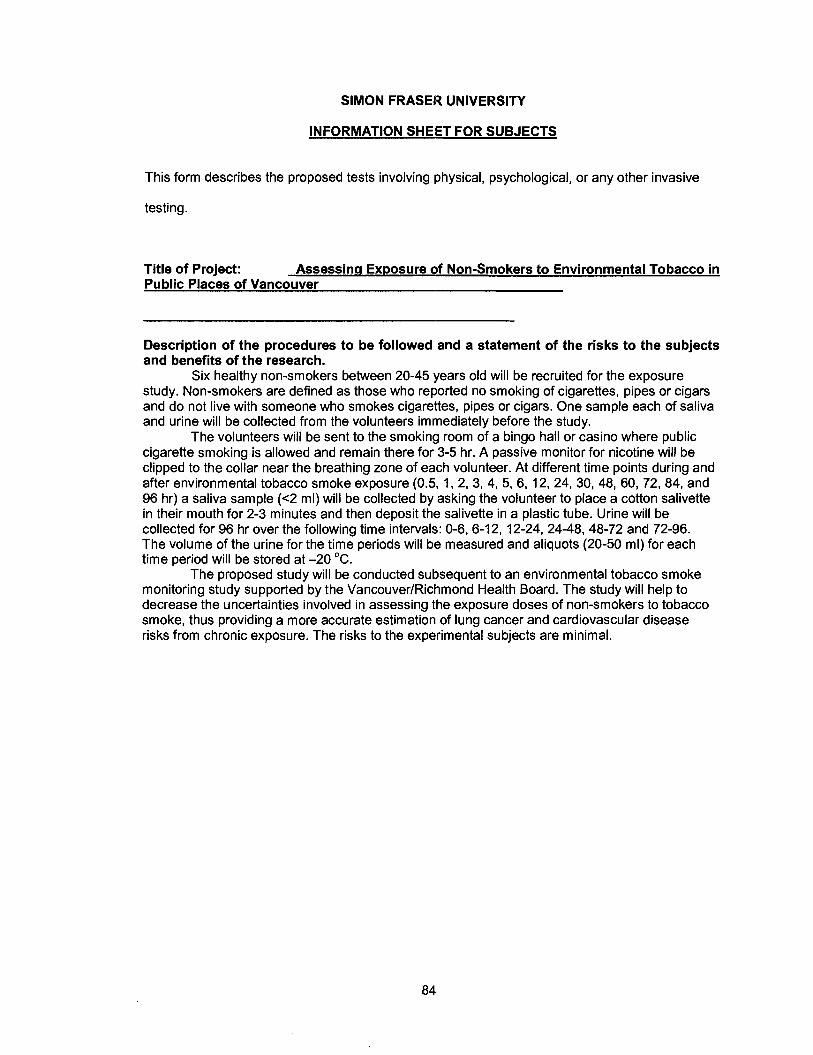
SIMON FRASER UNIVERSITY
INFORMATION SHEET FOR SUBJECTS
This form describes the proposed tests involving physical, psychological, or any other invasive
testing.
Title of Project: Assessinn Exposure of Non-Smokers to Environmental Tobacco in Public Places of Vancouver
Description of the procedures to be followed and a statement of the risks to the subjects and benefits of the research.
Six healthy non-smokers between 20-45 years old will be recruited for the exposure study. Non-smokers are defined as those who reported no smoking of cigarettes, pipes or cigars and do not live with someone who smokes cigarettes, pipes or cigars. One sample each of saliva and urine will be collected from the volunteers immediately before the study.
The volunteers will be sent to the smoking room of a bingo hall or casino where public cigarette smoking is allowed and remain there for 3-5 hr. A passive monitor for nicotine will be clipped to the collar near the breathing zone of each volunteer. At different time points during and after environmental tobacco smoke exposure (0.5, I , 2, 3, 4, 5, 6, 12, 24, 30, 48, 60, 72, 84, and 96 hr) a saliva sample ( ~ 2 ml) will be collected by asking the volunteer to place a cotton salivette in their mouth for 2-3 minutes and then deposit the salivette in a plastic tube. Urine will be collected for 96 hr over the following time intervals: 0-6, 6-12, 12-24, 24-48, 48-72 and 72-96. The volume of the urine for the time periods will be measured and aliquots (20-50 ml) for each time period will be stored at -20 OC.
The proposed study will be conducted subsequent to an environmental tobacco smoke monitoring study supported by the VancouverlRichmond Health Board. The study will help to decrease the uncertainties involved in assessing the exposure doses of non-smokers to tobacco smoke, thus providing a more accurate estimation of lung cancer and cardiovascular disease risks from chronic exposure. The risks to the experimental subjects are minimal.
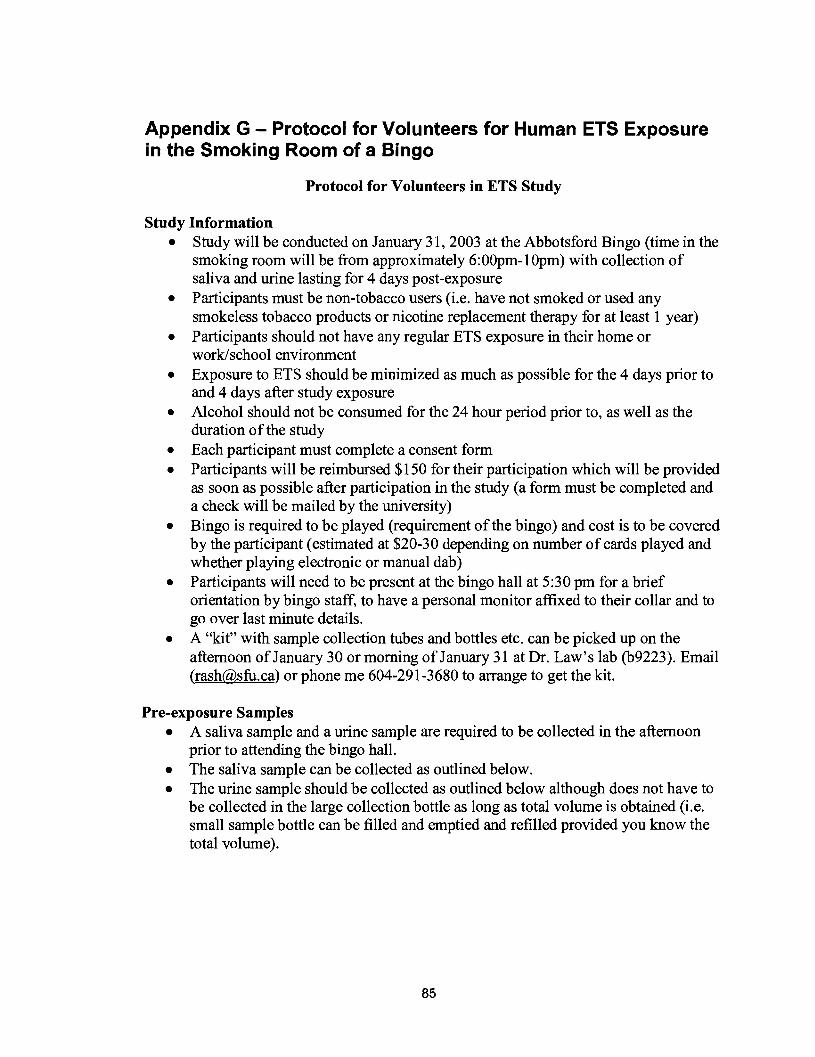
Appendix G - Protocol for Volunteers for Human ETS Exposure in the Smoking Room of a Bingo
Protocol for Volunteers in ETS Study
Study Information Study will be conducted on January 3 1,2003 at the Abbotsford Bingo (time in the smoking room will be from approximately 6:OOpm-1Opm) with collection of saliva and urine lasting for 4 days post-exposure Participants must be non-tobacco users (i.e. have not smoked or used any smokeless tobacco products or nicotine replacement therapy for at least 1 year) Participants should not have any regular ETS exposure in their home or work/school environment Exposure to ETS should be minimized as much as possible for the 4 days prior to and 4 days after study exposure Alcohol should not be consumed for the 24 hour period prior to, as well as the duration of the study Each participant must complete a consent form Participants will be reimbursed $150 for their participation which will be provided as soon as possible after participation in the study (a form must be completed and a check will be mailed by the university) Bingo is required to be played (requirement of the bingo) and cost is to be covered by the participant (estimated at $20-30 depending on number of cards played and whether playing electronic or manual dab) Participants will need to be present at the bingo hall at 5:30 pm for a brief orientation by bingo staff, to have a personal monitor affixed to their collar and to go over last minute details. A "kit" with sample collection tubes and bottles etc. can be picked up on the afternoon of January 30 or morning of' January 3 1 at Dr. Law's lab (b9223). Email (rash@,sfu.ca) or phone me 604-291-3680 to arrange to get the kit.
Pre-exposure Samples A saliva sample and a urine sample are required to be collected in the afternoon prior to attending the bingo hall. The saliva sample can be collected as outlined below. The urine sample should be collected as outlined below although does not have to be collected in the large collection bottle as long as total volume is obtained (i.e. small sample bottle can be filled and emptied and refilled provided you know the total volume).
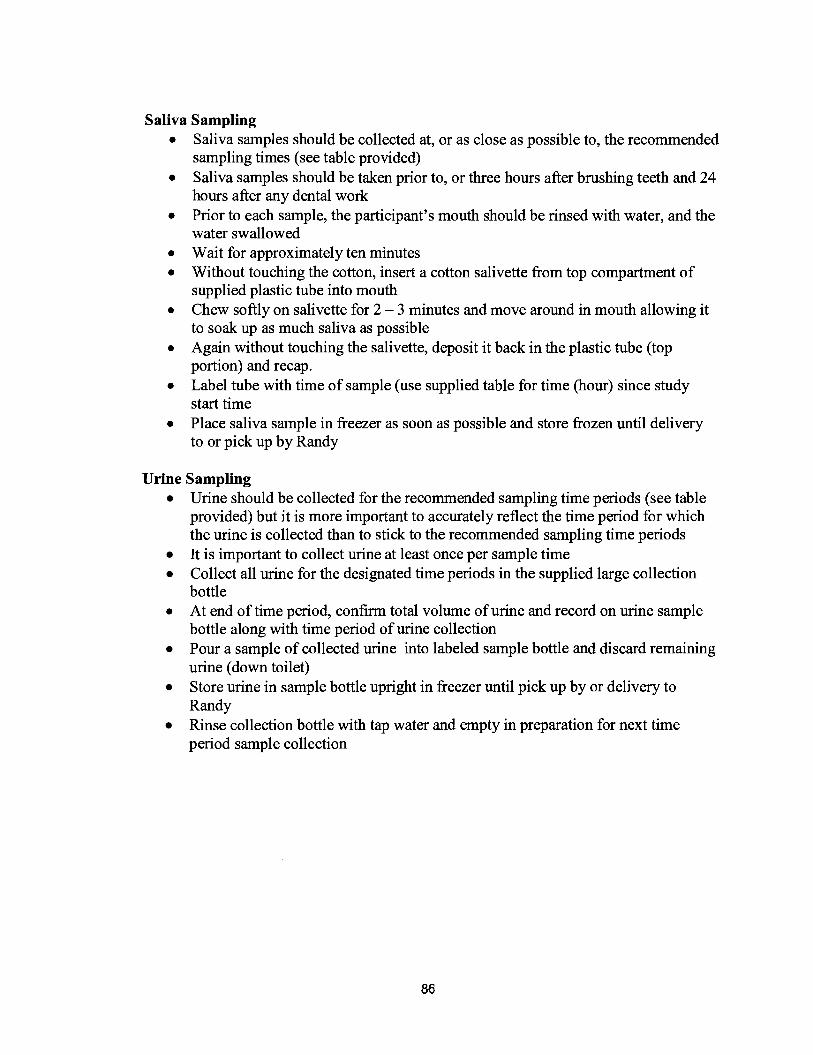
Saliva Sampling Saliva samples should be collected at, or as close as possible to, the recommended sampling times (see table provided) Saliva samples should be taken prior to, or three hours after brushing teeth and 24 hours after any dental work Prior to each sample, the participant's mouth should be rinsed with water, and the water swallowed Wait for approximately ten minutes Without touching the cotton, insert a cotton salivette from top compartment of supplied plastic tube into mouth Chew softly on salivette for 2 - 3 minutes and move around in mouth allowing it to soak up as much saliva as possible Again without touching the salivette, deposit it back in the plastic tube (top portion) and recap. Label tube with time of sample (use supplied table for time (hour) since study start time Place saliva sample in freezer as soon as possible and store frozen until delivery to or pick up by Randy
Urine Sampling Urine should be collected for the recommended sampling time periods (see table provided) but it is more important to accurately reflect the time period for which the urine is collected than to stick to the recommended sampling time periods It is important to collect urine at least once per sample time Collect all urine for the designated time periods in the supplied large collection bottle
a At end of time period, confirm total volume of urine and record on urine sample bottle along with time period of urine collection Pour a sample of collected urine into labeled sample bottle and discard remaining urine (down toilet) Store urine in sample bottle upright in freezer until pick up by or delivery to Randy Rinse collection bottle with tap water and empty in preparation for next time period sample collection
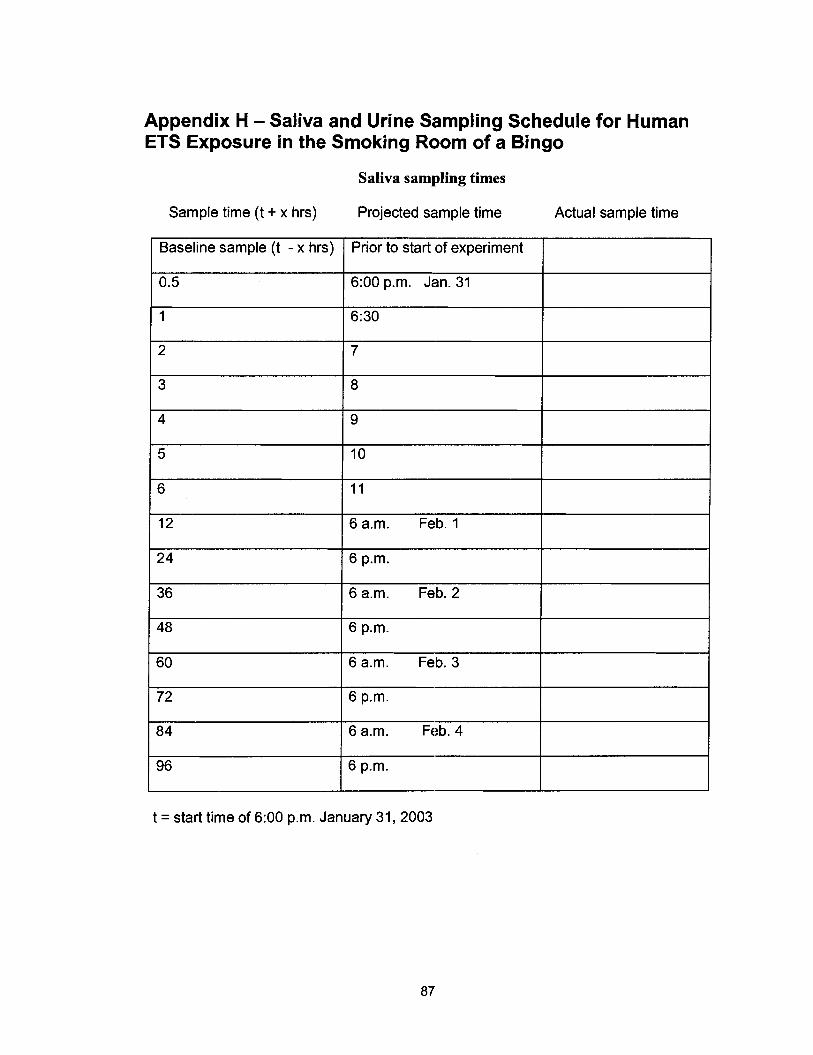
Appendix H - Saliva and Urine Sampling Schedule for Human ETS Exposure in the Smoking Room of a Bingo
Saliva sampling times
Sample time (t + x hrs)
Baseline sample (t - x hrs)
Projected sample time Actual sample time
Prior to start of experiment
6:00 p.m. Jan. 31
I
6 a.m. Feb. 1
6 a.m. Feb. 2
I
6 a.m. Feb. 3
6 a.m. Feb. 4
t = start time of 6:00 p.m. January 31, 2003
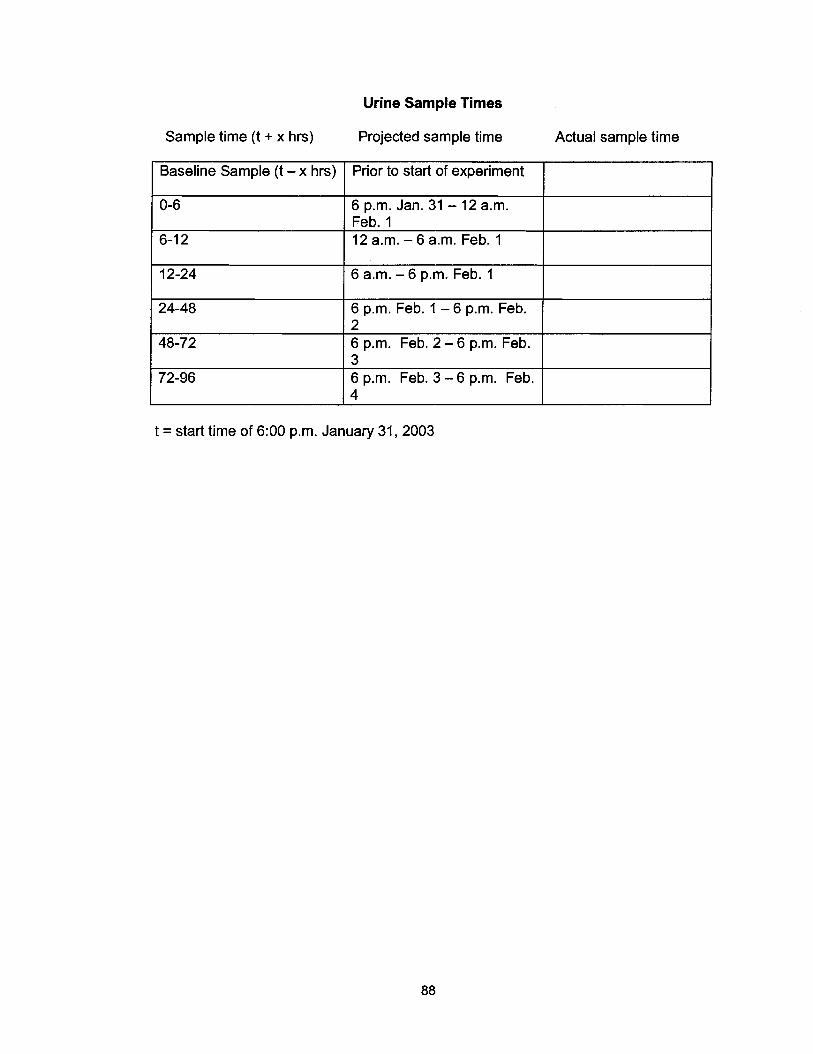
Urine Sample Times
Sample time (t + x hrs) Projected sample time Actual sample time
Baseline Sample (t - x hrs) I Prior to start of experiment I . . I
6-1 2 1 12 a.m. - 6 a.m. Feb. 1
0-6 6 p.m. Jan. 31 - 12 a.m. Feb. 1
6 p.m. Feb. 1 - 6 p.m. Feb.
6 p.m. Feb. 2 - 6 p.m. Feb.
12-24 6 a.m. - 6 p.m. Feb. 1
t = start time of 6:00 p.m. January 31, 2003
72-96 6 p.m. Feb. 3 - 6 p.m. Feb. 4
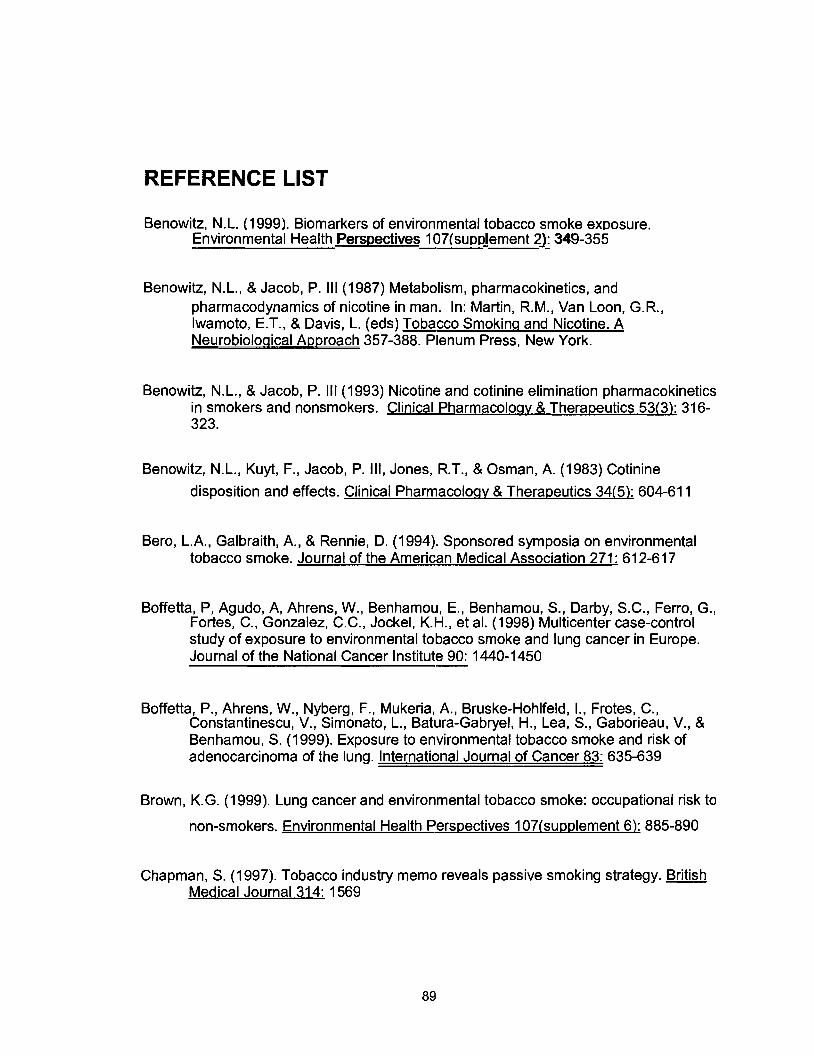
REFERENCE LIST
Benowitz, N.L. (1 999). Biomarkers of environmental tobacco smoke exposure. ~nvironmenta-l Health Perspectives 107(supplement 2): 349-355
Benowitz, N.L., & Jacob, P. 111 (1987) Metabolism, pharmacokinetics, and pharmacodynamics of nicotine in man. In: Martin, R.M., Van Loon, G.R., Iwamoto, E.T., & Davis, L. (eds) Tobacco Smokinq and Nicotine. A Neurobioloqical Approach 357-388. Plenum Press, New York.
Benowitz, N.L., & Jacob, P. 111 (1993) Nicotine and cotinine elimination pharmacokinetics in smokers and nonsmokers. Clinical Pharmacoloqv & Therapeutics 53(3): 316- 323.
Benowitz, N.L., Kuyt, F., Jacob, P. Ill, Jones, R.T., & Osman, A. (1983) Cotinine disposition and effects. Clinical Pharmacoloav & Therapeutics 34(5): 604-61 1
Bero, L.A., Galbraith, A., & Rennie, D. (1994). Sponsored symposia on environmental tobacco smoke. Journal of the American Medical Association 271 : 61 2-61 7
Boffetta, P, Agudo, A, Ahrens, W., Benhamou, E., Benhamou, S., Darby, S.C., Ferro, G., Fortes, C., Gonzalez, C.C., Jockel, K.H., et al. (1998) Multicenter case-control study of exposure to environmental tobacco smoke and lung cancer in Europe. Journal of the National Cancer Institute 90: 1440-1450
Boffetta, P., Ahrens, W., Nyberg, F., Mukeria, A., Bruske-Hohlfeld, I., Frotes, C., Constantinescu, V., Simonato, L., Batura-Gabryel, H., Lea, S., Gaborieau, V., & Benhamou, S. (1 999). Exposure to environmental tobacco smoke and risk of adenocarcinoma of the lung. International Journal of Cancer 83: 635-639
Brown, K.G. (1999). Lung cancer and environmental tobacco smoke: occupational risk to non-smokers. Environmental Health Pers~ectives 107(supplement 6): 885-890
Chapman, S. (1997). Tobacco industry memo reveals passive smoking strategy. British Medical Journal 31 4: 1569
Curvall, M., Vala, E.K., Enzell, C.R. & Wahren, J. (1990) Simulation and evaluation of nicotine intake during passive smoking: Cotinine measurements in body fluids of nonsmokers given intravenous infusions of nicotine. Clinical Pharmacoloa~ & Therapeutics 47(1): 42-49
Daisey, J.M. (1999). Tracers for assessing exposure to environmental tobacco smoke: what are they tracing? Environmental Health Perspectives 107(su~~lement 2): 3 1 9-327
De Schepper, P.J., Van Hecken, A., Daenens, P., & Van Rossum, J.M. (1987) Kinetics of cotinine after oral and intravenous administration to man. European Journal of Clinical Pharmacoloay 31 (5): 583-588
Dockery D.W., & Trichopoulos D. (1997). Risk of lung cancer from environmental exposures to tobacco smoke. Cancer Causes and Control 8: 333-345
Etzel, R.A. (1 990) A review of the use of salivary cotinine as a marker of tobacco smoke exposure. Preventive Medicine 19: 190-1 97
Gammon, M.D., Eng, S.M., Teitelbaum, S.L., Britton, J.A., Kabat, G.C., Hatch, M., Paykin, A.B., Neugut, A.I., & Santella, R.M. (2004) Environmental tobacco smoke and breast cancer incidence. Environmental Research 96: 176-1 85
Hackshaw, A.K. (1 998). Lung cancer and passive smoking. Statistical Methods in Medical Research 7: 1 19-1 36
Hammond, S.K. & Leaderer, B.P. (1987). A diffusion monitor to measure exposure to passive smoking. Environmental Science and Technoloay, 21(5): 494-497.
Hammond, S.K., Leaderer, B.P., Roche, A.C., & Schenker, M. (1987) Collection and analysis of nicotine as a marker for enivironimental tobacco smoke. Atmospheric Environment 21 (2): 457-462
Hammond, S.K., Sorensen, G., Youngstrom, R., & Ockene, J.K. (1 995). Occupational exposure to environmental tobacco smoke. Journal of the American Medical Association 274(12): 956-960
Health Canada (2003) http://www.hc-sc.gc.ca/hecs-sesc/tobacco/facts/
Hecht, S.S. (2002) Human urinary carcinogen metabolites: biomarkers for investigating tobacco and cancer. Carcinoqenesis 23(6): 907-922
Hecht, S.S., Carmella, S.G., Murphy, S.E., Akerkar, S., Brunnemann, K.D., & Hoffman, D. (1 993). A tobacco-specific lung carcinogen in the urine of men exposed to cigarette smoke. New England Journal of Medicine 329: 1543-1 546
Howard, G. & Thun, M.J. (1999). Why is environmental tobacco smoke more strongly associated with coronary heart disease than expected? A review of potential biases and experimental data. Environmental Health Perspectives 107(surs~lement 6): 853-858
Husgafvel-Pursiainen, K., Boffetta, P., Kannio, A., Nyberg, F., Pershagen, G., Mukeria, A., Constantinescu, V., Fortes, C., & Benhamou, S. (2000) p53 mutations and exposure to environmental tobacco smoke in a multicenter study on lung cancer. Cancer Research 60: 2906-291 1
Jarvis, M.J., Foulds, J., & Feyerabend, C. (1992) Exposure to passive smoking among bar staff. British Journal of Addiction 87: 1 1 1-1 13
Jenkins, R.A. & Counts, R.W. (1 999). Personal exposure to environmental tobacco smoke: salivary cotinine, airborne nicotine, and nonsmoker misclassification. Journal or Ex~osure Analysis and Environmental E~idemiology 9: 352-363
Jenkins, R.A., Palausky, A., Counts, R.W., Bayne, C.K., Dindal, A.B., & Guerin, M.R. (1996). Exposure to environmental tobacco smoke in sixteen cities in the United States as determined by personal breathing zone air sampling. Journal of Exposure Analysis and Environmental Epidemiologv 6: 473-502
Kiyohara, C., Wakai, K., Mikami, H., Sido, K., Andao, M., & Ohno, Y. (2003) Risk modification by CYPlAl and GSTMl polymorphisms in the association of environmental tobacco smoke and lung cancer: a case-control study in Japanese non-smoking women. International Journal of Cancer 107: 139-144
Klein J, & Koren G. (1999) Hair analysis-a biological marker for passive smoking in pregnancy and childhood. Human Experimental Toxicoloqy 18 (4): 279-282
Kreuzer, M., Krauss, M., Kreienbrock, L., Jockel, K., & Wichmann, H.E. (2000) Environmental tobacco smoke and lung cancer: a case-control study in Germany. American Journal of E~idemioloav 151fl241-250
Kropp, S., & Chang-Claude, J. (2002) Active and passive smoking and risk of breast cancer by age 50 years among German women. American Journal of Epidemioloav I56 (7): 61 6-626.
Kuusimaki, L., Pfaffli, P., Froshaug, M., Becher, G., Dybing, E., & Peltonen, K. (1999) Determination of nicotine as an indicator of environmental tobacco smoke in restaurants. American Journal of Industrial Medicine Supplement 1 : 152-1 54
LaKind, J.S., Jenkins, R.A., Naiman, D.Q., Ginevan, M.E., Graves, C.G., & Tardiff, R.G. (1 999). Use of environmental tobacco smoke constituents as markers for exposure. Risk Analvsis 19(3): 359-373
Law, M.R., Morris, J.K., & Wald, N.J. (1997) Environmental tobacco smoke exposure and ischaemic heart disease: an evaluation of the evidence. British Medical Journal 31 5: 973-980
Leaderer, B.P. (1 990). Assessing exposures to environmental tobacco smoke. Risk Analvsis 1 O(1 19-26
Leaderer, B.P., & Hammond, S.K. (1991). Evaluation of vapour-phase nicotine and respirable suspended particle mass as markers for environmental tobacco smoke. Environmental Science and Technoloay 25: 770-777
Lee, P.N. (1998). Difficulties in assessing the relationship between passive smoking and lung cancer. Statistical Methods in Medical Research 7: 137-163
Lee, C., KO, Y., Goggins, W., Huang, J., Huang, M., Kao, E., & Wang, H., (2000) Lifetime environmental exposure to tobacco smoke and primary lung cancer of non- smoking Taiwanese women. International Journal of Epidemioloav 29: 224-231.
Malats, N., Camus-Radon, A.M., Nyberg, F., Ahrens, W., Constantinescu, V., Mukeria, A., Benhamou, S., Batura-Gabryel, H., Bruske-Hohlfeld, I., Simonato, L., Menezes, A., Lea, S., Lang, M., & Boffetta, P. (2000). Lung cancer risk in nonsmokers and GSTMI and GSTTI genetic polymorphism. Cancer Epidemioloqy, Biomarkers & Prevent ion 827-833
Maskarinec, M.P., Jenkins, R.A., Counts, R.W., & Dindal, A.B. (2000) Determination of exposure to environmental tobacco smoke in restaurant and tavern workers in one US city. Journal of Exposure Analvsis and Environmental Epidemioloav 10: 36-49.
Moffatt, R.J., Chelland, S.A., Pecott, D.L., & Stamford, B.A. (2004) Acute exposure to environmental tobacco smoke reduces HDL-C and HDL2-C. Preventive Medicine 38: 637-641 -
National Research Council (1 986). Environmental tobacco smoke. Measurina exposure and assessinn health effects. Washington: National Academy Press.
Otsuka, R., Watanabe, H., Hirata, K., Tokai, K., Muro, T., Yoshiyama, M. Takeuchi, K., & Yoshikawa, J. (2001) Acute effects of passive smoking on the coronary circulation in health young adults. Journal of the American Medical Association 286(4): 436-441
Repace, J.L., & Lowrey, A.H. (1990). Risk assessment methodologies for passive smoking-induced lung cancer. Risk Analysis 10(1): 27-37
Repace, J.L., & Lowrey, A.H. (1993). An enforceable indoor air quality standard for environmental tobacco smoke in the workplace. Risk Analysis 13(4): 463-475
Repace, J.L., Jinot, J., Bayard, S., Emmons, K., & Hammond, S.K. (1998). Air nicotine and saliva cotinine as indicators of workplace passive smoking exposure and risk. Risk Analysis l8( l ) : 71 -83
Robinson, D.E., Balter, N.J., & Schwartz, S.L. (1992) A physiologically based pharmacokinetic model for nicotine and cotinine in man. Journal of Pharmacokinetics and Biopharmaceutics 20(6): 591 -609
Rosenbaum, W.L., Sterling, T.D., & Weinkam, J. J. (1 998). Linear extrapolation models of lung cancer risk associated with exposure to tobacco smoke. Regulatorv Toxicoloqy and Pharmacolonv 28: 106-1 14
Thun, M., Henley, J., & Apicella, L. (1999) Epidemiologic studies of fatal and nonfatal cardiovascular disease and ETS exposure from spousal smoking. Environmental Health Perspectives 1 O7(6): 841-846
Tobacco Institute (Undated) "Public Smoking: The Problem (SDC Introduction)," undated but circa 1985, http://www.tobaccodocuments.ord, Bates Number TIMN0014554-65
Trout, D., Decker, J., Mueller, C., Bernert, J.T., & Pirkle, J. (1998) Exposure of casino employees to environmental tobacco smoke. Journal of Occupational and Environmental Medicine (40): 270-276
US EPA (1 994). Setting the record straight: second hand smoke is a preventable health risk. 402-F-94-005 http://www.e~a.aov/iaq/~ubs/strsfs.html
US EPA (1 989). Risk Assessment Guidance for Su~erfund: Human Health Evaluation Manual Part A: Interim Final OSWER Directive 9285.7-01 a
Van Vunakis, H., Gjika, G.B., & Langone, J.J. (1993). Radioimmunoassay for Nicotine and Cotinine. IARC Scientific Publications. (1 09): 293-299
Villeneuve, P.J., Johnson, K.C., Mao, Y., Hanley, A.J., & Canadian Cancer Registries Research Group, (2004) Environmental tobacco smoke and the risk of pancreatic cancer. Findings of a Canadian population-based case-control study. Canadian Journal of Public Health 95 (1 ): 32-37
WCB (2003) Occupational Health and Safety Regulation, Part 4 General Conditions, Environmental Tobacco Smoke http://reaulation.healthandsafet~centre.ora/slPart4.as~?ReportlD=3l051 &hilite=e
Zhong, L., Goldberg, M.S., Gao, Y, & Jin, F. (1999). A case-control study of lung cancer and environmental tobacco smoke among non-smoking women living in Shanghai, China. Cancer Causes and Control 10: 607-616