an evaluation of seafood industry -...
TRANSCRIPT

Vol-1 Issue-1 2016 IJARIIE-ISSN(O)-2395-4396 International Conference on "Innovative Management Practices” Organize by SVCET, Virudhunagar
C-1155 www.ijariie.com 231
AN EVALUATION OF SEAFOOD
INDUSTRY
Harish.M 1 , Dr.S.NatarajaIyer 2
1Ph.D Research, Scholar in Commerce, SD, College Alappuzha, Kerala, India
2Vice Principal, Associate Professor & Head of the Post Graduate , Department of Commerce, SD,
College Alappuzha, Kerala, India.
ABSTRACT
India is blessed with a coastline of over 8,129 kms, 2.02 million sq. km of EEZ, 0.5 million sq. km. Continental
shelf estimated to have exploitable resources to the tune of 4.42 million tons of which about 3.22 million tons
are presently exploited. The estimated potential brackish water area suitable for shrimp farming is about 1.24
million hectare of which around 15% is utilized for farming, producing abou t 2.78 lakh tons of shrimp, scampi,
mud crab and seabass which is going to the export basket. India’s total fishery production is about 8.88 million
tons from both capture and aquaculture India’s seafood industry has become one of the leading suppliers of
quality seafood to all the major markets of the world. India has world class seafood processing plants that
follow quality control regimes complaint to stringent international regulatory requirements. With the growing
demand for Indian seafood products across the world, the dynamics of the seafood business in India is changing
fast. There is a tremendous growth in the resources and infrastructure of the Indian seafood industry
today.Export of Marine Products from India will depend upon world’s demand and su pply conditions. This
paper highlights the significance and viability of marine exports. The need for the present study is to identify
different types of marine products exported and in turn determine the export prospects of this sector.
Key Words: Capture Fisheries, Export Development, Export Potential, Marine Products, Seafood Industry.
1.1 INTRODUCTION
Export plays a very significant ro le in the development and growth of any Country. Export Trade or
International trade refers to the buying and selling of goods and services across national borders or territories
allowing both the buyer and seller to expand their markets for goods and services. Fisheries and aquaculture is
an important sector of food production, providing nutritional security to millions of people contributing to the
agricultural exports and engaging about 14-15 million people in different fish related activit ies. India has shown
continuous and sustained increments in fish production. The fisheries sector has been one of the major
Contributors of foreign exchange through export. India stands second as the largest fish producing Country in
the World. Fisheries sector Contribute to animal protein supply to its increasing population.The marine products
export basket of India comprises mainly Fro zen Shrimp, Frozen fish,Frozen Squid, Frozen Cuttle Fish, dried
items, Chilled items, live items, Frozen Lobster, Frozen Octopus, Canned items and Fish Pickles. The Principal
export markets for Indian marine products are Japan, USA, South East Asia, Middle East and other Asian and
European Countries.
1.2 Need for the Study
India has vast and varied resources for aquaculture and Capture Fisheries. Export of Marine Products will
depend upon World’s demand and Supply Conditions. The need for the Study is to evaluate the export
performance of the marine products from India into different markets and to clearly determine the export
Prospects.
1. 3Objectives of the Study
To analyze the Export performance of marine Products from India.
To examine the item wise, port wise and market wise export of marine Products from India.

Vol-1 Issue-1 2016 IJARIIE-ISSN(O)-2395-4396 International Conference on "Innovative Management Practices” Organize by SVCET, Virudhunagar
C-1155 www.ijariie.com 232
To find out the Contribution of Cultured Shrimp & Scampi in the export production.
To examine the item wise export of Crabs from India.
1.4 Methodology
The study is pursued using Secondary data.The Sources from which the secondary data were drawn is from the
Statistics of MPEDA.The study is descriptive and analytical in nature.
Tools for Analysis
Regression and Correlation is used in the Study with the help of SPSS.
Limitations of the Study
Primary data is not applied in the Study which is a major drawback.
Present Fisheries Statistics is unavailable with the concerned authorities which is also a major hindrance to
the Study.
2. REVIEW OF LITERATURE
Krishnan (1992) made a study on the potentiality of Indian marine Industry. According to him, the potential for
enhancing the marine industry, as a leading one was bright but it was only the techniques and methods that have
to be developed as it would result in higher production and lower price. He also concluded that to Combat
Competition from Latin America and South East Asia the production strategy need to be improved.
Tharakan A.J., (1999), in his study observed that India had international Competit ive advantage in shrimp and
Cephalopods. Therefore he suggested that higher unit value realization from the export of these two products
should be realized by value addit ion and creation of international brand equity for Indian Shrimp and
cephalopods.
Chandrasekaran and Natarajan’s (1994) work on Seasonal abundance and distribution of mud Crabs in
mangroves, in South east India, identified that the t ime of g reatest catch of juvenile recruits was during the post
monsoon period, with nil evident during the monsoon.
Kathirvel and Srin ivassagam (1992) identified area availab ility in India for juveniles. They found that S.serrata
appear to be continual breeders with peak catches of juveniles prevalent in the backwaters during May to
October and in the mangroves during January to February.
3. ANALYSIS
Table-I-Exports during 2013-14 compared to 2012-13
Export Details 2012-13 2013-14 Growth %
Quantity Tonnes 928215 983756 5.98
Value RsCrore 18856.26 30213.26 60.23
Value US $ Million 3511.67 5007.7 42.6
Unit Value (US$/Kg) 3.78 5.09 34.55

Vol-1 Issue-1 2016 IJARIIE-ISSN(O)-2395-4396 International Conference on "Innovative Management Practices” Organize by SVCET, Virudhunagar
C-1155 www.ijariie.com 233
Table-II
Comparison of Total Shrimp & Scampi Production from aquaculture in 2013-14 and
2012-13
Year Live Weight (MT) Product weight
(MT)
Estimated Value
Rs (Crore)
2012-2013 2,77,275 1,68,585 8340.00
2013-2014 3,33,382 1,92,993 12,384.00
Increase 56,107 24408.00 4,044.00
Difference % 20.24% 14.48% 48.49%
Table-III
VannameiProduction through Aquaculture
Year Live Weight (MT) Product weight (MT) Estimated Value
`Rs(Crore)
2012-2013 147516.00 91,610.00 5160.00
2013-2014 250.507 143,855.00 10,020.00
Increase 102.991 52,245.00 4,860.00
Difference% 69.82% 57.03% 94.19%
Table-IV
Contribution of Cultured Shrimp & Scampi in the export production
2012-13 2011-12 Difference
Item Quantity
In MT
Value in
RsCrore
Value in
US $
Million
Quantity In
MT
Value in
RsCrore
Value in
US $
Million
Quantity In
MT
Value in
RsCrore
Value in
US $
Million
Tiger 61,177 2,809 521 74,097 3,684 791 -12,920 875.0 -269.00
Vannamei 91,171 3,937 731 40,787 1,820 386 50,382 2118.0 345.00
Scampi 2,061 112 21 2,723 155 33 -662 -43.00 -13.00
White
shrimp 529 21 4 1,585 71 15 -1,056 -50.00 -11.00
Total 1,54,938 6,879 1,277 1,19,192 5,730 1225 35,746 1,150 52

Vol-1 Issue-1 2016 IJARIIE-ISSN(O)-2395-4396 International Conference on "Innovative Management Practices” Organize by SVCET, Virudhunagar
C-1155 www.ijariie.com 234
Table-VI Market Wise Export of Marine Products from India
Market 2010-11 2011-12 2012-13 2013-14 2014-15
JAPAN
Quantity
in ton 70714 85800 76648 71484 78772
Value in
RsCrore 1683.39 2140.67 1999.59 2463.83 3040.26
US$
Million 373 456.35 372.57 410.95 502.29
USA
Quantity
in ton 50095 68354 92447 110880 129667
Value in
RsCrore 1990.26 2977.53 4026.48 7744.67 8830.12
US$
Million 438.49 637.53 747.45 1286.04 1458.24
EUROPEAN
UNION
Quantity
in ton 170963 154221 158357 174686 188031
Value in
RsCrore 3459.4 3810.44 4176.42 6129.69 6715.58
US$
Million 765.15 805.38 777.41 1013.28 1106.67
CHINA
Quantity
in ton 159147 84515 87776 75783 59519
Value in
RsCrore 1977.81 1259.23 1444.86 1766.72 1349
US$
Million 440.1 263.3 269.47 293.12 221.44
SOUTH
EAST ASIA
Quantity
in ton 233964 343962 340944 380061 409931
Value in
RsCrore 2114.48 4193.27 4357.28 8046.59 8620.85
Table-V
Comparison of cultured tiger shrimp production in 2012-13 and 2013-2014
Year Live Weight (MT) Product weight
(MT)
Estimated Value
Rs (Crore)
2012-2013 1,23,303 73,747.00 3082.00
2013-2014 76,798 46,100.00 2,304.00
Increase (-) 46,505 (-) 27,668.00 (-) 778.00
Difference % (-) 37.72 (-) 37.52 (-) 25.24%

Vol-1 Issue-1 2016 IJARIIE-ISSN(O)-2395-4396 International Conference on "Innovative Management Practices” Organize by SVCET, Virudhunagar
C-1155 www.ijariie.com 235
US$
Million 469.36 880.09 811.8 1320.95 1416.82
MIDDLE
EAST
Quantity
in ton 43983 38155 41419 58040 64608
Value in
RsCrore 670.35 894.38 1113.34 1599.37 2020.86
US$
Million 148.31 186.85 209.26 272.65 333.1
OTHERS
Quantity
in ton 84225 87014 130623 112822 120716
Value in
RsCrore 1005.77 1321.72 1738.29 2462.4 2864.93
US$
Million 222.5 278.94 323.71 410.71 472.56
Total
Quantity
in ton 813091 862021 928215 983756 1051243
Value in
RsCrore 12901.47 16597.23 18856.26 30213.26 33441.61
US$
Million 2856.92 3508.45 3511.67 5007.7 5511.12
Source:MPEDA
Market Wise Export Performance
Regression
ANOVA(b)
Model Sum of Squares df Mean Square F Sig.
1
Regression 30.967 3 10.322 7.579 .000(a)
Residual 49.033 36 1.362
Total 80.000 39
a Predictors: (Constant), US$ Million, Quantity in ton, Value in RsCrore
b Dependent Variable: Year wise
Model Summary
Model R R Square Adjusted R Square Std. Error of the Estimate
1 .622(a) .387 .336 1.167
a Predictors: (Constant), US$ Million, Quantity in ton, Value in RsCrore

Vol-1 Issue-1 2016 IJARIIE-ISSN(O)-2395-4396 International Conference on "Innovative Management Practices” Organize by SVCET, Virudhunagar
C-1155 www.ijariie.com 236
Coefficients(a)
Unstandardized Coefficients Standardized Coefficients
t Sig.
Model B Std. Error
Beta
1
(Constant) 2.999 .242 12.371 .000
Quantity in ton -1.708E-07 .000 -.034 -.063 .950
Value in RsCrore 8.847E-04 .000 4.550 3.628 .001
US$ Million -4.818E-03 .002 -4.289 -2.670 .011
a Dependent Variable: Year wise
Table-VII
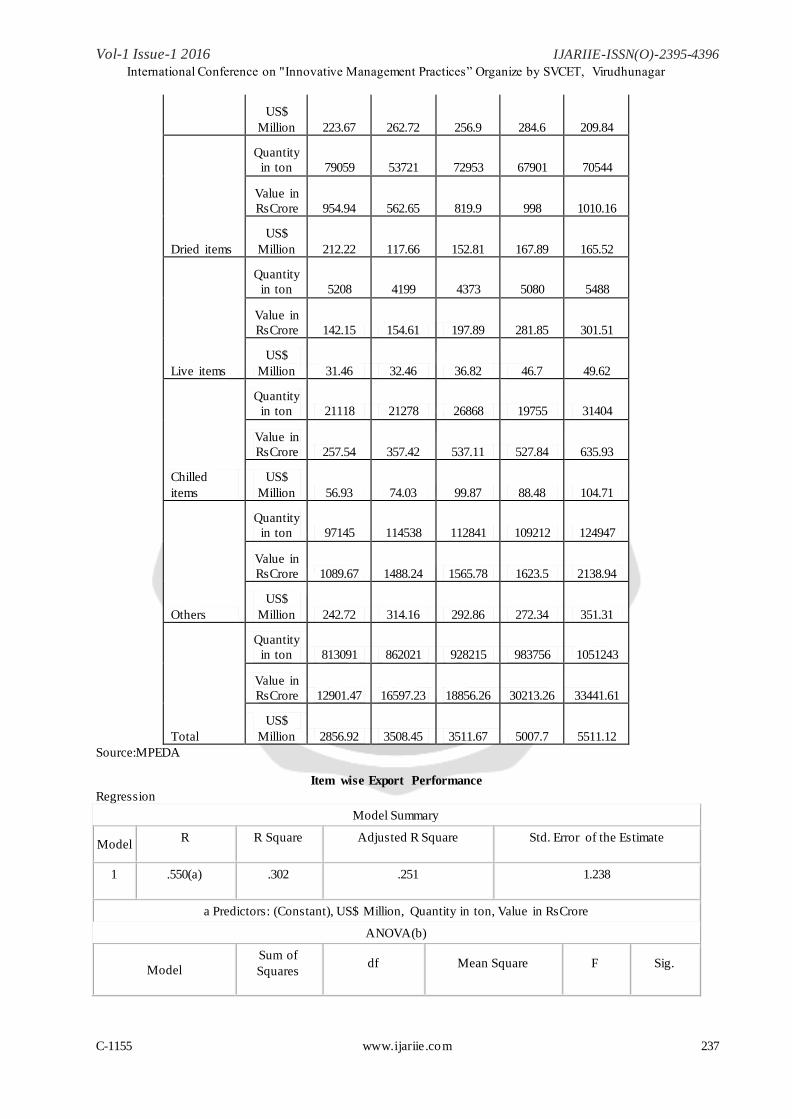
Item wise Export of Marine Products from India
Item 2010-11 2011-12 2012-13 2013-14 2014-15
Fr. Shrimp
Quantity
in ton 151465 189125 228620 301435 357505
Value in
RsCrore 5718.13 8175.26 9706.36 19368.3 22468.12
US$
Million 1261.81 1741.2 1803.26 3210.94 3709.76
Fr.Fin Fish
Quantity
in ton 312358 347118 343876 324359 309434
Value in
RsCrore 2623.89 3284.15 3296.86 4294.81 3778.5
US$
Million 583.48 683.5 617.59 708.63 619.66
Fr.Cuttlefish
Quantity
in ton 59159 54671 63296 68577 82353
Value in
RsCrore 1104.57 1346.72 1354.28 1386.98 1833.21
US$
Million 244.62 282.72 251.54 228.13 300.69
Fr. Squid
Quantity
in ton 87579 77373 75387 87437 69569
Value in
RsCrore 1010.57 1228.19 1378.08 1731.97 1275.25
Vol-1 Issue-1 2016 IJARIIE-ISSN(O)-2395-4396 International Conference on "Innovative Management Practices” Organize by SVCET, Virudhunagar
C-1155 www.ijariie.com 237
US$
Million 223.67 262.72 256.9 284.6 209.84
Dried items
Quantity
in ton 79059 53721 72953 67901 70544
Value in
RsCrore 954.94 562.65 819.9 998 1010.16
US$
Million 212.22 117.66 152.81 167.89 165.52
Live items
Quantity
in ton 5208 4199 4373 5080 5488
Value in
RsCrore 142.15 154.61 197.89 281.85 301.51
US$
Million 31.46 32.46 36.82 46.7 49.62
Chilled
items
Quantity
in ton 21118 21278 26868 19755 31404
Value in
RsCrore 257.54 357.42 537.11 527.84 635.93
US$
Million 56.93 74.03 99.87 88.48 104.71
Others
Quantity
in ton 97145 114538 112841 109212 124947
Value in
RsCrore 1089.67 1488.24 1565.78 1623.5 2138.94
US$
Million 242.72 314.16 292.86 272.34 351.31
Total
Quantity
in ton 813091 862021 928215 983756 1051243
Value in
RsCrore 12901.47 16597.23 18856.26 30213.26 33441.61
US$
Million 2856.92 3508.45 3511.67 5007.7 5511.12
Source:MPEDA
Item wise Export Performance
Regression
Model Summary
Model R R Square Adjusted R Square Std. Error of the Estimate
1 .550(a) .302 .251 1.238
a Predictors: (Constant), US$ Million, Quantity in ton, Value in RsCrore
ANOVA(b)
Model
Sum of
Squares df Mean Square F Sig.

Vol-1 Issue-1 2016 IJARIIE-ISSN(O)-2395-4396 International Conference on "Innovative Management Practices” Organize by SVCET, Virudhunagar
C-1155 www.ijariie.com 238
1
Regression 27.206 3 9.069 5.921 .002(a)
Residual 62.794 41 1.532
Total 90.000 44
a Predictors: (Constant), US$ Million, Quantity in ton, Value inRs Crore
b Dependent Variable: Year wise
Coefficients(a)
Unstandardized Coefficients
Standardized
Coefficients
t Sig.
Model B Std. Error
Beta
1
(Constant) 3.005 .231 13.013 .000
Quantity in ton 8.335E-07 .000 .163 .479 .635
Value in Rs
Crore 8.336E-04 .000 4.721 3.833 .000
US$ Million -4.773E-03 .001 -4.681 -3.368 .002
a Dependent Variable: Year wise
Table-VIII
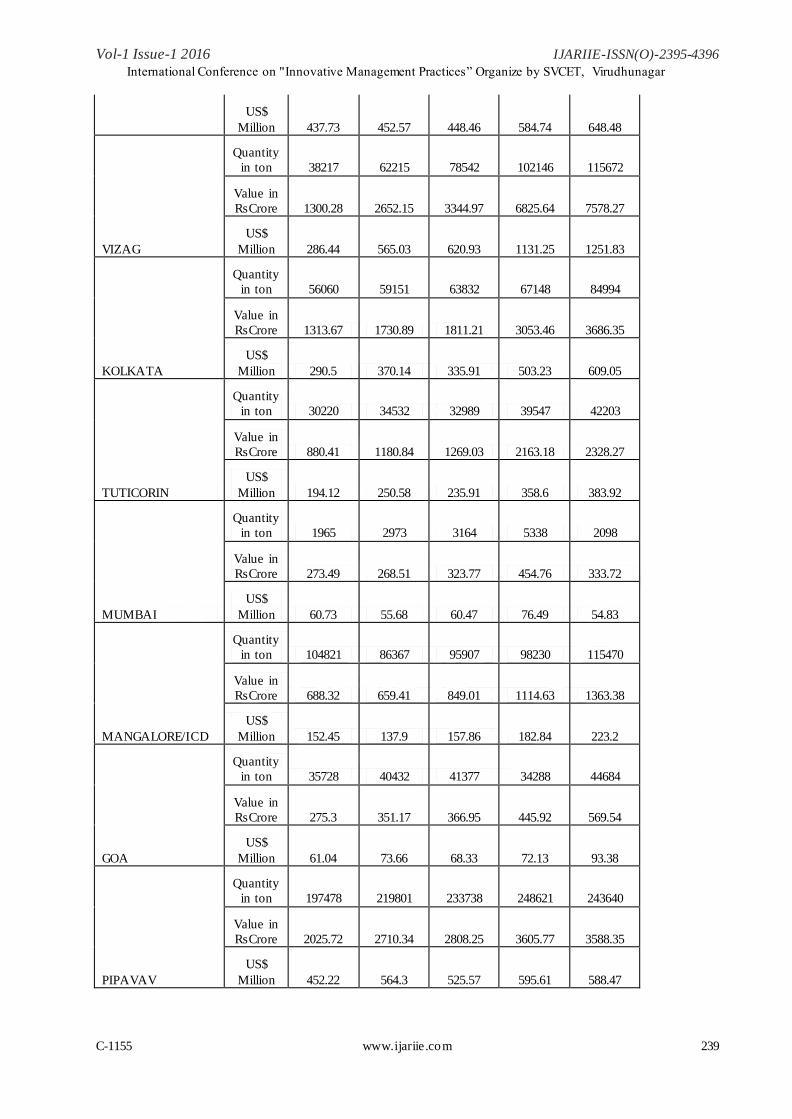
Port Wise Export of Marine Products from India
Port 2010-11 2011-12 2012-13 2013-14 2014-15
CHENNAI
Quantity
in ton 55961 46184 53596 55282 46671
Value in
RsCrore 1979.76 1847.88 2062.72 2709.97 2458.2
US$
Million 436.77 394.61 383.46 456.79 405.71
KOCHI
Quantity
in ton 121550 152445 162109 160798 162818
Value in
RsCrore 1892.14 2859.02 3265.64 4491.03 4989.86
US$
Million 418.1 605.25 608.8 748.69 822.23
J N P
Quantity
in ton 155829 148891 145723 142073 149585
Value in
RsCrore 1970.65 2151.66 2399.8 3531.36 3939.46
Vol-1 Issue-1 2016 IJARIIE-ISSN(O)-2395-4396 International Conference on "Innovative Management Practices” Organize by SVCET, Virudhunagar
C-1155 www.ijariie.com 239
US$
Million 437.73 452.57 448.46 584.74 648.48
VIZAG
Quantity
in ton 38217 62215 78542 102146 115672
Value in
RsCrore 1300.28 2652.15 3344.97 6825.64 7578.27
US$
Million 286.44 565.03 620.93 1131.25 1251.83
KOLKATA
Quantity
in ton 56060 59151 63832 67148 84994
Value in
RsCrore 1313.67 1730.89 1811.21 3053.46 3686.35
US$
Million 290.5 370.14 335.91 503.23 609.05
TUTICORIN
Quantity
in ton 30220 34532 32989 39547 42203
Value in
RsCrore 880.41 1180.84 1269.03 2163.18 2328.27
US$
Million 194.12 250.58 235.91 358.6 383.92
MUMBAI
Quantity
in ton 1965 2973 3164 5338 2098
Value in
RsCrore 273.49 268.51 323.77 454.76 333.72
US$
Million 60.73 55.68 60.47 76.49 54.83
MANGALORE/ICD
Quantity
in ton 104821 86367 95907 98230 115470
Value in
RsCrore 688.32 659.41 849.01 1114.63 1363.38
US$
Million 152.45 137.9 157.86 182.84 223.2
GOA
Quantity
in ton 35728 40432 41377 34288 44684
Value in
RsCrore 275.3 351.17 366.95 445.92 569.54
US$
Million 61.04 73.66 68.33 72.13 93.38
PIPAVAV
Quantity
in ton 197478 219801 233738 248621 243640
Value in
RsCrore 2025.72 2710.34 2808.25 3605.77 3588.35
US$
Million 452.22 564.3 525.57 595.61 588.47

Vol-1 Issue-1 2016 IJARIIE-ISSN(O)-2395-4396 International Conference on "Innovative Management Practices” Organize by SVCET, Virudhunagar
C-1155 www.ijariie.com 240
TRIVANDRUM
Quantity
in ton 2932 2867 3131 3180 2955
Value in
RsCrore 105.61 117.54 143.56 164.19 141.56
US$
Million 23.33 24.56 26.72 27.41 23.3
KANDLA
Quantity
in ton 124 0 0 0 0
Value in
RsCrore 1.75 0 0 0 0
US$
Million 0.4 0 0 0 0
PORBANDAR
Quantity
in ton 0 0 0 0 20
Value in
RsCrore 0 0 0 0 0.9
US$
Million 0 0 0 0 0.15
KAKINADA
Quantity
in ton 0 0 0 62 0
Value in
RsCrore 0 0 0 3.74 0
US$
Million 0 0 0 0.62 0
PARADEEP
Quantity
in ton 0 0 0 0 413
Value in
RsCrore 0 0 0 0 8.98
US$
Million 0 0 0 0 1.47
CALICUT
Quantity
in ton 132 403 1159 1720 980
Value in
RsCrore 4.36 11.77 26.65 51.14 34.66
US$
Million 0.97 2.48 4.95 8.68 5.74
DELHI
Quantity
in ton 0 34 242 0 147
Value in
RsCrore 0 4.94 17.67 0 5.92
US$
Million 0 1.05 3.27 0 0.97
HALDIA
Quantity
in ton 0 28 0 0 0

Vol-1 Issue-1 2016 IJARIIE-ISSN(O)-2395-4396 International Conference on "Innovative Management Practices” Organize by SVCET, Virudhunagar
C-1155 www.ijariie.com 241
Value in
RsCrore 0 0.33 0 0 0
US$
Million 0 0.07 0 0 0
KARWAR
Quantity
in ton 0 0 56 0 42
Value in
RsCrore 0 0 0.62 0 1.47
US$
Million 0 0 0.11 0 0.24
MUNDRA
Quantity
in ton 263 573 8274 3201 1026
Value in
RsCrore 3.79 11.15 119.96 49.68 14.28
US$
Million 0.84 2.28 22.32 8.4 2.35
AHMEDABAD
Quantity
in ton 432 87 44 97 224
Value in
RsCrore 124.94 4.77 1.4 3.03 6.74
US$
Million 27.81 1.04 0.26 0.48 1.1
AGARTALA
Quantity
in ton 0 105 0 97 54
Value in
RsCrore 0 0.24 0 0.17 0.24
US$
Million 0 0.05 0 0.03 0.04
NSICT
Quantity
in ton 0 0 0 0 1
Value in
RsCrore 0 0 0 0 0.11
US$
Million 0 0 0 0 0.02
KARIMGANJ
Quantity
in ton 51 19 17 153 56
Value in
RsCrore 0.14 0.04 0.04 0.32 0.16
US$
Million 0.03 0.01 0.01 0.05 0.03
MID SEA
Quantity
in ton 7600 1963 46 0 0
Value in
RsCrore 52.23 21.68 0.63 0 0

Vol-1 Issue-1 2016 IJARIIE-ISSN(O)-2395-4396 International Conference on "Innovative Management Practices” Organize by SVCET, Virudhunagar
C-1155 www.ijariie.com 242
US$
Million 11.44 4.56 0.11 0 0
HILL LAND
CUSTOMS
Quantity
in ton 3714 2736 3109 1604 144
Value in
RsCrore 8.35 6.62 13.91 5.21 1.34
US$
Million 1.85 1.36 2.56 0.88 0.22
OKHA
Quantity
in ton 0 0 0 0 0
Value in
RsCrore 0 0 0 0 0
US$
Million 0 0 0 0 0
PORT BLAIR
Quantity
in ton 0 1 0 0 0
Value in
RsCrore 0 0.01 0 0 0
US$
Million 0 0 0 0 0
HYDERABAD
Quantity
in ton 2 85 386 173 719
Value in
RsCrore 0.03 3.24 11.48 5.49 0
US$
Million 0.01 0.68 2.13 0.93 0
VERAVAL
Quantity
in ton 0 101 0 0 0
Value in
RsCrore 0 1.77 0 0 0
US$
Million 0 0.34 0 0 0
BANGALORE
Quantity
in ton 3 8 479 388 810
Value in
RsCrore 0.22 0.81 6.23 7.75 10.12
US$
Million 0.05 0.17 1.15 1.25 1.67
TRICHY
Quantity
in ton 10 22 1 14 32
Value in
RsCrore 0.31 0.44 0.03 1.13 3.31
US$
Million 0.07 0.1 0.01 0.2 0.54
Vol-1 Issue-1 2016 IJARIIE-ISSN(O)-2395-4396 International Conference on "Innovative Management Practices” Organize by SVCET, Virudhunagar
C-1155 www.ijariie.com 243
KRISHNAPATNAM
Quantity
in ton 0 0 294 19594 30690
Value in
RsCrore 0 0 12.72 1525.62 2066.14
US$
Million 0 0 2.36 248.37 341.51
SURUT (INHZA)
Quantity
in ton 0 0 0 1 101
Value in
RsCrore 0 0 0 0.09 7.33
US$
Million 0 0 0 0.01 1.21
Total
Quantity
in ton 813091 862021 928215 983756 1051243
Value in
RsCrore 12901.47 16597.23 18856.26 30213.26 33441.61
US$
Million 2856.92 3508.45 3511.67 5007.7 5511.12
HAZIRA
US$
Million 0 0 0 0 4.56
Quantity
in ton 0 0 0 0 423
Value in
RsCrore 0 0 0 0 27.63
KATTUPALLI
Quantity
in ton 0 0 0 0 4571
Value in
RsCrore 0 0 0 0 248.4
US$
Million 0 0 0 0 40.47
Source:MPEDA
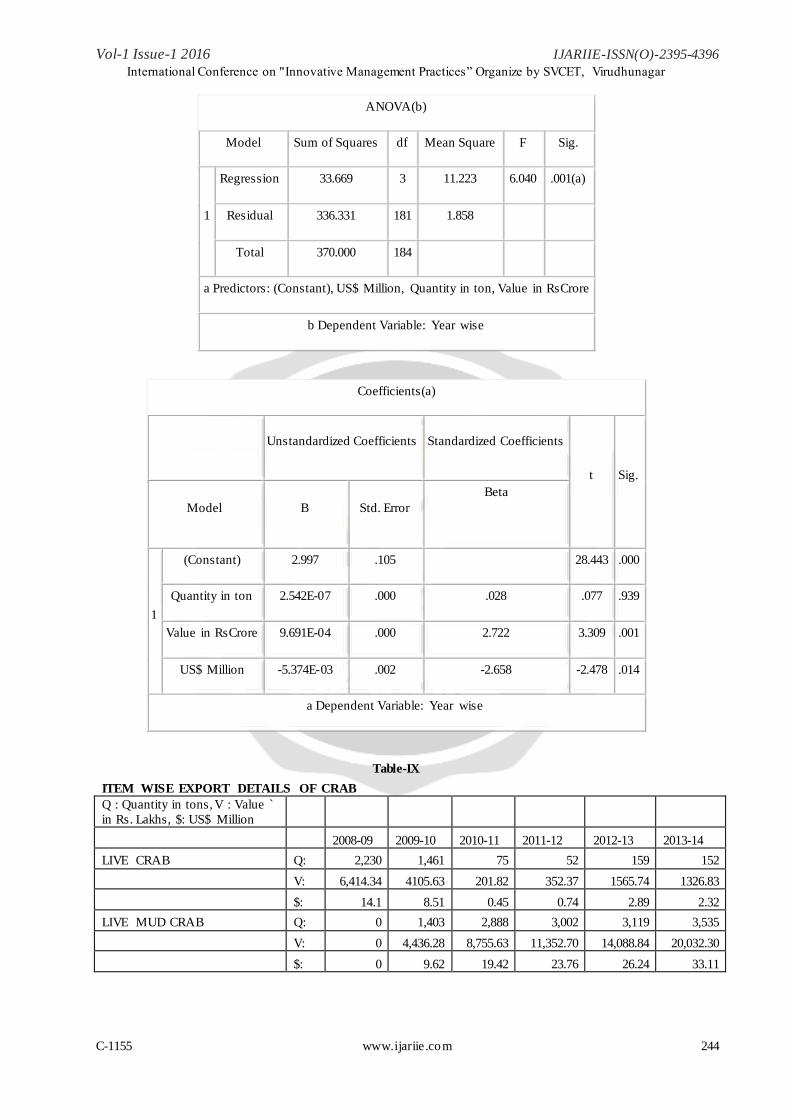
Port wise Export Performance
Regression
Model Summary
Model R R Square Adjusted R Square Std. Error of the Estimate
1 .302(a) .091 .076 1.363
a Predictors: (Constant), US$ Million, Quantity in ton, Value in RsCrore
Vol-1 Issue-1 2016 IJARIIE-ISSN(O)-2395-4396 International Conference on "Innovative Management Practices” Organize by SVCET, Virudhunagar
C-1155 www.ijariie.com 244
ANOVA(b)
Model Sum of Squares df Mean Square F Sig.
1
Regression 33.669 3 11.223 6.040 .001(a)
Residual 336.331 181 1.858
Total 370.000 184
a Predictors: (Constant), US$ Million, Quantity in ton, Value in RsCrore
b Dependent Variable: Year wise
Coefficients(a)
Unstandardized Coefficients Standardized Coefficients
t Sig.
Model B Std. Error
Beta
1
(Constant) 2.997 .105 28.443 .000
Quantity in ton 2.542E-07 .000 .028 .077 .939
Value in RsCrore 9.691E-04 .000 2.722 3.309 .001
US$ Million -5.374E-03 .002 -2.658 -2.478 .014
a Dependent Variable: Year wise
Table-IX
ITEM WISE EXPORT DETAILS OF CRAB
Q : Quantity in tons, V : Value `
in Rs. Lakhs, $: US$ Million
2008-09 2009-10 2010-11 2011-12 2012-13 2013-14
LIVE CRAB Q: 2,230 1,461 75 52 159 152
V: 6,414.34 4105.63 201.82 352.37 1565.74 1326.83
$: 14.1 8.51 0.45 0.74 2.89 2.32
LIVE MUD CRAB Q: 0 1,403 2,888 3,002 3,119 3,535
V: 0 4,436.28 8,755.63 11,352.70 14,088.84 20,032.30
$: 0 9.62 19.42 23.76 26.24 33.11
Vol-1 Issue-1 2016 IJARIIE-ISSN(O)-2395-4396 International Conference on "Innovative Management Practices” Organize by SVCET, Virudhunagar
C-1155 www.ijariie.com 245
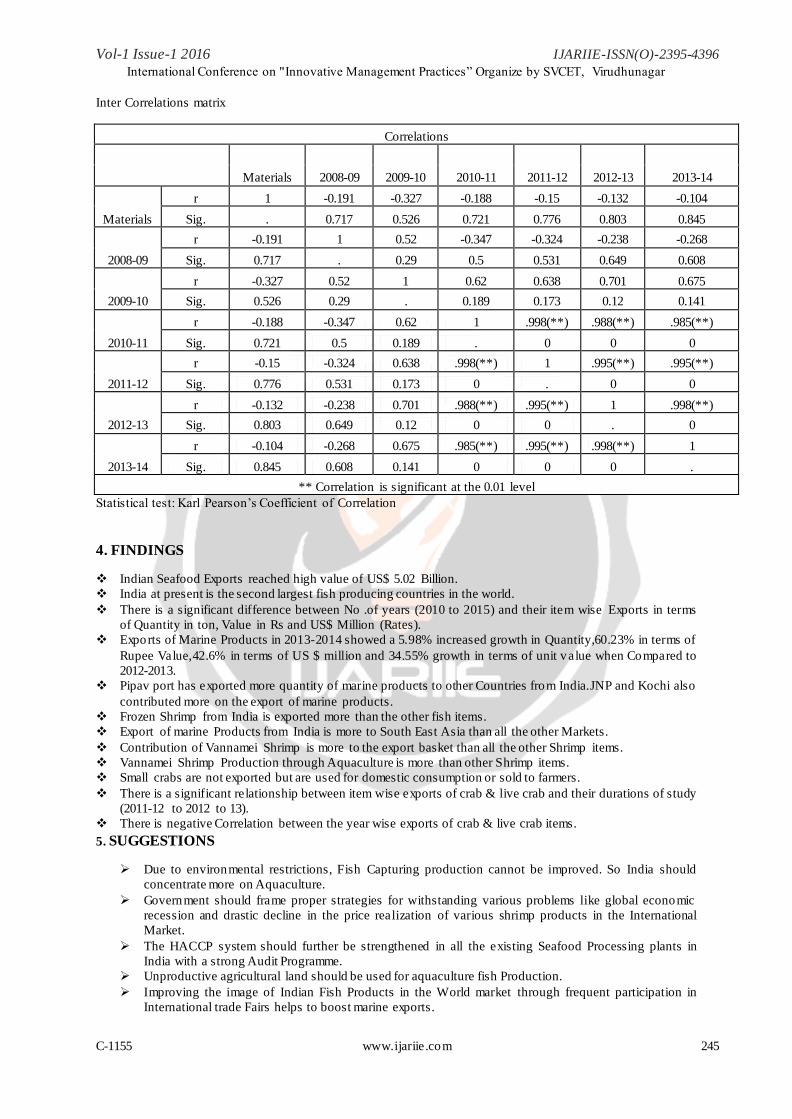
Inter Correlations matrix
Correlations
Materials 2008-09 2009-10 2010-11 2011-12 2012-13 2013-14
Materials
r 1 -0.191 -0.327 -0.188 -0.15 -0.132 -0.104
Sig. . 0.717 0.526 0.721 0.776 0.803 0.845
2008-09
r -0.191 1 0.52 -0.347 -0.324 -0.238 -0.268
Sig. 0.717 . 0.29 0.5 0.531 0.649 0.608
2009-10
r -0.327 0.52 1 0.62 0.638 0.701 0.675
Sig. 0.526 0.29 . 0.189 0.173 0.12 0.141
2010-11
r -0.188 -0.347 0.62 1 .998(**) .988(**) .985(**)
Sig. 0.721 0.5 0.189 . 0 0 0
2011-12
r -0.15 -0.324 0.638 .998(**) 1 .995(**) .995(**)
Sig. 0.776 0.531 0.173 0 . 0 0
2012-13
r -0.132 -0.238 0.701 .988(**) .995(**) 1 .998(**)
Sig. 0.803 0.649 0.12 0 0 . 0
2013-14
r -0.104 -0.268 0.675 .985(**) .995(**) .998(**) 1
Sig. 0.845 0.608 0.141 0 0 0 .
** Correlation is significant at the 0.01 level
Statistical test: Karl Pearson’s Coefficient of Correlation
4. FINDINGS
Indian Seafood Exports reached high value of US$ 5.02 Billion.
India at present is the second largest fish producing countries in the world.
There is a significant difference between No .of years (2010 to 2015) and their item wise Exports in terms
of Quantity in ton, Value in Rs and US$ Million (Rates).
Exports of Marine Products in 2013-2014 showed a 5.98% increased growth in Quantity,60.23% in terms of
Rupee Value,42.6% in terms of US $ million and 34.55% growth in terms of unit v alue when Compared to
2012-2013.
Pipav port has exported more quantity of marine products to other Countries from India.JNP and Kochi also
contributed more on the export of marine products.
Frozen Shrimp from India is exported more than the other fish items.
Export of marine Products from India is more to South East Asia than all the other Markets.
Contribution of Vannamei Shrimp is more to the export basket than all the other Shrimp items.
Vannamei Shrimp Production through Aquaculture is more than other Shrimp items.
Small crabs are not exported but are used for domestic consumption or sold to farmers.
There is a significant relationship between item wise exports of crab & live crab and their durations of study
(2011-12 to 2012 to 13).
There is negative Correlation between the year wise exports of crab & live crab items.
5. SUGGESTIONS
Due to environmental restrictions, Fish Capturing production cannot be improved. So India should
concentrate more on Aquaculture.
Government should frame proper strategies for withstanding various problems like global economic
recession and drastic decline in the price realization of various shrimp products in the International
Market.
The HACCP system should further be strengthened in all the existing Seafood Processing plants in
India with a strong Audit Programme.
Unproductive agricultural land should be used for aquaculture fish Production.
Improving the image of Indian Fish Products in the World market through frequent participation in
International trade Fairs helps to boost marine exports.
Vol-1 Issue-1 2016 IJARIIE-ISSN(O)-2395-4396 International Conference on "Innovative Management Practices” Organize by SVCET, Virudhunagar
C-1155 www.ijariie.com 246
More Mud Crab Hatcheries need to be established to meet the demand of India’s mud Crab Farming
Industry and for meeting the global demand.
Continuous refinement is required to improve the economic viab ility of producing Crab lets and adult
mud crabs.
Harvesting techniques to be Improved and certification of hatcheries need to be done.
6. CONCLUSION
India has good prospects of becoming a dominant supplier of seafood in the international market. The opening
up of the economy and liberalized Industrial policy of India helped to gain a lot in the field. The aquaculture
industry is rapidly developing. The vast untapped resources can be utilized successfully to uplift India’s marine
products export trade in the international Market.
7. REFERENCE
1) Krishnan G.,”Potential for Development and Challenges for theDevelopment of Marine Industry in
India” Seafood Export Journal,XXIV(7):5-8,1992.
2) Tharakan.A.J.(1999),”Strategy and Action plan to achieve US $2 Billion per annum Seafood exports
by year 2000,” twelfth Indian Seafood Trade Fair, Souvenir, the Seafood Exporters Association of
India,Cochin,pp:7-12.
3) Chandrasekaran, V. S and Natarajan, R. (1994). Seasonal abundance and distribution of seed of mud
crab ScyllaserratainPichavaram mangrove, south east India.
4) Marichamy, R and Rajapackiam, S.2001. The aquaculture Scylla species in India, Asian Fisheries
Science.14, 231-238.
5) Annual reports of MPEDA.2002-2012.The Director, Marine Product Export Development Authority,
MPEDA House, P Nagar, Ernakulam, Kerala 680036, India.