an evaluation of group therapy using the 16 pf, mmpi, and tat · review of related literature...
TRANSCRIPT
Loyola University ChicagoLoyola eCommons
Master's Theses Theses and Dissertations
1971
An Evaluation of Group Therapy Using the 16 PF,MMPI, and TATBede SmithLoyola University Chicago
This Thesis is brought to you for free and open access by the Theses and Dissertations at Loyola eCommons. It has been accepted for inclusion inMaster's Theses by an authorized administrator of Loyola eCommons. For more information, please contact [email protected].
This work is licensed under a Creative Commons Attribution-Noncommercial-No Derivative Works 3.0 License.Copyright © 1971 Bede Smith
Recommended CitationSmith, Bede, "An Evaluation of Group Therapy Using the 16 PF, MMPI, and TAT" (1971). Master's Theses. Paper 2605.http://ecommons.luc.edu/luc_theses/2605

AN EVALUATION OF GROUP THERAPY
USING THE 16 PF, MMPI, AND TAT
PY
Bede Smith
A Thesis submitted to the Faculty of the Graduate
School of Loyola University in Partial Fulfillment
of the Requirements for the degree of
~aster of Arts
December, 1971

ABSTRACT
The 16 PF, MMPI, and TAT were used to evaluate ·personality changes in 35 male college students as a result of participation in a disclosure-confrontation group session, using measures related to anxiety, ego strength, and level of motivation. The participants were tested before the session and one month following it. A control group of 35 male college students were tested before and after an equivalent interval.
Participants in a DC group session showed a decrease in anxiety and an increase in ego strength, as measured by 16 PF factors and MMPI clinical scales. The control group snowed similar changes in anxiety and ego strength, although the changes on the MMPI scales were not at as high a level of significance as in the group of participants.
The Motivation Index from Story Sequence Analysis of the TAT increased significantly after participation in the DC group. session but did not cha!l'.lge in the c·ontrol group.
ACKNOWLEDGEMENT Sc
The author wishes to thank Dr. Magda Arnold who
guided and encouraged this study and who worked earnest
hours going over the data. Her sincere and undaunted
search for truly understanding the human person has had,
a profound influence on the author.
To Dr. Donald J. Tyrell, whose courage and commit
ment to people have led through risky areas of uncharted
clinical practice and persona-1 living, this study ex
presses hope that his explorations.have been fruitful.
Dr. J~hn Shack has patiently gone over drafts of
this study and provided welcome and needed_ guidance.
This has been appreciated.
i

LIFE
Bede Smith was born in Monroe City, Missouri, on
September 16, 1942.
He entered Divine Word Seminary in Duxbury, Massa
chusetts in 1958, and received his B.A. in philosophy
from Divine Word College, Conesus, New York. From De
Paul University, Chicago, he received the Bachelor of
Science degree in biology in 1966.
Theological studies were begun at Divine Word Sem
inary, Techny, Illinois, and continued at Notre Dame
University where, in 1969, he ~eceive~ the M. Th. degree.
In September, 1970, graduate ~tudies in psychology
were begun at Loyola University. He is presently serving
his internship in the Veterans Administrat~on training
program for clinical psychologists at Hines, Illinois.
ii

CHAPl'ER
I.
II.
III.
IV.
v. VI.
.REFERENCES
APPENDIX
I.
II.
III.
IV.
v.
• •
.TABLE OF CONTENTS
INTRODUCTION. • • • • • • • • • • • • • •
REVIEW OF RELATED UTERATURE. • • • • • •
METHOD. • • • • • • • . • • • • . • • • •
RESULTS • • • • • • • • • • • • • • • . •·
DISCUSSION. • • • • • • • • • • • • • • •
SUMMARY . • • • • • • • • • • • • • . • .
• • • • • • • • • • • • • • • • • •• • • •
16 PF DATA: CONTROL GROUP •••• • • • •
16 PF DATA: EXPERIMENTAL GROUP. • • • • •
PAGE
l
3
45
49
70
75
79
85
93
MMPI DATA: CONTROL GROUP. • • • • • • • • 101
MMPI DATA: EXPERIMENTAL GROUP • • • • • • 105
TAT DATA • • • • • • • • • • • • • • • • 109
iii

TABLE
. LIST OF TABLES I
PAGE
Factors of the 16 PF • • • • . :.. . • • • • • • 50
2. 16 PF: Group Means and Standard Deviations Control Group • • • • • • • • • • • • 51
3. 16 PF: Group Means and Standard Deviations Experimental Group. • • • • • • • • • 52
4. MMPI: Group Means and Standard Deviations Control Group • • • • • • • • • • • • 56
5. MMPI: Group Means and Standard Deviations Experimental Group. • • • • • • • • • 57
6. 16 PF: t-test on Differences between Group ·Means of Experimental and Control Groups. • • • • • • • • • • • 59
7. MMPI: t-test on Differences between -Group Means of Experimental and
Control Groups. • • • · • • • • • • • • 60
8. 16 PF: t-test on DL.·ect Difference of 'individual Scores ••••••
9. MMPI: t-test on Direct Difference of -Individual Scores • • • • . • •
10. TAT: Non-parametric Tests on Motivation Index • • . • • . • ... • • • .
iv
• • 62
. . • 65
• . • 67

CHAPTER I
.INTRODUCTION
New approaches to psychotherapy generally arise in the clinic rather
than in the laboratory. Unlike drugs, which are developed and tested before
they are applied, new therapeutic techniques are typically "invented" and
applied before they are researched. This fact, noted by Bergin and Strupp
(1970) in their review of new directions in psychotherapy, leads to a gap
between the practices of the clinician and the theories that loosely artic
ulate his practices as well as the research that tests them. The innovative
clinician is more in the forefront of new therapeutic approaches than the
researcher. However, _once a new therapeutic approach is found effective by
the clinician in practice~ it still needs to be analyzed. Its effectiveness
needs to be more rigorously evaluated lest too much be made of startling but
scattered successes. Mechanisms and variables need to be isolated, case
experiments need to be planned, so that the method can be refined and tested.
The following study intends to investigate personality changes that
occur following participation in a disclosure-confrontation group session.
This form of group therapy has been developed and employed by Donald J.
Tyrell in his clinical practice but has not yet been subjected to thorough
research. This study aims to determine whether any changes occur in partic
ipants of such sessions, what these changes are, and whether they can be
considered therapeutically beneficial. It is hypothesized that changes

2
which do occur will be reflected in the measures used. If these changes
significantly differ from the records of a control group tested over an
equivalent period of time, it is suggested that they are due to the inter
vention of the disclosure-confrontation session. Specifically, it is
hypothesized that the level of anxiety will decrease, the level of ego
·strength will increase, and motivation will change in a positive direction.
CHAPI'ER II
REVIEW OF RELATED LITERATURE
Research in psychotherapy may be concerned either with the outcome
or with the process of psychotherapy (Meltzof! and Kornreich, 1970). Research
on the outcome of therapy concentrates on discovering whether a therapy is
effective or not and determining what the' effects 'are. Research on the pro
cess of therapy aims at isolating variables within the therapy itself that
account for the changes observed. Examples of process research in psycho
therapy include studies where different methods of therapy are compared to
determine their relative merits, where a particular therapy is applied to
different pathologies to determine its specific effectiveness in each case,
where a particular type of therapy is employed by different therapists to
determine whether its effectiveness is idiosYn.cratic to specific therapi\s.
Process studies would ordinarily follow outcome studies since it is first
necessary to know ~ the effects of therapy are and whether it does what
the therapist claims for it (outcome) before proceeding to investigate h2:!
or why or under what circumstances it is effective (process). A new thera
peutic approach is generally ushered on the scene with a wave of enthusiasm
and carried along the crests marked by instances of success. But the surge
of enthusiasm must meet the hard facts of controlled research to prevent the
brightness of initial successes from plinding one to contrary instances. The
optimism of an innovator should welcome critical assessment.

4
The following study is concerned with the outcome of disclosure-
confrontation sessions, not with the process. It concerns the whether
and ~ of the effects and not the h2:! and why. By the design of the
study, it cannot compare this form of therapy to other forms since there
is no control for other forms of therapy. It aims only at finding the ef-
fects of the therapy in contrast to controls without therapy. However, to
understand what the therapy consists in, the review of literature will in-
elude a description of disclosure-confrontation therapy as it; compares to
related therapies as well as an evaluation of the specific measures used
in the study.
Disclosure-confrontation Therapx
An extensive description of disclosure-confrontation (DC) therapy is
given by Donald J. Tyrell in When Love is Lost (Waco, Texas: Word Preas, . --- -- - _...,
1971, in press). It can be considered as individual therapy in a group set-
ting, for in this open-ended session confrontation is focused on one indi-
vidual at a time until he comes to some resolution of whatever conflict
remains if' possible. Each person in the group commits himself to stay until
the group decides it has gone as far as it can to resolve the problems of
each individual. He also commits himself to be as open and honest with the
group about his past and present behavior and feelings as he can. The same
commitment is made by the" therapists. As dishonesties and hiding become
known to the therapists in the session, the person is confronted with these
at whatever level of personality it is relevant. Particular techniques are
employed to bring about exposure when di~closure is not spontaneous or
5
complete. Such techniques aim at recreating as vividly as possible, either
in reality or in imagination, the barriers to self-disclosure so that the
person can face them and get beyond them. These barriers are emotional
trauma and habits or value conflict. Verbal confrontation exposes inconsis
tencies and gaps in the person's self-disclosure or value system. Physical
·confrontation may be used to provide a corrective emotional experience. The
corrective experience consists in allowing the person to express his fear,
anger, or affection in a safe situation without punishment or ridicule. When
the corrective experience cannot be re-enacted.in reality, an attempt is made
to do this through imagination. Techniques involving imagination include
forced or implosive fantasy {Stampfl and Levis, 1967) and.Jung's free fantasy
technique. The essence of the therapy, however, does not consist in the
particular technique employed on occasion, but in the honest disclosure of
oneself to others. Only when this disclosure is not spontaneous are techniques
employed.
More clarification of the nature of DC therapy can be had by comparing
and contrasting it with similar group therapies. Various forms of group
therapy have much in common and the differences are not always so apparent.
When "ground rules" are clearly indicated, differences are quickly seen, but
often differences are a matter of the emphasis of the group, its goal,
the theoretical orientation {e.g. behavior therapy, psychoanalytic, sensi
tivity, transactional analysis), or the personal approach of the therapist
and his involvement.
In terms of the goals of. therapy, DC group sessions are similar to
Mowrer's Integrity Groups (1969). The three cardinal principles behind

,
6
Integrity Groups are honesty, responsibili~y, and emotional.involvement.
Mowrer stresses all three of these elements as the tripod to uphold Int9grity
Groups. This triad he shares with Mainord (1968) whose contract states that
(1) the patient must agree to be completely open with the group, (2) he must
accept total responsibility for all his behavior (acting according to his
own ethical code), and (3) each patient must accept responsibility for every
other patient in the program. Mainord's tripod of openness, responsibility,
and involvement becomes for Mowrer: honesty, responsibility, and emotional
involvement. For Mowrer, a person's discomfort as a "neurotic" has developed
primarily because of bad choices and habits, arid "therapy" aims to help him
become more honest, more responsible, and more.involved. In contrast to the
reality therapy of Glasser (1965) who stresses responsibility and involve
ment, but says little of honesty; and in contrast to Jourard (1964) who
stresses honesty and involvement rather than responsibility; Mowrer insists
on all three of these principles.
The tripod for DC therapy is similar to Mowrer 1s: it is truth,
freedom, and care. The goals aimed for in the participant and his relation
to others in the group, and afterwards to the significant persons in his life,
are that he be truthful, free, and caring. Lest this seem only a se.mantic
difference from Mowrer, clarification will be helpful. Although it is hoped
that the participant reach-a greater degree of these three qualities in his
relationships, they are not the contract of the participant nor is there any
promise that he will achieve them as a result of the session. His commitment
is rather to be as open and honest (truthful) as he can be, and responsible
enough to remain in the session until the group nas decided that it has gone
7
as far as possible. He is committed to be truthful (both honest by not
lying, and open by not hiding), but the only commitment he makes to the
group beforehand is to remain with it. Like Mowrer, DC therapy recognizes
the difference between honesty at various levels of personality, between
the intellectual openness and honesty of giving an accurate account of
overt actions and the emotional honesty that accompanies them. In fact,
most of the dishonesty met on sessions is emotional, since usually partici
pants are capable of and committed to intellectual honesty, but they may
be quite unaware of their emotional dishonesty.
Corresponding to Mowrer's stres~ on responsibility, DC therapy aims
to increase the range of freedom that a person is capable of. It assumes
that responsibility is the consequence of freedom and that being free is a
condition for real responsibility. This range of freedom is increased by
facing the fears that keep a person from acting responsibly and by making
him more aware of the consequences of his actio~s or inact~on on others.
Rather than emotional involvement, DC therapy stresses care. But
this is not a commitment demanded of the participant. Care usually implies
an emotional involvement, but more fundamentally it requires a decision to
act toward another person's benefit. The probl~m is often to distinguish
between care and emotional involvement, how one's fear, anger, or affection
toward another is to be appropriately expressed. Emotional involvement is
not the goal of DC therapy;' but caring for oneself and others is.
Like Integrity Groups, DC therapy does not consider people on a sick
healthy continuum, but on the line from immaturity to maturity. It holds
that a person is immature (not "neurotic") primarily because of bad choices
and habits. However, it recognizes the effects of emotional experiences in
8
a person's life and aims to supply corrective experiences for them. As
faulty intellectual and moral habits must be corrected on an intellectual
or moral level, so faulty emotional experiences must be dealt with on an
emotional level. But DC therapy, like Mowrer's Integrity Groups, might be
accused of being "moralistic'' in insisting that a mature person sets goals
and makes choices for wB:ich he is held responsible.
Mowrer (1969) sets down seven ground rules for Integrity Groups:
(1) There is no physical violence or threat of physical violence. Violation of this rule may be just cause for summary expulsion of the offending individual from the group. (2) No one leaves a group session when he is under challenge or "upset." Persons freely come and go for any minor reason, but if a person is having a "run" and becomes "involved" with another individual or the group as a whole, he stays on and sees it through before leaving the room. (3) There is no Red-Crossing or rat-packing. When one individual is under challenge, another person does not go to his aid until the nature of the challenge has been made completely clear and the merits of the case reviewed. Also, if a person is spontaneously expressing emotional or moral pain, he is not to be given spurious assistance or reassurance. On the other hand, we are very concerned about justice and never want a group to "gang-up" on a given member. (4) There is no restriction as to what language may be used in a group. (5) There is.no "sub-grouping," i.e. what is called "Whispering" in grammar schools. If you have "something to say," then it is ordinarily said to the group as a whole. (6) All conversation and action that transpire in a group are strictly confidential. {7) Each newcomer is asked to commit himself to the three principles of Honesty, Responsibility, and Involvement--and to be open to challenge in regard to his nonpractice of any of these. He also commits himself to attend six consecutive meetings of the group, at which time he may leave 'if'"he chooses.
DC therapy differs particularly on two of these. Physical violence
is dealt with. No one is "given permission" to act out his anger physically,
but i! this is necessary for him to !ace his feelings honestly, he is I'',
confronted on this level. ,It is a man's fear that in his anger he might hurt
others or himself that prevents him often from facing his anger. It is

9
considered worth the physical danger to deal with this fear·rather than to
bring a person to the point of physical aggression and then back off or
threaten expulsion from the group. He may not, however, attack anyone in
the group except the therapists who are willing to face the possible danger.
The commitment asked in DC therapy is that the person be honest and
open and stay until the group session is finished. He must also see some
need for change in his life before he is admitted. To this extent it re
sembles the honesty, responsibility, and involvement commitment in Integrity
Groups.
Mowrer is oriented toward behavior therapy and would lean toward
standard behavior modification techniques such·as desensitization (Wolpe,
1961) or implosive therapy (Stampfl and Levis, 1967), although he himself
does not employ them. It is noted that implosive therapy is often used in
the DC $ession. The group setting can add a further dimension to the implo
sive technique. After having faced an implosive procedure, acceptance by
a group is a powerful reinforcement for having successfully dealt -;fl.th an
anxiety. In some instances, the group becomes a part of the implosive
therapy itself. A person afraid of being left alone, may be in fact "left
alone" by the group while he is being further subjected to an imaginative
sequence of being alone and abandoned. His subsequent return to the group
assures him that fearful possibilities he vividly imagined did not eventuate
and the corrective experience with the group present again helps him deal
with the fear in the future.
DC therapy and Integrity Groups.differ also, of course, on the time
arrangement. Integrity Groups meet periodi~ally (-weekly) for two or three

10
hours at a time; DC therapy is an open-end~d single session. A person might
attend another session later but that would be independently determined.
Being an open-ended session makes DC therapy like the marathon
sessions of George Bach. Bach (1966, 1967) states that the purpose of the
marathon group is to intensify transparency and genuine encounter by a delib-
erate instigation of group pressure focused on behavioral change. Bach and
Mowrer, like DC therapy, stress behavioral change and leveling with one another,
no sub-grouping, and confidentiality. Both Bach and DC therapy use a time-
extended session, but the purpose of being open-ended in DC therapy is not to
"pressure-cook" or induce fatigue. It is rather to allow time for defenses
to drop and to insure that all problems can be ·adequately dealt with before
leaving. Unfortunately, the word "marathon" applied to an open-ended group
session often connotes the physical fatigue and endurance contests associated
with gymnastic events or dance marathons. The session is open-ended not to
wear down, but to insure that issues raised can be dealt with and to prevent
people from leaving the session with unresolved problems simply because time
is up. It also discourages a person from holding out, thereby hoping to escape
dealing with himself and others in the group.
Bach, like Mowrer, also outlaws all forms of physical violen.ce. But
he does stress aggressive verbal confrontation as therapeutically helpful
and presents data to suppo~t this (1967).
Bach and Mowrer use "techniques", but only under spe·cial circumstances.
Both share with DC therapy hesitation in the use of techniques because they
can distract from the main goal of the group--the honest self-disclosure of
one person to another.
11
Bach stresses the here and now behavior in the group rather than - -the why and where .!£2!!! of behavior. DC therapy is concerned mainly about
the here and now, but recognizes the effect of emotional habits and life
styles built up over years of habit.
Both Bach and Mowrer employ a selection procedure for their groups,
as does DC therapy. Mowrer uses an Intake Interview that resembles aubse-
quent Integrity Group sessions. Bach selects persons according to their
attitudes toward self-change and group constellations. Like DC therapy, the
participants must convince the co-therapists that they are anxious to make
significant changes. DC therapy selects participants on the basis of at
least one clinical interview and a test battery including the 16 Personality
Factor Questionnaire, the Minnesota Multiphasic Personality Inventory, the
Thematic Apperception Test, and a Sentency Completion Form.
Bach stresses the therapy role of eve~ member in the group. This is
true also of DC groups, although the therapists·play a large role and are not
":facilitators" in the background. In DC therapy sessions, there are at least
two co-therapists and usually more than two. The therapists are participants
like others, particularly in self-disclosure. The importance of self-disclo-
sure on the part of the therapist is emphasized by Jourard (1964); in DC
therapy, the commitment to honest self-disclosure is made by the therapists
as well as the other participants.
This similarity to the approaches of Mowrer, Bach, and Jourard will
distinguish DC groups from most forms of group work including "sensitivity
groups," T-groups, and nude marathons such as Bin~im's (1968). Although
denuding is employed in DC therapy when .. intellectual and emotional
exposure cannot be attained, it is by no means essential to the approach
12
and is not the aim of the session nor is it used to explore feelings arbi-
trarily.
~ Evaluation of TheraPl
The difficulties of psychotherapy research elaborated by Meltzoff
and Kornreich (1970) provide some criteria by which to evaluate further
studies. Particularly the debate between Eysenck (1952, 1954, 1955, 1960,
1964) and others (Rosenszweig, 1954; DeCharms, Levy, and Wertheimer, 1954;
Luborsky, 1954; Cartwright, 1955; and Strupp, 1963) has ptit the burden of
proof on those who are trying to establish that therapy is more effective
than non-therapy. Eysenck's earlier statements ~ere based on selected
studies, but most of those responding to his critique missed the point of
his argument: the possibility ha~ not been disproved that the differences
between therapy and non-therapy might be chance variations. Meltzoff and
Kornreich (1970) give a review of the debate and point out that Eysenck had
missed many studies of therapy. They point out that the myth that controlled
evaluative studies on psychotherapy have not been done has been passed on by
those who "relied upon Eysenck's review but did not (them .. selves) review the
literature in depth" (p. 74). Meltzoff and Kornreich's own review of the
literature on psychotherapy outcome distinguishes between adequate and
questionable studies. And among each of these divisions they consider studies
that show positive results and those that show no or negative results~ Among
the studies with positive results they distinguish between positive results
that are major and positive results that are minor. The major positive
result would be a study where the treated group, when compared to the control

13
group, showed significant reduction of symptoms without substitution, or
improvement in general adjustment in several important areas. A minor posi
tive result would show improvement in a restricted or limited area that does
not bear on a central condition. This classification is summarized:
A. Adequate
Al Positive (major)
A2 Positive (minor)
A3 Null or negative
B. Questionable
Bl Positive (major)
B2 Positive (minor)
B3 Null or negative
Ideally for therapy evaluation, one would hope for an adequate study
with major positive results. But more important would be to determine what
type of research results one has actually obtained and accept it within that
context. Questionable research may still have supportive if not demonstra
tive value •. Questionable research is just th~t--questionable; but in many
cases it may be better than nothing. Unfortunately, since much of psycho
therapy research is done within a clinical setting, one has to be satisfied
with less than adequate research design if he is to do research at all.
Adequate studies, according to Meltzoff and Kornreich (1970) fulfill
the following criteria: (1) freedom from ~jor flaws that might invalidate
the conclusions; (2) use of an appropriate control group.and adequate sampling;
(3) relative freedom from bias; (4) employment of reasonably objective,
reliable, and valid criteria measures; and (5) presentation of suitably
analyzed and interpreted data. When the results and discussion of this
study are presented, they will be subjected to each of these criteria to
determine its adequacy and limitations. . First, the measures used in the

14
study will be investigated to determine th~ir objectivity, reliability, and
validity as measurements of therapeutic change.
!h2, ~ !!! ~ Evaluation .2f. Therapy
Among the controlled outcome studies of good quality reviewed by
Meltzoff and Kornreich (1970), the criterion measure most often used was
observed behavior (53%) followed by objective personality tests or inven
tories (34%). The same ranking is present when all studies are included,
with observed behavior used in 39% of the studies and objective personality
tests or inventories used 27% of the time. Projective techniques were used
18% of the time in good quality studies and 19% of the time in all studies.
The most common objective personality test or inventory used has been the
MMPI.
Inventories lead to problems because most were designed for other
purposes than the evaluation of therapeutic change, e.g. for diagnosis, as
is the MMPI. Responses to many items refer to past history that are reveal
ing for diagnostic purposes but would not be expected to change with therapy.
In so far as these items load the scale, it becomes less sensitive as a
scale measuring change. It increases the probability of a high correlation
between initial and final scores. Some items on the inventory may be worded
so they do not pick up the nuances that reflect actual change.
Despite these difficulties, however, studies have shown that the
MMPI is useful in evaluating therapy, although many of the studies need
critical evaluation. One of the earliest studies, by Rashkis and Shaskin

15
(1946), examined the protocols of twenty-t~o psychiatric patients and
fifteen anxiety patients following group therapy. They found the greatest
changes on the D (Depression), Hy (Hysteria), Ha (Hypochondriasis), and Pt
(Psychasthenia) scales. These are the scales associated with later measures
of anxiety const:ructed from the combination of MMPI scales (cf. Modlin, 1947;
Purcell, 1952; Welsh, 1952). They found the Pd (Psychopathic Deviate) scores
remained the same and the Ma (Hypomania) scale tended to increase.
Two studies employ the MMPI to evaluate client-centered therapy.
Mozak (1950) studied the MMPI profiles of twenty-eight clients under client
centered therapy for an average of fifteen interviews. Post-therapy MMPI
profiles showed significant decreases on the n; Sc (Schizophrenia), Hs, Hy,
and Pa (Paranoid) scales. The individual patterns were much as they were on
the pre-therapy tests with a general drop in the scores on all scales.
Gallagher (1953) had forty-one students who came to the clinic for
client-centered therapy counseled by advanced graduate students. The control
group was 202 randomly selected college students. Seven of the scales
showed significant differences between pre-therapy and post-therapy scores,
but the therapy group remained more deviant than the randomly selected
control group. The D, Hs, Pt, and F (validity scale) scores decreased
significantly following therapy, while the K ~(a validity scale related to
defensiveness) scale increased. In general, the feeling or discomfort
scales (D, Pt, Hs) showed the greatest change in the direction of health;
while the behavior or character disorder scales (Hy, Pd, Ma) showed the
least amount of change.
Kaufmann (1950) compared the MMPI protocols of fifty-one university

16
students who were reported as improved by their therapists with fifty-four
controls consisting of students in Psychology class. His comparison of pre
treatment and post-treatment protocols showed the following results. (1) The
patient group had higher scores on all the scales except K on the pre-test
protocols. (2) The D, Pt, and Sc scales most easily differentiated between
patient and control groups and were most modifiable by therapy. The Hs
showed the same tendency but to a lower degree. The K scale increased for
both groups. The F scale differentiated the patients from the controls and
is modifiable by therapy. The Hy and Pd scales tended to differentiate the
groups, but were not modifiable by therapy. (3) The reduction of scores by
therapy was not enough to obtain a mean score equal to the control group.
In summary, the scales lowered by therapy included D, Ft, Sc, Hs, and F,
with K increasing. The research limited itself to successful cases, so
whether others would change similarly is not shown. The controls served no
useful purpose other than providing a baseline that was never attained by the
successfully treated patients.
Schofield (1950) conducted an attempt to validate the MMPI as a
measure of change in therapy. One section of his study dealt with twenty
five psychoneurotics who were given the MMPI before and after an average of
five therapeutic visits. No significant changes were seen on any of the
clinical scales. Since the patients were seen for a brief period by junior
medical students assigned to the psychiatric service for ten weeks, the
adequacy of this procedure could be questioned. There is no assurance that
results would be the same with trained and experienced therapists. Schofield
(1953) also did an item analysis on the scales to find out which items

17
changed and which remained the same following therapy.
Barron (1953) compared the profiles of seventeen adult psychoneurotics
who had been rated as Improved with sixteen profiles of others who had been
rated as Unimproved. Only the Pa scale showed a significant difference
between the groups. The unimproved group was, however, consistently higher
on almost all scales, with a peak on the Sc scale and the average Pt and D
T-scores being above 70. These profiles are associated with reactive de
pression and schizoid trends.
The study by Barron and Leary (1955) has often been cited by those
who deny the value of therapy (cf. Eyse~ck, 1960). They used three groups
selected from 150 patients who applied to a clinic for treatment; twenty
three were used as the control group consisting of persons who had been
accepted for treatment but were on the waiting list, eighty-five who were
received for group therapy, and forty-two who received individual therapy.
All had a minimum of three months treatment and none were ill enough to
require hospitalization. They were diagnosed commonly as psychosomatic
neurotics, obsessive or schizoid characters, or phobics; less commonly as
psychopathic characters or hysterics. They were given the MMPI before and
after therapy or the waiting period. An examin~tion of the sample shows that
only those in therapy for three months were included, so the sample is biased
by the exclusion of those who terminated before the three months were over.
Initially the three groups did not differ significantly in the severity of
their condition as indicated by the MMPI clinical scales. Significant de
creases on the D, lis, Hy, and L scales were found in records of patients

18
receiving psychotherapy of either individual or group nature. Group therapy
showed significant decrease also on the Pa and Pt scales. Both groups
showed a significant rise on the Es (Barron's ego-strength) scale. Individual
psychotherapy showed a significant increase on the K scale. Barron and
Leary also give percentage of improvement. On the three scales directly
reflecting neurotic symptoms (Hs, D, Hy), 61 to 67 per cent of the persons
changed in the direction of improvement. The Es score increased on the
second testing in 66 per cent of the cases. None of the other scales changed
in the "improved" direction for as much a 60 per cent of the cases. In gen.;;;
eral, the MMPI post-therapy scores of patients undergoing both individual
and group therapy showed significant improvement over their pre-therapy
scores.
Leary and Harvey (1956) later br9ught. evidence to bear that therapy
patients change more than non-therapy patients, but did not improve more.
Cartwright (1956) re-analyzed the data of Barron and Leary showing that the
variability of the therapy group was significantly greater than that of the
control group. This could lead to the same interpretation as given by Leary
and Harvey, that more people do change in therapy--but some improve while
others get worse.
These studies using the MMPI to measure therapeu~ic change tend to
support its usage for this purpose. The scales typically found to change
most are those involving feeling or mood: Ha, D,. Hy, and Pt. Some research
reports that the Sc and Pa scales are also lowered. The K scale generally
shows an increase.
19
The above studies have investigated the results of therapy with
psychologically unhealthy persons of different grades of severity. Since
the present study deals with normal range MMPI scores, the lowered ceiling
would make changes in group means less likely. However, by matching pre and
post scores for each individual, a more sensitive statistical test is made
possible. On the basis of the literature cited, a lowering might be expected
on the Hs, D, Hy, Pt, and Sc scales, an increase on the K scale, and the
Pd and Ma scales would be less likely to change. On the basis of its content,
·the Social Introversion (Si) scale could be expected to be lower after therapy.
Both the MMPI and the 16 PF (Sixteen Personality Factor Questionnaire)
have been used to evaluate therapy. Since both of these tests are used in
this study, a comparison of the two tests would be useful to determine
whether they are measuring the same things. There are several studies that
attempt to explore the subscale correlations between these two, but they are
not all in clear agreement. The 16 PF purports to measure sixteen indepen
dent aspects of personality that more or less reflect the basic source
traits given by Cattell (1957) as empirically derived from factorial studies.
In contrast, the MMPI is designed to isolate diagnostically differentiating
scales (Dahlstrom and Welsh, 1960). Because of this complexity and different
origins and purposes of the tests, scale correlations are quite mixed. Three
prominent correlation studies are those done by Karson and Pool (1958),
La Forge (1962), and Hundleby and Connor (1968). ·Other studies are by
Cattell (1956), Cattell and Bolton (1969), Gocka and Marks (1961), and O'Dell
and Karson (1969). Hundleby and Connor review (1968) the former studies of
correlation by Karson and Pool (1958) and La Forge (1962). Both studies agree
in showing a high negative correlation b~tween the H scale of the 16 PF and
20
the Si scale on the MMPI (-.73, La Forge; -.69, Karson and Pool). Both
studies show a fairly high positive correlation (greater than .• 40) between
L and Si, D, and Ft; between 0 and Pt, Sc, Si, D, and ~; between Q4 and
Si and Ft. A fairly high negative correlation is found between 0 and K~
between Q4 and K. (In each of these comparisons, the first letter refers
to the 16 PF factor and the second refers to. the MMPI scale.) The major
finding of La Forge is that there is a high degree of correspondence between
the variables manifesting anxiety on either test, specifically Pt, Sc, F,
D, Si, and -K on the MMPI, and o, Q4, L, and -C on the 16 PF. There is a
common factor expressing anxiety or general maladjustment on both tests.
Welsh's Factor A tries to capture this on the MMPI, and the Adjustment vs.
Anxiety second-order factor expresses it on the 16 PF. Since these anxiety
factors are common to both the MMPI and 16 PF and since reduction in anxiety
is generally considered a sign of positive therapeutic change, these scales
would be critical to the present study.
Specific Measures .2£ Anxiety
Reduction of anxiety is a common indicator of positive therapeutic
change. Welsh's First Factor (A) of the MMPI was derived on the basis of
factor analytic studies (1956) that identified at least two main sources of
variance running through the clinical scales. The first major source was
identified as factor Jr:., with high loadings from Pt and Sc scales and high
negative loadings from the K scale. The source of variance appearing on
Factor A appeared to be personal·discomfort or distress. It was described
as measuring anxiety or general emotional upset. Welsh then devised his
21
. A scale from items that differentiated extreme scorers on a scale of general
maladjustment.
T,he second source of variance on the ~asic scales Welsh identified
as Factor R. Scales Hs, D, and Hy all have moderate loadings on R, and Ma
has moderate negative loadings. This factor appeared to be related to
dependence on mechanisms of denial or rationalization and lack of effective
insight into self. Welsh developed his R scale to measure this second
factor of variance.
Kassebaum, Couch, and Slater (1959) did a factor analysis on thirty
two scales of the MMPI on 160 college freshmen protocols. This stu~y con
firmed the basic validity of the A and R scales to measure their respective
factors. The A scale showed its purest pattern. of loadings on the first
factor. These authors interpreted their first factor as a measure or ego
weakness or ego strength. The R scale had its highest loadings on the second
factor. This factor they interpreted as introversion or extraversion. The
A scale loaded .88 on Factor I; the R scale loaded .69 on Factor II. The A
scale correlated positively over .50 with scales F, D, Pd, Pt, Sc, and Si.
It correlated negatively (-.70) with the K scale.
The 16 PF second-order factor of Adjustment vs. Anxiety provides a
measure of anxiety that has been found to decline with therapy (Cattell,
Rickels, et al., 1966). It may, however, be found high in normal persons
and low in psychotics, though it is usually high with neurotics. Its chief
factor loadings are C-, H-,L+, O+, Q3-, and Q4+. The factors of C-, ~' and
Q4+ are suggested by their content and meaning; the factors of L+, H-, and
Q3
- have been added by experimental analysis. The present study will be
concerned with factors C, O, and Q4 since these have the highest factor

22
loadings on the ar..xiety factor and fit into the concept of anxiety. Factor
C is described as "affected by feelings, emotionally less stable, easily
upset, changeable, lower ego strength" on the low side·and "emotionally
stable, mature, faces reality, calm, higher ego strength" on the high
side. Factor 0 is described as "self-assured, placid, secure, serene,
untroubled adequacy" on the low side and "apprehensive, self-reproaching,
insecure, worrying, troubled, guilt proneness" on the high side. Factor Q4 is described as "relaxed, tranquil, torpid, unfrustrated, composed" on the
low side and "tense, frustrated, driven, overwrought" on the high side.
Karson and Pool (1958), using Forms A plus B with seventy-one Air
Force officers, found the following factor loadings on Factor I (Anxiety
vs. Dynamic Integration) on the 16 PF: C -.84; O .81; Q4 ;Bo; M .72; L .65;
Q3 .34; H -.33; and I .32. These findings show many of the same factor
loadings included in Cattell's study (1956). Karson and Pool (1967) found
that the Pt scale on the MMPI correlated high}J with C, O, Q4, M, L, Q3
, H,
and I factors on the 16 PF and that !actors which load highly ori Factor I
of the 16 PF correlate with the Pt scale on the MMPI more than any other
scale. La Forge (1962) found a high degree of correspondence between measures
of anxiety on both 16 PF and MMPI scales, specifically Pt, Sc, D, F, Si,
and -K from the MMPI correlated with O, Q4, L, and -C on the 16 PF. Hundleby
and Connor (1968) report that the 16 Pl! Adjustment vs. A~iety second order
factor correlated positively over .4o with scales D, Pt, and Si on the MMPI
and negatively over -.4o with K. There is then a common factor expressing
anxiety or general maladjustment prominent on both tests.
Karson (1960) compared normal and anxiety neurotic groups and found
that facto~s c, O, Q4, and L significantly differentiated the groups, all

23
of which are loading factors on the Adjustment vs. Anxiety second order fac-
tor.
To swnmarize these findings, the 16 PF provides a specific measure
of anxiety in its second order factor Adjustment vs. Anxiety. This would be
expected to decrease with therapy. Factor loadings that are consistently
related to this second order factor are C-, O+, and Q4+ and so after therapy
an increase would be expected on C and a decrease on 0 and Q4•
factors strongly associated with anxiety are Lt, Q3-, and H-.
'lhree other
It could be
expected that L would decrease following therapy while H and Q3
would increase.
Finally, some indication is given that M and I are positively related to
good adjustment and so there is some reason to expect these scales to in-
crease after therapy. Correlatiohs were found between these factors on
the 16 PF and scales related to anxiety on the MMPI.
Specific Measures of Ego Strength
Another characteristic commonly associated with positive therapeutic
change is an increase in ego-strength. Barron (1953) originally designed a
scale from items on the MMPI which was to predict the response of psycho
neurotic patients to psychotherapy. But consideration of its contents and
correlates suggested that it be used as an assessment in.any situation where
some estimate of adaptability and personal resourcefulness is wanted. It
could be considered a measure of aspects of effective personal functioning
usually meant by the term "ego-strength." He suggested that what was being
measured was a capacity for personal integration. He found a high negative
correlation with most of the MMPI scales of psychopathology, so that it was
24
suggested that the scale picks up a general factor of psychopathology,
reflecting a degree of maladjustment irrespective of the differential
diagnosis.
The Barron Es scale consists of sixty-eight items from the MMPI that
correlated significantly with improvement in thirty-three neurotic patients.
Improvement was reliably rated by two judges who were not the therapists,
and the sample was dichotomized into improved and unimproved groups whose
average Es scale differed significantly.
Studies on the ego-strength scale (Es) have been of two main kinds:
those validating its prognostic ability for psychotherapy or its diagnostic
differentiating ability and those examining its construct validity as a
measure of "ego-strength." These latter studies have mainly been through
comparisons with other "ego-strength" measures. Both lines of study have
produced ambiguous results although with general support of the scale's
basic value.
As a prognostic instrument to predict th.erapeutic ~hange, Barron
(1953) includes some preliminary validating studies. Barron and Leary (1955)
found an increase in the Es scale for 66 per cent of the therapy cases in
their study on the improvement between therapy and non-therapy groups.
However, their control group, on the waiting list for therapy, also showed
an increase on the Es scale for 55 per cent of the cases, which is not
significantly different from the therapy treated groups.
Wirt (1955) had patients being discharged from a hospital rated
independently by two psychiatrists as Unimproved, Improved, and Greatly
Improved and received 203 patients with identical ratings. Using the Es
score of MMPI protocols taken on their admission to the hospital, the Greatly

25
Improved group could be separated from the Unimproved group significantly
at the .05 level.
Getter and Sundland (1962) applied the Es scale to fifty-nine ther-
apy candidates, fifteen of whom were rated as unimproved, twenty-five
improved, and nineteen remained untreated. No significant relationship was
found between ego strength, improvement in therapy, or the number of hours
of therapy.
Fiske, Cartwright, and Kirtner (1964) also found the Es scale
wanting as a predictor of outcome with ninety-three subjects in client-
centered therapy. Endicott and Endicott (1964) also determined that it
was unrelated as a predictor of outcom~ with forty untreated patients and
twenty-one patients in individual psychotherapy.
These studies then indicate that the Es scale does not stand up well
as a m::edictor of therapeutic success. However, as a measure of positive
therapeutic change, there is some evidence that the Es scale increases with
therapy. Negative results of studies using the_Es scale t? predict therapy
success do not of themselves disprove its use as a measure of therapeutic
change.
Diagnostically, Quay (1955) found that the Es score differentiated
a group of 74 psychiatric patients (without organic pathology) from a group
of 92 student nurses and from a group of 41 psychiatric attendants at the
.01 and .05 level respectively. However, they also found that it distin~
guished between attendants and nurses at the .Ol level. Hawkinson (1961)
found that the Ee did not distinguish between psychoneurotic, manic-depres-
sive, and schizophrenic groups. I So although Barron s statement that the Es
scale represents a general maladjustment factor might suggest its utilization
26
to differentiate between degrees of pathological severity, its actual
ability to do so is not strongly validated.
Grace (1960) attempted to validate the Es scaie by independent
criteria that reflect possible components of "ego-strength," using fifty
two hospitalized patients with functional disturbances. He found that it
related to independent measures of conceptual ability (giving abstract
rather than concrete meanings to proverbs), to stress tolerance, and to
recovery from stress. It was not related to verbal performance decrement
associated with stress nor with tolerance of ambiguity.
Crumpton, Cantor, and Batiste (1960) did a factorial analysis of
the Ea scale and found fourteen factor loadings. They identified ambiguous,
misleading, and non-contributory items on the scale, suggesting the omission
of twelve items and the reversal of scoring for three items. However, the
scale was associated with the effective functioning of students and less
well associated with the non-effective functioning of psychiatric patients.
They suggest that the scale is misnamed because it seems to measure the
absence of ego-weakness rather than the presence of ego-strength. This
absence of ego-weakness is interpreted as ego-strength. Normals do not
admit to the weaknesses shown on the scale, whereas patients do, They
note the loading of -.73 to the factor identified by Kassebaum, Couch, and
Slater (1959) as "ego-weakness vs. ego-strength." These same authors found
Es negatively correlated with all the clinical scales of the MMPI and
the validating scales except K. It is negatively correlated over -.50
with D, Pt, Sc, and Si.
Several studies report comparisons between Barron's Es scale and
other measures of ego strength. Tamkin (1957) compared the Es scale,
27
Rorschach F+%, and Pascal and Suttell's Bender-Gestalt Z-score, all of which
purport to measure "ego-strength." He found that none of these differen
tiated be.tween psychotic and neurotic groups. Nor were they correlated with
each other significantly. Although they may be measuring something referred
to as "ego-strength", they are apparently not measuring the same thing.
Corotto and Curnutt (1962) essentially repeated Tamkin's comparison except
with a normal population and again found the three measures unrelated.
Roos (1962) compared the Es with Bender-Gestalt Z-soores and got a corre
lation of -.12 which supports Tamkin's findings.
Adams and Cooper (1962) compared the Es scale with Klopfer's Ror
schach Prognostic Rating Scale (RPRS) and Cartwright's modification of the
RPRS which correlates .85 with.the complete RP~S. Published data on these
two Rorschach scales show that they ,predict response to therapy better than
the Es scale. The Es scale correlated .12 with the Cartwright modification
of the RPRS and .13 with_ the complete RPRS, neither of which is statistically
significant. Again, apparently the Es does not tap the same source as
these two Rorschach measures.
Finally, in comparisons of different ego strength measures, Herron,
Guido, and Kantor (1965) compared nine ego strength measures on forty college
students. For our purposes, this study included the Barron Es scale, the
16 PF ego strength factor C, and the ego strength vs. ego weakness'factor
reported by Kassebaum (195g) on the MMPI. The correlations among these
three measures are as follows:
16 PF ego strength: Barron's Es -.o6
16 PF ego strength: Kassebaum's factor -.21
Barron's Es: Kassebaum's factor +.o6
28
Again, there is no significant correlations among these three
measures of ego strength. The great number of insignificant correlations
among the various measures of ego strength limits the ability to predict
from one test to another. Consequently, ego strength must be regarded as
a function of the testing instrument.
As with studies dealing with measures of anxiety, studies on Barron's
Es have been done mainly with psychiatric patients and so say little about
the function in a normal population.
Factor C on the 16 PF is one of "dynamic integration and maturity
as opposed to uncontrolled, disorganizedi general emotionality " (Cattell,
Eber, and Tatsuoka, 1970, p. 83). It is characteristically low in all
kinds of clinical disorders. A low C score is one of the loads to the
Adjustment vs. Anxiety second order factor.
Both the MMPI and the 16 PF then provide an instrument to measure
"ego strength", Barron's Es scale on the MMPI and.Factor C on the 16 PF.
The reported correlations between these two measures are low and so what is
measured as "ego strength" appears to be a function of each measure. But
both measures are associated with positive therapeutic change, although
the Es scale does not stand up well as a predictpr of therapeutic change.
Measurement 2f Motivation
Successful therapy is related to positive behavior change. For
although reduction of anxiety or increase of ego strength may be regarded
29
as goals of therapy, they would hardly be adequate in· themselves unless
they were accompanied by a change in behavior. Behavior modification
is in some way the goal of any therapy. When the change of behavior is
used exclusively as the criterion of successful therapy, then therapy is
considered successful when the designated symptom is removed or an unde
sirable behavior is extinguished or replaced. What is happening "inside"
the person with regard to feelings, attitudes, or self-directing convic
tions is disregarded. Within the behavior modification approach to therapy,
success is defined quite specifically according to the type of behavior
that is to be changed.
In the type of group therapy investigated here a broad range of
behavior changes might be envisioned as ~esirable depending on the style of
life of the individual members in the group. To use behavior in itself
as a criterion of change would require a unique definition of a behavior
change desired for each member of the group and a way of determining whether
it was effected. This would be impractical because of the subjective var
iations of desired changes, the difficulty in measuring them, and the many
possible positive changes accruing from the group session which would not
have been specifically included in the goals of therapy._
The behavior change produced in behavior modification therapy usually
consists of a simple action or omission, such as.dressing properly, not
screaming at night, eliminating bedwetting. With normal adults there is
rarely such a specific behavior that ought to be changed, unless it is a

particular overt habit such as smoking, over-eating, or stuttering. It is
usually not at all clear what specific behavior ought to be changed. In
any case, DC therapy in a group session is not directed to the changing
of a specific habit that extends over time.
The changes that are produced are such that have their influence
within the individual's uniqueness and reflect the complexity of his
personality. They issue from the "inner" aspects of a person that are
reflected in behavior such as attitude and convictions. An instrument
that measures motivation is suited to reflecting these changes.
The TAT has been used as an instrument to assess motivation. Tradi
tionally the story is broken down and themes are isolated. These themes,
according to the psychoanalytic theory, are supposed to reflect the instinc
tive drives and impulses that are motivating the person. It is thought that
when these themes are isolated, a picture of the needs and drives of the
storyteller can be determined. This approach.to TAT stories assumes that
the themes, the drives and needs expressed in the story, are projections
of the storyteller's own needs and drives. But this assumption simply has
not been borne out in studies. The practice of identifying themes of the
hero of the story with motives of the storyteller has not proven true.
Furthermore, fractionating a story into themes destroys the basic unity
of a story. It is apparent that. the process of summing the number of
themes to score the TAT makes the final score dependent on the length
of the narratives.
What then is unique to a story, as opposed to other fantasy products
such as a dream or "free association"? First, the story is a conscious and

31
creative product of imagination, in contrast to a dream. Secondly, the
story is a~ with a plot and outcome, in contrast to "free association."
These two characteristics of a.story as an imaginative product suggest a
reason to assume that it reveals the motivation pattern of a person.
Imagination is the ability of a person to mentally represent
possibilities. These mental representations ("images") may be specific
to a sensory modality, such as a visual picture, an imagined sound. We can
also imagine what velvet feels like, how a lemon tastes, and what a fish
market smells like. The modalities of touch, taste, and smell are more
vividly imagined when the visual modality is added by picturing the velvet
and the fish market and the lemon. And we can also imagine the sequence of
motor movements, motor imagination, when we imagine biting into the lemon.
In the ordinary course of events, we use imagination to plan for action.
We imagine what we are going to do, what we are to wear, what tasks lie before
us during the day. We imagine how best to execute the task, what plans we
need to make. In using our imagination, we draw on our memory of what we
have done in the past and what has happened as a consequence. We consider
what alternatives are present and what resources are now available. We
imagine future consequences, the good and bad effects of intended actions.
Imagination then is a planning for action, a "picturing" of possibilities.
In telling a story a person is set with a problem situation which he
imagines (the plot) and he resolves it in some way (the outcome). The story
teller draws upon his memory and imagination, and the story will reflect his
characteristic way of solving problems, his dispositions toward various

32
situations, his attitudes and expectations about the way things turn out,
and how he tends to act or sees others as acting. It reveals his pattern
of motivation. The TAT picture provides a stimulus about which the person
can weave a plot and draw an outcome. But h.2..1! he does t~is depends on his
own creative reorganization of his experience.
It is this process unique to storytelling that is missed when the
TAT is considered as a product of fantasy where themes are linked as though
the story were nothing but a patchwork of associated images strung together
according to hidden affects disguised even to the person himself •. "The story
is not a collection of themes nor is it a string of memory images. A story
is a creative reorganization of past sense impressions, a ~ product of
human imagination." (Arnold, 1962, p. 13)
A motive is taken to be a "want that leads to action" (Arnold, 1962,
p. 32). It is its link to behavior that distinguishes a motive from an
emotion or a value. Values, needs, drives, and emotions do not necessarily
lead to action. But a motive always includes a tendency to action because
it is based on an appraisal of something as good for a particular action.
The tendency to action, however, of a motive may be based on a deliberate
appraisal of an object as good for ~ as well as a good appraised on the
basis of a need, a drive, or an emotion. It differs from a value in that
a value is appraised as go~d, but not necessarily .f2!: !!!!· To distinguish
motives from emotions and needs and values is necessary because we are more
interested in behavior change after therapy than in value change or change
in needs or emotions. For whereas motives are related to behavior, values
and emotions or needs are not necessarily linked to a particular behavior.

33
For example, value change may occur without a person being motivated to
act on these values. Needs and emotional attitudes may not change much,
but how one acts on these needs and emotions may change, and this is
important. An interpretation of the TAT based on ~ a person resolves
a problem, i.e. gives an outcome to a plot, is more revealing of his
motiv~tional pattern than an approach that enumerates his purported needs
and impulses without indicating how he deals with them.
Magda Arnold devised a system of measuring motivation using stories
told to TAT cards called Story Sequence Analysis. Her theory is explained
primarily in Emotion and Personality {Vol. II, 1960) and her method of using
the TAT is set forth in Story Sequence Analysis {1962). The unit of inter-
pretation in SSA is the story, rather than themes of the stories. The
critical process in the method is extracting the import of each story. The
import is a condensation of a story which preserves the kernel of the story
and leaves out incidentals. Each story makes· a point, and when this point
is extracted in the import, and the imports are strung together ir a sequence,
a picture emerges of the person's attitudes and intentions to action.
If each story is an imaginative exploration of various problems and their possible solutions, we must try to isolate what it is the storyteller is trying to say. What he says about the picture will reveal his convictions: what could be called the "moral11 of the story. When this moral is applied to the storyteller's subjective circumstances, we arrive at the import (the meaning or significance) of the story. Once the import of each story is set down in sequence, it becomes.possible to follow the storyteller's trend of thought, which reveals his habitual dispositions, the way he evaluates human actions, and the circumstances of man's life. Th~ story import will show how the storyteller thinks people usually act and how he feels they ahoul~ act; what actions he thinks right
LOYULA UNIVtK~ll ~ Ll~KAMX
and wrong; what will lead to success, in his opiill.on, and what to .failure; what can be done when danger threatens, and what things to strive for. In short, the story imports, taken in sequence, give a connected statement of the storyteller's principles of action, his motivational pattern. (Arnold, 1962, p. 51)
Skill in taking imports from stories is learned, for the import is
objective in that it is abstracted as well as possible without adding from
subjective interpretations. However, because of the examiner's focus on a
particular problem around which the story is spun, imports as well as the
sequence in which they are embedded may vary somewhat from examiner to
examiner. Some stories are simple and indicate clearly what the story-
teller is trying to say. In others, the point of the story is not at all
obvious, outcomes are implied rather than stated clearly, stories border
on monologues, and the import is difficult to score. Here skill in inter-
preting needs to be developed. When the stories are written with definite
plots and outcomes, the meaning of the import· is consistent when taken by . -
different examiners although the parT.icular wording of it may vary consid-
erably. When the import is then scored, using the categories that have
been devised, the variations in wording become unimportant because the
content of the import, regardless of wording, receives the same score.
Scoring
There are two aspects of scoring: classifying the content of the
story import and giving it quantitative value. Imports fall.into four
broad categories: I. Achievement, success, happiness, active effort and
LOYOLA UNIVtK~l I Y UISKAK~
35
their opposites; II. Right and wrong; III. Human relations; and IV. Reaction
to adversity. These categories were derived empirically from the records
of high and low achievers, from effective and ineffective teachers, from
offenders and non-offenders among Navy recruits, and from efficient and
inefficient executives in a government project. Over a period of ten years
these categories of imports were organized into a scoring system with various
headings and sub-headings to include the types of imports found in stories.
Quantitatively, each story has four possible scores ranging from
-2 to +2. These scores derive from the types of imports found in positively
motivated persons as contrasted with those found in negatively motivated
persons and were derived empirically from the contrasting groups mentioned
above.
When the scores for each story on a record are algebraically summed,
a consistency score is obtained which indicates how consistently the story
teller reveals a positive or negative attitude. If all of the stories told
are positively scored, the consistency score will be positive. Wh~n all the
stories told are scored negatively, the consistency score will be negative.
But when the storyteller reveals imports whose positive and negative scores
cancel out, he has zero consistency, neither definitely positive nor definitely
negative. In the consistency score, two factors are involved: the intensity
of the individual story's ~ositive or negative score and the number of stories
included in the sequence.
In order make the scores from records of different lengths comparable,
a linear transformation is made which does not change the nature of the

36
raw scores, but gives an equivalent unit that takes into account the
number of stories included. This is done by making a proportion from the
ratio or the actual scale units obtained which can be derived from the
consistency score over the maximum units obtainable. This ratio is
multiplied by 200 which gives an index where 100 is the arbitrary zero
· point for consistency, all negative consistency scores will give an index
value below 100, and all positive consistency scores will give values above •
100, up to the scale limit of 200.
This Motivation Index (M.I.) is calculated according to the
formula:
0 n
x 200
where n° is the number of units obtained (derived from the final score), and
np is the number of units obtainable or possible. The np is four times the
number of stories used: e.g. for a 20-story sequence, the np is 80; for a
19-ato~y sequence, it is 76. Arnold provides a table to make this trans-
formation easy (Arnold, 1962, pp. 146-147).
Reliability
Arnold tested the reliability of Story Sequence Analysis by odd-even
and split-half methods. With 99 TAT records of e!ficien~ and inefficient
teachers, she found a correlation of .86 between odd and even numbered
imports and between first and second halves of the records. In 51 TAT
records of seventh grade children she found an odd-even correlation of .79
37
and a split-half correlation or .61.
Validity
The scoring system of the SSA was developed on the basis of studies
distinguishing matched pairs or high and_low achievers (Snider, 1954; Brown,
1953; McCandlish, 1958). TAT imports given by high achievers were scored
positively; those given by low achievers were scored negatively. And these
were arranged into categories so that the scoring system could be correlated
with other criteria. To differentiate low and high degrees.of positive and
negative motivation, the scoring system was expanded to involve four steps
or intensity with two steps of negative motivation (-2,-1) and two steps
or positive motivation (+1, +2). Garvin (1960) found a correlation of .85
for men and .83 for women between the TAT scores of seniors in college and
their junior year grade-point average. Quinn .(1962) found correlations of
.61 and .59 between t~e TAT scores of scholastics and their ratings of
possible success by superiors and peers. Dulin (1968)_ compared the TAT
records of 100 male freshmen in college and their subsequent grade-point
average throughout four years. Because of the loss of subjects during the
following years, the number dropped from 100 in the first year to 75 in the
second, 54 in the third, and 42 in the fourth year. The MI-GPA correlation
from freshman to senior year was .84, .65, .62, and .61 respectively. In
order to investigate why the drop between first and second year occurred and
then why the correlation leveled off in the following years, Dulin selected
a sample of 39 students who remained through all four years for whom he

had complete records. The MI-GPA correlations reported for this group from
freshman through senior year were .67, .46, .46, and .59 respectively. This
selected sample also shows the.highest correlation in the freshman year, a
fairly steep drop between first and second year, and a leveling for the
following three years. The MI therefore does have a positive correlation
with records of academic achievement as recorded by grade-point average.
This correlation is higher than either the correlation between intelligence
(as measured by the Henmon-Nelson intelligence test) and grade-point average,
or between intelligence and MI. The correlations between intelligence and
GPA for the selected group who remained.over four years is generally about
0.1 below the correlations between MI and GPA in each case. Since remaining
in college for four years is in~itself an indication of positive motivation
and adequate intelligence, these similarities between correlations of MI and
GPA with correlations between intelligence and GPA would be expected in this
group. Dulin's findings support the validity of SSA as a measure of moti
vation related to academic performance.
Fields (1965) compared the. TAT records of twenty-five unwed mothers
from 15 to 19 years old with a control group of 25 girls currently institu
tionalized for behavior problems but who had ~ever been pregnant out of wed
lock. The TAT records were used to confirm certain hypotheses about the
motivational patterns of unwed mothers which would distinguish them from
institutionalized girls with other behavior problems. For scoring, she
categorized imports according to the activity and passivity expressed in
the stories. Unwed mothers were found to exhibit the same degree of nega
tive motivation as other institutionalized girls, but they were three times

r ' 39
more likely to have patterns of 'i> assivity." Whereas the degree of negative
motivation in the two groups was similar, unwed mothers were more pass]ve.
Ramirez (1970) used SSA to evaluate the outcome of client-centered
therapy. Thirty outpatients who applied for therapy at the Counseling
Center of the University of Chicago were assigned to twelve therapists using
the client-centered orientation. Nineteen of the subjects were male, eleven
were female. The age range was from twenty to forty years with a median of
26.8 years. They were above average in intelligence and education with
college and post-graduate backgrounds. Sixteen were students at the
University and fourteen were in different professions in the community. They
would be classified as mostly psychoneurotic, some as borderline psychotic,
and a small group as normal with slight emotional disturbances.
Thirty control subjects were matched according to age, sex, educa-
tional status and socio-economic status. Fifteen were male and fifteen
female; fifteen students and fifteen non-students.
The TAT was given to each subject three times, once before therapy,
a second time at the end of therapy, and a third time as a follow-up after
therapy. The control group was tested at similar intervals. The average time
between first and second testing was about six months; between the second
testing and the third TAT as follow-up averaged about seven months.
The subjects in th~rapy received at least six sessions and at the
end each was rated as success or failure by the therapist on a nine point
scale: 1 indicating complete failure and 9 indicating marked success. Those
rated 6 or above were included in the success group; those rated 5 or below
were included in the failure group. By thi~ classification, there were 19
successful clients and 11 failures.
Ramirez found that those persons who received therapy showed a
significant increase in their MI scores between pre-therapy and post
therapy (at the .05 level). There was a slight decrease in the MI from
the post-therapy score to the follow-up, but the decrease was not signifi-
cant. The MI scores at follow-up were still higher than the pre-therapy
. scores, but the difference was not significant. As a group, those who
received therapy increased their Motivation Index significantly after
therapy, but there was a slight decrease between post-therapy and follow
up testing. This decrease was not significant and did not reach the pre
therapy level.
The controls who took the TAT at approximately equal intervals but
did not receive therapy did not show a significant increase in their MI
between the first testing and either the second or third testing. Instead,
they showed a decrease between first and second testing.
When the therapy group was broken down into those who were rated as
success and those ra~ed as failure, the differences were sharper yet for
those who were rated as successful in therapy. Those rated as successes
showed an increase in MI between pre-therapy and post-therapy at the .002
level. The increase in MI between pre-therapy and follow-up was significant
at the .05 level. The change from post-therapy to follow-up was random
showing that the therapeutic change was maintained through the follow-up.
Those who received therapy but who were rated as failures showed a
significant decrease in MI between pre-therapy and post-therapy, and between
pre-therapy and follow-up. There was a decrease in the MI between post
therapy and follow-up but it was not significant.

41 When comparing the MI of the whole experimental group (success and
failure combined) with the controls at the three testing points, there was
no significant difference at any point, although the experimental group
showed a tendency toward lower MI's at pre-therapy. There seems to be a
tendency for those who underwent therapy in general to have lower MI's than
_controls and particularly for those who were rated as successful therapy
subjects.
It should be noted that the major finding that persons receiving
client-centered therapy showed an increase in their motivation was
confirmed on the basis of the experimental group as a whole,_ i.e. with
success and failure cases combined. There was a significant increase in the
MI between pre-therapy and post-therapy, but this change was not maintained
through to the follow-up. But when the group undergoing therapy were sub
divided into success and failure cases on the.basis of therapist ratings,
the change in the success group was very sign~ficant between pre-therapy
and post-therapy and was maintained through the follow-up. The failure
group, on the other hand, decreased significantly from pre-therapy to
post-therapy, and decreased slightly through the follow-up. These results
point to the advantage of distinguishing between success and failure cases
among those who underwent therapy. It also suggests that therapy is not a
neutral intervention, but may decrease motivation as well as increase it.
This supports the findings of Leary and Harvey (1956), Cartwright (1956), and
others that therapy leads to change; but whereaa·some improve through it,
others get worse.
Ramirez found that the MI was an effective instrument for measuring
therapeutic change in client-centered tn~rapy using the therapist ratings

of success and failure as a criterion.
Ramirez's study has much in common with the present study in that
both use the SSA of the TAT to evaluate the outcome of therapy. Some
differences between the two studies are:
1. The present study is using a single session of DC group therapy
as the therapeutic variable rather than individual client-centered therapy
extended over several sessions.
2. The present study involves the same therapist with three
different groups rather than twelve different therapists.
3. The present study uses only pre-therapy and a one month post- .
therapy evaluation. A follow-up evaluation is not included so longer range
stability of change cannot be evaluated.
4. The subjects of the present study are normal individuals as
determined by the MMPI profiles and cli~cal interviews. Ramirez's therapy
group included psychoneurotic individuals although none would be diagnosed
as having severe pathologies.
5. The experimental and control groups in the present study are all
male, but of similar educational and intellectual range as Ramirez's study.
Ramirez had both male and female subjects in his groups and needed to show
that sex differences were not significant.
6. Ramirez used a full 20-story TAT record obtained over a two-day
testing period, which the subjects gave by talking into a microphone for
a five minute period. These records were transcribed later. After doing
intra-judge and inter-judge reliability studies, it was decided to use the
first eleven stories that were re-scored by the experimenter from each
record. In the present study, thirteen cards were used, the stories were

written by the subjects in a seven-minute time limit per story, and they
were written in one sitting. The stories were scored independently by
two persons. Where discrepancies were discovered, these were conferenced
to determine the final scoring for each story.
7. Ramirez uses a therapist rating to distinguish between ~ccess
and failure cases. The present study does not distinguish successes and
failures among those who participated in a DC therapy session, but it only
compares those participating in the session with the controls who did not.
Specific Hypotheses
Participants in a disclosure-confrontation group session will show
a decrease in anxiety, an increase in ego strength, and an increase in
positive motivation after such a session. Control subjects over an
equivalent time will not show significant changes in anxiety, ego strength,
or level of positive motivation. These changes will be reflected in the
following measures:
(1) Participants in a DC session will show a decrease in anxiety
as reflected in lowered scores on the MMPI Welsh A scale and the 16 PF
Adjustment vso Anxiety second order factor. Control subjects will not
significantly change on these scales.
(2) Participants in a DC session will show an increase in ego
strength as reflected in raised scores on the MMPI Barron Es· scale and
the 16 PF Factor c. Control subjects will not significantly change on
these scales.

(3) Participants in the DC session will show an increase in
positive motivation as reflected in a raised Motivation Index on the
TAT Story Sequence Analysis. The control subjects will not significantly
change on their Motivation Ind~x.

CHAPTER III
METHOD
Subjects
The subjects of this study are seventy unmarried males in their
last two years of undergraduate studies or one year followipg graduation
at a small college. They were from 21 to 24 years of age. None of them
had psychiatric histories and all were within normal range of mental
health as assessed through test data and clinical observation. The
thirty-five subjects who participated in group sessions are distributed
over three separate gr_oups, thirteen members .of one session, twelve
members in a second session, and ten in a third. Data from the three
sessions was combined to f onn a larger N for statistical purposes. The
three disclosure-confrontation sessions were conducted by Donald J. Tyrell
with a co-therapist between February 1970 and January 1971. Two of the
groups were in their senior year at college when the participated in the
session and the third was out of undergraduate college work one year. No
subject participated in more than one session.
The control group consisted of other students in the same college,
most in their junior year and a few in their senior year. Both the students
who participated in sessions and those volunteering as controls knew one

46
another before the session and afterwards since they were living near one
another and attended many of the same classes. The fact that these students,
both members of the control group as well as members of the experimental
group, had contact with one another before and after the session could account
for some contamination of the control group. Attitude changes in the
participants of the session might lead to changes in the control group, so
this "contamination" of a positive nature would make any differences
between the two groups more significant.
The experimental group then consists of 35 students who participated
in a DC session; the control group consists of 35 students from the same
college who did not participate in a session.
Procedure
All subjects were given the Minnesota Multiphasic Personality Inven-
tory (MMPI), the 16 PF Personality Factor Questionnaire (16 PF) Form A, and
the Thematic Apperception Test (TAT). The TAT was administered according to
the instructions in Arnold's Sto12 Sequence Analysis using thirteen cards
(1, 2, 3BM, 4MF, 6BM, ?BM, 8BM, 10, 11, 13MF, 14, 16, and 20 shown in this
order). Before showing the first picture, these instructions were given:
This is a test of your creative imagination. You will see thirteen pictures, one after another. As you look at each picture, write as dramatic a story as you can about it. Tell what has led up to the scene shown in the picture and what is happening nowWhat are the thoughts and feelings of the people in the picture? What will be the outcome?
Since we are interested in your creative imagination, be sure to tell a story with a plot and an outcome. Do not just describe the picture. Try to write a story and not a piece of conversation.
You will have seven minutes for each story. Be sure to write something about each picture. If you can't think of anything for

one of the pictures, write that down, too. (Arnold, 1962, p. 49)
After the first story has been written, the instructions are
repeated stressing that a stor1 with a plot and an outcome be written,
giving what led up to the scene, what is happening in the picture, and
how it will turn out.
The experimental group took the tests before the session and were
re-tested one month following it. The control group took the tests and
were re-tested after an equivalent one month period, with no session
in bet~een.
Measures
A battery of tests including the MMPI, 16 PF, and TAT has been
used as a selection procedure along with a Sentence Completion Form and
a clinical interview to screen participants for DC group sessions. This is
in part the rationale for using the selection of these three tests for the
evaluation of the therapy as well, since parsimony and the clinical
situation are well served if the instruments used for selection can be
also used for evaluation. The review of literature confirms advantages to
be had from this test battery. A side advantage of this study would be
an evaluation of this battery as. an effective selection procedure.
The MMPI was computer scored and T-scores are used. From the MMPI,
measures related to anxiety and ego strength were investigated. This is
primarily the Welsh A scale and the Barron Es scale. Consideration has
been given to other scales suggested by the review ·or literature to be

related to anxiety or therapeutic change, namely Hs, D, Hy, Pt, Sc, and K.
The 16 PF Form A was computer scored and the scores in stens
recorded ac~ording to college norms. The anxiety mea~ure is primarily the
second order factor Adjustment vs. Anxiety. Consideration has been given
to its loading factors related to anxiety: Factor C, Emotional Instability
vs. Ego Strength; Factor o, Self-assured vs. Apprehensive; Factor Q4,
Relaxed vs. Tense; Factor L, Trusting vs. Suspicious; Factor Q3
, Undisci
plined Self-conflict vs. Controlled; Factor H, Shy vs. Venturesome. Factor
C on the 16 PF is used as the measure of ego strength.
Motivation has been measured by the Motivation Index derived from
the imports of the TAT stories scored according to Magda Arnold's Story
Sequence Analysis. The TAT records were~scored by blind analysis, that is
without knowing which group the record being scored belonged to. The
imports were taken and scored independently by two persons. After independent
scoring was completed, the scoring was compared and discrepant scores were
conferenced with Dr. Arnold to determine the final score.
CHAPTER IV
RESULTS
Although hypotheses have been formulated in terms of measures of
anxiety, ego strength, and motivation, the results of all sixteen factors
of the 16 PF and for all ten clinical scales and three validity scales of
the MMPI are reported. This prevents the experimental bias of reporting
only on measures that support the desired results and discarding those
that are less supportative.
The mean and standard deviation for each group on initial and
final testing for each factor of the 16 PF are given in Tables 2 and 3.
Table 1 provides a reference to what th~ factors of the 16 PF are intended
to measure. Table 2 shows that the control group on initial testing showed
its lowest mean on f~ctor Q3, 4.257, indicating that the group was more
casual and careless of protocol than the average college population. Units
are in stens so the normal college mean would be .5.5. The highest mean is
on factor I, 7.446, which indicates that the control group is more tender
minded than the college population in general. On factors G (expedient),
Q1 (conservative), and ~ (casual), the control group m~ans are in the
fourth sten, which is below the college norm mean. On factors A (outgoing),
I (tender-minded), M (imaginative), 0 (apprehensive), Q4 (tense), and the
second-order Anxiety factor, they were in the sixth sten or above. (In
naming the 16 PF factor, the adjective selected to describe the factor
will depend upon which side of 5.5 the mean referred to lies.)
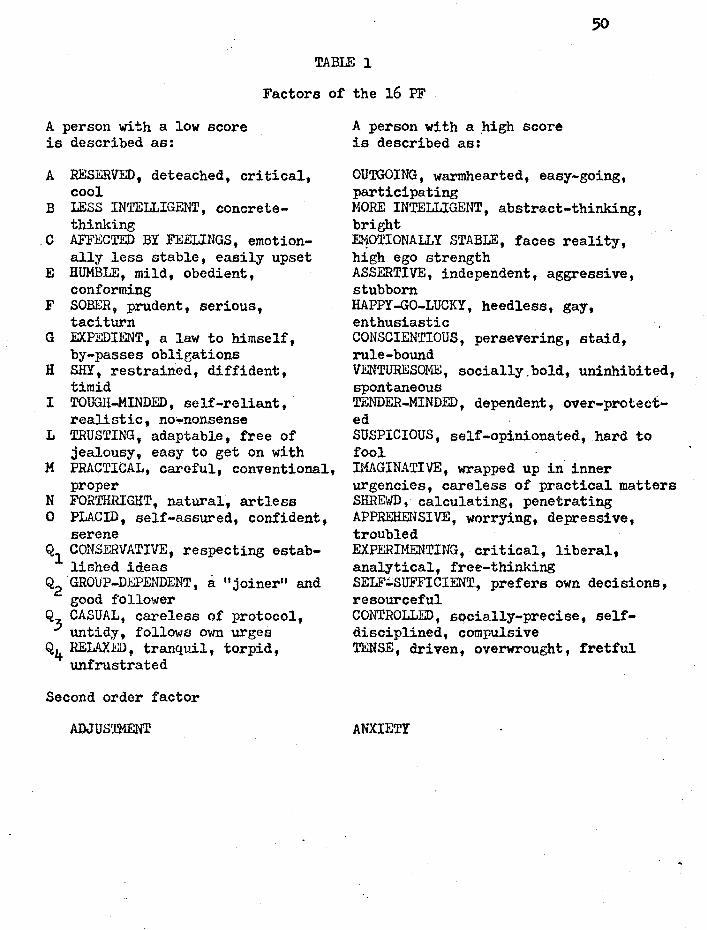
TABLE 1
Factors of the 16 PF
A person with a low score is described as:
A RESERVED, deteached, critical, cool
B LESS INTELLIGENT, concretethinking
.C AFFECTED BY FEELINGS, emotionally less stable, easily upset
E HUMBLE, mild, obedient, conforming
F SOBER, prudent, serious, taciturn
G EXPEDIENT, a law to himself, by-passes obligations
H SHY, restrained, diffident, timid
I TOUGH-MINDED, self-reliant, realistic, no-nonsense
L TRUSTING, adaptable, free of jealousy, easy to get on with
M PRACTICAL, careful, conventional, proper
N FORTHRIGHT, natural, artless 0 PLACID, self-assured, confident,
serene Q1 CONSERVATIVE, respecting estab
lished ideas Q2 GROUP-DEPENDENT, a 11 joiner11 and
good follower Q3
CASUAL, careless of protocol, untidy, follows own urges
Q4 RELAXED, tranquil, torpid, unfrustrated
Second order factor
ADJUSTMENT
A person with a ftigh score is described as:
OUTGOING, warmhearted, easy-going, participating MORE INTELLIGENT, abstract-thinking, bright El-!OTIONALLY STABLE, faces reality, high ego strength ASSERTIVE, independent, aggressive, stubborn HAPPY-GO-LUCKY, heedless, gay, enthusiastic CONSCIENTIOUS, persevering, staid, rule-bound VENTURESOME, socially.bold, uninhibited, spontaneous TENDER-MINDED, dependent, over-protected SUSPICIOUS, self-opinionated, hard to fool IMAGINATIVE, wrapped up in inner urgencies, careless of practical matters SHREWD, calculating, penetrating APPREHENSIVE, worrying, depressive, troubled EXPERIMENTING, critical, liberal, analytical, free-thinking SELF~SUFFICIENT, prefers own decisions, resourceful CONTROLLED, socially-precise, selfdisciplined, compulsive TENSE, driven, overwrought, fretful
ANXIETY

51
TABLE 2·
16 PF: GROUP MEANS AND STANDARD DEVIATIONS
CONTROL GROUP
Pre-test Post-test
Factor Mean S.D. Factor Mean S.D.
A 6.o83 2.30 Ai. 6.057 2.27
B 5.954 2.16 B 7.503 1.53
c 5.o69 1.92 c 6.429 2.70
E 5.637 1.71 E 5.98o 1.87
F 5.54-0 1.67 F· 6.751 1.87
G 4.717 1.71 G 4.380 2.11
H 5.029 1.89 H 6.237 2.47
I 7.446 2.58 I 7.291 1.90
L 5.9.54 2.11 L 5.120 2.16
M 6.189 2.o4 M 7.131 1.82
N 5.383 1.86 N 4.84o 1.81
Q. 6.4.54 2.18 0 4.489 2.19
Ql 4.551 1.73 Ql 5.009 1.71
Q2 5.374 1.84 Q2 5.031 1.71
~ 4.257 1.96 Q3 .5.583 1.88
Q4 6.503 2.26 Q4 4.697 2.60
Anxiety 6.557 2.05 Anxiety 4.463 2.56 '
Units in stens.
N = 35
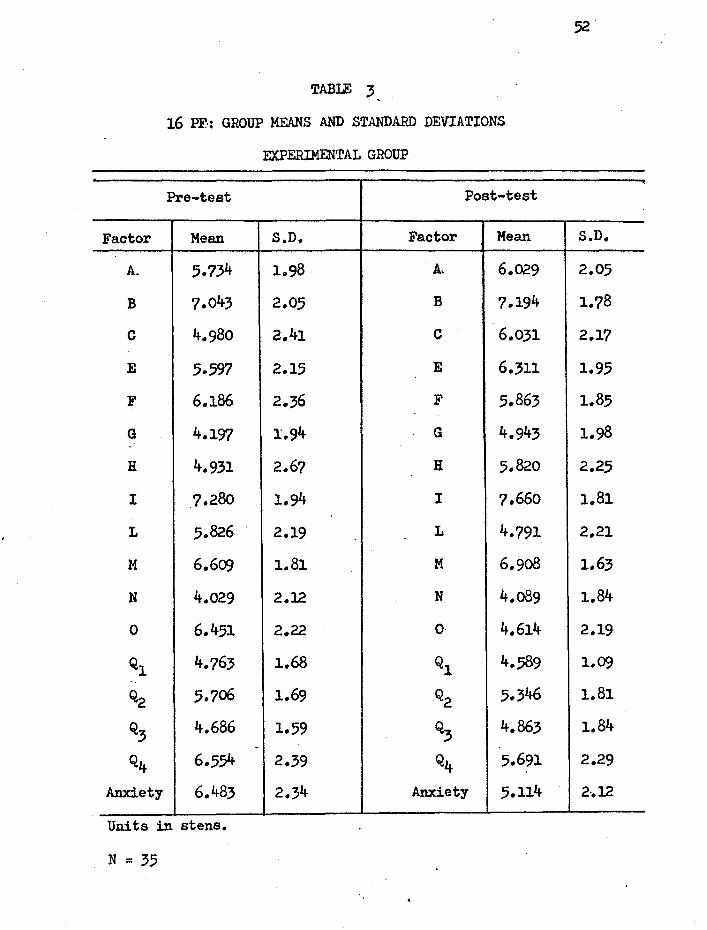
Factor
A.
B
c
E
F
G
H
I
L
M
N
0
Ql
Q2
Q3
Q4
Anxiety
TABLE 3
16 PF·: GROUP MEANS AND STANDARD DEVIATIONS
EXPERIMENTAL GROUP
Pre-test Post-test
Mean S.D. Factor Mean
5.734 1098 At 6.029
?.043 2.05 B 7.194
4.980 ?.41 c 6.031
5.597 2.15 E 6.311
6.186 2.36 F 5.863
4.197 1.94 G 4.943
4.931 2.67 H 5.820
7.28o 1.94 I 7.660
5.826 2.19 L 4.791
6.609 1.81 M 6.9o8
4.029 2.12 N 4.089
6.451 2.22 0 4.614
4.763 1.68 Ql 4.589
5.706 1.69 Q2 5.346
4.686 1.59 Q3 4.863 -
6.554 2.39 Q4 5.691
6.483 2.34 Anxiety 5.114
Units in stens.
N = 35
S.D.
2.05
1.78
2.17
1.95
1.85
1.98
2.25
1.81
2.21
1.63
1.84
2.19
1.09
1.81
1.84
2.29
2-.12
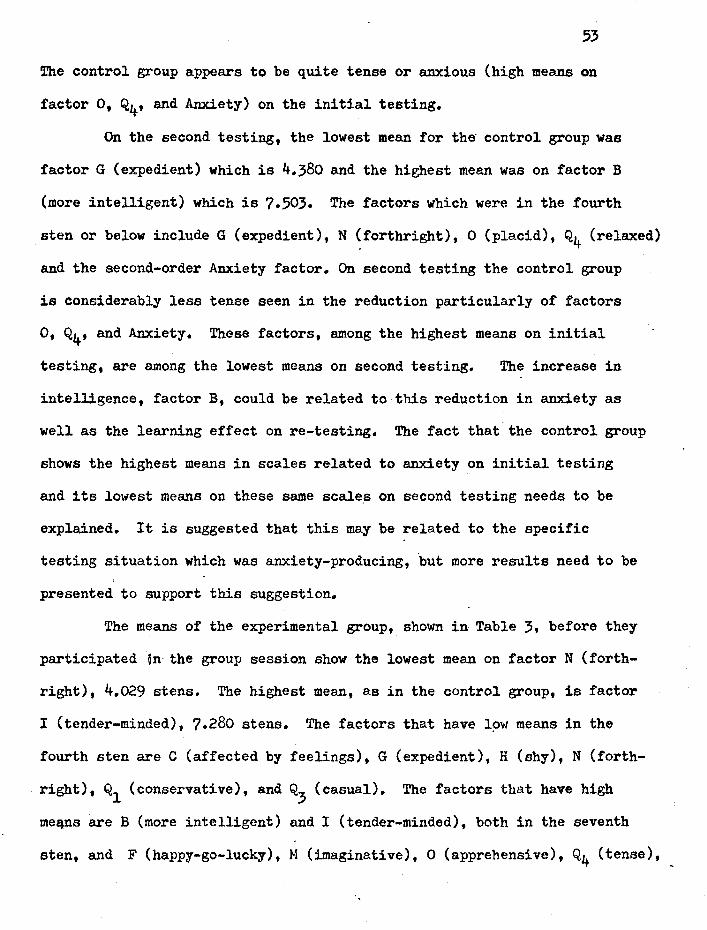
53
The control group appears to be quite tense or anxious (high means on
factor O, Q4, and Anxiety) on the initial testing.
On the second testing, the lowest mean for th~ control group was
factor G (expedient) which is 4.380 and the highest mean was on factor B
(more intelligent) which is 7.503. The factors which were in the fourth
sten or below include G (expedient), N ~forthright), 0 (placid), Q4 (relaxed)
and the second-order Anxiety factor. On second testing the control group
is considerably less tense seen in the reduction particularly of factors
o, Q4, and Anxiety. These factors, among the highest means on initial
testing, are among the lowest means on second testing. The increase in
intelligence, factor B, could be related to this reduction in anxiety as
well as the learning effect on re-testing. The fact that the control group
shows the highest means in scales related to anxiety on initial testing
and its lowest means on these same scale~ on second testing needs to be
explained. It is suggested that this may be related to the specific
testing situation which was anxiety-producing, but more results need to be
presented to support this suggestion.
The means of the experimental group, shown in Table 3, before they
participated 'on the group session show the lowest mean on factor N (forth
right), 4.029 stens. The highest mean, as in the control group, is factor
I (tender-minded), 7.280 stens. The factors that have low means in the
fourth sten are C (affected by feelings), G (expedient), H (shy), N (forth
right), Q1
(conservative), and Q3
(casual). The factors that have high
meEl!ls are B (more intelligent) and I (tender-minded), both in the seventh
sten, and F (happy-go-lucky), M (imaginative), 0 (apprehensive), Q4 (tense),
and the second-order Anxiety factor.
On the post-testing, following participation in the group session,
the experimental group again shows its lo~est mean on factor N (forthright),
and its highest mean on factor.I (tender-minded). The factors showing low
means in the fourth sten are G (expedient), L (trustin~), N (forthright),
0 (placid), Q1 (conservative), and Q3
(casual).
Both experimental and control groups have high means on factors
related to anxiety on the initial testing which decrease on second testing.
The experimental group shows however a high mean of 7.043 on factor B (intel-
ligence) on initial testing which increases only slightly on second testing
to 7.194. The control group's mean of intelligence on initial testing is
5.954 and increases to 7.503 on second testing which is a mean equivalent
to that maintained by the experimental group over both testing periods.
Since the control group and the experimental group both come from the same
college population and were not screened on the basis of intelligence, there
is no reason to assume a difference in basic intelligence between the groups. . .
However, if it is hypothesized that in the initial test situation, anxiety
had a disturbing effect on intellectual functioning, then this lowered mean
of the control group on initial testing could be considered an effect of the
test situation anxiety. This is in accord with the high anxiety related scores
the group shows which reduce considerably on second testing. It is to be
noted that members of the control group were tested together on the same
occasion, whereas the experimental group was tested as three different
subgroups on different occasions, before these subgroups made their respec-
tive sessions. It could be that the lowered intelligence score and the
higher anxiety-related scores of the control group are exaggerated because
55 of a specifically anxiety-inducing test situation which is something of
an artifact.
Both groups show consistently lower scores on factors G (expedient),
N (forthright), and Q1 (conseryative) and consistently higher scores on
factors A (outgoing), B (more intelligent), and I (tender-minded) than the
general college norm.
Tables 4 and 5 give the means and standard deviations of pre-testing
and post-testing for both groups on the MMPI. Since the MMPI scores are
T-scores, the range of means recorded shows quickly that both groups are
within normal distribution. The only scale that consistently is above the
T-score of 60 is the Mf scale. Since college students generally score higi1er
than the general population on the Mf scale, these means are easily explained.
The only other means that are above 60 are in the experimental group, where
on initial testing the Pt mean is 60.685 and after the session the Ma mean
is 60.314.
On initial testing the experimental group has a low mean of 44.257
on the L scale and the control group has low means of 48.000 and 48.600
on the L and Hs scales respectively. Otherwise all means are within the
T-score range between 50 and 60.
On second testing, the control group shows a T-score mean below 50
on the L, Hs, D, and A scale. The experimental group shows a T-score mean
below 50 on approximately the same scales, L, Hs, and A.
The MMPI does not reflect the elevation on scales related to anxiety
in the control group as does the 16 PF. This lends some support to the
hypothesis that the elevated anxiety reflected in the 16 PF is related to
the testing situation. The mean of the control group on the A scale of the
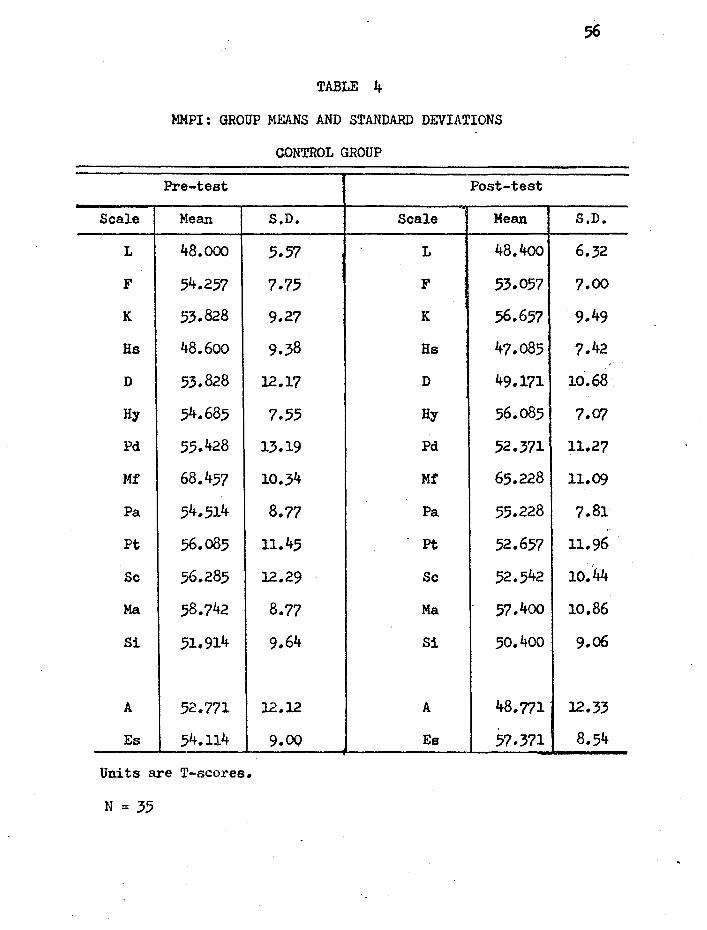
Scale
L
F
K
Hs
D
Hy
Pd
Mf
Pa
Pt
Sc
Ma
Si
A
Es
TABLE 4
MMPI: GROUP MEANS AND STANDARD DEVIATIONS
CONTROL GROUP
Pre-test Post-test
Mean S.D. Scale Mean
48.ooo 5.57 L 48.4oo
54.257 7.75 F 53.057
53.828 9.27 K 56.657
48.6oo 9.38 Hs 47.085
53.828 12.17 D 49.l?l
54.685 7.55 Hy 56.085
55.428 13.19 Pd 52.371
68.457 10.34 Mf 65.228
54.514 8.77 Pa 55.228
56.085 11.45 pt 52.657
56.285 12.29 Sc 52.542
58.742 8.77 Ma 57.400
51.914 9.64 Si 50.400
52.771 12.12 A 48.771.
54.114 9.00 Es 57.371
Units are T-scores.
N = 3.5
S.D.
6.32
7.00
9.49
7.42
10.68
7.(f/
11.27
11.09
7.81
11.96
10.44
10.86
9.06
12.33
8.54
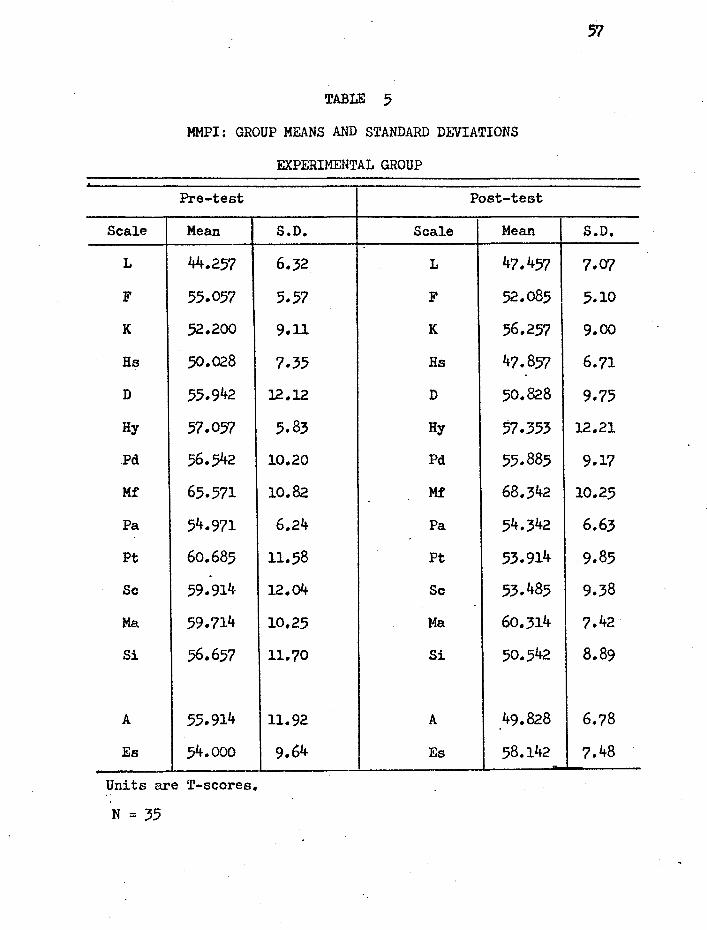
Scale
L
F
K
Ha
D
Hy
.Pd
Mf
Pa
Pt
Sc
Ma
Si
A
Es
TABLE 5
MMPI: GROUP MEANS AND STANDARD DEVIATIONS
EXPERIMENTAL GROUP
Pre-test Post-test
Mean S.D. Scale Mean
44.257 6.32 L 47.457
55.057 5.57 F 52.085
52.200 9.11 K 56.257
.50.028 7.35 Hs 47.857
55.942 12.12 D 50.828
57.057 5.83 Hy 57.353
56.542 10.20 Pd 55.885
65.571 10 .. 82 Mf 68.342
54.971 6.24 Pa 54.342
60.685 ll.58 Pt 53.914
59.914 12.04 Sc 53.485
59.714 10.25 Ma 60.314
56.657 11.70 Si 50.542
55.914 11.92 A 49.828
54.ooo 9.64 Es 58.142
Units are T-scores.
N = 35
57
S.D.
7.07
5.10
9.00
6.71
9.75
12.21
9.17
10.25
6.63
9.85
9.,38
7.42
8.89
6.78
7.48
58
MM.PI is 52.771, with a slight elevation in Pt (56.085), Sc (56.285) and
Ma (58.742). The experimental group, according to MMPI means, appears
more anxiou3 with the means of A (55.914), Pt (60.685), Sc (59.914), and
Ma (59.714) in each case being higher than the corresponding means of
the control group.
It appears that at initial testing, the 16 PF shows the control
group as being more anxious than the experimental group and the MMPI shows
the experimental group as being more anxious than the controls. This
difference could be reconciled if we hypothesized that the 16 PF reflects
a test-situation anxiety and the MMPI reflects a more general personal
anxiety. This would be in accord with what one might expect of persons
anticipating participation in a group therapy session
When the two groups are compared by !-test on the difference between
means on initial and second testing, the results are seen on Tables 6 and 7.
A quick glance shows that in no case do these differences between group
means reach the .05 level of significance.
The difference in means and the t-test of significance for the 16 PF
is shown in Table 6. Although there is no difference that is statistically
significant between the groups, the direction of the differences between
means of the groups can be inspected. The greatest differences, when
a !-teat score of 0.200 or above is used as a cutting-score, are shown
on factors B, F, G, and N on initial testing. The experimental group tends
to be more intelligent (B), more happy-go-lucky (F), more expedient (G), and
more forthright (N). On second testing, the experimental group is less
happy-go-lucky (F) than the control group, less forthright (N), more
conservative (Q1), more casual (Q
3), and more tense (Q4). These differences

Factor
.. 'A,.
B
c
E
F
G
H
I
L
M
N
0
Ql
Q2
Q3
Q4
Anxiety
TABLE 6
16 PF: !,-TEST ON DIFFERENCES BETWEEN GROUP MEANS
OF EXPERIMENTAL AND CONTROL GROUPS
Pre-test Post-test
Difference Proba- Diff'erence ·in Means t-test bility Factor in Means --0.349 -0.115 NS. A. -0.029
+l.o89 +0 • .567 NS B -0.309
-0.089 -0.029 NS c -0.397
-o.o40 -0.014 NS E +0.331
+0.646 +0.223 NS F -o.889
-0.520 -0.202 NS G +0.563
-0.097 -0.030 NS H -0.417
-0.166 -0.051 NS I +0.369
-0.129 -0.042 NS L -0.328
+0.420 +0.154 NS M -0.223
-1.354 -o.48o NS N -0.751
-0.003 -0.001 NS 0 +0.126
+0.211 +0.088 NS Ql -o.420
+0.332 +0.133 NS Q2 +0.314
+0.429 +0.170 NS Q3 -0.720
+0.051 +0.016 NS Q4 +0.994
-0.074 -0.024 NS Anxiety +0.651
df = 68
59
Proba-t-test bility --0.009 NS,
-0.127 NS.
-0.115 NS
+0.123 NS
-0.339 NS
+0.195 NS
-0.121 NS
+0.141 NS
-0.106 NS
-0.091 NS
-0.291 NS
+O.o41 NS
-0.208 NS
+0.126 NS
-0.274 NS
·+0.287 NS
+0.196 NS
p ~.05 = 2.000 Note: Positive sign indicates that the experimental group mean is higher;
negative sign indicates that the experi~ental group mean is lower.·
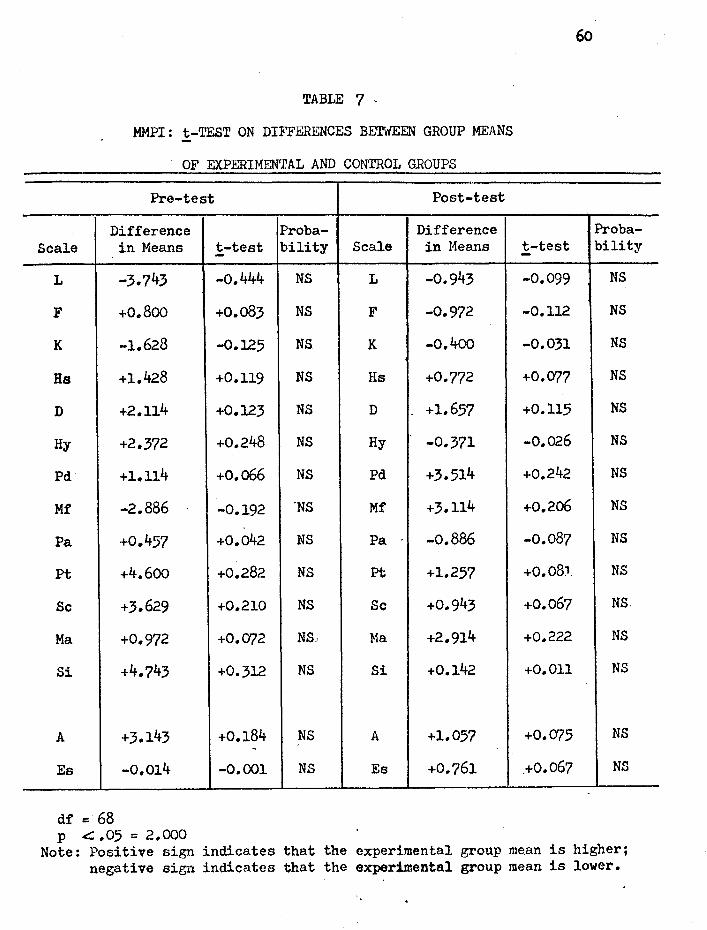
60
TABLE 7 -
MMPI : t-TEST ON DIFFERl."'NCES BETWEEN GROUP MEANS
OF EXPERIMENTAL AND CONTROL GROUPS
Pre-test Post-test
Difference Proba- Difference Proba-Scale in Means t-test bility Scale in Means t-test bility -
L -3.743 -o.444 NS L -0.943 -0.099 NS
F +0.800 +0.083 NS F -0.972 -0.112 NS
K -1.628 -0.125 NS K -0.400 -0.031 NS
Ha +l.428 +0.119 NS Hs +0.772 +0.077 NS
D +2.114 +0.123 NS D +1.657 +0.115 NS
Hy +2.372 +0.248 NS Hy -0.371 -0.026 NS
Pd +1.114 +0.066 NS Pd +3.514 +0.242 NS
Mf -2.886 -0.192 'NS Mf +3.114 +0.206 NS
Pa +0.457 +O.o42 NS Pa -o.886 -0.087 NS
Pt +4.600 +0.282 NS pt +1.257 +o.o8J. NS
Sc +3.629 +0.210 NS Sc +0.943 +0.067 NS.
Ma +0.972 +0.072 NS) Ma +2.914 +0.222 NS
Si +4.743 +0.312 NS Si +0.142 +0.011 NS
A +3.143 +0.184 NS A +1.057 +0.075 NS .
Es -0.014 -0.001 NS Es +0.761 .+0.067 NS
df = 68 p .c:::: .05 = 2.000
Note: Positive sign indicates that the experimental group mean is higher; negative sign indicates that the experimental group mean is lower.
61 are not at the .05 level of significance and must be interpreted in the
context of where the mean is located. When the mean is near 5.5 stens,
e.g. 5.691 as the Q~ mean of the experimental group on post-testing, the
adjective "more-tense" is somewhat misleading.
The j:,-test of differences between group means on the MMPI is given
on Table 7. Again there is no statistically significant difference
between the two groups either before or after the session. But inspection
shows some tendencies in differences between the groups. On initial
testing the greatest differences between the groups are on scales L, Hy,
Pt, Sc, and Si. The experimental group is lower on the L scale, and higher
on Hy, Ft, Sc, and Si using 0.200 as a cut-off score on the j:,-test.
When comparing control group with experimental group the standard
j:,-test between groups is used. But when comparing scores of subjects within
a group, either experimental or control, on pre- and post-testing, a
direct-difference application of the !-test is appropriate and more powerful.
When the same subjects are used for the first and second tests, then one can
obtain the difference between raw scor~s for each subject. This does not
change the difference between means of the groups, but it does affect the
variability of the distribution of direct differences. The standard error of
the mean difference is used to compute the j:_-value. It reduces the degrees
of freedom since paired raw scores are involved.
The results of the !-test on direct differences for both groups
on the factors of the 16 PF are given in Table a·. Those who participated
in the group session show significant changes at the .05 level on factors
E, G, H, and Q4• They are significantly more assertive (E), more consci
entious (G), more venturesome (H), and less tense CQ4) than they were before
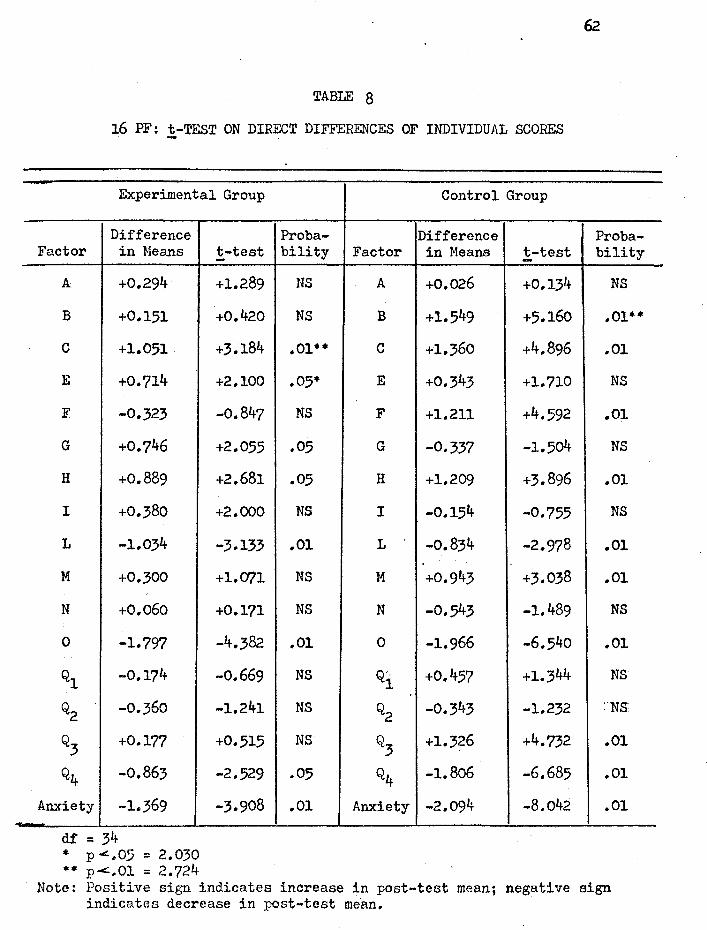
-
TABLE 8
16 PF: t-TEST ON DIRECT DIFFERENCES OF INDIVIDUAL SCORES
Experimental Group
Difference Factor in Means
A +0.294
B +0.151
c +1.051
E +0.714
F -0.323
G +0.746
H +0.889
I +0.380
L -1.034
M +0.300
N +0.060
0 -1.797
Ql -0.174
Q2 -0.360
Q3 +0.177
Q4 -0.863
Anxiety -1.369
df = 34 • p <.,05 = 2.030 ** p...::.01 = 2.724
t-test
+1.289
+0.420
+3.184
+2.100
-0.847
+2.055
+2.681
+2.000
-3.133
+l.CJ71
+0.171
-4.382
-0.669
-1.241
+0.515
-2.529
-3.908
Proba-bility
NS
NS
.01••
.05•
NS
.05
.05
NS
.01
NS
NS
.. 01
NS
NS
NS
.05
.01
Control Group
Difference Factor in Means t-test -
A +0.026 +0.134
B +1.549 +5.16o
c +1.360 +4.896
E +0.343 +1.710
F +1.211 +4.592
G -0.337 -1.504
H +1.209 +3.896
I -0.154 -0.755
L -0.834 -2.978
M +0.943 +3.038
N -0.543 -1.489
0 -1.966 -6.540
Q'' 1 +0.457 +1.344
Q2 -0.343 -1.232
Q3 +1.326 +4.732
Q4 -1.806 -6.685
Anxiety -2.094 -8.042
Proba-bility
NS
.01••
.01
NS
.01
NS
.01
NS
.01
.01
NS
.01
NS
:Ns
.01
.01
.01
Note: Positive sign indicates increase in post-test mean; negative sign indicates decrease in post-test me·an.
the session. At the .oi level of significance they have more ego strength
or are emotionally more stable (C), are more trusting (L), are more
placid, self-assured, or confident (0), and less anxious (Anxiety) after
the session than before it.
The control group also shows significant changes on the 16 PF.
At the .Ol level, they are more intelligent (B), have more ego strength (C),
are more happy-go-lucky (F), are more venturesome (H), are more trusting (L),
are more imaginative (M), are more placid (O), more casual (Q3
), less
tense (Q4), and less anxious (Anxiety) than they were on initial testing.
Although the changes in the participants of the group session are
positive, they are confounded by the changes in the control group. The
control group shows the same direction of chsnge in ego strength and anxiety
(C, O, Q4, and Anxiety). The only chang~shown by the experimental group "
which a.re not shared by the control group are in factors E (more assertive)
and G (more conscientious). On the other hand, the control group shows
changes in intelligence (B), being happy-go-lucky (F), imaginativeness (M)
and bei~g more controlled (Q3
) not shared by the participants of a session.
If our hypothesis that the control group was affected by a specifically
anxious testing situation on their initial testing were true, not only would
that help explain the reduction in anxiety related factors on second testing,
but the increase of intelligence.and imaginativeness which is otherwise
difficult to account for and to some extent the increase in enthusiasm or
being happy-go-lucky (F) might be accounted for. In any case, the positive
changes noted in those participating in the session as reflected on the 16 PF
are confounded by equally marked.changes in the controls who did not partici-
pate.
On the MMPI, the changes are more discriminative between control
and experimental groups as is seen in Table 9. Here the participants in
the group session changed on scales D and Mf at the .05 level of signifi
cance and on scales L, F, K, Pt, Sc, Si, A, and Es at the .01 level.
In contrast, the control group changed at the .01 level only on the A
scale, and at the .05 level on K, D, Mf, Pt, Sc, and Es. Both groups did
show significant changes on K, D, Mf, Pt, Sc, and A, but participants on
the group session changed with a higher degree of significance. There are
no scales on which the control group changed significantly that the
experimental group did not, whereas the participants of a session also
changed on scales L, F, and Si. The level of significance is higher in
the group that participated in a session (.01 level) for scales K, Pt, Sc,
and Es where the control group also showed significant change at the .05
level.
On one scale, Mf, both groups changed significantly, but whereas the
control group decreased, the experimental group.increased.
It should also be noted that on those scales where the degree
of change did not reach the level of significance, the direction of the
tendency to change as indicated by the difference in means is in a direction
indicative of health. In the experimental gro~p scales Hs, Hy, Pd, and Pa
did decrease, though not to a level of significance. So when these results
are also included, there is certainly no evidence that the sessions were
detrimental. And when it is considered that no means were taken to separate
among those who participated between those who were successes and those who
were not, the results are even more positive.
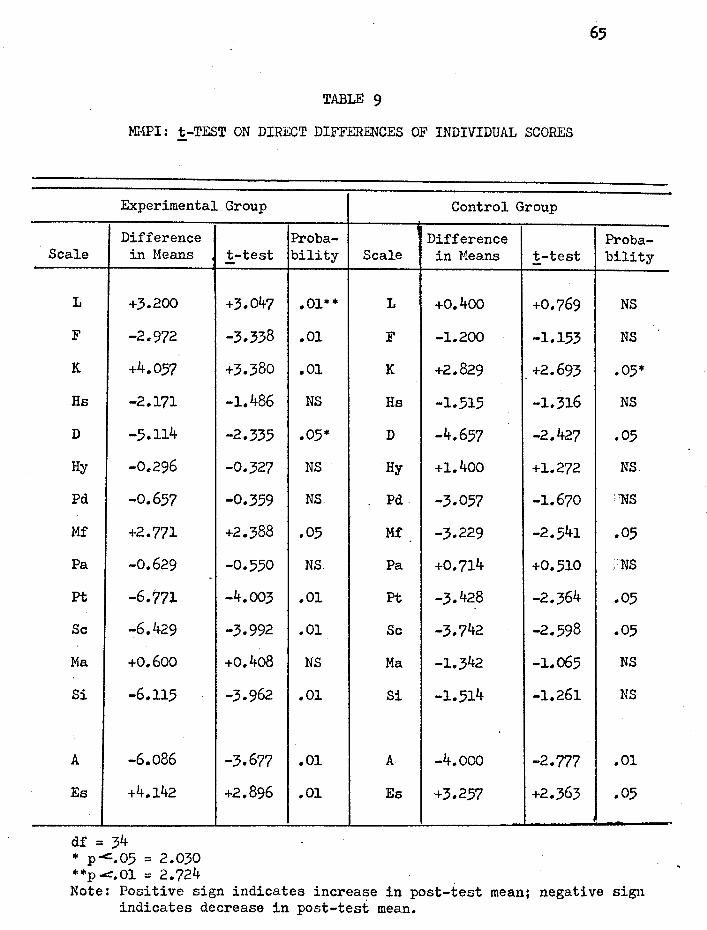
TABLE 9
Ml'1PI: t-TEST ON DIRECT DIFFERENCES OF INDIVIDUAL SCORES
Experimental Group
Difference Scale in Means
L +3.200
F -2.972
K. +4.057
Hs -2.171
D -5.114
Hy -0.296
Pd -0.657
Mf +2.771
Pa -0.629
pt -6.771
Sc -6.429
Ma +0.600
Si -6.115
A -6.086
Es +4 .. 142
df = 34 * p-c::.05 = 2.030 * *p .c:=. 01 = 2. 724
t-test
+3.047
-3.338
+3.380
-1.486
-2.335
-0.327
-0.359
+2.388
-0.550
-4.003
-3.992
+0.4o8
-3.962
-3.677
+2.896
Control Group
Proba- Difference bility Scale in Means t-test
.01** L +0.400 +0.769
.01 F -1.200 -1.153
.01 K +2.829 +2.693
NS Hs -1.515 -1.316
.05* D -4.657 -2.427
NS Hy +1.400 +1.272
NS Pd -3.057 -1.670
.05 Mf -3.229 -2 • .541
NS. Pa +0.714 +0.510
.01 Pt -3.428 -2.364
.01 Sc -3.742 -2.598
NS Ma -1.342 -1.o65
.01 Si -1.514 -1.261
.01 A -4.ooo -2.777
.01 Es +3.257 +2.363
65
Proba-bility
NS
NS
.05*
NS
.05
NS
:'NS
.05
:NS
.05
.05
NS
NS
.01
.05
Note: Positive sign indicates increase in post-test mean; negative sign indicates decrease in post-test mean.

Since the rating scale of Story Sequence Analysis scoring system
has no equal intervals, it cannot be treated with parametric statistics.
The intensity of the scored import is indicated by -2,-1, or +1 and +2
(Arnold, 1962). These levels of positive or negative motivation cannot
be considered a metric scale, since when a rater changes from positive
to negative scoring, it ia not a step equal to changing from 1 to 2 on
the same side of the scale. This intrinsic inequality of steps in the
rating scale limits the type of statistics that can be used, and so
non-parametric methods that depend on rank ordering are used.
The results of the two ·non-parametric tests applied to the Motiva
tion Index data are given in Table 10. The Wi~coxon Matched-Pair Signed
Ranks Test is applied to comparisons between pre- and post-testing of each
group because the scores of subjects can be ma.tched as was done with the
parametric !-test on direct differences above. When comparing the two
groups, where matching is not possible, the Mann-Whitney U Test is employed.
When the two groups are compared on the initial testing there is
no significant difference between the groups. When they are compared on
second testing, the Motivation Index is significantly different. Whereas
the two groups were not initially different in the level of positive
motivation, after the experimental group had participated in a session,
their level of motivation is significantly higher than the controls as is
shown by the Mann-Whitney U Test.
The participants in the DC group session showed a significant increase
in their level of positive motivation after the session at the .01 level of
significance by a Wilcoxon Signed-Ranks Test. Th~ control group did not
change significantly between the two testings, The Motivation Index appears

TABLE 10
TAT: NON-PARAMETRIC TESTS ON MOTIVATION INDEX
A. Wilcoxon Matched-Pair Signed Ranks Test
Experimental Group Pre-post Comparison
Control Group Pre-post Comparison
B. Mann-Whitney U Te.st
Pre-test Experimental and Control
Comparison
Post-test Experimental and Control
Comparison
• p <: • 01 z = 2. 58 p < .05 z = 1.96
!-score Probability
4.777 .01 •
0.812 NS
!-score Probability
0.153 NS
4.454 .01 •
67

68
to reflect a change of motivation in those who participate on the group
session and is not changed over time in those who did not participate.
With regard to the hypotheses that were made related to anxiety,
ego strength, and level of positive motivation, the following results were
obtained:
(1) Participants in a DC therapy session show a significant decrease
in anxiety. On the 16 PF they show a significant decrease at the .Ol level
on the second-order Anxiety factor. Of the scales correlated to anxiety
on the 16 PF, they show a significant decrease at the .01 level on factors
0 and L and an increase on factor c. At the .05 level of significance there
is a decrease in factors H and Q4•
The control group, however, also showssignificant decrease in the
16 PF second order Anxiety factor at the .01 l~vel. On the scales correlated
to anxiety, the control group shows a significant decrease at the .01 level
on factors H, L, O, Q3
, and Q4, with a significant increase at the .Ol
level on factor c. And so, although the 16 PF reflects a decrease in anxiety
among those who participated on a DC group session, it shows as marked a
decrease in the control group who did not participate.
On the MMPI, participants in the DC session likewise show a signifi
cant decrease in anxiety at the .Ol level on scale A. On scales reported as
related to positive therapeutic change, the participants of a DC group session
show a significant increase at the .Ol level on K, and a significant decrease
at the .Ol level on Pt, Sc, and Si, and at the .05 level on D.
The control group showed a significant decrease in anxiety also on
the MMPI A scale at the .01 level. On scales rep~rted as related to positive
69
therapeutic change, the control group showed no change at the .Ol level
of significance; but at the .05 level scale K increased, while scales D,
Ft, and Sc decreased.
(2) Participants in a DC group session show a significant increase
in ego strength. On the 16 PF, participants in a session show increased
emotional stability or ego strength as measured by factor C at the .Ol
level of significance. The control group shows a similar significant in
crease at the .01 level on factor c. On the MMPI, participants in a DC
session show a significant increase on Barron's ego strength scale (Es)
at the .Ol level; the control group showed a significant increase but at
the .05 level.
(3) Participants in a DC group session show a significant increase
in positive motivation as indicated by the Motivation Index at the .Ol
level. The control group did not significantly change their Motivation
Index over an equivalent period of time. And whereas the two groups were
not significantly different in the level of motivation on initial testing,
those who participated in a DC session showed a significantly higher
Motivation Index at the .01 level than their controls on second testing.

,CH.A.Pl$R V
DISCUSSION
Of the three measures used to evaluate therapy in this study, Story
Sequence Analysis of the TAT is the only measure that clearly differentiates
between those who participated on a DC session and those who did not. Since
similar changes are found in the control group with the measures related to
anxiety and ego strength, we can conclude that the hypotheses regarding
anxiety and ego strength are only partially aupported. Whereas there was a
decrease in anxiety and an increase in ego strength in those who participated
on the session, the control group showed similar changes. It is tnte that the
levels of significance for the changes in measures related to anxiety and ego
strength on the MMPI are greater for the parti~ipants than for the control
group. The MMPI could be said to differentiate between the two groups to
some extent because of this difference in levels of significance. Although
neither the 16 PF nor the MMPI clearly differentiate between the two groups,
they do reflect a change in the direction of health for those who participated.
It is worth noting that the participants in a DC session did not increase in
anxiety nor decrease in ego strength. There is no indication that the effect
of therapy was detrimental.
In accounting for the change in the control group reflected on the
16 PF and the MMPI there are some sugges~iona. If the 16 PF were the only
measure used to evaluate the therapy, one would be inclined to conclude that
71
the therapeutic intervent~on, while not being detrimental, was not as thera
peutic as the mere passage of time. If the results of the MMPI were taken
alone as the measure of therapeutic change, one would be inclined to suggest
a contamination effect on the control group since the level of significance
for the change in the control group is not as high as it is for the partici
pants. Taking the results of both the MMPI and the 16 PF, it could be
suggested that both groups underwent a similar therapeutic intervention,
either through contamination or because of an artifact such as a specific
anxiety-producing situation at initial testing. It could also be suggested
that these instruments do not validly reflect the changes that do occur
following a DC session that di-fferentiate the participants from the control
group.
Since these suggested exylanations of the change in the control group
cannot be directly determined from the present data, we must conclude that
the MMPI and the 16 PF do not clearly differentiate between changes in ego
strength and anxiety occurring in participants of a DC session and a homo
geneous control group who did not participate on such a session.
However, the TAT did show a clear increase in positive motivation
in participants of a session that did not occur in the control group. This
test did differentiate between the groups. The fact that SSA of the TAT did
differentiate between the groups whereas the 16 PF and MMPI did not suggests
that it is a more valid instrument to measure the type of changes that occur
as a result of DC therapy with this nor~al range population than either the
16 PF or the MMPI.

72
Returning to the criteria of Meltzoff and Kornreich (1970) for an
adequate study of the evaluation of psychotherapy, we can now consider how
well the present study meets them.
{l) Freedom from major flaws that invalidate the conclusions. An
effort has been made not to conclude too much from the data. There is no
attempt to compare the effectiveness of DC therapy with other therapies,
only to determine what changes result from it and whether these changes are
beneficial or detrimental and whether they are better than no therapy. Since
the same therapist is involved in each group session, it cannot be demon
strated in this study whether the method of therapy is idiosyncratic to one
therapist. However, in each session there were one or two co-therapists
as well, so there is some indication that it is not.idiosyncratic. By com
bining three separate groups into the experimental group, the possibility
of over-generalizing from one startling success is reduced.
(2) Use of an appropriate control group and adequate sampling. The
control group is appropriate in terms of matching for age, sex, education,
marriage status, and psychological health. This selection of matched groups
contains the limitation of generalizing the results. Whether the results
hold true for other groups, e.g. for females, for married males, for married
couples, for a more pathological group, will need further studies with
their own controls. The possibility of an initial anxiety-producing
test situation for the control group has been suggested. This group was
tested initially at the beginning of the school year a.nd it is possible that
this was at a time when test-taking vas anxiety-producing. The possibility
73
of contamination of the control group has ~een mentioned. However, from the
results .of the data, this "contamination" would be of a positive therapeutic
nature, making the differentiation between groups even more difficult.
(3) Relative freedom from bias. Two of the measures (16 PF and
MMPI) are objective and so the possibility of investigator bias is unlikely
to enter. All scales of fhese two inventories were included in the results
to prevent an experimenter bias of including only those scales which show
desired results and discarding others. By including the results of all
scales, the possibility of statistical deviations as a result of chance alone
is increased. For that reason, hypotheses were limited to scales related
to specifically anxiety and ego strength which could be expected to change
as a result of therapy.
The TAT protocols were independently scored blindly by two persons
trained in SSA and the differences in scoring were conferenced to determine
the final score. This procedure prevents subjective factors from entering
in the scoring of the TAT.
Sampling bias was taken into account. The control group and the
experimental group were set at 35. A few subjects were lost because they
failed to take the follow-up tests. Some selection is inevitable in those
participating on the group session since such participation is voluntary
and a few persons were advised not to participate after pre-testing and
clinical interview. The control group subjects did not face the decision
of participating in such a session. However, once the control group and the
experimental group data was collected, the data to be stati~tically analyzed
was rounded to 35 subjects in each group by random procedure.
(4) Employment of reasonably objective, reliable, and valid criteria
measures. The rationale of the choice of measures was given in the review
of literature and the method. In the interpretation of results some
indication was given that two of the measures, the 16 PF and the MMPI,
were not aa valid to measure the results of DC therapy with this normal
range population group as was the TAT.
(5) Presentation and suitably analyzed and interpreted data. The
chapters on results and discussion have tried to do this.
In terms of judging the adequacy of this study, we must point out
three possible flaws: the possible 11 contaminat~on" of the controls by the
participants in the session which appears to be of a therapeutic nature;
the possi,bility of a specific ~iety-producing pre-test situation for the
control group; and the ~uestiona.ble validity of the 16 PF and the MMPI as
measures for therapeutic change in this normal range population. However,
the TAT did clearly differentiate between the groups and did not show the
effect of contamination or change in the specific pre-test situation. It
reflects a change in positive motivation occurring in those who participated
in a DC session vhich is not present in the control group.

CHAPTER VI
SUMMARY
Disclosure-confrontation is a form of group therapy introduced by
Donald J. Tyrell and used in his clinical practice. Its goal is to increase
the characteristics of truth, freedom, and care in the way participants
relate to others in the group and to significant persons in their lives
and it operates on the conviction that honest disclosure of one person to
another leads to the development of such mature relations. The open-ended
group session is considered a microcosm of life where a person commits him
self to be as open and honest with the group as he can and to remain with
the group until it has gone as far as possible to resolve the problems of
each person in the group. When disclosure is not spontaneous or complete
the person is confronted at whatever level of.personality it is relevant
so that barriers to disclosure are faced, whether these be emotional trauma
or value conflicts. Efforts are made to provide a corrective emotional
experience by re-enacting either in reality or through imagination situations
where the expression of fear, anger, or affection have been impeded or
inappropriately expressed in the past. This corrective experience is
necessarily emotional when the original barrier to mature relationships
was emotional in character; it is moral when values are in question and
intellectual when understanding is lacking.
The 16 PF, MMPI, and TA~ were· administered to 35 unmarried male
college students who participated in a DC therapy session and to a control

76
group of students from the same college matched for age, sex, marriage
status, educational level, and psychological health. The tests were
administered once before the students participated on a DC therapy session
and again after the session. Members of three different group sessions were
combined to form the experimental group. The control group was re-tested
after an equivalent period of time with~ut an intervening therapy session.
The 16 PF and MMPI were computer scored and the data analyzed in
stens and T-scores respectively. The TAT protocols, using 13 stories
written by the subject at each testing, were scored using Arnold's method
of Story Sequence Analysis independently by this investigatQr and blindly
by Dr. Arnold. Differences between scoring were conferenced with Dr. Arnold
and a final score determined. The Motivation Index for each protocol was
computed and used in the statistical analysis.
It was hypothesized that (1) participants in a DC group session would
show a decrease in anxiety while the control group would show no change in
anxiety over an equivalent period of time; (2) participants in a DC session
would show an increase in ego strength while the cont~ol group would show no
change in ego strength; and (3) participants in a DC session would show an
increase in positive motivation while the motivation level of the control
group would not change.
(1) Those who participated in the DC group session did significantly
decrease in anxiety at the .01 level on both the 16 PF and the MMPI measures.
But the control group also showed a decrease in anxiety at the .01 level. The
16 PF reflected marked changes in both experimental and control groups on
factors correlated to anxiety. The MMPI showed changes on clinical scales

reported to be related to positive therapeutic change in both experimental
and control groups, but the changes in participants in a DC session were
at the .Ol level of significance whereas the level of significance for the
control group was .05.
(2) Participants in a DC group session showed an increase in ego
strength at the .Ol level of significance on both the 16 PF factor C and
the MMPI Es scale. The control group also showed a significant increase in
ego strength, at the .Ol level on the 16 PF factor C and.at the .05 level
on the MMPI Es scale.
(3) Participants in a DC session showed a significant increase in
positive motivation as indicated by the increase in Motivation Index at the
.01 level, whereas the control group did not change. On initial testing the
two groups were not significantly different in.their level of motivation;
but after participating in the DC session, the experimental group had a
significantly higher level of motivation at the .Ol level than the control
group.
The three measures used to evaluate DC therapy each show positive
change after participation in a session in terms of a decrease in anxiety,
an increase in ego strength, and an increase in positive motivation. However,
the decrease in anxiety and the increase in ego strength of the experimental
group are confounded by sim~lar changes in the control group as reflected
on 16 PF factors and MMPI scales.
The Motivation Index clearly differentiates between the two groups,
showing significant increase in the level of motivation in the participants

?8
of a session and no significant changes in those who did not participate.
This supports the reliability and validity of SSA to evaluate the outcome
of therapy.

79
REFERENCES
Adams, H.B. and Cooper, D. Three measures of ego strength and prognosis for psychotherapy. Journal of Clinical Psychology;, 1962, 18, 490-494.
Arnold, Magda B. A demonstration analysis of the Thematic Apperception Test in a clinical setting. Journal £!: Abnormal ~ Social Psychology, 1949, 44, 97-111. .
Arnold, M.B. and Gasson, J.A. ~Human Person. New York: Ronald Press, 1954.
Arnold, M.B. Emotion ~ Personalit~. Vol. I: Psychological Aspects, Vol. II: Neurological. and Physiological Aspects. New York: Columbia University Press, 1960.
Arnold, M.B. Storl Sequence Analysis: !::;, ~ Method ,2! Measurin& Motivation ~ Predicting Achievement. New York: Columbia University Press,1962.
Bach, George R. The marathon group: intensive practice of intimate interaction. Psychological Reports, 1966, 18, 995-1002.
Bach, G. R. Marathon group dynamics: I •. Some ·functions of the professional facilitator. Psychological Reports, 1967, 20, 99p-999.
Bach, G.R. Marathon group dynamics: II. Dime.nsions of helpfulness: therapeutic aggression. Psychological Reports, 1967, 20, 1147-1158.
Bach, G.R. Marathon group dynamics: III. Disjunctive contacts. Psychological Reports, 1967, 20, 1163-1172. ·
Barron, F. Some test correlates of response to therapy. Journal of Consult~ Psycholo~, 1953, 17, 235-241.
Barron, F. An ego-strength scale which predicts response to psychotherapy. Journal£! Consulting Psychology, 1953, 17, 327-333.
Barron, F. and Leary, T.F. Changes in psychoneurotic patients with and without therapy. Journal £! Consulting Psycholog;y, 1955, 19,239-245.
Bergin, A.E. and Strupp, H.H. New directions in psychotherapy research. Journal ,2! Abnormal· Psychology, 1970, 76, 13-26.
Bindrim, P. A report on a nude-marathon. Psychothera;ez: Theory, Research, ~ Practice, 1968, 5, 180-188.

Bo
Brown, Joseph E. Personality dynamics of high and low achievers in high school: a modified Thematic Apperception Test reliability study. Master's thesis. St. Louis University, St. Louis, 1953.
Cartwright, D.S. Effectiveness of psychotherapy: a critique of the spontaneous remission argument. Journal 2f Counseling Psychology, 1955, 2, 290-296.
Cartwright, D.S. Note on "changes in psychoneurotic patients with and without psychotherapy." Journal 2f Consulting Psycholof5l, 1956, 20, 403-404.
Cattell, R.B. Personaliti ~Motivation Structure ~ Measurement. New York: World Book Co., 1957•
Cattell, R.B. Second order personality factors in the questionnaire realm. Journal 2f Consulting Psychology, 1956, 20, 411-421.
Cattell, R.B., Eber, H.W., and Tatsuoka, M.M. Handbook for the Sixteen PersonalitJ: Factor Questionnaire (16 PFJ. Institute-fOr Personality Testing, Champaign, Illinois, 1970.
Cattell, R.B. and Bolton, L.S. What pathological dimensions lie beyond the normal dimensions of the 16 PF? A comparison of MMPI and 16 PF factor dimensions. Journal 2f Consulting ~ Clinical Psycholo&;Y, 1969, 33, 18-29.
Cattell, R.B., Rickels, K., Weis, c., Gray, B., and Yee, R. The effects of psychotherapy upon measured anxiety and regression. American Journal ,2! Psychotherapy, 1966, 20, 261-269 •.
Corotto, L.V. and C~nutt, R.H. Eget strength: a function of the measuring instrument. Journal 2f Projective Techniques, 1962, 26, 228-230.
Crumpton, E., Cantor, J.M., and Batiste, c. A factor analytic study of Barron's ego-strength scale. Journal .2.f Clinical ~pzcho~?Sit 1960, 16, 283-291.
Dahlstrom, W.G., and Welsh, G.S. An MMPI Handbook: A Guide to Use in Clinical Practice and Research.°11inneapolis: Univ;r'Srty-of°"'Miiiiiesot-;----- ?--Press, 19o0.
DeCharms, R., Levy, J., and Wertheimer, M. A note on attempted evaluations of psychotherapy. Journal 2f Clinical Psychology, 1954, 10, 233-235.
Dulin, J. T. Prediction of academic achievement· in college. Doctoral dissertation. Loyola University, Chicago, 1968.
Endicott, N.A. and Endicott, J. · Prediction of improvement in treated and untreated patients using the Rorschach prognostic rating scale. Journal £! Consulting Psychol.05~~ 1964, 28 1 342-348.
81 Eysenck, H.J. Effects of psychotherapy: an evaluation. Journal .2! Consulting
PsycholoSI, 1952, 16, 319-324.
Eysenck, H.J. Effects of psychotherapy: a reply. Journal 2.f Abnormal~ Social Psychology;, 1955, 50, 147-148.
Eysenck, H.J. Handbook .2f Abnormal Psychology. London: Pitman, 1960.
Eysenck, H.J. The outcome of psychotherapy: a reply. Psychotherapy: Theory, Research, ~ Practice, 1964, 1, 97-100.
·Eysenck, H.J. The effects of psychotherapy. International Journal of Psychiatry, 1965, 1, 99-142.
Fields, R. M. A personality description of the unwed pregnant adolescent using Story Sequence Analysis. Master's thesis. Loyola University, Chicago, 1965.
Fiske, D.W., Cartwright, D.S., and Kirtner, W.L. Are psychotherapeutic changes predictable? Journal .£f Abnormal~ Social' Psychology, 1964, 69, 418-426.
Gallagher, J.J. MMPI changes and client-centered therapy~ Journal of £2.!!sultin~ Psychology, 1953, 17, 334-338.
Garvin, J.A. A Thematic Apperception Test study of non-intellective factors related to academic success on the college level. Doctoral dissertation. Loyola University, Chicago, 1960.
Getter, H., and Sundland, D.M. T'ne Barron ego-strength scale and psychotherapeutic outcome. Journal of Consulting Psychology, 1962, 26, 195.
Glasser, w. Realit~ Therapy: ! ~Approach!,!?. Psychiatry. and Row. 19 5.
New York: Harper
Gocka, E.F. and Marks, J.B. Second order factors on the 16 PF Test and MMPI inventory. Journal .2f Clinical Psychology, 1961, 17, 32-35.
Grace, D.P. An experimental study of the validity of Barron's ego-strength scale. Doctoral dissertation. University of Miss?uri, 1960.
Hawkinson, J.R. A study of the construct validity of Barron's ego-strength scale with a state mental hospital population. Doctoral dissertation. University of Minnesota, 1961.
Herron, W.G., Guido, S.M., and Kantor, R.E. Relationships among ego strength measures. Journal £!. Clinical Psychology, 1965, 21, 403-404.

Hundleby, J.D. and Connor, W.H. Interrelationship betwee.n personality inventories: the 16 PF, the MMPI, and the MPI. Journal .2! Consultina ~Clinical Psychology;, 1968, 32, 152-157.
Jourard, s. !!!! Transparent .§.!tl!• Princeton, N.J.: D. Van Nostrand Co., 1964.
Karson, s. The 16 PF Test in clinical practice. Journal of Clinical Psychol~' 1960, 1.6, 174-176.
Karson, s. Second~order personality factors in positive mental health. Journal ,2! Clinical Psychology;, 1961, 17, 14-19.
Karson, s. and Pool, K.B. The construct validity of the 16 PF Test. Journal .2! Clinical Esychology, 1957, 13, 245-252
Karson, s., and Pool, K. B. Second-order factors in personality measurement. Journal .2.f. Consultin5 Psychology, 1958, 22, 299-303.
Kassebaum, G.G., Couch, H.S., and Slater, P.E. The factorial dimensions of the MMPI. Journal 2f. Consulting Psychology, 1959, 23, 226-236.
Kaufmann, P. Changes in the MMPI as a function of psychiatric therapy. Journal .2.f Consultins Psychology-, 1950, 14, 458-464.
La Forge, R. A correlation study of two personality tests: the MMPI and the Cattell 16 PF. Journal£!: Consulting Psycholog;c, 1962, 26, 402-411.
Leary, T.F. and Harvey, J.s. A methodology for measuritig personality changes in psychotherapy. Journal .2f Clinical Psycholo~, 1956, 12, 123-132.
Luborsky, L. A note on Eysenck's article "The effects of psychotherapy: an evaluation." British Journal £! Psychologz, 1954, 45, 129-131.
Mainord, W.A. Operant group psychotherapy in a total institution setting. The Dis-Coverer, 1968, 5 (Nos. 1 and 2, entire issue).
McCandlish, L.A. An investigation of a new method of TAT analysis. Doctoral dissertation. Loyola University, Chicago, 1958.
Meltzoff, J. and Kornreich, M. Research,!!! Psychotherap~. New York: Atherton, Inc., 1970.
Modlin, H.C. A study of the Minnesota Multiphasic Personality Inventory in clinical practice. American Journal .!?.f. Psychiatry, 1947, 103, 758-769.
Mowrer, O.H. Group therapy and therapeutic communities examined in the light of behavior modification principles. Address to the :F.'irst Southern Califor·nia Conference on Behavior Modification. Los Angeles, Calif., Oct. 9, 1969.
Mozak, H.H. Evaluation of psychotherapy: a study of some current measures. Doctoral dissertation. University of Chicago, 1950.
O'Dell, J.W., and Karson, s. Some relationships between the MMPI and 16 PF. Journal .2£ Clinical PsychologY, 1969, 25, 279-?83.
Purcell, C.K., Drevdahl, J., and Purcell, K. The relationship between altitude-I.Q. discrepancy and anxiety. Journal .2.f Clinical Psychology, 1952, 8, 82-85.
Quay, H. The performance of hospitalized psychiatric p~tients on the ego strength scale of the MMPI. Journal 2f Clinical Psycholo6I, 1955, 11, 403-405.
Quinn, T.L. Differences in motivational patterns of college student Brothers as revealed in the TAT, the rating of their peers and the rating of their superiors: a validation study. Doctoral dissertation. Loyola University, Chicago, 1961.
Ramirez, J. Augustine. Changes in motivation during client~centered therapy as measured by the Story Sequence Analysis of the TAT. Doctoral dissertation. Loyola University, Chicago, 1970.
Rashkis, H.A. and Shaskin, D.A. ality inventory scales. 16, 345-349.
The effects of group psychotherapy on personAmerican Journal .2£ Orthopsychiatrz, 1946,
Roos, P. Performance of psychiatric patients on two measures of ego strength. Journal .2f Clinical Psycholog;y, 1962, 18, 48-50.
Rosensweig, s. A transvaluation of psychotherapy--a reply to Hans Eysenck. Journal 2f. A~normal ~ Social Psychologz, 1954, 49, 298-304.
Schofield, W. Changes in responses to the MMPI following certain therapies. Psychological Monog:raphs, 1950, 64, No. 5, Whole No. 311.
Schofield, W. A further study of the effects of therapy on MMPI responses. Journal£! Abnormal~ Social ~cholofP!:t.. 1953, 48, 67-77e'
Snider, L.B. A research method validating self-determination. In ~Human Person by M.B. Arnold and J.A. Gasson. New York: Ronald Press, 1954.
Stampfl, T.G. and Levis, D.J. The essentials of implosive therapy: a learning theory based psychodynamic behavioral therapy. Journal£! Abnormal Psicho~, 1967, 72, 496-503.
Tamkin, A.S. An evaluation of the construct validity of Barron's ego strength scalee Journal .2£ Clinical Psychologx, 1957, 13, 156-158.
84
Tyrell, Donald J. press).
When Love is Lost. Waco, Texas: Word Press, 1971 (in ---------Welsh, G.S. Factor Dimensions A and R. In G.S. Welsh and W.G. Dahlstrom
(Eds.) Basic Readings£!!~~!!! Psycholo~ ~Medicine. Minneapolis: University of Minnesota Press, 195 •
Wirt, R.D. Further validation of ego-strength scales. Journal .2f Consulting Psychology, 1955, 19, 444.
Wolpe, J. The systematic desensitization treatment of neuroses. Journal t ,2,! Nervous ~ Mental Diseases, 1961, 132, 189-203.
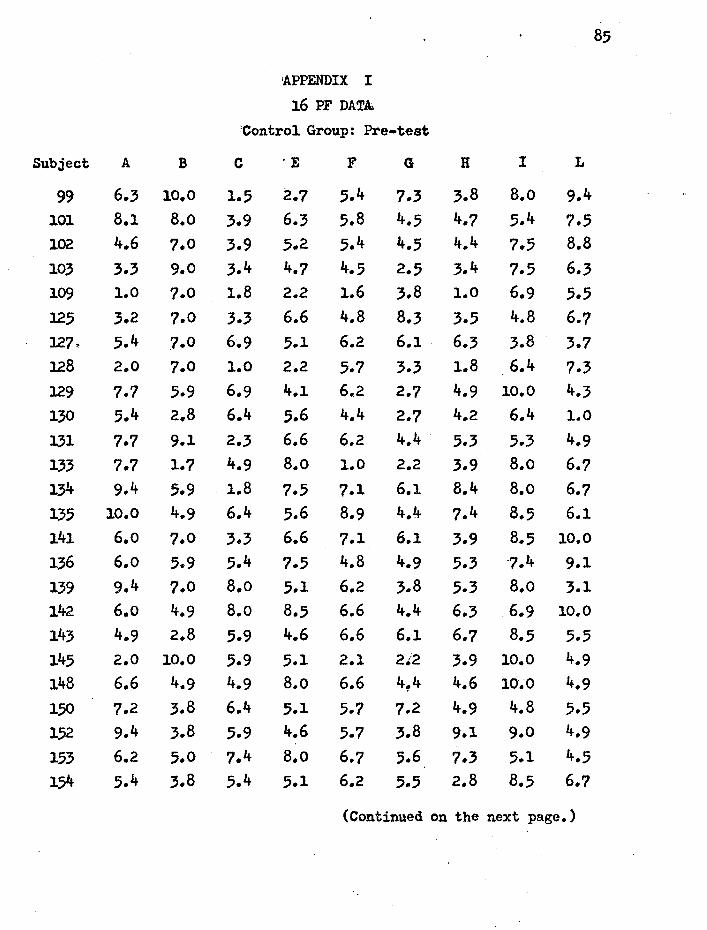
85
'APPENDIX I
16 PF DATA.
:control Group: Pre-test
Subject A B c ·E F G H I L
99 6.3 10.0 1.5 2.1 5.4 7.3 3.8 B.o 9.4 101 8.1 8.o 3.9 6.3 5.8 4.5 4.7 5.4 7.5 102 4.6 1.0 3.9 5.2 5.4 4.5 4.4 7.5 8.8 103 3.3 9.0 3.4 4.7 4.5 2.5 3.4 7.5 6.3 109 1.0 1.0 1.8 2.2 1.6 3.8 1.0 6.9 5.5 125 3.2 1.0 3.3 6.6 4.8 8.3 3.5 4.8 6.7 127. 5.4 7.0 6.9 5.1 6.2 6.1 . 6.3 3.8 3.7 128 2.0 7.0 1.0 2.2 5.7 3.3 1.8 6.4 7.3 129 7.7 5.9 6.9 4.1 6.2 2.7 4.9 10.0 4.3 130 5.4 2.8 6.4 5.6 4.4 2.7 4.2 6.4 1.0 131 7.7 9.1 2.3 6.6 6.2 4.4 5.3 5.3 4.9 133 7.7 1.7 4.9 8.o 1.0 2.2 3.9 8.o 6.7 134 9.4 5.9 . 1.8 7.5 7.1 6.1 8.4 8.o 6.7 135 10.0 4.9 6.4 5.6 8.9 4.4 ?.4 8.5 6.1 141 6.o 7.0 3.3 6.6 7.1 6.1 3.9 8.5 10.0
136 6.o 5.9 5.4 7.5 4.8 4.9 5.3 -7.4 9.1 139 9.4 7.0 8.o 5.1 6.2 3.8 5.3 B.o 3.1 142- 6.o 4.9 B.o 8.5 6.6 4.4 6.3 6.9 10.0 143 4.9 2.8 5.9 4.6 6.6 6.1 6.1 8.5 5.5 145 2.0 10.0 5.9 5.1 2.1 2t2 3.9 10.0 4.9 148 6.6 4.9 4.9 8.o 6.6 4~4 4.6 10.0 4.9 150 7.2 3.8 6.4 5.1 5.7 1.2 4.9 4.8 5.5 1.52 9.4 3.8 5.9 4.6 5.7 3.8 9.1 9.0 4.9
153 6.2 5.0 7.4 8.o 6.7 5.6 7.3 5.1 4.5 154 5.4 3.8 5.4 5.1 6.2 5.5 2.8 8.5 6.7
(Continued on the next page.)

86
16 PF DATA Control Group: Pre-test
Subject A B c E F G H I L
155 6.6 9.1 4.9 6.1 5.3 6.6 4.6 9.0 8.5 156 6.6 4.9 3.3 7.5 7.1 3.3 6.o 10.0 7.3 158 2.6 4.9 4.9 8.5 6.6 2.2 6.o 8.5 6.7 162 7.7 3.8 5.9 5.6 3.5 3.8 2.1 6.4 2.5 164 7.2 7.0 4.4 5.6 8.9 6.1 4.6 6.9 7.3 166 10.0 1.7 6.4 3.6 4.8 6.6 8.1 7.4 3.7 167 6.o 5.9 6.4 7.5 4.4 4.4 8.1 6.4 4.3 168 4.9 4.9 5.9 3.6 6.2 4.9 4.9 10.0 6.1 169 3.2 7.0 5.9 5.1 4.8 2.7 2.5 4.8 3.7 170 7.2 a.o 8.5 3.6 4.8 7.7 6.o 8.o 4.3
Sum Sum Factor of scores Mean Factor of scores Mean
A 212.9 6.083 G 165.1 4.717
B 208.4 5.954 H 176.o 5.029
c 177.4 5.o69 I 260.6 7.446
E 197.3 5.637 L 2o8.4 5.954
F 193.9 5.540
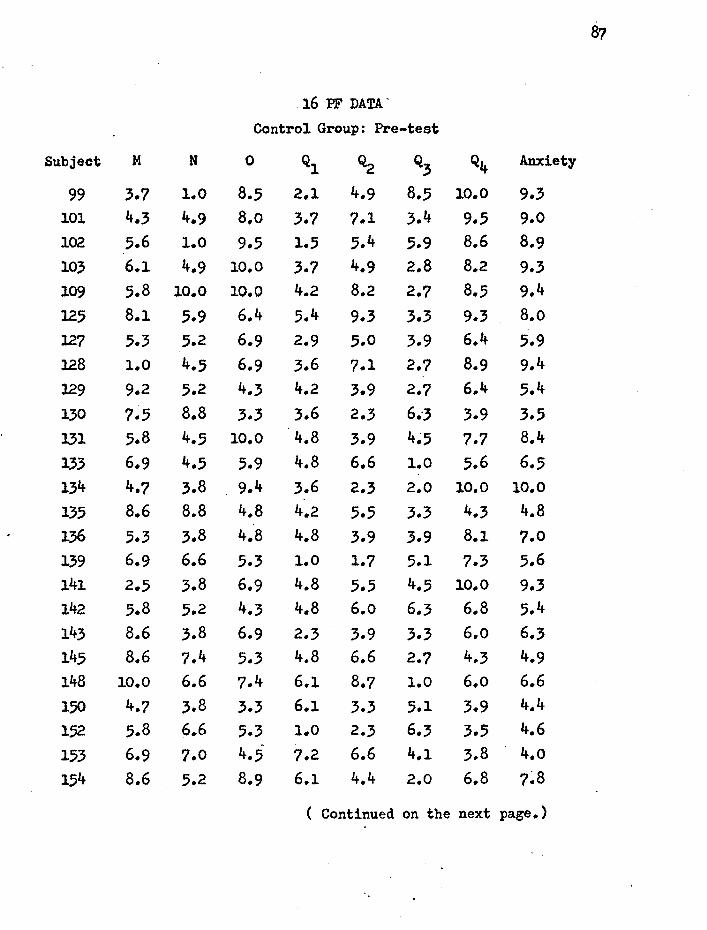
87
16 PF DATA'
Control Group: Pre-test
Subject M N 0 Ql Q2 Q3 Q4 Anxiety
99 3.7 l.O 8.5 2.1 4.9 8.5 10.0 9.3 101 4.3 4.9 8.o 3.7 7.1 3.4 9.5 9.0 102 5.6 1.0 9.5 1.5 5.4 5.9 8.6 8.9 103 6.1 4.9 10.0 3.7 4.9 2.8 8.2 9.3 109 5.8 10.0 10.0 4.2 8.2 2.7 8.5 9.4 125 8.l 5.9 6.4 5.4 9.3 3.3 9.3 8.o 127 5.3 5.2 6.9 2.9 5.0 3.9 6.4 5.9 128 l.O 4.5 6.9 3.6 7.1 2.7 8.9 9.4 129 9.2 5.2 4.3 4.2 3.9 2.7 6.4 5.4 130 7.5 8.8 3.3 3.6 2.3 6.-3 3.9 3.5 131 5.8 4.5 10.0 4.8 3.9 4~5 7.7 8.4
133 6.9 4.5 5.9 4.8 6.6 1.0 5.6 6.5 134 4.7 3.8 9.4 3.6 2.3 2.0 10.0 10.0 135 8.6 8.8 4.8 4.2 5.5 3.3 4.3 4.8 136 5.3 3.8 4.8 4.8 3.9 3.9 8.1 7.0 139 6.9 6.6 5.3 1.0 1.7 5.1 7.3 5.6 141 2.5 3.8 6.9 4.8 5.5 4.5 10.0 9.3 142 5.8 5.2 4.3 4.8 6.o 6.3 6.8 5.4 143 8.6 3.8 6.9 2.3 3.9 3.3 6.o 6.3 145 8.6 7.4 5.3 4.8 6.6 2.7 4.3 4.9 148 10.0 6.6 7.4 6.1 8.7 1.0 6.o 6.6 150 4.7 3.8 3.3 6.1 3.3 5.1 3.9 4.4
1.52 5.8 6.6 5.3 1.0 2.3 6.3 3.5 4.6
153 6.9 7.0 4.5· 7.2 6.6 4.1 3.8 4.o 154 8.6 5.2 8.9 6.1 4.4 2.0 6.8 7~8
( Continued on the next page.}

88
16 PF DATA
Control Group: Pre-test
Subject M 0 ·Q l Q2 Q3 Q4 Anxiety
155 3.1 5.2 5.3 8.6 6.6 5.7 2.7 5.1 156 10.0 5.2 8.4 6.7 8.2 1.0 8.9 8.4 158 5.8 5.2 10.0 5.4 6.o 3.9 8.9 8.2 162 5.8 7.4 4.3 4.8 6.6 5.1 4.3 4.6 164 7.5 6.6 6.4 3.6 4.4 3.3 7.7 7.5 166 4.2 3.8 2.8 5.4 5.0 7.5 3.1 3.4 167 4.7 4.5 3.8 7.9 5.0 5.1 5.2 4.2 168 5.3 6.6 8.4 5.4 5.5 4.5 5.2 6.6 169 7.5 5.2 5.9 4.8 7~1 6.9 4.7 4.7 170 6.4 . 5.9 3.8 5.4 4.4 8.7 3.l 3.1
Sum Sum Factor of scores Mean Factor of scores Mean
M 216.6 6.189 Q~ 188~1 5.374
N 188.4 5.383 Q3 149.0 4.257
0 225.9 6.454 Q4 227.6 6.503
Ql 159.3 4.551 Anxiety 229.5 6.557
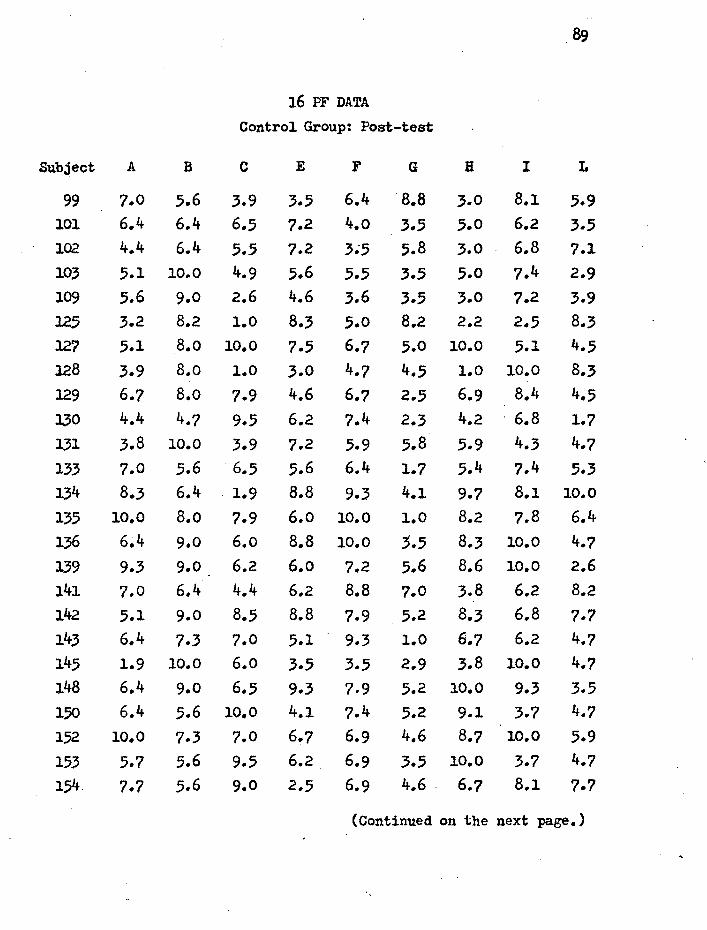
16 PF DATA
Control Group: Post-test
Subject A B c E F G B I L
99 7.0 5.6 3.9 3.5 6.4 8.8 3.0 8.1 5.9 101 6.4 6.4 6.5 7.2 4.o 3.5 5.0 6.2 3.5 102 4.4 6.4 5.5 7.2 3.;5 5.8 3.0 6.8 7.1 103 5.1 10.0 4.9 5.6 5.5 3.5 5.0 7.4 2.9 109 5.6 9.0 2.6 4.6 3.6 3.5 3.0 7.2 3.9 125 3.2 8.2 l.O 8.3 .5.0 8.2 2.2 2.5 8.3 127 5.1 8.o 10.0 7.5 6.7 5.0 10.0 5.1 4.5 128 3.9 8.o l.O 3.0 4.7 4.5 1.0 10.0 8.3 129 6.7 8.o 7.9 4.6 6.7 2.5 6.9 8.4 4.5 130 4.4 4.7 9.5 6.2 7.4 2.3 4.2 . 6.8 1.7 131 3.8 10.0 3.9 7.2 5.9 5.8 5.9 4.3 4.7 133 7.0 5.6 6.5 5.6 6.4 1.7 5.4 7.4 5.3 134 8.3 6.4 1.9 8.8 9.3 4.1 9.7 8.1 10.0
135 10.0 8.o 7.9 6.o 10.0 l.O 8.2 7.8 6.4
136 6~4 9.0 6.o 8.8 10.0 3.5 8.3 10.0 4.7 139 9.3 9.0 6.2 6.o 7.2 5.6 8.6 10.0 2.6 141 7.0 6.4 4.4 6.2 8.8 7.0 3.8 6.2 8.2 142 5.1 9.0 8.5 8.8 7.9 5.2 8.3 6.8 7.7 143 6.4 7.3 7.0 5.1 9.3 l.O 6.7 6.2 4.7 145 1.9 10.0 6.o 3.5 3.5 2.9 3.8 10.0 4.7 148 6.4 9.0 6.5 9.3 7.9 5.2 10.0 9.3 3.5 150 6.4 5.6 10.0 4.1 7.4 5.2 9.1 3.7 4.7
152 10.0 7.3 7.0 6.7 6.9 4.6 8.7 10.0 5.9
153 5.7 5.6 9.5 6.2 6.9 3.5 10.0 3.7 4.7
154 7.7 5.6 9.0 2.5 6.9 4.6 . 6.7 8.1 7.7
(Continued on the next page.)

90
16 PF DATA • Control Group: Post-test
Subject A B c E F G H I L
155 7.7 10.0 10.0 6.2 5.0 5.8 3.4 8.7 8.3 1.56 7.2 8.o l.O 9.1 7.7 1.7 5.1 9.1 7.0 158 1.0 5.6 3.9 4.6 10.0 1.0 7.1 8.7 5.9 162 ·8.3 6.4 8.5 6.2 5.0 2.9 7.1 6.8 2.3 164~ 7.2 8.o 6.8 7.0 10.0 2.5 7.3 7.2 5.8 166 10.0 5.6 8.o 5.1 6.4 8.8 7.9 7.4 4.1 167 5.6 9.0 6.2 6.5 5.2 4.o 7.7 6.7 1.0 168 3.8 6.4 8.o 5.6 5.9 5.8 7.1 8.7 2.9 169 l.O 7.3 10.0 1.9 6.4 4 .. 1 2.2 5.0 1.7 170 7.0 8.2 9.5 4.6 6.9 8.2 7.9 6.8 4.1
Sum Sum Factor of scores Mean Factor of scores Mean
A. 212.0 6.057 G 153.3 4.380
B 262.6 7.503 H 218.3 6.237
c 225.0 6.429 I 255.2 7.291
E 209.3 5.980 L 179.2 5.120.
F 236.3 6.751

91
16 PF DATA
Control Group: Post-test
Subject M N 0 Ql Q2 Q3 Q4 Anxiety
99 3.7 4.4 4.4 2.4 7.7 6.7 6.9 6.8 101 8.9 5.8 4.4 3.1 5.9 8.5 2.6 3.1 102 6.6 3.7 5.4 3.7 4-.7 6.1 7.9 6.7 103 4.9 7.3 5.4 3.7 4.7 3.7 4.5 5.2 109 7.3 5.6 6.5 5.2 5.6 8.1 6.3 6.2
125 5.4 5.8 7.9 4.4 7.7 5.5 10.0 9.4 127 4.6 1.0 3.3 5.8 5.0 6.8 3.8 2.2 128 5.2 3.2 6.5 1.0 5.0 3.5 7.8 9.2 129 10.0 5.6 3.3 5.2 3.9 5.4 3.8 ,.4 130 ?.7 8.o 2.0 4.4 5.3 5.5 1.0 l.O
131 7.7 3.7 7.4 5.8 5.3 3.7 6.9 6.6
133 6.6 6.6 3.5 4.4 4.7 3.7 2.6 3.7 134 4.3 5.1 7.9 5.1 l.O 3.1 10.0 9.5 135 9.0 3.2 5.5 3.0 3.3 3.5 4.7 4.9 136 6.6 5.1 2.5 5.1 4.7 5.5 4.5 3.7 139 5.2 3.2 5.0 5.8 4.5 8.7 2.6 2.4 141 3.7 1.0 6.9 7.8 3.5 6.7 8.4 7.9 142 6.o 2.3 2.5 6.4 6.5 7.3 5.5 3.5 143 8.3 3.0 5.4 5.1 2.9 4.9 5.0 4.5 145 8.9 8.o 5.4 7.1 7.1 2.4 5.0 5.2 148 10.0 5.1 2.0 4.4 6.5 4.9 2.6 2.2
150 8.3 4.4 3.0 1.0 4.1 6.1 1.0 1.5 152 6.6 5.1 3.9 5.1 1.0 6.1 2.6 . 3.6
153 7.1 5.1 4.9 7.1 4.7 5.5 3.1 2.6
154 9.4 7.3 5.9 5.1 5.3 4.3 4.5 4.7
(Continued on the next page.)

92
16 PF DATA'
Control Group: Post-test
Subject M N 0 Ql Q2 Q3 Q4 Anxiety
155 10.0 2.3 3.9 7.8 6.5 4.3 1.0 2.6 156 10.0 4.8 9.1 8.o 6.6 2.9 8.7 9.5 158 . 6.6 6.6 8.9 5.8 3.5 3.1 9.3 8.2 162 7.7 7.3 2.0 3.1 2.9 6.1 3.6 2.4 164 8.o 3.2 l.O 7.2 5.6 3.5 5.1 3.9 166 6.6 5.1 1.5 4.4 5.3 10.0 2.2 2.0 167 9.0 4.o l.O 6.5 5.0 7.4 3.0 1.5 168 5.4 5.8 3.9 5.1 5.9 6.1 4.5 3.6 169 7.7 7.3 2.5 5.8 9.5 7.9 1.7 1.0 170 6.6 4.4 2.5 4.4 4.7 7~9 1.7 1.8
Sum Sum Factor of scores Mean Factor of scores Mean
M 249.6 7.131 Q2 176.1 5.031
N 169.4 4.840 Q3 195.4 5.583
0 157.1 4.489 Q4 164.4 4.697
Ql 175.3 5.009 Anxiety 156.2 4.463

93
APPENDIX II
16 PF DATA
Experimental Group: Pre-test
Subject A B c . E F G H I L
84 6.9 10.0 3.4 3.2 6.8 3.5 6.5 10.0 .5.1 85 3.9 7.0 2.9 7.2 8.3 5.6 3.4 7.5 6.9 86 7.4 10.0 4.9 5.7 4.9 6.6 3.0 6.5 6.9 87 4.6 8.o 4.9 4.7 5.8 5.0 2.2 6.5 7.5 88 3.9 10.0 4.4 8.2 10.0 1.9 10.0 4.3 5.1 89 5.7 10.0 6.o 2.7 2.2 6.1 2.6 6.5 3.9 90 5.7 10.0 5.4 8.8 10.0 1.5 10.0 10.0 6.9 91 3.3 10.0 6.6 3.2 7.8 2.5 1.8 6.5 6.9 92 5.7 8.o 4.4 1.0 4 .. 9 3.0 3.0 7.5 3.3 93 6.3 7.0 3.9 4.2 10.0 6.6 5.1 8.o 9.4
105 5.4 5.9 6.9 2.7 4.8 3.8 3.2 6.4 4.3 lo6 8.3 3.8 4.9 8.o 5.7 2.7 5.6 10.0 6.7 lo8 6.6 5.9 . 10.0 8.o 5.3 4.9 9.1 3.8 4.3 111 8.3 7.0 1.8 6.6 8.o 4.9 8.4 8.5 10.0 112 9.4 1.0 1.0 5.6 5.3 7.2 4.2 5.9 6.7 115 4.9 4.9 5.4 1.0 1.6 7.7 2.8 -8.5 2.5 116 6.o 7.0 5.9 6.6 8.5 2.2 7.7 10.0 3.7 117 2.0 4.9 2.3 3.2 3.0 2.2 1.0 4.3 2.5 118 8.3 4.9 4.4 6.6 3.9 4.4 5.6 8.5 6.? 120 7.7 4.9 2.8 4.6 5.3 4.4 2.8 6.9 6.7 121 6.o 7.0 6.9 3.6 4.8 4 .• 9 5.6 9.0 3.1 122 3.7 7.0 4.9 4.6 4.8 3.8 2.8 6.4 4.9 123 4.3 7.0 5.9 7.5 2.5 5.5 3.9 8.o 3.7 125 3.2 8.2 1.0 8.3 5.0 8.2 2.2 2.5 8.3 127 5.1 8.o 10.0 7.5 6.7 5.0 10.0 5.1 4.5
(Continued on the next page.}

94
16 PF DATA
Experimental Group: Pre-test
Subject A B c ·E F G B I L
128 3.9 8.o 1.0 3.0 4.7 4.5 l.O 10.0 8.3 129 6.7 8.o 7.9 4.6 6.7 2.5 6.9 8.4 4.5 130 4.4 4.7 9.5 6.2 7.4 2.3 4.2 6.8 1.7 131 3.8 10.0 3.9 7.2 5.9 5.8 5 .. 9 4.3 4 .. 7 133 7.0 ,5.6 6.5 ,5.6 6.4 1.7 ,5.4 7.4 5 .. 3 134 8.3 6.4 1.9 8.8 9.3 4.1 8.7 8.1 10.0 13.5 10.0 8.o 7.9 6.o 10.0 1.0 8.2 7.8 6.4 138 1.9 5.6 2.9 7.2 2.6 2.9 1.8 8.7 6.5 14o 5.1 6.4 7.5 7.8 8.8 1.0 4.2 10.0 7.7 141 7.0 6.4 4.4 6.2 8.8 7.0 3.8 6.2 8.3
Sum Sum Factor of scores Mean Factor of scores Mean
A 200.7 ,5. 734 G 146.9 4.197
B 246.5 7.043 H 172.6 4.931
c 174.3 4.980 I 254.8 7.280
E 19.5.9 5.597 L <:::-203.9 5.826
F 216.5 6.186
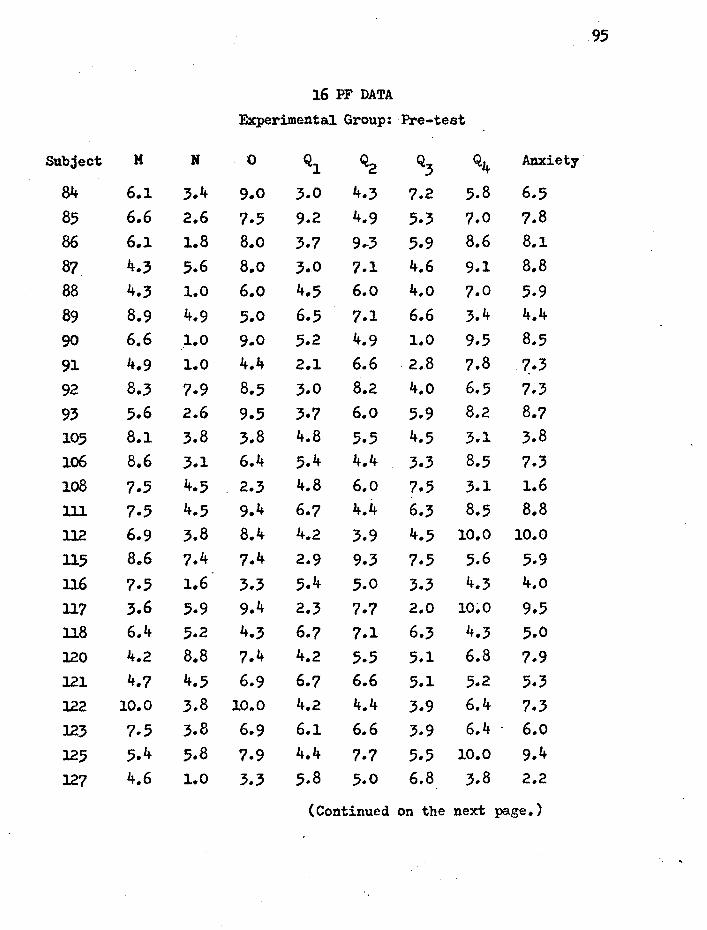
95
16 PF DATA
Experimental Group: Pre-test
Subject M N 0 Ql ~ Q3 Q4 Anxiety
84 6.1 3.4 9.0 3.0 4.3 ?.2 5.8 6.5 85 6.6 2.6 7.5 9.2 4.9 5.3 7.0 7.8 86 6.1 1.8 B.o 3.7 9 •. 3 5.9 8.6 8.1 87 4.3 5.6 8.o 3.0 7.1 4.6 9.1 8.8 88 4.3 1.0 6.o 4.5 6.o 4.o 7.0 5.9 89 8.9 4.9 5.0 6.5 7.1 6.6 3.4 4.4
90 6.6 1.0 9.0 5.2 4.9 1.0 9.5 8.5 91 4.9 1.0 4.4 2.1 6.6 2.8 ?.8 7.3 92 8.3 7.9 8.5 3.0 8.2 4.o 6.5 7.3 93 5.6 2.6 9.5 3.7 6.o 5.9 8.2 8.7 105 8.1 3.8 3.8 4.8 5.5 4.5 3.1 3.8 106 8.6 3.1 6.4 5.4 4.4 3.3 8.5 7.3 lo8 7.5 4.5 2.3 4.8 6.o 7.5 3.1 1.6 lll 7.5 4 .. 5 9.4 6.7 4.4 6.3 8.5 8.8 112 6.9 3.8 8.4 4.2 3.9 4.5 10.0 10.0
115 8.6 7.4 7.4 2.9 9.3 7.5 5.6 5.9 116 7.5 1.6 3.3 5.4 5.0 3.3 4.3 4.o
117 3.6 5.9 9.4 2.3 7.7 2.0 10~0 9.5 118 6.4 5.2 4.3 6.7 7.1 6.3 4.3 5.0 120 4.2 8.8 7.4 4.2 5,.5 5.1 6.8 ?.9 121 4.7 4.5 6.9 6.7 6.6 5.1 5.2 5.3 122 10.0 3.8 10.0 4.2 4.4 3.9 6.4 7.3 123 7.5 3.8 6.9 6.1 6.6 3.9 6.4 . 6.o
125 5.4 5.8 7.9 4.4 7.7 5.5 10.0 9.4
127 4.6 1.0 3.3 5.8 5.0 6.8 3 .. 8 2.2
(Continued on the next page.)

96
16 PF DATA.
Experimental Group: Pre-test
Subject M N 0 Ql Q2 Q3 Q4 Anxiety
128 5.2 3.2 6.5 1.0 5.0 3.5 7.8 9.2 129 10.0 5.6 3.3 5.2 3.9 5.4 3.8 3.4 130 ?.7 8.o 2.0 4.4 5.3 5.5 1.0 1.0 131 7.7 3.7 7.4 5.8 5.3 3.7 6.9 6.6 133 6.6 6.6 3.5 4.4 4.7 3.7 2.6 3.7 134 4.3 5.1 7.9 5.1 1 .. 0 3.1 10 .. 0 9.5 135 9.0 3.2 5.5 3.0 3.3 3.5 4.7 4.9 138 8.9 3.7 4.4 5.1 6.5 2.4 6.9 6.7 140 5 .. 4 1.6 6.4 6.4 7.7 3.7 8.4 6.7 141 3.7 l.O 6 .. 9 .7.8 3.5 6.,7 8.4 7.9
Sum Sum Factor of scores Mean Factor of scores Mean
M 231.3 6.609 Q2 199.7 5.706
N 141.0 4.029 Q3 164.o 4.686
0 225.8 6.451 Q4 229.4 6.554
Ql 166.7 4.763 Anxiety 226.9 6.483
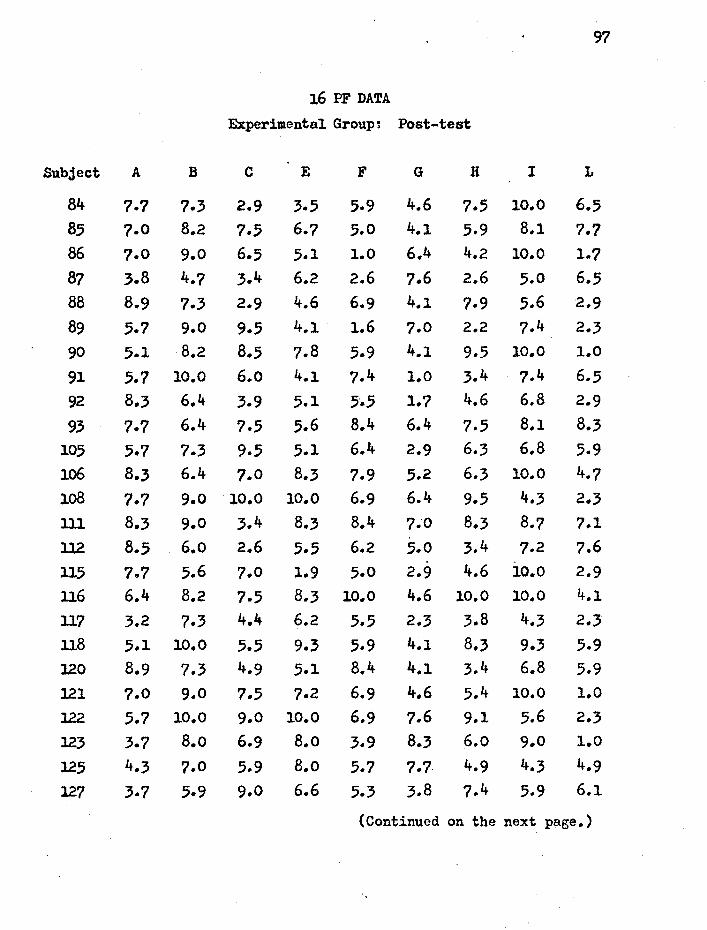
97
16 PF DATA
Experimental Group~ Post-test
Subject A B c E F G H I L
84 7.7 7.3 2.9 3 .. 5 5.9 4.6 7.5 10.0 6.5 85 7.0 8.2 7.5 6.7 5.0 4.1 5.9 8.1 ?.7 86 7.0 9.0 6.5 5.1 1.0 6.4 4.2 10.0 l .. ? 87 3.8 4.7 3.4 6.2 2.6 7.6 2.6 5.0 6.5 88 8.9 7.3 2.9 4.6 6.9 4 .. 1 7.9 5.6 2.9
89 5.7 9.0 9.5 4.1 1.6 7.0 2.2 7.4 2.3
90 5.1 8.2 8.5 7.8 5.9 4.1 9.5 10.0 1.0
91 5.7 10.0 6.o 4.1 7.4 1.0 3.4 7.4 6.5 92 8.3 6.4 3.9 5.1 5·.5 1.7 4.6 6.8 2.9
93 7.7 6.4 7.5 5.6 8.4 6.4 7.5 8.1 8.3
105 5.7 7 .. 3 9.5 5.1 6.4 2.9 6.3 6.8 5.9 lo6 8.3 6.4 7.0 8.3 7.9 5.2 6.3 10.0 4.7 lo8 7.7 9.0 10.0 10.0 6.9 6.4 9.5 4.3 2.3 ll1 8.3 9.0 3.4 8.3 8.4 7.0 8.3 8.7 7.1 112 8.5 6.o 2.6 5.5 6.2 5.0 3.4 7.2 7.6 115 7.7 5.6 7.0 1.9 5.0 2.9 4.6 10.0 2.9 ll6 6.4 8.2 7.5 8.3 10.0 4.6 10.0 10.0 4.1
117 3.2 7.3 4.4 6.2 5.5 2.3 3.8 4.3 2.3 118 5.1 10.0 5.5 9.3 5.9 4.1 8.3 9.3 5.9 l20 8.9 7.3 4.9 5.1 8.4 4.1 3.4 6.8 5.9 121 7.0 9.0 7.5 7.2 6.9 4.6 5.4 10.0 1.0
122 5.7 10.0 9.0 10.0 6.9 7.6 9.1 5.6 2.3 123 3.7 8.o 6.9 B.o 3.9 8.3 6.o 9.0 l.O
125 4.3 7.0 5.9 B.o 5.7 7.7. 4.9 4.3 4.9
127 3.7 5.9 9.0 6.6 5.3 3.8 7.4 5.9 6.1
(Continued on the next page.)

98
16 PF DATA
Experimental Group: Post-test
Subject A B c E F G H I L
128 2.6 4.9 5.4 6.1 7.1 7.7 2.1 6.9 6.7 129 6.o 8.o 6.9 6.1 5.7 4.4 8.1 8.5 6.1 130 4.3 a.o 8.5 4.6 5.7 4.4 4.2 6.4 4.3 l.31 3.2 7.0 5.4 3.6 4.8 3.3 2.8 5.3 5.5 133 3.7 4.9 4.9 6.1 l.6 2.2 4.2 6.9 4.9 134 8.3 .5.9 2.3 7.5 6.6 6.1 8.8 9.0 6.7
l.35 8.3 9.1 6.4 3.2 6.6 7.7 5.3 8.5 3.7 138 3.7 4.9 3.3 7.5 3.0 3.3 6.o 9.0 3.7 140 3.2 3.8 5.4 7.1 7.5 2.7 4.2 8.5 6.7 141 6.6 2.8 3.9 8.5 7.1 7.7 6.o 8.5 9.1
Sum Sum Factor of scores Mean Factor of scores Mean
A 211.0 6.029 G 173.0 4.943
B 251.8 7.194 H 203.7 5.820
c 211.1 6.031 I 268.1 7.660
E 220.9 6.311 L 167.7 4.791
F 205.2 5.863
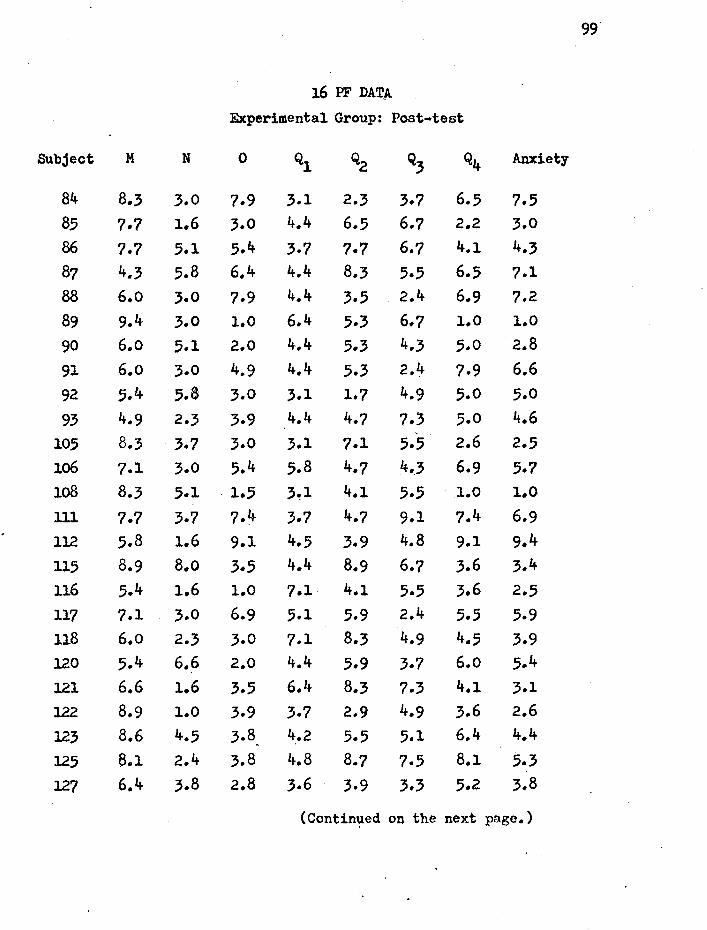
99
16 PF DATA.
Experimental Group: Post-test
Subject M N 0 Ql Q2 Q3 Q4 Anxiety
84 8.3 3.0 7.9 3.1 2.3 3.7 6.5 7.5 85 7.7 1.6 3.0 4.4 6.5 6.7 2.2 3.0 86 7.7 5.1 5.4 3.7 7.7 6.7 4.1 4.3 87 4.3 5.8 6.4 4.4 8.3 5.5 6.5 7.1 88 6.o 3.0 7.9 4.4 3.5 2.4 6.9 7.2 89 9.4 3.0 1.0 6.4 5.3 6.7 l.O 1.0
90 6.o 5.1 2.0 4.4 5.3 4.3 5.0 2.8
91 6.o 3.0 4.9 4.4 5.3 2.4 7.9 6.6 92 5.4 5.8 3.0 3.1 1.7 4.9 5.0 5.0
93 4.9 2.3 3.9 4.4 4.? 7.'j 5.0 4.6 105 8.3 3.7 3.0 3.1 7.1 5.5 2.6 2.5 lo6 7.1 3.0 5.4 5.8 4.7 4 •. 3 6.9 5.7 lo8 8.3 5.1 . 1.5 3~1 4.1 5.5 1.0 1.0 lll 7.7 3.7 7.4 3.7 4.7 9.1 7.4 6.9 112 5.8 1.6 9.1 4.5 3.9 4.8 9.1 9.4 115 8.9 8.o 3.5 4.4 8.9 6.7 3.6 3.4 116 5.4 1.6 1.0 7.1 4.1 5.5 3.6 2.5 117 7.1 3.0 6.9 5.1 5.9 2.4 5.5 5.9 118 6.o 2.3 3.0 7.1 8.3 4.9 4.5 3.9 120 5.4 6.6 2.0 4.4 5.9 3.7 6.o 5.4 121 6.6 1.6 3.5 6.4 8.3 7.3 4.1 3.1 122 8.9 1.0 3.9 3.7 2.9 4.9 3.6 2.6
123 8.6 4.5 3.8 4.2 5.5 5.1 6.4 4.4 . 125 a.1 2.4 3.8 4.8 8.7 7.5 8.1 5.3 127 6.4 3.8 2.8 3.6 3.9 3.3 5.2 3.8
(Contin~ed on the next page.)

100
16 PF DATA
Experimental Group: Post-test
Subject M N 0 Ql Q2 % Q4 Anxiety
128 6.4 3.8 .5.3 3.6 4.4 4 .. .5 8.9 7.5 129 10.0 4.5 2.3 4.8 5.0 l.O 6.4 4.6 130 5.8 8.8 3.8 4.2 4.4 5.7 2.2 3.0
131 6.4 6.6 8.9 5.4 6.6 4.5 9.3 8.o 133 7.5 .5.2 5.9 3.6 6.o l.O 6.o 6.2
134 2.5 5.2 7.9 5.4 2.8 3.9 9.3 8.9 13.5 9.2 5.2 5.3 3.6 3.9 6.3 6.o 5.3 138 6.4 4.5 5.9 4.2 5.5 2.0 6.4 6.5 14o 4.7 3.8 5.9 4.8 5.0 5.7 8.1 6.9 141 8.6 5.9 4.3 6.7 6.0 4.5 8.9 7.2
Sum Sum Factor of scores Mean Factor of scores Mean
M 241.8 6.908 Q2 187.1 5.346
N 143.1 4.089 Q3 170.2 4.863
0 161.5 4.614 Q4 199.2 5.691
Ql 160.6 4.589 Anxiety 179.0 5.114

Subject
APPENDIX III
MMPI DATA
Control Group: Pre-test
101
L F K Hs D Hy Pd Mf Pa Pt Sc Ma Si A Es
99 44 66 49 52 53 51 70 78 56 64 67 61 51 61 49 101 4o 60 44 53 53 56 78 74 50 71 76 68 55 71 43 102 50 48 48 49 51 47 55 61 53 60 57 57 65 59 49 103 53 55 62 49 75 60 50 73 59 64 55 43 73 64 49 109 40 60 42 88 87 67 68 71 62 88 87 57 78 81 35 125 44 55 38 49 58 47 50 74 73 68 78 70 64 70 56 127 44 48 51 53 58 64 45 55 47 52 43 52 47 42 59 128 40 60 46 56 53 56 47 61 44 63 60 57 61 64 56 129 50 53 68 40 63 64 75 76 62 49 51 61 48 45 64 130 50 48 61 42 46 55 53 71 65 49 43 45 44 41 56 131 40 58 44 42 56 47 68 61 53 59 60 61 58 56 56 133 50 62 51 53 58 58 81 76 65 70 75 70 63 66 43 134 50 58 44 56 70. 64 88 73 67 74 68 70 45 67 41 135 46 64 57 47 51 53 42 86 65 50 51 59 43 56 49 136 50 55 53 51 41 55 45 82 62 54 60 72 47 44 61 139 46 46 61 44 41 62 50 74 62 50 47 52 50 46 59 141 4o 76 36 72 82 65 75 84 53 77 Bo 77 62 71 33 142 53 48 57 4o 39 45 47 61 .56 45 47 59 45 42 72 143 40 48 57 44 70 49 60 69 47 59 48 57 44 52 53 145 50 53 51 44 48 55 45 84 50 50 55 61 49 41 54 148 50 46 74 42 58 53 68 73 53 48 48 52 52 40 56 150 50 55 51 42 44 38 45 47 44 50 48 59 44 41 62 152 53 48 61 5~ 46 73 55 71 56 46 49 66 38 42 61 153 50 46 61 42 34 45 53 53 50 41 43 63 38 41 64
~4 " 50 ~ ~ " ~ » ~ % ~ ~ 52 ~ 46_~ (Continued on the next page.)

102
MMPI DATA
Control Group: Pre-test
Subject L F K He D Hy Pd Mf Pa pt Sc Ma Si A Es
155 50 53 57 47 51 49 45 74 30 49 52 66 52 46 53 156 36 ?6 38 53 48 53 50 78 62 68 76 66 67 74 48
158 50 55 44 56 60 53 60 71 53 70 63 57 54 67 46
170 60 44 70 42 44 60 35 53 50 38 40 48 40 37 67 162 46 55 62 42 58 56 55 59 62 48 51 45 50 42 49 164 50 55 51 44 51 40 47 78 59 56 57 66 51 54 54 166 60 48 64 42 58 58 60 65 41 45 53 39 43 41 51 167 46 53 53 42 29 56 58 47 47 45 47 66 41 46 64 168 50 46 55 47 44 53 40 55 41 43 43 52 49 45 59 169 56 48 59 42 53 56 42 59 53 50 49 50 58 46 72
Sum Sum
Scale of scores Mean Scale of scores Mean
L 1680 48.ooo Pa 1908 54.514
F 1899 54.257 Pt 1963 56.o85
K 1884 53.828 Sc 1970 56.285
Hs 1701 48.600 Ma 2056 58.742
D 1884 53.828 Si 1817 51.914
Hy 1914 54.685 A 184? 52.771
Pd 1940 55.428 Es 18.94 54.114
Mf 2396 68.457
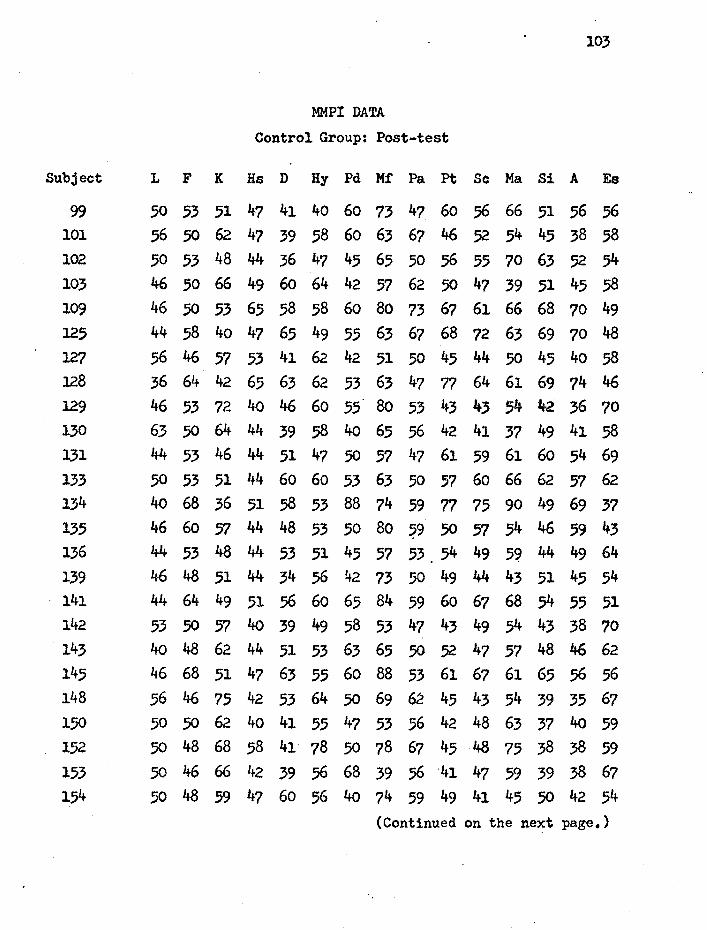
Subject
MMPI DATA
Control Group: Post-test
103
L F K Hs D Hy Pd Mf Pa pt Sc Ma Si A Es
99 50 53 51 47 41 40 60 73 47. 60 56 66 51 56 56 101 56 50 62 47 39 58 60 63 67 46 52 54 45 38 58 102 50 53 48 44 36 47 45 65 50 56 55 70 63 52 54 ~ 4650~~~64~~6250~~~~~
109 46 50 53 65 58 58 ~ 80 73 67 61 66 68 70 49 125 44 58 40 47 65 49 55 63 67 68 72 63 69 70 48 127 56 46 57 53 41 62 42 51 so 45 44 50 45 40 ~ 128 36 64 42 65 63 62 53 63 47 77 64 61 69 74 46
~ 46"n4o46~"~"~~~~%~ ~ ~506444~584o~56~~~~~58
131 44 53 46 44 51 47 50 57 47 61 59 61 60 54 69 133 50 53 51 44 60 60 53 63 50 57 60 66 62 ~ 62 134 40 68 36 51 58 53 88 74 59 77 75 90 49 69 37 135 46 60 57 44 48 53 50 80 59 50 57 54 46 59 43 136 44 53 48 44 53 51 45 57 53 54 49 5~ 44 49 64 rn 4648~44~56~"50~44~~~54
~ 4464~~56~~~59~~~54"~
~ "50~4o~~58"~~~54~~~ ~ 40486244~"~~5052~~484662
145 46 68 51 4? 63 55 60 88 53 61 67 61 65 56 56 148 56 46 75 42 53 64 50 69 62 45 43 54 39 35 67 150 50 50 62 4o 41 55 47 53 56 42 48 63 37 40 59 152 .50 48 68 58 41 78 50 78 67 45 48 75 38 38 59 153 .50 46 66 42 39 56 68 39 56 '41 47 59 39 38 67 154 .50 48 59 47 60 56 4o 74 59 49 41 45 50 42 54
(Continued on the next page.)

lo4
MMPI DATA'
Control Group: Post-test
Subject L F K Ha D H;y Pd Mf Pa pt Sc Ma Si A Es
155 56 5.5 49 47 44 45 42 73 41 4.5 49 66 56 46 64 156 36 70 46 49 51 55 55 73 56 63 65 59 65 66 53 158 36 66 46 72 84 69 78 73 67 91 79 63 62 79 35 162 53 48 70 44 48 60 53 51 70 45 43 50 41 36 61 164 46 50 59 47 53 45 55 69 56 50 51 66 43 44 58 166 60 48 62 44 48 58 45 55 44 43 47 43 44 38 58 167 46 48 62 4o 34 60 50 51 50 41 43 57 38 40 56 168 53 46 64 40 44 58 42 61 50 41 41 43 39 38 61 169 53 48 64 42 39 56 42 57 53 45 41 52 56 40 61 170 53 48 68 40 41 53 30 53 47 39 44 41 43 37 72
Sum Sum Scale of scores Mean Scale of scores Mean
L 1694 48.400 ·Pa 1933 55.228
F 1857 53.057 Pt 1843 52.657
K 1983 56.657 Sc 1839 52.542
lis 1648 47.o85 Ma 2009 57.400
D 1721 49.171 Si 1?64 50.400
Hy 1963 56.o85 A 17cr/ 48.771
Pd 1833 5?.371 Es 2008 57.371
Mf 2283 65.228
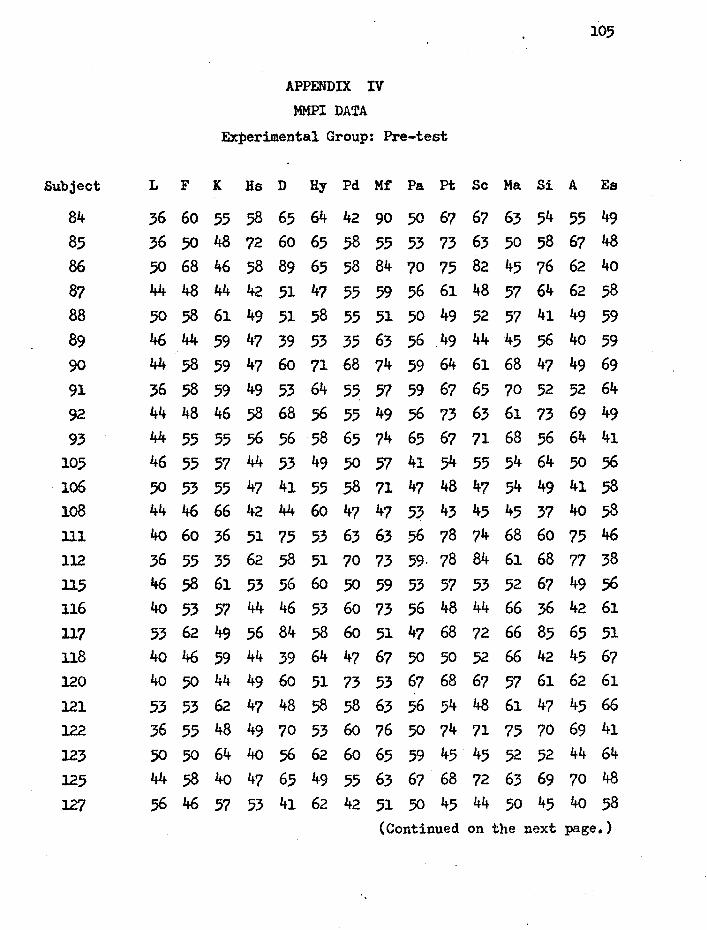
Subject
APPENDIX IV MMPI DATA
Experimental Group: Pre-test
105
L F K Hs D Hy Pd Mf Pa pt Sc Ma Si A Es
84 36 60 55 58 65 64 42 90 50 67 67 63 54 55 49 85 36 50 48 72 60 65 58 55 53 73 63 50 58 67 48 86 50 68 46 58 89 65 58 84 70 75 82 45 76 62 4o 87 44 48 44 42 51 47 55 59 56 61 48 57 64 62 58
88 50 58 61 49 51 58 55 51 50 49 52 57 41 49 59 89 46 44 59 47 39 53 35 63 56 49 44 45 56 4o 59 90 44 58 59 47 60 71 68 74 59 64 61 68 47 49 69
91 36 58 59 49 53 64 55 57 59 67 65 70 52 52 64 92 44 48 46 58 68 56 55 49 .56 73 63 61 73 69 49 93 44 55 55 56 56 58 65 74 65 67 71 68 .56 64 41
105 46 55 57 44 53 49 50 57 41 54 55 54 64 50 .56 ~ .50""~""58n~48~54~~58 108 44 46 66 42 44 60 47 47 53 43 45 45 37 40 58 111 4o 60 36 51 75 53 63 63 56 78 74 68 60 75 46 112 36 55 35 62 .58 51 70 73 59. 78 84 61 68 77 38
m 46.58Q".56~50~"57"~~~56 116 4o 53 57 44 46 53 60 73 56 48 44 66 36 42 61 117 53 62 49 56 84 58 60 51 47 68 72 66 85 65 51 118 40 46 59 44 39 64 47 67 50 50 52 66 42 45 67 120 4o 50 44 49 60 51 73 53 67 68 67 57 61 62 61 121 53 53 62 47 48 58 .58 63 56 54 48 61 47 45 66 122 36 55 48 49 70 53 ~ 76 50 74 71 75 70 69 41
m 505064405662~~~~~~~4464
~ 44.584o~~~~~~~n~~~~
127 56 46 57 53 41 62 42 51 50 45 44 50 45 40 58 (Continued on the next page.}

lo6
MMPI DATA
Experimental Group: Pre-test
Subject L F K Hs D Hy Pd Mt Pa Pt Sc Ma Si A Es
128 36 64 42 65 63 62 53 63 47 77 64 61 69 74 46 129 46 53 72 40 46 60 55 80 53 43 43 54 42 36 70 130 63 50 64 44 39 58 40 65 56 42 41 37 49 41 58 131 44 53 46 44 51 47 50 57 47 61 59 61 60 54 69 133 50 53 51 44 60 60 .53 63 50 57 60 66 62 57 62 134 4o 68 36 51 58 53 88 74 59 77 75 90 49 69 37 135 46 60 57 44 48 53 50 80 59 50 57 54 46 59 43 138 36 55 44 60 68 58 73 67 53 74 78 50 73 74 38 140 40 6o 44 44 41 47 53 74 56 60 64 75 50 55 51 141 44 64 49 51 56 60 65 84 59 6o 67 68 54 55 51
Sum Sum Scale of scores Mean Scale of scores Mean
L 1549 44.257 ·Pa 1924 54.971
F 1927. 55.057 Pt 2124 60.685
K 1827 52.200 Sc 2097 59.914
Ha 1751 50.028 Ma 2090 59.714
D 1958 55.942 Si 1983 56.657
Hy 1997 57.057 A 1957 55.914
Pd 1979 56.542 Ea 1890 54.ooo
Mf 2295 65.571

1<:17
-MMPI DATA
Experimental Group: Post-teat
Subject L F K Hs D Hy Pd Mf Pa pt Sc Ma Si A Es
84 36 60 55 53 56 .58 53 80 53 57 61 61 54 54 51 85 53 55 57 44 36 53 53 57 50 53 53 61 45 41 66 86 56 53 59 47 58 60 50 78 62 48 49 48 55 50 53 87 44 48 36 42 51 0 40 59 50 61 45 52 66 65 59 88 46 60 57 69 63 65 65 63 53 67 60 59 45 61 54 89 53 46 57 4o 36 49 35 59 44 43 40 54 54 37 64 90 66 53 62 47 41 69 53 71 65 52 51 59 37 37 61 91 46 55 57 49 58 64 65 63 53 63 59 68 52 59 62
~ 50 48 64 4o ~ ~" ~ "-~ ~ Q 46 ~ 62 93 53 48 59 44 48" 49 53 65 4?' 50 49 68 43 46 59
105 46 55 57 44 53 49 50 57 41 54 55 54 64 55 56
~ 4648"~~58~n56~~"~~58 ~ ~46~4o4462~~56~4o~~~62
111 40 53 36 49 56 44 55 73 53 74 64 75 55 67 54 ll2 4o 60 46 53 65 53 78 84 70 78 82 63 58 74 41 115 53 46 57 53 53 58 47 71 53 50 47 52 54 46 64 116 44 53 55 44 44 55 58 73 50 41 43 63 38 41 62 117 50 53 49 51 65 51 53 47 44 53 49 59 64 47 62 118 50 48 59 44 39 65 47 74 56 48 51 57 42 47 66 120 4o 46 55 42 65 47 63 59 59 59 55 59 56 46 66 121 50 48 64 49 46 65 58 67 56 49 48 68 45 44 64 122 40 48 66 42 34 55 55 71 56 45 45 68 39 40 66 123 50 55 66 44 .. 48 64 63 69 56 41 45 57 45 36 74
~ 4644~~~~~~62~~~~~"
127 50 48 68 47 46 65 63 67 59 42 47 61 42 41 64 .(Continued on the next page.)

lo8
MMPI DATA-
Experimental Group: Post-test
Subject L F K Hs D Hy Pd Mf Pa Pt Sc Ma Si A Es
128 40 62 48 58 63 62 47 69 53 67 61 48 69 64 43 129 4o 48 72 4o 48 64 5.5 82 56 41 41 50 40 38 70 130 63 48 68 42 46 60 60 69 56 42 43 52 46 37 56 131 46 .50 ~ 42 60 4o 58 63 41 66 59 50 70 61 51 133 56 53 68 62 65 71 70 73 62 57 59 61 55 52 54 134 44 58 55 56 60 67 73 69 56 54 53 61 46 56 51 135 4o 64 62 53 65 64 53 98 65 .56 59 59 51 57 53 138 4o 53 44 49 44 44 42 73 44 59 64 59 56 60 45 14o 44 55 40 49 41 49 55 73 59 68 68 77 53 64 49 141 4o 55 49 .56 56 60 70 82 53 56 71 75 46 46 54
Sum Sum Scale of scores Mean Scale of scores Mean
L 1§91 47.457 Pa 1902 54.342
F 1823 52.085 Pt 1887 53.914
K 1969 56.257 Sc 1872 53.485
Hs 1675 47.857 Ma 2111 60.314
D 1779 50.828 Si 1769 50.542
Hy 1950 57.353 A 1741+ 49.828
Pd 1956 55.885 Es 2035 58.142
Mf 2392 68.342

109
APPENDIX V TAT DATA
MOTIVATION INDEX
Control Group Experimental Group
Subject Pre Post Subject Pre Post
99 96 131 si. 58 lo4 100 85 77 85 58 131 101 7!l 92 86 81 108 102 119 135 87 162 146 103 96 lo4 88 65 138 109 123 100 89 88 135 110 88 123 90 138 173 119 23 31 91 118 135 125 58 42 92 42 73 127 100 154 93 62 46 128 62 115 95 69 142
129 65 50 96 69 69 130 73 108 97 27 115 131 19 27 98 46 123
133 38 19 105 92 123 134 96 50 lo6 138 135 135 58 115 108 154 154 138 42 38 111 135 131 139 81 62 112 42 127 141 73 115 ·115 112 162
143 112 81 116 38 142 11+5 58 100 117 65 85
148 77 77 118 81 104
150 131 73 120 92 146
152 100 123 121 85 181
(Continued on the next page.)

llO
TAT DATA
MOTIVATION
Control Group
Subject Pre Post
153 112 96 1.54 112 l27 155 38 54 156 58 42 158 96 65 162 62 96 164 77 92
166 38 46
167 104 100
168 81 31
Control Group
Sum of scores Mean
Pre-test
Post-test
2728
2787
77 .. 942
79.628
INDEX
Experimental Group
Subject Pre Post
122 77 158
125 42 146 127 154 135 128 115 146 129 50 69 130 lo8 135
131 27 62
133 19 50 134 50 162 135 115 142
Experimental Group
S'111 of scores Mean
Pre-test 2874
Post-test ~333
82.114
123.800
APPROVAL SHEET
The thesis submitted by Bede Smith has been read
and approved by members of the Department of Psychology.
The final copies have been examined by the director
of the thesis and the signature which appears below
verifies the fact that any necessary changes have been
incorporated and that the thesis is now given final
approval with reference to content and form.
The thesis is therefore accepted in partial fulfill-
ment of the requirements for the degree of Master of
Arts.
12- 7-'7/ Date
/"
I
11 Signature of Advisor ./