an evaluation of formic acid as an …an evaluation of formic acid as an electron donor for...
TRANSCRIPT
AN EVALUATION OF FORMIC ACID AS AN
ELECTRON DONOR FOR PALLADIUM (PD)
CATALYZED DESTRUCTION OF
NITROAROMATIC COMPOUNDS
Mark R. Stevens, Capt, USAF
AFIT/GEM/ENV/04M-19
DEPARTMENT OF THE AIR FORCE AIR UNIVERSITY
AIR FORCE INSTITUTE OF TECHNOLOGY
Wright-Patterson Air Force Base, Ohio
APPROVED FOR PUBLIC RELEASE; DISTRIBUTION UNLIMITED

The views expressed in this thesis are those of the author and do not reflect the official
policy or position of the United States Air Force, Department of Defense, or the U.S.
Government.

AFIT/GEM/ENV/04M-19
AN EVALUATION OF FORMIC ACID AS AN ELECTRON DONOR FOR
PALLADIUM (PD) CATALYZED DESTRUCTION OF NITROAROMATIC
COMPOUNDS
THESIS
Presented to the Faculty
Department of Systems and Engineering Management
Graduate School of Engineering and Management
Air Force Institute of Technology
Air University
Air Education and Training Command
In Partial Fulfillment of the Requirements for the
Degree of Master of Science in Engineering Management
Mark R. Stevens, BS
Captain, USAF
March 2004
APPROVED FOR PUBLIC RELEASE; DISTRIBUTION UNLIMITED.

AFIT/GEM/ENV/04M-19
AN EVALUATION OF FORMIC ACID AS AN ELECTRON DONOR FOR
PALLADIUM (PD) CATALYZED DESTRUCTION OF NITROAROMATIC
COMPOUNDS
Mark R. Stevens, BS Captain, USAF
Approved: _____________//Signed//_________________ __8 Mar 2004_ Dr. Mark N. Goltz, (Co-Chairman) date _____________//Signed//_________________ _26 Feb 2004_ Dr. Abinash Agrawal, (Co-Chairman) date _____________//Signed//_________________ __8 Mar 2004_ Dr. Alfred E. Thal Jr. (Member) date

iv
AFIT/GEM/ENV/04M-19
Abstract
The Department of Defense is responsible for over 2,000 hazardous waste sites
containing nitroaromatic compounds (NACs) such as 2,4,6-TNT, 2,4- and 2,6-DNT that
resulted from the production and use of munitions throughout the nation and world.
NACs are typically persistent in natural environments, though they can be oxidized or
reduced under engineered conditions. NACs and their reduction products are toxic
chemicals and suspected human carcinogens. Both TNT and 2,4-DNT are listed as
priority pollutants by the U.S. EPA.
This study investigates the effectiveness of using a palladium (Pd) catalyst in
concert with formic acid as an electron donor to reduce NACs. If the reduction reaction
is rapid and complete, without producing hazardous daughter products, the process may
have application as an in situ treatment technology to remediate NAC-contaminated
groundwater.
In this study, formic acid was added into NAC-contaminated water flowing
through a laboratory column filled with Pd catalyst. Experimental results using 2,4-DNT
as a model NAC indicate reduction rates are dependent on pH, formic acid
concentrations, and NAC concentrations. At high NAC concentrations and high pH,
reduction rates slowed. Higher concentrations of formic acid led to greater extent and
rates of 2,4-DNT reduction. The amines that would be expected to be produced from 2,4-
DNT reduction were identified in the column effluent, along with several unidentified
byproducts. Further research is required to identify and characterize the possible risks
these unknown byproducts might pose. Based on experimentally observed reaction rates

v
and removal efficiencies, there is potential that Pd-catalyzed reduction using formic acid
as a reductant may have application as an in situ remediation technology to manage
NAC-contaminated groundwater.

vi
Table of Contents
Page
Abstract .............................................................................................................................. iv Table of Figures ................................................................................................................. ix List of Tables .................................................................................................................. xvii
1.0 INTRODUCTION ........................................................................................................ 1
1.1 Motivation............................................................................................................... 1 1.2 Research Objectives................................................................................................ 8 1.3 Study Limitations.................................................................................................... 9
2.0 LITERATURE REVIEW ........................................................................................... 10
2.1 Uses of Nitroaromatic Compounds (NACs) ......................................................... 10 2.2 Production of Trinitrotoluene (TNT) .................................................................... 11 2.3 Groundwater Contamination by NACs................................................................. 12 2.4 Toxicity of Nitrotoluenes, Aminonitrotoluenes, and Aminotoluenes................... 17 2.5 Properties of Nitroaromatic Compounds .............................................................. 20 2.6 Reduction of NACs............................................................................................... 21 2.7 Application of Pd Catalyzed Reduction of NACs ................................................ 27 2.8 Alternate NAC Remediation Technologies .......................................................... 28 2.8.1 Ex Situ Technologies. ........................................................................................ 28 2.8.2 In Situ Technologies .......................................................................................... 30
3.0 EXPERIMENTAL MATERIALS AND METHODS................................................ 32
3.1 Chemicals.............................................................................................................. 32 3.2 Palladium Catalysts............................................................................................... 32 3.3 Column.................................................................................................................. 33 3.4 High Pressure Liquid Chromatograph (HPLC) - Standardization........................ 33 3.5 Flow-through Column Experiments ..................................................................... 35 3.6 Effect of pH........................................................................................................... 37 3.7 Effect of Contaminant Concentration ................................................................... 37 3.8 Effect of Formic Acid Concentration ................................................................... 38

vii
Page
3.9 Application of Michaelis-Menten Kinetics........................................................... 38 3.10 Daughter Product Identification.......................................................................... 41
4.0 RESULTS AND DISCUSSION................................................................................. 43
4.1 Experimental Results ............................................................................................ 43 4.2 Effects of pH on the Rate, Extent, and Byproducts of Pd-catalyzed 2-NT
Reduction .............................................................................................................. 44 4.2.1 Effects of pH on Extent of 2-NT Degradation................................................... 44 4.2.2 Effects of pH on 2-NT Degradation Rates......................................................... 45 4.2.3 Effects of pH on 2-NT Byproducts.................................................................... 47 4.3 Effects of pH on the Rate, Extent, and Byproducts of Pd-catalyzed 2,4-DNT
Reduction .............................................................................................................. 48 4.3.1 Effects of pH on Extent of 2,4-DNT Degradation............................................. 48 4.3.2 Effects of pH on 2,4-DNT Degradation Rates................................................... 51 4.3.3 Effects of pH on 2,4-DNT Byproducts. ............................................................. 56 4.4 Effects of Formic Acid on the Rate, Extent, and Byproducts of Pd-catalyzed
2,4-DNT Reduction............................................................................................... 59 4.4.1 Effects of Formic Acid on Extent of 2,4-DNT Degradation. ............................ 59 4.4.2 Effects of Formic Acid on 2,4-DNT Degradation Rates. .................................. 62 4.4.3 Effects of Formic Acid on 2,4-DNT Byproducts............................................... 64 4.5 Effects of 2,4-DNT Initial Concentration on the Rate, Extent, and
Byproducts of Pd-catalyzed 2,4-DNT Reduction ................................................. 69 4.5.1 Effects of 2,4-DNT Initial Concentration on Extent of 2,4-DNT
Degradation........................................................................................................... 69 4.5.2 Effects of 2,4-DNT Initial Concentration on 2,4-DNT Degradation Rates....... 70 4.5.3 Effects of 2,4-DNT Initial Concentration on 2,4-DNT Byproducts. ................. 72 4.6 2A4NT Degradation.............................................................................................. 75 4.7 Effects of Formic Acid on the Rate, Extent, and Byproducts of Pd-catalyzed
2,4-DAT Reduction............................................................................................... 76 4.7.1 Effects of Formic Acid on Extent of 2,4-DAT Degradation. ............................ 76 4.7.2 Effects of Formic Acid on 2,4-DAT Degradation Rates. .................................. 78 4.7.3 Effects of Formic Acid on 2,4-DAT Byproducts............................................... 79 4.8 Unknown Byproducts ........................................................................................... 80 4.8.1 Unknown Byproduct at 2.5 Minutes HPLC Residence Time............................ 81 4.8.2 Unknown Byproduct at 3.4 Minutes HPLC Residence Time............................ 84 4.8.3 Unknown Byproduct at 4.0 Minutes HPLC Residence Time............................ 85

viii
Page
4.9 Potential for In Situ Remediation ......................................................................... 87
5.0 CONCLUSIONS......................................................................................................... 89
5.1 Summary ............................................................................................................... 89 5.2 Conclusions........................................................................................................... 90 5.3 Future Work .......................................................................................................... 92
References......................................................................................................................... 94
VITA................................................................................................................................. 98
APPENDIX A................................................................................................................... 99
APPENDIX B ................................................................................................................. 148
APPENDIX C ................................................................................................................. 156
APPENDIX D................................................................................................................. 163

ix
Table of Figures Page
Figure 1.1 Reaction scheme for hydrogenation of 2,4-DNT (Rajashekharam et al., 1997) ........................................................................................................................... 8
Figure 2.1 Location of NPL sites with TNT contamination (CDC, 1995) ....................... 14
Figure 2.2 Location of NPL sites with 2,6-DNT contamination (CDC, 1998) ................ 15
Figure 2.3 Location of NPL sites with 2,4-DNT contamination (CDC, 1998) ................ 16
Figure 2.4 Aromatic(Ar) ring (I) reduced to corresponding hydroxylamine (III) and, ultimately to amine (IV) (Heijman et al., 1995) ....................................................... 22
Figure 2.5 Reduction pathways for 2,4-DNT (Neri et al., 1995)...................................... 25
Figure 2.6 Two possible pathways for the reduction of 2,4-DNT (Rajashekharam et al., 1997) ................................................................................................................... 25
Figure 2.7 Schematic representation of the absorption of formic acid onto monometallic Pd (Prüsse and Vorlop, 2001) ............................................................ 26
Figure 3.1 Schematic of experimental setup..................................................................... 36
Figure 3.2 Typical Michaelis-Menten curve (Boggs, 2000)............................................. 40
Figure 4.1 2-NT effluent concentration vs. time for differing values of pH, 20 ppm initial 2-NT concentration, 1 mMol formic acid....................................................... 45
Figure 4.2 2-NT degradation rate vs. Clm for differing values of pH, 20 ppm initial 2-NT concentration, 1mMol formic acid .................................................................. 46
Figure 4.3 2,4-DNT effluent concentration vs. time for differing values of pH, 20 ppm initial 2,4-DNT concentration, 1 mMol formic acid......................................... 48
Figure 4.4 2,4-DNT effluent concentration vs. time for differing values of pH, 20 ppm initial 2,4-DNT concentration, 4 mMol formic acid......................................... 50
Figure 4.5 2,4-DNT effluent concentration vs. time for differing values of pH, 20 ppm initial 2,4-DNT concentration, 10 mMol formic acid....................................... 50
Figure 4.6 2,4-DNT degradation rate vs. Clm for differing values of pH, 20 ppm initial 2,4-DNT concentration, 1 mMol formic acid................................................. 51
Figure 4.7 2,4-DNT degradation rate vs. Clm for differing values of pH, 20 ppm initial 2,4-DNT concentration, 4 mMol formic acid................................................. 54
Figure 4.8 2,4-DNT degradation rate vs. Clm for differing values of pH, 20 ppm initial 2,4-DNT concentration, 10 mMol formic acid............................................... 54
Figure 4.9 2A4NT effluent concentration vs. time for differing values of pH, 20 ppm initial 2,4-DNT concentration, 4 mMol formic acid......................................... 56
Figure 4.10 4A2NT effluent concentration vs. time for differing values of pH, 20 ppm initial 2,4-DNT concentration, 4 mMol formic acid......................................... 57

x
Page
Figure 4.11 2,4-DAT effluent concentration vs. time for differing values of pH, 20 ppm initial 2,4-DNT concentration, 1 mMol formic acid......................................... 58
Figure 4.12 2,4-DAT effluent concentration vs. time for differing values of pH, 20 ppm initial 2,4-DNT concentration, 10 mMol formic acid....................................... 59
Figure 4.13a 2,4-DNT effluent concentration vs. time for differing concentrations of formic acid, 20 ppm initial 2,4-DNT concentration, pH = 5.0 ............................. 60
Figure 4.13b 2,4-DNT effluent concentration vs. time for differing concentrations of formic acid, 20 ppm initial 2,4-DNT concentration, pH = 6.0 - 6.4..................... 60
Figure 4.14 2,4-DNT effluent concentration vs. time for differing concentrations of formic acid, 40 ppm initial 2,4-DNT concentration, pH = 4.0 ................................. 61
Figure 4.15 2,4-DNT degradation rate vs. Clm for differing concentrations of formic acid, 20 ppm initial 2,4-DNT concentration, pH = 4.0 ............................................. 62
Figure 4.16 2,4-DNT degradation rate vs. Clm for differing concentrations of formic acid, 20 ppm initial 2,4-DNT concentration, pH = 5.0 ............................................. 63
Figure 4.17 2,4-DNT degradation rate vs. Clm for differing concentrations of formic acid, 20 ppm initial 2,4-DNT concentration, pH = 6.0 ............................................. 63
Figure 4.18 2,4-DAT effluent concentration vs. time for differing concentrations of formic acid, 20 ppm initial 2,4-DNT concentration, pH = 4.0 ................................. 65
Figure 4.19 2,4-DAT effluent concentration vs. time for differing concentrations of formic acid, 20 ppm initial 2,4-DNT concentration, pH = 5.0 ................................. 65
Figure 4.20 2,4-DAT effluent concentration vs. time for differing concentrations of formic acid, 20 ppm initial 2,4-DNT concentration, pH = 6.0 ................................. 66
Figure 4.21 2,4-DAT effluent concentration vs. time for differing concentrations of formic acid, 40 ppm initial 2,4-DNT concentration, pH = 4.0 ................................. 66
Figure 4.22 2A4NT effluent concentration vs. time for differing concentrations of formic acid, 20 ppm initial 2,4-DNT concentration, pH = 5.0 ................................. 68
Figure 4.23 4A2NT effluent concentration vs. time for differing concentrations of formic acid, 20 ppm initial 2,4-DNT concentration, pH = 5.0 ................................. 68
Figure 4.24 2,4-DNT removal fraction vs. Clm for differing initial concentrations of 2,4-DNT, 1 mMol formic acid, pH = 4.0 (Note: data for 100 ppm experiment not shown above 40 ppm) ......................................................................................... 69
Figure 4.25 2,4-DNT degradation rate vs. Clm for differing initial concentrations of 2,4-DNT, 1 mMol formic acid, pH = 4.0.................................................................. 71
Figure 4.26 2,4-DNT degradation rate vs. Clm for differing initial concentrations of 2,4-DNT, 1 mMol formic acid, pH = 4.0 (zoom) ..................................................... 71

xi
Page
Figure 4.27 2,4-DAT effluent concentration vs. Clm for differing initial concentrations of 2,4-DNT, 1 mMol formic acid, pH = 4.0 ..................................... 73
Figure 4.28 2A4NT effluent concentration vs. Clm for differing initial concentrations of 2,4-DNT, 1 mMol formic acid, pH = 4.0 ..................................... 74
Figure 4.29 4A2NT effluent concentration vs. Clm for differing initial concentrations of 2,4-DNT, 1 mMol formic acid, pH = 4.0 ..................................... 74
Figure 4.30 2A4NT degradation rate vs. Clm, 20 ppm initial 2A4NT concentration, 4 mMol formic acid, pH = 4.0 .................................................................................. 75
Figure 4.31 2,4-DAT removal fraction vs. Clm for differing concentrations of formic acid, 20 ppm initial 2,4-DAT concentration, pH = 4.0 ................................. 77
Figure 4.32 2,4-DAT degradation rate vs. Clm for differing concentrations of formic acid, 20 ppm initial 2,4-DAT concentration, pH = 4.0 ............................................. 78
Figure 4.33 % mass identified vs. time for Experiment #22 with actual and converted 2,4-DAT mass data................................................................................... 80
Figure 4.34 HPLC response curve from Experiment #18 showing all known and unknown byproducts................................................................................................. 81
Figure 4.35 Unk 2.5 HPLC response vs. time for differing values of pH, 20 ppm initial 2,4-DNT concentration, 10 mMol formic acid............................................... 83
Figure 4.36 Unk 4.0 HPLC response vs. time for differing values of pH, 20 ppm initial 2,4-DNT concentration, 10 mMol formic acid............................................... 85
Figure 4.37 HPLC Analysis of 2,4-DNT reduction (Neri et al., 1995) ............................ 86
Figure A.1a Exp #1 – 100 ppm 2-NT, 1mMol Formic acid, pH = 4.43 (A) Influent vs. Effluent 2-NT Concentration (B) Removal vs. Clm (ppm) (C) Effluent pH vs. Time................................................................................................................... 100
Figure A.1b Exp #1 – 100 ppm 2-NT, 1mMol Formic acid, pH = 4.43 (D) Degradation Rate vs. Clm (ppm) (E) Degradation Rate vs. Clm (mMol) (F) Byproduct Distribution ........................................................................................... 101
Figure A.2a Exp #2 – 20 ppm 2-NT, 1mMol Formic acid, pH = 3.99 (A) Influent vs. Effluent 2-NT Concentration (B) Removal vs. Clm (ppm) (C) Effluent pH vs. Time................................................................................................................... 102
Figure A.2b Exp #2 – 20 ppm 2-NT, 1mMol Formic acid, pH = 3.99 (D) Degradation Rate vs. Clm (ppm) (E) Degradation Rate vs. Clm (mMol) (F) Byproduct Distribution ........................................................................................... 103
Figure A.3a Exp #3 – 20 ppm 2-NT, 1mMol Formic acid, pH = 5.15 (A) Influent vs. Effluent 2-NT Concentration (B) Removal vs. Clm (ppm) (C) Effluent pH vs. Time................................................................................................................... 104

xii
Page
Figure A.3b Exp #3 – 20 ppm 2-NT, 1mMol Formic acid, pH = 5.15 (D) Degradation Rate vs. Clm (ppm) (E) Degradation Rate vs. Clm (mMol) (F) Byproduct Distribution ........................................................................................... 105
Figure A.4a Exp #4 – 20 ppm 2-NT, 1mMol Formic acid, pH = 6.54 (A) Influent vs. Effluent 2-NT Concentration (B) Removal vs. Clm (ppm) (C) Effluent pH vs. Time................................................................................................................... 106
Figure A.4b Exp #4 – 20 ppm 2-NT, 1mMol Formic acid, pH = 6.54 (D) Degradation Rate vs. Clm (ppm) (E) Degradation Rate vs. Clm (mMol) (F) Byproduct Distribution ........................................................................................... 107
Figure A.5a Exp #5 – 20 ppm 2,4-DNT, 1mMol Formic acid, pH = 4.01 (A) Influent vs. Effluent 2,4-DNT Concentration (B) Removal vs. Clm (ppm) (C) Effluent pH vs. Time (D) Degradation Rate vs. Clm (ppm) (E) Degradation Rate vs. Clm (mMol) .............................................................................................. 108
Figure A.5b Exp #5 – 20 ppm 2,4-DNT, 1mMol Formic acid, pH = 4.01 (F) Byproduct Distribution (G) Known Daughter Products ......................................... 109
Figure A.6a Exp #6 – 20 ppm 2,4-DNT, 1mMol Formic acid, pH = 5.00 (A) Influent vs. Effluent 2,4-DNT Concentration (B) Removal vs. Clm (ppm) (C) Effluent pH vs. Time (D) Degradation Rate vs. Clm (ppm) (E) Degradation Rate vs. Clm (mMol) .............................................................................................. 110
Figure A.6b Exp #6 – 20 ppm 2,4-DNT, 1mMol Formic acid, pH = 5.00 (F) Byproduct Distribution (G) Known Daughter Products ......................................... 111
Figure A.7a Exp #7 – 20 ppm 2,4-DNT, 1mMol Formic acid, pH = 6.40 (A) Influent vs. Effluent 2,4-DNT Concentration (B) Removal vs. Clm (ppm) (C) Effluent pH vs. Time (D) Degradation Rate vs. Clm (ppm) (E) Degradation Rate vs. Clm (mMol) .............................................................................................. 112
Figure A.7b Exp #7 – 20 ppm 2,4-DNT, 1mMol Formic acid, pH = 6.40 (F) Byproduct Distribution (G) Known Daughter Products ......................................... 113
Figure A.8a Exp #8 – 20 ppm 2,4-DAT, 1mMol Formic acid, pH = 3.97 (A) Influent vs. Effluent 2,4-DAT Concentration (B) Removal vs. Clm (ppm) (C) Effluent pH vs. Time (D) Degradation Rate vs. Clm (ppm) (E) Degradation Rate vs. Clm (mMol) .............................................................................................. 114
Figure A.8b Exp #8 – 20 ppm 2,4-DAT, 1mMol Formic acid, pH = 6.40 (F) Byproduct Distribution ........................................................................................... 115
Figure A.9a Exp #9 – 20 ppm 2,4-DAT, 4mMol Formic acid, pH = 3.96 (A) Influent vs. Effluent 2,4-DAT Concentration (B) Removal vs. Clm (ppm) (C) Effluent pH vs. Time (D) Degradation Rate vs. Clm (ppm) (E) Degradation Rate vs. Clm (mMol) .............................................................................................. 116

xiii
Page
Figure A.9b Exp #9 – 20 ppm 2,4-DAT, 4mMol Formic acid, pH = 3.96 (F) Byproduct Distribution (G) Unknown Byproduct Response.................................. 117
Figure A.10a Exp #10 – 20 ppm 2,4-DAT, 0mMol Formic acid, pH = 7.28 (A) Influent vs. Effluent 2,4-DAT Concentration (B) Removal vs. Clm (ppm) (C) Effluent pH vs. Time (D) Degradation Rate vs. Clm (ppm) (E) Degradation Rate vs. Clm (mMol) .............................................................................................. 118
Figure A.10b Exp #10 – 20 ppm 2,4-DAT, 1mMol Formic acid, pH = 7.28 (F) Byproduct Distribution ........................................................................................... 119
Figure A.11a Exp #11 – 20 ppm 2,4-DNT, 0mMol Formic acid, pH = 5.85 (A) Influent vs. Effluent 2,4-DNT Concentration (B) Removal vs. Clm (ppm) (C) Effluent pH vs. Time (D) Degradation Rate vs. Clm (ppm) (E) Degradation Rate vs. Clm (mMol) .............................................................................................. 120
Figure A.11b Exp #11 – 20 ppm 2,4-DNT, 0mMol Formic acid, pH = 5.85 (F) Byproduct Distribution (G) Known Daughter Products ......................................... 121
Figure A.12a Exp #12 – 15 ppm 2,4-DNT, 4mMol Formic acid, pH = 4.00 (A) Influent vs. Effluent 2,4-DNT Concentration (B) Removal vs. Clm (ppm) (C) Effluent pH vs. Time (D) Degradation Rate vs. Clm (ppm) (E) Degradation Rate vs. Clm (mMol) .............................................................................................. 122
Figure A.12b Exp #12 – 15 ppm 2,4-DNT, 4mMol Formic acid, pH = 4.00 (F) Byproduct Distribution (G) Known Daughter Products ......................................... 123
Figure A.13a Exp #13 – 20 ppm 2,4-DNT, 4mMol Formic acid, pH = 5.06 (A) Influent vs. Effluent 2,4-DNT Concentration (B) Removal vs. Clm (ppm) (C) Effluent pH vs. Time (D) Degradation Rate vs. Clm (ppm) (E) Degradation Rate vs. Clm (mMol) .............................................................................................. 124
Figure A.13b Exp #13 – 20 ppm 2,4-DNT, 4mMol Formic acid, pH = 5.06 (F) Byproduct Distribution (G) Known Daughter Products ......................................... 125
Figure A.14a Exp #14 – 20 ppm 2,4-DNT, 4mMol Formic acid, pH = 6.06 (A) Influent vs. Effluent 2,4-DNT Concentration (B) Removal vs. Clm (ppm) (C) Effluent pH vs. Time (D) Degradation Rate vs. Clm (ppm) (E) Degradation Rate vs. Clm (mMol) .............................................................................................. 126
Figure A.14b Exp #14 – 20 ppm 2,4-DNT, 4mMol Formic acid, pH = 6.06 (F) Byproduct Distribution (G) Known Daughter Products ......................................... 127
Figure A.15a Exp #15 – 20 ppm 2,4-DNT, 10mMol Formic acid, pH = 4.04 (A) Influent vs. Effluent 2,4-DNT Concentration (B) Removal vs. Clm (ppm) (C) Effluent pH vs. Time (D) Degradation Rate vs. Clm (ppm) (E) Degradation Rate vs. Clm (mMol) .............................................................................................. 128
Figure A.15b Exp #15 – 20 ppm 2,4-DNT, 10mMol Formic acid, pH = 4.04 (F) Byproduct Distribution (G) Known Daughter Products ......................................... 129
xiv
Page
Figure A.16a Exp #16 – 20 ppm 2,4-DNT, 10mMol Formic acid, pH = 4.97 (A) Influent vs. Effluent 2,4-DNT Concentration (B) Removal vs. Clm (ppm) (C) Effluent pH vs. Time (D) Degradation Rate vs. Clm (ppm) (E) Degradation Rate vs. Clm (mMol) .............................................................................................. 130
Figure A.16b Exp #16 – 20 ppm 2,4-DNT, 10mMol Formic acid, pH = 4.97 (F) Byproduct Distribution (G) Known Daughter Products ......................................... 131
Figure A.17a Exp #17 – 20 ppm 2,4-DNT, 10mMol Formic acid, pH = 6.06 (A) Influent vs. Effluent 2,4-DNT Concentration (B) Removal vs. Clm (ppm) (C) Effluent pH vs. Time (D) Degradation Rate vs. Clm (ppm) (E) Degradation Rate vs. Clm (mMol) .............................................................................................. 132
Figure A.17b Exp #17 – 20 ppm 2,4-DNT, 10mMol Formic acid, pH = 6.06 (F) Byproduct Distribution (G) Known Daughter Products ......................................... 133
Figure A.18a Exp #18 – 40 ppm 2,4-DNT, 10mMol Formic acid, pH = 3.97 (A) Influent vs. Effluent 2,4-DNT Concentration (B) Removal vs. Clm (ppm) (C) Effluent pH vs. Time (D) Degradation Rate vs. Clm (ppm) (E) Degradation Rate vs. Clm (mMol) .............................................................................................. 134
Figure A.18b Exp #18 – 40 ppm 2,4-DNT, 10mMol Formic acid, pH = 3.97 (F) Byproduct Distribution (G) Known Daughter Products ......................................... 135
Figure A.19a Exp #19 – 20 ppm 2A4NT, 4mMol Formic acid, pH = 4.00 (A) Influent vs. Effluent 2A4NT Concentration (B) Removal vs. Clm (ppm) (C) Effluent pH vs. Time (D) Degradation Rate vs. Clm (ppm) (E) Degradation Rate vs. Clm (mMol) .............................................................................................. 136
Figure A.19b Exp #19 – 20 ppm 2A4NT, 4mMol Formic acid, pH = 4.00 (F) Byproduct Distribution (G) Known Daughter Products ......................................... 137
Figure A.20a Exp #20 – 40 ppm 2,4-DNT, 4mMol Formic acid, pH = 4.00 (A) Influent vs. Effluent 2,4-DNT Concentration (B) Removal vs. Clm (ppm) (C) Effluent pH vs. Time (D) Degradation Rate vs. Clm (ppm) (E) Degradation Rate vs. Clm (mMol) .............................................................................................. 138
Figure A.20b Exp #20 – 40 ppm 2,4-DNT, 4mMol Formic acid, pH = 4.00 (F) Byproduct Distribution (G) Known Daughter Products ......................................... 139
Figure A.21a Exp #21 – 40 ppm 2,4-DNT, 1mMol Formic acid, pH = 4.00 (A) Influent vs. Effluent 2,4-DNT Concentration (B) Removal vs. Clm (ppm) (C) Effluent pH vs. Time (D) Degradation Rate vs. Clm (ppm) (E) Degradation Rate vs. Clm (mMol) .............................................................................................. 140
Figure A.21b Exp #21 – 40 ppm 2,4-DNT, 1mMol Formic acid, pH = 4.00 (F) Byproduct Distribution (G) Known Daughter Products ......................................... 141

xv
Page
Figure A.22a Exp #22 – 20 ppm 2,4-DNT, 4mMol Formic acid, pH = 4.00 (A) Influent vs. Effluent 2,4-DNT Concentration (B) Removal vs. Clm (ppm) (C) Effluent pH vs. Time (D) Degradation Rate vs. Clm (ppm) (E) Degradation Rate vs. Clm (mMol) .............................................................................................. 142
Figure A.22b Exp #22 – 20 ppm 2,4-DNT, 4mMol Formic acid, pH = 4.00 (F) Byproduct Distribution (G) Known Daughter Products ......................................... 143
Figure A.23a Exp #23 – 100 ppm 2,4-DNT, 1mMol Formic acid, pH = 4.00 (A) Influent vs. Effluent 2,4-DNT Concentration (B) Removal vs. Clm (ppm) (C) Effluent pH vs. Time (D) Degradation Rate vs. Clm (ppm) (E) Degradation Rate vs. Clm (mMol) .............................................................................................. 144
Figure A.23b Exp #23 – 100 ppm 2,4-DNT, 1mMol Formic acid, pH = 4.00 (F) Byproduct Distribution (G) Known Daughter Products ......................................... 145
Figure A.24a Exp #24 – 100 ppm 2,4-DNT, 1mMol Formic acid, pH = 5.05 (A) Influent vs. Effluent 2,4-DNT Concentration (B) Removal vs. Clm (ppm) (C) Effluent pH vs. Time (D) Degradation Rate vs. Clm (ppm) (E) Degradation Rate vs. Clm (mMol) .............................................................................................. 146
Figure A.24b Exp #24 – 100 ppm 2,4-DNT, 1mMol Formic acid, pH = 5.05 (F) Byproduct Distribution (G) Known Daughter Products ......................................... 147
Figure B.1 Exp #9 – 20 ppm 2,4-DAT, 4mMol Formic acid, pH = 3.96 Unknown Byproducts at HPLC Time...................................................................................... 149
Figure B.2 Exp #12 – 15 ppm 2,4-DNT, 4mMol Formic acid, pH = 4.00 Unknown Byproducts at HPLC Time...................................................................................... 149
Figure B.3 Exp #13 – 20 ppm 2,4-DNT, 4mMol Formic acid, pH = 5.06 Unknown Byproducts at HPLC Time...................................................................................... 150
Figure B.4 Exp #14 – 20 ppm 2,4-DNT, 4mMol Formic acid, pH = 6.06 Unknown Byproducts at HPLC Time...................................................................................... 150
Figure B.5 Exp #15 – 20 ppm 2,4-DNT, 10mMol Formic acid, pH = 4.04 Unknown Byproducts at HPLC Time..................................................................... 151
Figure B.6 Exp #16 – 20 ppm 2,4-DNT, 10mMol Formic acid, pH = 4.97 Unknown Byproducts at HPLC Time..................................................................... 151
Figure B.7 Exp #17 – 20 ppm 2,4-DNT, 10mMol Formic acid, pH = 6.06 Unknown Byproducts at HPLC Time..................................................................... 152
Figure B.8 Exp #18 – 40 ppm 2,4-DNT, 10mMol Formic acid, pH = 3.97 Unknown Byproducts at HPLC Time..................................................................... 152
Figure B.9 Exp #19 – 20 ppm 2A4NT, 4mMol Formic acid, pH = 4.00 Unknown Byproducts at HPLC Time...................................................................................... 153

xvi
Page
Figure B.10 Exp #20 – 40 ppm 2,4-DNT, 4mMol Formic acid, pH = 4.00 Unknown Byproducts at HPLC Time..................................................................... 153
Figure B.11 Exp #21 – 40 ppm 2,4-DNT, 1mMol Formic acid, pH = 4.00 Unknown Byproducts at HPLC Time..................................................................... 154
Figure B.12 Exp #22 – 20 ppm 2,4-DNT, 4mMol Formic acid, pH = 4.00 Unknown Byproducts at HPLC Time..................................................................... 154
Figure B.13 Exp #23 – 100 ppm 2,4-DNT, 1mMol Formic acid, pH = 4.00 Unknown Byproducts at HPLC Time..................................................................... 155
Figure B.14 Exp #24 – 100 ppm 2,4-DNT, 1mMol Formic acid, pH = 5.05 Unknown Byproducts at HPLC Time..................................................................... 155
Figure C.1 HPLC Standard Curve with Linear Regression for 2,4-DNT....................... 157
Figure C.2 HPLC Standard Curve with Linear Regression for 2A4NT. ........................ 158
Figure C.3 HPLC Standard Curve with Linear Regression for 4A2NT. ........................ 159
Figure C.4 HPLC Standard Curve with Linear Regression for 2,4-DAT....................... 160
Figure C.5 HPLC Standard Curve with Linear Regression for 2-NT............................. 161
Figure C.6 HPLC Standard Curve with Linear Regression for 2-aT.............................. 162

xvii
List of Tables
Page
Table 3.1 HPLC typical residence times for contaminant chemicals studied................... 41
Table 4.1 Column experiments (results exhibit Michaelis-Menten kinetic behavior)...... 55
Table 4.2 Column experiments (results exhibit first-order kinetic behavior)................... 88
Table C.1 HPLC Data for 2,4-DNT Standard................................................................. 157
Table C.2 HPLC Data for 2A4NT Standard................................................................... 158
Table C.3 HPLC Data for 4A2NT Standard................................................................... 159
Table C.4 HPLC Data for 2,4-DAT Standard................................................................. 160
Table C.5 HPLC Data for 2-NT Standard ...................................................................... 161
Table C.6 HPLC Data for 2-aT Standard........................................................................ 162

1
AN EVALUATION OF FORMIC ACID AS AN ELECTRON DONOR FOR
PALLADIUM (PD) CATALYZED DESTRUCTION OF NITROAROMATIC
COMPOUNDS
1.0 INTRODUCTION
1.1 Motivation
The Department of Defense (DoD) is home to over 29,000 hazardous waste sites.
These sites are located on approximately 11,000 military installations and former
properties in all 50 states, the District of Columbia, and the eight U.S. territories (DoD,
2003). Though clean-up activities are underway or complete at many of the sites, a
significant number of sites still remain to be investigated and perhaps remediated.
Administration of DoD sites falls under the Defense Environmental Restoration Program
(DERP); a federally mandated program to remediate environmental contamination from
past defense activities. A number of DoD sites listed in the DERP, currently 2,307, are
contaminated with constituents of munitions such as 2,4,6-trinitrotoluene (TNT), 2,4- and
2,6-dinitrotoluene (DNTs) and nitrotoluenes (NTs), hexahydro-1,3,5-trinitro-1,3,5-
triazine (RDX), and octahydro-1,3,5,7-tetranitro-1,3,5,7-tetrasocine (HMX) (DoD, 2003).
These sites are broken down into three categories: active installation sites (542 sites
identified), formerly used defense sites (FUDS) (1,691 sites), and Base Realignment and
Closure Act (BRAC) sites (74 sites). The DoD has a significant stake in NAC
remediation, only 15 out of the 542 active installation sites identified have investigations
currently underway.

2
In the past 18 years, the DoD has spent almost $25 billion remediating hazardous
waste sites through the DERP. The estimated cost to complete restoration at the reported
active installation and FUDS sites (2,233 sites) totals $11.2 billion (DoD, 2003). In FY
2002 alone, approximately $1.9 billion was appropriated for environmental restoration
activities. The DERP does not include operational ranges that are currently in use by the
Department of Defense. There is little doubt that ranges currently in use will have
munitions contamination that must be addressed in the future. The nitroaromatic
compounds (NACs) and their byproducts found at these operational ranges present a
potential hazard due to their explosive safety risks and potential toxicological effects
(DoD, 2003). The DoD estimates that total remediation costs at operational ranges will
be between $16 billion and $165 billion (DoD, 2003). These NACs are of interest as the
nitro group is among the most common groundwater and soil contaminants in the U.S.,
second only to the organochlorine functional group (Agrawal and Tratnyek, 1996).
Trinitrotoluene is a xenobiotic oxidizing agent suspected of causing
methemoglobinemia (Klaassen, 2001); in the bloodstream, it binds hemoglobin so
oxygen transport through the body is limited. The DNTs are smooth muscle toxins that
cause atherosclerosis, a cardiovascular disease that results in buildup inside arteries and
reduces blood flow (Klaassen, 2001). Chronic toxicity studies in laboratory animals have
shown DNTs can cause cancer of the liver, gallbladder, and kidneys as well as benign
tumors of the connective tissue. It is also possible for munition constituents to be
biologically transformed into toxins that are hepatotumorigenic; that is, which cause
tumors in the liver. The toxicity and widespread use and occurrence of these chemicals
within DoD make them an environmental concern.

3
Current techniques used to restore NAC-contaminated groundwater include
pump-and-treat, bioremediation, and natural attenuation. The conventional technique for
treating munitions-contaminated groundwater is a pump-and-treat system (DoD, 2003).
The contaminated groundwater is pumped to the surface, and the NACs are removed by
sorption to activated carbon. The treated groundwater is then returned to the aquifer or
discharged to surface waters. The major disadvantage of this remediation strategy is that
the contaminant is simply transferred from the liquid to the solid phase; the NAC itself is
still present aboveground, on the activated carbon, and potentially harmful. The use of
granular activated carbon (GAC) is the most common method of treatment due to its
simplicity, effectiveness, and, at least in past years, its relatively low price. However, the
rising cost of disposing or regenerating spent GAC is making other technologies more
competitive (Rodgers and Bunce, 2001). In addition, activated carbon is not useful to
treat high contaminant concentrations, as its sorption capacity may become rapidly
depleted as contaminant mass loadings increase, thus, requiring frequent disposal or
regeneration (Rodgers and Bunce, 2001). The increasing regulatory requirements and
disposal costs associated with ex situ (that is, above ground) remediation technologies
such as GAC have led researchers to look for more effective methods of treating
contaminant in place, or in situ. Within the DoD alone, approximately $20 million are
budgeted yearly for research and development of more effective remediation technologies
(DoD, 2003).
In general, in situ treatment is safer, has less regulatory requirements, is more
acceptable to the public, and usually is cheaper than ex situ treatment. The contaminant
is remediated in the subsurface, so contact with the contaminant by site workers or the

4
general public is limited compared to when the contaminant is pumped to the surface as
part of a pump-and-treat system. In many jurisdictions, the water that has been treated by
a pump-and-treat system cannot be reinjected into the subsurface, and must be managed
aboveground. Not only does aboveground wastewater management involve costs, it also
may constitute a significant waste of a limited resource. In addition to eliminating
aboveground waste management costs, the costs of pumping water to the surface are
eliminated when treatment is in situ. For the above reasons, particularly the reduction in
risk and the fact that all treatment is below ground, in situ treatment technologies are
often viewed favorably by the public.
One in situ remediation technique being investigated for application to NAC-
contaminated groundwater is engineered in situ bioremediation. Recent studies have
shown NACs may be completely degraded to carbon dioxide and water in laboratory
scale systems (Nishino et al., 1999). Engineered in situ bioremediation has all the
advantages of in situ technologies that were discussed above, while also having the added
advantage of using biological processes to destroy the NAC. Bioremediation of NACs
has good potential as a future remediation strategy, though at present, field scale
implementations are limited. While laboratory and bench scale NAC bioremediation
studies have been successful, exhibiting high rates of degradation and complete
mineralization (Nishino et al., 1999), these laboratory successes may not translate to
field-scale application. Bioremediation is limited in its application and current studies
suggest that high levels of DNT contamination (> 20 ppm) may inhibit microbial growth
(Nishino et al., 1999). Bench scale studies have also shown other possible limitations to
bioremediation: bioclogging due to excessive microbial growth, poor system

5
performance when oxygen levels drop (Lendenmann et al., 1998), and the difficulty of
proper subsurface mixing of the target contaminant, electron donor, and microorganisms.
Natural attenuation, the degradation or removal of a contaminant by naturally
occurring processes such as radioactive decay, chemical and biological transformation, or
uptake by plants, is another possible method of remediation. Concentrations of NACs
may also be reduced through sorption to soil or humic acids, dispersion, or volatilization.
These processes occur naturally and do not require human intervention, unlike engineered
bioremediation. Studies of NAC-contaminated natural systems have found that NACs
are degraded extremely slowly with the production of toxic intermediate amino
compounds (Nishino et al., 1999). Though microorganisms capable of mineralizing
NACs exist in natural systems, they do not appear to degrade NACs at the rates seen in
laboratory studies (Nishino et al., 1999).
Another method of remediation is chemically catalyzed degradation of NACs
using a noble metal catalyst formulation. Pure metal catalysts like palladium are too
costly for waste treatment and in certain instances the pure catalyst dissolves in the
presence of NACs (Rodgers and Bunce, 2001). Metal catalyst formulations of Pd with
carbon, iron, or Al2O3 have been used to degrade other environmental contaminants such
as TCE and PCE (Lowry and Reinhard, 2001) and research has shown the process has
potential for degrading NACs as well (Rodgers and Bunce, 2001; Phillips, 2003). Recent
work using palladium as a noble metal catalyst to reductively degrade nitrotoluene
showed that the reaction was sufficiently fast to be used in the field to remediate NAC-
contaminated groundwater (Phillips, 2003). Palladium was used rather than other metal
catalysts such as nickel, ruthenium, and platinum because palladium has been shown to

6
result in faster reaction kinetics (Niekamp, 2001). Swift reaction kinetics are necessary
due to the limited residence time associated with in situ remediation techniques. The fast
reaction kinetics that result from using just a small amount of palladium makes palladium
an ideal catalyst for in-well treatment systems.
The noble metal formulation catalyzes reduction chemistry by providing a site for
an electron donor and the contaminant to come together. There are a host of electron
donors that could be used but most often H2 gas and common acids such as hydrochloric,
sulfuric, or formic acid are used. Until recently H2 was the most commonly used electron
donor but new studies have shown that using formic acid as an electron donor may result
in faster contaminant reduction (Phillips, 2003). Studies conducted by Phillips (2003)
showed formic acid produced NAC degradation rates superior to hydrogen. Formic acid
offers several other advantages as compared to hydrogen. The major one is a buffering
effect: the hydroxide ions formed during nitrate reduction are neutralized in situ at the
catalyst surface by the CO2 formed by the decomposition of formic acid (Prüsse and
Vorlop, 2001). This buffering effect prevents the pH in the system from continuously
rising as hydroxide ions are formed when the nitrite is reduced. When only hydrogen is
used as an electron donor, the hydroxide ions raise the pH within the system. As the pH
rises, catalyst deactivation occurs as a result of OH- ions binding to catalyst sites
(Phillips, 2003). Another advantage of using formic acid is its general safety. Liquid
formic acid is easier to handle than compressed H2 gas which is explosive and highly
flammable. Formic acid also has a much higher solubility than H2 and it is possible to
make solutions with high concentrations of formic acid. The low solubility of molecular

7
hydrogen can limit the system as insufficient electron donor may be present at high NAC
concentrations.
Though the kinetics of palladium-catalyzed degradation of NACs have been
explored (Phillips, 2003), the reaction byproducts of NAC reduction using a Pd/Al2O3
catalyst with formic acid as an electron donor have not been identified. Reaction
byproducts using other palladium formulations or other electron donors have been
studied, however. Hydrogenation of 2,4-DNT using H2 gas as an electron donor and a Pd
on carbon catalyst was accomplished by Neri et al. (1995) with the main reaction
intermediate being 4-hydroxylamine, 2-nitrotoluene (4HA2NT). Other intermediates
found were 4-amino, 2-nitrotoluene (4A2NT) and 2-amino, 4-nitrotoluene (2A4NT)
(Neri et al., 1995). These intermediates are not production chemicals and have little
industrial use. Toxicity studies for these chemicals are limited, however amine-
substituted chemicals are generally toxic (Williams and Burson, 1985). Amines are
strong irritants and are easily absorbed by all routes. The nitro group and the amine
group both cause methemoglobin formation in red blood cells reducing oxygen transport
in the body. The reduction of 2,4-DNT using a Pd/Al2O3 catalyst with H2 as an electron
donor was studied by Rajashekharam et al. (1998). In their work, they found a reaction
scheme as seen in Figure 1.1 almost identical to the one proposed by Neri et al. (1995).
The degradation products and pathways associated with the destruction of NACs
are important for determining treatment methods and potential risks at a contaminated
site. Both 2,4-dinitrotoluene and 2,6-dinitrotoluene, precursor chemicals and degradation
byproducts of trinitrotoluene, have been shown to be carcinogenic in animals (EPA,
2002). In order to determine the feasibility of Pd-catalyzed degradation of NACs, the

8
byproducts and degradation pathways must be determined. The viability of Pd-catalyzed
destruction of NACs as a remediation technology at DoD sites may hinge on whether or
not significant quantities of daughter products that are more harmful than the parent NAC
(such as the amines observed in Neri et al.’s (1995) work) are produced.
Figure 1.1 Reaction scheme for hydrogenation of 2,4-DNT (Rajashekharam et al., 1997)
1.2 Research Objectives
This research will attempt to identify the reaction pathway and byproducts that
result from the Pd-catalyzed reduction of NACs using a Pd/Al2O3 catalyst and formic
acid as an electron donor. This thesis will focus on answering the following questions:
1. What byproducts result from the Pd-catalyzed degradation of a model NAC (nitrotoluene) using formic acid as an electron donor?

9
2. What are the reaction kinetics and rate parameters that describe the Pd-catalyzed degradation of nitrotoluene?
3. What byproducts result from the Pd-catalyzed degradation of a second model
NAC (DNT) and its isomers? What are the key degradation pathways of DNT? 4. What byproducts result from the Pd-catalyzed degradation of more complex NACs
(TNT, HMX, etc.)? What are the key degradation pathways?
1.3 Study Limitations
There are laboratory safety issues associated with the use of NACs like TNT,
HMX, and RDX. As these chemicals are explosive and very dangerous even in small
quantities they may not be used in the available facilities. This study will use
nitrotoluene (NT) and 2,4-dinitrotoluene (2,4-DNT) as model NACs. These compounds
are precursors to TNT and are expected to behave in a similar fashion though they
possess fewer nitro functional groups, making them safer for laboratory use. Results
from the 2,4-DNT experiments will be compared to results obtained by Rajashekharam et
al. (1999). Degradation pathways for HMX and RDX will not be explored as no
standards or precursor chemicals are available, or permitted in the available laboratory.
This study will focus solely on NAC-contaminated groundwater and will not address
NAC-contaminated soil or pure phase NAC.
10
2.0 LITERATURE REVIEW
2.1 Uses of Nitroaromatic Compounds (NACs)
NACs have been found to be ubiquitous pollutants in the aquatic environment
because they are widely used as pesticides, explosives, chemical intermediates, and dyes
(Heijman et al., 1995). Catalytic hydrogenation of nitroaromatic compounds is a process
used for the production of aromatic amines that are used to make plastics, fine chemicals,
and pharmaceuticals. One specific group of NACs is the (poly)nitrotoluenes consisting
of a base toluene molecule with several nitro (NO2-) groups. Nitrotoluenes are high
production chemicals with over 30 million pounds of o-nitrotoluene and over 10 million
pounds of p-nitrotoluene produced in the U.S. each year (see Appendix D for chemical
structures) (Dunnick et al., 2003). Hansen et al. (2001) reports that as of 1985, 2 million
pounds of TNT were being produced per year. Hydrogenation of 2,4-dinitrotoluene (2,4-
DNT) produces 2,4-diaminotoluene (2,4-DAT) which is used in the production of
polyurethane (Neri et al., 1995). Dinitrotoluenes (DNTs) are intermediates in the
manufacture of trinitrotoluene (TNT), once the world’s most widely used explosive.
Explosives are one of the most significant uses of NACs. Thus, munitions
manufacturing is a primary source of NAC contamination (Hansen et al., 2001). In
military applications DNTs are primarily used as plasticizers and burn rate modifiers in
propellants for rockets and artillery (Doppalapudi et al., 2001). DNTs are also precursors
of toluene diisocyanate used to manufacture polyurethane foams (Nishino et al., 1999).
DNT may also be found at industrial sites as it is a precursor to coatings and elastomers.

11
2.2 Production of Trinitrotoluene (TNT)
The chemical explosive, TNT, was first developed about 150 years ago. Though
the explosive nitroglycerin was developed in 1846, TNT was not produced until 1863.
TNT manufacturing began in the 1890’s but production lagged until noted chemist Fritz
Haber developed a process to synthesize ammonia in 1913. Readily available nitrogen
increased manufacturing and TNT saw heavy use during WWI. Adapted to commercial
use in the 1930’s by Karl Bosch, the Haber-Bosch process lead to the mass production of
TNT and other nitro compounds; in particular, fertilizers (Encarta, 2003). In the
explosive production industry, TNT refers specifically to 2,4,6-trinitrotoluene, the most
common and most used isomer of trinitrotoluene manufactured.
Production of TNT increased greatly in the first half of the 20th century. From
WWI and WWII TNT production in Germany alone grew from 3,000 tons to over 20,000
tons per month (Urbanski, 1964). In the United States billions of pounds of TNT were
produced annually. At the Weldon Spring Ordnance Works in eastern Missouri, more
than 700 million pounds of TNT were produced from 1941 to 1945 (DoI, 1996), and
Weldon Spring was only one of 23 Army Ammunition Plants in 21 states that were
producing and storing TNT.
As a military weapon, TNT was ideal for delivering explosive destructive force,
and destroying equipment, facilities, and materials. Since the turn of the century, TNT
has been the major explosive used for ammunition throughout the world (Nahen et al.,
1997). Only in the last 20 years has there been a shift to using other, more complex
explosives, like HMX and RDX, in the military. TNT is still used in commercial
12
industry, and millions of pounds of TNT-based ordnance still may be found in the
military inventory. During the middle of the 20th century, environmental regulations and
constraints on treating and disposing of industrial wastes were almost non-existent. The
production of TNT during this time resulted in large quantities of industrial effluent
called “red water”. Until about 30 years ago, hazardous substances and wastes, like “red
water”, were often managed and disposed of using standard practices that were later
found to be detrimental to the environment (DoD, 2003).
2.3 Groundwater Contamination by NACs
A significant percentage of Department of Defense (DoD) contaminated sites that
have been identified to date contain NAC contamination (DoD, 2003). These DoD sites
can be found throughout the United States and at U.S. military bases in other countries.
A majority of the contamination is the result of past and current manufacturing, storage,
transportation, and detonation of explosives containing TNT. In looking at the history of
TNT production and use it is easy to see how contamination infiltrated groundwater
aquifers and surface waters. Urbanski (1985) reported that industrial “red water”
contained up to 30 NACs besides TNT (Rodgers and Bunce, 2001). The “red water”
contained residual amounts of TNT as well as other production chemicals;
dinitrotoluenes (DNTs) and nitrotoluenes (NTs) being the most common. The NTs and
DNTs are the raw materials used to make TNT. Nitration is carried out in the presence of
nitric and sulfuric acid. A nitro group is added to toluene to form an NT which is further
nitrogenated to DNT and finally to TNT. The TNT is then crystallized in alcohol or

13
water and then washed with sodium sulfite (Zhao and Yinon, 2002). The process water
and wash water were then dumped directly to streams and wells often with no treatment
of the effluent. Kratz (1949) reported that in Germany, for production of 4,000 tons of
TNT a month, 5,000 – 6,000 m3 of “red water” was generated daily (Urbanski, 1964).
Though only 1.1 – 1.6% of drinking water samples test positive for DNTs with a mean
concentration < 10 µg/L for all samples, waste streams from manufacturing plants have
reported concentrations as high as 48 mg/L (CDC, 1998).
Another form of industrial waste from TNT production is “pink water” which was
used for final cleaning and purification of the TNT. Pink water generated during loading,
packing or assembling munitions often contains high concentrations of nitroaromatic
explosives (Rodgers and Bunce, 2001). Wastewater contaminated with these explosives
is also generated during demilitarization operations when excess or outdated munitions
are destroyed (Adrian et al., 2003). Commonly today, the term “pink water” is used to
describe all types of effluent containing nitroaromatic compounds due to the distinct pink
color caused when TNT is photodegraded (Dave et al., 2000). Hwang et al. (1998)
reported that a survey of four Army installations, where loading, packing, and assembling
operations were carried out, found that 1.6 million gallons of “pink water” were produced
annually.
Production and use of nitroaromatic explosives for military operations have
resulted in their transfer into the environment where they pose an ecological and potential
health hazard. Though the U.S. ceased commercial production of TNT in the mid 1980’s,
contamination still exists due to historical activities and current demilitarization
operations (Rodgers and Bunce, 2001; Hwang et al., 1998). Production of TNT is now

14
limited to United States Army arsenals and data on production is not publicly available
(CDC, 1995). U.S. Army arsenals are scattered across the United States, resulting in
widespread TNT contamination in many states. Many of the former Army Ammunition
Plants are now closed and listed on the National Priorities List (NPL), where the NPL is a
listing of the most contaminated sites in the United States. These sites are identified in
conjunction with the Comprehensive Environmental Response, Compensation, and
Liability Act (CERCLA) and billions of dollars have been spent to characterize and
remediate them. The number and distribution of NPL sites that are contaminated by TNT
(see Figure 2.1) indicates the widespread nature of this contaminant (CDC, 1995).
Figure 2.1 Location of NPL sites with TNT contamination (CDC, 1995)
Including degradation and products of combustion, there are over 200 chemicals
associated with military munitions. Of the 20 of greatest concern, nine are directly
associated with TNT, including TNT itself, and TNT degradation products like the

15
DNTs, nitrotoluenes, and amino-toluene isomers. DoD has identified potential releases
of munitions at locations such as former ranges, open burning/open detonation sites and
burial pits (DoD, 2003). The dinitrotoluenes are the major impurities of TNT and are
usually present wherever soils have been contaminated with TNT. DNTs are also a
major component of propellants for artillery shells, and can be found as contaminants in
soils on firing ranges in the immediate vicinity of firing points (Pennington, 2003). The
DNTs are more widely distributed across the United States than TNT (CDC, 1998) as can
be seen by comparing Figure 2.1 with Figures 2.2 and 2.3. Crockett et al. (1995) listed
some activities that result in soil or groundwater contamination by NACs, including open
detonation and burning of explosives at army depots, evaluation facilities, artillery
ranges, and ordnance disposal sites (Rodgers and Bunce, 2001). These activities continue
today as military forces conduct training and improve military equipment and tactics.
Figure 2.2 Location of NPL sites with 2,6-DNT contamination (CDC, 1998)

16
Figure 2.3 Location of NPL sites with 2,4-DNT contamination (CDC, 1998)
Military operations are vital in today’s world. To attain the level of readiness
necessary to deter adversaries and defend our nation, the DoD must develop, test, and
deploy weapon systems and military munitions, and then train its personnel to use and
maintain these systems (DoD, 2002). The past, present, and, presumably, future use of
explosives will continue to cause nitroaromatic contamination. In 1993 the DoD had
identified more than 1,000 sites with explosives contamination. Of these sites, greater
than 95% had TNT and 87% exceeded permissible groundwater contaminant levels
(Rodgers and Bunce, 2001). Adrian et al. (2003) report that more than 1,200 explosive
contaminated sites have been identified within the United States. The extent of the
problem is just beginning to be realized in Europe where more than 2,000 ammunition
production and storage sites are likely contaminated with explosives. Lendenmann et al.
(1998) report that traces of DNT have been found in the Rhine and Elbe rivers, two major

17
European waterways. Dillert et al. (1995) report that in Germany several places are
known where the water supply is endangered by nitroaromatic compounds. Recent
surveys of five Canadian anti-tank ranges revealed low level soil contamination by TNT,
HMX, and RDX (Groom et al., 2001). The manufacture and use of these chemicals will
continue in an effort to protect the security of our nation. However, their use has resulted
in severe contamination of both soils and groundwater (Balakrishnan et al., 2003). With
the inevitability of these chemicals being used in the future, along with widespread
existing contamination, methods must be developed to remediate them and reduce the
risk they pose to the public and the environment.
2.4 Toxicity of Nitrotoluenes, Aminonitrotoluenes, and Aminotoluenes
Many munition constituents are toxic and believed to be carcinogenic. TNT as
well as 2,4-DNT are listed as U.S. EPA priority pollutants; they are known mutagens and
can cause pancytopenia as a result of bone marrow failure (Rodgers and Bunce, 2001).
This has focused the majority of toxicity research on TNTs and DNTs; the aminotoluenes
have not been as studied and limited information is available. Trinitrotoluene is an
oxidizing xenobiotic agent suspected of causing methemoglobinemia (Klaassen, 2001).
The TNT causes a buildup of methemoglobin which leads to reduced oxygen levels by
binding up hemoglobin making it unable to transport oxygen in the body. The precise
mechanism is still unknown, but it is believed the nitro group in the TNT molecule
directly interacts with the iron in hemoglobin reducing red-blood cell activity. Water
phase toxicity studies conducted by Dave et al. (2000) resulted in a water-phase EC/LC50

18
between 5 and 20 mg/L for two crustaceans (Daphnia magna and Nitocra spinipes). The
toxicity of DNT to these crustaceans was slightly less than that of TNT, but after
activation by UV light, DNT toxicity was more pronounced (Dave et al., 2000).
The DNTs are responsible for a number of occupational diseases including the
cardiovascular disease atherosclerosis. In this case the toxic DNT degrades the interior of
arteries causing plaque buildup and obstructing bloodflow. DNT appears to have a
negative effect on Sertoli cells causing sterility (Klaassen, 2001). DNTs have also been
identified as smooth muscle cell toxins (Klaassen, 2001). The toxin mutates the cell and
can cause uncontrolled growth similar to a tumor. Chronic toxicity studies in laboratory
animals have shown that DNT can cause cancer of the liver, gall bladder, and kidney, as
well as cause benign tumors of the connective tissue. In humans, retrospective mortality
studies in exposed workers show DNT causes circulatory disorders of atherosclerotic
etiology. DNT can also be biologically transformed to more toxic contaminants that are
hepatotumorigenic; that is, which cause tumors in the liver (Klaassen, 2001). During
WWI and WWII, fatal cases of toxic jaundice and aplastic anemia were recorded by the
U.S. Department of Health and Human Services among munitions workers (Rodgers and
Bunce, 2001). Urbanski (1964) reported that in one ammunition plant in the U.S., 17,000
poisoning cases with 475 fatalities occurred during seven and a half months of
production.
Since DNTs are considered toxic and many explosives-contaminated sites exhibit
DNTs as well as TNT, the fate of DNT is relevant to remediation and risk assessment
(Pennington, 2003). Hawari (1999) reports that the environmental transformation
products of NACs, including arylamines, arylhydroxylamines, and condensed products

19
such as azoxy- and azo-compounds, are thought to be as or more toxic than the parent
nitroaromatic (Rodgers and Bunce, 2001).
The aminonitrotoluenes (2A4NT and 4A2NT) which were seen as intermediates
in the reduction of DNT (Neri et al., 1995; Rajashekharam et al., 1998) have not been
studied with the same intensity as TNT and the DNTs. Specific toxicological studies
using these chemicals could not be found, but the chemical properties of the functional
groups may be used to infer toxicity. Chemicals with the amine (NH2) functional group
are usually strong irritants, have tissue-corrosive characteristics, and can cause
methemoglobin formation (Williams and Burson, 1985). The nitro group (NO2) is
believed to be responsible for causing methemoglobinemia as seen with TNT and the
DNTs and its presence indicates the aminonitrotoluenes may have similar effects.
The diaminotoluenes (DATs) are significantly more common and toxicity studies
have shown DATs cause hepatocellular carcinomas (the most common primary
malignant liver tumor) in rats and mice (Hathaway et al., 1996; Klaassen, 2001).
Exposure to 2,4- and 2,6-diaminotoluene also inhibited DNA synthesis in smooth muscle
cells, similar to the effects caused by 2,4-DNT (Klaassen, 2001).
The nitrotoluenes (2-NT, 3-NT, 4-NT) have been shown to depress the immune
system and antibody response, thus lowering host resistance. 2-NT exhibited clear
evidence of causing cancer at multiple sites in rats and mice. These studies showed that
experimental exposure to 2-NT caused mesotheliomas, subcutaneous skin neoplasms,
mammary gland fibroadenomas, and liver neoplasms. Stop-studies, experimental
treatment with 2-NT for a set period of time, on rats and mice showed tumor formation
occurred after three months of dosing at 125 mg/kg or 315 mg/kg and these events were

20
irreversible and eventually lead to cancer at multiple sites (Dunnick et al., 2003). The
aminotoluenes, also called toluidines (see Appendix D), are demonstrated mutagens that
have been shown to be carcinogenic in animals and are suspected human carcinogens
(Williams and Burson, 1985). They also cause anoxia as a result of methemoglobin
formation (Hathaway et al., 1996).
2.5 Properties of Nitroaromatic Compounds
The high yield detonation, ease of ignition, and relatively safe handling
(compared with nitroglycerine) of TNT made it an ideal explosive that could be mass
produced, stored and shipped (Lewin, 2003). The low melting point (80.1°C), stability,
low sensitivity to impact, and safety of manufacture, compared to other explosives, were
additional benefits of TNT (Doppalapudi et al., 2001). Nitroaromatic compounds are
resistant to chemical or biological oxidation and to hydrolysis because of the electron-
withdrawing nitro groups (Rodgers and Bunce, 2001). They are environmentally
persistent and remediation of NAC-containing waste streams and groundwater is difficult
due to their properties. TNT has a solubility of 130 mg/L at 20ºC (CDC, 1995) which
causes soil contamination to slowly seep into the groundwater. The DNTs have only a
slightly higher solubility of 270 mg/L at 20ºC. The octanol/water partition coefficient as
log Kow is 1.60 so TNT is not expected to significantly partition to sediment or strongly
sorb to soil particles (ICSC, 2000). The average adsorption coefficient (Kd) for soil tests
conducted by Pennington and Patrick (1990) was 3.8 cm3/g with a standard deviation of
1.34 (Phelan and Webb, 1998) indicating limited sorption potential. TNT has a relatively

21
low Henry's Law constant, 3.35x10⁻⁷ indicating limited partitioning from surface waters
to the atmosphere (Phelan and Webb, 1998).
Based on these parameter values, it appears that removal of aqueous phase TNT
due to volatilization or sorption is limited. Thus, solid TNT at the surface, which has
been reported to persist for many years by Rosenblatt (1980) will act as a source of
groundwater contamination, dissolving into water with very little removal by either
volatilization or sorption (CDC, 1995).
2.6 Reduction of NACs
Although, as noted earlier, oxidation of TNT and other NACs is difficult, these
compounds are susceptible to chemical reduction. Engineered reduction of NACs has
been proposed as the first step in a two-stage treatment process, since the aromatic
polyamines that result from NAC reduction are more biodegradable, less persistent and/or
bind irreversibly to the solid matrix under oxic conditions (Hofstetter et al., 1999)
compared with the parent nitroaromatic. Hoffstetter et al. (1999) reports that reduction of
nitro groups is the predominant transformation pathway of polynitroaromatics under
anaerobic as well as aerobic conditions. During reduction, the nitro groups (NO2) are
replaced with amine groups (NH2) in a sequential order. The TNT is reduced down to
triaminotoluene (TAT). Under aerobic conditions, DNTs are reduced to
monoaminodinitrotoluenes, but not to diaminonitrotoluenes (Pennington, 2003).
Reduction of NACs can be accomplished by creating a reducing environment by
oxidizing a metal, such as Fe, or by using an electron donor, such as hydrogen or formic
22
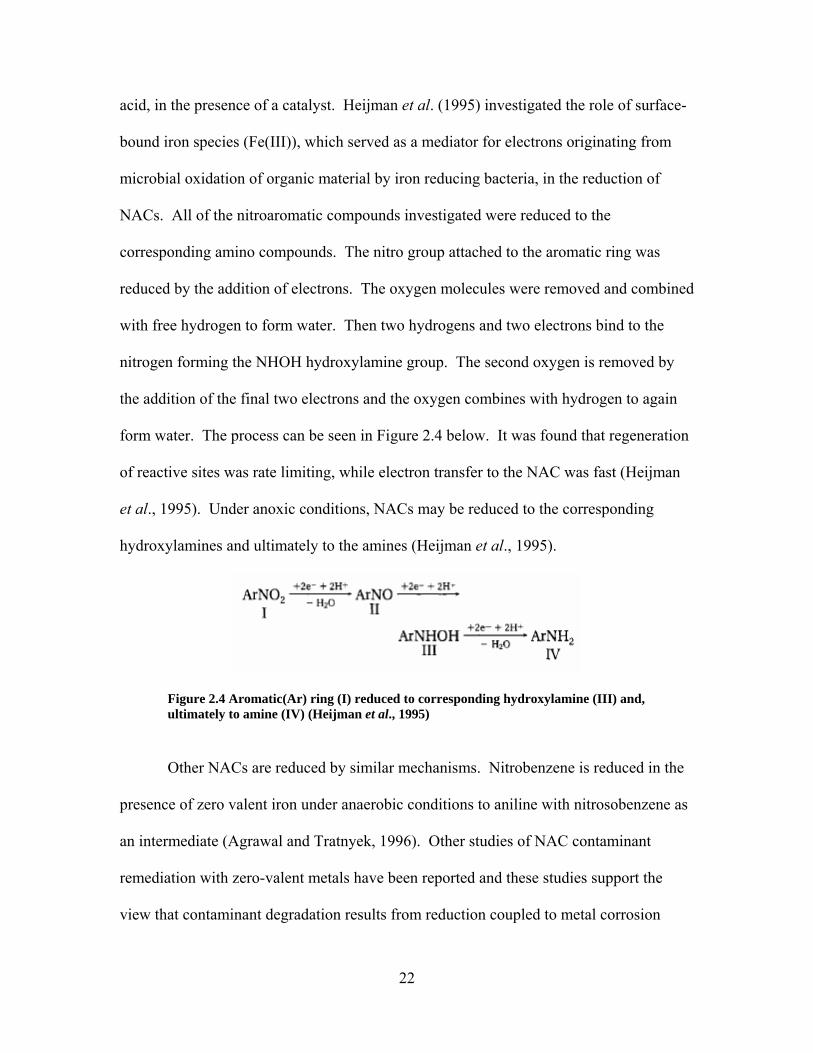
acid, in the presence of a catalyst. Heijman et al. (1995) investigated the role of surface-
bound iron species (Fe(III)), which served as a mediator for electrons originating from
microbial oxidation of organic material by iron reducing bacteria, in the reduction of
NACs. All of the nitroaromatic compounds investigated were reduced to the
corresponding amino compounds. The nitro group attached to the aromatic ring was
reduced by the addition of electrons. The oxygen molecules were removed and combined
with free hydrogen to form water. Then two hydrogens and two electrons bind to the
nitrogen forming the NHOH hydroxylamine group. The second oxygen is removed by
the addition of the final two electrons and the oxygen combines with hydrogen to again
form water. The process can be seen in Figure 2.4 below. It was found that regeneration
of reactive sites was rate limiting, while electron transfer to the NAC was fast (Heijman
et al., 1995). Under anoxic conditions, NACs may be reduced to the corresponding
hydroxylamines and ultimately to the amines (Heijman et al., 1995).
Figure 2.4 Aromatic(Ar) ring (I) reduced to corresponding hydroxylamine (III) and, ultimately to amine (IV) (Heijman et al., 1995)
Other NACs are reduced by similar mechanisms. Nitrobenzene is reduced in the
presence of zero valent iron under anaerobic conditions to aniline with nitrosobenzene as
an intermediate (Agrawal and Tratnyek, 1996). Other studies of NAC contaminant
remediation with zero-valent metals have been reported and these studies support the
view that contaminant degradation results from reduction coupled to metal corrosion

23
(Agrawal and Tratnyek, 1996). The transformation reaction generally produces the
corresponding aromatic amines, with minor amounts of intermediates like
hydroxylamines and nitroso compounds (Agrawal and Tratnyek, 1996).
Granular iron has been determined to be a potentially useful reductant for organic
contaminants in groundwater. Devlin et al. (1998) used a suite of NACs to investigate
granular iron reactivity. The research found the NACs were rapidly reduced to anilines
that sorbed to the solid iron particles, thereby reducing the activity of the iron. The
granular iron reactivity was rapidly reduced over the first few days then more slowly over
several months (Devlin et al., 1998). Nitro reduction by iron may be useful in the
treatment of NAC-contaminated water if the resulting amines can be removed by
subsequent treatment (Agrawal and Tratnyek, 1996). Triaminotoluene (TAT) may be
almost irreversibly bound to the granular iron surface. Treatment of TNT with iron may
lead to very small residual dissolved concentrations of TNT and its reduction products
over prolonged periods (Devlin et al., 1998). Research has demonstrated that NACs such
as TNT can be completely reduced to the corresponding aromatic polyamines by Fe(II)
present at the surface of Fe(III)(hydr)oxides (Hofstetter et al., 1999).
A second method of reduction involves using a metal catalyst and an electron
donor. Many different metal catalysts exist; nickel rhodium, platinum and palladium
being the most common. More recently palladium metal and metal formations made with
palladium have been used as catalysts because of their superior performance over other
metals (Niekamp, 2001). Hydrogenolysis of PCE on Pd has been demonstrated and
shown to be faster than PCE reductive dechlorination in the presence of iron (Devlin et
al., 1995). There are also many different electron donors that can be used to drive

24
reduction of NACs. The most commonly used electron donor is hydrogen gas, H2, which
creates the needed free electrons and hydrogen to reduce the contaminant. Another
potential electron donor is formic acid. Recent studies by Phillips (2003) have shown
that formic acid is a superior electron donor for the Pd-catalyzed reduction of NACs.
There has been limited research conducted on Pd-catalyzed degradation of NACs.
Hydrogenation of 2,4-DNT to 2,4-diaminotoluene (DAT), also called 2,4-toluenediamine
(2,4-TDA), using H2 gas as an electron donor was carried out over a 5% Pd/C catalyst
(Neri et al., 1995). The main reaction intermediate was 4-hydroxylamine, 2-nitrotoluene
(4HA2NT). The other two relevant intermediates that were observed were 4-amino, 2-
nitroluene (4A2NT) and 2-amino, 4-nitrotoluene (2A4NT) (Neri et al., 1995).
Researchers determined intermediates are formed from DNT through two parallel
reactions (Figure 2.5). The intermediates are then hydrogenated to produce DAT, as
shown in Figure 2.5 (Neri et al., 1995). The reaction pathway shows the sequential
removal of oxygen and replacement by hydrogen. Similar behavior is seen when
Pd/Al2O3 is used as a catalyst and hydrogen gas is the electron donor (Rajashekharam et
al., 1997). The researchers reported two possible reduction pathways similar to those
shown in Figure 2.6. The first pathway has 4HA2NT as an intermediate while the other
pathway bypasses hydroxylamine production. Rajashekharam et al. (1997) reported that
the 4HA2NT intermediate accounted for less than 2% of the 2,4-DNT that was converted
and therefore could be discounted in the stoichiometric reaction pathway.

25
Figure 2.5 Reduction pathways for 2,4-DNT (Neri et al., 1995)
Figure 2.6 Two possible pathways for the reduction of 2,4-DNT (Rajashekharam et al., 1997)
Scheme 1 Scheme 2

26
Reduction by palladium catalysis is ineffective at high pH, as strongly adsorbing
oxygenated species block palladium sites (Prüsse and Vorlop, 2001). This inhibits the Pd
reactivity. Studies conducted by Prüsse and Vorlop (2001) found that for Pd-catalyzed
nitrite reduction with hydrogen gas as a reductant, the activity of the nitrite decreases
with increasing pH (Prüsse and Vorlop, 2001). Research conducted by Phillips (2003)
also showed that degradation rates decreased with increasing pH. One advantage that is
hoped to be gained using formic acid is an internal buffering effect to control the pH.
Formic acid combines with palladium to produce a reducing environment through
a mechanism that Prüsse and Vorlop (2001) describe as transfer hydrogenation. Transfer
hydrogenation is the process by which formic acid binds to palladium at two congruent
sites (Figure 2.7). One hydrogen is released as the formic acid binds, the other then is
available for immediate use in the reduction of the NAC contaminant. This reduction
occurs as described in Figure 2.5. When starting with DNT as a contaminant, byproducts
like those reported by Neri et al. (1995) and Rajashekharam et al. (1997) are seen.
Figure 2.7 Schematic representation of the absorption of formic acid onto monometallic Pd (Prüsse and Vorlop, 2001)
To date, only Phillips (2003) is known to have looked at a system using a
palladium catalyst and formic acid as an electron donor to remediate NACs. Both Neri et
al. (1995) and Rajashekharam et al. (1997) used H2 gas as a reductant. A number of
advantageous properties of formic acid may account for its superior performance.

27
Formic acid is a liquid that has almost unlimited solubility in water so high
concentrations of formic acid can be achieved; whereas hydrogen gas has a limited
solubility. Formic acid also buffers the system due to the production of CO2 as the acid
breaks down during reactions with the palladium. The hydroxide ions formed during
nitrate reduction are neutralized at the catalyst surface (Prüsse and Vorlop, 2001).
Formic acid is also cheaper and easier to store, ship, and handle as compared to a
compressed gas like hydrogen.
2.7 Application of Pd Catalyzed Reduction of NACs
Metal catalyst systems used for groundwater remediation may be applied either
aboveground in conjunction with pump-and-treat systems or in-well as an in situ
remediation technology. For in situ application, a catalyst can be installed in-well as a
component of a recirculating well. In this type of well, contaminated groundwater is
extracted from the aquifer through a well screen, pumped up through the well where it
passes through the catalytic reactor, and the treated water is then injected into the aquifer
through a second well screen. A fraction of the treated water then flows through the
aquifer back to the extraction well screen for recycle through the in-well reactor.
Another approach is to use so-called horizontal flow treatment wells that have two dual-
screened wells that pump in opposite directions (one well pumps water up, the other
down). Recycle occurs between the two wells, with treatment occurring as water passes
through in-well reactors. The high rates of degradation that have been seen with Pd
catalysis make Pd an ideal choice for in-well application where fast reaction kinetics are

28
required due to the limited contact time in the reactors. Formic acid may be useful as a
reductant in an in-well system, based on the advantages of its use which were discussed
above.
2.8 Alternate NAC Remediation Technologies
2.8.1 Ex Situ Technologies.
There are a number of technologies available to remediate NAC contamination in
groundwater at the surface, or ex situ. A pump-and-treat system is used to capture
contaminated groundwater and pump it to the surface. Methods of treatment that can be
employed at the surface include physical processes such as adsorption to activated
carbon, biological processes like bioremediation or phytoremediation, and chemical
processes such as photocatalytic degradation. Physical adsorption using granular
activated carbon (GAC) is a simple and commonly used method of remediation (Rogers
and Bunce, 2001). The NACs are concentrated in the GAC and then the GAC is treated
either through disposal, incineration, or regeneration by partial oxidation where the
NACs desorb and burn (Rogers and Bunce, 2001). Pump-and-treat systems using
adsorption to GAC as the aboveground treatment technology have been used in the field
with much success. The use of GAC is limited due to the finite capacity of the activated
carbon and the necessity to treat the GAC after use. At high contaminant concentrations
and large groundwater volumes the use of activated carbon systems becomes
economically unviable.

29
Bioremediation is another technology that can be linked to a pump-and-treat
system. The contaminated groundwater can be pumped through fluidized beds or
trickling filters where biologic activity can degrade the NACs, much like a municipal
wastewater treatment systems. The use of bioremediation has the potential advantages of
low cost, ease of operation and public acceptance (Rogers and Bunce, 2001). Another
distinct advantage of bioremediation is that the NAC is destroyed rather than just
removed as in GAC systems. Research has shown that bacteria can completely degrade
mixtures of DNT liquid cultures without the production of aminonitrotoluenes (Nishino
et al., 1999), though Nishino et al. (1999) found the presence of high concentrations (250
µM) of 2,6-DNT inhibited 2,4-DNT degradation. Biological systems also require a
significant measure of control to ensure proper environments are maintained to support
the microorganisms. Lendenmann et al. (1998) reported that loss of environmental
control led to contaminant breakthrough in two instances.
Ex situ chemical methods of remediation are also possible. One is photocatalytic
degradation using ultraviolet light and an oxidizing agent such as hydrogen peroxide,
ozone, or titanium oxide (TiO2) to oxidize NACs (Nahen et al., 1997). The NACs absorb
sunlight, or artificially generated UV light, and are oxidized (Nahen et al., 1997). Nahen
et al. (1997) found that greater than 99% TNT removal was achieved within 90 minutes
of irradiation. The major intermediates seen were trinitrobenzene, 3,5-dinitroaniline, 2A-
4,6-DNT, and 4A-2,6-DNT (Nahen et al., 1997). In particular, the amino-dinitro
compounds appear to accumulate during TNT photocatalysis (Nahen et al., 1997).
Dillert et al. (1995) found that the reactivity of the NAC decreases with increasing
numbers of nitro groups on the aromatic ring for irradiated aqueous suspensions of TiO2.

30
Dillert et al., (1995) indicates that photocatalysis may be an effective treatment for
ammunition plant wastewater, but does not report any successful field applications.
Base-induced transformation of TNT has also been shown using NaOH (Hansen et al.,
2001). Complete removal of TNT was reported with a systematic production of
unidentified byproducts (Hansen et al., 2001).
2.8.2 In Situ Technologies.
In situ technologies have an advantage in that the contaminated groundwater
remains in the subsurface. This greatly reduces the risk of exposure to the general public
and reduces some of the regulatory requirements of dealing with hazardous waste. In situ
remediation strategies are generally more economical for large scale clean-up as the cost
of pumping millions of gallons of groundwater to the surface is not incurred. Though
physical and photocatalytic methods of remediation are not practical to apply in situ, in
situ biodegradation and chemical reduction are possible.
Spanggord et al. (1991) found that strains of Pseudomonas sp. under aerobic
conditions could completely biodegrade 2,4-DNT, while using it as the sole source of
carbon. A dioxygenase attack at the 4,5 position removed the nitro group as nitrite with
subsequent reactions resulting in the removal of the second nitro group and complete
biodegradation (Spanggord et al., 1991). Studies have found that TNT was transformed
to 2,4,6-triaminotoluene (TAT) by Clostridia in Brain Heart Infusion broth, mixed
cultures in anaerobic sludge, and by a biofilm from an industrial wastewater treatment
plant (Adrian et al., 2003). Adrian et al. (2003) found that addition of H2, ethanol, or
propylene glycol enhanced transformation of TNT, which was completely depleted with

31
transient formation of 2A-4,6-DNT, 4A-2,6-DNT, 2,4DA-6-NT, and TAT. Findings
indicate hydrogen is a key factor in stimulating the anaerobic biotransformation of RDX,
HMX, and TNT and suggest the addition of hydrogen gas or electron donors that produce
hydrogen gas may be a useful strategy for enhancing the anaerobic biodegradation of
explosives in contaminated groundwater and soils (Adrian et al., 2003).
Though mineralization is possible, several factors can limit biodegradation.
Bioavailability of some nitroaromatic compounds in historically contaminated soils can
be dramatically reduced due to sorption to soil (Nishino et al., 1999). Bioremediation
systems can be subject to mechanical failures as seen in experiments conducted by
Lendenmann et al. (1998). Conclusions drawn by Schmelling (1996) and reported by
Rogers and Bunce (2001) show that due to NAC toxicity, bioremediation may not be
appropriate when NAC concentrations are high, or when biodegradation results in the
production of non-biodegradable byproducts. Abiotic systems, like palladium catalyzed
reduction systems, can be applied at areas with extremely high concentrations (>100
ppm) that are toxic to microorganisms. Research with Pd/formic acid systems is limited
but encouraging requiring more research and efforts to identify daughter products and
describe the system.

32
3.0 EXPERIMENTAL MATERIALS AND METHODS
3.1 Chemicals
Certified ACS grade chemicals were obtained from Sigma-Aldrich Chemical Co.
in the highest purity available. No additional purification was performed and chemicals
were used from their original containers as shipped. Chemicals obtained included all of
the amino compounds used during the course of experimentation and two dinitrotoluene
isomers; 2,4-dinitrotoluene and 2,6-dinitrotoluene. The isomers of the mononitrotoluenes
(2-NT, 3-NT, and 4-NT) were obtained in 2002 by Lt Landon Phillips in his previous
work (Phillips, 2003). These three chemicals have been in storage in their original
containers in the Wright State University Department of Geological Sciences laboratory
where the experiments were conducted. The nitrotoluenes were obtained from Sigma-
Aldrich Chemical Co. and are certified ACS grade chemicals with a 99%+ purity.
3.2 Palladium Catalysts
Palladium catalysts were supplied by Sigma-Aldrich Chemical Co. as 0.5%
weight on alumina (Al2O3) 3.2 mm diameter pellets. The pellets were used as obtained
and no further purification was accomplished. The pellets were used as the sole media in
the column reactor. The pellets were added to the column with no special precautions to
avoid exposure to air.
33
3.3 Column
The column and end caps were purchased from Mainline Supply, Dayton, OH, a
local plumbing supply store. The column is a 4 cm diameter, 316 gauge stainless steel
tube. The column is 13 cm long and threaded on both ends. End caps of the same
material were tightened with a wrench after Teflon tape was applied to the threads. A
single, threaded hole of ¼” diameter was drilled into each end cap for installation of a
sampling port. Each end cap was packed with a layer of pesticide grade glass wool
obtained from Sigma-Aldrich Chemical Co. to ensure even flow across the column and
prevent the media from infiltrating or clogging the tubing. The column was packed with
157.31 gm of Pd/Al2O3 pellets. The column was tapped repeatedly during packing to
settle the pellets and reduce the pore volume. Once the end caps were applied and
tightened, the column was not opened again, nor was it rotated from its original vertical
orientation. The column remained vertical throughout the entire run of experiments with
the influent entering from the bottom of the column and the effluent exiting the top of the
column. Five pore volume measurements were made after the end caps were tightened,
resulting in an average pore volume of 69.2 mL with a standard deviation of 2.28 mL.
This pore volume was used to calculate hydraulic residence times (HRTs) during the
subsequent experiments.
3.4 High Pressure Liquid Chromatograph (HPLC) - Standardization
Chemical constituents, daughter products, and concentrations were determined
using a High Pressure Liquid Chromatograph (HPLC) detection system. The HPLC

34
system consists of a Dynamax® Solvent Delivery System, model SD-200. The delivery
system uses two pumps, one pumping HPLC grade acetonitrile, the other pumping a
buffer solution made with filtered deionized water and 10 mL of buffer solution
concentrate (potassium phosphate monobasic-sodium hydroxide buffer, Fisher Scientific)
per liter of water. The acetonitrile/buffer solution runs through a mixing chamber then
through the sample injection ring. The sample injection ring has a volume of 20 µL. The
detector is a Dynamax® absorbance detector model UV-1. The entire system is
connected to a desktop computer and controlled by Dynamax® software. Output from
the UV detector was obtained real-time and stored on the computer hard drive. Printouts
of each sample run were collected as a backup. The column used was a Discovery® C-
18 5µm, 25 cm x 4.6 mm HPLC column obtained from Supelco, a division of Sigma-
Aldrich Chemical Co. The column was used with a 50% mix of HPLC grade acetonitrile
(99.93%+, Sigma-Aldrich) and 50% buffer solution described above (pH > 6.5).
Calibration of the column was accomplished using multiple dilutions of known
contaminant concentrations. Stock solutions of experimental chemicals were made from
the above mentioned chemicals using filtered deionized water. Retention time ranges for
each chemical were determined for the HPLC method used. Known concentrations were
plotted against the absorbance area, resulting in a straight line relationship between
concentration and area. Linear regression from the dilution standards gave R2 values
greater than 0.99 for all chemicals (see Appendix C).
All HPLC analysis was conducted at a flowrate of 1.3 mL/min and a UV
absorbance of 254 nm. This wavelength is the maximum absorbance for the benzene ring
and is appropriate for detection of most NACs. The nitrotoluenes mentioned above,
35
including the aminonitrotoluenes, are all clearly visible using the method parameters
detailed above. The flowrate is the same as that used by Phillips (2003) though he used
an absorbance wavelength of 280 nm. Other researchers including Lendenmann et al.
(1998) and Heijman et al. (1995) used a wavelength of 254 nm in conjunction with
HPLC for determination of NAC concentration. Heijman et al. (1995) also used HPLC
with a flowrate set to 1.0 ml/min.
3.5 Flow-through Column Experiments
Flow through column experiments were conducted to identify daughter products
formed by the reduction of nitroaromatic compounds on Pd catalyst using formic acid as
an electron donor. Deionized water contaminated with a known concentration of a
specific contaminant was pumped through the column using a Masterflex® L/S Digital
Standard Drive peristaltic pump model number 7523-70 obtained from Cole-Parmer. The
pump head is a PTFE diaphragm pump model number 07090-42 manufactured by the
Barnant Company, Barrington, IL, and was obtained from Cole-Parmer.
Water used in the column experiments was mixed in a 19L glass jar where formic
acid concentrations and pH could be adjusted to desired levels (see Figure 3.1). To adjust
the pH, NaOH (1M and 2M) was added until the desired pH was obtained. Then 4 L of
the mixture was placed in a glass Ehrlenmeyer flask and the contaminant was added to
obtain the desired concentration (see Figure 3.1). Contaminant concentrations ranged
from 20 ppm to 100 ppm. The contaminant-spiked mixture was then stirred for
approximately 48 hours (72+ hours for the 100 ppm experiments) to ensure contaminant

36
was totally dissolved. Catalyst column influent contaminant concentrations were reduced
over time as water with formic acid from the 19 L jar flowed into and diluted the
contaminant-spiked water in the Ehrlenmeyer flask (Figure 3.1).
Figure 3.1 Schematic of experimental setup
Influent samples, Cin, were taken using a three-way valve (Cole-Parmer) after the
flow passed through the pumphead prior to entering the column. The effluent samples,
Cout, were taken from the column effluent line directly. Effluent samples were taken one
minute after the corresponding influent sample. Flowrates through the column were
determined for each experiment by running non-contaminated water from the 19 L jar
through the column. The water was run until the measured effluent pH and conductivity
stabilized. Pump settings were chosen to provide hydraulic residence times as close to
one minute as possible. Temperature was not controlled, but the laboratory experienced a
shift of less than 4º C (17º C - 21ºC) during all experimental runs. The values of Cin and
Effluent sample
Influent sample
Pump Mixer
Formic acid
waste
Pd/Al2O3
Contaminant
Ehrlenmeyer flask
19 L jar

37
Cout will be used to determine extent and rate of degradation of the specific NAC for each
experiment.
3.6 Effect of pH
The pH of the experimental water was adjusted to determine what effects pH had
on NAC reduction and byproduct formation. Phillips (2003) reported that at low pH,
nitrotoluene reduction rates improved. Experiments were conducted to determine if the
same trend will be seen for dinitrotoluenes (see Table 3.2). After a known molar amount
of formic acid was added to 20L of DI water, the pH was adjusted with NaOH to desired
levels (4.0, 5.0, 6.0). A stirplate was used to ensure complete mixing while pH
adjustments were being made. After the desired pH was obtained, the mixture was stirred
overnight (approx. 12 hours). The pH was measured again and recorded immediately
prior to running the experiment. For each experiment, the pH of the column effluent was
measured for each sample, though the influent pH was assumed constant throughout the
experiment and was not measured once the experiment began.
3.7 Effect of Contaminant Concentration
Experiments were conducted at differing initial concentrations to study the effect
of contaminant concentration on reduction rate and daughter products. The experiments
were conducted following procedures outlined in Section 3.5 for contaminant
concentrations of 20, 40, and 100 ppm (see Table 3.2). Higher contaminant

38
concentrations were unrealistic for groundwater contamination due to the low solubility
of 2,4-DNT (270 mg/L).
3.8 Effect of Formic Acid Concentration
The experimental setup to determine the effect of formic acid concentration on
NAC reduction rate and daughter products followed procedures outlined in Section 3.5.
Greater degradation rate of nitrotoluenes occurred at higher formic acid concentrations
(Phillips, 2003) and experiments will determine if this also applies to dinitrotoluenes.
Concentrations of 1, 4, and 10 mMol of formic acid were studied (see Table 3.2).
3.9 Application of Michaelis-Menten Kinetics
When contaminant concentrations are low, a simple first-order equation can be
used to model degradation,
kCdtdC
−= , (1)
where the change in contaminant concentration over time (dC/dt) is equal to the
contaminant concentration (C) times a degradation rate constant (k). To obtain a value
for k, the method outlined by Phillips (2003) will be employed. A plot of dC/dt versus
Clm is used to obtain the first-order rate constant. For a column experiment, we use the
log mean concentration within the column (Clm) (see Equation (2)) to represent the
contaminant concentration (C) in Equation (1)
39
)/ln( outin
outinlm CC
CCC −= (2)
where Cin and Cout are the column influent and effluent contaminant concentrations,
respectively. The change of contaminant concentration over time (dC/dt) is determined
using Equation (3)
θ)( outin CC
dtdC −
= (3)
where the hydraulic retention time (θ) in minutes is calculated for each experiment as the
column pore volume (69.2 mL) divided by the flowrate of water through the column in
mL/min. A value close to 1 minute was used for θ in all column experiments. If kinetics
are first-order, a linear regression of the dC/dt vs. Clm plot results in a line whose slope is
the value of k in Equation (1).
A first-order degradation rate model assumes that the only factor affecting
contaminant degradation is the contaminant concentration itself; other factors that may
potentially limit the rate of degradation, such as the concentration of electron donor,
number of active catalyst sites, or the mass transfer rate of the contaminant to the catalyst
surface are not considered. However, researchers have found that for many reactions, as
the concentration of the contaminant increases, degradation rates become limited
(perhaps by limitations due to electron donor or availability of catalyst sites) and first-
order kinetics no longer apply. In fact, at sufficiently high contaminant concentrations, it
is often found that the rate of reaction becomes constant, so reaction kinetics may be
described as a zero-order process. This transition from first-order to zero-order Pd-

40
catalyzed degradation kinetics with increasing mononitrotoluene concentration was
described by Phillips (2003) using a Michaelis-Menten model:
)())((
2/1
max
lm
lm
CKCV
dtdC
+−= (4)
Where: dC/dt = reaction rate [ppm t-1] Vmax = maximum reaction rate [ppm t-1] K1/2 = half-velocity constant [ppm] Clm = contaminant concentration [ppm] We see from Equation (4) that for very low contaminant concentrations (Clm),
when the K1/2 value is much larger than Clm, the reaction will appear first-order with a
rate constant (k) equal to Vmax/K1/2. As the value of Clm increases, so that Clm >> K1/2, the
reaction rate becomes constant with a value equal to Vmax (Figure 3.2). Note from Figure
3.2 that K1/2, which is referred to as the half-velocity constant, represents the substrate
concentration at which the rate of substrate degradation is half of Vmax.
Figure 3.2 Typical Michaelis-Menten curve (Boggs, 2000)
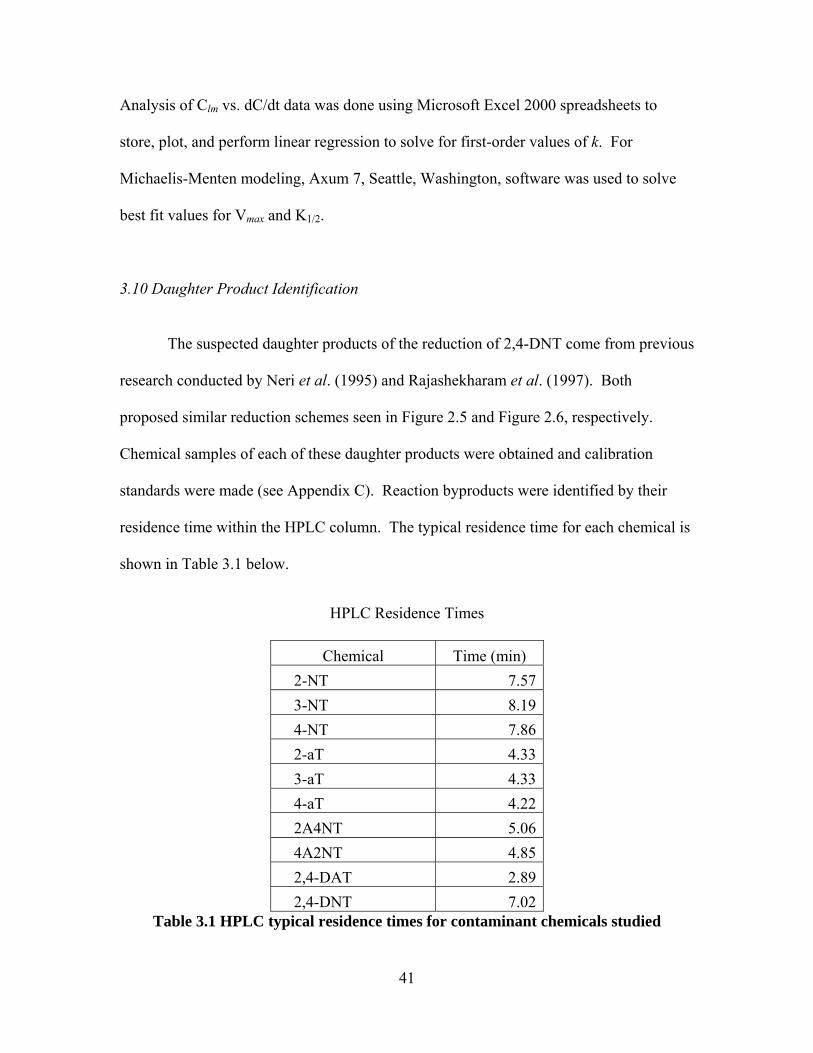
41
Analysis of Clm vs. dC/dt data was done using Microsoft Excel 2000 spreadsheets to
store, plot, and perform linear regression to solve for first-order values of k. For
Michaelis-Menten modeling, Axum 7, Seattle, Washington, software was used to solve
best fit values for Vmax and K1/2.
3.10 Daughter Product Identification
The suspected daughter products of the reduction of 2,4-DNT come from previous
research conducted by Neri et al. (1995) and Rajashekharam et al. (1997). Both
proposed similar reduction schemes seen in Figure 2.5 and Figure 2.6, respectively.
Chemical samples of each of these daughter products were obtained and calibration
standards were made (see Appendix C). Reaction byproducts were identified by their
residence time within the HPLC column. The typical residence time for each chemical is
shown in Table 3.1 below.
HPLC Residence Times
Chemical Time (min) 2-NT 7.573-NT 8.194-NT 7.862-aT 4.333-aT 4.334-aT 4.222A4NT 5.064A2NT 4.852,4-DAT 2.892,4-DNT 7.02
Table 3.1 HPLC typical residence times for contaminant chemicals studied

42
The separation for each chemical was sufficient to identify it by its residence time
with the exception of the aminotoluene isomers (2-aT, 3-aT, 4-aT). The three
aminotoluene (aT) isomers could not be separated if two or more standards were run in
the same sample. However, no researchers have reported the complete removal of the
nitrogen group using catalyst reduction so it is unlikely experiments conducted with 2,4-
DNT will produce both 2-aT and 4-aT as byproducts. Nor is there evidence in the
literature that the amino group will transfer to another carbon ie. 2-aT spontaneously
becomes 3-aT. With the expected reaction schemes seen in Figure 2.6 there is sufficient
separation to identify all expected byproducts.
Unknown byproducts can not be identified using the HPLC as the only data
generated in an HPLC run are the residence time and peak area. With no standards to
compare against, unknown byproducts can not be identified with any certainty. The use
of a mass spectrometer (MS) or a nuclear magnetic resonance (NMR) is required to
identify unknown chemicals.
43
4.0 RESULTS AND DISCUSSION
4.1 Experimental Results
Experiments using 2-NT and 2,4-DNT as model contaminants were conducted in
a laboratory column. Experiments studied the effects of three parameters: pH, formic
acid concentration, and contaminant concentration on the rate, extent, and byproducts of
2,4-DNT reduction, as well as investigating the effects of pH on 2-NT degradation rate,
extent, and byproduct formation. Experimental results for trials listed in Table 3.2 can be
found in Appendices A and B. Graphs are based on data collected after analysis of
influent and effluent samples using a High Pressure Liquid Chromatograph (HPLC), as
described in Chapter 3. The influent and effluent concentrations (Cin and Cout
respectively) were used to calculate extent and rates of degradation and the mean
contaminant concentration within the column per Section 3.9. The graphs of Degradation
Rate vs. Clm are given in both ppm and mMol for ease of comparison.
Complete mass balance calculations could not be made due to the presence of
unknown byproducts seen during HPLC analysis. The graphs identify the percent of the
total influent mass that could be accounted for in the effluent, seen in Appendix A as "%
Mass Id". This percentage was calculated using the molar sum of the known byproducts
compared to the molar amount of contaminant seen in the corresponding influent sample.
The larger the “% Mass Id” number, the greater the percentage of mass that is accounted
for. A value of 100% indicates complete mass balance for that sample. Data gathered on
unknown byproducts are shown in Appendix B. Not all experiments produced

44
unknowns--only experiments where unknowns were observed are reported in Appendix
B. As concentrations for unknowns cannot be quantified, the figures in Appendix B
show the behavior of the HPLC response areas as a function of time for the unknowns,
rather than plotting concentration versus time.
4.2 Effects of pH on the Rate, Extent, and Byproducts of Pd-catalyzed 2-NT Reduction
4.2.1 Effects of pH on Extent of 2-NT Degradation.
The first column experiments conducted were done with 2-NT in an effort to
compare results to data reported by Phillips (2003). It was hoped that degradation rate
and extent would be similar to what Phillips (2003) reported, although experimental
conditions were slightly different, in that the Pd catalyst mass in the current system was
150% more (152 gm vs. 100 gm) than in the column system used by Phillips (2003).
However, the data gathered in this set of experiments (Experiment #1 through #4) are of
questionable value as the connections from the reservoir to the mixing chamber were not
constructed properly, resulting in incomplete mixing and some short circuiting. The
connections were reconstructed for Experiment #5, but no additional 2-NT experiments
were conducted after Experiment #4. Thus, the data reported in Appendix A for the first
four experiments are suspect due to the construction of the connections. For Experiments
#2 and #3, the influent curves show relatively smooth dilution within the mixing chamber
so these data were considered adequate to compare with the previous results reported by
Phillips (2003).

45
Experimental results show that the lower values of pH result in greater removal of
2-NT, as was also seen by Phillips (2003). The removal at pH = 4.0 is only slightly
greater than the removal at pH = 5.15 (see Figure 4.1). The experiment conducted at pH
= 6.54 showed much greater variation in the influent concentrations (not shown) which
gave rise to the erratic effluent behavior. However, it is clear from the figure that at pH =
6.54 less reduction has taken place.
02468
101214161820
0 50 100 150 200 250Time (min)
Con
c (p
pm)
pH = 4.0
pH = 5.15
pH = 6.54
Figure 4.1 2-NT effluent concentration vs. time for differing values of pH, 20 ppm initial 2-NT concentration, 1 mMol formic acid 4.2.2 Effects of pH on 2-NT Degradation Rates.
Figure 4.2 shows that as pH is decreased, the rate of 2-NT degradation increases,
which agrees with the data reported by Phillips (2003) and Prüsse and Vorlop (2001).
The rate of degradation is very similar for pH = 4.0 and pH = 5.15 but there is a
significant rate reduction at a pH of 6.54. The data at pH = 4.0 show Michaelis-Menten
behavior with a Vmax = 0.0719 mMol/min and K1/2 = 0.0753 mMol. The experiment at
pH = 5.15 did not produce data that can be modeled using Michaelis-Menten kinetics, so
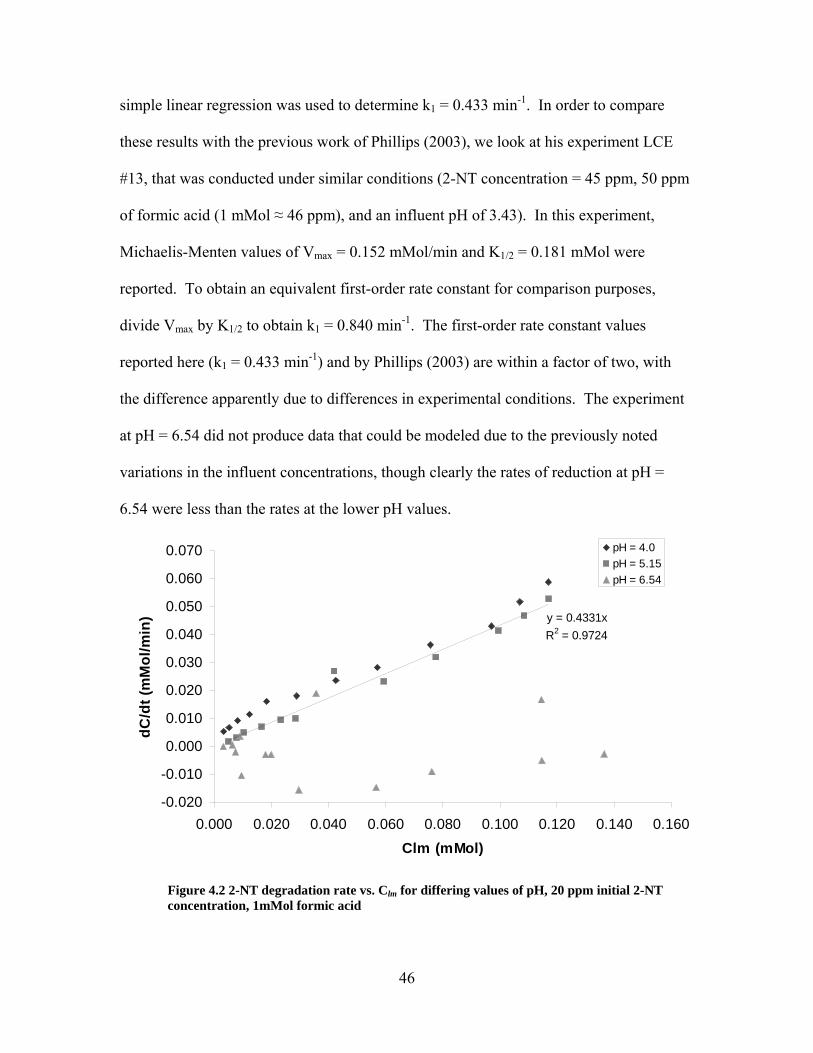
46
simple linear regression was used to determine k1 = 0.433 min-1. In order to compare
these results with the previous work of Phillips (2003), we look at his experiment LCE
#13, that was conducted under similar conditions (2-NT concentration = 45 ppm, 50 ppm
of formic acid (1 mMol ≈ 46 ppm), and an influent pH of 3.43). In this experiment,
Michaelis-Menten values of Vmax = 0.152 mMol/min and K1/2 = 0.181 mMol were
reported. To obtain an equivalent first-order rate constant for comparison purposes,
divide Vmax by K1/2 to obtain k1 = 0.840 min-1. The first-order rate constant values
reported here (k1 = 0.433 min-1) and by Phillips (2003) are within a factor of two, with
the difference apparently due to differences in experimental conditions. The experiment
at pH = 6.54 did not produce data that could be modeled due to the previously noted
variations in the influent concentrations, though clearly the rates of reduction at pH =
6.54 were less than the rates at the lower pH values.
y = 0.4331xR2 = 0.9724
-0.020
-0.010
0.000
0.010
0.020
0.030
0.040
0.050
0.060
0.070
0.000 0.020 0.040 0.060 0.080 0.100 0.120 0.140 0.160Clm (mMol)
dC/d
t (m
Mol
/min
)
pH = 4.0pH = 5.15pH = 6.54
Figure 4.2 2-NT degradation rate vs. Clm for differing values of pH, 20 ppm initial 2-NT concentration, 1mMol formic acid

47
4.2.3 Effects of pH on 2-NT Byproducts.
Reduction of 2-NT generated 2-aminotoluene (2-aT) as a byproduct for both the
pH = 4.0 and pH = 5.15 experiments. The pH = 6.54 experiment did not produce any
detectable 2-aT. This is most likely due to the very small amount of reduction that
occurred in the higher pH experiment. The molar mass balance for these experiments,
though better than for all other experiments, is not consistent and does not sufficiently
account for the disappearance of all the influent 2-NT. The mass balance, based on
influent 2-NT compared to effluent 2-NT and 2-aT, was between 70%-80% for the
experiments at pH 4 and 5.15. The remaining unidentified mass indicates that other
unidentified byproducts may result from Pd-catalyzed 2-NT reduction with formic acid as
a reductant.
The concentration of the 2-aT produced was dependent on the pH of the system.
A greater concentration of 2-aT was observed at pH = 4.0. However, this greater
concentration may be attributed to the greater extent of reduction that occurred at the
lower pH, as opposed to the reaction following an alternative pathway (which produced
more 2-aT) at the lower pH. The maximum concentration of 2-aT seen was only 0.0186
mmol/L (1.99 ppm) (Exp #2, Sample 2), which occurred with an influent 2-NT
concentration of 0.133 mmol/L. The total amount of 2-NT reduced at this point in the
dilution experiment was 0.0485 mmol/L (0.133 mmol/L – 0.0845 mmol/L). Thus, the 2-
aT accounted for approximately 38% of the 0.0485 mmol/L mass of 2-NT that was
reduced.
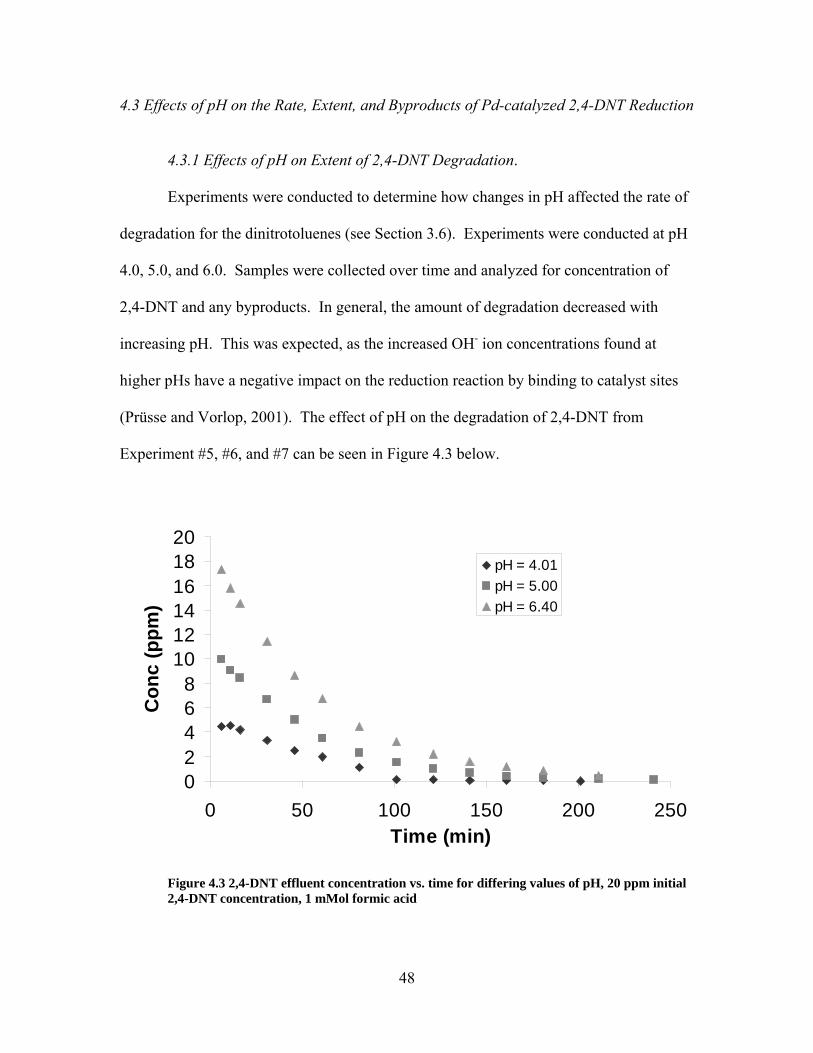
48
4.3 Effects of pH on the Rate, Extent, and Byproducts of Pd-catalyzed 2,4-DNT Reduction
4.3.1 Effects of pH on Extent of 2,4-DNT Degradation.
Experiments were conducted to determine how changes in pH affected the rate of
degradation for the dinitrotoluenes (see Section 3.6). Experiments were conducted at pH
4.0, 5.0, and 6.0. Samples were collected over time and analyzed for concentration of
2,4-DNT and any byproducts. In general, the amount of degradation decreased with
increasing pH. This was expected, as the increased OH- ion concentrations found at
higher pHs have a negative impact on the reduction reaction by binding to catalyst sites
(Prüsse and Vorlop, 2001). The effect of pH on the degradation of 2,4-DNT from
Experiment #5, #6, and #7 can be seen in Figure 4.3 below.
02468
101214161820
0 50 100 150 200 250Time (min)
Con
c (p
pm)
pH = 4.01pH = 5.00pH = 6.40
Figure 4.3 2,4-DNT effluent concentration vs. time for differing values of pH, 20 ppm initial 2,4-DNT concentration, 1 mMol formic acid

49
With the starting concentrations equal and all other experimental parameters
constant save pH, the concentration of 2,4-DNT in the effluent stream decreases with
lower pH values. This agrees with information reported by Prüsse and Vorlop (2001)
that palladium is deactivated at higher pHs. The trend was also observed in Section 4.2.1
with reduction of 2-NT and has been reported by Phillips (2003) for the
mononitrotoluenes with Pd/Al2O3 catalyst. The effect of pH on degradation is observed
even at higher concentrations of formic acid (donor) (Figures 4.4 and 4.5). Again, the
lower values of pH result in lower concentrations of 2,4-DNT leaving the column,
indicating greater amounts of reduction.
The effect of pH on degradation can be overcome with the addition of more
formic acid. The higher concentration of formic acid buffers the system and the CO2 that
is produced by the degradation of formic acid removes the OH- ions at the palladium.
Also, a higher concentration of formic acid increases the availability of the electron donor
so the amount of degradation and overall system performance increases. We see the
effect of formic acid concentration on performance by comparing the effluent
concentrations of 2,4-DNT at different pHs and formic acid concentrations. At a pH =
4.0 and 4 mMol of formic acid, initial Cout ≈ 5 ppm but at pH = 6.07 and 10 mMol of
formic acid, initial Cout ≈ 2.25 ppm (see Figures 4.4 and 4.5). The higher pH had greater
reduction due to the increased level of formic acid. Other effects of formic acid
concentration will be discussed later in Section 4.4.

50
0.0
1.0
2.0
3.0
4.0
5.0
6.0
0 50 100 150 200 250
Time (min)
Con
c (p
pm)
pH = 4.00pH = 5.05pH = 6.06
Figure 4.4 2,4-DNT effluent concentration vs. time for differing values of pH, 20 ppm initial 2,4-DNT concentration, 4 mMol formic acid
0.0
0.5
1.0
1.5
2.0
2.5
0 50 100 150 200Time (min)
Con
c (p
pm)
pH = 4.04pH = 4.97pH = 6.07
Figure 4.5 2,4-DNT effluent concentration vs. time for differing values of pH, 20 ppm initial 2,4-DNT concentration, 10 mMol formic acid

51
4.3.2 Effects of pH on 2,4-DNT Degradation Rates.
The rate of degradation is also affected by the pH. Just as the amount of
contaminant degraded increases as pH decreases, the rate of contaminant removal also
increases as pH decreases. This faster rate at lower pH can again be attributed to the
presence of less OH- ions to deactivate the Pd catalyst. Results for the Degradation Rate
versus the log mean 2,4-DNT Concentration (Clm) for Experiments #5, #6, and #7 (shown
in Figure 4.3) can be seen below in Figure 4.6.
02468
10121416
0 5 10 15 20Clm (ppm)
dC/d
t (pp
m/m
in)
pH = 4.01pH = 5.00pH = 6.40
Figure 4.6 2,4-DNT degradation rate vs. Clm for differing values of pH, 20 ppm initial 2,4-DNT concentration, 1 mMol formic acid
The above graph clearly shows that the lower values of pH result in much higher
rates of degradation. This agrees with Prüsse and Vorlop (2001) and Phillips (2003) who
reported that lower values of pH resulted in greater extents and rates of reduction. The
negative effects of higher pH can also be observed at higher concentrations of formic

52
acid. Again, even at higher formic acid concentrations, as the pH increases, the slopes of
the Degradation Rate (dC/dt) vs. Clm curves decrease indicating reduced rates of
degradation (see Figure 4.7 and 4.8). Note from comparing the two figures, however,
that as the formic acid concentration increases, the negative impact of higher pH on
performance decreases. Apparently, at high formic acid concentrations, the availability
of the donor, combined with the acid’s buffering capacity, reduces the negative effect of
the OH- ion on performance.
The graph of dC/dt vs. Clm at a pH of 4.0 (Figure 4.6) appears non-linear. The
points at very low values of Clm show a linear relationship and there then is a break in the
slope, followed by a second, more-or-less linear relation (with a less steep slope) between
dC/dt and Clm at higher values of Clm. This curve does not display Michaelis-Menten
type kinetics. This unusual behavior may be explained by conditions at the start of the
experiment. When the experiment began the column was flushed with water containing
formic acid but no contaminant. This allowed formic acid to bind to the palladium in the
column. At this point, the system is primed to reduce a great amount of contaminant. As
the high initial concentrations of contaminant moved through the column, the excess
formic acid was consumed. It was only after the consumption of the formic acid that was
initially present in the column was there confidence that effluent contaminant
concentrations reflected conditions related to the influent formic acid concentration.
Thus, it was deemed necessary to remove some of the initial data points, which, based on
the dilution experiment methodology, are the high concentration points on the curve, to
ensure that the analysis of effluent concentration data was not confounded by the formic
acid initially present in the column. Individual data points were not used for curve-fitting
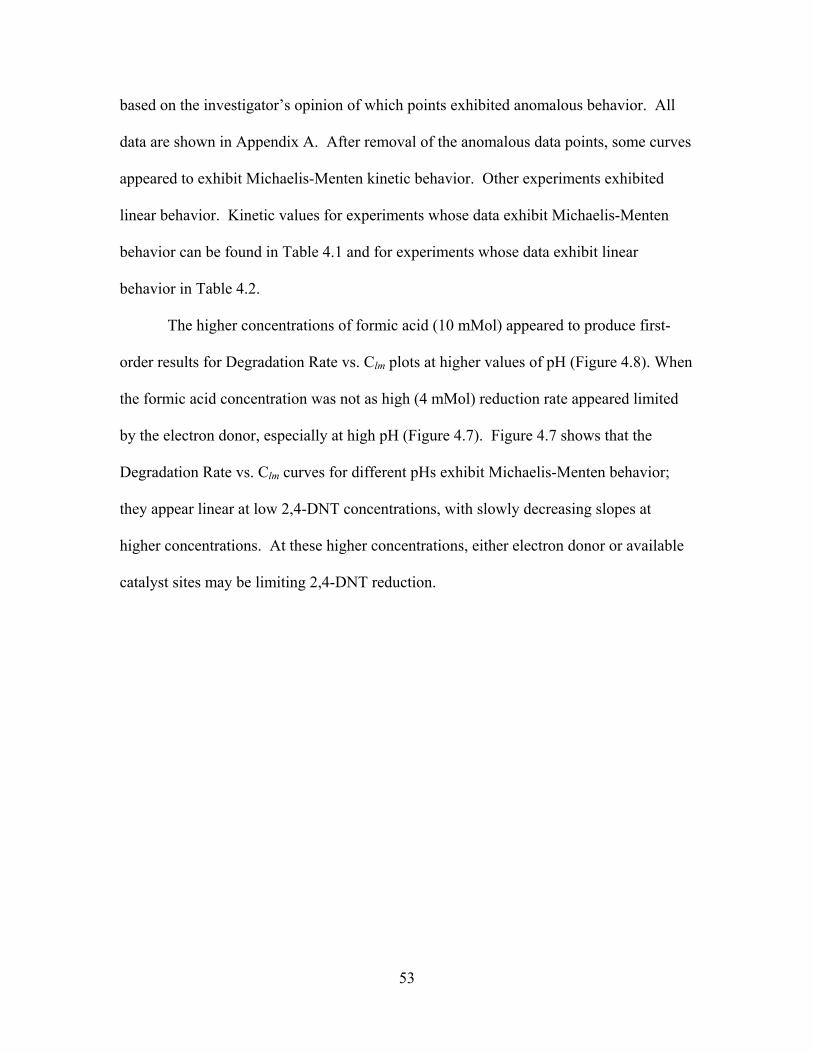
53
based on the investigator’s opinion of which points exhibited anomalous behavior. All
data are shown in Appendix A. After removal of the anomalous data points, some curves
appeared to exhibit Michaelis-Menten kinetic behavior. Other experiments exhibited
linear behavior. Kinetic values for experiments whose data exhibit Michaelis-Menten
behavior can be found in Table 4.1 and for experiments whose data exhibit linear
behavior in Table 4.2.
The higher concentrations of formic acid (10 mMol) appeared to produce first-
order results for Degradation Rate vs. Clm plots at higher values of pH (Figure 4.8). When
the formic acid concentration was not as high (4 mMol) reduction rate appeared limited
by the electron donor, especially at high pH (Figure 4.7). Figure 4.7 shows that the
Degradation Rate vs. Clm curves for different pHs exhibit Michaelis-Menten behavior;
they appear linear at low 2,4-DNT concentrations, with slowly decreasing slopes at
higher concentrations. At these higher concentrations, either electron donor or available
catalyst sites may be limiting 2,4-DNT reduction.

54
0.02.04.06.08.0
10.012.014.016.018.020.0
0.0 2.0 4.0 6.0 8.0 10.0 12.0Clm (ppm)
dC/d
t (pp
m/m
in)
pH = 4.00pH = 5.05pH = 6.06
Figure 4.7 2,4-DNT degradation rate vs. Clm for differing values of pH, 20 ppm initial 2,4-DNT concentration, 4 mMol formic acid
0.02.04.06.08.0
10.012.014.016.018.020.0
0.0 2.0 4.0 6.0 8.0 10.0Clm (ppm)
dC/d
t (pp
m/m
in)
pH = 4.04pH = 4.97pH = 6.07
Figure 4.8 2,4-DNT degradation rate vs. Clm for differing values of pH, 20 ppm initial 2,4-DNT concentration, 10 mMol formic acid

55
Experiment Number Contaminant
Initial Conc (ppm)
Formic Acid
(mMol) pH
Kinetic Parameters
Vmax = mMol/min K = mMol
2 2-NT 20 1.0 3.99 Vmax = 0.0718974 K = 0.0752570 correlation = 0.978
5 2,4-DNT 20 1.0 4.01 Vmax = 0.0638136 K = 0.0183905 correlation = 0.953
7 2,4-DNT 20 1.0 6.40 Vmax = 0.0163293 K = 0.0793023 correlation = 0.983
13 2,4-DNT 20 4.0 5.06 Vmax = 0.1684350 K = 0.0590204 correlation = 0.995
14 2,4-DNT 20 4.0 6.06 Vmax = 0.1211080 K = 0.0670712 correlation = 0.994
15 2,4-DNT 20 10.0 4.04 Vmax = 0.501960 K = 0.142396 correlation = 0.999
20 2,4-DNT 40 4.0 4.00 Vmax = 0.797930 K = 0.248874 correlation = 0.999
21 2,4-DNT 40 1.0 4.00 Vmax = 0.1263130 K = 0.0924327 correlation = 0.984
23 2,4-DNT 100 1.0 4.00 Vmax = 0.364384 K = 0.593804 correlation = 0.996
24 2,4-DNT 100 1.0 5.05 Vmax = 0.312861 K = 0.780152 correlation = 0.998
Table 4.1 Column experiments (results exhibit Michaelis-Menten kinetic behavior)

56
4.3.3 Effects of pH on 2,4-DNT Byproducts.
pH does have an effect on the formation of intermediate byproducts. When the
pH was near 4.0 there was limited formation of both 2-amino, 4-nitrotoluene (2A4NT)
and 4-amino, 2-nitrotoluene (4A2NT) compared to formation at higher values of pH (see
Figures 4.9 and 4.10). These two intermediates can be observed in the reduction
pathways proposed by both Neri et al. (1995) and Rajashekharam et al. (1997) (Figures
2.5 and 2.6).
0.000
0.050
0.100
0.150
0.200
0.250
0 50 100 150 200Time (min)
Con
c (p
pm)
pH = 4.00pH = 5.05pH = 6.06
Figure 4.9 2A4NT effluent concentration vs. time for differing values of pH, 20 ppm initial 2,4-DNT concentration, 4 mMol formic acid
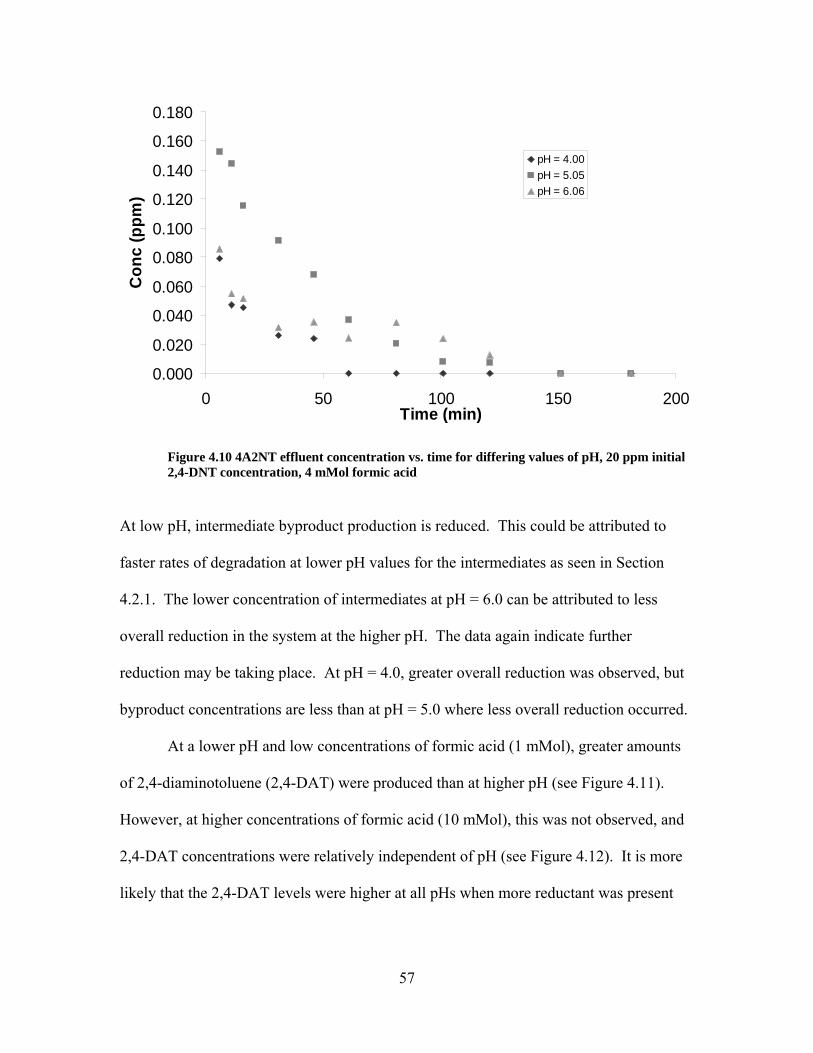
57
0.000
0.020
0.040
0.060
0.080
0.100
0.120
0.140
0.160
0.180
0 50 100 150 200Time (min)
Con
c (p
pm)
pH = 4.00pH = 5.05pH = 6.06
Figure 4.10 4A2NT effluent concentration vs. time for differing values of pH, 20 ppm initial 2,4-DNT concentration, 4 mMol formic acid
At low pH, intermediate byproduct production is reduced. This could be attributed to
faster rates of degradation at lower pH values for the intermediates as seen in Section
4.2.1. The lower concentration of intermediates at pH = 6.0 can be attributed to less
overall reduction in the system at the higher pH. The data again indicate further
reduction may be taking place. At pH = 4.0, greater overall reduction was observed, but
byproduct concentrations are less than at pH = 5.0 where less overall reduction occurred.
At a lower pH and low concentrations of formic acid (1 mMol), greater amounts
of 2,4-diaminotoluene (2,4-DAT) were produced than at higher pH (see Figure 4.11).
However, at higher concentrations of formic acid (10 mMol), this was not observed, and
2,4-DAT concentrations were relatively independent of pH (see Figure 4.12). It is more
likely that the 2,4-DAT levels were higher at all pHs when more reductant was present

58
due to the increased overall degradation, rather than a relationship between low pH and
increased 2,4-DAT formation. At higher concentrations of formic acid (10 mMol) the
extent and rate of degradation were similar (Figures 4.5 and 4.8) and pH had a limited
affect on the system. The similar extent and rate of degradation should lead to similar
concentrations of byproducts unless the different pHs cause a preference for a reduction
pathway. At a pH of 4.0 there was less intermediate observed but at a pH of 5.0 and 6.0
both 2A4NT and 4A2NT concentrations were comparable (data not shown). Figure 4.12
illustrates that the amount of 2,4-DAT produced is consistent regardless of the pH
indicating the amount of reduction, not the pH directly, affects byproduct formation.
0.0
0.5
1.0
1.5
2.0
2.5
3.0
0 50 100 150 200 250Time (min)
Con
c (p
pm)
pH = 4.01pH = 5.00pH = 6.40
Figure 4.11 2,4-DAT effluent concentration vs. time for differing values of pH, 20 ppm initial 2,4-DNT concentration, 1 mMol formic acid

59
0.00.51.01.52.02.53.03.54.04.55.0
0 50 100 150 200 250Time (min)
Con
c (p
pm)
pH = 4.04pH = 4.97pH = 6.07
Figure 4.12 2,4-DAT effluent concentration vs. time for differing values of pH, 20 ppm initial 2,4-DNT concentration, 10 mMol formic acid
4.4 Effects of Formic Acid on the Rate, Extent, and Byproducts of Pd-catalyzed 2,4-DNT
Reduction
4.4.1 Effects of Formic Acid on Extent of 2,4-DNT Degradation.
Column experiments were conducted to study the effect of formic acid
concentration on system performance (see Table 3.2). Concentrations of 1, 4, and 10
mMol of formic acid were used. For 2-NT, Phillips (2003) found that as the
concentration of formic acid increased, the degradation increased. This was due to an
increased amount of electron donor, as well as formic acid’s ability to buffer the system,
preventing a pH increase that would have a detrimental effect on performance. The
results obtained for column experiments with 2,4-DNT are in agreement with previous
results; that is, contaminant reduction increased at higher concentrations of formic acid.

60
This may be observed when effluent concentrations of 2,4-DNT are plotted versus time
(Figure 4.13a, b). The higher the formic acid concentration, the lower the effluent
contaminant concentration indicating more removal has taken place.
0.0
2.0
4.0
6.0
8.0
10.0
12.0
0 50 100 150 200 250
Time (min)
Con
c (p
pm)
1 mMol formic acid4 mMol formic acid10 mMol formic acid
Figure 4.13a 2,4-DNT effluent concentration vs. time for differing concentrations of formic acid, 20 ppm initial 2,4-DNT concentration, pH = 5.0
0.02.04.06.08.0
10.012.014.016.018.020.0
0 50 100 150 200 250
Time (min)
Con
c (p
pm)
1 mMol formic acid4 mMol formic acid10 mMol formic acid
Figure 4.13b 2,4-DNT effluent concentration vs. time for differing concentrations of formic acid, 20 ppm initial 2,4-DNT concentration, pH = 6.0 - 6.4

61
The effect of formic acid on the system can be seen at differing values of pH by
comparing Figures 4.13a with 4.13b. At a pH of 5.0 and a pH of 6.0 the trend is the
same, higher formic acid concentrations result in lower effluent concentrations of 2,4-
DNT, indicating greater reduction. However, this behavior of increasing reduction with
increasing reductant concentration is only true when reductant is limiting. In Figure 4.14,
which shows effluent concentrations for pH = 4.0 and increased initial influent 2,4-DNT
concentration, we see there is little difference in 2,4-DNT effluent concentration between
4 and 10 mMol formic acid. This indicates that at the low pH and relatively high
reductant and contaminant concentrations, reduction in the system is limited by a factor
other than reductant: perhaps available catalyst sites, diffusion limitations, or residence
time. The implication is that for some situations, increasing the amount of electron donor
may not lead to increased degradation.
0.02.04.06.08.0
10.012.014.016.0
0 50 100 150 200 250 300
Time (min)
Con
c (p
pm)
1 mMol formic acid4 mMol formic acid10 mMol formic acid
Figure 4.14 2,4-DNT effluent concentration vs. time for differing concentrations of formic acid, 40 ppm initial 2,4-DNT concentration, pH = 4.0

62
4.4.2 Effects of Formic Acid on 2,4-DNT Degradation Rates.
As the formic acid concentration increases from 1 to 4 to 10 mMol, while other
parameters are held constant, the rate of degradation increases (Figure 4.15, 4.16, and
4.17). All three figures show that at low 2,4-DNT concentrations (< 2 ppm) the
degradation rates at 4 and 10 mMol of formic acid are similar. With a pH of 4.0 and low
2,4-DNT concentrations, the degradation rates for all three formic acid concentrations are
similar (Figure 4.15) indicating that for low contaminant concentrations and low pH, the
reductant is not limiting, and that kinetics are first-order. As the 2,4-DNT concentration
increases, the degradation rates begin to diverge, indicating that formic acid begins to
limit the degradation rate. The data indicate that for systems with low levels of
contaminant (< 2 ppm), increasing the amount of formic acid (electron donor) may not
result in increased contaminant removal.
0.02.04.06.08.0
10.012.014.016.018.020.0
0.0 2.0 4.0 6.0 8.0 10.0 12.0
Clm (ppm)
dC/d
t (pp
m/m
in)
1 mMol formic acid4 mMol formic acid10 mMol formic acid
Figure 4.15 2,4-DNT degradation rate vs. Clm for differing concentrations of formic acid, 20 ppm initial 2,4-DNT concentration, pH = 4.0
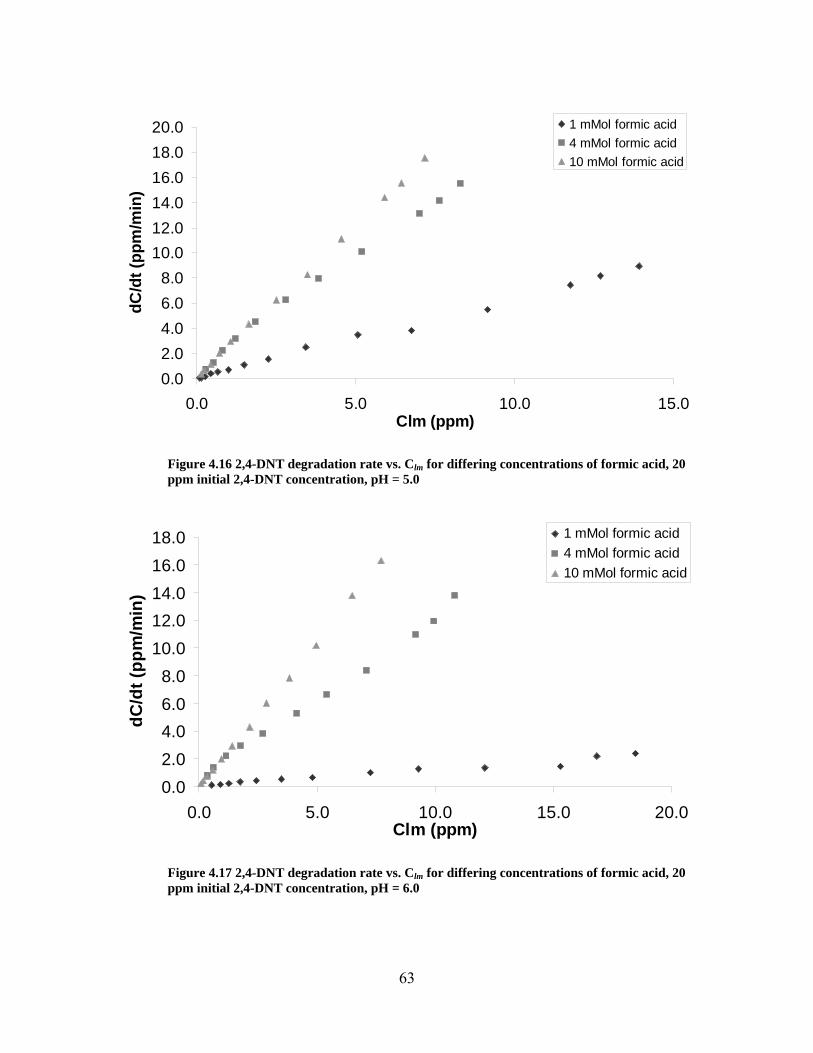
63
0.02.04.06.08.0
10.012.014.016.018.020.0
0.0 5.0 10.0 15.0Clm (ppm)
dC/d
t (pp
m/m
in)
1 mMol formic acid4 mMol formic acid10 mMol formic acid
Figure 4.16 2,4-DNT degradation rate vs. Clm for differing concentrations of formic acid, 20 ppm initial 2,4-DNT concentration, pH = 5.0
0.02.04.06.08.0
10.012.014.016.018.0
0.0 5.0 10.0 15.0 20.0Clm (ppm)
dC/d
t (pp
m/m
in)
1 mMol formic acid4 mMol formic acid10 mMol formic acid
Figure 4.17 2,4-DNT degradation rate vs. Clm for differing concentrations of formic acid, 20 ppm initial 2,4-DNT concentration, pH = 6.0

64
4.4.3 Effects of Formic Acid on 2,4-DNT Byproducts.
The concentration of formic acid had a significant impact on the formation of 2,4-
DAT as a byproduct. Though the formation of 2,4-DAT was similar for the 4 and 10
mMol experiments, experiments using only 1 mMol of formic acid produced significantly
less 2,4-DAT (Figure 4.18, 4.19, 4.20). Much of this difference can be attributed to the
lower degradation rates in the 1mMol experiments. The amount of 2,4-DAT produced
appears to be proportional to the initial concentration of 2,4-DNT.
In Figure 4.18 and Figure 4.21 the data show a relationship between the influent
2,4-DNT concentration and the concentration of 2,4-DAT that is produced as a
byproduct. This relationship indicates that a doubling of the initial 2,4-DNT
concentration led to an approximate doubling of the 2,4-DAT byproduct when all other
parameters were held constant. This could have implications for site remediation as
byproduct formation could be estimated based on the influent concentration. The
reduction pathways in Figure 2.5 show 2,4-DAT as the final product with no further
reduction expected. The amount of 2,4-DAT could be used as an indicator of system
performance. If small concentrations of byproduct are seen, it could indicate the system
is not operating properly or another limiting factor is affecting the remediation.

65
0.0
0.5
1.0
1.5
2.0
2.5
3.0
3.5
4.0
0 50 100 150 200 250 300Time (min)
Con
c (p
pm)
1 mMol formic acid
4 mMol formic acid
10 mMol formic acid
Figure 4.18 2,4-DAT effluent concentration vs. time for differing concentrations of formic acid, 20 ppm initial 2,4-DNT concentration, pH = 4.0
0.0
0.5
1.0
1.5
2.0
2.5
3.0
3.5
4.0
4.5
0 50 100 150 200Time (min)
Con
c (p
pm)
1 mMol formic acid4 mMol formic acid10 mMol formic acid
Figure 4.19 2,4-DAT effluent concentration vs. time for differing concentrations of formic acid, 20 ppm initial 2,4-DNT concentration, pH = 5.0
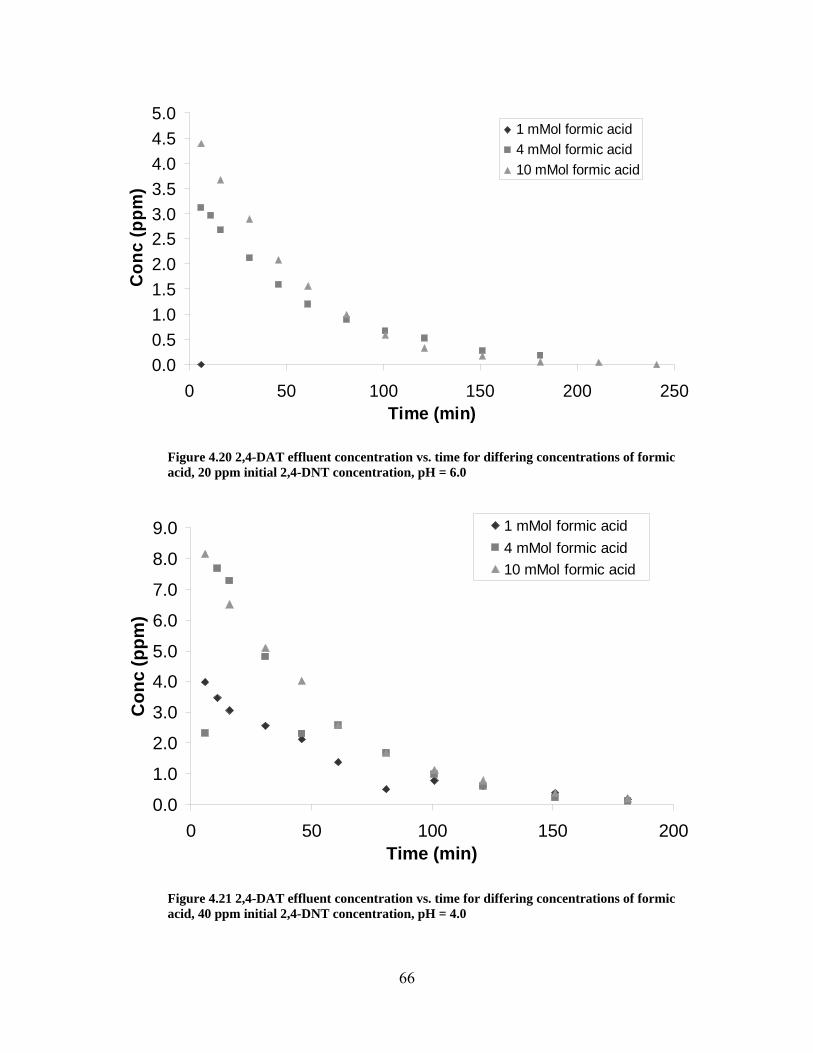
66
0.00.51.01.52.02.53.03.54.04.55.0
0 50 100 150 200 250Time (min)
Con
c (p
pm)
1 mMol formic acid4 mMol formic acid10 mMol formic acid
Figure 4.20 2,4-DAT effluent concentration vs. time for differing concentrations of formic acid, 20 ppm initial 2,4-DNT concentration, pH = 6.0
0.0
1.0
2.0
3.0
4.0
5.0
6.0
7.0
8.0
9.0
0 50 100 150 200Time (min)
Con
c (p
pm)
1 mMol formic acid4 mMol formic acid10 mMol formic acid
Figure 4.21 2,4-DAT effluent concentration vs. time for differing concentrations of formic acid, 40 ppm initial 2,4-DNT concentration, pH = 4.0

67
The relation between the production of 2A4NT and 4A2NT and formic acid
concentration is shown in Figures 4.22 and 4.23. While Figure 4.23 indicates that formic
acid concentration does not have an effect on 4A2NT production, there does appear to be
a relationship between 2A4NT production and formic acid concentration. At lower
values of pH (pH < 6.0) more 2A4NT was formed at 4 mMol of formic acid than at 10
mMol of formic acid (Figure 4.22). We saw earlier that experiments conducted at 4
mMol formic acid exhibited Michaelis-Menten behavior and speculated that formic acid
became rate limiting. The greater concentrations of 2A4NT in the 4 mMol formic acid
experiments may be due to the limited amount of formic acid in the system. At 10 mMol
the formic acid is not limiting so intermediates were able to be reduced to 2,4-DAT.
Experiments conducted with 1 mMol formic acid did not produce these intermediates in
detectable quantities when the initial concentration of 2,4-DNT was 20 ppm (Figure
4.22). At greater concentrations of 2,4-DNT, all three concentrations of formic acid
produced 2A4NT and 4A2NT. Byproduct production graphs for all experiments can be
found in Appendix A.

68
0.00
0.05
0.10
0.15
0.20
0.25
0 50 100 150 200Time (min)
Con
c (p
pm)
1 mMol formic acid4 mMol formic acid10 mMol formic acid
Figure 4.22 2A4NT effluent concentration vs. time for differing concentrations of formic acid, 20 ppm initial 2,4-DNT concentration, pH = 5.0
0
0.02
0.04
0.06
0.080.1
0.12
0.14
0.16
0.18
0 50 100 150 200Time (min)
Con
c (p
pm)
1 mMol formic acid4 mMol formic acid10 mMol formic acid
Figure 4.23 4A2NT effluent concentration vs. time for differing concentrations of formic acid, 20 ppm initial 2,4-DNT concentration, pH = 5.0
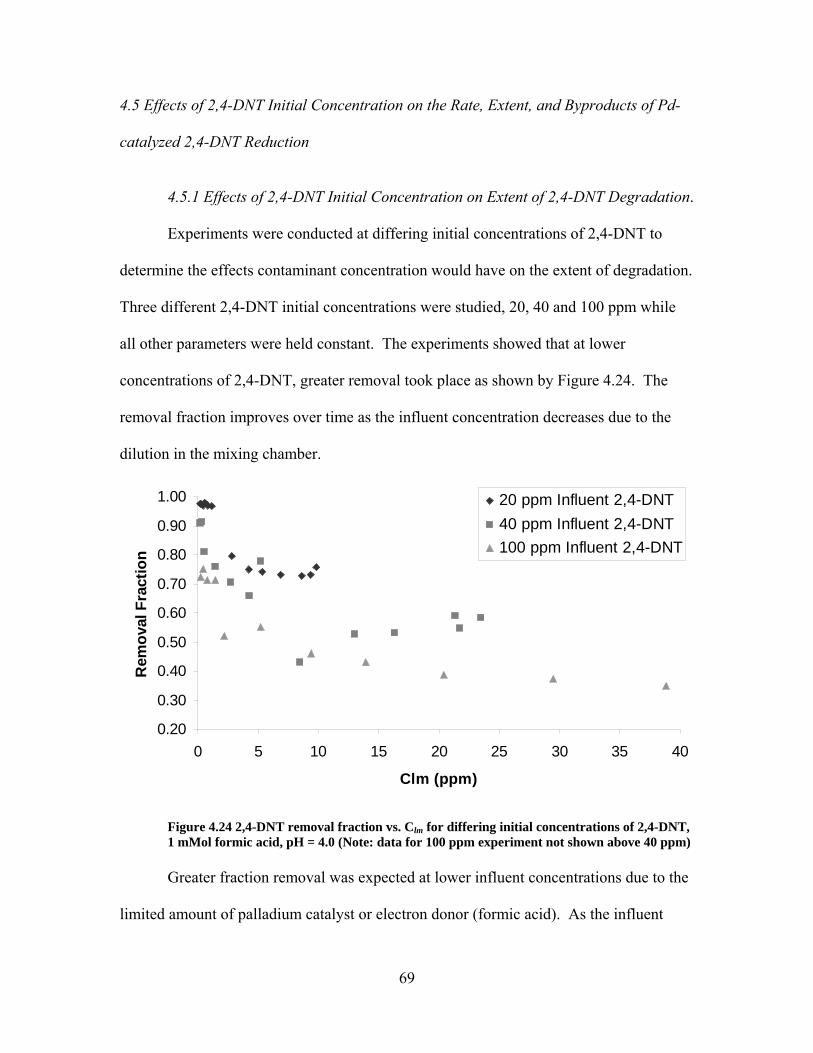
69
4.5 Effects of 2,4-DNT Initial Concentration on the Rate, Extent, and Byproducts of Pd-
catalyzed 2,4-DNT Reduction
4.5.1 Effects of 2,4-DNT Initial Concentration on Extent of 2,4-DNT Degradation.
Experiments were conducted at differing initial concentrations of 2,4-DNT to
determine the effects contaminant concentration would have on the extent of degradation.
Three different 2,4-DNT initial concentrations were studied, 20, 40 and 100 ppm while
all other parameters were held constant. The experiments showed that at lower
concentrations of 2,4-DNT, greater removal took place as shown by Figure 4.24. The
removal fraction improves over time as the influent concentration decreases due to the
dilution in the mixing chamber.
0.20
0.30
0.40
0.50
0.60
0.70
0.80
0.90
1.00
0 5 10 15 20 25 30 35 40
Clm (ppm)
Rem
oval
Fra
ctio
n
20 ppm Influent 2,4-DNT40 ppm Influent 2,4-DNT100 ppm Influent 2,4-DNT
Figure 4.24 2,4-DNT removal fraction vs. Clm for differing initial concentrations of 2,4-DNT, 1 mMol formic acid, pH = 4.0 (Note: data for 100 ppm experiment not shown above 40 ppm) Greater fraction removal was expected at lower influent concentrations due to the
limited amount of palladium catalyst or electron donor (formic acid). As the influent

70
concentration increases, the amount of catalyst or electron donor becomes limiting. The
results seen in Figure 4.24 indicate that catalyst performance is degraded by high
concentrations of contaminant. At similar values of Clm system performance is not the
same for different initial values of 2,4-DNT. The concentration of formic acid is the
same for each experiment, indicating catalyst deactivation is responsible for the smaller
reductions seen at higher initial concentrations. The number of available sites has
decreased, possibly due to OH- inhibition, reducing the efficiency of the catalyst and the
overall system. When the amount of contaminant exceeds the available number of sites it
is possible for 2,4-DNT to pass through the column and not be reduced because catalyst
sites or reductant is limiting. The results from Experiment #11 clearly indicate that 2,4-
DNT is reduced only in the presence of an electron donor. In this experiment, no formic
acid was added, and no reduction of 2,4-DNT occurred.
4.5.2 Effects of 2,4-DNT Initial Concentration on 2,4-DNT Degradation Rates.
The different initial influent concentrations also had an effect on the rate of
degradation. The rate of degradation was highest for the 20 ppm experiment at the same
values of Clm, and the 40 ppm experiment was higher than the 100 ppm experiment
(Figure 4.25). This is perhaps due to catalyst deactivation caused by the higher initial
contaminant concentration. Figure 4.26 expands the low Clm portion of Figure 4.25 and
clearly indicates the higher degradation rates observed at the lower initial 2,4-DNT
concentrations.

71
0.0
5.0
10.0
15.0
20.0
25.0
30.0
35.0
40.0
45.0
0.0 10.0 20.0 30.0 40.0 50.0 60.0 70.0 80.0
Clm (ppm)
dC/d
t (pp
m/m
in)
20 ppm Initial 2,4-DNT40 ppm Initial 2,4-DNT100 ppm Initial 2,4-DNT
Figure 4.25 2,4-DNT degradation rate vs. Clm for differing initial concentrations of 2,4-DNT, 1 mMol formic acid, pH = 4.0
0.00.51.01.52.02.53.03.54.04.55.0
0.0 1.0 2.0 3.0 4.0 5.0 6.0 7.0Clm (ppm)
dC/d
t (pp
m/m
in)
20 ppm Initial 2,4-DNT40 ppm Initial 2,4-DNT100 ppm Initial 2,4-DNT
Figure 4.26 2,4-DNT degradation rate vs. Clm for differing initial concentrations of 2,4-DNT, 1 mMol formic acid, pH = 4.0 (zoom)
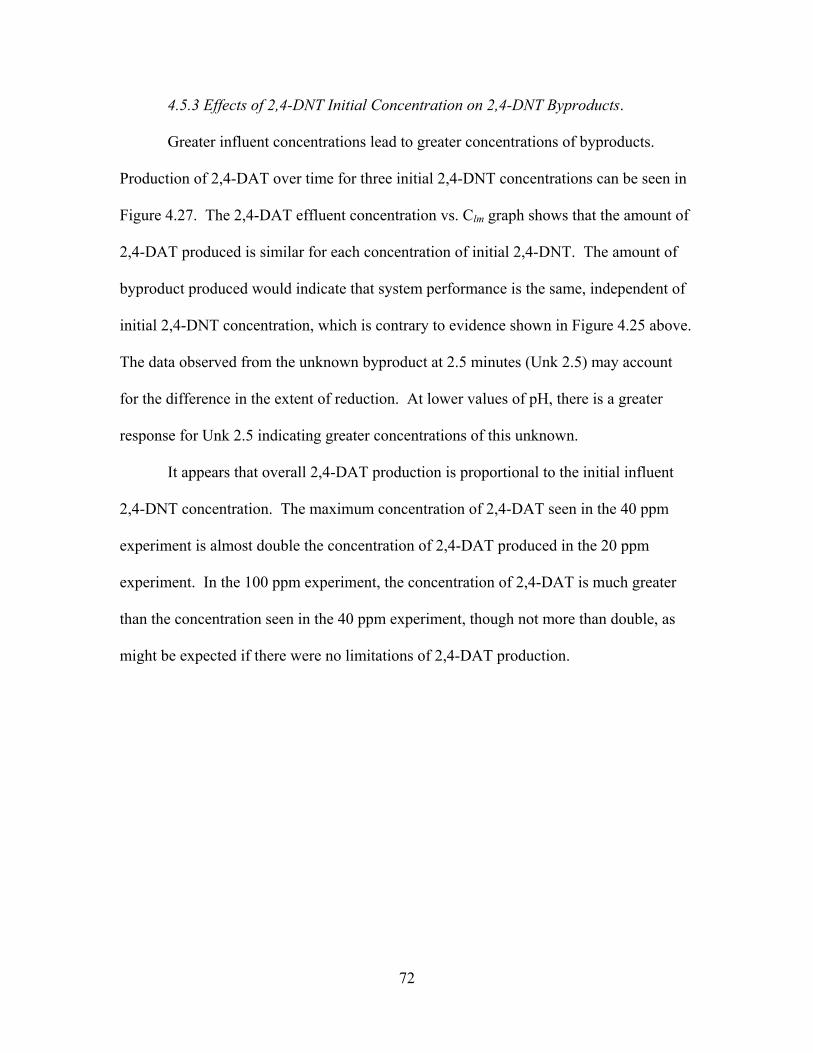
72
4.5.3 Effects of 2,4-DNT Initial Concentration on 2,4-DNT Byproducts.
Greater influent concentrations lead to greater concentrations of byproducts.
Production of 2,4-DAT over time for three initial 2,4-DNT concentrations can be seen in
Figure 4.27. The 2,4-DAT effluent concentration vs. Clm graph shows that the amount of
2,4-DAT produced is similar for each concentration of initial 2,4-DNT. The amount of
byproduct produced would indicate that system performance is the same, independent of
initial 2,4-DNT concentration, which is contrary to evidence shown in Figure 4.25 above.
The data observed from the unknown byproduct at 2.5 minutes (Unk 2.5) may account
for the difference in the extent of reduction. At lower values of pH, there is a greater
response for Unk 2.5 indicating greater concentrations of this unknown.
It appears that overall 2,4-DAT production is proportional to the initial influent
2,4-DNT concentration. The maximum concentration of 2,4-DAT seen in the 40 ppm
experiment is almost double the concentration of 2,4-DAT produced in the 20 ppm
experiment. In the 100 ppm experiment, the concentration of 2,4-DAT is much greater
than the concentration seen in the 40 ppm experiment, though not more than double, as
might be expected if there were no limitations of 2,4-DAT production.

73
0.0
1.0
2.0
3.0
4.0
5.0
6.0
7.0
8.0
0.0 10.0 20.0 30.0 40.0 50.0 60.0 70.0 80.0Clm (ppm)
Con
c (p
pm)
20 ppm Initial 2,4-DNT40 ppm Initial 2,4-DNT100 ppm Initial 2,4-DNT
Figure 4.27 2,4-DAT effluent concentration vs. Clm for differing initial concentrations of 2,4-DNT, 1 mMol formic acid, pH = 4.0
The differences observed when comparing the intermediate 2A4NT and 4A2NT
concentrations as a function of initial influent 2,4-DNT concentration are much more
pronounced than what was observed for 2,4-DAT in Figure 4.27. At high initial influent
2,4-DNT concentrations, much higher concentrations of intermediates were observed
(Figure 4.28 and 4.29). The concentration of 4A2NT produced was double the
concentration of 2A4NT produced for each experiment. This may indicate that removal
of the nitro group at the 4th carbon is the preferred reaction (producing 4A2NT). It is also
possible the second reduction step to remove the nitro group at the 4th carbon (in 2A4NT)
is faster than the removal of the nitro group at the 2nd carbon (in 4A2NT). This would
mean the 2A4NT has a shorter half-life within the column. The greater amount of
4A2NT may also be caused by the extra step in reduction of 2,4-DNT described by
Rajashekharam et al. (1997) (see Figure 2.6, Pathway 1). To produce 4A2NT the

74
reduction first goes through 4HA2NT. This causes the production of 4A2NT to occur
later in the column and the 4A2NT may not have sufficient time remaining within the
column to be reduced to 2,4-DAT.
Figure 4.28 2A4NT effluent concentration vs. Clm for differing initial concentrations of 2,4-DNT, 1 mMol formic acid, pH = 4.0
Figure 4.29 4A2NT effluent concentration vs. Clm for differing initial concentrations of 2,4-DNT, 1 mMol formic acid, pH = 4.0
0.00
0.10
0.20
0.30
0.40
0.50
0.60
0.70
0.0 10.0 20.0 30.0 40.0 50.0 60.0 70.0 80.0
Clm (ppm)
Con
c (p
pm)
20 ppm Initial 2,4-DNT40 ppm Initial 2,4-DNT100 ppm Initial 2,4-DNT
0.00
0.01
0.02
0.03
0.04
0.05
0.06
0.07
0.0 5.0 10.0 15.0 20.0 25.0Clm (ppm)
0.00
0.20
0.40
0.60
0.80
1.00
1.20
1.40
1.60
0 10 20 30 40 50 60 70 80Clm (ppm)
Con
c (p
pm)
20 ppm Initial 2,4-DNT40 ppm Initial 2,4-DNT100 ppm Initial 2,4-DNT
0.00
0.01
0.02
0.03
0.04
0.05
0.06
0.07
0.08
0.09
0.10
0 5 10 15 20 25
C lm (ppm)
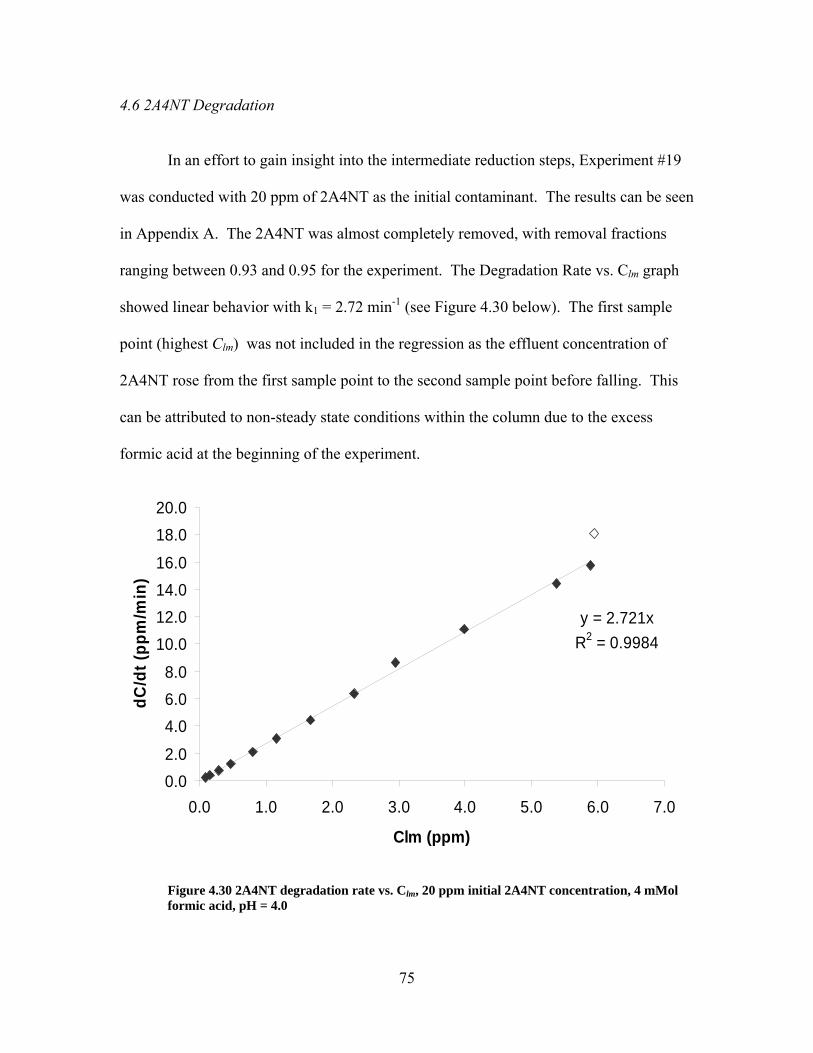
75
4.6 2A4NT Degradation
In an effort to gain insight into the intermediate reduction steps, Experiment #19
was conducted with 20 ppm of 2A4NT as the initial contaminant. The results can be seen
in Appendix A. The 2A4NT was almost completely removed, with removal fractions
ranging between 0.93 and 0.95 for the experiment. The Degradation Rate vs. Clm graph
showed linear behavior with k1 = 2.72 min-1 (see Figure 4.30 below). The first sample
point (highest Clm) was not included in the regression as the effluent concentration of
2A4NT rose from the first sample point to the second sample point before falling. This
can be attributed to non-steady state conditions within the column due to the excess
formic acid at the beginning of the experiment.
y = 2.721xR2 = 0.9984
0.02.0
4.06.08.0
10.012.014.016.0
18.020.0
0.0 1.0 2.0 3.0 4.0 5.0 6.0 7.0
Clm (ppm)
dC/d
t (pp
m/m
in)
Figure 4.30 2A4NT degradation rate vs. Clm, 20 ppm initial 2A4NT concentration, 4 mMol formic acid, pH = 4.0

76
The experiment produced a slightly greater amount of 2,4-DAT compared to
Experiment #22 that had 20 ppm of 2,4-DNT as the initial contaminant. Experiment #19
produced 0.188 mMol of 2,4-DAT (31% of the influent) while Experiment #22 produced
0.128 mMol (25% of the influent). The high removal rates of 2A4NT support the
observations from the 2,4-DNT experiments, where the concentrations of the
intermediate 2A4NT were very low compared with the influent concentrations and the
amount of 2,4-DAT produced. This indicates that the removal of the second nitro group
is a fast reaction for 2A4NT, so it is a seen at only low concentrations in the effluent.
Results from Experiment #23, where the initial concentration of 2,4-DNT was 100 ppm,
show only 1.5 ppm of 4A2NT and 0.6 ppm of 2A4NT in the effluent, while 50 ppm of
2,4-DNT was removed. However, with almost complete removal of 2A4NT in
Experiment #19, mass balance could account for only 45% of the mass. A majority of
the mass could not be accounted for, indicating a number of unknown pathways that
produce byproducts that are not visible at 254 nm with HPLC. One unidentified
byproduct was visible on the HPLC and appeared with a residence time of 2.5 minutes,
Unk 2.5. Unknown byproducts will be discussed in greater detail in Section 4.8.
4.7 Effects of Formic Acid on the Rate, Extent, and Byproducts of Pd-catalyzed 2,4-DAT
Reduction
4.7.1 Effects of Formic Acid on Extent of 2,4-DAT Degradation.
A series of experiments (Experiment #8, #9,and #10) was conducted to examine
the effect of formic acid on the reduction of 2,4-DAT and to determine if 2,4-DAT was

77
the final reduction product of 2,4-DNT or if it could be further transformed within the
column. The possibility that 2,4-DAT was transformed to an unknown daughter product
that cannot be detected with the current analytical method may explain the poor mass
balance seen in all experiments. Experiments were conducted using 1, 4, and 0 mMol of
formic acid. The experiment with no formic acid had a pH of 7.8 while the other two
experiments were buffered to a pH of 4.0. Surprisingly, 2,4-DAT was removed even
when no formic acid was present. The greater concentrations of formic acid led to
greater removals (Figure 4.31), a trend seen before with the DNTs and seen by Phillips
(2003) for the NTs. It is not clear what reduction reactions, if any, are taking place when
no formic acid was present, or if the 2,4-DAT is being oxidized by residual oxygen in the
water.
-0.40
-0.20
0.00
0.20
0.40
0.60
0.80
1.00
0.0 5.0 10.0 15.0 20.0Clm (ppm)
Rem
oval
Fra
ctio
n
0 mMol formic acid1 mMol formic acid4 mMol formic acid
Figure 4.31 2,4-DAT removal fraction vs. Clm for differing concentrations of formic acid, 20 ppm initial 2,4-DAT concentration, pH = 4.0

78
4.7.2 Effects of Formic Acid on 2,4-DAT Degradation Rates.
The effect of formic acid concentration on the degradation rates of 2,4-DAT was
similar to the effects seen for 2,4-DNT, that is, higher concentrations of formic acid
resulted in higher degradation rates (Figure 4.32). The data, as seen in Figure 4.32, are
fairly erratic, either due to poor sampling and analytical procedures, poor mixing,
inconsistent flow through the column, or some other unknown condition. Experiments
conducted both before and after this series of experiments show smooth dilutions of the
influent and effluent concentrations, but the data for this series of experiments
(Experiments #8 - #10) are more variable, for an unknown reason. The influent curves
for this series of experiments (Appendix A) also show erratic behavior, which may have
been caused by poor mixing, sampling error, poor analysis, or another unknown factor.
-1.0
1.0
3.0
5.0
7.0
9.0
11.0
13.0
0.0 5.0 10.0 15.0 20.0Clm (ppm)
dC/d
t (pp
m/m
in)
0 mMol formic acid1 mMol formic acid4 mMol formic acid
Figure 4.32 2,4-DAT degradation rate vs. Clm for differing concentrations of formic acid, 20 ppm initial 2,4-DAT concentration, pH = 4.0

79
4.7.3 Effects of Formic Acid on 2,4-DAT Byproducts.
The reduction of 2,4-DAT did not produce any known byproducts. However, one
unknown byproduct was seen during HPLC analysis with a residence time of 2.5
minutes. This byproduct was seen in both experiments with formic acid (see Appendix
A). No byproducts were observed in the experiment with 0 mMol of formic acid, an
indication that transformation was taking place without formic acid present, producing
byproducts that could not be seen by the HPLC method used. When no formic acid was
present, no byproducts were observed, although the removal fraction was consistently
between 0.2 and 0.4 with only one outlier (see Appendix A). This is an indication that
other transformation products not visible at 254 nm are being produced by some other
mechanism. It is important to note that Experiment #11 was conducted to determine if
2,4-DNT behaved in a similar manner when no formic acid was present. It did not and
no reduction of 2,4-DNT was seen, with only slight variations in influent and effluent
concentrations that can be attributed to experimental variation. This is further evidence
that the aminotoluenes are less persistent than the nitrotoluenes. A small number of
samples from Experiment #13 were run through the HPLC and analyzed at 210 nm to
determine if any cyclohexane was being produced; 210 nm being the maximum
absorbance of cyclohexane. No cyclohexane was seen, and no other additional
transformation products were observed at this wavelength.
The degradation of 2,4-DAT in the column does have implications regarding the
overall mass balance for the 2,4-DNT experiments. Experiments #8 and #9 for 2,4-DAT
had the same experimental conditions as Experiment #5 and #22 for 2,4-DNT. When the

80
degradation of the 2,4-DAT is considered when analyzing the 2,4-DNT reduction results,
the mass balance improves. For example the average removal fraction of 2,4-DAT is
0.662 for Experiment #9. If the effluent concentrations of 2,4-DAT in Experiment #22
are all increased by CDAT/(1-.662) the overall % Mass Identified improves as seen in
Figure 4.33 below.
0102030405060708090
100
0 50 100 150 200 250 300Time (min)
% M
ass
Iden
tifie
d
Actual dataConverted data
Figure 4.33 % mass identified vs. time for Experiment #22 with actual and converted 2,4-DAT mass data
4.8 Unknown Byproducts
Though the catalytic reduction produced the expected byproducts of 2A4NT,
4A2NT and 2,4-DAT (Rajashekharam et al., 1997; Neri et al., 1995) a number of other
byproducts were seen during HPLC analysis. These other byproducts appeared to
comprise a significant portion of the total amount of byproducts produced. With no
81
standards to compare to, it is not possible to determine the concentration of these
unknown byproducts. The three unknown byproducts will each be discussed in detail
below. Results from each experiment that produced these unknown byproducts can be
seen in Appendix B. The unknown byproducts are labeled based on their residence time
for the method of analysis as described in Section 3.4. The time reported is the elapsed
time in minutes before the chemical created a measurable response in the detector.
Figure 4.34 shows an HPLC response curve from Experiment #18 containing all of the
known and unknown byproducts.
Figure 4.34 HPLC response curve from Experiment #18 showing all known and unknown byproducts
4.8.1 Unknown Byproduct at 2.5 Minutes HPLC Residence Time.
The first unknown byproduct appeared at 2.5 minutes (see Figure 4.34), labeled as
Unk 2.5 in Appendix B. This was the first chemical to appear (2,4-DAT residence time

82
was 2.8 minutes) that was not attributed to minor responses that were also seen in the
blank DI runs. Since the HPLC C18 column is a reversed-phased column, the stationary
bed inside the column is nonpolar (hydrophobic), while the mobile phase is a polar
(hydrophilic) liquid composed of a mixture of water and acetonitrile. This indicates that
a polar compound will remain in the mobile phase and have a short retention time. The
nonpolar material will sorb to the stationary phase and have longer retention times. The
byproduct Unk 2.5 appears quickly, indicating it has a higher polarity compared to the
other byproducts.
Unk 2.5 appears to be a byproduct of a reaction of 2,4-DAT inside the catalytic
column. Experiments #8, #9, and #10 were conducted to examine the behavior of 2,4-
DAT in the system (see Section 4.7). In Experiments #8 and #9, Unk 2.5 was visible and
its response in the HPLC composed about 8% of the area of the entire HPLC response
curve. Unk 2.5 appears in a significant number of other experiments, but its appearance
in Experiments #8 and #9 indicate it is a product of 2,4-DAT transformation.
When the formic acid concentration is only 1 mMol and the influent concentration
of 2,4-DNT is only 20 ppm, Unk 2.5 does not appear in the effluent. For experiments
conducted with 4 and 10 mMol formic acid, Unk 2.5 does appear. At lower values of pH
the HPLC response for Unk 2.5 is greater (see Figure 4.35). Also, higher concentrations
of formic acid lead to greater HPLC response for this byproduct as seen in Appendix B.
Though the actual concentration may not be determined, we may speculate that this
byproduct does not have a significant effect on the total mass balance. The known
contaminant concentrations are found by running standards and plotting the HPLC
response area versus the known standard concentration (see Appendix C for standards).

83
The slope of the line gives the conversion value to change a known HPLC response into a
concentration. The known contaminant standards all have slope values within one order
of magnitude. All are 10-5 for the conversion of HPLC response to concentration (ppm).
Using a value of 1x10⁻⁴, which would greatly overestimate the concentration of the
known NACs, for conversion and the maximum HPLC response for Unk 2.5 from all
experiments (HPLC Response = 19,518 from Exp #20) the maximum concentration
would be 1.952 ppm. Though this would be a significant fraction of the byproducts
produced, it would have only a minor effect on the total mass balance. When the influent
2,4-DNT concentration was 100 ppm, a smaller response at 2.5 minutes occurred for pH
= 4.0 and no response was seen when pH = 5.05. The data suggest that with only 1
mMol of formic acid, the pH must be near 4.0 to produce this byproduct. At a pH of 5,
even starting with a 2,4-DNT concentration of 100 ppm, Unk 2.5 was not observed.
0
2,000
4,000
6,000
8,000
10,000
12,000
0 50 100 150 200Time (min)
HPL
C R
espo
nse
pH = 4.04pH = 4.97pH = 6.07
Figure 4.35 Unk 2.5 HPLC response vs. time for differing values of pH, 20 ppm initial 2,4-DNT concentration, 10 mMol formic acid

84
4.8.2 Unknown Byproduct at 3.4 Minutes HPLC Residence Time.
The second unknown byproduct, Unk 3.4, appeared just after the 2,4-DAT (see
Figure 4.34) indicating a slightly less polar compound when compared to 2,4-DAT. This
byproduct also was not in evidence in experiments with 1 mMol formic acid and starting
concentrations of 20 ppm 2,4-DNT. The appearance of Unk 3.4 was not consistent and
its response in the HPLC was generally less than that for Unk 2.5. For a number of
experiments, the response associated with Unk 3.4 was greater at increased values of pH,
a trend not seen for other byproducts, though for other experiments lower values of pH
produced more response. The response for Unk 3.4 was greater at higher concentrations
of formic acid.
The response of Unk 3.4 appears to have greater dependence on the initial influent
2,4-DNT concentration than on other parameters. The maximum responses at initial
influent concentrations of 20 ppm were around 4,000 while at 40 ppm responses were as
high as 14,400. The greatest HPLC response was seen for the two experiments with 100
ppm initial influent concentrations; a maximum response of 77,884 for pH = 4.0 and
50,049 for pH = 5.05. Using the same approach as was used in Section 4.8.1 for Unk 2.5,
it can be estimated that the maximum concentration of Unk 3.4 would be about 8 ppm
(observed in Experiment #23). This would be a significant fraction of the byproducts
generated (the corresponding concentration of 2,4-DAT in Experiment #23 was 3.78
ppm). It would also have a significant, though presently unquantifiable, effect on the
overall mass balance.

85
4.8.3 Unknown Byproduct at 4.0 Minutes HPLC Residence Time.
The last unknown byproduct, Unk 4.0, appears between 2,4-DAT and the two
amino-nitro intermediates, 2A4NT and 4A2NT. This byproduct also was not observed
for experiments with 1 mMol formic acid and initial concentrations of 20 ppm 2,4-DNT.
At 4 mMol formic acid, the pH had an effect with the most Unk 4.0 appearing at pH =
5.05, then 6.0, and the least at pH = 4.0. When the formic acid concentration was raised
to 10 mMol the pH did not greatly affect the Unk 4.0 that was observed and HPLC
responses were similar with slightly more appearing at pH = 4.97 (Figure 4.36).
0
2,000
4,000
6,000
8,000
10,000
12,000
14,000
16,000
0 50 100 150 200Time (min)
HPL
C R
espo
nse
pH = 4.04pH = 4.97pH = 6.07
Figure 4.36 Unk 4.0 HPLC response vs. time for differing values of pH, 20 ppm initial 2,4-DNT concentration, 10 mMol formic acid
For almost all 2,4-DNT experiments, the higher concentrations of formic acid
produced greater amounts of Unk 4.0. The formation of Unk 4.0 appears to be influenced
more by the concentration of formic acid than the pH. For pH values of 4.04, 4.97, and
6.07 at 10 mMol formic acid, the Unk 4.0 maximum response was 12,779; 14,846; and

86
10,574 respectively. With the influent 2,4-DNT concentration at 100 ppm, only the first
two samples showed Unk 4.0 for pH = 4.0 and no samples showed Unk 4.0 when pH =
5.0. Since both experiments were conducted with 1 mMol formic acid, this agrees with
data gathered from the earlier series of experiments conducted at 1 mMol formic acid.
Studies conducted by Rajashekharam et al. (1997) and Neri et al. (1995) support
the possibility that Unk 4.0 is actually 4-hydroxylamine, 2-nitrotoluene (4HA2NT). Both
researchers show 4HA2NT as a possible intermediate in the 2,4-DNT reduction pathway.
Neri et al. (1995) presented an HPLC output, Figure 4.37, which shows 4HA2NT appears
almost exactly between 2,4-DAT and 2A4NT, the same location Unk 4.0 appears. The
4HA2NT is an unstable transient byproduct that spontaneously degrades in a matter of
hours, with almost complete disappearance after one day (Neri et al., 1995). Sampling
for the 2,4-DNT experiments was done within 4 hours so it is highly probable that
4HA2NT would still be present in the samples if it was initially formed during the
reduction process.
Figure 4.37 HPLC Analysis of 2,4-DNT reduction (Neri et al., 1995)

87
4.9 Potential for In Situ Remediation
As will be discussed below, based on the kinetic parameters, palladium catalyzed
degradation of 2,4-DNT would be possible in an in situ recirculation well application.
The known byproducts have some health effects (see Section 2.4) but are less toxic and
less persistent than the parent NAC contaminant. Further research must be conducted to
determine the identification of the unknown byproducts before overall health risks can be
assessed.
Assuming upgradient 2,4-DNT concentrations of 20 ppm, 4 mMol formic acid
could be added, which would result in a first-order reaction rate constant (based on
Experiment #9) of k1 = 1.0 min-1. Based on calculations with this rate constant, an in-
well reactor would require a residence time of approximately 4.56 minutes for 99% 2,4-
DNT destruction. By increasing the formic acid concentration to 10 mMol and using a
first-order rate constant based on Experiment #15 of 3.19 min-1 the residence time would
drop to 1.45 minutes; a time very close to the residence time reported by Phillips (2003)
for a hypothetical in-well system.

88
Experiment Number Contaminant pH
Formic Acid (mMol)
Initial Conc (ppm)
Kinetic Parameters (min-1)
3 2-NT 5.15 1 20 k1 = 0.4103 R2 = .99416 2,4-DNT 5.00 1 20 k1 = 0.6354 R2 = .9959 2,4-DAT 3.96 4 20 k1 = 1.0098 R2 = .9743
12 2,4-DNT 4.00 4 15 k1 = 3.4513 R2 = .9857
15 2,4-DNT 4.04 10 20 k1 = 3.1867 R2 = .9959
16 2,4-DNT 4.97 10 20 k1 = 2.4426 R2 = .9989
17 2,4-DNT 6.06 10 20 k1 = 2.0985 R2 = .9994
18 2,4-DNT 3.97 10 40 k1 = 2.8208 R2 = .9989
19 2A4NT 4.00 4 20 k1 = 2.7205 R2 = .9984
22 2,4-DNT 4.00 4 20 k1 = 2.4831 R2 = .9979
Table 4.2 Column experiments (results exhibit first-order kinetic behavior)

89
5.0 CONCLUSIONS
5.1 Summary
In this thesis the use of a palladium catalyst with formic acid as an electron donor
to remediate a nitroaromatic contaminant was investigated. A flow through column
experiment was designed to study reaction rate, extent, and byproduct formation, by the
reduction of 2,4-dinitrotoluene (2,4-DNT). Reduction of the intermediate byproduct
2A4NT and final product 2,4-DAT was also examined to gain a further understanding of
the system. The effect of three different parameters on system performance was
evaluated in the course of experimentation for 2,4-DNT: initial pH, formic acid
concentration, and contaminant concentration. Results were modeled using first-order
and Michaelis-Menten kinetics.
The complete pathway for reduction was not determined due to the presence of
unknown byproducts observed during 2,4-DNT reduction. It is not known if these
byproducts indicate additional reduction pathways or are transformations due to direct
reactions with formic acid or the palladium catalyst. These additional byproducts were
not reported in earlier work with palladium while hydrogen gas was the electron donor.
Should similar unknown byproducts appear with TNT reduction, it may indicate new
pathways exist that do not lead to TAT as a final reduction product.

90
5.2 Conclusions
Nitrotoluenes are reduced to their corresponding aminotoluenes.
Experimental results show that the mononitrotoluene 2-NT is reduced by a Pd-catalyzed
system to 2-aminotoluene when formic acid is used as an electron donor. This was the
only byproduct observed in the column effluent. However, lack of mass balance
indicates that other undetected byproducts or transformation products may also be present
in the effluent.
Extent and rate of 2,4-DNT degradation is dependent on the influent pH. At
lower values of pH, greater degradation was seen. Lower values of pH produce more
favorable reducing conditions due to the greater presence of free hydrogen. The lower
pH also reduced the concentration of hydroxide ions that bind to palladium sites and
deactivate the catalyst. Though the pH is of great importance in the system, limitations
due to a higher pH can be overcome by higher concentrations of formic acid.
Extent and rate of 2,4-DNT degradation is highly dependent on the
concentration of formic acid. The formic acid is used as an electron donor to drive the
reaction. Without an electron donor the reduction reaction does not occur in the
palladium system, regardless of the pH. Experimental results show that with no formic
acid, there is no degradation of 2,4-DNT. The greater concentrations of formic acid led
to increased amounts of degradation in the column experiments. However, at low values
of pH less formic acid is necessary to obtain similar reaction rates. The lower amount of
hydroxide ion at low pH compensates for a lower concentration of formic acid.

91
Extent and rate of 2,4-DNT degradation is dependent on the initial
concentration of the contaminant. The higher initial concentrations of contaminant led
to lower degradation rates at similar values of Clm. However, the system still performed
even at initial concentrations as high as 100 ppm, with approximately 40% removal,
increasing to 75% as the 2,4-DNT concentrations dropped below 20 ppm. This is
significantly lower than removals observed when initial concentrations were only 20 ppm
(75%, increasing to 97%). The ability for the palladium system to degrade high
concentrations of 2,4-DNT, even at a reduced extent, shows it is a viable option for areas
of high contaminant concentrations where other methods may not be applicable.
Intermediate reduction steps are not rate limiting. The intermediate reduction
products do not limit the overall reduction reaction of 2,4-DNT. Experiments show that
concentrations of these intermediates are quite low compared to influent concentrations
and reduction end products. Experiment #19 which used 20 ppm of 2A4NT as the initial
contaminant showed that greater than 92% of 2A4NT was removed throughout the entire
experiment. The high removal rate and low concentration of these intermediates suggest
they are quickly reduced within the system.
2,4-DNT degradation produces expected and unexpected byproducts. The
expected intermediates of 2A4NT, 4A2NT, and 2,4-DAT were observed as byproducts of
the reduction reaction. However, three other byproducts were observed that were not
identified. One is believed to be 4HA2NT as seen in previous research. Another appears
to be a result of 2,4-DAT reduction or is a hydrogenated form of 2,4-DAT. The other is
unknown, and no speculation may be made at this time.

92
More complex NACs such as TNT, HMX, and RDX may be reduced by Pd-
catalysis. The research conducted by Phillips (2003) and results obtained from this effort
show a distinct possibility for Pd-catalyzed reduction of more complex nitroaromatics.
Research has shown that TNT can be reduced to triaminotoluene (TAT) (Hwang et al.,
1998). Based on the current study of NT and DNT reduction, which resulted in the
production of the corresponding aminotoluenes, it is hypothesized that reduction of TNT
to TAT will probably occur with a Pd-catalyzed system using formic acid as the electron
donor. As the reduction occurs at the nitro functional group, other complex NACs such
as HMX and RDX may also be reduced with this system.
5.3 Future Work
Study behavior of intermediates. The reduction and byproducts of the
aminonitrotoluenes should be examined to gain an understanding of the fate of these
chemicals. This research can then be applied to reduction of 2,4-DNT in an effort to
better quantify and identify byproducts and reaction schemes.
Extend Studies to other NACs. This thesis examined the reduction of 2,4-DNT, one of
the simplest nitroaromatic compounds. Future work should examine the susceptibility of
the isomers of DNT and other compounds such as TNT, RDX, and HMX to Pd-catalyzed
reduction.
Characterize unknown byproducts. The reduction of 2,4-DNT using a palladium
catalyst and formic acid as an electron donor resulted in a number of unidentified
byproducts. The HPLC employed was not able to identify these unknown byproducts.

93
Use of a GCMS may lead to positive identification and a greater understanding of the
reduction reactions.
Continued investigation and optimization of 2,4-DNT reduction using Pd-catalysis
with formic acid as a reductant. This thesis only examined the effect of three
parameters on system performance, over a limited range of conditions. The range of
experiments may be expanded or additional parameters, such as competing dissolved ions
or contaminant mixtures, studied. Continued research will allow for optimization of the
system, improving overall performance and defining operating parameters for possible
future field applications.
Use kinetic data to model a recirculation well system. Models of catalytic reactors as
components of recirculation well systems have been applied to other contaminants, to
determine the feasibility of field application. Kinetic data from this work and from
Phillips (2003) may be incorporated into a recirculating well model to determine the
feasibility of field application of Pd-catalysis to effect in situ degradation of NACs.
Study health effects of NAC reduction byproducts. The health effects and overall
toxicity of NAC reduction products, both known and unknown, should be studied.
Should the byproducts of palladium-catalyzed reduction of NACs pose health risks, this
process may not be useful for groundwater remediation.

94
References
Adrian, Neal R., Clint M. Arnett., Robert F. Hickey. “Stimulating the anaerobic
biodegradation of explosives by the addition of hydrogen or electron donors that produce hydrogen,” Water Research, Vol 37, 3499-3507, 2003.
Agrawal, Abinash., Paul G. Tratnyek. “Reduction of Nitro Aromatic Compounds by
Zero-Valent Iron Metal,” Environ. Sci. Technol., Vol 30, No. 1. 153-160, 1996. Balakrishnan, Vimal K., Annamaria Halasz., Jalal Hawari. “Alkaline Hydrolysis of the
Cyclic Nitramine Explosives RDX, HMX, and CL-20: New Insights into Degradation Pathways Obtained by the Observation of Novel Intermediates,” Environ. Sci. Technol., Vol xx, No. xx. 2003.
Boggs, K. G. Bench-Scale Investigation of Catalytic Dehalogenation of Chlorinated
Ethenes with Palladium Metal. MS Thesis, Wright State University, Dayton OH, July 2000.
Centers for Disease Control (CDC). Agency for Toxic Substances and Disease Registry,
2,4,6-Trinitrotolouene, PB/95/264297/AS. Washington D.C. 1995. http://www.atsdr.cdc.gov/toxprofiles/tp81.html
Centers for Disease Control (CDC). Agency for Toxic Substances and Disease Registry,
2,4-and 2,6-Dinitrotoluene, PB/99/122004. Washington D.C. 1998. http://www.atsdr.cdc.gov/toxprofiles/tp109.html
Dave, G., E. Nilsson., A.-S. Wernersson. “Sediment and water phase toxicity and UV-
activation of six chemicals used in military explosives,” Aquatic Ecosystem Health and Management. Vol 3, 291-299, 2000.
Department of Defense (DoD). Defense Environmental Restoration Program (DERP)
Report to Congress. Washington D.C.: DoD, April 2003. Department of the Interior (DoI). U.S. Geological Survey, Fact Sheet FS-027-96.
Washington D.C., 1996. http://water.usgs.gov/pubs/FS/FS-027-96/#HDR09 Devlin, John F., Jorg Klausen., Rene P. Schwarzenbach. “Kinetics of Nitroaromatic
Reduction on Granular Iron Recirculating Batch Experiments,” Environ. Sci. Technol., Vol 32, No. 13. 1941-1947, 1998.
Dillert, Ralf., Matthias Brant., Iris Fornefett., Ulrike Siebers., Detlef Bahnemann.
“Photocatalytic Degradation of Trinitrotoluene and Other Nitroaromatic Compounds,” Chemosphere, Vol 30, No. 12. 2333-2341, 1995.

95
Doppalapudi, Rajesh., Dinesh Palaniswamy., George Sorial., Stephen W. Maloney.
“Pilot-Scale Reactor for Electrochemical Reduction of Nitroaromatics in Water,” U.S. Army Corps of Engineers. Washington D.C., 2001.
Dunnick, June K., Leo T. Burka., Joel Mahler., Robert Sills. “Carcinogenic potential of
o-nitrotoluene and p-nitrotoluene,” Toxicology, Vol 183, 221-234, 2003. Encarta Reference Library. Microsoft Corp., 2003. Environmental Protection Agency (EPA). 2002 Edition of the Drinking Water Standards
and Health Advisories. Washington D.C.: EPA, Summer 2002. Groom, Carl A., Sylvie Beaudet., Annamaria Halasz., Louise Paquet., Jalal Hawari.
“Detection of the cyclic nitramine explosives hexahydro-1,3,5-trinitro-1,3,5-triazine (RDX) and octahydro-1,3,5,7-tetranitro-1,3,5,7-tetrazine (HMX) and their degradation products in soil environments,” Journal of Chromatography A, Vol 909, 53-60, 2001.
Hansen, Lance D., David D. Ringelberg., Deborah R. Felt., Jeffrey D. Davis. “Base-
induced 2,4,6-trinitrotoluene transformation, titration studies,” ERDC TR-01-10, U.S. Army Engineer Research and Development Center, Vicksburg, MS, 2001.
Hathaway, Gloria J., Nick H. Proctor., James P. Hughes. Proctor & Hughes’ Chemical
Hazards of the Workplace 4th Edition. New York: Van Nostrand Reinhold, 1996. Heijman, Cornelis G., Erwin Grieder., Christof Holliger., Rene P. Schwarzenbach.
“Reduction of Nitroaromatic Compounds Coupled to Microbial Iron Reduction in Laboratory Aquifer Columns,” Environ. Sci. Technol., Vol 29, No. 3. 775-783, 1995.
Hofstetter, Thomas B., Cornelis G. Heijman., Stefan B. Haderlein., Christof Holliger.,
Rene P. Schwarzenbach. “Complete Reduction of TNT and Other (Poly)nitroaromatic Compounds under Iron-Reducing Subsurface Conditions,” Environ. Sci. Technol., Vol 33, No. 9. 1479-1487, 1999.
Hwang, Philip., Teresa Chow., Neal R. Adrian. “Transformation of TNT to
Triaminotoluene by Mixed Cultures Incubated Under Methanogenic Conditions,” USACERL Technical Report 98/116, September 1998.
International Occupational Safety and Health Information Centre (ICSC). ICSC: 0967,
2,4,6-Trinitrotoluene. April 2000. http://www.ilo.org/public/english/protection/safework/cis/products/icsc/dtasht/_icsc09/icsc0967.htm

96
Klaassen, Curtis D. Casarett & Doull’s Toxicology, the Basic Science of Poisons 6th Edition. New York: McGraw-Hill Medical Publishing Division, 2001.
Lendenmann, Urs., Jim C. Spain., Barth F. Smets. “Simultaneous Biodegradation of 2,4-
Dinitrotoluene and 2,6-Dinitrotoluene in an Aerobic Fluidized-Bed Biofilm Reactor,” Environ. Sci. Technol., Vol 32, No. 1. 82-87, 1998.
Lewin, Seymour, Z. “Explosives,” Encarta Reference Library. Microsoft Corp., 2003. Lowry, Gregory V. and Martin Reinhard. “Pd-Catalyzed TCE Dechlorination in Water:
Effect of [H2](aq) and H2-Utilizing Competitive Solutes on the TCE Dechloringation Rate and Product Distribution,” Environ. Sci. Technol., Vol 35, No. 4. 696-702, 2001.
Nahen, Michael., Detlef Bahnemann., Ralf Dillert., Gregor Fels. “Photocatalytic
degradation of trinitrotoluene: reductive and oxidative pathways,” Journal of Photochemistry and Photobiology A: Chemistry, Vol 110, 191-199, 1997.
Neri, G., M. G. Musolino., C. Milone., A. M. Visco., A. Di Mario. “Mechanism of 2,4-
dinitrotoluene Hydrogenation Over Pd/C,” Journal of Molecular Catalysis A: Chemical, Vol 95, 235-241, 1995.
Nishino, Shirley F., Jim C. Spain., Hiltrud Lenke., Hans-Joachim Knackmuss.
“Mineralization of 2,4- and 2,6-Dinitrotoluene in Soil Slurries,” Environ. Sci. Technol., Vol 33, No. 7. 1060-1064, 1999.
Pennington, Judith C., US Army Corps of Engineers, Immobilization of 2,4- and 2,6-
Dinitrotoluenes in Soils and Compost, Jan 2003. Phelan, James M. and Stephen W. Webb. Chemical Detection of Buried Landmines,
Unpublished document, Environmental Restoration Technologies Department, Sandia National Laboratories, Albuquerque NM, NPS Symposium 1998. http://www.demine.org/symposia/3rd-NPS-1998/pillar3/phelan.pdf
Phillips, D. Landon. Palladium-Catalyzed Destruction of Nitro Aromatic-Contaminated
Groundwater. MS Thesis, Air Force Institute of Technology, WPAFB OH, March 2003.
Prüsse, Ulf., Klaus-Dieter Vorlop. “Supported bimetallic palladium catalysts for water-
phase nitrate reduction,” Journal of Molecular Catalysis A: Chemical, Vol 173, 313-328, 2001.
Rodgers, James D., Nigel J. Bunce. “Treatment Methods for the Remediation of
Nitroaromatic Explosives, Review Paper,” Water Resources, Vol 35, No. 9. 2101-2111, 2001.

97
Spanggord, Ronald J., Jim C. Spain., Shirly F. Nishino., Kristien E. Mortelmans.
“Biodegradation of 2,4-Dinitrotoluene by a Pseudomonas sp.,” Applied and Environmental Microbiology, Vol 57, No. 11. 3200-3205, Nov. 1991.
Urbanski, Tadeusz. Chemistry and Technology of Explosives, Vol 1. New York: The
Macmillan Company, 1964. Williams, Phillip L. and James L. Burson. Industrial Toxicology. New York: Van
Nostrand Reinhold, 1985. Zhang, Chunlong., Joseph B. Hughes., Shirley F. Nishino., Jim C. Spain. “Slurry-Phase
Biological Treatment of 2,4-Dinitrotoluene and 2,6-Dinitrotoluene: Role of Bioaugmentation and Effects of High Dinitrotoluene Concentrations,” Environ. Sci. Technol., Vol 34, No. 13. 2810-2816, 2000.
Zhao, Xiaoming and Jehuda Yinon. “Characterization and origin identification of 2,4,6-
trinitrotoluene through its by-product isomers by liquid chromatography-atmospheric pressure chemical ionization mass spectrometry,” Journal of Chromatography A, Vol 946, 125-132, 2002.

98
VITA
Captain Mark R. Stevens was born in San Antonio, TX. He graduated from
Bellevue East High School in 1995 and received an appointment to the United States Air
Force Academy. At the Air Force Academy he received a Bachelors of Science degree in
Environmental Engineering and a commission in the United States Air Force on 2 June
1999. In August 2003 he matriculated into the Graduate Engineering Management
program at the Air Force Institute of Technology.

99
APPENDIX A
COLUMN EXPERIMENT RESULTS

100
2-NT Removal Fraction2-NT (100ppm), 1 mMol, pH = 4.43
-0.60-0.40-0.200.000.200.40
0.0 20.0 40.0 60.0 80.0
Clm (ppm)
Rem
oval
Fra
ctio
n
Influent vs Effluent 2-NT Concentration2-NT (100ppm), 1 mMol, pH = 4.43
0.020.040.060.080.0
0 50 100 150 200 250 300
Elapsed Time (min)
Con
c (p
pm)
Influent Effluent
Effluent pH over Time2-NT (100ppm), 1 mMol, pH = 4.43
5.405.605.806.006.206.40
0 100 200 300Elapsed Time (min)
pH
Figure A.1a Exp #1 – 100 ppm 2-NT, 1mMol Formic acid, pH = 4.43 (A) Influent vs. Effluent 2-NT Concentration (B) Removal vs. Clm (ppm) (C) Effluent pH vs. Time
(B)
(A)
(C)

101
Degradation Rate vs Clm2-NT (100ppm), 1 mMol, pH = 4.43
-30.0-20.0-10.0
0.010.020.0
0.0 20.0 40.0 60.0 80.0
Clm (ppm)
dC/d
t (pp
m/m
in)
Degradation Rate vs Clm2-NT (100ppm), 1 mMol, pH = 4.43
-0.25-0.20-0.15-0.10-0.050.000.050.10
0.00 0.10 0.20 0.30 0.40 0.50 0.60
Clm (mMol)
dC/d
t (m
Mol
/min
)
Byproduct Distribution2-NT (100ppm), 1 mMol, pH = 4.43
0.0
0.2
0.4
0.6
0.8
0 50 100 150 200 250
Time (min)
mm
ole/
L
0
50
100
150
200
% Id
Influent 2-NT Effluent 2-NT 2-aT Sum % Id
Figure A.1b Exp #1 – 100 ppm 2-NT, 1mMol Formic acid, pH = 4.43 (D) Degradation Rate vs. Clm (ppm) (E) Degradation Rate vs. Clm (mMol) (F) Byproduct Distribution
(D)
(E)
(F)

102
Removal Fraction2-NT (20ppm), 1 mMol, pH = 3.99
0.200.300.400.500.600.700.800.90
0.0 5.0 10.0 15.0 20.0Clm (ppm)
Rem
oval
Fra
ctio
n
Influent vs Effluent 2-NT Concentration2-NT (20ppm), 1 mMol, pH = 3.99
0.05.0
10.015.020.025.0
0 50 100 150 200
Elapsed Time (min)
Con
c (p
pm)
Influent Effluent
Effluent pH over Time2-NT (20ppm), 1 mMol, pH = 3.99
6.10
6.15
6.20
6.25
6.30
0 50 100 150 200
Elapsed Time (min)
pH
Figure A.2a Exp #2 – 20 ppm 2-NT, 1mMol Formic acid, pH = 3.99 (A) Influent vs. Effluent 2-NT Concentration (B) Removal vs. Clm (ppm) (C) Effluent pH vs. Time
(A)
(B)
(C)
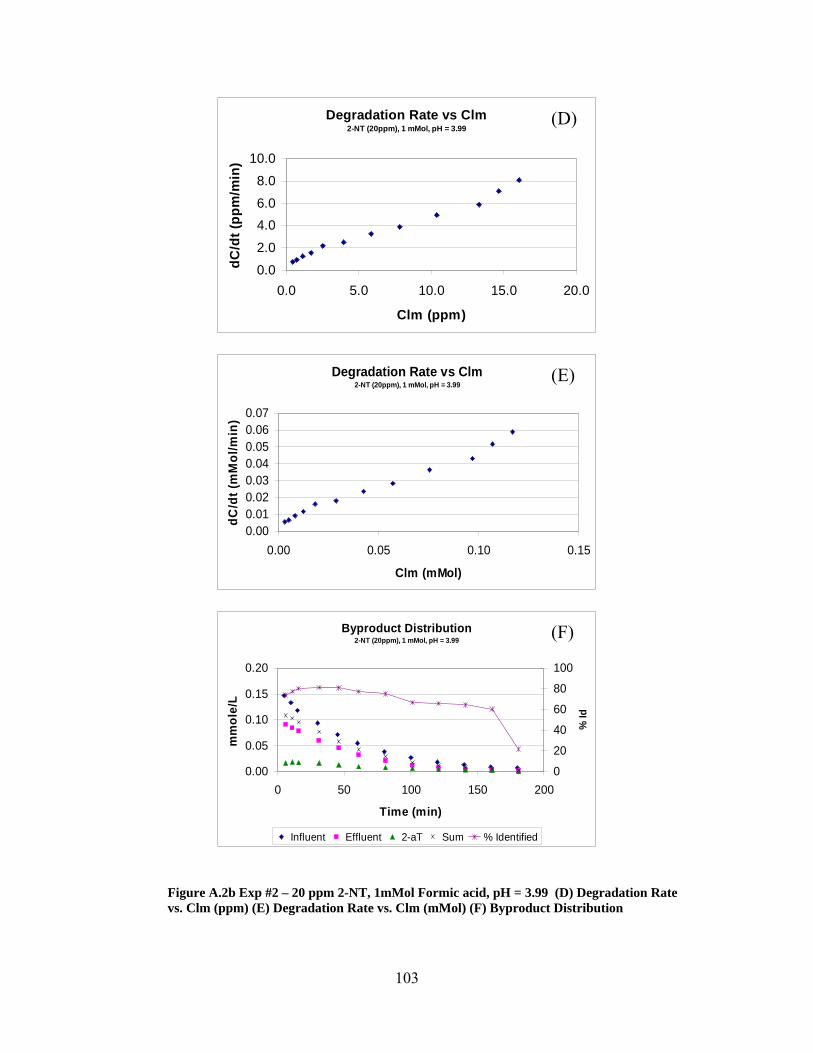
103
Degradation Rate vs Clm2-NT (20ppm), 1 mMol, pH = 3.99
0.0
2.0
4.06.0
8.0
10.0
0.0 5.0 10.0 15.0 20.0
Clm (ppm)
dC/d
t (pp
m/m
in)
Degradation Rate vs Clm2-NT (20ppm), 1 mMol, pH = 3.99
0.000.010.020.030.040.050.060.07
0.00 0.05 0.10 0.15
Clm (mMol)
dC/d
t (m
Mol
/min
)
Byproduct Distribution2-NT (20ppm), 1 mMol, pH = 3.99
0.00
0.05
0.10
0.15
0.20
0 50 100 150 200
Time (min)
mm
ole/
L
0
20
40
60
80
100
% Id
Influent Effluent 2-aT Sum % Identified
Figure A.2b Exp #2 – 20 ppm 2-NT, 1mMol Formic acid, pH = 3.99 (D) Degradation Rate vs. Clm (ppm) (E) Degradation Rate vs. Clm (mMol) (F) Byproduct Distribution
(D)
(E)
(F)

104
Influent vs Effluent 2-NT Concentration 2-NT (20ppm), 1 mMol, pH = 5.15
0.0
10.0
20.0
30.0
0 50 100 150 200 250 300
Elapsed Time (min)
Con
c (p
pm)
Influent Effluent
Removal Fraction2-NT (20ppm), 1 mMol, pH = 5.15
0.200.250.300.350.400.450.50
0.0 5.0 10.0 15.0 20.0
Clm (ppm)
Rem
oval
Fra
ctio
n
Effluent pH over Time2-NT (20ppm), 1 mMol, pH = 5.15
7.257.307.357.407.457.507.55
0 50 100 150 200 250 300
Elapsed Time (min)
pH
Figure A.3a Exp #3 – 20 ppm 2-NT, 1mMol Formic acid, pH = 5.15 (A) Influent vs. Effluent 2-NT Concentration (B) Removal vs. Clm (ppm) (C) Effluent pH vs. Time
(A)
(B)
(C)

105
Degradation Rate vs Clm2-NT (20ppm), 1 mMol, pH = 5.15
0.0
2.0
4.0
6.0
8.0
0.0 5.0 10.0 15.0 20.0
Clm (ppm)
dC/d
t (pp
m/m
in)
Degradation Rate vs Clm2-NT (20ppm), 1 mMol, pH = 5.15
0.000.010.020.030.040.050.06
0.00 0.05 0.10 0.15
Clm (mMol)
dC/d
t (m
Mol
/min
)
Byproduct Distribution2-NT (20ppm), 1 mMol, pH = 5.15
0.000.05
0.100.15
0.20
0 50 100 150 200 250 300
Time (min)
mm
ole/
L
020406080100
% Id
Influent Effluent 2-aT Sum % Id
Figure A.3b Exp #3 – 20 ppm 2-NT, 1mMol Formic acid, pH = 5.15 (D) Degradation Rate vs. Clm (ppm) (E) Degradation Rate vs. Clm (mMol) (F) Byproduct Distribution
(D)
(F)
(E)
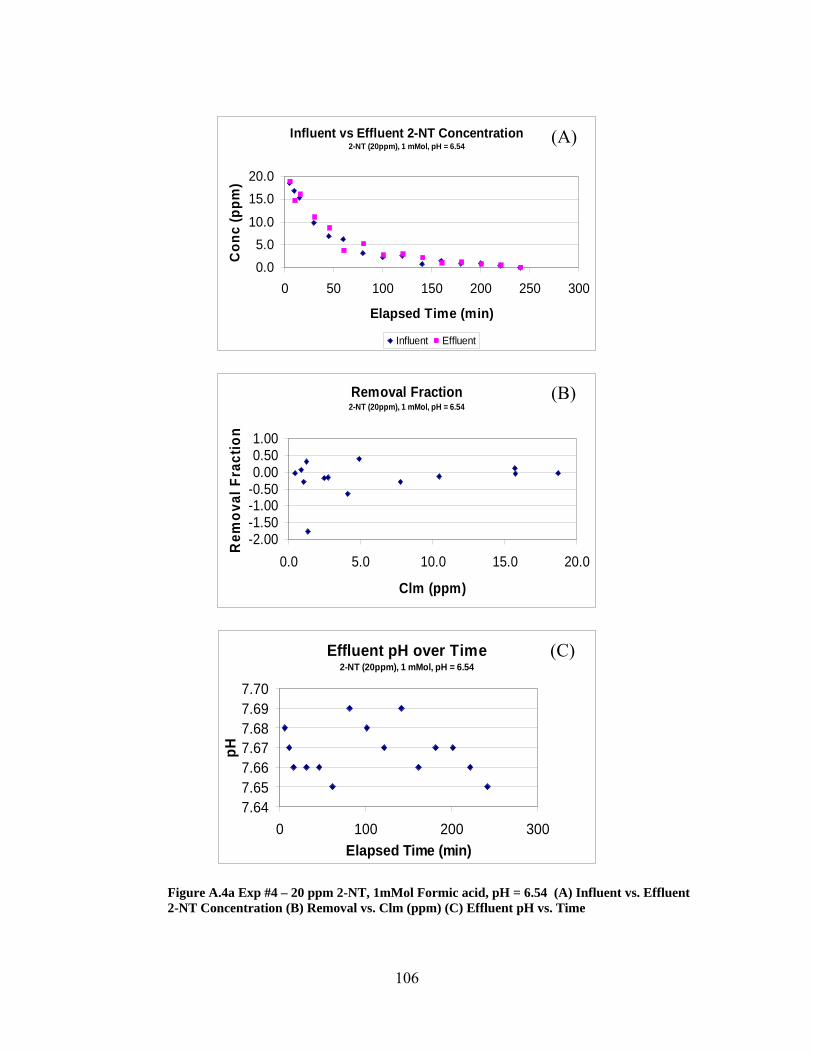
106
Influent vs Effluent 2-NT Concentration2-NT (20ppm), 1 mMol, pH = 6.54
0.05.0
10.0
15.020.0
0 50 100 150 200 250 300
Elapsed Time (min)
Con
c (p
pm)
Influent Effluent
Removal Fraction2-NT (20ppm), 1 mMol, pH = 6.54
-2.00-1.50-1.00-0.500.000.501.00
0.0 5.0 10.0 15.0 20.0
Clm (ppm)
Rem
oval
Fra
ctio
n
Effluent pH over Time2-NT (20ppm), 1 mMol, pH = 6.54
7.647.657.667.677.687.697.70
0 100 200 300Elapsed Time (min)
pH
Figure A.4a Exp #4 – 20 ppm 2-NT, 1mMol Formic acid, pH = 6.54 (A) Influent vs. Effluent 2-NT Concentration (B) Removal vs. Clm (ppm) (C) Effluent pH vs. Time
(A)
(B)
(C)

107
Degradation Rate vs Clm2-NT (20ppm), 1 mMol, pH = 6.54
-3.0-2.0-1.00.01.02.03.0
0.0 5.0 10.0 15.0 20.0
Clm (ppm)
dC/d
t (pp
m/m
in)
Degradation Rate vs Clm2-NT (20ppm), 1 mMol, pH = 6.54
-0.020
-0.010
0.000
0.010
0.020
0.030
0.000 0.050 0.100 0.150
Clm (mMol)
dC/d
t (m
Mol
/min
)
Byproduct Distribution2-NT (20ppm), 1 mMol, pH = 6.54
0.000
0.050
0.100
0.150
0 50 100 150 200 250 300
Time (min)
mm
ole/
L
050100150200250300
% Id
Influent Effluent 2-aT Sum % Id
Figure A.4b Exp #4 – 20 ppm 2-NT, 1mMol Formic acid, pH = 6.54 (D) Degradation Rate vs. Clm (ppm) (E) Degradation Rate vs. Clm (mMol) (F) Byproduct Distribution
(D)
(E)
(F)

108
Influent vs Effluent 2,4-DNT Concentration2,4-DNT (20ppm), 1 mMol, pH = 4.01
0
5
10
15
20
0 50 100 150 200 250
Elapsed Time (min)
Con
c (p
pm)
Influent Effluent
Removal Fraction2,4-DNT (20ppm), 1 mMol, pH = 4.01
0.700.750.800.850.900.951.00
0.0 2.0 4.0 6.0 8.0 10.0 12.0
Clm (ppm)
Rem
oval
Fra
ctio
n
Degradation Rate vs Clm2,4-DNT (20ppm), 1 mMol, pH = 4.01
0.00
5.00
10.00
15.00
0.00 2.00 4.00 6.00 8.00 10.00 12.00Clm (ppm)
dC/d
t (pp
m/m
in)
Effluent pH over Time2,4-DNT (20ppm), 1 mMol, pH = 4.01
5.906.006.106.206.306.406.50
0 100 200 300
Time (min)
pH
Degradation Rate vs Clm2,4-DNT (20ppm), 1 mMol, pH = 4.01
0.00
0.02
0.04
0.06
0.08
0.00 0.01 0.02 0.03 0.04 0.05 0.06
Clm (mMol)
dC/d
t (m
Mol
/min
)
Figure A.5a Exp #5 – 20 ppm 2,4-DNT, 1mMol Formic acid, pH = 4.01 (A) Influent vs. Effluent 2,4-DNT Concentration (B) Removal vs. Clm (ppm) (C) Effluent pH vs. Time (D) Degradation Rate vs. Clm (ppm) (E) Degradation Rate vs. Clm (mMol)
(A) (B)
(E)
(C) (D)

109
Byproduct Distribution2,4-DNT (20ppm), 1 mMol, pH = 4.01
0.000.020.040.060.080.100.12
0 50 100 150 200 250 300
Time (min)
mm
ole/
L
05101520253035404550
% Id
Influent Effluent 2,4-DAT 4A2NT 2A4NT Sum % Identified
Known Daughter Products2,4-DNT (20ppm), 1 mMol, pH = 4.01
0.00.51.01.52.02.53.0
0 100 200 300
Elapsed Time (min)
Con
cent
ratio
n (p
pm)
2,4-DAT 2A4NT 4A2NT
Figure A.5b Exp #5 – 20 ppm 2,4-DNT, 1mMol Formic acid, pH = 4.01 (F) Byproduct Distribution (G) Known Daughter Products
(F)
(G)

110
Influent vs Effluent 2,4-DNT Concentration2,4-DNT (20ppm), 1 mMol, pH = 5.00
0
5
10
15
20
0 50 100 150 200 250 300
Elapsed Time (min)
Con
c (p
pm)
Influent Effluent
Removal Fraction2,4-DNT (20ppm), 1 mMol, pH = 5.00
0.00
0.20
0.40
0.60
0.80
0.0 5.0 10.0 15.0
Clm (ppm)
Rem
oval
Fra
ctio
n
Effluent pH over Time2,4-DNT (20ppm), 1 mMol, pH = 5.00
7.107.157.207.257.30
0 100 200 300Time (min)
pH
Degradation Rate vs Clm2,4-DNT (20ppm), 1 mMol, pH = 5.00
0.00
2.00
4.00
6.00
8.00
10.00
0.00 5.00 10.00 15.00Clm (ppm)
dC/d
t (pp
m/m
in)
Degradation Rate vs Clm2,4-DNT (20ppm), 1 mMol, pH = 5.00
0.000.010.020.030.040.050.06
0.00 0.02 0.04 0.06 0.08 0.10
Clm (mMol)
dC/d
t (m
Mol
/min
)
Figure A.6a Exp #6 – 20 ppm 2,4-DNT, 1mMol Formic acid, pH = 5.00 (A) Influent vs. Effluent 2,4-DNT Concentration (B) Removal vs. Clm (ppm) (C) Effluent pH vs. Time (D) Degradation Rate vs. Clm (ppm) (E) Degradation Rate vs. Clm (mMol)
(E)
(A) (B)
(C) (D)

111
Byproduct Distribution2,4-DNT (20ppm), 1 mMol, pH = 5.00
0.000.020.040.060.080.100.12
0 50 100 150 200 250 300
Time (min)
mm
ole/
L
0
10
20
30
40
50
60
70
80
% Id
Influent Effluent 2,4-DAT 4A2NT 2A4NT Sum % Identified
Known Daughter Products2,4-DNT (20ppm), 1 mMol, pH = 5.00
0.00.20.40.60.81.01.2
0 100 200 300
Elapsed Time (min)
Con
cent
ratio
n (p
pm)
2,4-DAT 2A4NT 4A2NT
Figure A.6b Exp #6 – 20 ppm 2,4-DNT, 1mMol Formic acid, pH = 5.00 (F) Byproduct Distribution (G) Known Daughter Products
(F)
(G)

112
Influent vs Effluent 2,4-DNT Concentration2,4-DNT (20ppm), 1 mMol, pH = 6.40
05
10152025
0 50 100 150 200 250 300
Elapsed Time (min)
Con
c (p
pm)
Influent Effluent
Removal Fraction2,4-DNT (20ppm), 1 mMol, pH = 6.40
0.000.050.100.150.200.25
0.0 5.0 10.0 15.0 20.0
Clm (ppm)
Rem
oval
Fra
ctio
n
Effluent pH over Time2,4-DNT (20ppm), 1 mMol, pH = 6.40
7.587.607.627.647.667.68
0 100 200 300
Time (min)
pH
Degradation Rate vs Clm2,4-DNT (20ppm), 1 mMol, pH = 6.40
0.000.501.001.502.002.503.00
0.00 5.00 10.00 15.00 20.00Clm (ppm)
dC/d
t (pp
m/m
in)
Degradation Rate vs Clm2,4-DNT (20ppm), 1 mMol, pH = 6.40
0.000.000.000.010.010.010.010.01
0.00 0.02 0.04 0.06 0.08 0.10 0.12
Clm (mMol)
dC/d
t (m
Mol
/min
)
Figure A.7a Exp #7 – 20 ppm 2,4-DNT, 1mMol Formic acid, pH = 6.40 (A) Influent vs. Effluent 2,4-DNT Concentration (B) Removal vs. Clm (ppm) (C) Effluent pH vs. Time (D) Degradation Rate vs. Clm (ppm) (E) Degradation Rate vs. Clm (mMol)
(E)
(A) (B)
(C) (D)

113
Byproduct Distribution2,4-DNT (20ppm), 1 mMol, pH = 6.40
0.000.020.040.060.080.100.12
0 50 100 150 200 250 300
Time (min)
mm
ole/
L
0102030405060708090100
% Id
Influent Effluent 2,4-DAT 4A2NT 2A4NT Sum % Identified
Known Daughter Products2,4-DNT (20ppm), 1 mMol, pH = 6.40
0.0
0.2
0.4
0.6
0.8
1.0
0 100 200 300
Elapsed Time (min)
Con
cent
ratio
n (p
pm)
2,4-DAT 2A4NT 4A2NT
Figure A.7b Exp #7 – 20 ppm 2,4-DNT, 1mMol Formic acid, pH = 6.40 (F) Byproduct Distribution (G) Known Daughter Products
(F)
(G)

114
Influent vs Effluent 2,4-DNT Concentration2,4-DAT (20ppm), 1 mMol, pH = 3.97
0
5
10
15
20
0 50 100 150 200
Elapsed Time (min)
Con
c (p
pm)
Influent Effluent
Removal Fraction2,4-DAT (20ppm), 1 mMol, pH = 3.97
0.300.400.500.600.700.80
0.0 5.0 10.0 15.0
Clm (ppm)
Rem
oval
Fra
ctio
n
Effluent pH over Time2,4-DAT (20ppm), 1 mMol, pH = 3.97
6.006.106.206.306.406.50
0 100 200 300
Time (min)
pH
Degradation Rate vs Clm2,4-DAT (20ppm), 1 mMol, pH = 3.97
0.00
2.00
4.00
6.00
8.00
10.00
0.00 5.00 10.00 15.00Clm (ppm)
dC/d
t (pp
m/m
in)
Degradation Rate vs Clm2,4-DAT (20ppm), 1 mMol, pH = 3.97
0.000.010.020.030.040.050.060.07
0.00 0.02 0.04 0.06 0.08 0.10 0.12 0.14
Clm (mMol)
dC/d
t (m
Mol
/min
)
Figure A.8a Exp #8 – 20 ppm 2,4-DAT, 1mMol Formic acid, pH = 3.97 (A) Influent vs. Effluent 2,4-DAT Concentration (B) Removal vs. Clm (ppm) (C) Effluent pH vs. Time (D) Degradation Rate vs. Clm (ppm) (E) Degradation Rate vs. Clm (mMol)
(E)
(A) (B)
(C) (D)

115
Byproduct Distribution2,4-DAT (20ppm), 1 mMol, pH = 3.97
0.00
0.05
0.10
0.15
0.20
0 50 100 150 200 250 300
Time (min)
mm
ole/
L
0
10
20
30
40
50
60
70
% Id
Influent Effluent Sum % Identified
Figure A.8b Exp #8 – 20 ppm 2,4-DAT, 1mMol Formic acid, pH = 6.40 (F) Byproduct Distribution
(F)

116
Influent vs Effluent 2,4-DNT Concentration2,4-DAT (20ppm), 4 mMol, pH = 3.96
0
5
10
15
20
0 50 100 150 200
Elapsed Time (min)
Con
c (p
pm)
Influent Effluent
Removal Fraction2,4-DAT (20ppm), 4 mMol, pH = 3.96
0.50
0.60
0.70
0.80
0.90
0.0 2.0 4.0 6.0 8.0 10.0 12.0
Clm (ppm)
Rem
oval
Fra
ctio
n
Effluent pH over Time2,4-DAT (20ppm), 4 mMol, pH = 3.96
4.60
4.80
5.00
5.20
0 100 200 300
Time (min)
pH
Degradation Rate vs Clm2,4-DAT (20ppm), 4 mMol, pH = 3.96
0.002.004.006.008.00
10.0012.00
0.00 2.00 4.00 6.00 8.00 10.00 12.00Clm (ppm)
dC/d
t (pp
m/m
in)
Degradation Rate vs Clm2,4-DAT (20ppm), 4 mMol, pH = 3.96
0.00
0.02
0.04
0.06
0.08
0.10
0.00 0.02 0.04 0.06 0.08 0.10
Clm (mMol)
dC/d
t (m
Mol
/min
)
Figure A.9a Exp #9 – 20 ppm 2,4-DAT, 4mMol Formic acid, pH = 3.96 (A) Influent vs. Effluent 2,4-DAT Concentration (B) Removal vs. Clm (ppm) (C) Effluent pH vs. Time (D) Degradation Rate vs. Clm (ppm) (E) Degradation Rate vs. Clm (mMol)
(E)
(A) (B)
(C) (D)
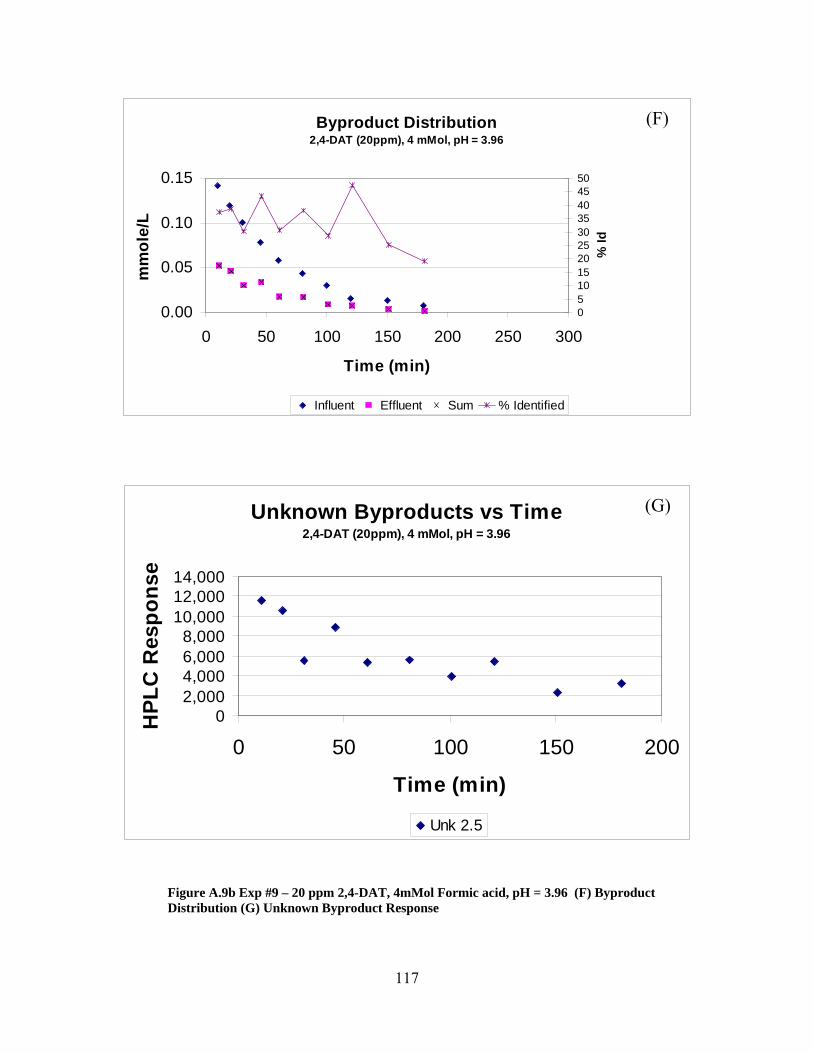
117
Byproduct Distribution2,4-DAT (20ppm), 4 mMol, pH = 3.96
0.00
0.05
0.10
0.15
0 50 100 150 200 250 300
Time (min)
mm
ole/
L
05101520253035404550
% Id
Influent Effluent Sum % Identified
Unknown Byproducts vs Time2,4-DAT (20ppm), 4 mMol, pH = 3.96
02,0004,0006,0008,000
10,00012,00014,000
0 50 100 150 200
Time (min)
HPL
C R
espo
nse
Unk 2.5
Figure A.9b Exp #9 – 20 ppm 2,4-DAT, 4mMol Formic acid, pH = 3.96 (F) Byproduct Distribution (G) Unknown Byproduct Response
(F)
(G)

118
Influent vs Effluent 2,4-DNT Concentration2,4-DAT (20ppm), 0 mMol, pH = 7.28
0
5
10
15
20
0 50 100 150 200 250 300
Elapsed Time (min)
Con
c (p
pm)
Influent Effluent
Removal Fraction2,4-DAT (20ppm), 0 mMol, pH = 7.28
-0.40-0.200.000.200.400.60
0.0 5.0 10.0 15.0 20.0
Clm (ppm)
Rem
oval
Fra
ctio
n
Effluent pH over Time2,4-DAT (20ppm), 0 mMol, pH = 7.28
5.605.806.006.206.40
0 100 200 300
Time (min)
pH
Degradation Rate vs Clm2,4-DAT (20ppm), 0 mMol, pH = 7.28
-2.00
0.00
2.00
4.00
6.00
8.00
0.00 5.00 10.00 15.00 20.00
Clm (ppm)dC
/dt (
ppm
/min
)
Degradation Rate vs Clm2,4-DAT (20ppm), 0 mMol, pH = 7.28
-0.010.000.010.020.030.040.050.06
0.00 0.02 0.04 0.06 0.08 0.10 0.12 0.14
Clm (mMol)
dC/d
t (m
Mol
/min
)
Figure A.10a Exp #10 – 20 ppm 2,4-DAT, 0mMol Formic acid, pH = 7.28 (A) Influent vs. Effluent 2,4-DAT Concentration (B) Removal vs. Clm (ppm) (C) Effluent pH vs. Time (D) Degradation Rate vs. Clm (ppm) (E) Degradation Rate vs. Clm (mMol)
(E)
(A) (B)
(C) (D)

119
Byproduct Distribution2,4-DAT (20ppm), 0 mMol, pH = 7.28
0.00
0.05
0.10
0.15
0.20
0 50 100 150 200 250 300
Time (min)
mm
ole/
L
020406080100120140160
% Id
Influent Effluent Sum % Identified
Figure A.10b Exp #10 – 20 ppm 2,4-DAT, 1mMol Formic acid, pH = 7.28 (F) Byproduct Distribution
(F)

120
Influent vs Effluent 2,4-DNT Concentration2,4-DNT (20ppm), 0 mMol, pH = 5.85
0
5
10
15
20
0 50 100 150 200
Elapsed Time (min)
Con
c (p
pm)
Influent Effluent
Removal Fraction2,4-DNT (20ppm), 0 mMol, pH = 5.85
-0.40-0.30-0.20-0.100.000.100.20
0.0 5.0 10.0 15.0 20.0
Clm (ppm)
Rem
oval
Fra
ctio
n
Effluent pH over Time2,4-DNT (20ppm), 0 mMol, pH = 5.85
5.605.705.805.906.00
0 100 200 300
Time (min)
pH
Degradation Rate vs Clm2,4-DNT (20ppm), 0 mMol, pH = 5.85
-3.00-2.00-1.000.001.002.003.004.00
0.00 5.00 10.00 15.00 20.00Clm (ppm)
dC/d
t (pp
m/m
in)
Degradation Rate vs Clm2,4-DNT (20ppm), 0 mMol, pH = 5.85
-0.02-0.01-0.010.000.010.010.020.02
0.00 0.02 0.04 0.06 0.08 0.10
Clm (mMol)
dC/d
t (m
Mol
/min
)
Figure A.11a Exp #11 – 20 ppm 2,4-DNT, 0mMol Formic acid, pH = 5.85 (A) Influent vs. Effluent 2,4-DNT Concentration (B) Removal vs. Clm (ppm) (C) Effluent pH vs. Time (D) Degradation Rate vs. Clm (ppm) (E) Degradation Rate vs. Clm (mMol)
(E)
(A) (B)
(C) (D)

121
Byproduct Distribution2,4-DNT (20ppm), 0 mMol, pH = 5.85
0.000.020.040.060.080.100.12
0 50 100 150 200 250 300
Time (min)
mm
ole/
L
0
20
40
60
80
100
120
140
% Id
Influent Effluent 2,4-DAT 4A2NT 2A4NT Sum % Identified
Known Daughter Products2,4-DNT (20ppm), 0 mMol, pH = 5.85
0.0
0.2
0.4
0.6
0.8
1.0
0 100 200 300
Elapsed Time (min)
Con
cent
ratio
n (p
pm)
2,4-DAT 2A4NT 4A2NT
Figure A.11b Exp #11 – 20 ppm 2,4-DNT, 0mMol Formic acid, pH = 5.85 (F) Byproduct Distribution (G) Known Daughter Products
(F)
(G)

122
Influent vs Effluent 2,4-DNT Concentration2,4-DNT (15ppm), 4 mMol, pH = 4.00
0
5
10
15
0 50 100 150 200 250 300
Elapsed Time (min)
Con
c (p
pm)
Influent Effluent
Removal Fraction2,4-DNT (15ppm), 4 mMol, pH = 4.00
0.920.940.960.981.001.02
0.0 1.0 2.0 3.0 4.0
Clm (ppm)
Rem
oval
Fra
ctio
n
Effluent pH over Time2,4-DNT (15ppm), 4 mMol, pH = 4.00
4.80
4.90
5.00
5.10
0 100 200 300
Time (min)
pH
Degradation Rate vs Clm2,4-DNT (15ppm), 4 mMol, pH = 4.00
0.002.004.006.008.00
10.0012.0014.00
0.00 1.00 2.00 3.00 4.00Clm (ppm)
dC/d
t (pp
m/m
in)
Degradation Rate vs Clm2,4-DNT (15ppm), 4 mMol, pH = 4.00
0.00
0.02
0.04
0.06
0.08
0.00 0.01 0.01 0.02 0.02 0.03
Clm (mMol)
dC/d
t (m
Mol
/min
)
Figure A.12a Exp #12 – 15 ppm 2,4-DNT, 4mMol Formic acid, pH = 4.00 (A) Influent vs. Effluent 2,4-DNT Concentration (B) Removal vs. Clm (ppm) (C) Effluent pH vs. Time (D) Degradation Rate vs. Clm (ppm) (E) Degradation Rate vs. Clm (mMol)
(E)
(A) (B)
(C) (D)

123
Byproduct Distribution2,4-DNT (15ppm), 4 mMol, pH = 4.00
0.000.010.020.030.040.050.060.070.08
0 50 100 150 200 250 300
Time (min)
mm
ole/
L
0
10
20
30
40
50
60
% Id
Influent Effluent 2,4-DAT 4A2NT 2A4NT Sum % Identified
Known Daughter Products2,4-DNT (15ppm), 4 mMol, pH = 4.00
0.0
1.0
2.0
3.0
4.0
0 100 200 300
Elapsed Time (min)
Con
cent
ratio
n (p
pm)
2,4-DAT 2A4NT 4A2NT
Figure A.12b Exp #12 – 15 ppm 2,4-DNT, 4mMol Formic acid, pH = 4.00 (F) Byproduct Distribution (G) Known Daughter Products
(F)
(G)

124
Influent vs Effluent 2,4-DNT Concentration2,4-DNT (20ppm), 4 mMol, pH = 5.06
0
5
10
15
20
0 50 100 150 200
Elapsed Time (min)
Con
c (p
pm)
Influent Effluent
Removal Fraction2,4-DNT (20ppm), 4 mMol, pH = 5.06
0.820.840.860.880.900.920.940.96
0.0 2.0 4.0 6.0 8.0 10.0
Clm (ppm)
Rem
oval
Fra
ctio
n
Effluent pH over Time2,4-DNT (20ppm), 4 mMol, pH = 5.06
6.706.756.806.856.906.95
0 100 200 300
Time (min)
pH
Degradation Rate vs Clm2,4-DNT (20ppm), 4 mMol, pH = 5.06
0.00
5.00
10.00
15.00
20.00
0.00 2.00 4.00 6.00 8.00 10.00Clm (ppm)
dC/d
t (pp
m/m
in)
Degradation Rate vs Clm2,4-DNT (20ppm), 4 mMol, pH = 5.06
0.00
0.02
0.04
0.06
0.08
0.10
0.00 0.01 0.02 0.03 0.04 0.05
Clm (mMol)
dC/d
t (m
Mol
/min
)
Figure A.13a Exp #13 – 20 ppm 2,4-DNT, 4mMol Formic acid, pH = 5.06 (A) Influent vs. Effluent 2,4-DNT Concentration (B) Removal vs. Clm (ppm) (C) Effluent pH vs. Time (D) Degradation Rate vs. Clm (ppm) (E) Degradation Rate vs. Clm (mMol)
(E)
(A) (B)
(C) (D)

125
Byproduct Distribution2,4-DNT (20ppm), 4 mMol, pH = 5.06
0.000.020.040.060.080.100.12
0 50 100 150 200 250 300
Time (min)
mm
ole/
L
0
10
20
30
40
50
60
% Id
Influent Effluent 2,4-DAT 4A2NT 2A4NT Sum % Identified
Known Daughter Products2,4-DNT (20ppm), 4 mMol, pH = 5.06
0.0
1.0
2.0
3.0
4.0
5.0
0 100 200 300
Elapsed Time (min)
Con
cent
ratio
n (p
pm)
2,4-DAT 2A4NT 4A2NT
Figure A.13b Exp #13 – 20 ppm 2,4-DNT, 4mMol Formic acid, pH = 5.06 (F) Byproduct Distribution (G) Known Daughter Products
(F)
(G)

126
Influent vs Effluent 2,4-DNT Concentration2,4-DNT (20ppm), 4 mMol, pH = 6.06
05
10152025
0 50 100 150 200
Elapsed Time (min)
Con
c (p
pm)
Influent Effluent
Removal Fraction2,4-DNT (20ppm), 4 mMol, pH = 6.06
0.60
0.70
0.80
0.90
1.00
0.0 2.0 4.0 6.0 8.0 10.0 12.0
Clm (ppm)
Rem
oval
Fra
ctio
n
Effluent pH over Time2,4-DNT (20ppm), 4 mMol, pH = 6.06
7.45
7.50
7.55
7.60
0 100 200 300
Time (min)
pH
Degradation Rate vs Clm2,4-DNT (20ppm), 4 mMol, pH = 6.06
0.00
5.00
10.00
15.00
0.00 2.00 4.00 6.00 8.00 10.00 12.00Clm (ppm)
dC/d
t (pp
m/m
in)
Degradation Rate vs Clm2,4-DNT (20ppm), 4 mMol, pH = 6.06
0.00
0.02
0.04
0.06
0.08
0.00 0.01 0.02 0.03 0.04 0.05 0.06 0.07
Clm (mMol)
dC/d
t (m
Mol
/min
)
Figure A.14a Exp #14 – 20 ppm 2,4-DNT, 4mMol Formic acid, pH = 6.06 (A) Influent vs. Effluent 2,4-DNT Concentration (B) Removal vs. Clm (ppm) (C) Effluent pH vs. Time (D) Degradation Rate vs. Clm (ppm) (E) Degradation Rate vs. Clm (mMol)
(E)
(A) (B)
(C) (D)

127
Byproduct Distribution2,4-DNT (20ppm), 4 mMol, pH = 6.06
0.000.020.040.060.080.100.12
0 50 100 150 200 250 300
Time (min)
mm
ole/
L
0
10
20
30
40
50
60
70
% Id
Influent Effluent 2,4-DAT 4A2NT 2A4NT Sum % Identified
Known Daughter Products2,4-DNT (20ppm), 4 mMol, pH = 6.06
0.00.51.01.52.02.53.03.5
0 100 200 300
Elapsed Time (min)
Con
cent
ratio
n (p
pm)
2,4-DAT 2A4NT 4A2NT
Figure A.14b Exp #14 – 20 ppm 2,4-DNT, 4mMol Formic acid, pH = 6.06 (F) Byproduct Distribution (G) Known Daughter Products
(F)
(G)

128
Influent vs Effluent 2,4-DNT Concentration2,4-DNT (20ppm), 10 mMol, pH = 4.04
0
5
10
15
20
0 50 100 150 200 250 300
Elapsed Time (min)
Con
c (p
pm)
Influent Effluent
Removal Fraction2,4-DNT (20ppm), 10 mMol, pH = 4.04
0.920.940.960.981.001.02
0.0 2.0 4.0 6.0 8.0
Clm (ppm)
Rem
oval
Fra
ctio
n
Effluent pH over Time2,4-DNT (20ppm), 10 mMol, pH = 4.04
4.50
4.55
4.60
4.65
0 100 200 300
Time (min)
pH
Degradation Rate vs Clm2,4-DNT (20ppm), 10 mMol, pH = 4.04
0.00
5.00
10.00
15.00
20.00
0.00 2.00 4.00 6.00 8.00Clm (ppm)
dC/d
t (pp
m/m
in)
Degradation Rate vs Clm2,4-DNT (20ppm), 10 mMol, pH = 4.04
0.00
0.02
0.04
0.06
0.08
0.10
0.00 0.01 0.02 0.03 0.04
Clm (mMol)
dC/d
t (m
Mol
/min
)
Figure A.15a Exp #15 – 20 ppm 2,4-DNT, 10mMol Formic acid, pH = 4.04 (A) Influent vs. Effluent 2,4-DNT Concentration (B) Removal vs. Clm (ppm) (C) Effluent pH vs. Time (D) Degradation Rate vs. Clm (ppm) (E) Degradation Rate vs. Clm (mMol)
(E)
(A) (B)
(C) (D)

129
Byproduct Distribution2,4-DNT (20ppm), 10 mMol, pH = 4.04
0.000.020.040.060.080.100.12
0 50 100 150 200 250 300
Time (min)
mm
ole/
L
0
5
10
15
20
25
30
35
40
% Id
Influent Effluent 2,4-DAT 4A2NT 2A4NT Sum % Identified
Known Daughter Products2,4-DNT (20ppm), 10 mMol, pH = 4.04
0.0
1.0
2.0
3.0
4.0
0 100 200 300
Elapsed Time (min)
Con
cent
ratio
n (p
pm)
2,4-DAT 2A4NT 4A2NT
Figure A.15b Exp #15 – 20 ppm 2,4-DNT, 10mMol Formic acid, pH = 4.04 (F) Byproduct Distribution (G) Known Daughter Products
(F)
(G)

130
Influent vs Effluent 2,4-DNT Concentration2,4-DNT (20ppm), 10 mMol, pH = 4.97
05
10152025
0 50 100 150 200
Elapsed Time (min)
Con
c (p
pm)
Influent Effluent
Removal Fraction2,4-DNT (20ppm), 10 mMol, pH = 4.97
0.900.910.920.930.940.95
0.0 2.0 4.0 6.0 8.0
Clm (ppm)
Rem
oval
Fra
ctio
n
Effluent pH over Time2,4-DNT (20ppm), 10 mMol, pH = 4.97
6.20
6.30
6.40
6.50
0 100 200 300
Time (min)
pH
Degradation Rate vs Clm2,4-DNT (20ppm), 10 mMol, pH = 4.97
0.00
5.00
10.00
15.00
20.00
0.00 2.00 4.00 6.00 8.00Clm (ppm)
dC/d
t (pp
m/m
in)
Degradation Rate vs Clm2,4-DNT (20ppm), 10 mMol, pH = 4.97
0.000.020.040.060.080.100.12
0.00 0.01 0.02 0.03 0.04 0.05
Clm (mMol)
dC/d
t (m
Mol
/min
)
Figure A.16a Exp #16 – 20 ppm 2,4-DNT, 10mMol Formic acid, pH = 4.97 (A) Influent vs. Effluent 2,4-DNT Concentration (B) Removal vs. Clm (ppm) (C) Effluent pH vs. Time (D) Degradation Rate vs. Clm (ppm) (E) Degradation Rate vs. Clm (mMol)
(E)
(A) (B)
(C) (D)

131
Byproduct Distribution2,4-DNT (20ppm), 10 mMol, pH = 4.97
0.000.020.040.060.080.100.12
0 50 100 150 200 250 300
Time (min)
mm
ole/
L
051015202530354045
% Id
Influent Effluent 2,4-DAT 4A2NT 2A4NT Sum % Identified
Known Daughter Products2,4-DNT (20ppm), 10 mMol, pH = 4.97
0.0
1.0
2.0
3.0
4.0
0 100 200 300
Elapsed Time (min)
Con
cent
ratio
n (p
pm)
2,4-DAT 2A4NT 4A2NT
Figure A.16b Exp #16 – 20 ppm 2,4-DNT, 10mMol Formic acid, pH = 4.97 (F) Byproduct Distribution (G) Known Daughter Products
(F)
(G)

132
Influent vs Effluent 2,4-DNT Concentration2,4-DNT (20ppm), 10 mMol, pH = 6.06
0
5
10
15
20
0 50 100 150 200 250 300
Elapsed Time (min)
Con
c (p
pm)
Influent Effluent
Removal Fraction2,4-DNT (20ppm), 10 mMol, pH = 6.06
0.840.860.880.900.920.94
0.0 2.0 4.0 6.0 8.0 10.0
Clm (ppm)
Rem
oval
Fra
ctio
n
Effluent pH over Time2,4-DNT (20ppm), 10 mMol, pH = 6.06
7.10
7.20
7.30
7.40
0 100 200 300
Time (min)
pH
Degradation Rate vs Clm2,4-DNT (20ppm), 10 mMol, pH = 6.06
0.00
5.00
10.00
15.00
20.00
0.00 2.00 4.00 6.00 8.00 10.00Clm (ppm)
dC/d
t (pp
m/m
in)
Degradation Rate vs Clm2,4-DNT (20ppm), 10 mMol, pH = 6.06
0.00
0.02
0.04
0.06
0.08
0.10
0.00 0.01 0.02 0.03 0.04 0.05
Clm (mMol)
dC/d
t (m
Mol
/min
)
Figure A.17a Exp #17 – 20 ppm 2,4-DNT, 10mMol Formic acid, pH = 6.06 (A) Influent vs. Effluent 2,4-DNT Concentration (B) Removal vs. Clm (ppm) (C) Effluent pH vs. Time (D) Degradation Rate vs. Clm (ppm) (E) Degradation Rate vs. Clm (mMol)
(E)
(A) (B)
(C) (D)

133
Byproduct Distribution2,4-DNT (20ppm), 10 mMol, pH = 6.06
0.000.020.040.060.080.100.12
0 50 100 150 200 250 300
Time (min)
mm
ole/
L
0
10
20
30
40
50
60
% Id
Influent Effluent 2,4-DAT 4A2NT 2A4NT Sum % Identified
Known Daughter Products2,4-DNT (20ppm), 10 mMol, pH = 6.06
0.0
1.0
2.0
3.0
4.0
5.0
0 100 200 300
Elapsed Time (min)
Con
cent
ratio
n (p
pm)
2,4-DAT 2A4NT 4A2NT
Figure A.17b Exp #17 – 20 ppm 2,4-DNT, 10mMol Formic acid, pH = 6.06 (F) Byproduct Distribution (G) Known Daughter Products
(F)
(G)

134
Influent vs Effluent 2,4-DNT Concentration2,4-DNT (40ppm), 10 mMol, pH = 3.97
0
10
20
30
40
0 50 100 150 200 250 300
Elapsed Time (min)
Con
c (p
pm)
Influent Effluent
Removal Fraction2,4-DNT (40ppm), 10 mMol, pH = 3.97
0.910.920.930.940.950.96
0.0 5.0 10.0 15.0
Clm (ppm)
Rem
oval
Fra
ctio
n
Effluent pH over Time2,4-DNT (40ppm), 10 mMol, pH = 3.97
4.304.404.504.604.70
0 100 200 300
Time (min)
pH
Degradation Rate vs Clm2,4-DNT (40ppm), 10 mMol, pH = 3.97
0.00
10.00
20.00
30.00
40.00
0.00 5.00 10.00 15.00Clm (ppm)
dC/d
t (pp
m/m
in)
Degradation Rate vs Clm2,4-DNT (40ppm), 10 mMol, pH = 3.97
0.00
0.05
0.10
0.15
0.20
0.25
0.00 0.02 0.04 0.06 0.08
Clm (mMol)
dC/d
t (m
Mol
/min
)
Figure A.18a Exp #18 – 40 ppm 2,4-DNT, 10mMol Formic acid, pH = 3.97 (A) Influent vs. Effluent 2,4-DNT Concentration (B) Removal vs. Clm (ppm) (C) Effluent pH vs. Time (D) Degradation Rate vs. Clm (ppm) (E) Degradation Rate vs. Clm (mMol)
(E)
(A) (B)
(C) (D)

135
Byproduct Distribution2,4-DNT (40ppm), 10 mMol, pH = 3.97
0.00
0.05
0.10
0.15
0.20
0.25
0 50 100 150 200 250 300
Time (min)
mm
ole/
L
051015202530354045
% Id
Influent Effluent 2,4-DAT 4A2NT 2A4NT Sum % Identified
Known Daughter Products2,4-DNT (40ppm), 10 mMol, pH = 3.97
0.0
2.0
4.0
6.0
8.0
10.0
0 100 200 300
Elapsed Time (min)
Con
cent
ratio
n (p
pm)
2,4-DAT 2A4NT 4A2NT
Figure A.18b Exp #18 – 40 ppm 2,4-DNT, 10mMol Formic acid, pH = 3.97 (F) Byproduct Distribution (G) Known Daughter Products
(F)
(G)

136
Influent vs Effluent 2,4-DNT Concentration2A4NT (20ppm), 4 mMol, pH = 4.00
0
5
10
15
20
0 50 100 150 200 250 300
Elapsed Time (min)
Con
c (p
pm)
Influent Effluent
Removal Fraction2A4NT (20ppm), 4 mMol, pH = 4.00
0.920.930.930.940.940.950.950.96
0.0 2.0 4.0 6.0 8.0
Clm (ppm)
Rem
oval
Fra
ctio
n
Effluent pH over Time2A4NT (20ppm), 4 mMol, pH = 4.00
4.504.604.704.804.90
0 100 200 300
Time (min)
pH
Degradation Rate vs Clm2A4NT (20ppm), 4 mMol, pH = 4.00
0.00
5.00
10.00
15.00
20.00
0.00 2.00 4.00 6.00 8.00Clm (ppm)
dC/d
t (pp
m/m
in)
Degradation Rate vs Clm2A4NT (20ppm), 4 mMol, pH = 4.00
0.000.020.040.060.080.100.120.14
0.00 0.01 0.02 0.03 0.04 0.05
Clm (mMol)
dC/d
t (m
Mol
/min
)
Figure A.19a Exp #19 – 20 ppm 2A4NT, 4mMol Formic acid, pH = 4.00 (A) Influent vs. Effluent 2A4NT Concentration (B) Removal vs. Clm (ppm) (C) Effluent pH vs. Time (D) Degradation Rate vs. Clm (ppm) (E) Degradation Rate vs. Clm (mMol)
(E)
(A) (B)
(C) (D)

137
Byproduct Distribution2A4NT (20ppm), 4 mMol, pH = 4.00
0.000.020.040.060.080.100.120.14
0 50 100 150 200 250 300
Time (min)
mm
ole/
L
05101520253035404550
% Id
Influent Effluent 2,4-DAT Sum % Identified
Known Daughter Products2A4NT (20ppm), 4 mMol, pH = 4.00
0.01.02.03.04.05.06.0
0 100 200 300
Elapsed Time (min)
Con
cent
ratio
n (p
pm)
2,4-DAT
Figure A.19b Exp #19 – 20 ppm 2A4NT, 4mMol Formic acid, pH = 4.00 (F) Byproduct Distribution (G) Known Daughter Products
(F)
(G)

138
Influent vs Effluent 2,4-DNT Concentration2,4-DNT (40ppm), 4 mMol, pH = 4.00
0
10
20
30
40
0 50 100 150 200 250 300
Elapsed Time (min)
Con
c (p
pm)
Influent Effluent
Removal Fraction2,4-DNT (40ppm), 4 mMol, pH = 4.00
0.880.900.920.940.960.98
0.0 5.0 10.0 15.0
Clm (ppm)
Rem
oval
Fra
ctio
n
Effluent pH over Time2,4-DNT (40ppm), 4 mMol, pH = 4.00
4.404.604.805.005.20
0 100 200 300
Time (min)
pH
Degradation Rate vs Clm2,4-DNT (40ppm), 4 mMol, pH = 4.00
0.00
10.00
20.00
30.00
40.00
0.00 5.00 10.00 15.00Clm (ppm)
dC/d
t (pp
m/m
in)
Degradation Rate vs Clm2,4-DNT (40ppm), 4 mMol, pH = 4.00
0.00
0.05
0.10
0.15
0.20
0.25
0.00 0.02 0.04 0.06 0.08
Clm (mMol)
dC/d
t (m
Mol
/min
)
Figure A.20a Exp #20 – 40 ppm 2,4-DNT, 4mMol Formic acid, pH = 4.00 (A) Influent vs. Effluent 2,4-DNT Concentration (B) Removal vs. Clm (ppm) (C) Effluent pH vs. Time (D) Degradation Rate vs. Clm (ppm) (E) Degradation Rate vs. Clm (mMol)
(E)
(A) (B)
(C) (D)

139
Byproduct Distribution2,4-DNT (40ppm), 4 mMol, pH = 4.00
0.00
0.05
0.10
0.15
0.20
0.25
0 50 100 150 200 250 300
Time (min)
mm
ole/
L
05101520253035404550
% Id
Influent Effluent 2,4-DAT 4A2NT 2A4NT Sum % Identified
Known Daughter Products2,4-DNT (40ppm), 4 mMol, pH = 4.00
0.0
2.0
4.0
6.0
8.0
10.0
0 100 200 300
Elapsed Time (min)
Con
cent
ratio
n (p
pm)
2,4-DAT 2A4NT 4A2NT
Figure A.20b Exp #20 – 40 ppm 2,4-DNT, 4mMol Formic acid, pH = 4.00 (F) Byproduct Distribution (G) Known Daughter Products
(F)
(G)

140
Influent vs Effluent 2,4-DNT Concentration2,4-DNT (40ppm), 1 mMol, pH = 4.00
0
10
20
30
40
0 50 100 150 200 250 300
Elapsed Time (min)
Con
c (p
pm)
Influent Effluent
Removal Fraction2,4-DNT (40ppm), 1 mMol, pH = 4.00
0.400.500.600.700.800.901.00
0.0 5.0 10.0 15.0 20.0 25.0
Clm (ppm)
Rem
oval
Fra
ctio
n
Effluent pH over Time2,4-DNT (40ppm), 1 mMol, pH = 4.00
5.80
6.00
6.20
6.40
0 100 200 300
Time (min)
pH
Degradation Rate vs Clm2,4-DNT (40ppm), 1 mMol, pH = 4.00
0.00
5.00
10.00
15.00
20.00
25.00
0.00 5.00 10.00 15.00 20.00 25.00Clm (ppm)
dC/d
t (pp
m/m
in)
Degradation Rate vs Clm2,4-DNT (40ppm), 1 mMol, pH = 4.00
0.000.020.040.060.080.100.12
0.00 0.02 0.04 0.06 0.08 0.10 0.12 0.14
Clm (mMol)
dC/d
t (m
Mol
/min
)
Figure A.21a Exp #21 – 40 ppm 2,4-DNT, 1mMol Formic acid, pH = 4.00 (A) Influent vs. Effluent 2,4-DNT Concentration (B) Removal vs. Clm (ppm) (C) Effluent pH vs. Time (D) Degradation Rate vs. Clm (ppm) (E) Degradation Rate vs. Clm (mMol)
(E)
(A) (B)
(C) (D)

141
Byproduct Distribution2,4-DNT (40ppm), 1 mMol, pH = 4.00
0.00
0.05
0.10
0.15
0.20
0.25
0 50 100 150 200 250 300
Time (min)
mm
ole/
L
0
10
20
30
40
50
60
70
80
% Id
Influent Effluent 2,4-DAT 4A2NT 2A4NT Sum % Identified
Known Daughter Products2,4-DNT (40ppm), 1 mMol, pH = 4.00
0.0
1.0
2.0
3.0
4.0
5.0
0 100 200 300
Elapsed Time (min)
Con
cent
ratio
n (p
pm)
2,4-DAT 2A4NT 4A2NT
Figure A.21b Exp #21 – 40 ppm 2,4-DNT, 1mMol Formic acid, pH = 4.00 (F) Byproduct Distribution (G) Known Daughter Products
(F)
(G)

142
Influent vs Effluent 2,4-DNT Concentration2,4-DNT (20ppm), 4 mMol, pH = 4.00
05
10152025
0 50 100 150 200 250 300
Elapsed Time (min)
Con
c (p
pm)
Influent Effluent
Removal Fraction2,4-DNT (20ppm), 4 mMol, pH = 4.00
0.88
0.90
0.92
0.94
0.96
0.0 2.0 4.0 6.0 8.0
Clm (ppm)
Rem
oval
Fra
ctio
n
Effluent pH over Time2,4-DNT (20ppm), 4 mMol, pH = 4.00
4.504.604.704.804.905.00
0 100 200 300
Time (min)
pH
Degradation Rate vs Clm2,4-DNT (20ppm), 4 mMol, pH = 4.00
0.00
5.00
10.00
15.00
20.00
0.00 2.00 4.00 6.00 8.00Clm (ppm)
dC/d
t (pp
m/m
in)
Degradation Rate vs Clm2,4-DNT (20ppm), 4 mMol, pH = 4.00
0.000.020.040.060.080.100.12
0.00 0.01 0.02 0.03 0.04 0.05
Clm (mMol)
dC/d
t (m
Mol
/min
)
Figure A.22a Exp #22 – 20 ppm 2,4-DNT, 4mMol Formic acid, pH = 4.00 (A) Influent vs. Effluent 2,4-DNT Concentration (B) Removal vs. Clm (ppm) (C) Effluent pH vs. Time (D) Degradation Rate vs. Clm (ppm) (E) Degradation Rate vs. Clm (mMol)
(E)
(A) (B)
(C) (D)

143
Byproduct Distribution2,4-DNT (20ppm), 4 mMol, pH = 4.00
0.000.020.040.060.080.100.12
0 50 100 150 200 250 300
Time (min)
mm
ole/
L
0
5
10
15
20
25
30
35
40
% Id
Influent Effluent 2,4-DAT 4A2NT 2A4NT Sum % Identified
Known Daughter Products2,4-DNT (20ppm), 4 mMol, pH = 4.00
0.0
1.0
2.0
3.0
4.0
0 100 200 300
Elapsed Time (min)
Con
cent
ratio
n (p
pm)
2,4-DAT 2A4NT 4A2NT
Figure A.22b Exp #22 – 20 ppm 2,4-DNT, 4mMol Formic acid, pH = 4.00 (F) Byproduct Distribution (G) Known Daughter Products
(F)
(G)

144
Influent vs Effluent 2,4-DNT Concentration2,4-DNT (100ppm), 1 mMol, pH = 4.00
020406080
100120
0 50 100 150 200 250 300 350
Elapsed Time (min)
Con
c (p
pm)
Influent Effluent
Removal Fraction2,4-DNT (100ppm), 1 mMol, pH = 4.00
0.00
0.20
0.40
0.60
0.80
0.0 20.0 40.0 60.0 80.0
Clm (ppm)
Rem
oval
Fra
ctio
n
Effluent pH over Time2,4-DNT (100ppm), 1 mMol, pH = 4.00
5.605.806.006.206.406.60
0 100 200 300
Time (min)
pH
Degradation Rate vs Clm2,4-DNT (100ppm), 1 mMol, pH = 4.00
0.00
10.00
20.00
30.00
40.00
50.00
0.00 20.00 40.00 60.00 80.00Clm (ppm)
dC/d
t (pp
m/m
in)
Degradation Rate vs Clm2,4-DNT (100ppm), 1 mMol, pH = 4.00
0.00
0.05
0.10
0.15
0.20
0.25
0.00 0.10 0.20 0.30 0.40 0.50
Clm (mMol)
dC/d
t (m
Mol
/min
)
Figure A.23a Exp #23 – 100 ppm 2,4-DNT, 1mMol Formic acid, pH = 4.00 (A) Influent vs. Effluent 2,4-DNT Concentration (B) Removal vs. Clm (ppm) (C) Effluent pH vs. Time (D) Degradation Rate vs. Clm (ppm) (E) Degradation Rate vs. Clm (mMol)
(E)
(A) (B)
(C) (D)

145
Byproduct Distribution2,4-DNT (100ppm), 1 mMol, pH = 4.00
0.000.100.200.300.400.500.60
0 50 100 150 200 250 300
Time (min)
mm
ole/
L
0102030405060708090
% Id
Influent Effluent 2,4-DAT 4A2NT 2A4NT Sum % Identified
Known Daughter Products2,4-DNT (100ppm), 1 mMol, pH = 4.00
0.0
2.0
4.0
6.0
8.0
0 100 200 300
Elapsed Time (min)
Con
cent
ratio
n (p
pm)
2,4-DAT 2A4NT 4A2NT
Figure A.23b Exp #23 – 100 ppm 2,4-DNT, 1mMol Formic acid, pH = 4.00 (F) Byproduct Distribution (G) Known Daughter Products
(F)
(G)

146
Influent vs Effluent 2,4-DNT Concentration2,4-DNT (100ppm), 1 mMol, pH = 5.05
020406080
100120
0 50 100 150 200 250 300
Elapsed Time (min)
Con
c (p
pm)
Influent Effluent
Removal Fraction2,4-DNT (100ppm), 1 mMol, pH = 5.05
-0.80-0.60-0.40-0.200.000.200.400.60
0.0 20.0 40.0 60.0 80.0 100.0
Clm (ppm)
Rem
oval
Fra
ctio
n
Effluent pH over Time2,4-DNT (100ppm), 1 mMol, pH = 5.05
7.00
7.10
7.20
7.30
0 100 200 300
Time (min)
pH
Degradation Rate vs Clm2,4-DNT (100ppm), 1 mMol, pH = 5.05
-10.00
0.00
10.00
20.00
30.00
40.00
0.00 20.00 40.00 60.00 80.00 100.00
Clm (ppm)dC
/dt (
ppm
/min
)
Degradation Rate vs Clm2,4-DNT (100ppm), 1 mMol, pH = 5.05
-0.05
0.00
0.05
0.10
0.15
0.20
0.25
0.00 0.10 0.20 0.30 0.40 0.50
Clm (mMol)
dC/d
t (m
Mol
/min
)
Figure A.24a Exp #24 – 100 ppm 2,4-DNT, 1mMol Formic acid, pH = 5.05 (A) Influent vs. Effluent 2,4-DNT Concentration (B) Removal vs. Clm (ppm) (C) Effluent pH vs. Time (D) Degradation Rate vs. Clm (ppm) (E) Degradation Rate vs. Clm (mMol)
(E)
(A) (B)
(C) (D)

147
Byproduct Distribution2,4-DNT (100ppm), 1 mMol, pH = 5.05
0.000.100.200.300.400.500.60
0 50 100 150 200 250 300
Time (min)
mm
ole/
L
020406080100120140160180
% Id
Influent Effluent 2,4-DAT 4A2NT 2A4NT Sum % Identified
Known Daughter Products2,4-DNT (100ppm), 1 mMol, pH = 5.05
0.00.51.01.52.02.53.03.5
0 100 200 300
Elapsed Time (min)
Con
cent
ratio
n (p
pm)
2,4-DAT 2A4NT 4A2NT
Figure A.24b Exp #24 – 100 ppm 2,4-DNT, 1mMol Formic acid, pH = 5.05 (F) Byproduct Distribution (G) Known Daughter Products
(F)
(G)

148
APPENDIX B
UNKNOWN BYPRODUCT RESULTS

149
Unknown Byproducts vs Time2,4-DAT (20ppm), 4 mMol, pH = 3.96
02,0004,0006,0008,000
10,00012,00014,000
0 50 100 150 200
Time (min)
HPL
C R
espo
nse
Unk at 2.5 min
Unknown Byproducts vs Time2,4-DNT (15ppm), 4 mMol, pH = 4.00
0
2,000
4,000
6,000
8,000
10,000
0 100 200 300
Time (min)
HPL
C R
espo
nse
Unk at 2.5 min Unk at 3.4 min Unk at 4.0 min
Figure B.1 Exp #9 – 20 ppm 2,4-DAT, 4mMol Formic acid, pH = 3.96 Unknown Byproducts at HPLC Time
Figure B.2 Exp #12 – 15 ppm 2,4-DNT, 4mMol Formic acid, pH = 4.00 Unknown Byproducts at HPLC Time

150
Unknown Byproducts vs Time2,4-DNT (20ppm), 4 mMol, pH = 5.06
01,0002,0003,0004,0005,0006,0007,000
0 50 100 150 200
Time (min)
HPL
C R
espo
nse
Unk at 2.5 min Unk at 3.4 min Unk at 4.0 min
Unknown Byproducts vs Time2,4-DNT (20ppm), 4 mMol, pH = 6.06
0500
1,0001,5002,0002,5003,0003,5004,000
0 50 100 150 200
Time (min)
HPL
C R
espo
nse
Unk at 2.5 min Unk at 3.4 min Unk at 4.0 min
Figure B.3 Exp #13 – 20 ppm 2,4-DNT, 4mMol Formic acid, pH = 5.06 Unknown Byproducts at HPLC Time
Figure B.4 Exp #14 – 20 ppm 2,4-DNT, 4mMol Formic acid, pH = 6.06 Unknown Byproducts at HPLC Time

151
Unknown Byproducts vs Time2,4-DNT (20ppm), 10 mMol, pH = 4.04
02,0004,0006,0008,000
10,00012,00014,000
0 100 200 300
Time (min)
HPL
C R
espo
nse
Unk at 2.5 min Unk at 3.4 min Unk at 4.0 min
Unknown Byproducts vs Time2,4-DNT (20ppm), 10 mMol, pH = 4.97
02,0004,0006,0008,000
10,00012,00014,00016,000
0 50 100 150 200
Time (min)
HPL
C R
espo
nse
Unk at 2.5 min Unk at 3.4 min Unk at 4.0 min
Figure B.5 Exp #15 – 20 ppm 2,4-DNT, 10mMol Formic acid, pH = 4.04 Unknown Byproducts at HPLC Time
Figure B.6 Exp #16 – 20 ppm 2,4-DNT, 10mMol Formic acid, pH = 4.97 Unknown Byproducts at HPLC Time

152
Unknown Byproducts vs Time2,4-DNT (20ppm), 10 mMol, pH = 6.06
02,0004,0006,0008,000
10,00012,000
0 100 200 300
Time (min)
HPL
C R
espo
nse
Unk at 2.5 min Unk at 3.4 min Unk at 4.0 min
Unknown Byproducts vs Time2,4-DNT (40ppm), 10 mMol, pH = 3.97
05,000
10,00015,00020,00025,00030,000
0 100 200 300
Time (min)
HPL
C R
espo
nse
Unk at 2.5 min Unk at 3.4 min Unk at 4.0 min
Figure B.7 Exp #17 – 20 ppm 2,4-DNT, 10mMol Formic acid, pH = 6.06 Unknown Byproducts at HPLC Time
Figure B.8 Exp #18 – 40 ppm 2,4-DNT, 10mMol Formic acid, pH = 3.97 Unknown Byproducts at HPLC Time

153
Unknown Byproducts vs Time2A4NT (20ppm), 4 mMol, pH = 4.00
02,0004,0006,0008,000
10,00012,000
0 100 200 300
Time (min)
HPL
C R
espo
nse
Unk at 2.5 min Unk at 3.4 min Unk at 4.0 min
Unknown Byproducts vs Time2,4-DNT (40ppm), 4 mMol, pH = 4.00
0
10,000
20,000
30,000
40,000
50,000
0 100 200 300
Time (min)
HPL
C R
espo
nse
Unk at 2.5 min Unk at 3.4 min Unk at 4.0 min
Figure B.9 Exp #19 – 20 ppm 2A4NT, 4mMol Formic acid, pH = 4.00 Unknown Byproducts at HPLC Time
Figure B.10 Exp #20 – 40 ppm 2,4-DNT, 4mMol Formic acid, pH = 4.00 Unknown Byproducts at HPLC Time

154
Unknown Byproducts vs Time2,4-DNT (40ppm), 1 mMol, pH = 4.00
0
2,000
4,000
6,000
8,000
10,000
0 100 200 300
Time (min)
HPL
C R
espo
nse
Unk at 2.5 min Unk at 3.4 min Unk at 4.0 min
Unknown Byproducts vs Time2,4-DNT (20ppm), 4 mMol, pH = 4.00
0
5,000
10,000
15,000
20,000
0 100 200 300
Time (min)
HPL
C R
espo
nse
Unk at 2.5 min Unk at 3.4 min Unk at 4.0 min
Figure B.11 Exp #21 – 40 ppm 2,4-DNT, 1mMol Formic acid, pH = 4.00 Unknown Byproducts at HPLC Time
Figure B.12 Exp #22 – 20 ppm 2,4-DNT, 4mMol Formic acid, pH = 4.00 Unknown Byproducts at HPLC Time
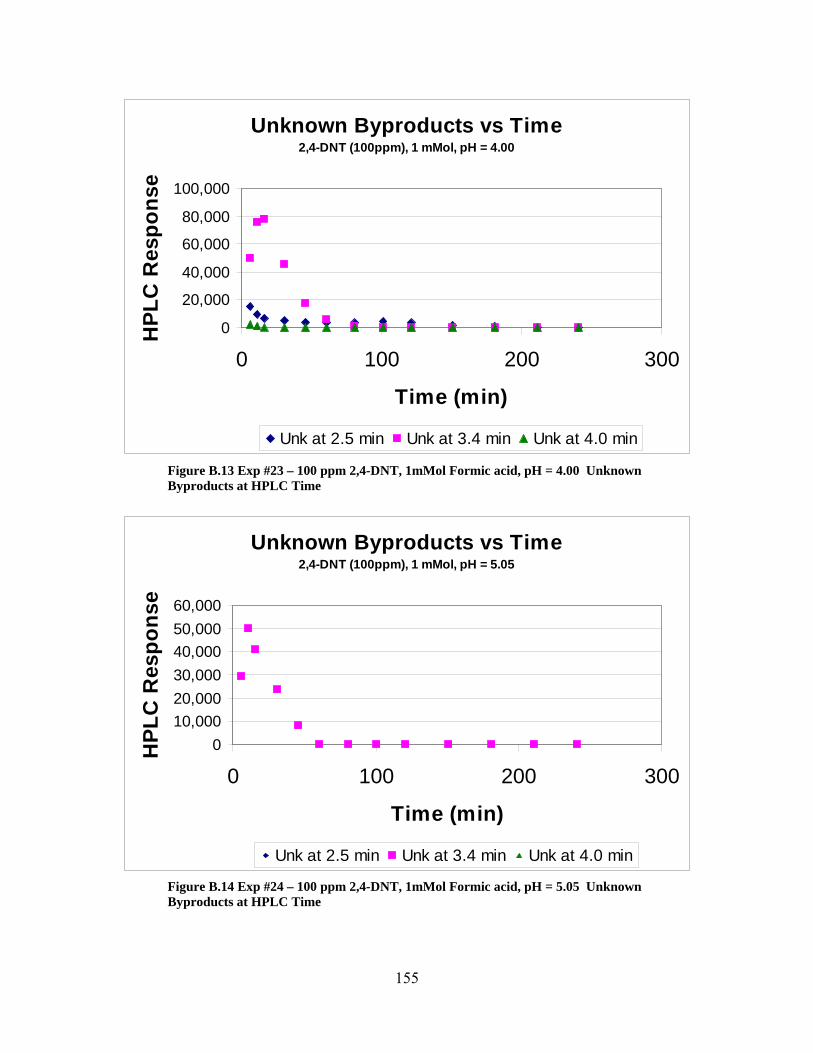
155
Unknown Byproducts vs Time2,4-DNT (100ppm), 1 mMol, pH = 4.00
0
20,000
40,000
60,000
80,000
100,000
0 100 200 300
Time (min)
HPL
C R
espo
nse
Unk at 2.5 min Unk at 3.4 min Unk at 4.0 min
Unknown Byproducts vs Time2,4-DNT (100ppm), 1 mMol, pH = 5.05
010,00020,00030,00040,00050,00060,000
0 100 200 300
Time (min)
HPL
C R
espo
nse
Unk at 2.5 min Unk at 3.4 min Unk at 4.0 min
Figure B.13 Exp #23 – 100 ppm 2,4-DNT, 1mMol Formic acid, pH = 4.00 Unknown Byproducts at HPLC Time
Figure B.14 Exp #24 – 100 ppm 2,4-DNT, 1mMol Formic acid, pH = 5.05 Unknown Byproducts at HPLC Time

156
APPENDIX C
CONTAMINANT HPLC STANDARDS

157
2,4-DNT
2,4-dinitrotoluene
Standard run through HPLC, 27 Oct 2003 2,4-DNT 2,4-dinitrotoluene
Time Concentration (ppm) Area 7.073 100 6,434,4277.020 20 1,301,9256.955 10 620,5007.058 2 119,487
Table C.1 HPLC Data for 2,4-DNT Standard
2,4-DNT Standards y = 1.553988E-05xR2 = 9.999671E-01
0
20
40
60
80
100
120
0 1,000,000 2,000,000 3,000,000 4,000,000 5,000,000 6,000,000 7,000,000
Area (HPLC)
Con
c (p
pm)
2,4-DNT
Linear (2,4-DNT)
Figure C.1 HPLC Standard Curve with Linear Regression for 2,4-DNT.

158
2A4NT
2-amino-4-nitrotoluene
Standard run through HPLC, 12 Oct 2003 2A4NT 2-amino-4-nitrotoluene
Time Concentration (ppm) Area 5.095 200 11,333,7825.043 50 2,953,0705.043 20 1,131,0395.068 10 566,0355.070 2 136,530
Supplemental test 11 Nov 03
Time Concentration (ppm) Area 5.003 10 544,595
Table C.2 HPLC Data for 2A4NT Standard
2A4NT Standards y = 1.760143E-05xR2 = 9.998397E-01
0
50
100
150
200
250
0 2,000,000 4,000,000 6,000,000 8,000,000 10,000,000 12,000,000
Area (HPLC)
Con
c (p
pm)
2A4NTLinear (2A4NT)
Figure C.2 HPLC Standard Curve with Linear Regression for 2A4NT.

159
4A2NT
4-amino-2-nitrotoluene
Standard run through HPLC, 11 Oct 2003 4A2NT 4-amino-2-nitrotoluene
Time Concentration (ppm) Area 4.873 100 4,119,8844.856 50 2,106,0794.846 20 842,3164.856 10 424,6074.863 2 89,164
Supplemental test 11 Nov 03
Time Concentration (ppm) Area 4.763 10 407,847
Table C.3 HPLC Data for 4A2NT Standard
4A2NT Standards y = 2.414350E-05xR2 = 9.998116E-01
0
20
40
60
80
100
120
0 1,000,000 2,000,000 3,000,000 4,000,000 5,000,000
Area (HPLC)
Con
c (p
pm)
4A2NTLinear (4A2NT)
Figure C.3 HPLC Standard Curve with Linear Regression for 4A2NT.

160
2,4-DAT
2,4-diaminotoluene
Standards run through HPLC, 18 Aug 2003 2,4-DAT 2,4-diaminotoluene
Time Concentration (ppm) Area 2.885 100 2,016,0862.878 50 1,012,2392.898 20 412,0792.893 10 199,9752.873 2 48,8702.891 2 38,008
Table C.4 HPLC Data for 2,4-DAT Standard
2-DAT Standards y = 4.952714E-05xR2 = 9.999447E-01
020406080
100120
0 500,000 1,000,000
1,500,000
2,000,000
2,500,000
Area (HPLC)
Con
c (p
pm)
2,4-DATLinear (2,4-DAT)
Figure C.4 HPLC Standard Curve with Linear Regression for 2,4-DAT.

161
2-NT
2-nitrotoluene
Standards run through HPLC, 22 Aug 2003 2-NT 2-nitrotoluene
Time Concentration (ppm) Area7.333 100 2,849,5147.313 50 1,476,6927.371 20 584,9987.351 10 295,0347.320 2 62,643
Table C.5 HPLC Data for 2-NT Standard
2-NT Standards y = 3.480320E-05xR2 = 9.995515E-01
0
20
40
60
80
100
120
0 500,000 1,000,000 1,500,000 2,000,000 2,500,000 3,000,000
Area (HPLC)
Con
c (p
pm)
2-NTLinear (2-NT)
Figure C.5 HPLC Standard Curve with Linear Regression for 2-NT.

162
2-aT
2-aminotoluene
Standards run through HPLC, 22 Aug 2003 2-aT 2-aminotoluene Time Concentration (ppm) Area 4.280 100 1,045,0524.281 50 543,0374.270 20 223,0664.271 10 99,8604.288 2 22,115Table C.6 HPLC Data for 2-aT Standard
2-aT Standards y = 9.477417E-05xR2 = 9.992694E-01
0
20
40
60
80
100
120
0 500,000 1,000,000 1,500,000
Area (HPLC)
Con
c (p
pm)
2-aTLinear (2-aT)
Figure C.6 HPLC Standard Curve with Linear Regression for 2-aT.

163
APPENDIX D
CONTAMINANT CHEMICAL
STRUCTURES

164
2,4,6-TNT
2,4,6-trinitrotoluene
2,4-DNT 2,6-DNT 2,4-dinitrotoluene 2,6-dinitrotoluene
CH3
NO2
NO2
NO2
CH3
NO2
NO2
CH3
NO2 NO2

165
2A4NT 4A2NT 2-amino-4-nitrotoluene 4-amino-2-nitrotoluene (2-methyl-5-nitroaniline) (4-methyl-3-nitroaniline)
2,4-DAT 2,4-diaminotoluene
(2,4-toluenediamine)
CH3
NH2
NO2
CH3
NO2
NH2
CH3
NH2
NH2

166
2-NT 2-aT 2-nitrotoluene 2-aminotoluene (ortho-nitrotoluene) (ortho-toluidine)
3-NT 3-aT 3-nitrotoluene 2-aminotoluene (meta-nitrotoluene) (meta-toluidine)
CH3 CH3
NH2
CH3
NO2
CH3
NH2
NO2

167
4-NT 4-aT 4-nitrotoluene 4-aminotoluene (para-nitrotoluene) (para-toluidine)
RDX HMX hexahydro-1,3,5-trinitro-1,3,5-triazine octahydro-1,3,5,7-tetranitro-1,3,5,7-tetrasocine
(Phillips, 2003)
CH3 CH3
NH2 NO2
168
REPORT DOCUMENTATION PAGE Form Approved OMB No. 074-0188
The public reporting burden for this collection of information is estimated to average 1 hour per response, including the time for reviewing instructions, searching existing data sources, gathering and maintaining the data needed, and completing and reviewing the collection of information. Send comments regarding this burden estimate or any other aspect of the collection of information, including suggestions for reducing this burden to Department of Defense, Washington Headquarters Services, Directorate for Information Operations and Reports (0704-0188), 1215 Jefferson Davis Highway, Suite 1204, Arlington, VA 22202-4302. Respondents should be aware that notwithstanding any other provision of law, no person shall be subject to an penalty for failing to comply with a collection of information if it does not display a currently valid OMB control number. PLEASE DO NOT RETURN YOUR FORM TO THE ABOVE ADDRESS. 1. REPORT DATE (DD-MM-YYYY) 23-03-2004
2. REPORT TYPE Master’s Thesis
3. DATES COVERED (From – To) Jun 2003 – Mar 2004
5a. CONTRACT NUMBER
5b. GRANT NUMBER
4. TITLE AND SUBTITLE AN EVALUATION OF FORMIC ACID AS AN ELECTRON DONOR FOR PALLADIUM (PD) CATALYZED DESTRUCTION OF NITROAROMATIC COMPOUNDS 5c. PROGRAM ELEMENT NUMBER
5d. PROJECT NUMBER 5e. TASK NUMBER
6. AUTHOR(S) Stevens, Mark, R., Captain, USAF
5f. WORK UNIT NUMBER
7. PERFORMING ORGANIZATION NAMES(S) AND ADDRESS(S) Air Force Institute of Technology Graduate School of Engineering and Management (AFIT/EN) 2950 Hobson Way, Building 641 WPAFB OH 45433-7765
8. PERFORMING ORGANIZATION REPORT NUMBER AFIT/GEM/ENV/04M-19
10. SPONSOR/MONITOR’S ACRONYM(S)
9. SPONSORING/MONITORING AGENCY NAME(S) AND ADDRESS(ES) HQ Air Force Center For Environmental Excellence/ERS ATTN: Ms. Erica S. K. Becvar, M.S. 3300 Sydney Brooks Brooks City-Base TX 78235-5112 DSN: 240-4314
11. SPONSOR/MONITOR’S REPORT NUMBER(S)
12. DISTRIBUTION/AVAILABILITY STATEMENT APPROVED FOR PUBLIC RELEASE; DISTRIBUTION UNLIMITED
13. SUPPLEMENTARY NOTES 14. ABSTRACT The Department of Defense is responsible for over 2,000 hazardous waste sites containing nitroaromatic compounds (NACs) such as 2,4,6-TNT, 2,4- and 2,6-DNT that resulted from the production and use of munitions throughout the nation and world. NACs are typically persistent in natural environments, though they can be oxidized or reduced under engineered conditions. NACs and their reduction products are toxic chemicals and suspected human carcinogens. Both TNT and 2,4-DNT are listed as priority pollutants by the US EPA. This study investigates the effectiveness of using a palladium (Pd) catalyst in concert with formic acid as an electron donor to reduce NACs. If the reduction reaction is rapid and complete, without producing hazardous daughter products, the process may have application as an in situ treatment technology to remediate NAC-contaminated groundwater. In this study, formic acid was added into NAC-contaminated water flowing through a laboratory column filled with Pd catalyst. Experimental results using 2,4-DNT as a model NAC indicate reduction rates are dependent on pH, formic acid concentrations, and NAC concentrations. At high NAC concentrations and high pH, reduction rates slowed.. Higher concentrations of formic acid led to greater extent and rates of 2,4-DNT reduction. The amines that would be expected to be produced from 2,4-DNT reduction were identified in the column effluent, along with several unidentified byproducts. Further research is required to identify and characterize the possible risks these unknown byproducts might pose. Based on experimentally observed reaction rates and removal efficiencies, there is potential that Pd-catalyzed reduction using formic acid as a reductant may have application as an in situ remediation technology to manage NAC-contaminated groundwater. 15. SUBJECT TERMS Nitroaromatic compounds (NACs), 2,4-DNT, palladium, formic acid, catalytic reduction
16. SECURITY CLASSIFICATION OF:
19a. NAME OF RESPONSIBLE PERSON Dr. Mark N. Goltz, ENV
REPORT U
ABSTRACT U
c. THIS PAGE U
17. LIMITATION OF ABSTRACT UU
18. NUMBER OF PAGES 186 19b. TELEPHONE NUMBER (Include area code)
(937) 255-3636, ext 4638; e-mail: [email protected]
Standard Form 298 (Rev: 8-98) Prescribed by ANSI Std. Z39-18