an evaluation of bias in the 2007 national household
TRANSCRIPT

An Evaluation of Bias in the 2007 National Household Education Surveys Program Results from a Special Data Collection Effort
NCES 2009–029 U.S. DEPARTMENT OF EDUCATION


An Evaluation of Bias in the 2007 National Household Education Surveys Program Results from a Special Data Collection Effort
MARCH 2009
Wendy Van de Kerckhove Jill M. Montaquila Priscilla R. Carver J. Michael Brick Westat Chris Chapman Project Officer National Center for Education Statistics
NCES 2009–029 U.S. DEPARTMENT OF EDUCATION


U.S. Department of Education Arne Duncan Secretary
Institute of Education Sciences Sue Betka Acting Director
National Center for Education Statistics Stuart Kerachsky Acting Commissioner
The National Center for Education Statistics (NCES) is the primary federal entity for collecting, analyzing, and reporting data related to education in the United States and other nations. It fulfills a congressional mandate to collect, collate, analyze, and report full and complete statistics on the condition of education in the United States; conduct and publish reports and specialized analyses of the meaning and significance of such statistics; assist state and local education agencies in improving their statistical systems; and review and report on education activities in foreign countries.
NCES activities are designed to address high-priority education data needs; provide consistent, reliable, complete, and accurate indicators of education status and trends; and report timely, useful, and high-quality data to the U.S. Department of Education, the Congress, the states, other education policymakers, practitioners, data users, and the general public. Unless specifically noted, all information contained herein is in the public domain.
We strive to make our products available in a variety of formats and in language that is appropriate to a variety of audiences. You, as our customer, are the best judge of our success in communicating information effectively. If you have any comments or suggestions about this or any other NCES product or report, we would like to hear from you. Please direct your comments to
National Center for Education Statistics Institute of Education Sciences U.S. Department of Education 1990 K Street NW Washington, DC 20006-5651
March 2009
The NCES World Wide Web Home Page address is http://nces.ed.gov. The NCES World Wide Web Electronic Catalog is http://nces.ed.gov/pubsearch.
Suggested Citation Van de Kerckhove, W., Montaquila, J.M., Carver, P. R., and Brick, J.M. (2008). An Evaluation of Bias in the 2007 National Households Education Surveys Program: Results From a Special Data Collection Effort (NCES 2009–029). National Center for Education Statistics, Institute of Education Sciences, U.S. Department of Education. Washington, DC.
For ordering information on this report, write to U.S. Department of Education ED Pubs P.O. Box 1398 Jessup, MD 20794-1398
or call toll free 1-877-4ED-Pubs or order online at http://www.edpubs.org.
Content Contact Christopher Chapman (202) 502-7414 [email protected]
iii
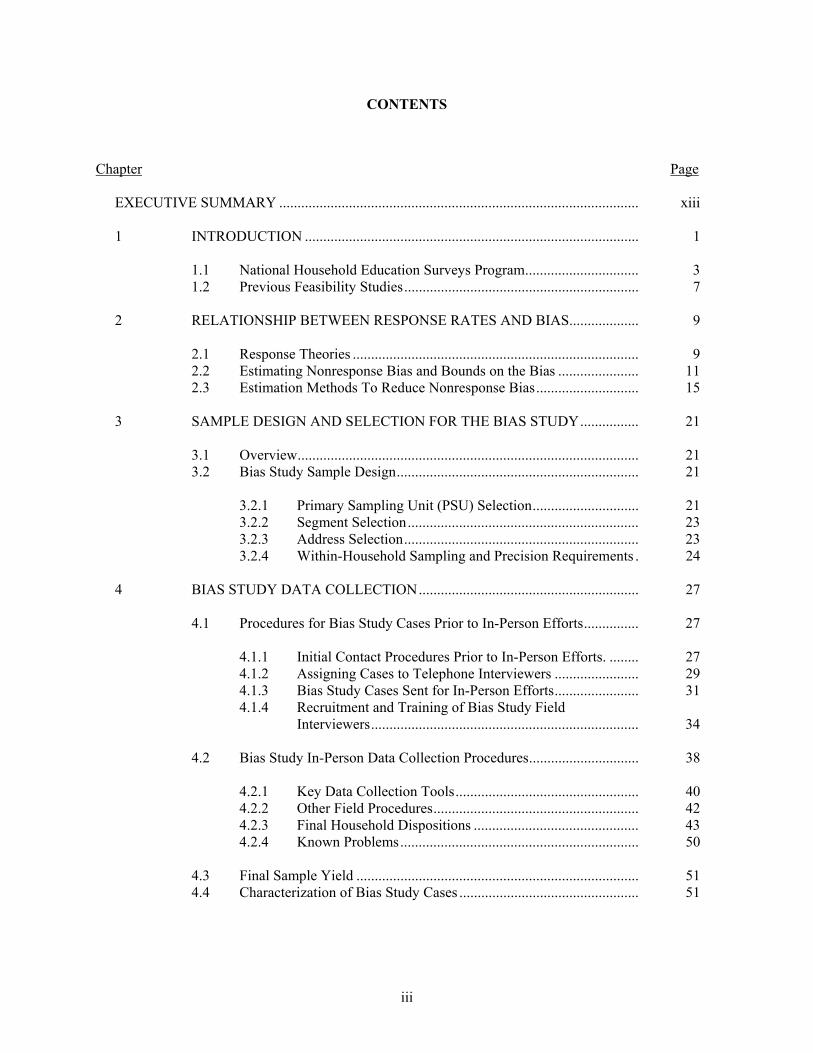
CONTENTS
Chapter Page
EXECUTIVE SUMMARY .................................................................................................. xiii 1 INTRODUCTION ........................................................................................... 1
1.1 National Household Education Surveys Program............................... 3 1.2 Previous Feasibility Studies................................................................ 7
2 RELATIONSHIP BETWEEN RESPONSE RATES AND BIAS................... 9
2.1 Response Theories .............................................................................. 9 2.2 Estimating Nonresponse Bias and Bounds on the Bias ...................... 11 2.3 Estimation Methods To Reduce Nonresponse Bias............................ 15
3 SAMPLE DESIGN AND SELECTION FOR THE BIAS STUDY................ 21
3.1 Overview............................................................................................. 21 3.2 Bias Study Sample Design.................................................................. 21
3.2.1 Primary Sampling Unit (PSU) Selection............................. 21 3.2.2 Segment Selection............................................................... 23 3.2.3 Address Selection................................................................ 23 3.2.4 Within-Household Sampling and Precision Requirements . 24
4 BIAS STUDY DATA COLLECTION............................................................ 27
4.1 Procedures for Bias Study Cases Prior to In-Person Efforts............... 27
4.1.1 Initial Contact Procedures Prior to In-Person Efforts. ........ 27 4.1.2 Assigning Cases to Telephone Interviewers ....................... 29 4.1.3 Bias Study Cases Sent for In-Person Efforts....................... 31 4.1.4 Recruitment and Training of Bias Study Field Interviewers......................................................................... 34
4.2 Bias Study In-Person Data Collection Procedures.............................. 38
4.2.1 Key Data Collection Tools.................................................. 40 4.2.2 Other Field Procedures........................................................ 42 4.2.3 Final Household Dispositions ............................................. 43 4.2.4 Known Problems................................................................. 50
4.3 Final Sample Yield ............................................................................. 51 4.4 Characterization of Bias Study Cases ................................................. 51

iv
Chapter Page
5 UNIT AND ITEM RESPONSE RATES......................................................... 67
5.1 Definition of Unit Response Rates ..................................................... 67 5.2 Screener Unit Response Rates ............................................................ 68 5.3 Extended Interview Unit Response Rates and Overall Unit Response Rates ................................................................................... 72 5.4 Item Response Rates........................................................................... 76
6 WEIGHTING................................................................................................... 79
6.1 Household-Level Weights .................................................................. 79 6.2 Person-Level Weights for the School Readiness (SR), Parent and Family Involvement in Education (PFI), and Adult Education for Work-Related Reasons (AEWR) Interviews ............... 83 6.3 Chi-Square Automatic Interaction Detection (CHAID) Analysis ...... 93 6.4 Sampling Errors .................................................................................. 95 6.5 Significance Tests ............................................................................... 97
7 AN OVERVIEW OF BIAS ............................................................................. 99
7.1 Methodological Considerations in Data Comparisons ....................... 99
7.1.1 General Comments on the Comparisons............................. 101 7.1.2 Other Data Considerations .................................................. 102
7.2 Comparison of NHES:2007 Bias Study Estimates to an External Source................................................................................... 102
7.2.1 Current Population Survey (CPS) ....................................... 102 7.2.2 Comparability of the NHES:2007 Bias Study and CPS Distributions................................................................ 103 7.2.3 Summary ............................................................................. 113
7.3 Effect of the Weighting Adjustments on Bias .................................... 113 7.4 An Examination of Overall Bias......................................................... 115
8 COMPONENTS OF BIAS .............................................................................. 141
8.1 An Examination of Nonresponse Bias................................................ 141 8.2 An Examination of Noncoverage Bias ............................................... 161
9 DISCUSSION.................................................................................................. 173 REFERENCES ................................................................................................ 177

v
Appendix Page
A Advance, Refusal, and Community Letters ..................................................... A-1 B Household Folder............................................................................................. B-1 C Interviewer Observation Form (IOF)............................................................... C-1 D Sorry I Missed You Card ................................................................................. D-1 E Appointment Card............................................................................................ E-1 F Field Non-Interview Report Form (NIRF) ...................................................... F-1 G Nonresponse Bias Estimates With Unadjusted Base Weights……………….. G-1
List of Tables
Table Page ES-1 Number of completed cases by data collection stage: NHES: 2007 RDD sample; NHES: 2007 Bias Study sample......................................................... xiv 1-1 Weighted unit response rates and percentage distribution of type of unit nonresponse for the NHES Screener:1991-2007.................................. 6 2-1 Bias in the unadjusted estimate of a percentage, by different ratios of response propensities ( )1
2 1λ φ φ−= .................................................................. 12 2-2 Relative percentage bias (bias divided by the percent of the population with the characteristic, expressed as a percentage) for the unadjusted estimate of a percentage, by different ratios of response propensities ( )1
2 1λ φ φ−= .......... 13 2-3 Percentage reduction in bias of estimate due to higher level of effort ( )κ , holding constant the ratio of response propensities at the higher level of effort ( )2 1.1λ = for different values of the ratio of response propensities at the lower level of effort ( )1λ ................................................................................. 14

vi
List of Tables
Table Page 3-1 Overview of the sampling scheme for selecting adults based on household composition: NHES:2007............................................................... 26 4-1 Distribution of Bias Study cases sent for in-person efforts: NHES:2007 Bias Study ........................................................................................................ 32 4-2 Final results of in-person data collection: NHES:2007 Bias Study ................. 45 4-3 Number of completed cases by data collection stage: NHES: 2007 RDD sample; NHES: 2007 Bias Study sample......................................................... 51 4-4 Distribution of Bias Study cases: NHES: 2007 Bias Study ............................. 52 4-5 Distributions of address dispositions for Bias Study cases finalized in the field: NHES: 2007 Bias Study ......................................................................... 53 4-6 Percentage of cases finalized in field and mean number of field attempts, by final household field disposition and TRC result: NHES:2007 Bias Study..... 58 4-7 Number and percentage of cases, by number of refusals and subgroups: NHES:2007 Bias Study ................................................................................... 60 4-8 Characteristics of Bias Study School Readiness (SR) respondents: NHES:2007 Bias Study ................................................................................... 61 4-9 Characteristics of Bias Study Parent and Family Involvement in Education (PFI) respondents: NHES:2007 Bias Study.................................... 62 4-10 Characteristics of Bias Study Adult Education for Work-Related Reasons (AEWR) respondents: NHES:2007 Bias Study................................. 64 5-1 Number of Screener cases attempted, by residential and response status, and weighted percentages of cases: NHES: 2007 Bias Study .............. 70 5-2 Weighted and unweighted Screener unit response rates for the RDD sample, the RDD mailable cases only, the Bias Study sample, and the Bias Study address-telephone matched only: NHES:2007 RDD and NHES:2007 Bias Study............................................................................. 70 5-3 Number and percent of households responding to the Screener, by sample type and type of extended interviews scheduled: NHES:2007 RDD and NHES:2007 Bias Study............................................................................. 71

vii
Table Page 5-4 Weighted Screener unit response rates for the NHES:2007 RDD sample,
reduced treatment NHES:2007 Bias Study sample, and full treatment NHES:2007 Bias Study sample, by selected characteristics............................ 73
5-5 Number of enumerated children and adults, by type of extended interview and final extended interview status: NHES:2007 RDD sample; NHES:2007 Bias Study sample, full treatment .................................. 75
5-6 Weighted unit response rates and overall unit response rates, by type of extended interview: NHES:2007 RDD sample; NHES:2007 Bias Study sample, full treatment ............................................................................ 75
6-1 Screener nonresponse adjustment cells: NHES:2007 Bias Study.................... 82
6-2 Control totals for poststratifying the NHES:2007 household-level weights: CPS:2006 ......................................................................................................... 83
6-3 School Readiness/Parent and Family Involvement in Education (SR/PFI)-NHES:2007 interview nonresponse adjustment cells: NHES:2007 Bias Study ................................................................................... 86
6-4 Adult Education for Work-Related Reasons (AEWR)-NHES:2007 interview nonresponse adjustment cells: NHES:2007 Bias Study................... 87
6-5 Control totals for raking the School Readiness (SR)-NHES:2007 person-level interview weights: NHES:2007 Bias Study ................................ 89
6-6 Control totals for raking the Parent and Family Involvement in Education (PFI)-NHES:2007 person-level interview weights: NHES:2007 Bias Study .. 90
6-7 Control totals for raking the Adult Education for Work-Related
Reasons (AEWR)-NHES:2007 person-level weights: NHES:2007 Bias Study ........................................................................................................ 92
7-1 Percentage distribution for age of subjects of interviews: SR-NHES:2007 Bias Study, PFI-NHES:2007 Bias Study, AEWR-NHES:2007 Bias Study, and CPS:2005 ............................................. 104
7-2 Number of children in kindergarten through grade 12, by school type and by student grade level: PFI-NHES:2007 Bias Study and CPS:2005 .................................................................................................. 105
7-3 Number and percentage of children in kindergarten through grade 12 enrolled in public and private schools: PFI-NHES:2007 Bias Study and CPS:2005 .................................................................................................. 106
7-4 Percentage of children ages 3 through 6 not yet enrolled in kindergarten, by household income: SR-NHES:2007 Bias Study and CPS:2005 ......................................................................................................... 107

viii
Table Page
7-5 Number and percentage of children ages 3 through 6 not yet enrolled in kindergarten, by household income and race/ethnicity: SR-NHES:2007 Bias Study and CPS:2005 ................................................................................ 107
7-6 Percentage of children in kindergarten through grade 12, by household income: PFI-NHES:2007 Bias Study and CPS:2005....................................... 108
7-7 Number and percentage of children in kindergarten through grade 12, by household income and race/ethnicity: PFI-NHES:2007 Bias Study and CPS:2005 .................................................................................................. 108
7-8 Number and percentage of children in kindergarten through grade 12 in public and private schools, by race/ethnicity: PFI-NHES: 2007 Bias Study and CPS:2005 ....................................................................... 109
7-9 Percentage of children in kindergarten through grade 12, by family structure and parents’ highest level of education: PFI-NHES:2007 Bias Study and CPS: 2005-2006.............................................................................. 110
7-10 Percentage distribution of the adult population, by sex and age: AEWR-NHES:2007 Bias Study and CPS:2006 .............................................. 111
7-11 Percentage distribution of the adult population, by highest educational attainment and race/ethnicity: AEWR-NHES:2007 Bias Study and CPS:2006 ......................................................................................................... 112
7-12 Percentage of adults who worked for pay or income in the past 12 months: AEWR-NHES:2007 Bias Study and CPS:2006............................ 112
7-13 Unadjusted, nonresponse adjusted, and final estimates for various characteristics from the School Readiness Survey:NHES:2007 RDD ............ 116
7-14 Unadjusted, nonresponse adjusted, and final estimates for various characteristics from the Parent and Family Involvement Survey: NHES:2007 RDD ............................................................................................ 120
7-15 Unadjusted, nonresponse adjusted, and final estimates for various characteristics from the Adult Education for Work-Related Reasons Survey:NHES:2007 RDD ................................................................................ 124
7-16 Estimates of overall bias for various characteristics from the School Readiness Survey:NHES:2007 RDD and NHES:2007 Bias Study ................. 128
7-17 Estimates of overall bias for various characteristics from the Parent and Family Involvement Suvey:NHES:2007 RDD and NHES:2007 Bias Study ........................................................................................................ 133
ix
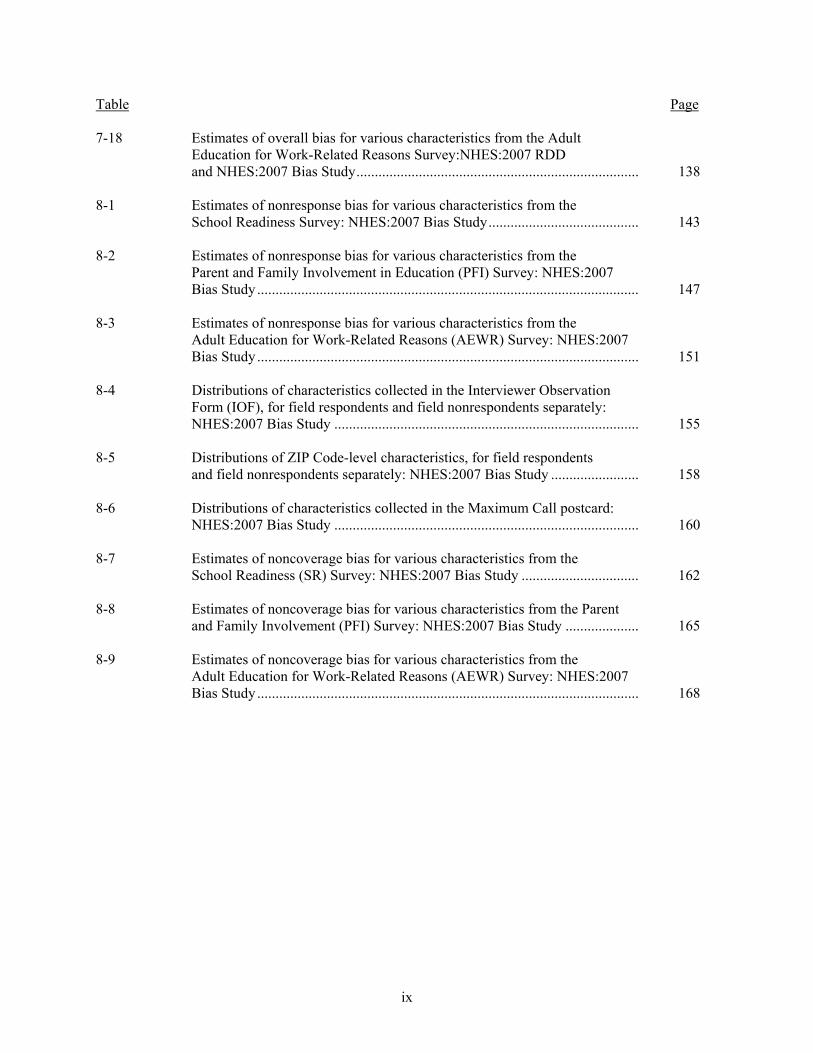
Table Page 7-18 Estimates of overall bias for various characteristics from the Adult
Education for Work-Related Reasons Survey:NHES:2007 RDD and NHES:2007 Bias Study............................................................................. 138
8-1 Estimates of nonresponse bias for various characteristics from the School Readiness Survey: NHES:2007 Bias Study......................................... 143
8-2 Estimates of nonresponse bias for various characteristics from the
Parent and Family Involvement in Education (PFI) Survey: NHES:2007 Bias Study ........................................................................................................ 147
8-3 Estimates of nonresponse bias for various characteristics from the Adult Education for Work-Related Reasons (AEWR) Survey: NHES:2007 Bias Study ........................................................................................................ 151
8-4 Distributions of characteristics collected in the Interviewer Observation Form (IOF), for field respondents and field nonrespondents separately: NHES:2007 Bias Study ................................................................................... 155
8-5 Distributions of ZIP Code-level characteristics, for field respondents and field nonrespondents separately: NHES:2007 Bias Study ........................ 158
8-6 Distributions of characteristics collected in the Maximum Call postcard: NHES:2007 Bias Study ................................................................................... 160
8-7 Estimates of noncoverage bias for various characteristics from the School Readiness (SR) Survey: NHES:2007 Bias Study ................................ 162
8-8 Estimates of noncoverage bias for various characteristics from the Parent and Family Involvement (PFI) Survey: NHES:2007 Bias Study .................... 165
8-9 Estimates of noncoverage bias for various characteristics from the Adult Education for Work-Related Reasons (AEWR) Survey: NHES:2007 Bias Study ........................................................................................................ 168

x
List of Appendix Tables
Table Page G-1 Unadjusted base weight estimates of nonresponse bias for various
characteristics from the School Readiness (SR) Survey: NHES:2007 Bias Study ........................................................................................................ G-1
G-2 Unadjusted base weight estimates of nonresponse bias for various characteristics from the Parent and Family Involvement in Education (PFI) Survey: NHES:2007 Bias Study ...................................................................... G-5
G-3 Unadjusted base weight estimates of nonresponse bias for various characteristics from the Adult Education for Work-Related Reasons (AEWR) Survey: NHES:2007 Bias Study ...................................................................... G-9
List of Figures
Figure Page 4-1 Total number of attempts to finalize a Screener for cases finalized in
the TRC: NHES:2007 Bias Study.................................................................... 54
4-2 Total number of attempts to finalize a Screener for telephone nonresponse cases: NHES:2007 Bias Study ......................................................................... 55
4-3 Total number of attempts to finalize a Screener for nonmatch and mismatch
cases: NHES:2007 Bias Study ......................................................................... 56
4-4 Number of attempts to ascertain residential status of household: NHES:2007 Bias Study ........................................................................................................ 57

xi
List of Exhibits
Exhibit Page ES-1 Data collection process for household Screeners: NHES: 2007 Bias Study
sample .............................................................................................................. xv
3-1 Strata used for PSU selection for the NHES:2007 Bias Study ........................ 22
3-2 Key design features of the NHES:2007 Bias Study......................................... 26
4-1 Data collection process for household Screeners: NHES: 2007 Bias Study sample .............................................................................................................. 28
4-2 NCES Affidavit of Nondisclosure: NHES:2007 Bias Study ........................... 36
4-3 Westat Confidentiality Pledge: NHES:2007 Bias Study ................................. 37
4-4 Household Information Sheet (HIS): NHES:2007 Bias Study ....................... 41
4-5 Telephone Center Non-Interview Report Form (NIRF): NHES:2007 Bias Study ........................................................................................................ 42 4-6 Final Household Field Disposition Codes: NHES:2007 Bias Study ............... 44
4-7 Maximum Call Postcard: NHES:2007 Bias Study .......................................... 46
4-8 Translation card text: NHES:2007 Bias Study ................................................ 47
4-9 Dwelling unit defined: NHES:2007 Bias Study .............................................. 49
4-10 Dwelling unit structure type: NHES:2007 Bias Study..................................... 49
5-1 Screener response status classification for the NHES:2007 Bias Study
sample .............................................................................................................. 69
6-1 Weighting factors to account for domain sampling for adults: NHES:2007 ... 85

This page is intentionally blank.

xiii
EXECUTIVE SUMMARY
The theory of sampling that is the basis for the majority of surveys conducted for the federal government assumes that accurate responses are obtained for all the sampled units and that the sample covers the target population. Surveys have always had some level of nonresponse, thus violating this assumption. To the extent that those who respond to surveys and those who do not are different in important ways, there is a potential for biases in estimates from survey data. As survey response rates decline, understanding the relationship between response rates and nonresponse bias has become even more important. Additionally, telephone survey methodologists are concerned with differences in telephone noncoverage rates, especially differential rates among population subgroups, such as those defined by region, age, race/ethnicity, and household composition, because they too can introduce bias in the estimates. The study described in this report was designed to examine bias in estimates from the 2007 National Household Education Surveys Program (NHES:2007) due to nonresponse from both refusals and noncontact cases, as well as bias due to noncoverage of households that only had cell phones and households without any telephones.
NHES is a random digit dialing (RDD) survey program developed by the National Center
for Education Statistics (NCES) in the Institute of Education Sciences, U.S. Department of Education. It is designed to collect information on important educational issues through telephone surveys of households in the United States. NHES has enabled NCES to gather data on a wide range of issues that cannot be measured in traditional institution-based data collections, such as early childhood care and education, children’s readiness for school, parent perceptions of school safety and discipline, before- and after-school activities of school-age children, participation in adult and continuing education, parent involvement in education, school choice, homeschooling, and civic involvement.
The sample drawn for this study to assess bias, hereinafter referred to as the Bias Study, was
an area sample, selected independently of the NHES:2007 RDD sample. The sampled addresses for the Bias Study were matched to telephone numbers, and an attempt was made to gain cooperation by telephone when a telephone number was available. These cases followed the same telephone interviewing protocol as NHES:2007 RDD cases. All nonhostile1 nonresponse cases and cases that were found to be incorrectly matched to a telephone number or potentially incorrectly matched to a telephone number were sent for in-person follow-up. The field interviewer’s job was to verify that the address was a dwelling unit, verify the address (and confirm the telephone number if there was one) with a resident of the household, and attempt to gain cooperation, (i.e., complete the Screener interview). Upon gaining
1 Nonhostile cases are those that were not deemed abusive or profane.

xiv
cooperation, field interviewers would connect the respondent with the Telephone Research Center (TRC) on either a cellular telephone carried by the interviewer or a household telephone via a toll-free number. The household respondent would then complete the Screener with the TRC interviewer. The Bias Study data collection process for the household Screener is summarized in exhibit ES-1. Demographic information collected in the Screener about household members was used to determine whether anyone was eligible for any of the three extended interviews: the School Readiness (SR) survey of school-aged children, the Parent and Family Involvement in Education (PFI) survey of school-aged children, and the Adult Education for Work-Related reasons (AEWR) survey. The extended interviews were also conducted with the TRC interviewer.
In addition to the survey data, two special data collection instruments—an Interviewer
Observation Form (IOF) and a maximum call postcard—were designed and used for the Bias Study. Before approaching a sampled residence, field interviewer’s first task was to note observations about the neighborhood and the sampled address using the IOF. The IOF was intended to capture observations on a number of factors including urbanicity, neighboring area land use (e.g., residential, commercial, or industrial), neighborhood and household affluence, indicators of neighborhood safety or household security, indicators of children in the area, and language diversity. Following the field effort, when a case was classified as a final maximum call case, with a supervisor’s approval, field interviewers left a postcard that contained four questions about the household. Both the IOF and the maximum call postcard provided additional information about field nonrespondents that was used in the analysis.
Among the 7,500 cases sampled for the Bias Study, a total of 5,104 were sent to the field for
in-person attempts. Overall, 50 percent of the Screener cases finalized in the field were finalized as completed Screeners. Among cases with no matching telephone number and those with a mismatched telephone number, the percentages finalized in the field as completed Screeners were 52 percent and 54 percent, respectively. Among the telephone maximum call, noncontact, refusal, and language problem cases, the percentages finalized in the field as completed Screeners were 46 percent, 45 percent, 42 percent, and 23 percent, respectively. The final number of completed Screeners and extended interviews for the RDD sample and Bias Study sample are provided in table ES-1. Table ES-1. Number of completed cases by data collection stage: NHES:2007 RDD sample;
NHES:2007 Bias Study sample Data collection stage RDD sample Bias Study sample Screener 54,034 4,894 Extended interview School Readiness (SR) 2,633 292 Parent and Family Involvement in Education (PFI) 10,681 1,123 Adult Education for Work-Related Reasons (AEWR) 7,710 1,065
SOURCE: U.S. Department of Education, National Center for Education Statistics, National Household Education Surveys Program (NHES), 2007.

xv
Exhibit ES-1. Data collection process for household Screeners: NHES:2007 Bias Study sample
Bias Study sample
(n=7,500)
Matching telephone number?
Attempted in TRC
(n = 5,433)
Result of initial telephone effort
Nonmatch cases
(n=2,067)
Attempted to gain cooperation in field
and complete telephone interview
Yes No
TRC respondents(n=2,345)*
Hostile refusals and final other nonresponse
(n=51)
Mismatched cases
(n=1,509)
TRC nonresponse
cases (n=1,528)
Field respondents(TRC nonresponse
cases)(n=1,890)
Field respondents (Nonmatch and Mismatch cases)
(n=659)
Field nonrespondents or ineligibles
(n=2,555)
Have telephone in household?
Telephone household field
respondents
Nontelephone household field
respondents
* Includes 109 potential mismatches and 1 RDD duplicate that were not sent to the field. TRC: Telephone research center; FT/RT: Full treatment and reduced treatment; FTO: Full treatment only; n: Number of households
Yes No
Result of field effort
FT/RT
FT/RTFTO

xvi
The goal of the research is to investigate bias in the estimates due to unit nonresponse and noncoverage, through the use of field follow-up of cases for which an interview could not be completed by telephone. The analysis involved two main steps. First, overall bias was evaluated by comparing final, adjusted estimates from the RDD sample to those from the Bias Study sample (completed extended interviews from FT/RT and FTO cells of figure ES-1). Since the Bias Study sample has a higher response rate and coverage of nontelephone households, differences between the two estimates are believed to be an indication of nonresponse and/or noncoverage bias in the RDD estimates. Prior to this analysis, Bias Study estimates were compared to external estimates from the Current Population Estimate as a check of their reasonableness. In addition, RDD estimates were compared before and after the weighting adjustments to evaluate the effect of the weighting.
The second main step of the analysis was to evaluate the nonresponse and noncoverage bias
components separately. Following up with nonrespondents from the telephone effort allows an investigation of nonresponse bias, and following up with households with no landline telephone allows an investigation of noncoverage bias. Specifically, nonresponse bias was evaluated by comparing estimates from the reduced treatment Bias Study sample (completed extended interviews from FT/RT cells of figure ES-1) to the full treatment Bias Study sample (completed extended interviews from FT/RT and FTO cells of figure ES-1). In the reduced treatment, the TRC status is treated as the final household status for Bias Study cases attempted in the TRC. In the full treatment, the final household status is based on efforts in both the TRC and in the field. This nonresponse study is limited because data on the households that did not respond to the Bias Study are not available. Thus, statements about the likely bias associated with the nonresponse of these households cannot be evaluated directly, and inferences about this bias are based on model assumptions. General characteristics of the field nonrespondents were described using the IOF and maximum postcard data.
The other component of interest, noncoverage bias, was evaluated by comparing fully
weighted estimates from the full Bias Study sample (completed extended interviews from FT/RT and FTO cells of figure ES-1) to estimates from the Bias Study sample restricted to telephone households (telephone household field respondents cell of figure ES-1). For this section, nontelephone households are defined as those without a landline so that the noncoverage bias associated with standard RDD surveys that do not include cell phones can be estimated. The NHES:2007 Bias Study survey instruments included a series of questions to capture the presence and number of telephone numbers in the household, so nontelephone households could be identified through the responses to these questions.

xvii
This analysis extends beyond the most common approach to bias analyses suggested in Seastrom (2002) in that it includes a full-scale data collection effort directed entirely at estimating bias. The most common methods use existing data to evaluate bias. The more typical nonresponse and noncoverage bias approaches have been used in the evaluation of bias in earlier NHES surveys. As a result, the current analysis complements and includes methods used in earlier investigations, such as comparisons to estimates from other surveys with higher responses. Those studies found little evidence of nonresponse or noncoverage bias in estimates from previous NHES surveys.
Results from this study suggest that there is no systematic pattern of bias in key statistics
from the NHES:2007. The comparison of the fully weighted RDD estimates to Bias Study estimates indicated the RDD survey underestimated the percentages of preschoolers:
Who count to 20 or higher;
Whose speech is often understandable to a stranger; and
Who watch 2 or more hours of TV in a typical weekday;
and overestimated:
The percentage of preschoolers whose mother is not in the labor force; and
The percentage of adults who are currently married.
However, the majority of estimates evaluated showed no evidence of bias of substantive
importance.2
In addition to the evaluation of overall bias in the NHES:2007 estimates, the Bias Study also allowed for the estimation of the nonresponse and noncoverage bias components. The NHES:2007 estimates were produced using weights that were adjusted for nonresponse and calibrated to population totals—adjustments that are expected to reduce nonresponse and noncoverage bias. The results from the NHES:2007 Bias Study, in concert with the previous bias analyses, suggest that:
Despite the falling response rates, there is no bias of substantive importance in the
NHES:2007 estimates due to nonresponse.
2 Bias of substantive importance is defined as a statistically significant difference of 5 percentage points or more or relative differences of 3 or more (i.e., when one estimate is 3 or more times larger than the other). The Bias Study was designed to allow detection of a 5 percentage point difference in key statistics. For NHES, this is considered a meaningful threshold to use to identify which statistically significant differences are of substantive importance.

xviii
A comparison of estimates before and after the raking adjustments indicated potential noncoverage biases in some unadjusted SR survey outcome estimates, as well as in some demographic estimates, that were reduced through the weighting process (see section 7.3 for a complete list).
While the weighting adjustments appear to have reduced noncoverage bias, the Bias Study analysis did provide evidence of the potential for noncoverage in the RDD survey to result in an overestimate of the percentage of preschoolers whose parents’ highest educational attainment is beyond a high school diploma.
Although estimates of noncoverage bias in other final estimates examined in this study are not of substantive importance as defined for this report, noncoverage bias may become more of an issue in the future as more households drop their landline telephone service.
1
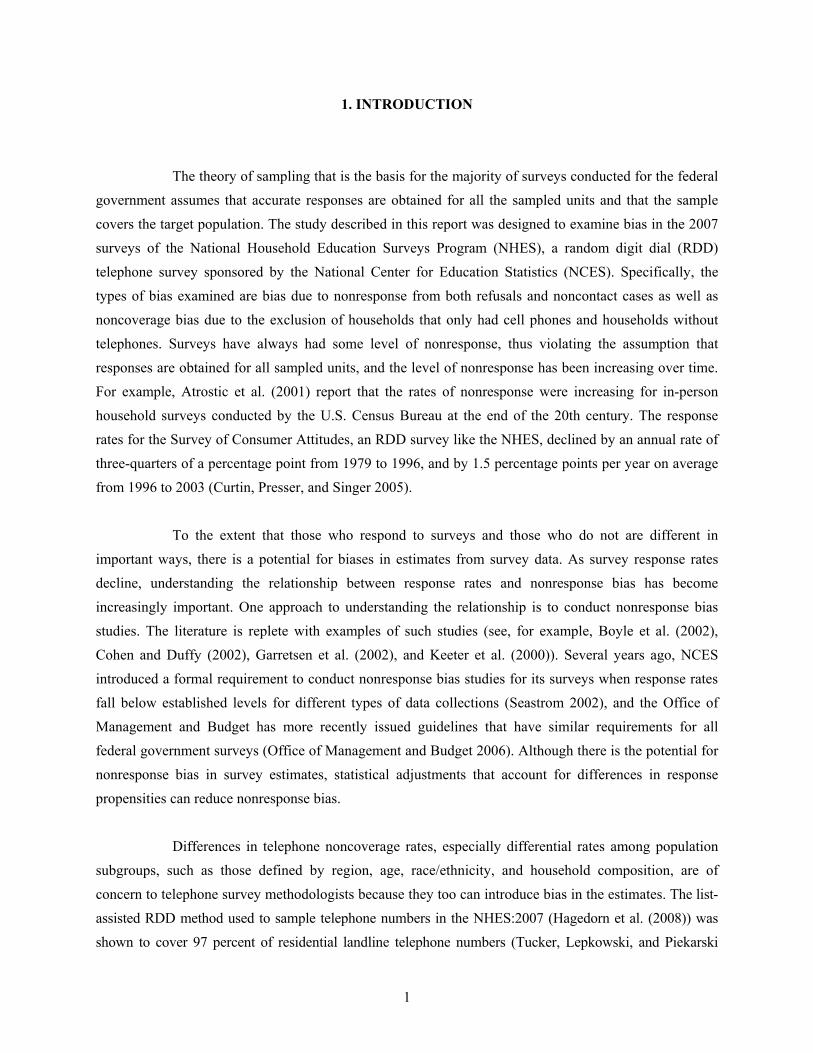
1. INTRODUCTION
The theory of sampling that is the basis for the majority of surveys conducted for the federal government assumes that accurate responses are obtained for all the sampled units and that the sample covers the target population. The study described in this report was designed to examine bias in the 2007 surveys of the National Household Education Surveys Program (NHES), a random digit dial (RDD) telephone survey sponsored by the National Center for Education Statistics (NCES). Specifically, the types of bias examined are bias due to nonresponse from both refusals and noncontact cases as well as noncoverage bias due to the exclusion of households that only had cell phones and households without telephones. Surveys have always had some level of nonresponse, thus violating the assumption that responses are obtained for all sampled units, and the level of nonresponse has been increasing over time. For example, Atrostic et al. (2001) report that the rates of nonresponse were increasing for in-person household surveys conducted by the U.S. Census Bureau at the end of the 20th century. The response rates for the Survey of Consumer Attitudes, an RDD survey like the NHES, declined by an annual rate of three-quarters of a percentage point from 1979 to 1996, and by 1.5 percentage points per year on average from 1996 to 2003 (Curtin, Presser, and Singer 2005).
To the extent that those who respond to surveys and those who do not are different in
important ways, there is a potential for biases in estimates from survey data. As survey response rates decline, understanding the relationship between response rates and nonresponse bias has become increasingly important. One approach to understanding the relationship is to conduct nonresponse bias studies. The literature is replete with examples of such studies (see, for example, Boyle et al. (2002), Cohen and Duffy (2002), Garretsen et al. (2002), and Keeter et al. (2000)). Several years ago, NCES introduced a formal requirement to conduct nonresponse bias studies for its surveys when response rates fall below established levels for different types of data collections (Seastrom 2002), and the Office of Management and Budget has more recently issued guidelines that have similar requirements for all federal government surveys (Office of Management and Budget 2006). Although there is the potential for nonresponse bias in survey estimates, statistical adjustments that account for differences in response propensities can reduce nonresponse bias.
Differences in telephone noncoverage rates, especially differential rates among population
subgroups, such as those defined by region, age, race/ethnicity, and household composition, are of concern to telephone survey methodologists because they too can introduce bias in the estimates. The list-assisted RDD method used to sample telephone numbers in the NHES:2007 (Hagedorn et al. (2008)) was shown to cover 97 percent of residential landline telephone numbers (Tucker, Lepkowski, and Piekarski

2
(2002)). The largest component of noncoverage bias in a telephone survey such as the NHES, whose sampling frame only includes landline phones, is probably due to the prevalence of households without landline telephones1 and the differences between such households and those with landline telephones. Based on recent findings (Blumberg and Luke 2008), in the last 6 months of 2007, the percentage of households with no telephone service was about 2 percent, and the percentage of households with cell phone service alone was about 16 percent. Tucker et al. (2004) and Blumberg and Luke (2008) examined differences in characteristics among persons and households having no telephone service, cellular service only, and landline service (including both landline only, and landline and cellular). Although there are differences in landline noncoverage (e.g., young adults, adults in one-person households, renters, and Blacks and Hispanics are less likely to have landlines), statistical adjustments that account for these subgroup differences can reduce noncoverage bias.
This report documents an extensive Bias Study conducted in conjunction with the 2007
National Household Education Surveys Program (NHES:2007). The Bias Study was motivated by continuing declines in response rates and landline telephone coverage experienced by NHES and other RDD studies over time. Conducted for NCES, NHES:2007 was an RDD survey covering the 50 states and the District of Columbia. As discussed in chapter 3, the Bias Study sample was an area sample, selected independently of the NHES:2007 RDD sample. The sampled addresses for the Bias Study were matched to telephone numbers, and an attempt was made to gain cooperation (i.e., to complete an interview) by telephone when a telephone number was available. That is, households with a matched telephone number were first called by telephone interviewers in the Telephone Research Center (TRC). Those cases for which a Screener interview could not be completed by the end of the calling period through TRC-initiated calls were sent to the field for in-person follow-up. Households for which a telephone number match was not found went to the field for in-person follow-up without being called by TRC interviewers. As with the RDD sample, telephone data collection for the Bias Study sample began on January 2, 2007 and ended on May 6, 2007. In-person data collection began on March 19, 2007 and ended on June 24, 2007.
The purpose of the Bias Study is to investigate bias in the estimates due to unit nonresponse
and noncoverage, through the use of field follow-up of cases for which an interview could not be completed by telephone. Following up with nonrespondents from the telephone effort allows an investigation of nonresponse bias, and following up with households with no landline telephone allows an investigation of noncoverage bias. This nonresponse study is limited because data on the households that did not respond to the Bias Study are not available. Thus, statements about the likely bias associated with
1 Households without landline telephones include cellular phone-only households, in addition to households with no telephone service.

3
the nonresponse of these households cannot be evaluated directly, and inferences are based on model assumptions.
The analysis presented in this report differs from the standard approach to bias analyses
suggested in Seastrom (2002) in that it involves a full-scale data collection effort directed entirely at estimating bias. The most common methods use existing data to evaluate bias and can be effective at detecting and helping to correct for it. Such methods have been used in the evaluation of bias in earlier NHES surveys. (See Brick (1996); Brick et al. (1997); Brick, Burke, and West (1992); Montaquila, Brick, and Brock (1997); Nolin et al. (2000); Nolin et al. (2004); and Roth, Montaquila, and Chapman (2007)). As a result, the current analysis complements earlier investigations, such as comparisons to estimates from other surveys with higher responses (e.g., chapter 8 in Nolin et al. (2004)). Those studies found little evidence of nonresponse bias or noncoverage bias in estimates from previous NHES surveys. 2
The remainder of this chapter provides an overview of NHES and the procedures used to
increase response rates and minimize the effects of nonresponse in the full RDD collections, as well as a description of previous feasibility studies that were conducted in preparation for the Bias Study. Chapter 2 describes the relationship between response rates and nonresponse bias, providing a theoretical framework for understanding nonresponse bias. Chapter 3 outlines the sample design and selection of the Bias Study sample, and chapter 4 describes the data collection process. Unit and item response rates for the Bias Study are provided in chapter 5, with some comparison to rates from the NHES:2007 RDD sample. Chapter 6 describes the process of creating weights and calculating standard errors for the analysis. The results of the bias analysis are provided in chapters 7 and 8, where chapter 7 gives an overview of bias, and chapter 8 addresses the components of bias. A final discussion is provided in chapter 9.
1.1 National Household Education Surveys Program
NHES is an RDD survey program developed by NCES in the Institute of Education Sciences, U.S. Department of Education. It is designed to collect information on important educational issues through telephone surveys of households in the United States. NHES has enabled NCES to gather data on a wide range of issues that cannot be measured efficiently in traditional institution-based data collections, such as early childhood care and education, children’s readiness for school, parent
2 A difference has been found between NHES and the Current Population Survey (CPS) for the estimated percentage of children in kindergarten through grade 12 whose parents’ highest level of education is graduate school. The estimate from NHES has been consistently higher than that from the CPS.

4
perceptions of school safety and discipline, before- and after-school activities of school-age children, participation in adult and continuing education, parent involvement in education, school choice, homeschooling, and civic involvement. NHES uses computer-assisted telephone interviews (CATI) and has been conducted by Westat in 1991, 1993, 1995, 1996, 1999, 2001, 2003, 2005, and 2007.
NHES provides data on populations of special interest to NCES and education researchers.
For surveys about children, the population of interest is defined by age or grade in school, or both, for the particular survey topic and research questions for a given survey administration. For surveys of adults, the population of interest is persons ages 16 and older who are not enrolled in grade 12 or below, excluding those on active duty military service and those who are institutionalized. NHES targets these populations using specific screening and sampling procedures.
NHES provides national cross-sectional estimates based on the 50 states and the District of
Columbia. The NHES design also yields estimates for subgroups of interest for each survey, as defined by age or grade for children, educational participation status for adults, and Black and Hispanic origin for all populations of interest. In addition to providing cross-sectional estimates, NHES is also designed to provide estimates of change over time in key statistics.
NHES:2007 was conducted from January through May 2007. Households were randomly
sampled, and a screening interview was administered to a household respondent age 18 or older. Demographic information collected in the Screener about household members was used to determine whether anyone was eligible for the School Readiness (SR), Parent and Family Involvement in Education (PFI), or Adult Education for Work-Related Reasons (AEWR) Surveys.
The SR Survey was administered to the parent or guardian3 in the household who was most
knowledgeable about the care and education of the sampled child; sampled children were ages 3 through 6, as of December 31, 2006, and were not yet in kindergarten.4 The PFI Survey was also administered to the parent or guardian who was most knowledgeable about the care and education of the sampled child; sampled children were ages 20 or younger, as of December 31, 2006, and were enrolled or homeschooled in kindergarten through twelfth grade. The AEWR Survey was administered to sampled persons 16 years or older who were not enrolled in twelfth grade or below at the time of screening and were not institutionalized or on active duty in the U.S. Armed Forces. Although the AEWR data were not released to the public,5 the AEWR Survey was administered in both the RDD and Bias Study in order to evaluate 3 The respondent for the SR and PFI Surveys was identified by the Screener respondent as the household member most knowledgeable about the care and education of the sampled child. For ease of discussion, the respondent is referred to as the parent/guardian. 4 Some SR Survey items were administered about children enrolled in kindergarten through second grade. 5 A decision was made not to release the AEWR data because of the low overall response rate.

5
bias; this was deemed important because NHES has included adult education surveys in various survey administrations since 1991.
The largest component of nonresponse in most RDD surveys occurs when a household is
first dialed and attempts are made to secure the household’s participation in the survey. This stage is called the Screener in NHES, and the Screener unit response rates across all the administrations of the survey are given in table 1-1. Screener unit response rates in 1991 and 1993 were greater than 80 percent, but then fell in 1995 and 1996 (73 percent and 70 percent, respectively) due, at least in part, to changes that increased the length and content of the screening interview (Brick and Collins 1997). In 1999, the length and content of the Screener were revised to be more consistent with the earlier surveys, and the response rate rose to 74 percent. The Screener response rates for 2001 and 2003 declined (68 percent and 62 percent, respectively) despite the fact that the length and content of the Screener were similar to 1999. In 2003 a large incentive experiment was imbedded in the survey (Brick et al. 2005), and the results of this experiment led to the use of monetary incentives in the refusal conversion6 stage of the Screener in 2005 (response rate of 64 percent). Despite the continued use of incentives in both an advance mailing and, where appropriate, a refusal conversion mailing, the Screener response rate declined to 53 percent in NHES:2007.
6 Throughout this report, the term refusal conversion refers to the process of attempting to complete an interview with a case that has previously refused to participate. This often involves multiple call attempts and may result in contacting a household member other than the person who refused.

6
Table 1-1. Weighted unit response rates and percentage distribution of type of unit nonresponse for the NHES Screener:1991–2007
Type of unit nonresponse (percentage distribution) Year of survey
Number of completed Screeners
Overall unit response rate (percent) Refusals Maximum calls Other nonresponse
1991 60,322 81.0 84 7 9 1993 63,844 82.1 68 15 181
1995 45,465 73.3 84 9 7 1996 55,838 69.9 83 10 7 1999 55,929 74.1 76 17 7 2001 48,385 67.5 74 18 8 2003 32,049 61.7 76 16 8 2005 58,140 64.2 77 15 8 2007 54,034 52.5 86 10 4 1 The NHES:1993 percentage of other nonresponse cases is higher than that in other surveys. The lower rate of refusals and the generally higher response rate in NHES:1993 are indicative of the fact that less refielding of other nonresponse cases was needed prior to ending data collection with an acceptable Screener response rate. NOTE: To avoid any differences in rates that might be attributable to the calculation method, all unit response rates given here were calculated using the business office method. Therefore, response rates given here are somewhat different than the official response rates cited later in this report and in other survey documentation. The official rates for 2001, 2003, and 2005 use the survival method. The official rate for 2007 uses the vendor-assisted method. See chapter 4 of Hagedorn et al. (2008) for details on the methods for computing response rates. The number of household members enumerated in each data collection differed according to the sample requirements of the topical surveys conducted in the specific year. Maximum call cases are those that received at least eight call attempts during which contact was made with a person on at least one occasion, yet the Screener was not completed. Other nonresponse includes cases with language problems, no-answer and answering machine calls (downweighted to reflect the appropriate proportion assumed to be residential), and other forms of nonresponse. Detail may not sum to totals because of rounding. SOURCE: U.S. Department of Education, National Center for Education Statistics, National Household Education Surveys Program (NHES), selected years, 1991-2007.

7
Procedures that have been used to increase response rates in RDD surveys include the following:
advance letters;
incentives;
one or more refusal conversion attempts;
special mailings such as Federal Express prior to refusal conversion;
increased numbers of call attempts;
leaving messages on answering machines;
special training of interviewers to avoid refusals;
assigning refusal cases to specially trained refusal conversion interviewers; and
effecting changes in the protocol for working the cases, such as increasing total time in the field.
All of these methods were used in NHES:2007. The specifics of the methods used in NHES: 2007 are described in section 4.1 of Hagedorn et al (2008).
1.2 Previous Feasibility Studies
Over the past several NHES survey administrations, an increasing array of methods has been used in an attempt to contact potential respondents and gain cooperation, as noted earlier. In order to evaluate an additional method for improving survey response, the NHES: 2005 Field Test included a test of the feasibility of conducting a national RDD survey with subsampling of RDD nonrespondents to be contacted for in-person interviews (see Westat 2004 for details). Further testing of the in-person follow-up approach was conducted during the NHES: 2005 main study data collection and NHES:2007 field test.
The goals of these feasibility tests were to determine whether an in-person
component would improve response rates enough to make it a cost-effective strategy for future NHES surveys and to assess the feasibility of using in-person follow-up with nonrespondents and households without landline telephones to study nonresponse and noncoverage bias. The results of the initial feasibility study in 2005 were promising in some ways (field interviewers completed

8
41 percent of telephone maximum call cases and 42 percent of telephone refusal cases that were determined to be residential). However, some major operational issues were identified, including the limited utility of such an approach when the study protocol greatly limited which cases could be fielded for in-person collection.7 The additional study conducted in conjunction with the NHES:2005 RDD collection examined operational issues and identified key factors needing further study. It also provided information on the refusal conversion rate for the cases that were not subject to the restrictions imposed in the NHES:2005 Field Test, as well as estimates that were not subject to the compressed schedule effects of the NHES:2005 Field Test. (The NHES:2005 Field Test was conducted over a 2-month period; this did not allow sufficient time for the full data collection protocol, e.g., a 13-day hold period prior to attempting refusal conversion, to be followed.)
For the study of in-person follow-up conducted with the NHES:2005 RDD
collection, a subset of Screener cases in two predetermined sites were sent to the field after having been finalized on the initial refusal on the phone, after having been finalized on the third refusal,8 and after having been finalized as maximum call or language problems. Of the 134 first refusal Screener cases sent to the field, 36 cases (27 percent) were completed in the field. Of the 206 third refusal Screener cases sent to the field, 48 cases (23 percent) were completed in the field. Among maximum call and language problem Screener cases, 8 of the 60 cases (13 percent) that were sent to the field were completed.
These studies demonstrated that field follow-up is feasible and is a viable approach
for completing interviews with a proportion of both telephone nonrespondents and households without landline telephones. In preparation for both the full-scale Bias Study and the NHES: 2007 RDD collection, a field test of NHES:2007 was conducted in 2006. For the Bias Study, the primary purpose of the field test was as a final test of operational procedures and materials used during the field follow-up.
7 In the 2005 Field Test, only refusals that were mild and had no more than one “knowledgeable” refusal were sent to the field for an in-person follow-up. A knowledgeable refusal was one in which the respondent who refused heard the entire study introduction prior to refusing, mentioned receiving and reading the advance letter, or otherwise acknowledged that he or she understood that the study was a legitimate survey and chose not to participate. 8 In NHES:2005 and NHES:2007, a subsample of Screener cases was designated to receive an abbreviated telephone protocol. A random subsample of cases was designated to finalize after the first refusal, while the remaining cases were designated to receive the full telephone protocol (which included up to three refusals before finalization).

9
2. RELATIONSHIP BETWEEN RESPONSE RATES AND BIAS
This chapter examines some theory on the relationships between response rates and nonresponse bias. The same theory may also be applied to noncoverage rates, although it requires some re-conceptualization. The relationship between response rates and bias is more complex than the assumption that higher response rates will produce estimates with lower nonresponse bias. The chapter begins by giving some theory that aids in understanding the nature of this relationship. Two approaches that have been examined in dealing with nonresponse bias are presented, and the approach that is most pertinent for this discussion is considered in more detail. As the more pertinent approach is explicated, connections to theories of nonresponse are provided. The chapter concludes by reviewing estimation methods that might be used to reduce nonresponse bias and the conditions required for these methods to be effective.
2.1 Response Theories
Two approaches to viewing nonresponse in surveys consider response as either deterministic or stochastic. The deterministic view implies that the population can be partitioned so that every unit can be classified into respondent and nonrespondent strata, irrespective of whether the unit was sampled (Cochran 1977, pp. 361-362). The nonresponse bias of an estimated mean depends on the sizes of the strata and the differences in the characteristics in the two strata. A common way of describing the relationship between the response rate and nonresponse bias for the mean under this approach is
( ) (1 )( )r r mbias y rr Y Y= − − , (2.1)
where ry is the estimated mean based on the respondents, rr is the proportion of the population in the respondent stratum, rY is the mean of the stratum of respondents, and mY is the mean of the stratum of
nonrespondents. For other statistics and estimators, the relationship varies and expressions like that given in (2.1) can be established.

10
The second approach takes a stochastic perspective and assumes that response to the survey is a random variable and that each unit has a response propensity or probability of responding, denoted
iφ . This response propensity model assumes that iφ > 0 for all i. When some units have zero response propensities, the response propensity model does not hold and these units must be treated as if they were not covered or using the deterministic approach. Under the response propensity model, nonresponse can be treated like a second phase of sampling (i.e., treating the nonrespondents as a subsample of the full sample), but an important difference is that response propensities, unlike sampling probabilities, are unknown.
Under the stochastic model, the bias of an estimate is related to both the distribution of the
characteristic and the distribution of the response propensities. Using the methods given in Bethlehem (1988) and Kalton and Maligalig (1991), the bias of the respondent mean can be written as
( )( )
1,
1
( )
/
r y y
ii
bias y
NY Y
φ φφ σ σ ρ
φ φ φ
−
−
=
= Σ −− ’
(2.2)
where iY is the value of the characteristic y for unit i, Y is the population mean of the characteristic y, iφ is the response propensity for unit i, φ is the mean of the response propensities, φσ is the standard deviation of the response propensities, yσ is the standard deviation of the characteristic y, ,yφρ is the correlation between the response propensities and the values of the characteristic, and N is the number of units in the population. Expression (2.2) shows that the respondent mean is unbiased if there is no correlation between the response propensity and the characteristic being estimated.
Both the deterministic and stochastic models imply that 100 percent response results in no
nonresponse bias. However, some relationships between response rates and bias are more obvious using the stochastic model. For example, suppose it were possible to raise the response propensity for every unit by the same factor, from iφ to ikφ , where k > 0 and ikφ ≤ 1. Using (2.2), it is clear that this type of increase in response rate has no effect on the bias,9 countering the assumptions that higher response rates necessarily result in estimates with lower nonresponse biases. In the next section, methods of estimating nonresponse bias using response propensity models are discussed.
9 Note that if response propensities for every unit are increased by the factor k, then the average response propensity φ will also increase by a factor of k; thus, the factor of k that appears in the numerator and denominator of expression (2.2) will cancel.

11
2.2 Estimating Nonresponse Bias and Bounds on the Bias
If the relationship between the response propensities and the statistic being estimated is known or can be estimated, then the nonresponse bias of the estimate can be approximated. Colombo (2000) and Groves, Presser, and Dipko (2004) have considered this relationship and examined some of the consequences for bias. To provide a clear example of this approach, only estimates of a proportion are considered here and the goal is to estimate the proportion of the population with a characteristic (P), say the proportion of preschoolers who participated in center-based arrangements in the previous year. (Note that the proportion of the population without the characteristic is expressed as 1-P.)
Since a proportion is a mean of a dichotomous variable (with the value of 1 indicating the
presence of a characteristic and 0 indicating its absence), the bias of the unadjusted estimator of a proportion can be written using (2.2). However, for a proportion this expression can be further simplified. Let the average response propensity for the units with the characteristic be φ1, and the average response propensity for those without the characteristic be φ2. The bias in the unadjusted estimator, denoted rp̂ , is
1ˆ( ) (1 )(1 ){ (1 ) }rbias p P P P Pλ λ −= − − + − , (2.3)
where 1
2 1λ φ φ −= .
The bias depends only on λ , the ratio of φ2 and φ1. The following are observations based on
(2.3):
If the average response propensities are the same for those with and without the characteristic (λ = 1), then the estimate is unbiased irrespective of the response rate.10
The bias is negative when λ > 1 (those with the characteristic have lower response propensities).
The bias is positive when λ < 1 (those with the characteristic have higher response propensities).
10 If λ = 1, then 0))1((0)1())1()(1)(1()ˆ( 11 =−+⋅⋅−=−+−−= −− pppppppppbias r λλ .

12
Table 2-1 gives the bias of an estimate and table 2-2 gives the relative bias of an estimate (bias divided by P) for different values of λ. Because relative bias gives an indication of the magnitude of the bias relative to the estimate itself (rather than an absolute measure), relative bias can be useful for comparisons across different levels of P and λ. To illustrate, consider a characteristic possessed by 25 percent of the population (P = 25 percent), and suppose those without the characteristic are 10 percent more likely to respond than those with the characteristic (λ = 1.1). Then
-0.017)1.1)25.01(25.0)(1.11)(25.01(25.0)ˆ( 1 =−+−−= −rpbias ,
and the relative bias is 07.025.0017.0)ˆ( −=−=Ppbias r .
Table 2-1 shows that the bias becomes larger as λ increases and when P is not extreme
(close to 0 percent or 100 percent). For characteristics possessed by 50 percent of the population, the bias may be large if the ratio of the response propensities for the two groups is not close to 1. In terms of relative bias, table 2-2 shows that when P is small, the nonresponse bias may be large relative to the size of the estimate, even for modest values of λ. On the other hand, for P = 90 percent, the value of λ has to be large to result in a large relative bias.
Table 2-1. Bias in the unadjusted estimate of a percentage, by different ratios of response
propensities ( 112−= φφλ )
Ratio of response propensities for those without the characteristic to those with the
characteristic (λ) Percent of population with the characteristic (P) 1.1 1.5 2.0 2.5 1 -0.1 -0.3 -0.5 -0.65 -0.4 -1.6 -2.4 -2.910 -0.8 -3.1 -4.7 -5.725 -1.7 -6.8 -10.7 -13.250 -2.4 -10.0 -16.7 -21.475 -1.8 -8.3 -15.0 -20.590 -0.9 -4.3 -8.2 -11.795 -0.5 -2.3 -4.5 -6.699 -0.1 -0.5 -1.0 -1.5NOTE: Response propensities for units with the characteristic = φ1; those without the characteristic = φ2. SOURCE: Analytical derivation.

13
Table 2-2. Relative percentage bias (bias divided by the percent of the population with the characteristic, expressed as a percentage) for the unadjusted estimate of a percentage, by different ratios of response propensities ( 1
12−= φφλ )
Ratio of response propensities for those without the characteristic to those with the
characteristic (λ) Percent of population with the characteristic (P) 1.1 1.5 2.0 2.5 1 -9 -33 -50 -605 -9 -32 -49 -5910 -8 -31 -47 -5725 -7 -27 -43 -5350 -5 -20 -33 -4375 -2 -11 -20 -2790 -1 -5 -9 -1395 0 -2 -5 -799 0 0 -1 -1NOTE: Response propensities for units with the characteristic = φ1; those without the characteristic = φ2. SOURCE: Analytical derivation.
Since the main analysis in this report examines the existence of bias when an additional
effort (in-person data collection) is attempted, the bias expressions are further developed to deal with this situation. Consider the ratio of the bias of the estimate for a survey conducted with a higher level of effort (say effort level = 2) to the bias for a survey conducted with a lower level of effort (effort level = 1). Using (2.3) and labeling the bias in the estimate using level of effort 1 as 1ˆ( )rbias p and the bias using level of effort 2 as 2ˆ( )rbias p , the ratio of the biases is
1
2 2 1 1
1 2 2
ˆ( ) (1 )( (1 ) )ˆ( ) (1 )r
r
bias p Pbias p P
λ λ λλ λ
−− + −=
− +, (2.4)
where 11φ , is the average response propensity for those with the characteristic at the level of effort = 1,
1 2φ , is the average response propensity for those with the characteristic at the level of effort = 2; 2 1φ , and
2 2φ , are defined similarly for those without the characteristic; and 1 2,1 1,1/ ,λ φ φ= 2 2,2 1,2/ .λ φ φ= (Note
that the expression is undefined if the 1ˆ( )rbias p = 0.)

14
An easier way to understand (2.4) is to rewrite it as a percentage reduction in the bias of the estimate as a result of increasing the level of effort from level 1 to level 2. This percentage reduction of bias is
( )( )
( ) ( )( )( ) .1
11100100
ˆˆ
10010022
1112
1
2
λλλλλ
κ+−
−+−−=−=
−
PP
pbiaspbias
r
r (2.5)
Notice that if increasing data collection effort changes the response rates, but does not
change the ratios of the average response propensities ( 1 2λ λ= ), then there is no reduction in the bias (κ = 0 percent). At the other extreme, suppose the added effort results in 2 1λ = and there is no bias in the estimate from the higher response rate survey, then κ = 100 percent.
Table 2-3 gives the percentage reduction in bias for different values of the population
percentage (P) holding 2 1.1λ = and varying the value of 1λ . The table shows the percentage reduction in bias is not very sensitive to P. In addition, the percentage reduction is greatest when the effort level 1 survey estimate has a large value of 1 2,1 1,1/ ,λ φ φ= as would be expected. It is worth noting that the bias due to nonresponse increases with higher response rates if 12 λλ > and 0<κ . For example, suppose
1 1.2λ = and 2 1.4λ = , then 83κ = − percent, and the nonresponse bias increases as a result of the additional effort. This type of result might be unusual in practice, but not impossible.
Table 2-3. Percentage reduction in bias of estimate due to higher level of effort (κ), holding
constant the ratio of response propensities at the higher level of effort ( 2λ =1.1) for different values of the ratio of response propensities at the lower level of effort ( 1λ )
Ratio of response propensities for those without the characteristic to those with the
characteristic, at the lower level of effort (λ1) Percent of population with the characteristic (P) 1.2 1.5 2.0 2.5 1 45 73 82 855 46 73 82 8510 46 73 83 8625 47 74 84 8750 48 76 86 8975 49 78 88 9190 50 79 89 9295 50 80 90 9399 50 80 90 93NOTE: Response propensities for units with the characteristic = φ1, without the characteristic = φ2, and the ratios are 1 2 1 1 1λ φ φ, ,/= and 2 2 2 1 2λ φ φ, ,/= . SOURCE: Analytical derivation.

15
At the time of deciding on the level of effort to expend in a survey, it may be useful to get a sense of what is feasible by obtaining a bound on the reduction in the bias. This can be done by assigning values for 1λ and 2λ . Making reasonable assignments of these values depends on understanding the causes of nonresponse, especially causes that would result in response propensities that differ for those with and without the characteristic. Two general categories of causes of nonresponse are accessibility (ability to contact sampled units) and amenability (willingness of those contacted to respond). Mechanisms likely to give rise to different response propensities for those with and without the characteristic are those that are either a direct cause of the nonresponse or a variable highly correlated with a direct cause. For example, different response propensities due to inability to contact respondents might be expected in surveys estimating statistics such as travel or the use of technology to prevent unwanted telephone calls from reaching the household. Similarly, other characteristics, such as being in a single-person household, might also be highly correlated to differential response propensities due to inaccessibility because it is typically harder to make contact with households with only one person.
With respect to amenability, the topic and sponsorship of the survey are features that might
cause differential response propensities for those with and without the characteristic. This hypothesis is consistent with leverage-saliency theory (Groves, Singer, and Corning 1999). Advance letters and introductions that identify the topic and sponsor might result in persons being more or less amenable to participate based on whether they have a specific characteristic. For example, households without school-age children may be less likely to respond to a survey on education. Groves, Presser, and Dipko (2004) conducted some experiments using persons with known characteristics and found some support for this hypothesis, but the differences in response propensities for those with and without the characteristic were typically not large.
2.3 Estimation Methods To Reduce Nonresponse Bias
The relationships between response propensities and nonresponse bias presented earlier assume that the estimator is not subject to any nonresponse adjustments. In many surveys, auxiliary data are used in either standard nonresponse adjustment weighting or calibration weighting. The main goal of these adjustments to the base weights, which are the inverse of the selection probabilities, is often reduction in nonresponse bias or noncoverage bias, or both. This section explores the use of these adjustments and the effect the adjustments have on nonresponse bias under the response propensity model perspective. For additional information about these types of adjustments, see Brick and Kalton (1996), Kalton and Maligalig (1991), and Lundstrom and Särndal (1999).

16
Response propensity models are often explicitly used to develop nonresponse adjustments in surveys. Little (1986) suggested estimating response propensities and using them to create nonresponse weighting cells. He calls estimators that are formed this way response propensity stratification estimators. The general approach is described in Brick and Kalton (1996) within the context of other weighting adjustment methods. Recent examples of the use of propensity models in telephone surveys are Smith et al. (2004) and Blenk and Stasny (2001).
Bethlehem (1988) and Kalton and Maligalig (1991) examined the statistical implications of
different estimation procedures under the response propensity model of nonresponse. In particular, they examined the bias of the estimator when auxiliary variables are used in an attempt to reduce the bias of the estimator. Some theory of estimation in this case is provided below.
The generalized regression estimator (GREG) is an estimator that uses auxiliary variables
and is a valuable one to consider because calibration estimators such as the poststratified and raking estimators are asymptotically equivalent to the GREG (Deville and Särndal 1992). When all the sampled units respond, the GREG estimator of the mean, GRy , is
,ˆ)'( βHTHTGR xXyy −+= (2.6)
where the subscript HT indicates the Horvitz-Thompson, or inverse selection, weighted estimator (e.g.,
Nyysi
iiHT /1∑∈
−= π with iπ the probability of selection for unit i, yi the value of the characteristic y for unit i, s the set of units in the sample, and N the total number of units in the population); X is a p-vector of population means of auxiliary variables; HTx is the Horvitz-Thompson estimator of X ; β̂ is the p-vector of weighted regression coefficients; and p is the number of auxiliary variables. When some units do not respond, a modified estimator is
*,ˆ)'( *** βHTHTGR xXyy −+= (2.7)
where the * indicates the estimator is based only on the values of the unit respondents11 (e.g.,
* 1 1/HT i i ir r
y yπ π− −= ∑ ∑ , where the sums are over the respondents).
11 Expression (2.7) assumes that all unit respondents have valid responses to all items used in the estimator. As such, the values used in (2.7) include reported values for item respondents and imputed values for item nonrespondents.
17
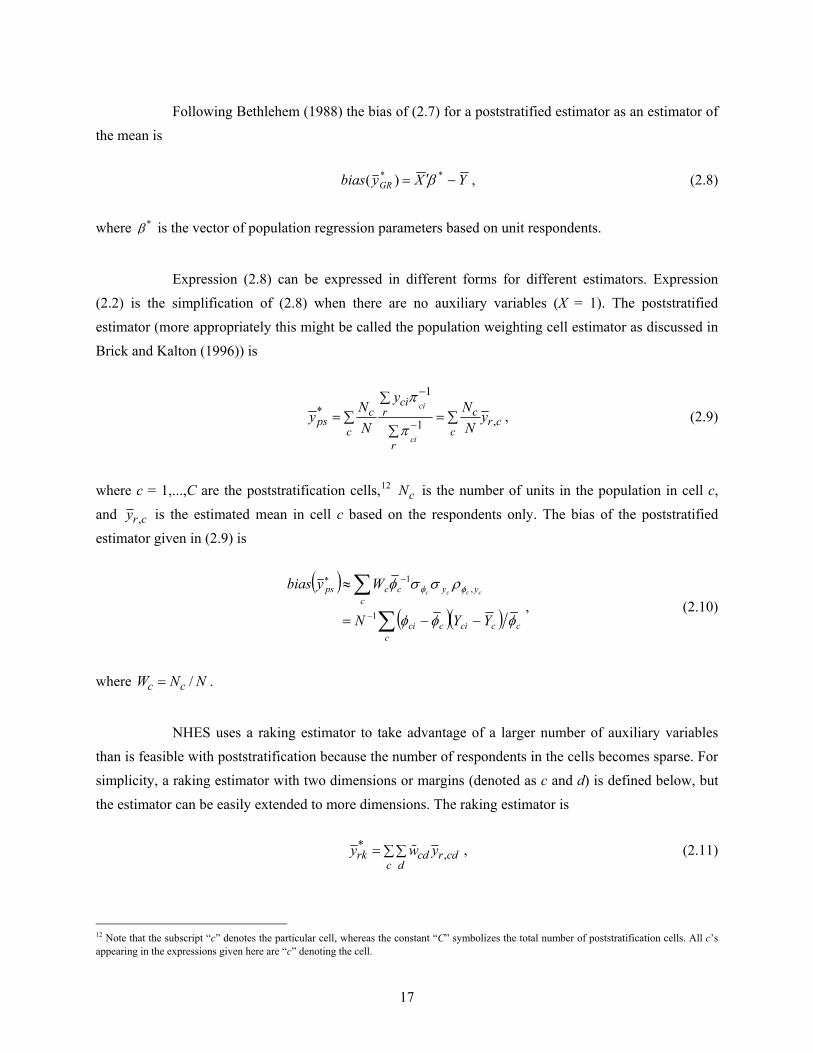
Following Bethlehem (1988) the bias of (2.7) for a poststratified estimator as an estimator of the mean is
YXybias GR −′= ** )( β , (2.8)
where *β is the vector of population regression parameters based on unit respondents.
Expression (2.8) can be expressed in different forms for different estimators. Expression
(2.2) is the simplification of (2.8) when there are no auxiliary variables (X = 1). The poststratified estimator (more appropriately this might be called the population weighting cell estimator as discussed in Brick and Kalton (1996)) is
1
*,1
ci
ci
cic cr
ps r cc c
r
yN N
y yN N
π
π
−
−
∑= =∑ ∑
∑, (2.9)
where c = 1,...,C are the poststratification cells,12 cN is the number of units in the population in cell c, and ,r cy is the estimated mean in cell c based on the respondents only. The bias of the poststratified estimator given in (2.9) is
( )
( )( )∑
∑−−=
≈
−
−∗
ccccicci
cyyccps
YYN
Wybiascccc
φφφ
ρσσφ φφ
1
,1
, (2.10)
where /c cW N N= .
NHES uses a raking estimator to take advantage of a larger number of auxiliary variables
than is feasible with poststratification because the number of respondents in the cells becomes sparse. For simplicity, a raking estimator with two dimensions or margins (denoted as c and d) is defined below, but the estimator can be easily extended to more dimensions. The raking estimator is
*
,rk cd r cdc d
y w y= ∑ ∑ % , (2.11)
12 Note that the subscript “c” denotes the particular cell, whereas the constant “C” symbolizes the total number of poststratification cells. All c’s appearing in the expressions given here are “c” denoting the cell.

18
where ,r cdy is the estimated mean in cell cd based on respondents only, and cdw% is an estimate of
/cd cdW N N= (where cdN is the number of population units in cell cd) formed by raking to the known marginal totals, cN and dN .
The bias of the raking estimator is discussed in Kalton and Maligalig (1991). Two sufficient
conditions for the raking estimator to be approximately unbiased in the presence of unit nonresponse are
( )( )
( ) .)(
0/)(1
1
−
−
=
=−−∑dccd
cdcdcdicdcdicd
b
YYNa
βαφ
φφφ (2.12)
Both conditions must hold at the same time in order for these conditions to be sufficient. The
first condition is the poststratification condition (2.10), but in this case the covariance term is the covariance within the cell defined by the full cross-classification of all the raking dimensions, e.g., the combination of the level of the first dimension and the level of the second dimension that defines cell (c,d). For the two-dimensional case, the covariance between the response propensities within cell (c,d) and the variable values in the cell is equal to zero. The second condition requires that the mean response propensity for a cell of the full cross-classification can be written as a product of factors (main effects) for the dimensions. This implies the estimate will be biased if the response propensities involve an interaction effect as well as the main effects for each of the dimensions.
The auxiliary variables used in the adjustments are assumed to be from an independent
source, to have negligible sampling and measurement error, and to be available for the entire population. However, Lundström and Särndal (1999) show that standard nonresponse adjustment methods that only use data from the sample, such as weighting class nonresponse estimators, have similar bias properties to those that use population data. Thus, most of the expressions for bias are approximately valid when the same weighting procedures are used with sample data. For example, the bias of the nonresponse weighting class estimator is approximately equal to the bias of the poststratified estimator (Brick and Kalton 1996).
To illustrate the role of auxiliary variables in weighting to control bias, the bias of the
poststratified estimator is considered further. Without poststratification, the estimator is unbiased only if the response propensities are constant, the values of the characteristic y are constant, or there is no correlation between the two. With poststratification, expression (2.10) shows the estimator is unbiased if the response propensities are constant within the poststrata cells, if the y value is constant within the cells,

19
or if there is no correlation between the response propensities and the y values within cells. Thus, if the cells account for variability in either the values of the φ’s or the y’s, then the poststratified estimator will be less biased than the unadjusted estimator. Even if the cells are not well chosen for either of these purposes, it is possible that the correlation between the y values and the φ’s within cells will be smaller than the overall correlation. Again, the result is a reduction in the bias of the estimates when the poststratification variables are reasonably related to the characteristics estimated.
These arguments indicate that using data available either from the sampling frame or from
independent sources can reduce the bias due to nonresponse. For the weighting adjustments to be effective at reducing the bias, the variables used in the adjustment should be related to either the probability of responding, the characteristics being estimated, or the correlation between the two. Even if the relationships between the auxiliary variables and the response propensities and the characteristics being estimated are not strong, the adjustments may reduce bias by attenuating the correlation. Thus, a reasonable strategy for bias reduction is to choose as large a number of auxiliary variables as possible in the adjustment. The implications of using a large number of variables on the variance of the estimates must also be considered, and some methods are more suitable for attaining both bias and variance reduction than others. For example, using response propensity scores is one way to include a large number of auxiliary variables in the adjustment. Raking is an estimation method suitable when there are many variables available to be used in adjustments. For further discussion of these topics, see, Brick and Kalton (1996), Little (1986) and Lundström and Särndal (1999).

This page is intentionally blank.

21
3. SAMPLE DESIGN AND SELECTION FOR THE BIAS STUDY
3.1 Overview
A nationally representative three-stage sample of 7,500 households was selected for the NHES:2007 Bias Study. The three stages of selecting households are described in sections 3.2.1 to 3.2.3. Within sampled households, children and adults were then sampled for the School Readiness (SR), Parent and Family Involvement in Education (PFI), and Adult Education for Work-Related Reasons (AEWR) surveys using the within-household sampling algorithm developed for the main NHES:2007 random digit dialing (RDD) collection. The sample sizes for the Bias Study were set to allow for detection of a 5 percentage point bias in key statistics from each of the surveys. Within-household sampling is discussed in section 3.2.4.
3.2 Bias Study Sample Design
3.2.1 Primary Sampling Unit (PSU) Selection
At the first stage of household sample selection, 30 PSUs, defined as single counties or groups of a few contiguous counties, were randomly selected from the 50 states and the District of Columbia with probabilities of selection proportional to size. The measure of size used for PSU selection was the PSU population estimate for July 1, 2004, produced by the Census Bureau’s Population Estimates Program. One PSU was large enough that it was identified as a certainty PSU (i.e., it was brought into the sample with probability 1). The noncertainty PSUs were stratified by metropolitan status and, for metropolitan areas, further by census division and by educational attainment, as measured by the proportion of adults having a bachelor’s degree or higher. These characteristics were used for stratification because they are related to many of the survey characteristics of interest in NHES. In total, 14 strata were created so that each had approximately the same aggregate measure of size, where the stratum size is the sum of the measure of size of PSUs within the stratum. The strata definitions are provided in exhibit 3-1. Within each stratum, two PSUs were randomly selected with probabilities proportionate to the measure of size.13
13 In one stratum, 3 PSUs were selected to achieve the total of 30 sampled PSUs (29 noncertainty PSUs and 1 certainty PSU).

22
Exhibit 3-1. Strata used for PSU selection for the NHES:2007 Bias Study
Stratum Stratum definition Total stratum measure
of size 1 Non-metropolitan 19,767,100
2
Metropolitan; New England, East North Central, and West North Central census divisions; percentage with a bachelor’s degree or higher is less than 22.800 29,131,311
3
Metropolitan; New England, East North Central, and West North Central census divisions; percentage with a bachelor’s degree or higher is greater than or equal to 22.800 and less than 29.100 21,981,207
4
Metropolitan; New England, East North Central, and West North Central census divisions; percentage with a bachelor’s degree or higher is greater than or equal to 29.100 21,835,548
5
Metropolitan; Middle Atlantic census division; percentage with a bachelor’s degree or higher is less than 24.310 20,035,322
6
Metropolitan; Middle Atlantic census division; percentage with a bachelor’s degree or higher is greater than or equal to 24.310 19,480,080
7
Metropolitan; South Atlantic, East South Central, and West South Central census divisions; percentage with a bachelor’s degree or higher is less than 15.130 19,356,038
8
Metropolitan; South Atlantic, East South Central, and West South Central census divisions; percentage with a bachelor’s degree or higher is greater than or equal to 15.130 and less than 20.775 19,355,261
9
Metropolitan; South Atlantic, East South Central, and West South Central census divisions; percentage with a bachelor’s degree or higher is greater than or equal to 20.775 and less than 25.280 19,726,185
10
Metropolitan; South Atlantic, East South Central, and West South Central census divisions; percentage with a bachelor’s degree or higher is greater than or equal to 25.280 and less than 29.500 18,950,774
11
Metropolitan; South Atlantic, East South Central, and West South Central census divisions; percentage with a bachelor’s degree or higher is greater than or equal to 29.500 19,412,564
12 Metropolitan; Mountain census division ............................................................ 18,336,012
13
Metropolitan; Pacific census division; percentage with a bachelor’s degree or higher is less than 26.960 18,460,250
14
Metropolitan; Pacific census division; percentage with a bachelor’s degree or higher is greater than or equal to 26.960 18,564,462
SOURCE: Retrieved from http://www.census.gov/population/estimates/metro_general/List1.txt, (3/3/2006); Census Bureau's Population Estimates Program, 2004.

23
3.2.2 Segment Selection
At the second stage of household sample selection, 10 area segments were selected within each sampled PSU with probabilities of selection proportional to size. The measure of size for segment selection was the number of occupied housing units in the segment, as reported in the 2000 decennial census. Segments were generally census blocks or block groups, but small block groups were combined with other block groups when necessary to form segments of sufficient size. A minimum segment size of 100 occupied housing units was set in an effort to ensure the desired number of addresses per segment could be attained. Another goal of having a relatively large segment was to reduce the effects of clustering on the variance of estimates.
3.2.3 Address Selection
At the third stage of household sample selection, a two-phase sampling process was used to select addresses to obtain a final sample size of 250 addresses in each PSU. Lists of residential addresses were purchased from a vendor who maintains address lists based on the U.S. Postal Service delivery files. Since the vendor provides address lists by ZIP code, addresses were obtained for all ZIP codes within the sampled segments. Each address was then geocoded to identify the census block containing the address. Addresses located within census blocks that were included in the sample segments form the frame for address selection. In the first phase of address selection, a sample of 50 addresses was selected within each sampled segment, when possible. If fewer than 50 addresses from the vendor-provided list matched to the sampled segment, then all addresses in the segment were selected for the first phase sample.14
The group of addresses sampled in the first phase was sent to a second commercial vendor to
be matched to white pages telephone directory listings to obtain telephone numbers, where possible. Overall, 59 percent of the first phase sample addresses had matching telephone numbers. This rate varied considerably by segment, ranging from 0 percent to 90 percent. In the second phase of sampling, within each sampled segment, addresses with telephone number matches were sampled at twice the rate of addresses without telephone number matches. The oversampling of addresses with telephone number matches was done to ensure a sufficient number of cases could be attempted by telephone. An equal number of addresses was selected within each segment in the PSU, for a total of 250 addresses per PSU.15
14 This occurred in fewer than 5 percent of segments. 15 In most cases, 25 addresses were selected within each of the 10 segments in the PSU. However, in 7 PSUs, the address lists contained fewer than 25 addresses in a particular segment. In this situation, the sample sizes in the other segments in the PSU were increased to achieve the target of 250 sampled addresses per PSU.

24
3.2.4 Within-Household Sampling and Precision Requirements
For each sampled address, the primary goal was to administer a screening interview to a household respondent age 18 or older.16 As described below, the household could be contacted by phone or in person. Demographic information about household members collected in the Screener was used to determine whether anyone was eligible for the SR, PFI, or AEWR surveys. Up to three eligible persons (one per survey) could be sampled for each participating household. The within-household sampling algorithm used for the Bias Study was the same as that used for the RDD sample. The SR Survey was administered to the parent or guardian17 in the household who was most knowledgeable about the care and education of the sampled child; sampled children were ages 3 through 6, as of December 31, 2006, and were not yet in kindergarten.18 The PFI Survey was also administered to the parent or guardian who was most knowledgeable about the care and education of the sampled child; sampled children were ages 20 or younger, as of December 31, 2006, and were enrolled or homeschooled in kindergarten through twelfth grade. The AEWR Survey was administered to sampled persons 16 years or older who were not currently enrolled in twelfth grade or below and were not institutionalized or on active duty in the U.S. Armed Forces.
The sample sizes for the Bias Study were set to allow for detection of a 5 percentage point
difference (or bias) in key statistics from each of the surveys.19 For example, if the work-related adult education participation rate from the NHES:2007 RDD survey was 40 percent, and the participation rate from the Bias Study was 45 percent, such a difference would be expected to be statistically significant, and the difference would be attributable to bias. Detection of a bias of 5 percentage points was set as the criterion because smaller differences are generally of less substantive importance in NHES.
Based on address-telephone number match rates attained in NHES:2005, it was expected that
about 60 percent of cases sampled for the Bias Study (or 4,530 of the 7,500 sampled addresses) would be attempted in the field because no matching telephone number would be identified or the case would not be completed through a telephone call initiated by an interviewer in the Telephone Research Center. Among cases attempted in the field, it was expected that Screeners would be completed with about 50 16 Any household member age 18 or older was eligible to respond to the screening interview. However, if there were no household members ages 18 or older, the male or female head of the household was asked to complete the Screener. Household members were defined as persons who considered that household as their residence, kept their possessions there, and had no other place to live. 17 The respondent for the SR and PFI Surveys was identified by the Screener respondent as the household member most knowledgeable about the care and education of the sampled child. For ease of discussion, the respondent is referred to as the parent/guardian. 18 Some SR Survey items were administered about children enrolled in kindergarten through second grade. 19 The key statistics from the SR survey that were selected in order to determine necessary minimum sample sizes include participation in center-based care arrangements, recognition of all colors, ability to count higher than 10, knowing all letters, and ability to write own name. Key statistics for the PFI survey include parent participation in three or more activities in the child’s school, parent participation in home learning activities, and parent assessment of school practices. Key statistics for the AEWR survey include participation in adult education for work-related reasons and participation in employer-supported adult education.

25
percent based on the experiences in the NHES:2005 Field Test and the study of in-field follow-up conducted in conjunction with NHES:2005 RDD collection. This expectation took into account the longer field period of and the higher incentive used in the Bias Study.
The initial target was a total of 1,144 completed extended interviews (344 SR interviews,
400 PFI interviews, and 400 AEWR interviews), assuming unit response rates of 90 percent, 83 percent, and 80 percent for the SR, PFI, and AEWR surveys, respectively.20 However, aiming for these targets would have required changing the sampling algorithm used for the NHES:2007 RDD study substantially to restrict the number of persons sampled for the PFI and AEWR survey for the bias analysis. Additionally, prior to releasing cases for in-field follow-up, an option was under consideration in which Bias Study cases would be combined with RDD cases in the preparation of public-use data files. Thus, it was decided to use the same within-household sampling algorithm for the Bias Study that was used in the RDD survey. These within-household sampling rates were expected to yield 2,682 completed extended interviews (327 SR interviews, 1,108 PFI interviews, and 1,247 AEWR interviews).
The first step in the within-household sampling process was to enumerate the members of
the households. Following the enumeration, if the households had at least one preschooler, then exactly one was randomly sampled for the SR survey. If the household had at least one child ages 3 through 20 enrolled in kindergarten through twelfth grade or homeschooled, then exactly one was randomly sampled for the PFI survey. For each survey, numbers pre-assigned at the household level were used to determine which child in the household should be sampled from among all children in the household eligible for the survey.
Households were designated for adult sampling based on a random number. In households in
which an adult was to be sampled, adult education participants had twice the probability of selection of nonparticipants. Table 3-1 shows all possible household compositions for sampling adults based on the presence of children in the household and adult education participation status as reported by the Screener respondent; the table also gives the respective domain probabilities of selection for adults or the likelihood that an adult would be selected, given the composition of his or her household. The maximum rate at which adults in households without children were sampled was 55 percent. That is, in 45 percent of households without children, no adult was sampled.
Exhibit 3-2 summarizes key design features of the Bias Study.
20 These expected extended interview unit response rates are slightly higher than the rates attained in recent NHES surveys of the same or similar subpopulations, because in-person interviews generally attain higher unit response rates than telephone interviews (Hox and de Leeuw 1994; Aquilino and Wright 1996; Leon et al. 2003).

26
Table 3-1. Overview of the sampling scheme for selecting adults based on household composition: NHES:2007
Household composition Domain probability of selection
Child in household Adult education
participant Adult education
nonparticipant Adult education
participant Adult education
nonparticipant No 0 0.2728 No 0.5456 0 No 0.3637 0.1819 Yes 0 0.1364 Yes 0.2728 0 Yes 0.1819 0.0909 SOURCE: U.S. Department of Education, National Center for Education Statistics, National Household Education Surveys Program (NHES), 2007.
Exhibit 3-2. Key design features of the NHES:2007 Bias Study Characteristic Type of sample Address sample Mode of data collection CATI (originating in Telephone Research
Center) for cases finalized in Telephone Research Center; CATI (via cell phone or home phone) for cases attempted in the field
Instrument Expanded Screener (see section 4.2) and
standard NHES:2007 extended interviews Respondent Standard NHES respondents Cases attempted in the field Follow-up with telephone nonrespondents
and telephone nonmatches Number of PSUs (sites) 30 Number of screener cases attempted
(total across sites) 7,500 Expected number of Screeners
completed by Telephone Research Center-initiated call 2,970 Expected number of Screeners
completed in field 2,265 Expected number of completed extended interviews (total across
sites) 2,682 SOURCE: U.S. Department of Education, National Center for Education Statistics, National Household Education Surveys Program (NHES), 2007.

27
4. BIAS STUDY DATA COLLECTION
This chapter provides a detailed description of the data collection procedures for the Bias Study. It describes the telephone interviewing procedures for Bias Study cases, the recruitment and training of Bias Study interviewers, case priorities, procedures designed to increase respondent cooperation, special procedures for language problem and refusal cases, and refielding of nonresponse cases. A summary of the process can be found in exhibit 4-1.
4.1 Procedures for Bias Study Cases Prior to In-Person Efforts
As described in section 3.2.3, all addresses in the first phase sample for the Bias Study were sent to a vendor to be matched with a telephone number. Addresses that were matched to telephone numbers were subsampled at about twice the rate of nonmatched addresses to arrive at the final (second phase) sample of addresses. In all, the sample consisted of 5,433 addresses matched to a telephone number and 2,067 cases that were not matched. The in-field procedures for the nonmatch cases are discussed in section 4.2. In order to evaluate nonresponse bias, cases that were matched with a telephone number were first attempted by telephone from the Telephone Research Center (TRC). These cases followed the same telephone interviewing protocol as NHES:2007 random digit dialing (RDD) cases. All nonhostile21 nonresponse cases and cases that were found to be incorrectly matched to a telephone number or potentially incorrectly matched to a telephone number were sent for in-person follow-up. The telephone procedures are discussed in the next section. The non-telephone matched addresses were sent to the field for in-person efforts without first being tried in the TRC.
4.1.1 Initial Contact Procedures Prior to In-Person Efforts
The TRC attempted to complete an interview with all households for which a telephone number had been matched to an address sampled for the Bias Study. Prior to calling any of the matched households, a letter was sent on U.S. Department of Education stationery explaining the purpose of the call with a $2 cash incentive enclosed to draw attention to the importance of the study. The advance letter provided information about the study, its sponsorship, and its purpose (appendix A). Then, using the same
21 Nonhostile cases are those that were not deemed abusive or profane.

28
Exhibit 4-1. Data collection process for household Screeners: NHES:2007 Bias Study sample
Bias Study sample
(n=7,500)
Matching telephone number?
Attempted in TRC
(n = 5,433)
Result of initial telephone effort
Nonmatch cases
(n=2,067)
Attempted to gain cooperation in field
and complete telephone interview
Yes No
TRC respondents(n=2,345)*
Hostile refusals and final other nonresponse
(n=51)
Mismatched cases
(n=1,509)
TRC nonresponse
cases (n=1,528)
Field respondents(TRC nonresponse
cases)(n=1,890)
Field respondents (Nonmatch and Mismatch cases)
(n=659)
Field nonrespondents or ineligibles
(n=2,555)
Have telephone in household?
Telephone household field
respondents
Nontelephone household field
respondents
* Includes 109 potential mismatches and 1 RDD duplicate that were not sent to the field. TRC: Telephone research center; FT/RT: Full treatment and reduced treatment; FTO: Full treatment only; n: Number of households
Yes No
Result of field effort
FT/RT
FT/RTFTO

29
telephone interviewing protocol followed for the NHES:2007 RDD sample, Bias Study cases were called by a TRC interviewer to identify households with eligible respondents. The interviewer was unaware whether the case was from the RDD sample or Bias Study sample. Once a household was reached, the interviewer administered a brief screening interview (referred to hereafter as the Screener) to a member of the household age 18 or older.22 The Screener responses determined if any of the household members were eligible for the SR, PFI, or AEWR surveys, and the within-household sampling algorithm was used to sample persons for the extended interview surveys (see section 3.2.4).
Just as with the RDD sample, TRC-initiated telephone data collection for the Bias Study
sample began on January 2, 2007 and ended on May 6, 2007.
4.1.2 Assigning Cases to Telephone Interviewers
For Bias Study cases that were matched to a telephone number and first attempted in the TRC, the same calling scheme used for RDD cases was used. That is, cases were prioritized for efficiency as follows:
cases that had specific appointments;
cases that had resulted in busy signals 15 minutes earlier;
cases that had resulted in noncontact at a scheduled appointment time;
cases that had unspecified appointment/general callback times for the time period;
cases that had not been contacted on previous attempts and had not been attempted during the time period; and
initial cases.
Initial attempts to contact households and determine the presence of household members eligible for extended interviews were conducted in two groups separated by a one-week hold period: a group of four calls consisting of two evening calls, one daytime call, and one weekend call; and a group of three calls, consisting of two evening calls and a weekend call on a different day than the previous weekend call. If contact had not been made with either a household member or an answering machine
22 In rare cases, a household may have no members ages 18 or older. In these cases, the Screener was administered to the male or female head of household.

30
after these two sets of calls, the case was sent to a vendor for 14 additional calls to be made by predictive dialing.23 If contact had not been made with a household member but an answering machine had been reached, the cycles of four calls and three calls were repeated. All cases that were no answer-answering machine cases were randomly subsampled to receive a total of 21 or 28 call attempts.24
Once a household member was contacted, up to 20 call attempts were made to complete the
Screener with a household member, except in the case of language problem or refusal cases, described below. Once a household member was sampled as the subject of an extended interview, up to 20 call attempts were made to complete the interview with the identified parent/guardian respondent (for the SR and PFI surveys) or the sampled adult (for the AEWR survey).
When a Screener was completed and household members were selected for extended
interviews, the interviewer would first attempt to complete any interviews for which the Screener respondent was selected, because he or she was already on the telephone. If other household members were selected, the interviewer asked to speak with them after completing any applicable interviews (or making a callback appointment) with the Screener respondent. Telephone callback attempts were made as necessary to make contact with respondents to extended interviews.
Non-English language/language problem cases. When English-only interviewers
encountered a case in which the respondent indicated he or she did not speak English or had a hearing or speech impairment, they attempted to ascertain whether any adult household member spoke English or could communicate clearly enough to respond to the interview. If they were not successful, the case was coded one of three interim language problem statuses: hearing/speech problem, probable Spanish language, or another language. Specially trained interviewers recontacted the hearing/speech problem cases and attempted to complete an interview. Bilingual interviewers recontacted the Spanish language cases. Cases coded as non-English and non-Spanish were available to all interviewers, who recontacted the household in an effort to identify an English- or Spanish-speaking household member. If a Spanish-speaking household member was identified, the case was recoded as a Spanish language case and made available to bilingual interviewers.
23 Predictive dialing is a process in which telephone numbers are automatically dialed and are routed to an attendant or operator when a telephone number is answered. The attendant identifies him or herself as an interviewer for the subcontractor and asks if the telephone number is for residential or business use. Calls resulting in no contact are not routed to an attendant or operator; they are automatically handled and classified as noncontact by a computer system. 24 The variation in number of attempts was introduced initially for the purpose of survival method to estimate residency rates. However, the survival method was not ultimately used.

31
Refusal conversion. Whenever a refusal occurred, the interviewer recorded general demographic information about the refusing respondent (e.g., sex, approximate age) and the respondent’s reasons for refusing to participate if any had been given. Interviewers also rated the strength of the refusal as mild, firm, or hostile. Although the distinction between the mild and firm classifications is subjective, these two classes of refusals receive the same contact protocol; the distinction simply serves to inform future interviewers of the nature of the refusals. In the NHES:2007 Bias Study, mild or firm refusal cases were released after a 13-day hold for a conversion attempt. TRC supervisors reviewed all cases coded as hostile to determine whether that designation was merited. Any cases rated as hostile that were judged by the supervisor to be inappropriately coded were recoded to firm refusals and were eligible to be released for a conversion attempt. Truly hostile (profane or abusive) refusal cases were never released for conversion. In addition, households that contacted the National Center for Education Statistics (NCES) directly and declined to participate were excluded from refusal conversion.
4.1.3 Bias Study Cases Sent for In-Person Efforts
Of the 5,433 Bias Study cases attempted by the TRC, 2,235 were completed in the TRC. Another 42 cases were coded as hostile refusals and 9 were finalized as other nonresponse (e.g., the only member of the household was suffering from dementia as reported by the full-time nurse who answered the call) in the TRC and were not sent for in-person efforts. Also, in 115 cases, respondents gave a slightly different address than the sampled address or the respondent refused to provide the household’s physical address so the address could not be confirmed. A total of 23 of these 115 potential mismatches were initially sent to the field for address-telephone number verification. Later, a decision was made not to send the remaining 92 cases out to the field based on time constraints and the results of the subsample of 23 cases sent to the field; approximately 74 percent (17 out of 23) were verified as correct address-telephone matches and the other 6 were incorrect matches. Based on the results of the subsample of 23 cases sent to the field, the 109 potential mismatch cases (17 verified as correct in the field plus 92 not sent out) were ultimately classified as telephone respondents. A total of 2,378 out of 5,433 cases with telephone numbers were not sent for in-person efforts (2,235 completes, 42 hostile refusals, 9 other nonresponse, and 92 potential mismatch cases).

32
The 5,122 cases sent to the field included the remaining 3,055 cases first attempted in the TRC and the 2,067 cases without a telephone match. Table 4-1 presents the distribution of nonmatch, mismatch, nonresponse, and RDD duplicate cases (discussed in detail below) sent for in-person follow-up.
Table 4-1. Distribution of Bias Study cases sent for in-person efforts: NHES:2007 Bias Study Cases sent for in-person data collection Number Total 5,122 Nonmatch cases (address not matched to telephone number) 2,067
Cases attempted but not completed by the TRC 3,055 Mismatched cases Incorrect residential telephone number match 108 Nonworking or nonresidential telephone number 1,394 Potential address-telephone number mismatch 23
Nonresponse cases Language problem 48 Maximum call 477 Noncontact 310 Nonhostile refusal 693
RDD duplicate cases 2 SOURCE: U.S. Department of Education, National Center for Education Statistics, National Household Education Surveys Program (NHES), 2007.
Cases sent for in-person data collection included four kinds of cases: (1) address cases not
matched to a telephone number, (2) address cases incorrectly matched to a telephone number, (3) nonresponse cases such as language problem cases, maximum call cases, noncontact cases, and refusal cases, and (4) a small number of cases that were duplicate RDD sample cases. The following describes each in turn:
Nonmatch cases were those cases for which a telephone number could not be matched to a
sampled address (2,067 cases).

33
Mismatched cases include the following:
incorrect residential telephone match cases (108 cases) in which the address provided by a respondent during the telephone interview was completely different from the sampled address;25
addresses matched to nonworking or nonresidential telephone numbers (1,394 cases); and
potential address-telephone mismatches (23 were sent for in-person follow-up) were cases attempted in the TRC for which the respondent-provided address was slightly different than the sampled address, or the respondent refused to provide the household’s physical address so the address could not be confirmed. If the address-telephone match was verified, the case was finalized as complete, i.e., as a telephone respondent. If the case was verified as a mismatch, the survey information in the CATI (computer-assisted telephone interviewing) system was cleaned out because it was collected with the wrong household. The field interviewer returned to the household to gain cooperation when the CATI was ready to accept information on the case that was sampled for the study. Six potential mismatch cases were verified as address-telephone number mismatches and of those six, two were completed when a field interviewer returned to the household.
Nonresponse cases include the following:
Language problem cases (48 cases) are those cases sent to the field that were coded
in the TRC as households in which a language other than English or Spanish appeared to be spoken, or cases that were coded as hearing or speech problems.
Maximum call cases (477 cases) are those cases that reached the maximum call limit in the TRC. The cases in the maximum call group may have had one language problem or up to two nonhostile refusals in its history but finalized as a maximum call case (i.e., up to 20 calls had been made without completing a Screener).
Noncontact cases (310 cases) are those that resulted in no human contact and no answering machine or only answering machine contact but no human contact.
Nonhostile refusal cases (693 cases) are those that refused three times on the telephone, or were in refusal status when the TRC data collection period closed. They were sent to the field as nonhostile refusals; refusal cases were sent additional mailings and an additional $2 in incentive cash.
25 For these cases, the data collected in the TRC was cleaned out of CATI prior to sending the case to the field.

34
RDD duplicate cases were those cases for which telephone numbers sampled for the main RDD study and resulting in completed Screeners were duplicates of telephone numbers matched to sampled addresses for the Bias Study. These cases were sent to the field to confirm that the telephone number was matched to the correct address. One of the 2 cases was confirmed to have been completed with the correct address; the other was found to have been completed with a household whose address did not match the one sampled for the Bias Study and was re-fielded.
All Bias Study cases were sent a letter on U.S. Department of Education stationery
explaining the purpose of the study and its sponsor prior to in-person data collection efforts. Cases that were first called by a TRC interviewer before being sent to the field were sent the letter and a $2 incentive (previously described in section 4.1.1) when telephone data collection began. Cases that were not matched to a telephone number were sent a similar letter on March 13, just prior to the beginning of in-person field efforts. Letters sent to non-matched cases did not contain a cash incentive because field interviewers would be arriving at those addresses with a $20 incentive to complete the Screener (the standard incentive offered by the in-person interviewers, as discussed in section 4.2).
4.1.4 Recruitment and Training of Bias Study Field Interviewers
Recruitment of supervisors for the NHES:2007 Bias Study began in November 2006. Five supervisors, previously employed by Westat as field supervisors in different regions of the U.S., were recruited to hire and supervise field interviewers in their respectively assigned PSUs. Regions were roughly assigned to supervisors by each supervisor’s home location. In January 2007, supervisors began recruiting field interviewers for their assigned regions. Supervisors were instructed to hire two interviewers per PSU who were experienced in field interviewing methods. All field interviewers were recruited from lists of previously employed field interviewers or through connections to the supervisor.
In-person training was held in Rockville, Maryland, on March 15, 2007, for supervisors and
on March 16 and 17, 2007 for field interviewers. Five interviewers were trained later at various times over the course of the Bias Study data collection period because they were unable to attend training on the training dates or were hired after the field training. In total, 66 interviewers were trained, 10 of whom were bilingual in English and Spanish and 12 of whom were travelers who were willing to conduct interviews in other regions. As with TRC interviewers, supervisors and field interviewers were required to sign a notarized Affidavit of Nondisclosure and a Westat confidentiality pledge to adhere to the

35
confidentiality procedures outlined in the Field Worker Guide (exhibits 4-2 and 4-3), as well as undergo a U.S. Department of Education security background check.
Supervisor training. Prior to training, several conference calls with all of the supervisors
were scheduled in which field interviewer recruitment progress and in-person study procedures were discussed with the project director and field manager. In addition, before the in-person training mentioned above, supervisors were mailed a supervisors’ manual, a field interviewers’ manual, and supplemental printed materials to help them understand NHES, the purpose of the Bias Study, and their role as supervisors. Supervisors’ training consisted of a half day of informal lecture and a half day of training on the Basic Field Operating System (BFOS) used for managing cases.
Field interviewer training. Field interviewers were mailed a field interviewer manual,
along with other printed home-study materials and exercises to be completed prior to training. Twelve hours of classroom training for field interviewers consisted of lectures, cell-phone training, and hands-on role-plays and practices. At the conclusion of training all field interviewers had to successfully complete a certification exercise before they could begin field work.

36
Exhibit 4-2. NCES Affidavit of Nondisclosure: NHES:2007 Bias Study ______________________________________ ___________________________________ (Job Title) (Date of Assignment to NCES Project) ______________________________________ ___________________________________ (Organizations, State or local (NCES Data Base or File Containing agency or instrumentality) Individually Identifiable Information) _______________________________________ (Address) I, __________________________________, do solemnly swear (or affirm) that when given access to the subject NCES data base or file, I will not (i) use or reveal any individually identifiable information furnished, acquired,
retrieved or assembled by me or others, under the provisions of Section 406 of the General Education Provisions Act (20 U.S.C. 1221e-1) for any purpose other than statistical purposes specified in the NCES survey, project or contract;
(ii) make any disclosure or publication whereby a sample unit or survey respondent could be identified or the date furnished by or related to any particular person under this section can be identified; or
(iii) permit anyone other than the individuals authorized by the Commissioner of the National Center for Education Statistics to examine the individual reports.
________________________________________ (Signature) (The penalty for unlawful disclosure is a fine of not more than $250,000 (under 18 U.S.C. 3559 and 3571) or imprisonment for not more than 5 years, or both. The word “swear” should be stricken out wherever it appears when a person elects to affirm the affidavit rather than to swear to it.) State of Maryland County of ______________________________ Sworn and subscribed to me before a Notary Public in and for the aforementioned County and State this ___________________ day of _________________ (year). ________________________________________ (Notary Public)

37
Exhibit 4-3. Westat Confidentiality Pledge: NHES:2007 Bias Study
WESTAT EMPLOYEE OR CONTRACTOR’S ASSURANCE OF CONFIDENTIALITY OF SURVEY DATA
Statement of Policy Westat is firmly committed to the principle that the confidentiality of individual data obtained through Westat surveys must be protected.
This principle holds whether or not any specific guarantee of confidentiality was given at time of interview (or self-response), or whether or not there are specific contractual obligations to the client. When guarantees have been given or contractual obligations regarding confidentiality have been entered into, they may impose additional requirements which are to be adhered to strictly.
Procedures for Maintaining Confidentiality
1. All Westat employees and field workers shall sign this assurance of confidentiality. This assurance may be superseded by another assurance for a particular project.
2. Field workers shall keep completely confidential the names of respondents, all information or opinions collected in the course of interviews, and any information about respondents learned incidentally during field work. Field workers shall exercise reasonable caution to prevent access by others to survey data in their possession.
3. Unless specifically instructed otherwise for a particular project, an employee or field worker, upon encountering a respondent or information pertaining to a respondent that s/he knows personally, shall immediately terminate the activity and contact her/his supervisor for instructions.
4. Survey data containing personal identifiers in Westat offices shall be kept in a locked container or a locked room when not being used each working day in routine survey activities. Reasonable caution shall be exercised in limiting access to survey data to only those persons who are working on the specific project and who have been instructed in the applicable confidentiality requirements for that project.
Where survey data have been determined to be particularly sensitive by the Corporate Officer in charge of the project or the President of Westat, such survey data shall be kept in locked containers or in a locked room except when actually being used and attended by a staff member who has signed this pledge.
5. Ordinarily, serial numbers shall be assigned to respondents prior to creating a machine-processible record and identifiers such as name, address, and Social Security number shall not, ordinarily, be a part of the machine record. When identifiers are part of the machine data record, Westat’s Manager of Data Processing shall be responsible for determining adequate confidentiality measures in consultation with the project director. When a separate file is set up containing identifiers or linkage information which could be used to identify data records, this separate file shall be kept locked up when not actually being used each day in routine survey activities.
6. When records with identifiers are to be transmitted to another party, such as for keypunching or key taping, the other party shall be informed of these procedures and shall sign an Assurance of Confidentiality form.
7. Each project director shall be responsible for ensuring that all personnel and contractors involved in handling survey data on a project are instructed in these procedures throughout the period of survey performance. When there are specific contractual obligations to the client regarding confidentiality, the project director shall develop additional procedures to comply with these obligations and shall instruct field staff, clerical staff, consultants, and any other persons who work on the project in these additional procedures. At the end of the period of survey performance, the project director shall arrange for proper storage or disposition of survey data including any particular contractual requirements for storage or disposition. When required to turn over survey data to our clients, we must provide proper safeguards to ensure confidentiality up to the time of delivery.
8. Project directors shall ensure that survey practices adhere to the provisions of the U.S. Privacy Act of 1974 with regard to surveys of individuals for the Federal Government. Project directors must ensure that procedures are established in each survey to inform each respondent of the authority for the survey, the purpose and use of the survey, the voluntary nature of the survey (where applicable) and the effects on the respondents, if any, of not responding.
PLEDGE
I hereby certify that I have carefully read and will cooperate fully with the above procedures. I will keep completely confidential all information arising from surveys concerning individual respondents to which I gain access. I will not discuss, disclose, disseminate, or provide access to survey data and identifiers except as authorized by Westat. In addition, I will comply with any additional procedures established by Westat for a particular contract. I will devote my best efforts to ensure that there is compliance with the required procedures by personnel whom I supervise. I understand that violation of this pledge is sufficient grounds for disciplinary action, including dismissal. I also understand that violation of the privacy rights of individuals through such unauthorized discussion, disclosure, dissemination, or access may make me subject to criminal or civil penalties. I give my personal pledge that I shall abide by this assurance of confidentiality. ________________________________
Signature

38
4.2 Bias Study In-Person Data Collection Procedures
In-person data collection began on March 19, 2007 and ended on June 24, 2007. Cases were distributed to field interviewers in three releases via signature-required FedEx. The first release of cases (3,601 cases in total; 2,067 of which were nonmatch cases) was shipped to field interviewers such that the cases would arrive at their home address on March 19. A large portion of these cases were nonmatch cases because many of the cases that were matched to a telephone number had yet to go through the full telephone-interviewing protocol in the TRC. The second release of cases was shipped to field interviewers around April 10, 2007 and contained 567 cases. The third release of cases was shipped around May 9, 2007 and contained 954 cases. All cases in the second and third releases were cases that had been attempted in the TRC.
In addition to some basic office supplies, interviewers received four main tools for
conducting the in-person follow-up. These tools included the Household Folder (HHF) (appendix B), the Household Information Sheet (HIS), a cellular telephone, and an NHES photo ID badge (the HHF and HIS form are described briefly below). Before approaching a sampled residence, field interviewers’ first task was to note observations about the neighborhood and the sampled address using an Interviewer Observation Form (IOF) (appendix C). The IOF was intended to capture observations on a number of factors including urbanicity, neighboring area land use (e.g., residential, commercial, or industrial), neighborhood and household affluence, indicators of neighborhood safety or household security, indicators of children in the area, and language diversity.
Once the IOF was completed, the interviewer’s job was to verify that the address was a
dwelling unit (defined in exhibit 4-9), verify the address label on the HHF (and telephone number if there was one) with a resident of the household, and attempt to gain cooperation, i.e., complete an interview. In order to facilitate this effort, the field interviewers offered a cash incentive of $20 for completing the Screener interview. Upon gaining cooperation, field interviewers would connect the respondent with the TRC on either a Westat-provided cellular telephone or on a household telephone via a toll-free number to complete the survey. The TRC interviewer would proceed with an expanded Screener. The expanded Screener contained additional questions about the household and its members and was only administered to cases sent for in-person follow-up.26 If the respondent who was selected for an extended interview had a household telephone and it was used to call into the TRC, the extended interview could be continued on 26 The additional questions in the expanded Screener were repeated in the extended interview for sampled Screener respondents. Data from the additional questions in the expanded Screener were collected for possible analytic use in cases in which the extended interview was not completed. The question wording was similar to the corresponding question in the extended interview.

39
the household telephone and the field interviewer could leave once the Screener was completed. If the respondent was selected for an extended interview and did not have a household telephone or did not want to use the household telephone, the extended interview continued on the Westat cellular telephone. However, not all extended interviews in the household could be completed immediately after the Screener. In these instances, the interviewer either made arrangements with the TRC to call the respondent back at a specified time, or the field interviewer returned to the household at an agreed upon date and time to complete the interview.
In addition to the study telephone, HHF, HIS, and badge, field interviewers were provided
with supplemental materials to handle a variety of nonresponse and other situations. These materials included the following:
“Sorry I missed you” cards indicating a call attempt (i.e., a visit to the household in
the context of the in-person follow-up) when household members were not at home (appendix D);
appointment cards to write an appointment time, the field interviewer’s name, and the study cellular telephone number at which the interviewer could be reached for the respondent (appendix E);
study brochures;
copies of the advance letter and copies of community letters to be shown to community officials, such as local police departments and home owner’s associations, to establish legitimacy;
a Spanish translation card for English-speaking field interviewers to gain cooperation with a Spanish-speaking respondent; and
Spanish versions of many of the materials for Spanish-speaking respondents.
If, upon locating a dwelling unit, the interviewer learned that there were no residents home or the only person home was under 18 years of age, the interviewer was instructed to either leave a “Sorry I Missed You” card in a discreet location or with a youth, or to ask the youth for a time when an adult would be available and leave an appointment card with an approximate time when the interviewer would return.
In-person calls by field interviewers followed a similar time slice procedure as those
telephone calls placed when cases were being attempted in the TRC. That is, contact attempts varied by day and by time to maximize the possibility of finding a respondent at home, including weekday

40
evenings, weekday daytimes, and weekends. Field interviewers made up to 10 follow-up attempts at each address in their assignment with the caveat that they would not revisit a household that refused in person without first consulting their supervisor. In order to efficiently work cases, interviewers were instructed to plan their household visits such that they could make calls on several cases in the same or close-by segments on the same trip, prioritizing appointments first, followed by new cases, and then all other cases.
At a designated time each week, the field interviewer would hold a reporting call with a field
supervisor. Each case the field interviewer attempted that week was reviewed with the field supervisor, and the field supervisor would determine if the case was to be reattempted, reassigned, or given a final disposition code (i.e., closed out, with no further attempts). The field supervisors then entered all contact attempts and results into BFOS. The NHES field manager in the Rockville office monitored the BFOS and held a weekly individual meeting with each supervisor to discuss any problems or field interviewer needs. A weekly conference call that included all field supervisors, the project director, and the field manager was held at the end of each week during data collection and for several weeks after data collection ended to discuss overall progress, any changes in protocol, new cases being sent to the field, and any outstanding problems.
4.2.1 Key Data Collection Tools
Field interviewers were supplied with a number of tools to help them gain cooperation during in-person efforts and to collect important observational information about each case. The key tools included the Interviewer Observation Form (IOF) (discussed at the beginning of section 4.2), the Household Folder (HHF), the Household Information Sheet (HIS), and the Field Non-Interview Report (NIR). The HHF, HIS, and NIR are briefly discussed below.
Household Folder. Each HHF indicated the sampled address, the telephone number (if one
had been matched to the sampled address), and a script that the field interviewer was to follow upon making contact with a household member (appendix B). Interviewers were instructed to locate the address, indicate the time and date of the visit, type of dwelling unit (e.g., stand alone home, townhouse or rowhouse, apartment, etc.), and briefly discuss the outcome of the visit, any problems encountered, or important observations on the back of the HHF.
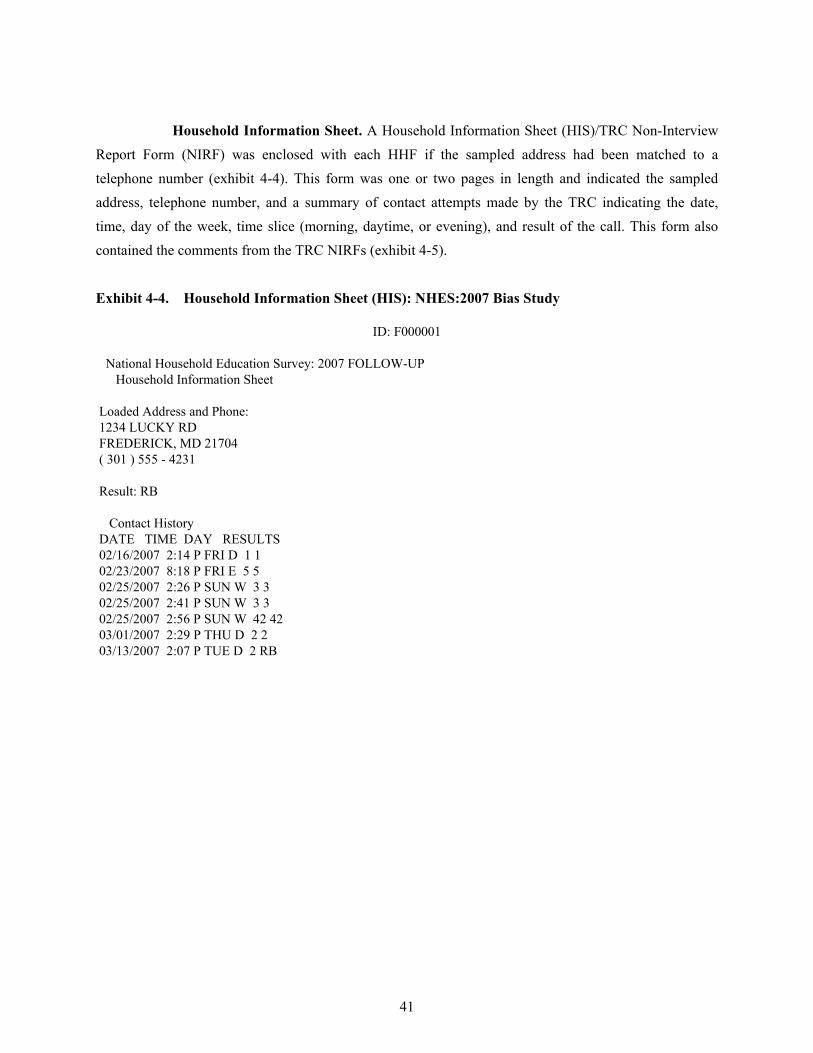
41
Household Information Sheet. A Household Information Sheet (HIS)/TRC Non-Interview Report Form (NIRF) was enclosed with each HHF if the sampled address had been matched to a telephone number (exhibit 4-4). This form was one or two pages in length and indicated the sampled address, telephone number, and a summary of contact attempts made by the TRC indicating the date, time, day of the week, time slice (morning, daytime, or evening), and result of the call. This form also contained the comments from the TRC NIRFs (exhibit 4-5).
Exhibit 4-4. Household Information Sheet (HIS): NHES:2007 Bias Study
ID: F000001 National Household Education Survey: 2007 FOLLOW-UP Household Information Sheet Loaded Address and Phone: 1234 LUCKY RD FREDERICK, MD 21704 ( 301 ) 555 - 4231 Result: RB Contact History DATE TIME DAY RESULTS 02/16/2007 2:14 P FRI D 1 1 02/23/2007 8:18 P FRI E 5 5 02/25/2007 2:26 P SUN W 3 3 02/25/2007 2:41 P SUN W 3 3 02/25/2007 2:56 P SUN W 42 42 03/01/2007 2:29 P THU D 2 2 03/13/2007 2:07 P TUE D 2 RB

42
Exhibit 4-5. Telephone Center Non-Interview Report Form (NIRF): NHES:2007 Bias Study ( 301 ) 555 - 4231 DATE OF NIRF: 03/01/07 TIME OF NIRF: 14:29:37 REASONS REFUSED SCREENER NIRF FR SAYS --SORRY WE'RE NOT ANSWERING ANY Q--AN D IMMEDIATELY HUNG UP BEFORE I COULD SAY ANYT HING REFUSED BY A FEMALE MILD-NO HOSTILITY ------------ ( 301 ) 555 - 4231 DATE OF NIRF: 03/13/07 TIME OF NIRF: 14:07:48 REASONS REFUSED SCREENER NIRF FR SAID SOMETHING ABT SOMEONE NOT BEING THERE NOW THEN HUNG UPclick REFUSED BY A FEMALE MILD-NO HOSTILITY
A Field Non-Interview Report Form (NIRF) was filled out for each household where an
interview was not completed (appendix F). Information collected on the NIRF included obtained and observable demographics of the would-be respondent/refuser (name, sex, age, race), type of nonresponse (e.g., language, maximum call, refusal, other), and reason for refusal or interview breakoff (i.e., the respondent decides to terminate the interview before completion).
4.2.2 Other Field Procedures
Some of the sampled addresses were apartment buildings, but the vendor-provided address did not indicate an apartment number. In situations like these, if there was a telephone match and the respondent confirmed that address (with the change that there should be an apartment number), then that household (at the address corresponding to the matching telephone number) was retained. Otherwise, field interviewers were instructed to collect specific information about an apartment building in order to randomly sample one or more apartment numbers (depending on the number of addresses originally sampled in the building). Specifically, interviewers counted the number of cases they had at that address, counted the total number of apartments in the building at a sampled address, and noted how the apartments were numbered (e.g., whether apartments were numbered 101-110, 201-210, 301-310; versus A1-A10, B1-B10, C1-C10). Once interviewers compiled this information, the field manager used a

43
random sampling algorithm to select apartment numbers for the study. Field interviewers returned to the address to gain cooperation from those sampled units.
4.2.3 Final Household Dispositions
Cases could be finalized with one of several different final field disposition codes. These dispositions were used in BFOS to record the status of the field effort (exhibit 4-6). There were some discrepancies between the BFOS status and the CATI status (i.e., the final status captured by the CATI system) of some cases. For example, if a field interviewer left the household before the extended interview was completed, there may have been a breakoff or language problem of which the interviewer was unaware. The BFOS and CATI were reconciled at the end of data collection. Results are reported in table 4-2 using the final disposition codes recorded after this reconciliation was complete. However, composite dispositions that take into account the final TRC disposition (i.e., the CATI status at the end of the TRC-initiated attempts) were derived for use in weighting and computing unit response rates. Also in table 4-2, among cases that were sent to the field for address-phone match verification, only the field effort results of those cases that were found to be mismatched are reported (6 cases out of 23 potential mismatch cases were found to be mismatched; 1 case out of 2 RDD duplicates was found to be a mismatch), since for the remaining cases, the TRC-initiated results were retained.
Completed cases (C1, C2, C3). In-person field efforts resulted in 998 completed Screeners
where no one in the household was sampled for an extended interview (C1); 1,106 sampled households had both completed Screeners and extended interviews (C2); and 447 households had a completed Screener but one or more extended interviews were never completed (C3).
Refusal cases (RB). If, during an in-person visit, a household member refused to participate,
and the refusal was not hostile and no one in the household had refused before (in-person or by telephone), then a letter on U.S. Department of Education stationery was sent by FedEx to the sampled address further explaining the importance of the study. Field interviewers were instructed to attempt to gain cooperation again about two weeks after the letter had been mailed. In-person refusal letters were sent to 426 households during the in-person data collection. Any refusal that was deemed hostile either in the TRC or in person was coded as a final refusal and a field interviewer did not attempt refusal conversion. In-person refusal cases that had also refused at least once by telephone or had one prior in-person refusal (i.e., a member of the household refused twice to a field interviewer) were closed as final refusals. There were 1,100 final Screener refusals as the result of in-person efforts.

44
Exhibit 4-6. Final Household Field Disposition Codes: NHES:2007 Bias Study
Final disposition Code Explanation Completed—no extended interviews
needed C1 This code was used when the TRC completed the Screener
and no extended interviews were required. Completed—Screener and one or more
extended interviews C2 This code was used if the respondent completed the
Screener and any or all extended interviews were also completed.
Completed Screener—one or more extended interviews outstanding
C3 This code was used if the respondent completed the Screener, and one or more extended interviews remained to be completed in the household.
Refusal/breakoff RB This code was used if a household member refused to participate or broke off before completing the Screener with the TRC interviewer.
Maximum call MC This code was used if a field interviewer was unable to make a successful contact with the household after making 10 visits, on different days and at different times.
Language LP This code was used when no one in the household spoke English or Spanish or there was a speech or hearing problem.
No Entry NE This code was used for a locked building or gated community.
Not Found NF This code was used when an interviewer could not locate a valid address.
Vacant/Demolished/Condemned NV A case was coded as vacant if no one lived in the residence or the residence was demolished or condemned.
Not a Dwelling Unit ND This code was used when an address did not fit the definition of a dwelling unit. Businesses were coded “ND”.
Other NO Any other result not described above, such as a respondent who was too ill to participate.
SOURCE: U.S. Department of Education, National Center for Education Statistics, National Household Education Surveys Program (NHES), 2007.

45
Table 4-2. Final results of in-person data collection: NHES:2007 Bias Study
Results of in-person efforts of Bias Study
Cases sent for in-person data collection
Total number C1 C2 C3 RB MC LP NE NF NV ND NO
Total1 5,104 997 1,106 447 1,101 635 95 56 14 397 93 163Nonmatch cases (address not matched to telephone) 2,067 435 471 178 379 245 31 33 9 186 37 63Mismatched cases Incorrect residential telephone number match 108 22 23 6 20 14 1 0 0 11 4 7 Nonworking or nonresidential telephone number 1,394 299 328 126 243 139 17 6 3 153 38 42 Potential address-telephone number mismatch2 6 1 0 1 2 1 0 0 0 0 0 1Nonresponse cases Language problem 48 7 4 0 5 2 27 0 0 2 0 1 Maximum call 477 64 100 55 110 94 7 6 1 14 6 20 Noncontact 310 48 70 22 57 64 3 5 0 22 1 18 Nonhostile refusal 693 121 110 59 285 75 9 6 1 9 7 11RDD duplicate cases3 1 0 0 0 0 1 0 0 0 0 0 01 Excludes 18 cases sent to the field for which addresses were verified as being the ones sampled for the Bias Study. These cases were considered to be the TRC completes. 2 Twenty-three potential address-telephone number mismatch cases were sent to the field for address-telephone number match verification. Six of the cases were found to be address-telephone number mismatches and were attempted by field interviewers and two of those were completed in the field. Only the field result of the six mismatch cases are reported in the table. 3 Two sampled addresses for these cases were matched to telephone numbers that were identical to telephone numbers sampled for the main RDD NHES:2007 study. They were sent to the field to verify that the address-telephone match was correct. One was found to be an incorrect address-telephone match and is reported in the table. NOTE: The results of the in-person efforts are coded as follows (see exhibit 4-6 for more detailed descriptions of these codes): C1, C2, C3: Screener completed; RB: Refusal/breakoff; MC: Maximum call; LP: Language, speech, or hearing problem; NE: No entry; NF: Not found; NV: Vacant/ demolished/condemned; ND: Not a dwelling unit; NO: Other. SOURCE: U.S. Department of Education, National Center for Education Statistics, National Household Education Surveys Program (NHES), 2007.

46
Maximum call cases (MC). In order to close out a case as a maximum call, field interviewers must have made at least 10 in-person attempts with a minimum of three attempts on weekends, three attempts in the evening (after 6 p.m.) on different days of the week, two attempts in the afternoon on different days of the week, and two attempts in the morning on different days of the week. In the final two weeks of the Bias Study data collection, this maximum call criterion was reduced to five contact attempts, to ensure that efforts were spread across all remaining cases. When a case was classified as a final maximum call case, with a supervisor’s approval, the field interviewer left a postcard that contained four questions about the household (exhibit 4-7) and a $5 cash incentive. Out of 635 maximum call Screener cases, postcards were returned for 222 cases, or 35 percent of them. Exhibit 4-7. Maximum Call Postcard: NHES:2007 Bias Study
SORRY WE MISSED YOU! We had hoped to interview you for the National Household Education Surveys Program, an important research study sponsored by the National Center for Education Statistics of the U.S. Department of Education. The study is completed and we will not attempt to reach you again. However, for statistical purposes, will you please take a minute to complete this postcard? We know that your time is valuable, and as a token of our appreciation we are enclosing$5. After responding to the questions, please use the attached sticker to seal it with the mailing address on the outside, and then mail it back to us. If you have any questions about the survey, please feel free to contact Westat, the social science research firm conducting the survey at 1-888-696-5672.
Please answer the following questions by placing a check mark (√) in the appropriate box. Your answers are confidential and the information will be used for statistical purposes only.
How many people currently live in this household?
One Two or three Four or more
How many children (under 18 years old) currently live in this household?
None One Two or three Four or more
Is your home:
Owned (with a mortgage, or paid in full)?
Rented? Other arrangement?
What is the highest level of education completed by anyone in your household?
Bachelor’s degree or higher High school diploma Less than a high school diploma
Thank you very much for your time. <Print Field ID at bottom>

47
Language problem cases (LP). The NHES interviews could be conducted in English or Spanish, and bilingual TRC interviewers were available to conduct the interview in either language. Field interviewers were instructed that, if they were not bilingual and they encountered a non-English, Spanish-speaking household, they could attempt to gain cooperation using a translation card (exhibit 4-8) to introduce the purpose of their visit and connect to a bilingual TRC interviewer. If they were unable to gain cooperation using the translation card, interviewers then attempted to verify the address and telephone information and then notify their supervisor so that the case could be reassigned to a bilingual field interviewer. If the language spoken in the household was something other than English or Spanish, the case was closed out as a “Language Problem.” Ninety-five Screener cases were finalized as language problems due to speech or hearing difficulties or because the language spoken in the household was something other than English or Spanish.
Exhibit 4-8. Translation card text: NHES:2007 Bias Study
English text: I work for Westat, a social science research company in Maryland. I am working on the National Household Education Surveys Program, which is a research study sponsored by the U.S. Department of Education. Are you a member of this household and at least 18 years old? I only speak English, but we are conducting interviews by telephone and have Spanish-speaking interviewers who can explain the study to you. Using my cell phone, will you allow me to call our telephone research center so that you can speak with someone who speaks Spanish? We're offering $20 to households that complete the initial screening interview. Thank you. Spanish text: Trabajo para Westat, una firma localizada en el estado de Maryland que hace investigación en el área de las ciencias sociales. Trabajo para el Programa Nacional de Encuestas en Hogares sobre Educación, el cual es un estudio patrocinado por el Departamento de Educación de los Estados Unidos. ¿Es usted miembro de este hogar y tiene por lo menos 18 años de edad? Yo hablo solamente inglés, pero estamos realizando entrevistas por teléfono y tenemos entrevistadores que hablan español; ellos le pueden explicar de qué se trata el estudio. ¿Me permite usar mi celular para llamar a nuestro centro de investigación para que usted pueda hablar con alguien que habla español? Estamos ofreciendo $20 a los hogares que completan la entrevista inicial. Muchas gracias.

48
No Entry (NE). Some interviewers encountered apartment buildings that were security-locked or communities that were gated. Most security-locked buildings contained entryways with intercom systems. Field interviewers were instructed to use the intercom system to explain the reason for the visit if they could not gain entry. For both gated communities and locked buildings, if the interviewer could not gain access after several tries, or if there was no intercom system, they were instructed to present the Community Authorization letter (appendix A) to the manager of the building or the security company used to monitor the community to help explain the importance of NHES. In 56 cases, field interviewers were never able to gain entry to the building or the community to complete a Screener.
Not Found (NF). In 14 cases field interviewers could not locate an address. The code of not
found was only used after attempting to find the address using three different resources. Additional resources included internet search engines, local post offices, the local fire or police departments, real estate agencies, and citizens in the area.
Vacant, demolished, or condemned (NV). A dwelling unit was coded as vacant,
demolished, or condemned if upon the field interviewer’s first visit the residence was vacant, demolished, or condemned. If, during their initial contact with a household, the field interviewer made contact with a household member and verified the address, and later returned to conduct the Screener and found that the household was vacant, demolished, or condemned, the case was given a final code of “NO” for other nonresponse, and notes about the case were made on the HHF. A total of 397 sent to the field were finalized as vacant, demolished, or condemned.
Not a dwelling unit (ND). Field interviewers were expected to identify whether or not an
address was a dwelling unit (DU) and the type of DU. In most cases, field interviewers did not have difficulty determining whether an address was a DU. Generally, Bias Study addresses were associated with a detached house, an apartment, or one house in a row of houses, such as a townhome or half of a duplex. Structures that did not qualify as DUs were institutional group quarters, such as a halfway house or other institution with 10 or more unrelated residents, military barracks and BOQs (Bachelor Officer’s Quarters), dormitories, penal institutions (e.g., jails, prisons), hospitals, homes for the aged, nursing homes, and businesses.
Exhibit 4-9 gives the definition of a DU used for purposes of this study. A total of 93
addresses did not fit the study definition of a DU.

49
Exhibit 4-9. Dwelling unit defined: NHES:2007 Bias Study
A dwelling unit is a house, an apartment, a mobile home or trailer, a group of rooms or a single room occupied as separate living quarters or, if vacant, intended for occupancy as separate living quarters. Separate living quarters are those in which the occupants live and eat separately from any other individuals in the building and have direct access from the outside of the building or through a common hall.
Field interviewers also indicated the type of DU structure located at the address
(exhibit 4-10). There were 3,043 field cases that were coded as stand-alone homes; 512 were coded as town homes or duplexes; 1,230 were coded as apartments; and 176 were coded as something other than stand-alone home, town home or duplex, or apartment. The remaining cases were missing a code for DU type.
Exhibit 4-10. Dwelling unit structure type: NHES:2007 Bias Study
DU STRUCTURE TYPE SA Stand-alone home TH Town home or Duplex AP Apartment, Flat OS Other, Specify
Other (NO). The code “NO,” or other nonresponse, was used when all other final result
codes did not apply. For example, when all household respondents were unavailable during the entire field period because of vacation or because the residence was used as a seasonal home, this code would be used. Other examples of when this code was used are when the only adult respondent was too ill to participate or when the address was initially confirmed by a resident but upon an interviewer’s second visit the residence was vacant. One hundred and sixty-three cases were coded “other” nonresponse.

50
4.2.4 Known Problems
In designing the Bias Study, Westat used past field studies as a guide for anticipating possible problems that could occur and for developing procedures and approaches to address these potential problems. This approach proved successful in heading off operational problems in most instances. For example, Westat developed, from experience in previous field tests, a method for sampling apartment numbers in instances when a sampled address should, but did not, have an apartment number provided by the vendor (apartment sampling procedures are described in section 4.2.2). Most of the problems encountered during the 2007 Bias Study were related to the fact that the Bias Study was a much larger, national sample compared to samples used in previous tests of in-person follow-up, and the previous field tests required fewer field interviewers and only one supervisor. Because the Bias Study was conducted on a larger scale, it presented a challenge in staffing the TRC to meet the needs of the field at any given time. Prior to in-person data collection, procedures were developed to coordinate field interviewer and telephone interviewer schedules, such as field interviewers supplying a weekly projection of days and times they would work and real-time text messaging to inform the TRC of actively working field interviewers. Despite these efforts, coordinating schedules was difficult on a large scale because issues such as weather could affect field operations.
Other issues that were not apparent in previous field tests were the potential difficulties of
tracking extended interview progress in the field. As a result of the experience in the NHES:2007 Field Test, additional field codes were developed before data collection for the Bias Study to keep field supervisors informed of outstanding extended interviews. However, the BFOS for the 2007 Bias Study was not developed to maintain details about the specific extended interview(s) outstanding or the respondent(s) sampled for the interview(s). This kind of information is important if a field interviewer is expected to return to a household to secure cooperation from a specific respondent. While procedures were implemented during data collection to meet interviewer needs in order to secure cooperation in the Bias Study, the process of tracking this type of information would be more efficiently and seamlessly gathered if collected using BFOS.
Communication to and with field interviewers was also more difficult in a large study. In
previous field tests, when there were fewer field interviewers and only one field supervisor, communication of procedural changes or respondent refusals to the TRC was more direct. Relaying information in real-time was much easier because there were fewer supervisors and interviewers to

51
inform. The use of laptops by field interviewers and regular checking of project email would increase the efficiency of communication in future studies.
Other issues arose during the Bias Study data collection that were not related to the relative
scale of the study in relation to past field studies. One was the relative ease for falsifying maximum call postcards. One way to reduce the potential for falsification of maximum call postcards is to develop a minimum percentage of maximum call postcards selected for validation for each field interviewer. Although a small number of falsified maximum call postcards were detected, these were removed from processing and new maximum call postcards were sent to the affected addresses. Thus, information from these falsified maximum call postcards has no effect on the analysis given in this report.
4.3 Final Sample Yield
The total numbers of completed cases by data collection stage for the RDD sample and the Bias Study sample are provided in table 4-3. The counts for the Bias Study reflect both the initial telephone data collection efforts and the in-person data collection efforts. There were a total of 54,034 Screeners completed for the RDD survey, and 4,894 Screeners completed for the Bias Study.
Table 4-3. Number of completed cases by data collection stage: NHES:2007 RDD sample; NHES:2007 Bias Study sample
Data collection stage RDD sample Bias Study sample Screener 54,034 4,894 Extended interview School Readiness (SR) 2,633 292 Parent and Family Involvement in Education (PFI) 10,681 1,123 Adult Education for Work-Related Reasons (AEWR) 7,710 1,065
SOURCE: U.S. Department of Education, National Center for Education Statistics, National Household Education Surveys Program (NHES), 2007.
4.4 Characterization of Bias Study Cases
As described above, for cases in the Bias Study sample with a matching telephone number, a TRC interviewer first attempted to gain cooperation (i.e., to complete an interview) by phone before sending cases to the field. Of the 7,500 sampled cases for the Bias Study, 2,396 were finalized (i.e.,

52
received a final disposition code) in the TRC. These include the 2,378 cases with telephone numbers that were not sent for in-person efforts (2,235 completes, 42 hostile refusals, 9 other nonresponse, 92 potential mismatch cases), plus the 17 potential mismatches and 1 RDD duplicate that were confirmed in the field to have been completed with the correct household over the phone. The remaining 5,104 cases were finalized in the field. The distribution of cases into these two groups is summarized in table 4-4.
Table 4-4. Distribution of Bias Study cases: NHES:2007 Bias Study Subgroup Sample size Percent of total Total Bias Study sample 7,500 100.0 Finalized in Telephone Research Center 2,396 31.9 Completes 2,235 29.8 Hostile refusals 42 0.6 Other nonresponse 9 0.1 Potential mismatches1 109 1.5 RDD duplicate 1 # Finalized in field2 5,104 68.1 No matching telephone number 2,067 27.6 Mismatched telephone number3 1,509 20.1 Telephone nonresponse cases 1,528 20.4
# Rounds to zero. 1 Includes 92 potential mismatches not sent to the field and 17 sent to the field and confirmed to have been completed with the correct household. 2 Finalized in field means the case received a final disposition code in the field, where the disposition codes are indicated in exhibit 4-6. Finalized cases include completes as well as nonresponding and ineligible cases. 3 Includes 1,394 cases with nonworking or nonresidential telephone numbers, 108 cases with an incorrect telephone number match, 6 potential mismatches determined to have been completed with the wrong household over the phone, and 1 RDD duplicate determined to have been completed with the wrong Bias Study case. NOTE: Detail may not sum to totals because of rounding. SOURCE: U.S. Department of Education, National Center for Education Statistics, National Household Education Surveys Program (NHES), 2007.
In order to assess the quality of the addresses obtained for the Bias Study sample, an address
disposition (separate from the Screener dispositions previously discussed) was coded for each case that was sent to the field. Table 4-5 gives distributions of address dispositions for the Bias Study cases that were finalized in the field. Of the cases finalized in the field, 97 percent had a correct address (or correct with a minor change). This percentage was approximately equal for cases previously attempted in the TRC (the telephone nonrespondent columns of table 4-4) and those that were not (the nonmatch or mismatch columns of table 4-4). Therefore, most of the addresses from the address lists appeared to be valid.

53
Table 4-5. Distributions of address dispositions for Bias Study cases finalized in the field: NHES:2007 Bias Study
Total finalized in field Nonmatch or
mismatch Telephone
nonrespondent
Address disposition Sample
size Percent Sample
size Percent Sample
size Percent Total 5,104 100.0 3,576 100.0 1,528 100.0 Correct address or correct with minor change 4,950 97.0
3,470 97.0
1,480 96.9
No entry 56 1.1 39 1.1 17 1.1 Address not found 14 0.3 12 0.3 2 0.1 Unable to confirm address1 65 1.3 42 1.2 23 1.5 Other2 19 0.4 13 0.4 6 0.4
1 Includes field nonresponse cases for which the addresses were not clearly displayed or confirmed from other sources. 2 Examples include addresses believed to be outside of the sampled county and gutted apartment buildings. NOTE: Detail may not sum to totals because of rounding. SOURCE: U.S. Department of Education, National Center for Education Statistics, National Household Education Surveys Program (NHES), 2007.
An analysis of the number of attempts required to finalize a case (i.e., to assign the case a
final disposition code) may be used to assess and understand the amount of effort expended. The number of attempts to finalize a Screener is shown in figures 4-1 through 4-3 for cases finalized in the TRC, telephone nonresponse cases, and cases with no matching telephone number or a mismatched telephone number, respectively. As evident in figure 4-1, Screener completes (i.e., successfully completed Screener cases) were finalized quickly by phone. Also, figure 4-3 shows that more than 2,700 of the 3,576 nonmatch/ mismatch cases received one or fewer phone attempts for the Screener. This indicates that instances of mismatched phone numbers were often identified on the first phone attempt, where they were determined to be a mismatch either because the phone number was nonworking or nonresidential or the address provided by the respondent in the telephone interview did not match the sampled address. For telephone nonresponse cases (figure 4-2), a large number of attempts were made in the TRC before sending the cases to the field.
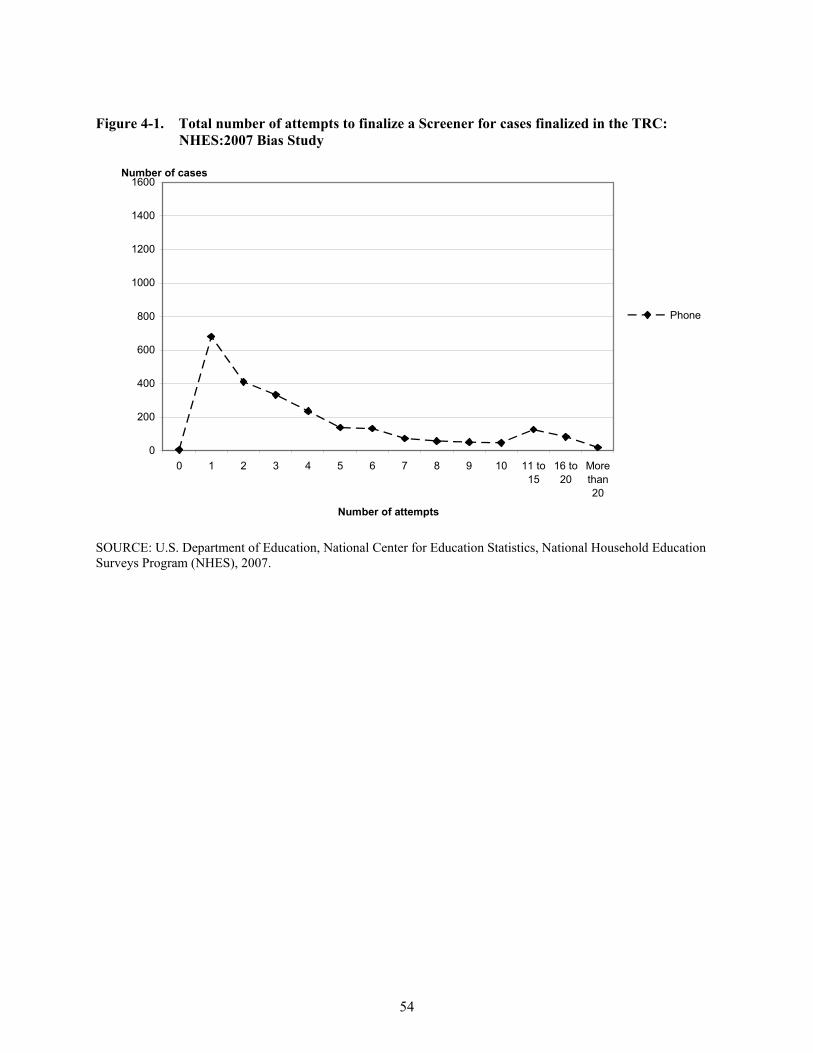
54
Figure 4-1. Total number of attempts to finalize a Screener for cases finalized in the TRC: NHES:2007 Bias Study
0
200
400
600
800
1000
1200
1400
1600
0 1 2 3 4 5 6 7 8 9 10 11 to15
16 to20
Morethan20
Number of attempts
Number of cases
Phone
SOURCE: U.S. Department of Education, National Center for Education Statistics, National Household Education Surveys Program (NHES), 2007.

55
Figure 4-2. Total number of attempts to finalize a Screener for telephone nonresponse cases: NHES:2007 Bias Study
0
200
400
600
800
1000
1200
1400
1600
0 1 2 3 4 5 6 7 8 9 10 11 to15
16 to20
Morethan20
Number of attempts
Number of cases
OverallPhoneField
NOTE: Overall number of attempts is the sum of the number of phone attempts to finalize a Screener and the number of field attempts to finalize a Screener for a given case. SOURCE: U.S. Department of Education, National Center for Education Statistics, National Household Education Surveys Program (NHES), 2007.

56
Figure 4-3. Total number of attempts to finalize a Screener for nonmatch and mismatch cases: NHES:2007 Bias Study
0
200
400
600
800
1000
1200
1400
1600
0 1 2 3 4 5 6 7 8 9 10 11 to15
16 to20
Morethan20
Number of attempts
Number of cases
OverallPhoneField
NOTE: Overall number of attempts is the sum of the number of phone attempts to finalize a Screener and the number of field attempts to finalize a Screener for a given case. SOURCE: U.S. Department of Education, National Center for Education Statistics, National Household Education Surveys Program (NHES), 2007.

57
Figure 4-4. Number of attempts to ascertain residential status of household: NHES:2007 Bias Study
0
500
1000
1500
2000
2500
0 1 2 3 4 5 6 7 8 9 10 Morethan10
Number of attempts
Number of cases
Nonmatch and mismatchNoncontact in TRCOther
NOTE: The “Other” category consists of cases for which the residency status was determined in the initial TRC effort, i.e. cases that were finalized in the initial TRC effort and cases that were sent to the field after having been coded a language problem, maximum call, or refusal in the TRC. SOURCE: U.S. Department of Education, National Center for Education Statistics, National Household Education Surveys Program (NHES), 2007.
It took an average of 3.8 attempts to finalize a Screener as complete, nonresponse, or nonresidential in the field. As shown in table 4-6, this varied by the final household field disposition, with nonrespondents requiring almost twice as many attempts as completes, and over twice as many attempts as cases finalizing as nonresidential. Having not been previously attempted by phone, cases with no matching phone number required a greater number of attempts in the field to finalize as complete or nonresponse than the telephone nonresponse cases (e.g., language problem, maximum call, noncontact, and refusal). No such pattern is evident for final nonresidential dispositions. In general, households that had refused the Screener in the TRC required fewer attempts overall to obtain a final disposition code than the other TRC results.

58
Table 4-6. Percentage of cases finalized in field and mean number of field attempts, by final household field disposition and TRC result: NHES:2007 Bias Study
Percentage of cases finalized in field Mean number of field attempts TRC result
Total finalized in field Completes Nonrespondents Nonresidential Total Completes Nonrespondents Nonresidential
Total 5,104 50.0 40.2 9.9 3.8 2.9 5.3 2.4 No matching telephone number 2,067 52.4 36.3 11.2 4.1 3.2 6.0 2.5 Mismatched telephone number1 1,509 53.5 32.7 13.9 3.7 2.9 5.5 2.3 Language problem 48 22.9 72.9 4.2 3.1 3.0 3.1 3.0 Maximum call 477 45.9 49.7 4.4 3.9 2.7 5.2 1.6 Noncontact 310 45.2 47.4 7.4 4.0 2.6 5.6 3.0 Refusal 693 41.7 55.8 2.5 2.9 2.2 3.5 1.5
1 Excludes the 17 potential mismatches and 1 RDD duplicate that were verified as having been completed with the correct household in the TRC. NOTE: The percentage of cases finalized in the field by final household disposition may not sum to 100 because of rounding. The final household field dispositions correspond to the codes in exhibit 4-6 as follows: Completes: C1, C2, and C3; Nonrespondents: RB, MC, LP, NE, and NO; Nonresidential: NF, NV, and ND. SOURCE: U.S. Department of Education, National Center for Education Statistics, National Household Education Surveys Program (NHES), 2007.

59
Residency status (i.e., whether the address is residential or nonresidential) was generally determined on the first attempt. The number of attempts to ascertain residency status is shown in figure 4-4. The number of attempts is plotted separately for cases with no matching telephone number or a mismatched telephone number, cases coded as non-contact in the TRC before being sent to the field, and all other Bias Study cases.27 For nonmatch or mismatch cases and cases coded non-contact in the TRC, the number of attempts reflects the field effort only, since residency status was never determined by phone.
The number of refusals for cases finalized in the TRC, telephone nonresponse cases, and
cases with no matching telephone number or a mismatched telephone number, respectively, is shown in table 4-7. Most of the refusals were by phone. Overall refusal for telephone nonresponse cases and nonmatch and mismatch cases is the sum of the number of refusals by telephone and the number of refusals in field before a give case was finalized in field. For example, if a case ever refused to finalize a Screener once by telephone and once in field, it was counted as a case with 2 refusals in table 4-7.
Characteristics of the three sets of Bias Study cases that completed an extended interview—
cases finalized in the TRC, telephone nonresponse cases, and nonmatches and mismatches—are provided in tables 4-8 to 4-10 for SR respondents, PFI respondents, and AEWR respondents, respectively. The frequencies are unweighted and are intended only as a description of the sample. A limited comparison of the three sets of cases is provided below as a first look at potentially noteworthy differences. However, the purpose of the frequencies is not to provide an evaluation of bias. Weighted frequencies for the evaluation of bias are provided in chapters 7 and 8. The percentages reflect skip patterns; the denominators include only respondents to the item.
27 All other Bias Study cases consist of cases for which the residency status was determined in the initial TRC effort (i.e., cases that were finalized in the initial TRC effort and cases that were sent to the field after having been coded a language problem, maximum call, or refusal in the TRC).

60
Table 4-7. Number and percentage of cases, by number of refusals and subgroups: NHES:2007 Bias Study
Cases finalized in the Telephone
Research Center Telephone nonresponse cases Nonmatch and mismatch cases
Refusals by telephone Overall refusals
Refusals by telephone1 Refusals in field Overall refusals
Refusals by telephone1 Refusals in field
Cases classified by number of refusals
Sample size Percent
Sample size Percent
Sample size Percent
Sample size Percent
Sample size Percent
Sample size Percent
Sample size Percent
Total 2,396 † 1,528 † 1,528 † 1,528 † 3,576 † 3,576 † 3,576 † Cases with 0 refusal 1,438 60.0 398 26.0 503 32.9 1,023 67.0 2,633 73.6 3,387 94.7 2,759 77.2Cases with 1 refusal 633 26.4 211 13.8 175 11.5 444 29.1 593 16.6 134 3.7 553 15.5Cases with 2 or more refusals 325 13.6 919 60.1 850 55.6 61 4.0 350 9.8 55 1.5 264 7.4† Not applicable. 1 Primarily refusals obtained in the initial TRC data collection effort, but also includes refusals over the telephone during the in-person effort. NOTE: Detail may not sum to totals because of rounding. SOURCE: U.S. Department of Education, National Center for Education Statistics, National Household Education Surveys Program (NHES), 2007.

61
Table 4-8. Characteristics of Bias Study School Readiness (SR) respondents: NHES:2007 Bias Study
Finalized in Telephone
Research Center Telephone
nonrespondents Nonmatches and
mismatches
Characteristic Sample
size Estimate Sample
size Estimate Sample
size Estimate Total 103 100.0 47 100.0 142 100.0 Participation in center-based care 66 64.1 34 72.3 77 54.2 Recognizes all colors 86 83.5 42 89.4 121 85.2 Counts to 20 or higher 69 67.0 33 70.2 96 67.6 Knows all letters 39 37.9 15 31.9 39 27.5 Can write own name 67 65.0 35 74.5 91 64.1 Census region Northeast 31 30.1 15 31.9 16 11.3 Midwest 31 30.1 6 12.8 36 25.4 South 28 27.2 12 25.5 50 35.2 West 13 12.6 14 29.8 40 28.2 Home ownership Own 84 81.6 36 76.6 81 57.0 Rent/other 19 18.4 11 23.4 61 43.0 Age 3–4 85 82.5 41 87.2 118 83.1 5–6 18 17.5 6 12.8 24 16.9 Grade Not enrolled 36 35.0 14 29.8 62 43.7 Preschool 67 65.0 33 70.2 80 56.3 NOTE: Detail may not sum to totals because of rounding. SOURCE: U.S. Department of Education, National Center for Education Statistics, National Household Education Surveys Program (NHES), 2007.

62
Table 4-9. Characteristics of Bias Study Parent and Family Involvement in Education (PFI) respondents: NHES:2007 Bias Study
Finalized in Telephone
Research Center Telephone
nonrespondents Nonmatches and
mismatches
Characteristic Sample size Estimate Sample
size Estimate Sample
size Estimate Total 498 100.0 164 100.0 461 100.0 Parents participate in 5 or more activities in the child’s school1 249 51.1 88 54.3 229 50.4 Parents report school provides information very well About how child is doing in school 299 61.4 100 61.7 269 59.3 About how to help child with his/her homework 224 46.0 76 46.9 225 49.6 About why child is placed in particular groups or classes 210 43.1 77 47.5 209 46.0 About how to help child plan for college or vocational school 116 41.0 32 36.0 89 37.6 About the family's expected role at child’s school 239 49.1 79 48.8 221 48.7 Parents took 3 or more outings with child in the past month2 254 51.0 87 53.0 218 47.3 Parents check to see that child's homework gets done 365 79.0 137 90.1 383 90.8 Census region Northeast 110 22.1 50 30.5 86 18.7 Midwest 146 29.3 29 17.7 95 20.6 South 132 26.5 54 32.9 157 34.1 West 110 22.1 31 18.9 123 26.7 Home ownership Own 431 86.5 129 78.7 277 60.1 Rent/other 67 13.5 35 21.3 184 39.9 See notes at end of table.

63
Table 4-9. Characteristics of Bias Study Parent and Family Involvement in Education (PFI) respondents: NHES:2007 Bias Study—Continued
Finalized in
Telephone Research Center Telephone
nonrespondents Nonmatches and
mismatches
Characteristic Sample size Estimate Sample
size Estimate Sample
size Estimate Age 3–6 62 12.4 21 12.8 67 14.5 7–8 65 13.1 25 15.2 84 18.2 9–10 69 13.9 27 16.5 61 13.2 11–12 73 14.7 20 12.2 64 13.9 13–14 70 14.1 23 14.0 63 13.7 15–16 93 18.7 30 18.3 83 18.0 17–20 66 13.3 18 11.0 39 8.5 Grade Kindergarten 40 8.0 15 9.1 36 7.8 1–2 56 11.2 23 14.0 82 17.8 3–4 80 16.1 23 14.0 77 16.7 5–6 72 14.5 23 14.0 59 12.8 7–8 74 14.9 26 15.9 74 16.1 9–10 80 16.1 26 15.9 73 15.8 11–12 96 19.3 28 17.1 60 13.0 1 Any five or more of the following: Attended a general school meeting (FSMTNG); attended a meeting of the parent-teacher organization or association (FSPTMTNG); went to a regularly scheduled parent-teacher conference with the child’s teacher (FSATCNFN); attended a school or class event, such as a play, dance, sports event, or science fair because of the child (FSSPORT); served as a volunteer in the child’s classroom or elsewhere in the school (FSVOL); participated in fundraising for the school (FSFUNDRS); served on a school committee (FSCOMMTE); and met with a guidance counselor in person (FSCOUNSLR). 2 Any three or more of the following: Visited a library (FOLIBRAY); visited a bookstore (FOBOOKST); went to a play, concert, or other live show (FOCONCRT); visited an art gallery, museum, or historical site (FOMUSEUM); visited a zoo or aquarium (FOZOO); attended an event sponsored by a community, religious, or ethnic group (FOGROUP); and attended an athletic or sporting event (outside of school) in which the child was not a player (FOSPRTEV). NOTE: Detail may not sum to totals because of rounding. SOURCE: U.S. Department of Education, National Center for Education Statistics, National Household Education Surveys Program (NHES), 2007.

64
Table 4-10. Characteristics of Bias Study Adult Education for Work-Related Reasons (AEWR) respondents: NHES:2007 Bias Study
Finalized in Telephone
Research Center Telephone
nonrespondents Nonmatches and
mismatches
Characteristic Sample
size Estimate Sample
size Estimate Sample
size Estimate Total 530 100.0 134 100.0 401 100.0 Participation in adult education for work-related reasons 221 41.7 62 46.3 212 52.9 Participation in distance education 130 57.0 34 53.1 121 54.5 Sex Male 203 38.3 43 32.1 185 46.1 Female 327 61.7 91 67.9 216 53.9 Adult education participation status from screener Participant 268 50.6 72 53.7 225 56.1 Nonparticipant 262 49.4 62 46.3 176 43.9 AEWR respondent was Screener respondent Yes 169 31.9 34 25.4 104 25.9 No 361 68.1 100 74.6 297 74.1 Census region Northeast 143 27.0 26 19.4 90 22.4 Midwest 132 24.9 28 20.9 75 18.7 South 129 24.3 54 40.3 131 32.7 West 126 23.8 26 19.4 105 26.2 Home ownership Own 467 88.1 101 75.4 226 56.4 Rent/other 63 11.9 33 24.6 175 43.6 NOTE: Detail may not sum to totals because of rounding. SOURCE: U.S. Department of Education, National Center for Education Statistics, National Household Education Surveys Program (NHES), 2007.
65
The three Bias Study groups are similar on certain key characteristics, such as whether the SR-eligible child can count to 20 or higher, whether the parents participate in 5 or more activities at the PFI-eligible child’s school, and the participation in distance education for adults. For example, 67 percent of SR respondents who finalized in the TRC indicated that their children were able to count to 20 or higher, compared to 70 percent for the telephone nonrespondents and 68 percent for the nonmatches and mismatches.
However, there are some differences between the groups. For instance, the rate of home
ownership is lower for cases that had no matching phone number or a mismatched phone number. For PFI respondents, the home ownership rate was 60 percent for cases with nonmatches and mismatches, compared to 87 percent for cases finalized in the TRC, and 79 percent for telephone nonrespondents.

This page is intentionally blank.

67
5. UNIT AND ITEM RESPONSE RATES
Unit and item nonresponse are generally regarded as important measures of survey quality. Response rates are of concern because survey estimates could potentially suffer from nonresponse bias if those who respond to a survey or item are very different from those who do not. This chapter presents the unit and item response rates for the 2007 National Household Education Surveys Program (NHES:2007) Bias Study. Unit response rates are defined (section 5.1) and an analysis of unit response rates is presented for the Screener (section 5.2). Unit response rates are also given for each of the three extended interview surveys, the School Readiness Survey (SR), the Parent and Family Involvement in Education Survey (PFI), and the Adult Education for Work-Related Reasons Survey (AEWR) (section 5.3). Item response rates are discussed in section 5.4.
5.1 Definition of Unit Response Rates
A unit response rate is the ratio of the number of units with completed interviews (for example, the units could be telephone numbers, households, or persons) to the number of units sampled and eligible for the interview. In some cases, these rates are easily defined and computed, while in other cases the denominator of the ratio must be estimated.
For reporting the results from the Bias Study, the overall unit response rate indicates the
percentage of possible interviews that were completed taking all survey stages into account, while the unit response rate measures the percentage of interviews that were completed for a specific stage of the survey. Specifically, household members were identified for interviews in a two-stage process, with a Screener interview conducted before an extended interview. Screener interviews were conducted to enumerate and sample household members, and then questionnaires were administered for the sampled members. If the responding household member failed to complete the first-stage Screener, no members could be sampled for other interviews. Under this design, the unit response rate for the first stage is the estimated percentage of households that completed the Screener. The unit response rate for the second stage (SR, PFI, or AEWR interviews) is the percentage of sampled persons that completed these extended interviews. The overall unit response rate is the product of the first- and second-stage unit response rates (i.e., the Screener unit response rate multiplied by the extended interview unit response rate).

68
Unit response rates and overall unit response rates can be either unweighted or weighted. The unweighted rate, computed using the raw number of cases, provides a useful measure of the success of the operational aspects of the survey. That is, the unweighted rate indicates the proportion of residential cases attempted that were successfully completed. The weighted rate, computed by summing the base weights (usually the reciprocals of the probability of selecting the units) for both the numerator and denominator, gives a better measure of the success of the survey with respect to the population sampled since the weights allow for inference of the sample data (including response status) to the population level. When analyzing survey data, estimates are typically computed using adjusted survey weights. (See chapter 6 for a discussion of the computation of the adjusted survey weights for the Bias Study.) However, weighted unit response rates, which include sums of weights of both unit respondents and unit nonrespondents, are computed using base weights. The unweighted and weighted unit response rates are usually similar unless the probabilities of selection and the unit response rates in the categories with different selection probabilities vary considerably. All of the unit response rates discussed in this chapter are base weighted unless noted specifically in the text, since the main purpose of this chapter is to describe the success of the survey with respect to the survey population.
5.2 Screener Unit Response Rates
The unit response rates use the weighted number of responding households as the numerator, and the total number of households as the denominator. For the RDD sample, the number of households needs to be estimated because the residential status of all the telephone numbers is not known. Various approaches are available; the vendor-assisted method was used for the NHES:2007 RDD sample (Hagedorn et al. 2008). Estimating the denominator is not an issue for the Bias Study because the residential status of each sampled address is known.
Two sets of unit response rates were computed for the Bias Study: the reduced treatment
response rates and the full treatment response rates. In the reduced treatment, the Telephone Research Center (TRC) status is treated as the final household status for Bias Study cases attempted in the TRC, and the field status is treated as the final household status for nonmatch and mismatch cases. In the full treatment, the final household status is based on efforts in both the TRC and in the field for cases attempted in the TRC, and the field status is the final household status for nonmatch and mismatch cases. For example, a case that was a final refusal in the TRC but responded to the Screener in the field is treated as a nonrespondent in the reduced treatment but as a respondent in the full treatment. Exhibit 5-1 shows how cases were classified for the reduced and full treatments. Table 5-1 shows the disposition of the
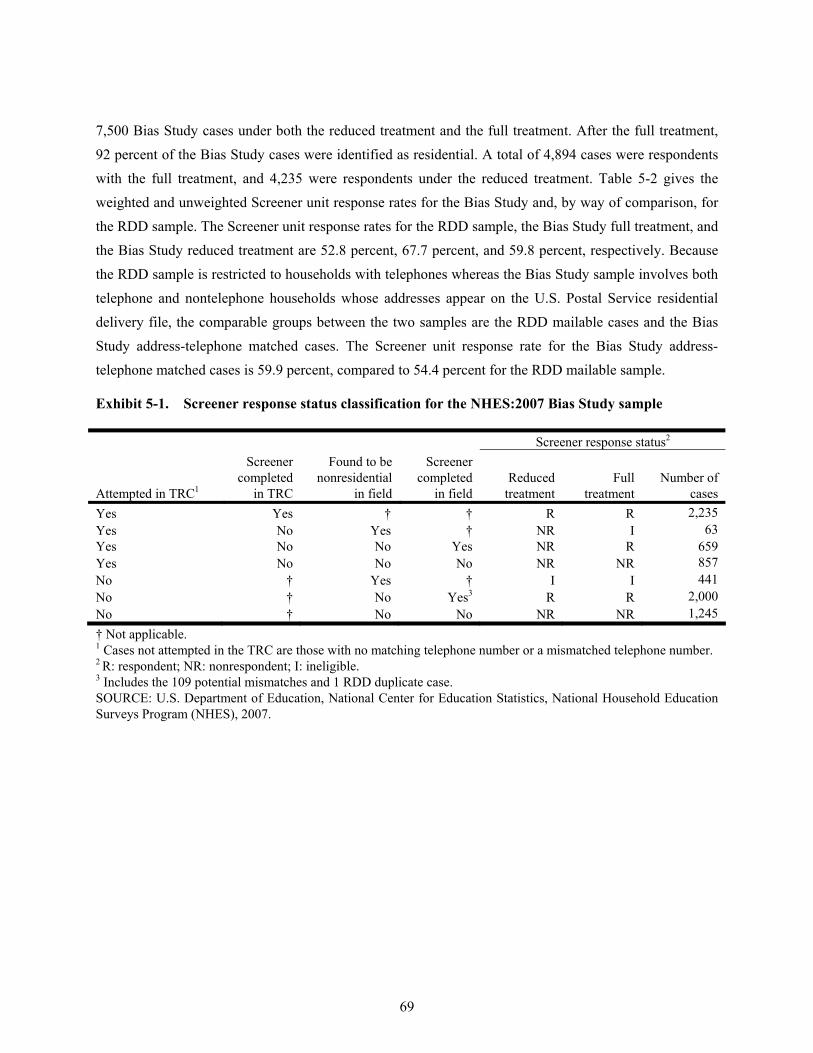
69
7,500 Bias Study cases under both the reduced treatment and the full treatment. After the full treatment, 92 percent of the Bias Study cases were identified as residential. A total of 4,894 cases were respondents with the full treatment, and 4,235 were respondents under the reduced treatment. Table 5-2 gives the weighted and unweighted Screener unit response rates for the Bias Study and, by way of comparison, for the RDD sample. The Screener unit response rates for the RDD sample, the Bias Study full treatment, and the Bias Study reduced treatment are 52.8 percent, 67.7 percent, and 59.8 percent, respectively. Because the RDD sample is restricted to households with telephones whereas the Bias Study sample involves both telephone and nontelephone households whose addresses appear on the U.S. Postal Service residential delivery file, the comparable groups between the two samples are the RDD mailable cases and the Bias Study address-telephone matched cases. The Screener unit response rate for the Bias Study address-telephone matched cases is 59.9 percent, compared to 54.4 percent for the RDD mailable sample. Exhibit 5-1. Screener response status classification for the NHES:2007 Bias Study sample Screener response status2
Attempted in TRC1
Screener completed
in TRC
Found to be nonresidential
in field
Screener completed
in field Reduced
treatment Full
treatment Number of
cases Yes Yes † † R R 2,235 Yes No Yes † NR I 63 Yes No No Yes NR R 659 Yes No No No NR NR 857 No † Yes † I I 441 No † No Yes3 R R 2,000 No † No No NR NR 1,245 † Not applicable. 1 Cases not attempted in the TRC are those with no matching telephone number or a mismatched telephone number. 2 R: respondent; NR: nonrespondent; I: ineligible. 3 Includes the 109 potential mismatches and 1 RDD duplicate case. SOURCE: U.S. Department of Education, National Center for Education Statistics, National Household Education Surveys Program (NHES), 2007.

70
Table 5-1. Number of Screener cases attempted, by residential and response status, and weighted percentages of cases: NHES:2007 Bias Study
Reduced treatment Full treatment Screener response category
Number (unweighted)
Percent (weighted)
Number (unweighted)
Percent (weighted)
Total 7,500 100.0 7,500 100.0 Residential 7,059 93.0 6,996 92.3 Responded 4,235 55.6 4,894 62.5 Did not respond 2,824 37.4 2,102 29.8 Nonresidential 441 7.0 504 7.7 NOTE: The numbers of cases are unweighted counts; the percentages are weighted. Detail may not sum to totals because of rounding. SOURCE: U.S. Department of Education, National Center for Education Statistics, National Household Education Surveys Program (NHES), 2007.
Table 5-2. Weighted and unweighted Screener unit response rates for the RDD sample, the RDD
mailable cases only, the Bias Study sample, and the Bias Study address-telephone matched only: NHES:2007 RDD and NHES:2007 Bias Study
Overall unit response rates Weighted (percent) Unweighted (percent) RDD sample 52.8 53.2 RDD mailable1 54.4 55.0 Bias Study sample, reduced treatment 59.8 60.5 Bias Study sample, reduced treatment, address- telephone matched only 59.9 60.3 Bias Study sample, full treatment 67.7 70.0 1 The unweighted rate was computed using the Wave 1 sample only, and assuming 37.6 percent of telephone numbers with an unknown residency status (no answer and no answer, answering machine cases) are residential. See section 4.2.1 of Hagedorn et al. (2008) for details. SOURCE: U.S. Department of Education, National Center for Education Statistics, National Household Education Surveys Program, 2007.
Table 5-3 shows the numbers of screened households in which household members were
sampled for extended interviews by the sample to which the cases belonged and the extended interviews completed. In the Bias Study sample with full treatment, about 59 percent of households had at least one household member sampled for an extended interview. The distribution of sampled extended interviews in the households under reduced treatment is comparable to the full treatment distribution. The RDD sample distribution of sampled extended interviews differs from the Bias Study distribution because for

71
the RDD sample the sampling of adults for AEWR interviews was done only in the Wave 1 sample (a random subsample comprising approximately 54 percent of the full RDD sample).28,29
Profile of Screener Unit Response Rates
In most RDD surveys, it is difficult to obtain and examine the characteristics of households that do not respond to the screening interview. Consequently, the ability to examine nonresponse bias at this stage of the survey is limited. In table 5-4, the Screener unit response rates are given by characteristics of the geographic area of the households30 based on the 2000 Census, and by whether an answering machine message was left during the study. These characteristics were considered because they are available for all cases and have the potential to be associated with response propensity. Table 5-3. Number and percent of households responding to the Screener, by sample type and
type of extended interviews scheduled: NHES:2007 RDD and NHES:2007 Bias Study
RDD sample Bias Study reduced
treatment Bias Study full
treatment
Type of interview scheduled Number of households
Percent of households
Number of households
Percent of households
Number of households
Percent of households
Total 54,034 100.0 4,235 100.0 4,894 100.0 At least one extended interview 24,725 45.8 2,452 57.9 2,882 58.9 School Readiness (SR) interview only 1,305 2.4 118 2.8 133 2.7 Parent and Family Involvement in Education (PFI) interview only 9,846 18.2 782 18.5 936 19.1 SR and PFI interview 1,988 3.7 165 3.9 204 4.2 Adult Education for Work- Related Reasons (AEWR) interview only 9,157 16.9 1,081 25.5 1,245 25.4 PFI and AEWR interviews 2,016 3.7 248 5.9 290 5.9 SR and AEWR interviews 242 0.4 37 0.9 45 0.9 SR, PFI, and AEWR interviews 171 0.3 21 0.5 29 0.6 No extended interview 29,309 54.2 1,783 42.1 2,012 41.1 NOTE: Detail may not sum to totals because of rounding. SOURCE: U.S. Department of Education, National Center for Education Statistics, National Household Education Surveys Program, 2007.
28 The subsampling into waves was done to allow for more efficient and effective use of follow-up procedures in a study with a short data collection period such as NHES. Cases in the Wave 1 sample were followed up more intensively than the remainder of the sample. See Hagedorn et al. (2008) for further details. 29 The sampling of adults for AEWR interviews was discontinued after Wave 1 due to low response rates. 30 For the RDD sample, these are characteristics of the ZIP code that has the most households associated with telephone numbers in the exchange; for the Bias Study sample, these are characteristics of the predominant ZIP code in the block.

72
The response rate patterns by area characteristic for the Bias Study (both the full treatment and the reduced treatment) were compared to those observed in the RDD study. The one characteristic, shown in table 5-4, that stands out is the indicator of whether an answering machine message was left. In the RDD sample and in the Bias Study reduced treatment, the Screener response rate was higher among households in which no answering machine message was left. In the Bias Study full treatment, the rate was higher among households in which at least one answering machine message was left. Among Bias Study cases (with the full treatment), the Screener unit response rate varied by region of the country, with the highest unit response rate in the Midwest and the lowest unit response rate in the West. Areas with higher proportions of Whites generally had higher unit response rates than those with lower proportions of Whites, and correspondingly, areas with lower proportions of Hispanics, Blacks, and Asians had higher unit response rates than those with higher proportions in these subgroups. Areas with lower median home values generally had higher unit response rates than those with higher median home values. Areas with higher proportions of renters had lower response rates than those with lower proportions of renters. In general, these response rate patterns for the Bias Study (both the full treatment and the reduced treatment) are consistent with those observed in the RDD study.
This univariate profile of Screener unit response rates by the characteristics of the areas is
difficult to interpret because there are so many characteristics to consider. In addition, some of these characteristics are correlated, and the univariate profile does not explore these relationships. Consequently, a multivariate analysis, which is discussed in chapter 6, was performed to examine the interrelationship of the characteristics and the Screener unit response rates.
5.3 Extended Interview Unit Response Rates and Overall Unit Response Rates
During the screening interview, all children were enumerated in households with eligible children; adults were enumerated in only a subsample of households. After the enumeration, children or adults within the household were sampled for the SR, PFI, or AEWR surveys. The person who was identified as the most knowledgeable about the sampled child’s care and education (nearly always a parent and most often the child’s mother) was designated to be the respondent for the SR or PFI interview. The AEWR interview was conducted with the sampled adult.
The number of persons enumerated and sampled, and those with completed interviews for
each survey are given in table 5-5; the table includes counts for both the RDD sample and the Bias Study

73
(full treatment) sample. Table 5-6 gives the unit response rates and overall unit response rates for the RDD sample and the Bias Study (full treatment) sample. For the SR survey, the unit response rate is 79.8 percent for the Bias Study sample, compared to 77.0 percent for the RDD sample; for the PFI survey the unit response rates are 75.9 percent for the Bias Study sample and 74.1 percent for the RDD sample; for the AEWR survey, the unit response rates are 60.6 percent and 62.4 percent for the Bias Study and RDD samples, respectively.
Table 5-4. Weighted Screener unit response rates for the NHES:2007 RDD sample, reduced
treatment NHES:2007 Bias Study sample, and full treatment NHES:2007 Bias Study sample, by selected characteristics
Characteristic RDD sampleBias Study sample, reduced treatment
Bias Study sample, full treatment
Total 52.8 59.8 67.7 Mailable status Mailable address 54.4 59.8 67.7 No mailable address 43.3 † † Answering machine message indicator No message left 65.7 64.0 67.0 One or more messages left 42.3 48.7 69.4 Percent White Less than 30 percent 43.4 46.1 51.5 30 to 39 percent 46.1 55.2 62.4 40 to 59 percent 47.8 57.3 64.5 60 to 69 percent 49.7 56.6 63.3 70 to 79 percent 52.8 63.4 71.6 80 to 89 percent 53.6 61.3 69.2 90 percent or more 58.0 63.1 71.9 Percent Black 0 to 49 percent 53.0 60.0 67.9 50 percent or more 48.3 51.5 60.3 Percent Asian Less than 10 percent 54.7 61.9 70.1 10 to 19 percent 47.6 53.0 59.0 20 to 29 percent 44.4 44.8 52.6 30 percent or more 39.2 49.1 55.7 Percent Hispanic 0 to 39 percent 53.4 60.8 68.9 40 percent or more 44.7 49.2 54.6 See notes at end of table.

74
Table 5-4. Weighted Screener unit response rates for the NHES:2007 RDD sample, reduced treatment NHES:2007 Bias Study sample, and full treatment NHES:2007 Bias Study sample, by selected characteristics—Continued
Characteristic RDD sampleBias Study sample, reduced treatment
Bias Study sample, full treatment
Median home value 1st decile 57.6 66.7 74.2 2nd through 4th deciles 57.0 64.1 72.2 5th through 6th deciles 54.3 60.0 68.8 7th through 9th deciles 49.3 55.3 62.7 10th decile 44.2 53.0 60.1 Percent renters 0 to 49 percent 53.8 61.0 69.1 50 percent or more 42.3 51.1 57.0 Percent college graduates Less than 20 percent 54.2 62.9 70.7 20 to 29 percent 54.0 59.0 66.4 30 percent or more 51.3 58.2 66.4 Household income decile Less than 40 percent 54.3 61.4 69.0 40 to 59 percent 53.6 61.4 69.7 60 percent or more 54.5 57.4 65.3 Census region Northeast 49.9 58.1 67.1 Midwest 59.3 66.7 74.2 South 52.6 58.9 67.1 West 49.2 57.2 63.9 Census division New England 51.9 57.6 66.7 Middle Atlantic 49.1 58.5 67.4 East North Central 57.3 68.2 76.6 West North Central 64.0 63.8 69.5 South Atlantic 51.6 55.9 63.9 East South Central 56.7 70.7 82.2 West South Central 52.3 57.0 63.0 Mountain 55.8 70.1 79.8 Pacific 46.5 52.8 58.5† Not applicable. NOTE: The categories of each characteristic are based on a multivariate analysis for the nonresponse weighting adjustment, in which the sample was divided into subgroups with the most differential response rates. SOURCE: U.S. Department of Education, National Center for Education Statistics, National Household Education Surveys Program, 2007.

75
Table 5-5. Number of enumerated children and adults, by type of extended interview and final extended interview status: NHES:2007 RDD sample; NHES:2007 Bias Study sample, full treatment
Type of interview RDD sample Bias Study sample, full treatment School Readiness (SR) interview Enumerated 4,030 450 Sampled 3,706 411 Ineligible 239 39 Did not respond 735 75 Total complete 2,633 299 Parent and Family Involvement in Education (PFI) interview Enumerated 23,882 2,480 Sampled 14,021 1,459 Ineligible 92 6 Did not respond 3,347 335 Total complete 10,681 1,115 Adult Education for Work-Related Reasons (AEWR) interview Enumerated 31,314 4,276 Sampled 11,586 1,609 Ineligible 236 40 Did not respond 3,640 504 Complete 7,710 1,065 NOTE: Counts given in this table are based on classifications according to how the person was sampled. For example, if a child was sampled for the SR interview but was found to be eligible for the PFI interview instead, that child is included in the SR interview counts in this table. SOURCE: U.S. Department of Education, National Center for Education Statistics, School Readiness (SR) Survey of the National Household Education Surveys Program, 2007; Parent and Family Involvement in Education (PFI) Survey of the National Household Education Surveys Program, 2007; and Adult Education for Work-Related Reasons (AEWR) Survey of the National Household Education Surveys Program, 2007.
Table 5-6. Weighted unit response rates and overall unit response rates, by type of extended
interview: NHES:2007 RDD sample; NHES:2007 Bias Study sample, full treatment RDD sample Bias Study sample, full treatment
Type of interview Unit response rate Overall unit
response rate
Unit response rate Overall unit
response rate SR interview 77.0 40.7 79.8 54.0 PFI interview 74.1 39.1 75.9 51.4 AEWR interview 62.4 33.0 60.6 41.0 NOTE: The overall unit response rate is the product of these unit response rates for the surveys and the Screener unit response rates of 52.8 percent for the RDD sample and 67.7 percent for the full treatment Bias Study sample. SOURCE: U.S. Department of Education, National Center for Education Statistics, School Readiness (SR) Survey of the National Household Education Surveys Program, 2007; Parent and Family Involvement in Education (PFI) Survey of the National Household Education Surveys Program, 2007; and Adult Education for Work-Related Reasons (AEWR) Survey of the National Household Education Surveys Program, 2007.

76
5.4 Item Response Rates
In the SR, PFI, and AEWR Surveys of NHES:2007, as in most surveys, the responses to some data items are not obtained for all interviews. There are numerous reasons for item nonresponse. Some respondents do not know the answer for the item or do not wish to respond for other reasons. Some item nonresponse arises when an interview is interrupted and not continued later, leaving items at the end of the interview blank. Item nonresponse may also be encountered when responses provided by the respondent are not internally consistent, and this inconsistency is not discovered until after the interview is completed. In these cases, the items that were not internally consistent were set to missing and then imputed.
For items on the SR, PFI, and AEWR31 surveys, the median item response rates for the Bias
Study were 99.3 percent, 99.4 percent, and 99.8 percent, respectively. These rates are comparable to the corresponding item response rates for the RDD sample (99.3 percent, 99.0 percent, and 99.7 percent, respectively).
As in the main NHES: 2007 study, most items on the SR, PFI, and AEWR surveys had item
response rates over 90 percent. For the SR survey, there were two items for which the response rate was substantially32 lower in the Bias Study than for the RDD sample (SEDOWELL, the number of times since the beginning of the school year that the child’s teacher/school has contacted the household about anything the child is doing particularly well or better in preschool, and SEENJOY, the extent to which the child enjoys school) and two items in the PFI survey (SEBEHAV, the number of times since the beginning of the school year that the child’s teacher/school has contacted the household about any behavior problems the child is having in school, and SESCHOL, whether the family applied for a scholarship or grant for the child). There is no reason to believe that SEDOWELL, SEENJOY, SEBEHAV, and SESCHOL are sensitive items that would be subject to lower response rates with the in-person effort than with strictly telephone collection. Thus, there is no indication of systematic differences between the two samples in the willingness or ability of respondents to respond to items. In summary, the item response rates for the NHES:2007 surveys, from both the RDD sample and the Bias Study sample, are high and consistent across samples.
31 For the AEWR survey, the median item response rates given correspond to the set of items that were imputed. For this survey, because no public-use data file was produced, only a subset of items needed for the analysis were imputed. 32 In this context, “substantially” is defined as a difference of 5.0 percent or more between the RDD item response rate and the Bias Study item response rate, for items that were applicable to more than 20 cases in each of the samples.

77
For analysis purposes, numeric and categorical data items with missing data were imputed. The imputations were done because complete responses were needed for the variables used in developing the sampling weights and for the variables needed for this analysis; additionally, for the RDD sample, the items were fully imputed in order to provide data users with data files containing complete cases.
A hot-deck procedure was used to impute most missing responses. In this approach, the
entire file was sorted into cells defined by characteristics of households or respondents that are likely to be associated with differences in item response propensities. These characteristics, or boundary variables, were used to group respondents into those most likely to have the same response or the same response propensity for the data item to be imputed. The hot-deck procedure has been used for imputation in all previous NHES administrations, and the specific procedures used for imputation for the NHES:2007 surveys were based on the procedures used in prior surveys. For details on the hot-deck procedure used for NHES:2007, see Hagedorn et al. (2008).

This page is intentionally blank.