an evaluation of a macroalgal bioassay tool for assessing
TRANSCRIPT
HAL Id: hal-00602601https://hal.archives-ouvertes.fr/hal-00602601
Submitted on 23 Jun 2011
HAL is a multi-disciplinary open accessarchive for the deposit and dissemination of sci-entific research documents, whether they are pub-lished or not. The documents may come fromteaching and research institutions in France orabroad, or from public or private research centers.
L’archive ouverte pluridisciplinaire HAL, estdestinée au dépôt et à la diffusion de documentsscientifiques de niveau recherche, publiés ou non,émanant des établissements d’enseignement et derecherche français ou étrangers, des laboratoirespublics ou privés.
An evaluation of a macroalgal bioassay tool for assessingthe spatial extent of nutrient release from offshore fish
farmsT. García-Sanz, J.M. Ruiz-Fernández, M. Ruiz, R. García, M.N. González, M.
Pérez
To cite this version:T. García-Sanz, J.M. Ruiz-Fernández, M. Ruiz, R. García, M.N. González, et al.. An evaluation of amacroalgal bioassay tool for assessing the spatial extent of nutrient release from offshore fish farms.Marine Environmental Research, Elsevier, 2010, 70 (2), pp.189. �10.1016/j.marenvres.2010.05.001�.�hal-00602601�

Accepted Manuscript
Title: An evaluation of a macroalgal bioassay tool for assessing the spatial extent ofnutrient release from offshore fish farms
Authors: T. García-Sanz, J.M. Ruiz-Fernández, M. Ruiz, R. García, M.N. González,M. Pérez
PII: S0141-1136(10)00068-1
DOI: 10.1016/j.marenvres.2010.05.001
Reference: MERE 3448
To appear in: Marine Environmental Research
Received Date: 26 June 2009
Revised Date: 26 April 2010
Accepted Date: 3 May 2010
Please cite this article as: García-Sanz, T., Ruiz-Fernández, J.M., Ruiz, M., García, R., González, M.N.,Pérez, M. An evaluation of a macroalgal bioassay tool for assessing the spatial extent of nutrient releasefrom offshore fish farms, Marine Environmental Research (2010), doi: 10.1016/j.marenvres.2010.05.001
This is a PDF file of an unedited manuscript that has been accepted for publication. As a service toour customers we are providing this early version of the manuscript. The manuscript will undergocopyediting, typesetting, and review of the resulting proof before it is published in its final form. Pleasenote that during the production process errors may be discovered which could affect the content, and alllegal disclaimers that apply to the journal pertain.

MANUSCRIP
T
ACCEPTED
ACCEPTED MANUSCRIPT
An evaluation of a macroalgal bioassay tool for assessing the spatial extent of nutrient release from
offshore fish farms
T. García-Sanza
J.M. Ruiz-Fernándezb
M. Ruizc R. Garcíab
M.N. Gonzálezc
M. Péreza
a Departament d´Ecología, Facultat de Biología, Universitat de Barcelona, Avda.
Diagonal 645, E-08028 Barcelona, Spain.
b Centro Oceanográfico de Murcia, Instituto Español de Oceanografía, C/ Varadero, 1, Lo Pagán 30740, San Pedro del Pinatar, Murcia, Spain.
c Instituto Canario de Ciencias Marinas, Ctra. Gral. de Taliarte s/n, 35200. Telde, Gran
Canaria, Spain.
MANUSCRIP
T
ACCEPTED
ACCEPTED MANUSCRIPT
1
An evaluation of a macroalgal bioassay tool for 1
assessing the spatial extent of nutrient release from 2
offshore fish farms 3
4
5
T. García-Sanza 6
J.M. Ruiz-Fernándezb 7
M. Ruizc 8
R. Garcíab 9
M.N. Gonzálezc 10
M. Péreza 11
12
13
14
15 a Departament d´Ecología, Facultat de Biología, Universitat de Barcelona, Avda. 16
Diagonal 645, E-08028 Barcelona, Spain. 17
18 b Centro Oceanográfico de Murcia, Instituto Español de Oceanografía, C/ Varadero, 1, 19
Lo Pagán E-30740, San Pedro del Pinatar, Murcia, Spain. 20
21 c Instituto Canario de Ciencias Marinas, Ctra. Gral. de Taliarte s/n, E-35200. Telde, 22
Gran Canaria, Spain. 23
24
25
26
27
28
29
30
31
32
33
34
35
36
37
38
39
40
41
42
43
44
45
46

MANUSCRIP
T
ACCEPTED
ACCEPTED MANUSCRIPT
2
Abstract 1
In this study we develop and evaluate a macroalgal bioassay tool for monitoring the 2
spatial extent of dissolved wastes loaded from offshore fish farms into the marine 3
coastal ecosystem. This tool is based on the analysis of the nitrogen stable isotope ratio 4
(δ15N) in tissues of several benthic primary producers (macroalgae and P. oceanica 5
epiphytes) incubated, by means of incubation devices, in the water column at increasing 6
distances (from 0 m to 1000 m) from the fish cages. The bioassays were performed in 7
three fish farms situated in different geographical locations (the Canary Islands, Murcia 8
and Catalonia) and we test: the suitability of the different macroalgae species used in 9
relation with their resistance to incubation and their sensitivity to fish-farm wastes and 10
the most appropriate incubation depth (5m or ~20m) and incubation time (2, 4 or 6 11
days) to detect the spatial distribution of δ15N around fish farms. In general terms, the 12
results showed a significant increment of δ15N values towards the fish cages with 13
respect to the reference (initial) and control values for all the species of macroalgae 14
tested except for the red algae Asparagopsis taxiformis from Canary Islands. The 15
magnitude and shape of the reported spatial responses varied as a function of the 16
experimental settings analyzed as well as a function of the nutrient regime 17
characteristics of each coastal area. The spatial gradient was more consistent in the 18
shallow part of the water column (5m depth), than in the deeper part (~20m) and was 19
statistically significant after an incubation period of four days. These results confirm the 20
effectiveness and reliability of the method proposed, enabling the spatial extent of 21
nutrients derived from fish farms to be assessed in an effective and simple manner, 22
suitable for use in monitoring programs around offshore fish farms. 23
24
25
26
Keywords: Nitrogen Stable isotopes (δ15N), Fish farms, Macroalgae, Bioassays, Indicators. 27
28
29
30
31
32
33

MANUSCRIP
T
ACCEPTED
ACCEPTED MANUSCRIPT
3
Introduction 1
2
The use of floating net cages in marine aquaculture has grown steadily over recent years 3
in the Mediterranean (FAO, 2007). This development has sparked much concern over 4
the threats posed by fish-farm wastes entering marine ecosystems. Fish farm wastes 5
increases the concentration of particulate organic matter (POM) and dissolved nutrients 6
in the surrounding waters (Pitta et al., 1999; Karakassis et al., 2001; Norvdarg and 7
Johansson, 2002) which has lead to significant alterations of benthic marine 8
communities, mainly in soft-bottom macro- and meio-benthos (Mazzola et al., 2000; 9
Mirto et al., 2002) but also in more vulnerable and valuable habitats, particularly 10
seagrasses (Pergent et al., 1999; Ruiz et al., 2001; Holmer et al., 2003; Pergent-Martini 11
et al., 2006; Holmer et al., 2008; Ruiz et al, in press). Most of these negative effects 12
have been reported in shallow and sheltered nearshore environments, and as a 13
consequence, most of fish farm facilities are presently placed in deeper, offshore waters, 14
where aquaculture waste is presumed to have a lower resident time thus minimizing the 15
impact on benthic communities (Wu et al., 1994; McGhie et al., 2000; Alongi et al., 16
2003). 17
Despite the reported evidence of environmental degradation caused by aquaculture 18
activities, there are currently no specific and reliable tools to provide ecologically 19
meaningful information about the impact of fish-farm wastes on marine ecosystems. 20
Classic descriptors based on water-column and sediment physicochemical variables (i.e. 21
DIN, POM, among others) have been systematically used in monitoring programs of 22
aquaculture impacts to assess the spread of fish-farm wastes in marine environments 23
(Dosdat et al., 1995; Roque d´Orbcastel et al., 2008). However, these methods have 24
usually failed to detect nutrient enrichment in receiving waters surrounding fish farms, 25
thus underestimating the spatial extent of the dissolved fraction of aquaculture wastes 26
(Jones et al., 2001 and references therein). This lack of response is attributed to the fast 27
dispersal of dissolved nutrients, its assimilation by organisms or loss to the atmosphere 28
through volatilization and denitrification (Pitta et al., 1999; Wolanski et al., 2000; 29
Karakassis et al., 2001; Sarà, 2007). This is especially true in offshore environments 30
where the dilution and spread of released nutrients is faster than at more confined sites. 31

MANUSCRIP
T
ACCEPTED
ACCEPTED MANUSCRIPT
4
Biological indicators (bioindicators) represent an alternative to physical and chemical 1
analyses to assess water quality since they can integrate both persistent and pulsed 2
changes in external nutrient availability over time (Lyngby 1990; Costanzo et al., 2000; 3
Jones et al 2001). Benthic primary producers (macroalgae, seagrasses and epiphytes) are 4
considered excellent potential bioindicators of nutrient availability for several reasons: 5
they are widely distributed and abundant, their biomasses persist over relatively long 6
periods, and they show well-characterized physiological responses to nutrient exposure 7
(Udy and Dennison, 1997; Lyngby et al., 1999). Indeed, the number of studies that use 8
these organisms to assess the influence of external sources of nutrients on coastal 9
ecosystems has recently increased (Fong et al., 1998; Savage and Elmgren, 2004; Lee et 10
al., 2004; Dalsgaard and Krause-Jensen, 2006; Pérez et al., 2008). On the other hand, in 11
the last decade, the analysis of the isotopic nitrogen ratios (δ15N) in benthic primary 12
producers has been revealed as a technique that is particularly effective in tracing 13
external nutrient inputs from certain human activities (see Lepoint et al., 2004 for a 14
review, Sarà et al., 2004, 2006). Organic loads from urban wastes and aquaculture are 15
enriched in the heavy nitrogen isotope (N15) relative to natural sources (Jones et al., 16
2001; Costanzo et al., 2003, 2004; Cole et al., 2004, 2005). This enrichment in N15 can 17
be detected in macrophyte tissues exposed to wastes since they show only small or no 18
fractionation during nitrogen uptake and assimilation (Gartner et al., 2002; Cohen and 19
Fong, 2005; Deutsch and Voss, 2006). 20
The analysis of the nitrogen isotopic signal in benthic vegetation has been applied 21
successfully to determine the spatial scale of the dispersal of aquaculture effluents 22
derived from land-based farms (Jones et al., 2001; Vizzini and Mazzola, 2004). 23
However, the distribution of benthic macrophytic communities along the coast is not 24
continuous and it is depth limited so these communities are usually absent from deeper 25
areas where offshore aquaculture is expanding. This fact restricts the use of this kind of 26
biological indicators to quantify the impact of fish farm effluents in open waters. To 27
overcome this problem some researchers have analyzed variations of δ15N in samples of 28
macroalgae collected from natural stands and placed in mesh bags staked to sediment at 29
unvegetated bottoms to detect the spatial extent of shrimp-farm (land-based) effluents 30
(Lin and Fong 2008). However, to our knowledge its potential has not still been 31
evaluated in marine offshore fish farms. So, we present here a study that uses pelagic 32
macroalgal bioassays in combination with isotopic analysis to determine the spatial 33

MANUSCRIP
T
ACCEPTED
ACCEPTED MANUSCRIPT
5
extent of offshore fish-farm wastes in open waters. 1
This study represents an assessment of a method based on the analysis of δ15N 2
signatures in tissues of benthic primary producers (macroalgae and P. oceanica 3
epiphytes) used as active bioindicators (i.e. bioassays) to determine the spatial extent of 4
dissolved wastes derived from offshore aquaculture facilities. Three case studies (fish 5
farms) were selected in three geographically separated sites along the Spanish coast to 6
perform this study. In each case, bioassays were deployed by means of incubation 7
devices in the water column at increasing distances from the fish farm facilities to 8
analyse the effects of several key experimental conditions (species of macroalgae, depth 9
of incubation and duration of incubation) on the variations of δ15N signatures. In 10
addition, spatial variations of δ15N were compared with those indicated by other 11
measures such as total nitrogen in plant tissues. 12
13
Materials and methods 14
15
Study sites 16
17
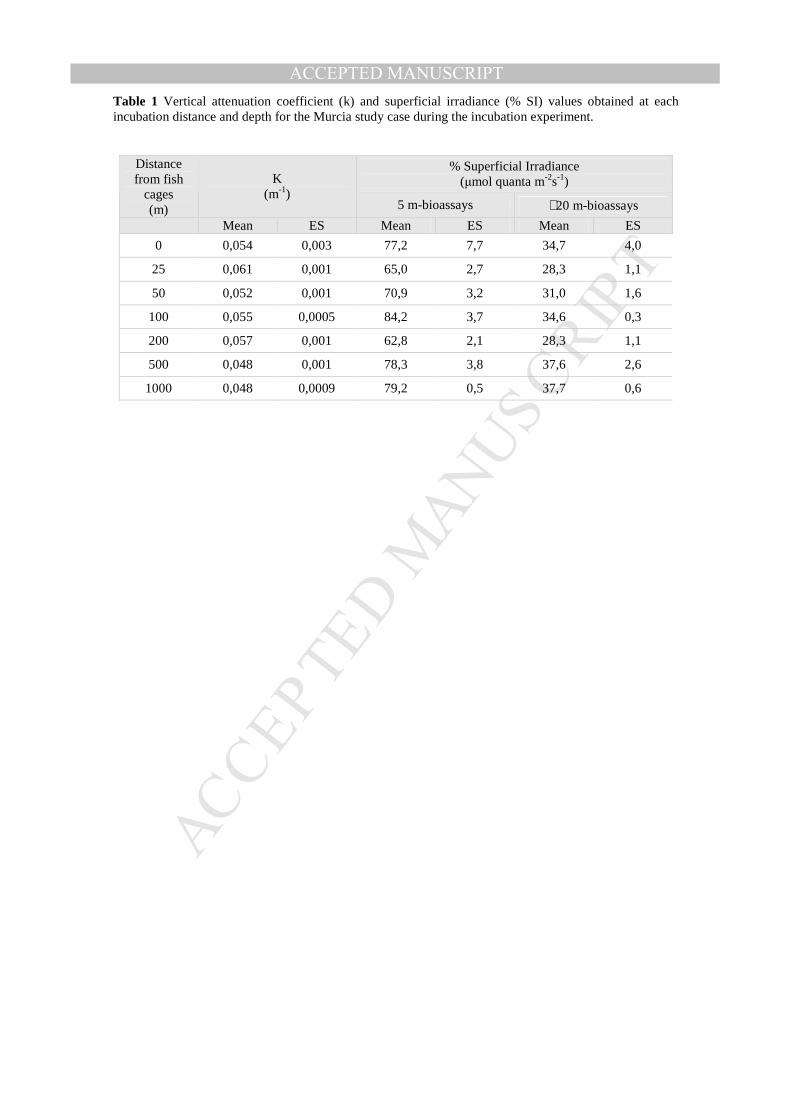
Three offshore fish farms were selected to perform the study. One was located in waters 18
of the Atlantic coast (Tenerife, Canary Islands), and two in the Mediterranean: one in 19
San Pedro del Pinatar (Murcia Region) and the other in L’Ametlla de Mar (Catalonia 20
Region), on the south-eastern and north-eastern coast of the Spanish Peninsula, 21
respectively (Fig. 1). In the Canary Islands, the annual production of the fish farm 22
during the study period was about 375 tonnes. The species farmed here were sea bream 23
(Sparus aurata) and sea bass (Dicentrarchus labrax). In Murcia, the annual production 24
of the fish farm was about 350 tonnes. Atlantic blue fin tuna (Thunnus thynnus) was 25
farmed in Murcia. However, this facility was at the southern end of a larger complex of 26
seven fish farms. These farms were concentrated in an area of 1.47 km2 and farmed blue 27
fin tuna, sea bream and sea bass with an annual production of 6,760 tonnes. On an 28
annual basis, the fish farm in Catalonia produced about 800 tonnes of sea bream. All 29
fish farms selected were located in areas with soft, unvegetated bottoms between about 30
20 and 40 m deep, and located more than 1 km from shore. The study was carried out 31
during July and August in 2005. 32

MANUSCRIP
T
ACCEPTED
ACCEPTED MANUSCRIPT
6
Experimental design 1
2
At each study site, macroalgal samples were collected from unpolluted sites one day 3
before the bioassay deployment. Macroalgae collected varied in availability at each 4
study site. As a result of this variation, the red algae Asparagopsis taxiformis (Delile) 5
Trevisande Saint-Léon and the brown algae Stypopodium zonale (Lamouroux) 6
Papenfuss were used in the Canary Islands study site; the brown algae Dictyopteris 7
polypodioides (De Candolle) J.V. Lamouroux and the epiphytic community of the 8
seagrass Posidonia oceanica (L.) Delile were used in the Murcia fish farm, and the 9
brown algae Cystoseira mediterranea (Sauvageau) in the study case of Catalonia. After 10
collection, all macroalgae were maintained until the next day in coolers with well-11
aerated seawater under low light conditions to avoid further physiological stress by light 12
and temperature. Ten sub-samples were separated from the bulk of collected plant 13
material and kept frozen until the time of analysis to obtain reference values for the 14
variables analyzed. 15
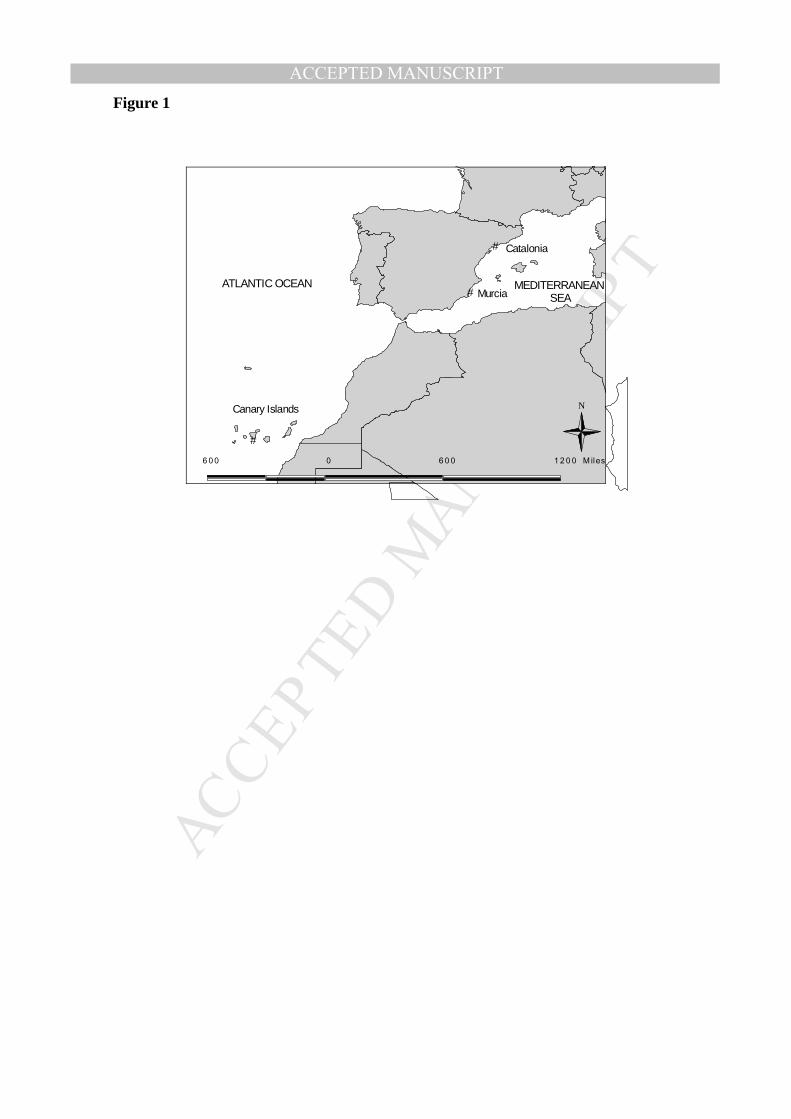
The day after sampling, macroalgae pieces (between 25 and 50 g of plant biomass) were 16
placed into incubation devices (comprising plastic 1 cm mesh cylinders measuring 9 cm 17
in diameter and 15 cm in height) and deployed in the water column at sites increasingly 18
further from the fish cages along a 1 km transect in the main current direction (Fig. 2). 19
All the plant material introduced in the devices was alive and in good condition. The 20
direction of the currents during the course of our study was established at each site from 21
data provided by environmental studies available in the respective monitoring programs. 22
The incubation devices were hung along vertical rope lines deployed at 0, 25, 50, 100, 23
200, 500 and 1000 meters from the fish cages, being the largest distance considered as a 24
control site representative of a natural, unpolluted condition. Rope lines were attached 25
to a concrete cube weighing 30 kg on the seabed and were maintained in an erect 26
position with a buoy. Along each rope line, three groups of four cylindrical devices (n = 27
4) were hung at two incubation depth (5 m (shallow) and between 15 and 20 m (deep)) 28
to assess the effect of the incubation depth on the spatial variation of the nitrogen 29
isotopic signal measured in plant tissues. Bioassays hanging at ~20m depth were always 30
separated from the bottom by at least 5 m. 31
32

MANUSCRIP
T
ACCEPTED
ACCEPTED MANUSCRIPT
7
To evaluate the most adequate incubation time, a group of 4 devices at each depth and 1
each distance (from a total of three groups at each sampling point) was collected at 2, 4 2
and 6 days after the initial deployment (T2, T4 and T6, respectively). The plant material 3
contained in each device was cleaned with deionized water, stored in plastic bags and 4
kept frozen until analysis. 5
6
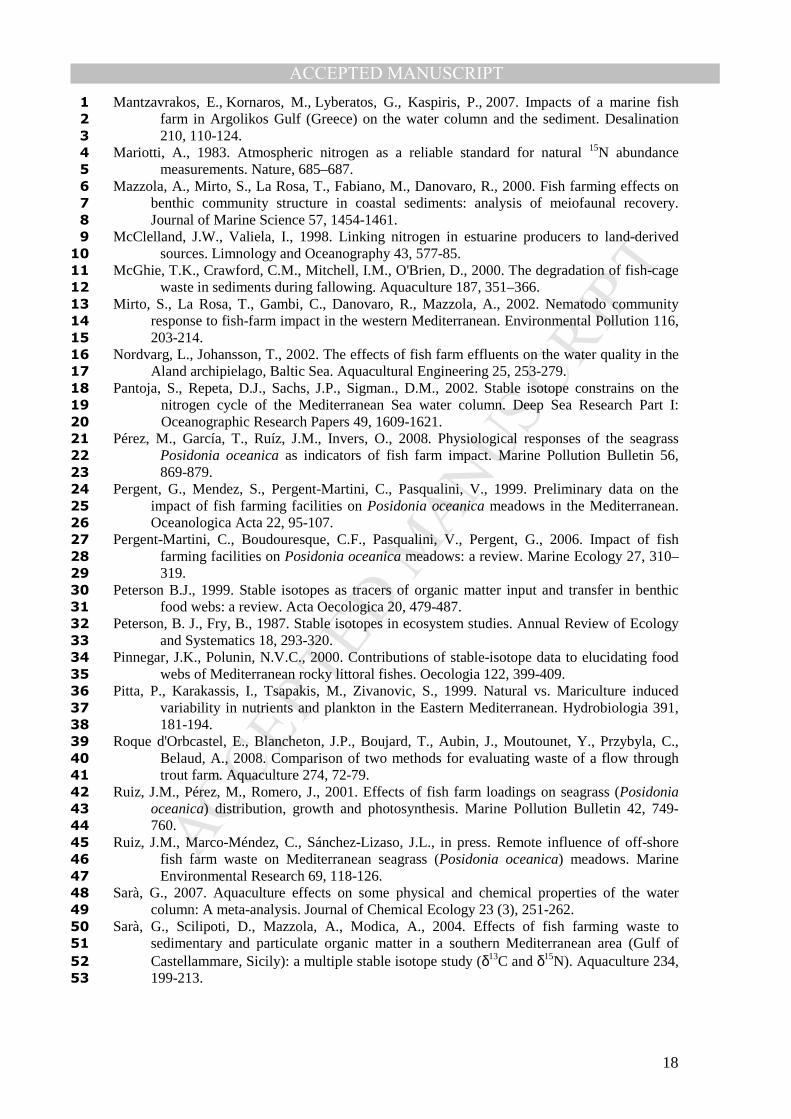
Light (PAR Irradiance, µmol quanta m-2s-1) profiles were obtained at each incubation 7
distance (and depth) using a LICOR light sensor. No differences in turbidity (k) or in 8
light availability (% SI) existed between incubation distances. Only differences between 9
incubation depths were apparent (Table 1). Thus, like other previous studies have 10
demonstrated (Beveridge et al., 1994; Wu et al., 1994; Mantzavrakos et al., 2007), light 11
availability did not represent an important factor explaining the reported variability of 12
response variables with cage distance. Furthermore, care was taken to avoid the shadow 13
of the cage in the 0 m distance, which was a possible cause of light reduction in this 14
experiment. 15
16
17
Analysis of plant material 18
19
Macroalgae samples were dried at 60ºC to constant weight for 24 hours, ground using 20
an agate mortar and pestle and preserved in a desiccator at room temperature. From 21
each sample, between 1.8 and 2 mg of dry weight was encapsulated to determine total 22
nitrogen content and the stable isotope ratio (δ15N). 23
The isotopic analysis technique was based on the two naturally occurring atomic forms 24
of nitrogen 14N and 15N (Mariotti, 1983). By measuring the ratio of 14N and 15N in dried 25
plant tissue, the relative amount of 15N or δ15N in the plant can be determined as the 26
relative difference between the sample and a worldwide standard (atmospheric N2) 27
using the following equation (Peterson and Fry, 1987): 28
δ15N = (15N/14Nsample /
15N/14Nstandard -1) x 1000 29
The nitrogen stable isotope ratio (δ15N) and total N content (%) were determined using a 30
continuous flow isotope ratio mass spectrometer (Thermo Finnigan Delta Plus IRMS). 31

MANUSCRIP
T
ACCEPTED
ACCEPTED MANUSCRIPT
8
This was carried out after combustion in an elemental analyzer Flash EA from 1
TermoFinnigan coupled via a ConFlo II from Finnigan MAT with the elemental 2
analyzer. The ratio δ15N value was expressed in per mil (‰). The internal laboratory 3
standard employed was acetanilide. 4
5
Statistical procedures 6
7
The effect of distance from fish cages on the dependent variables (δ15N and % N in 8
plant tissues) was analyzed using a one-way ANOVA for each combination of depth 9
and incubation time and for each specie (30 one-way ANOVA for each dependent 10
variable). Before analysis, Cochran’s test was used to assess the homogeneity of 11
variances. Differences were considered significant if p<0.05. When significant 12
differences were detected, a post hoc pair-wise comparison of means using Student-13
Newman-Keuls (SNK) test was performed (Zar, 1999). When variances were 14
homogeneous, results were interpreted at the probability level of 0.01 to reduce the 15
possibility of a Type I error (Underwood, 1997). Statgraphics Plus 5.1 data analysis 16
software package was used for the statistical analysis. 17
18
19
20
Results 21
22
23
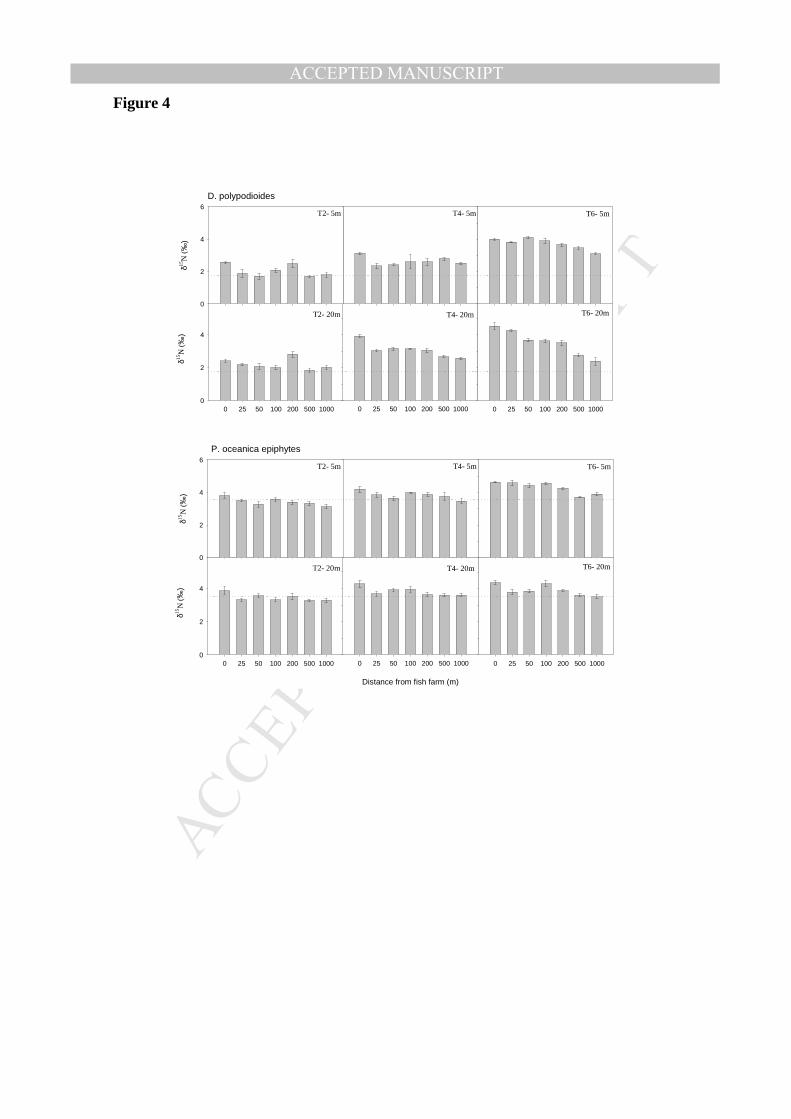
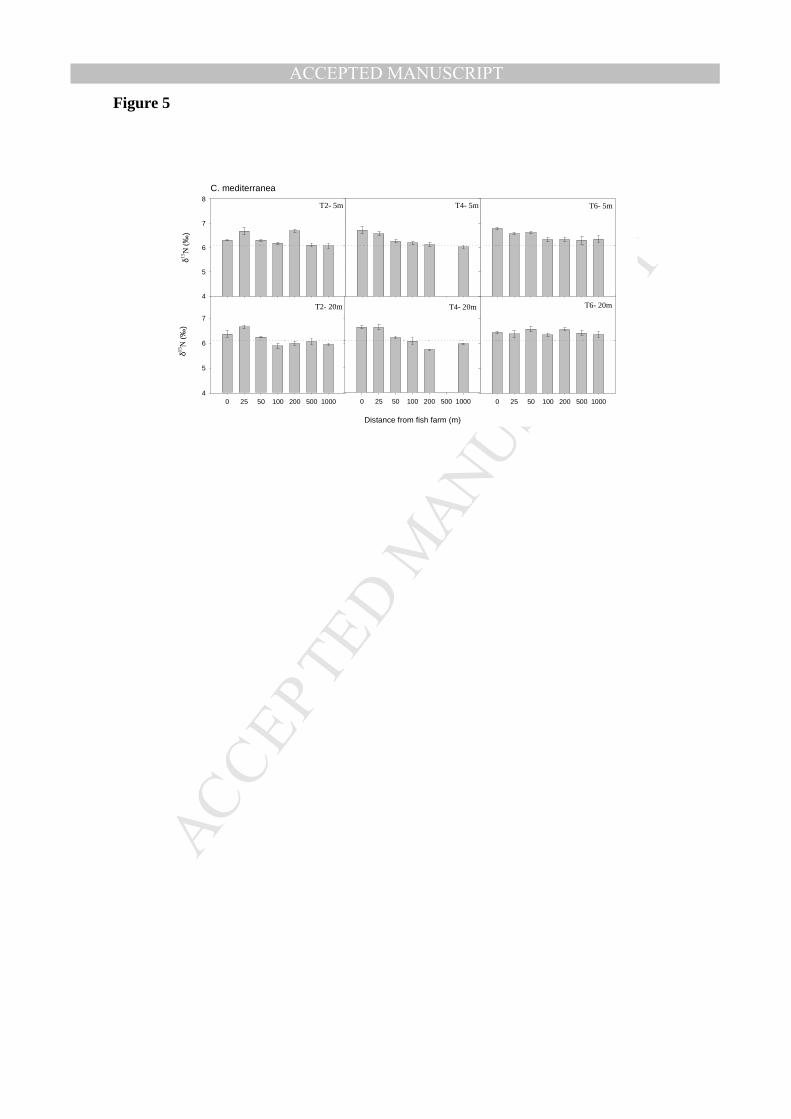
Nitrogen Stable Isotope Ratio (δδδδ15N) 24
Mean δ15N values obtained at the incubation time T2 for each transects distance were 25
variable and close to the reference values (Figs. 3, 4 and 5 and Table 2). Such variability 26
was significant in most cases but was not influenced by the presence of fish cages 27
(Table 3). As the incubation time increased, differences between bioassays and the 28
reference values increased, the maximum being in the fish cage (0 m) and minimum at 29
the control site (i.e. 1000 m). However, the significance and strength of this spatial 30
trend depended on the incubation time, the macroalgae species used and the depth of the 31
bioassay, as is described below. 32

MANUSCRIP
T
ACCEPTED
ACCEPTED MANUSCRIPT
9
With regard to the time of incubation, significant spatial trends were detected only in 1
the macroalgae incubated for four and six days (T4 and T6, respectively) (Table 3). In 2
the Canary Islands a spatial gradient was only detected by S. zonale at T4 (Fig. 3). In 3
the case of A. taxiformis variations of δ15N along the bioassays transect in all times of 4
incubations were not related to the spatial pattern described above, probably due to the 5
deteriorated state of the tissues of this alga at the end of the experimental period 6
(pigment loss, pers. Obs.) (Fig. 3). In Catalonia the spatial gradient defined by C. 7
mediterranea was evident at T4, while it appeared later (T6) in Murcia for the two 8
species analyzed (Figs. 4 and 5). 9
On the other hand, macroalgae incubated at 5m depth showed a similar response to 10
those incubated at ~20m depth (Table 3) although the spatial gradient between the fish 11
farm and control sites was more clearly defined in the upper layer of the water column 12
than in the deeper part (e.g. S. zonale, P. oceanica epiphytes and C. mediterranea, Figs. 13
3-5). All the macroalgae species tested, except for A. taxiformis, showed significant 14
spatial trends at 5m depth. At ~20m depth, significant spatial gradients were also found 15
in all macroalgae species, except for S. zonale and P. oceanica epiphytes (Table 3). 16
Differences between the fish cage (0 m) and control (1000 m) sites were highest for D. 17
polypodioides (1.9-fold) and lower for the other species (1.1 to 1.5-fold) (Figs. 3-5). 18
Furthermore, mean δ15N values in D. polypodioides were highest in comparison with 19
initial samples (i.e. references values), even at the control site, with maximum 20
differences in T6 at the 5m depth (Fig. 4). 21
22
Total nitrogen (% N) content 23
The mean N content values obtained at T2 (2 days) were similar to the reference values 24
(Figs. 6, 7 and 8 and Table 2) and there were no significant differences between transect 25
distances, with two exceptions: P. oceanica epiphytes at the 5m depth and C. 26
mediterranea at both 5m and ~20m depth (Table 4). However, in these cases no clear 27
spatial trend associated with fish cages (Figs. 6, 7 and 8 and Table 4) was detected. In 28
T4 (four days) differences between transect distances were found, such as in A. 29
taxiformis at the 5m depth and in D. polypodioides and C. mediterranea at ~20m depth. 30
From these cases, D. polypodioides at ~20m depth was the only species to show a 31

MANUSCRIP
T
ACCEPTED
ACCEPTED MANUSCRIPT
10
perceptible spatial gradation. However, at T6 (6 days) significant differences were 1
found between transect distances in almost every species except S. zonale and P. 2
oceanica epiphytes (at 5m and ~20m depth); D. polypodioides and P. oceanica 3
epiphytes followed significant trends at the 5m depth, while the same was true for C. 4
mediterranea at ~20m depth (Figs. 6, 7 and 8 and Table 4). Differences between the 5
fish cage (0 m) and control (1000 m) sites were greater in Murcia than in Catalonia (1.6-6
fold and 1.2-fold, respectively). 7
8
9
Discussion 10
11
In general terms, the results obtained in this study show a significant increase in the 12
δ15N values towards the fish cages with respect to the reference (initial) and control 13
values, in almost all the incubated macroalgae (except in Asparagopsis taxiformis), 14
which confirms the validity of the bioassay method employed to detect and characterize 15
spatial gradients of nutrients associated to offshore aquaculture facilities. 16
This response was similar to the increase in δ15N in benthic primary producers of 17
natural communities under the influence of organic effluents delivered from sewage 18
outfalls (Costanzo et al., 2001) or from land-based aquaculture facilities (Jones et al., 19
2001, Vizzini and Mazzola, 2004). Contamination from animal wastes is a common 20
cause of 15N enrichment in aquatic environments due to isotopic fractionation during the 21
ammonification and nitrification processes of urea, which is one of the main forms of 22
excreted nitrogen (Macko and Ostrom, 1994). Thus, higher δ15N values in incubated 23
macroalgae indicate a significant assimilation of dissolved inorganic nitrogen forms 24
(ammonia and nitrates) coming from fish farm wastes. Therefore, decreasing δ15N 25
signature in incubated macrophytes with increasing distance from the fish cages is 26
likely to reflect the dilution of nutrients from the source. This agrees with the high 27
significant negative correlation that we have found between the isotopic signature and 28
the distance from the fish cage for most of the case studies (Table 3). 29
The spatial pattern found for δ15N was well-defined and significant after four days of 30
incubation (T4) (Table 3). After two days of bioassay deployment (T2), differences in 31
δ15N were not significant and did not show any consistent spatial pattern. In contrast, in 32

MANUSCRIP
T
ACCEPTED
ACCEPTED MANUSCRIPT
11
T4 (four days) and T6 (six days) well-defined gradients were found. Then, although 1
nutrients released from fish farms usually show large temporal variability (e.g. 2
Karakassis et al., 2001), an incubation time of 4-6 days was sufficient to integrate 3
temporal, short-term changes in the nutrient regime at increasing distances from fish 4
farms. These findings are consistent with results from other studies where macroalgae 5
assimilated sewage-derived DIN and displayed higher δ15N values in their tissues at 6
similar times of incubations (Gartner et al., 2002; Costanzo et al., 2004; Deutsch and 7
Voss, 2006). 8
Not all of the macroalgal species tested showed the same tolerance and ability to 9
survive the experimental bioassay procedures. The red algae A. taxiformis used in the 10
bioassays at the Canary Islands site was the most obvious case (Fig. 3). In this specie, 11
values of both δ15N and total N content along transects did not show any relationship 12
with the fish farm effluent. Indeed, δ15N and total N content strongly decreased in 13
relation to references values (Tables 3 and 4). This is explained by tissue decomposition 14
during the bioassay incubation and indicates the low resistance of this macrophyte to 15
experimental manipulation. The other macroalgae species and P. oceanica epiphytes 16
were resistant to manipulation as no signs of deterioration were apparent during 17
incubation and we assumed that they were assimilating nitrogen derived from fish-farm, 18
so they could be considered as good indicators of nitrogen derived from fish farms 19
wastes. 20
Spatial gradients between the fish farm and control sites were more clearly defined in 21
the upper layer of the water column (i.e. 5 m incubation depth) than in the deeper part 22
(between 15 and 20 m incubation depth), where this gradient was not well-defined (e.g. 23
P. oceanica epiphytes; Fig. 4) or non-existent (e.g. S. zonale; Fig. 3). This can be 24
attributed to differences in environmental factors as light (Dudley, 2007) or differences 25
in the dispersion patterns of wastes. Macroalgae incubated at ~20m depth are subjected 26
to lower light levels than macroalgae incubated at the 5m depth. This can affect the 27
photosynthetic rates and hence nitrogen assimilation (Lobban and Harrison 1997). On 28
the other hand, our results indicated a higher dispersion of the dissolved inorganic 29
nitrogen forms derived from fish-farm wastes in the superficial layer than in the deeper 30
one. This can be attributed to a high fish density and activity in the upper layer during 31
feeding operations. Also, in summer, a thermocline was established between the two 32

MANUSCRIP
T
ACCEPTED
ACCEPTED MANUSCRIPT
12
incubation depths (unpublished data, pers. obs), which prevented effective diffusion and 1
transport of dissolved nutrients towards the deeper layer, so fish farm wastes are more 2
easily dispersed in the superficial layer, and thus detected more easily by the bioassays 3
at the 5m depth than by the 20m depth. 4
The magnitude of δ15N enrichment of macrophyte tissues (in relation to reference, 5
initial and control mean values) appeared higher also at 5m than at ~20m depth at all 6
study sites, except in Murcia for D. polypodioides. In Murcia study, results show that 7
the dispersion of the fish farm effluent at 5m and ~20m depth reached further than the 8
spatial scale measured in this study (1000 m), especially at the shallower depth, since 9
control bioassays had an isotopic signal higher than those found in reference algae. This 10
is consistent with the larger size of the aquaculture facilities selected in Murcia (see 11
methods), where the annual fish production is 9- and 20-fold higher than in the 12
Catalonia and Canary Islands fish farms, respectively. 13
The sensitivity of the bioassay and its spatial variability may be also influenced by other 14
factors such as the nutrient regime characteristics of each coastal area and the presence 15
of nutrient sources that differ from those derived from offshore fish farms (Ye et al., 16
1991; Wu, 1995; Cromey et al., 2002; Vizzini and Mazzola, 2004; Sarà et al., 2006). 17
These factors varied between the three fish farms studied here, which is probably 18
reflected in the results. The variation of δ15N along the transect was higher in the fish 19
farms of Murcia and the Canary Islands (2.5 -5 ‰), probably due to the oligotrophic 20
character of their waters. This condition, together with the absence of any substantial 21
source of nitrogen in the studied areas, besides fish farms, meant that δ15N could be 22
applied as a single tracer to follow the dispersion of the fish farm wastes from source 23
point (Peterson, 1999). In contrast, the variations of δ15N in Catalonia were lower than 24
those in Murcia and the Canary Islands, mainly because of higher initial δ15N values in 25
natural stands of C. mediterranea (6-7 ‰) used as reference values. The δ15N values 26
found in C. mediterranea in our study site are clearly higher that the background values 27
(3.4 ‰, Pantoja et al., 2002) for dissolved N in the Western Mediterranean and that 28
those found in the genus Cystoseira from unpolluted environments (Pinnegar and 29
Polunim, 2000). This could be explained by the high continental influence of the 30
Catalonia fish farm. Coastal waters near continents are enriched in the heavier N isotope 31
transported by runoff from watersheds larger than in islands, and with important urban 32

MANUSCRIP
T
ACCEPTED
ACCEPTED MANUSCRIPT
13
and agricultural development (McClelland and Valiela, 1998; Bowen and Valiela, 1
2008). Consequently, the contribution of fish farm waste to the enhancement of δ15N in 2
incubated algae could have been masked by ambient levels. In these cases the use of the 3
nitrogen stable isotope ratios would not have been as sensitive as in oligotrophic areas 4
to detect dissolved nutrients derived from fish farms (Costanzo et al., 2003). 5
Total N content in marine plants is commonly considered a potential indicator of the 6
concentration of biologically available nutrients in the environment (Duarte, 1990; Fong 7
et al., 2004). Despite this, it was much less sensitive to detect fish farm waste than δ15N 8
probably due to high dispersion rates in offshore fish farms. In our study, total N 9
content was a poor indicator of nutrient release from fish farms; in only three cases % N 10
content increased towards the cages with respect to the reference and control values (D. 11
polypodioides and P. oceanica epiphytes at 5m depth and C. mediterranea at ~20m 12
depth; Table 4). This trend was also reported by Lin and Fong (2008), who reported a 13
much more localized response to nutrient availability in tissue N content than in 14
nitrogen isotope stable ratios in relation to shrimp farm effluents. These authors 15
attributed this response to the fact that nutrient supply was not high enough to induce 16
tissue nitrogen storage (Lin and Fong, 2008), which only occurs when nutrient supply 17
exceeds growth rate (Fong et al., 2004). In our study, the lack of response in tissue 18
nitrogen content could be explained by the same argument; it is likely that the high 19
hydrodynamic conditions in offshore fish farms dilute the nitrogen rapidly. Moreover, 20
the lack of nitrogen response may also be influenced by other aspects related to species-21
specific physiological traits (Fong et al., 2001, 2003). 22
In summary, our results confirm the potential of δ15N in macrophytes (more than the 23
classic measures of total N) to track the dispersion of dissolved nutrients derived from 24
aquaculture discharges in offshore sites without benthic vegetation, and especially in 25
oligotrophic waters. Changes in δ15N values measured in incubated macrophytes along 26
transects has provided clear and reliable characterizations of nutrient gradients 27
associated with the fish farm wastes in 4-6 days (except for A. taxiformis), and the 28
wastes are going farther in the upper layer of the water column than in the deeper. 29
Furthermore, the technique is simple and low cost; experimental deployment is very 30
easy to perform and requires very little training making this method a strong candidate 31
for application in monitoring programs. 32

MANUSCRIP
T
ACCEPTED
ACCEPTED MANUSCRIPT
14
Finally, our results have also highlighted the necessity of an assessment study to 1
determine the appropriate experimental conditions (species of macroalgae, distances 2
from fish farms, incubation depth, etc…) that will ensure the bioassay is successful in 3
indicating the area of the spatial extent of fish farm wastes. The results obtained in this 4
study now make it possible to extensively apply the bioassay to other case studies. A 5
proper spatial replication is able to gather most of the spatial variability caused by 6
currents and other local factors of interest (i.e. more than one site per distance and at 7
least two transects either side of the fish farms). In conclusion, the application of this 8
macroalgal bioassays method has a great potential in determining the spatial scale of the 9
influence of aquaculture wastes on the marine environment, which represents a key 10
aspect for monitoring and management this activity in coastal marine ecosystems. 11
12
13
14
15
16
17
18
19
20
21
22
23
24
25
26
27
28
29
30
31
32
33
34
35
36
37
38
39
40
41
42
43
44

MANUSCRIP
T
ACCEPTED
ACCEPTED MANUSCRIPT
15
Acknowledgements 1
2
3
This study was financed by the “National Plan of Cage Impact of JACUMAR” 4
(Secretaría General de Pesca Marítima del Ministerio de Agricultura, Pesca y 5
Alimentación), and by the “Instituto Español de Oceanografía” (IEO). 6
The authors would like to thank Oriol Mascaró for his assistance in field work and 7
Natalia Cortazar for her help in laboratory analyses. Moreover we thank the staff of the 8
three fish farms for their collaboration and support during the experiments. We also 9
thank Maria Lema, from the “Unidad de Técnicas Instrumentales de Análisis” (UTIA) 10
of the “Servizos de Apoio á Investigación” (SAI) (Universidade da Coruña), for support 11
in isotopical analysis. 12
13
14
15
16
17
18
19
20
21
22
23
24
25
26
27
28
29
30
31
32
33
34
35
36
37
38
39
40
41
42
43
44
45
46
MANUSCRIP
T
ACCEPTED
ACCEPTED MANUSCRIPT
16
References 1
2
3
Alongi, D.M., Chong, V.C., Dixon, P., Sasekumar, A., Tirendi, F., 2003. The influence of fish 4
cage aquaculture on pelagic carbon flow and water chemistry in tidally dominated 5
mangrove estuaries of peninsular Malaysia. Marine Environmental Research 55, 313-6
333. 7
Beveridge, M.C.M., Ross L.G., Kelly, L.A., 1994. Aquaculture and biodiversity. Ambio 23, 8
497-502. 9
Bowen, J.L., Valiela, I., 2008. Using delta N-15 to assess coupling between watersheds and 10
estuaries in temperate and tropical regions. Journal of Coastal Research 24, 804-813. 11
Christensen, P.B., Rysgaard, S., Sloth,N.P., Dalsgaard, T., Schwærter, S., 2000. Sediment 12
mineralization, nutrient fluxes, denitrification and dissimilatory nitrate reduction to 13
ammonium in an estuarine fjord with sea cage trout farms. Aquatic Microbial Ecology 14
21, 73-84. 15
Cohen, R.A., Fong, P., 2005. Experimental evidence supports the use of δ15N content of the 16
opportunistic green macroalga Enteromorpha intestinalis (Chlorophyta) to determine 17
nitrogen sources to estuaries. Journal of Phycology 41, 287-293. 18
Cole, M.L., Valiela, I., Kroeger, K.D., Tomasky, G.L., Cebrian, J., Wigand, C., McKinney, 19
R.A., Grady, S.P., Carvalho da Silva, M.H., 2004. Assessment of a δ15N isotopic 20
method to indicate anthropogenic eutrophication in aquatic ecosystems. Journal of 21
Environmental Quality 33, 124-132. 22
Cole, M.L., Kroeger, K.D., McClelland, J.W., Valiela, I., 2005. Macrophytes as indicators of 23
land-derived wastewater: Application of a δ15N method in aquatic systems. Water 24
Resources Research 41, W01014. 25
Costanzo, S.D., O’Donohue, M.J., Dennison, W.C., 2000. Gracilaria edulis (Rhodophyta) as a 26
biologycal indicador of pulsed nutrients in oligotrophic waters. Journal of Phycology 27
36, 680-685. 28
Costanzo, S.D., O’Donohue, M.J., Dennison, W.C., Loneragan, N.R., Thomas, M., 2001. A new 29
approach for detecting and mapping sewage impacts. Marine Pollution Bulletin 42(2), 30
149-156. 31
Costanzo, S.D., O’Donohue, M.J., Dennison, W.C., 2003. Assessing the seasonal influence of 32
sewage and agricultural nutrient inputs in a subtropical river estuary. Estuaries 26, 857–33
865. 34
Costanzo, S.D., O'Donohue, M.J., Dennison, W.C., 2004. Assessing the influence and 35
distribution of shrimp pond effluent in a tidal mangrove creek in north-east Australia. 36
Marine Pollution Bulletin 48, 514-525. 37
Cromey, C., Nickell, T., Black, K., Provost, P., Griffiths, C., 2002. Validation of a fish farm 38
waste resuspension model by use of a particulate tracer discharged from a point source 39
in a coastal environment. Estuaries 25, 916-929. 40
Dalsgaard, T., Krause-Jensen, D., 2006. Monitoring nutrient release from fish farms with 41
macroalgal and phytoplankton bioassays. Aquaculture 256, 302-310. 42
Deutsch, B., Voss, M., 2006. Anthropogenic nitrogen input traced by means of δ15N values in 43
macroalgae: Results from in-situ incubation experiments. Science of Total 44
Environment. 366, 799-808. 45
Dosdat, A., Gaumet, F., Chartois, H., 1995. Marine aquaculture effluent monitoring- 46
methodological approach to the evaluation of nitrogen and phosphorus excretion by 47
fish. Aquacultural Engineering 14, 59–84. 48
Duarte, C.M., 1990. Seagrass nutrient content. Marine Ecology Progress Series 67, 201–207. 49
Dudley, B.D., 2007. Quantitative ecological impact assessments using natural abundance carbon 50
and nitrogen stable isotope signatures. Thesis: Victoria University of Wellington. 51
FAO, 2007. The State of World Fisheries and Aquaculture. FAO Fisheries and Aquaculture 52
Department. Food and Agriculture Organization of the United Nations, Rome, 2007. 53
Fong, P., Boyer, K.E., Zedler, J.B., 1998. Developing an indicator of nutrient enrichment in 54
coastal estuaries and lagoons using tissue nitrogen content of the opportunistic alga, 55
MANUSCRIP
T
ACCEPTED
ACCEPTED MANUSCRIPT
17
Enteromorpha intestinalis (L Link). Journal of Experimental Marine Biology and 1
Ecology 231, 63-79. 2
Fong, P., Kamer, K., Boyer, K.E., Boyle, K.A., 2001. Nutrient content of macroalgae with 3
differing morphologies may indicate sources of nutrients to tropical marine systems. 4
Marine Ecology Progress Series 220, 137-152. 5
Fong, P., Boyer, K.E., Kamer, K., Boyle, K.A., 2003. Influence of initial tissue nutrient status of 6
tropical marine algae on response to nitrogen and phosphorus additions. Marine 7
Ecology Progress Series 262, 111-123. 8
Fong, P., Fong, J.J., Fong, C.R., 2004. Growth, nutrient storage, and release of dissolved 9
organic nitrogen by Enteromorpha intestinalis in response to pulses of nitrogen and 10
phosphorus. Aquatic Botany 78, 83-95. 11
Franson, M.A.H., 1985. Method 424-F. In: Standard Methods for the Examination of Water and 12
Wastewater, 16th ed. APHA, AAWA, and WPCF, Washington, DC, pp. 448-450. 13
Gartner, A., Lavery, P., Smit, A.J., 2002. Use of δ15N signatures of different functional forms of 14
macroalgae and filter-feeders to reveal temporal and spatial patterns in sewage disposal. 15
Marine Ecology Progress Series 235, 63-73. 16
Hall, P.O.J., Holby, O., Kollberg, S., Samuelsson, M.O., 1992. Chemical fluxes and mass 17
balances in a marine fish cage farm: IV. Nitrogen. Marine Ecology Progress Series 89, 18
81-91. 19
Holby, O., Hall, P.O.J., 1991. Chemical fluxes and mass balances in a marine fish cage farm. II. 20
Phosphorus. Marine Ecology Progress Series 70, 263-272. 21
Holmer, M., Pérez, M., Duarte, C.M., 2003. Benthic primary producers – a neglected 22
environmental problem in Mediterranean maricultures? Marine Pollution Bulletin 46, 23
1372-1376. 24
Holmer, M., Argyrou, M., Dalsgaard, T., Danovaro, R., Díaz-Almela, E., Duarte, C.M., 25
Frederiksen, M., Karakassis, I., Marbà, N., Mirto, S., Pérez, M., Pusceddu, A., Tsapkasis, 26
M., in press. Effects of fish farm waste on Posidonia oceanica meadows: synthesis and 27
provision of monitoring and management tools. Marine Pollution Bulletin 56 (9), 1618-28
1629. 29
Jones, A.B., O'Donohue, M.J., Udy, J., Dennison, W.C., 2001. Assessing ecological impacts of 30
shrimp and sewage effluent: biological indicators with standard water quality analyses. 31
Estuarine Coastal and Shelf Science 52, 91-109. 32
Karakassis, I., Tsapakis, M., Astillan, E., Pitta, P., 2001. Diel variation of nutrients and 33
chlorophyll in the sea bream and sea bass cages in the Mediterranean. Fresenius 34
Environmental Bulletin 10, 278-283. 35
Lobban, C.S., Harrison, P.J., 1997. Seaweed Ecology and Physiology. Cambridge University 36
Press, Cambridge. 37
Lee, K.S., Short, F.T., Burdick, D.M., 2004. Development of a nutrient pollution indicator using 38
the seagrass, Zostera marina, along nutrient gradients in three New England estuaries. 39
Aquatic Botany 78, 197-216. 40
Lepoint, G., Dauby, P., Gobert, S., 2004. Applications of C and N stable isotopes to ecological 41
and environmental studies in seagrass ecosystems. Marine Pollution Bulletin 49, 887-891. 42
Lin, D.T., Fong, P., 2008. Macroalgal bioindicators (growth, tissue N, δ15N) detect nutrient 43
enrichment from shrimp farm effluent entering Opunohu Bay, French Polynesia. Marine 44
Pollution Bulletin 56 (2), 245-249. 45
Lyngby, J.E. 1990. Monitoring of nutrient availability and limitation using the marine 46
macroalgae, Ceramium rubrum (Huds.) C. Ag. Aquatic Botany 38, 153-161. 47
Lyngby, J.E., Mortensen, S., Ahrensberg, N., 1999. Bioassessment techniques for monitoring of 48
eutrophication and nutrient limitation in coastal ecosystems. Marine Pollution Bulletin 49
39, 212-223. 50
Macko, S.A., Ostrom, N.E., 1994. Pollution Studies Using Stable Isotopes, Chapter 3. In 'Stable 51
Isotopes in Ecology and Environmental Science'. (Eds Lajtha, K. and Michener, R.H.) 52
pp. 45-62. (Blackwell Scientific Publications: Oxford). 53
MANUSCRIP
T
ACCEPTED
ACCEPTED MANUSCRIPT
18
Mantzavrakos, E., Kornaros, M., Lyberatos, G., Kaspiris, P., 2007. Impacts of a marine fish 1
farm in Argolikos Gulf (Greece) on the water column and the sediment. Desalination 2
210, 110-124. 3
Mariotti, A., 1983. Atmospheric nitrogen as a reliable standard for natural 15N abundance 4
measurements. Nature, 685–687. 5
Mazzola, A., Mirto, S., La Rosa, T., Fabiano, M., Danovaro, R., 2000. Fish farming effects on 6
benthic community structure in coastal sediments: analysis of meiofaunal recovery. 7
Journal of Marine Science 57, 1454-1461. 8
McClelland, J.W., Valiela, I., 1998. Linking nitrogen in estuarine producers to land-derived 9
sources. Limnology and Oceanography 43, 577-85. 10
McGhie, T.K., Crawford, C.M., Mitchell, I.M., O'Brien, D., 2000. The degradation of fish-cage 11
waste in sediments during fallowing. Aquaculture 187, 351–366. 12
Mirto, S., La Rosa, T., Gambi, C., Danovaro, R., Mazzola, A., 2002. Nematodo community 13
response to fish-farm impact in the western Mediterranean. Environmental Pollution 116, 14
203-214. 15
Nordvarg, L., Johansson, T., 2002. The effects of fish farm effluents on the water quality in the 16
Aland archipielago, Baltic Sea. Aquacultural Engineering 25, 253-279. 17
Pantoja, S., Repeta, D.J., Sachs, J.P., Sigman., D.M., 2002. Stable isotope constrains on the 18
nitrogen cycle of the Mediterranean Sea water column. Deep Sea Research Part I: 19
Oceanographic Research Papers 49, 1609-1621. 20
Pérez, M., García, T., Ruíz, J.M., Invers, O., 2008. Physiological responses of the seagrass 21
Posidonia oceanica as indicators of fish farm impact. Marine Pollution Bulletin 56, 22
869-879. 23
Pergent, G., Mendez, S., Pergent-Martini, C., Pasqualini, V., 1999. Preliminary data on the 24
impact of fish farming facilities on Posidonia oceanica meadows in the Mediterranean. 25
Oceanologica Acta 22, 95-107. 26
Pergent-Martini, C., Boudouresque, C.F., Pasqualini, V., Pergent, G., 2006. Impact of fish 27
farming facilities on Posidonia oceanica meadows: a review. Marine Ecology 27, 310–28
319. 29
Peterson B.J., 1999. Stable isotopes as tracers of organic matter input and transfer in benthic 30
food webs: a review. Acta Oecologica 20, 479-487. 31
Peterson, B. J., Fry, B., 1987. Stable isotopes in ecosystem studies. Annual Review of Ecology 32
and Systematics 18, 293-320. 33
Pinnegar, J.K., Polunin, N.V.C., 2000. Contributions of stable-isotope data to elucidating food 34
webs of Mediterranean rocky littoral fishes. Oecologia 122, 399-409. 35
Pitta, P., Karakassis, I., Tsapakis, M., Zivanovic, S., 1999. Natural vs. Mariculture induced 36
variability in nutrients and plankton in the Eastern Mediterranean. Hydrobiologia 391, 37
181-194. 38
Roque d'Orbcastel, E., Blancheton, J.P., Boujard, T., Aubin, J., Moutounet, Y., Przybyla, C., 39
Belaud, A., 2008. Comparison of two methods for evaluating waste of a flow through 40
trout farm. Aquaculture 274, 72-79. 41
Ruiz, J.M., Pérez, M., Romero, J., 2001. Effects of fish farm loadings on seagrass (Posidonia 42
oceanica) distribution, growth and photosynthesis. Marine Pollution Bulletin 42, 749-43
760. 44
Ruiz, J.M., Marco-Méndez, C., Sánchez-Lizaso, J.L., in press. Remote influence of off-shore 45
fish farm waste on Mediterranean seagrass (Posidonia oceanica) meadows. Marine 46
Environmental Research 69, 118-126. 47
Sarà, G., 2007. Aquaculture effects on some physical and chemical properties of the water 48
column: A meta-analysis. Journal of Chemical Ecology 23 (3), 251-262. 49
Sarà, G., Scilipoti, D., Mazzola, A., Modica, A., 2004. Effects of fish farming waste to 50
sedimentary and particulate organic matter in a southern Mediterranean area (Gulf of 51
Castellammare, Sicily): a multiple stable isotope study (δ13C and δ15N). Aquaculture 234, 52
199-213. 53

MANUSCRIP
T
ACCEPTED
ACCEPTED MANUSCRIPT
19
Sarà, G., Scilipoti, G., Milazzo, M., Modica, A., 2006. Use of stable isotopes to investigate 1
dispersal of waste from fish farms as a function of hydrodynamics. Marine Ecology 2
Progress Series 313, 261-270. 3
Savage C, Elmgren R., 2004. Macroalgal (Fucus vesiculosus) δ15N values trace decrease in 4
sewage influence. Ecological Applications 14, 517-26. 5
Udy, J.W., Dennison W.C., 1997. Physiological responses of seagrasses used to identify 6
anthropogenic nutrient inputs. Marine Freshwater Research 47, 605-614. 7
Underwood, A.J., 1997. Experiments in ecology. Their Logical and Interpretation Using 8
Analysis of Variance. Cambridge University Press, p. 504. 9
Vezzuli, L., Chelosi, E., Riccardi, G., Fabiano, M., 2002. Bacterial community structure and 10
activity in fish farm sediments of the Ligurian sea (Western Mediterranean). 11
Aquaculture International 10, 123-141. 12
Vizzini, S., Mazzola, A., 2004. Stable isotope evidence for the environmental impact of a land-13
based fish farm in the western Mediterranean. Marine Pollution Bulletin 49, 61-70. 14
Wolanski, E., Spagnol, S., Thomas, S., Moore, K., Alongi, D.M., Trott, L., Davidson, A., 2000. 15
Modelling and visualizing the fate of shrimp pond effluent in a mangrove-fringed tidal 16
creek. Estuarine Coastal and Shelf Science 50, 85-97. 17
Wu R.S.S., 1995. The environmental impact of marine fish culture: Towards a sustainable 18
future. Marine Pollution Bulletin 31, 159-166. 19
Wu, R.S.S., Lam, K. S., Mackay, D. W., Lau, T. C. and Yam, V., 1994. Impact of marine fish 20
farming on water quality and bottom sediment: a case study of the sub-tropical 21
environment. Marine Environmental Research 38, 115-145. 22
Ye, L.X., Ritz, D.A., Fenton, G.E., Lewis, M.E., 1991. Tracing the influence on sediments of 23
organic waste from a salmonid farm using stable isotope analysis. Journal of 24
Experimental Marine Biology and Ecology 145, 161–174. 25
Zar, J.H., 1999. Biostatistical Análisis. Prentice Hall, USA, 660 pp. 26
27
28
29
30
31
32
33
34
35
36
37
38
39
40
41
42
43
44
45
46
47
48
49
50
51
52

MANUSCRIP
T
ACCEPTED
ACCEPTED MANUSCRIPT
20
Caption of figures 1
2
3
Figure 1: Sample sites map. 4
5
Figure 2: Diagram of the experimental design developed in this study. 6
7
Figure 3: Nitrogen isotopic ratio (δ15N) in the two macroalgae analyzed in Canary Islands, Asparagopsis 8
taxiformis and Stypopodium zonale. For each species of macroalgae the results for two depths (5m and 9
~20m) and three times of incubations (T2= 2 days; T4= 4 days; T6= 6 days) at different distances from 10
fish farm are shown. Vertical bars correspond to the standards error of the mean. 11
12
Figure 4: Nitrogen isotopic ratio (δ15N) in the two macroalgae analyzed in Murcia, Dictyopteris 13
polypodioides and Posidonia oceanica epiphytes. For each specie of macroalgae the results for two 14
depths (5m and ~20m) and three times of incubations (T2= 2 days; T4= 4 days; T6= 6 days) at different 15
distances from fish farm are shown. Vertical bars correspond to the standards error of the mean. 16
17
Figure 5: Nitrogen isotopic ratio (δ15N) in the macroalgae analyzed in Catalonia, Cystoseira 18
mediterranea. The results for two depths (5m and ~20m) and three times of incubations (T2= 2 days; T4= 19
4 days; T6= 6 days) at different distances from fish farm are shown. Vertical bars correspond to the 20
standards error of the mean. 21
22
Figure 6: Nitrogen content (% N) in the two macroalgae analyzed in Canary Islands, Asparagopsis 23
taxiformis and Stypopodium zonale. For each species of macroalgae the results for two depths (5m and 24
~20m) and three times of incubations (T2= 2 days; T4= 4 days; T6= 6 days) at different distances from 25
fish farm are shown. Vertical bars correspond to the standards error of the mean. 26
27
Figure 7: Nitrogen content (%N) in the two macroalgae analyzed in Murcia, Dictyopteris polypodioides 28
and Posidonia oceanica epiphytes. For each species of macroalgae the results for two depths (5m and 29
~20m) and three times of incubations (T2= 2 days; T4= 4 days; T6= 6 days) at different distances from 30
fish farm are shown. Vertical bars correspond to the standards error of the mean. 31
32
Figure 8: Nitrogen content (% N) in the macroalgae analyzed in Catalonia, Cystoseira mediterranea. The 33
results for two depths (5m and ~20m) and three times of incubations (T2= 2 days; T4= 4 days; T6= 6 34
days) at different distances from fish farm are shown. Vertical bars correspond to the standards error of 35
the mean. 36
37
38
MANUSCRIP
T
ACCEPTED
ACCEPTED MANUSCRIPTTable 1 Vertical attenuation coefficient (k) and superficial irradiance (% SI) values obtained at each incubation distance and depth for the Murcia study case during the incubation experiment.
% Superficial Irradiance (µmol quanta m-2s-1)
Distance from fish
cages (m)
K (m-1)
5 m-bioassays ∼20 m-bioassays
Mean ES Mean ES Mean ES
0 0,054 0,003 77,2 7,7 34,7 4,0
25 0,061 0,001 65,0 2,7 28,3 1,1
50 0,052 0,001 70,9 3,2 31,0 1,6
100 0,055 0,0005 84,2 3,7 34,6 0,3
200 0,057 0,001 62,8 2,1 28,3 1,1
500 0,048 0,001 78,3 3,8 37,6 2,6
1000 0,048 0,0009 79,2 0,5 37,7 0,6

MANUSCRIP
T
ACCEPTED
ACCEPTED MANUSCRIPTTable 2 Mean ± SE values of δ15N and % N in macroalgae collected from unpolluted sites at each location (references values).
Reference values (n=10)
Site Specie
δ15N (‰) % N
Asparagopsis taxiformis 3.9 ± 0.2 1.7 ± 0.1 Canary Islands
Stypopodium Zonale 2.5 ± 0.2 0.9 ± 0.1
Dictyopteris polypodioides 1.7 ± 0.1 1.8 ± 0.1 Murcia
P. oceanica epiphytes 3.5 ± 0.1 1.1 ± 0.04
Catalonia Cystoseira mediterranea 6.1 ± 0.3 1.4 ± 0.2

MANUSCRIP
T
ACCEPTED
ACCEPTED MANUSCRIPTTable 3 Summary of ANOVA one-way results for δ15N values of the macroalgae analyzed. Post hoc associations are shown in lower-case letters. For the sake of simplicity, only SNK test results for significant differences are shown. Ho: there are no significant effects between distances. NS = not significant, *p ≤ 0.05; **p ≤ 0.01; ***p ≤ 0.001.
Samples
ANOVA one-way
(p-value)
SNK -test (distance) Site Specie
Depth Time
df
F-value
0 25 50 100 200 500 1000 T2 ns 27 1.2 - - - - - - -
T4 *** 27 9.6 a a a a b a a
5m T6 ns (1) 27 2.2 - - - - - - -
T2 ** 27 4.1 ab a a a b ab ab T4 *** 26 14.8 b ab a ab b b c
Asparagopsis taxiformis
∼20m T6 ns 25 2.4 - - - - - - -
T2 *** 24 6.9 a a b a a a a T4 ** 27 4.1 a a ab a a ab b
5m
T6 * 27 3.1 a a a a a a a T2 ns 22 0.9 - - - - - - -
T4 ns 27 0.3 - - - - - - -
Canary Islands
Stypopodium zonale
∼20m T6 ns 27 2.3 - - - - - - -
T2 ns (1) 27 3.2 - - - - - - -
T4 ns 27 1.4 - - - - - - -
5m
T6 *** 27 15.4 a ab a ab bc c d T2 *** (1) 26 9.3 a b b b a b b T4 *** 27 27.5 a b b b b c c
Dictyopteris polypodioides
∼20m T6 *** 26 37.8 a a b b b c d T2 *** 27 4.6 a b b b b b b T4 ** 21 4.8 a ab b ab ab b b
5m
T6 *** 23 9.5 a a a a ab c bc T2 *** 26 6.2 a b b b b b b T4 ns (1) 23 1.7 - - - - - - -
Murcia
Posidonia oceanica epiphytes
∼20m T6 *** 27 6.4 a bc bc ab bc c c T2 *** 24 9.0 b a b b a b b T4 *** 25 8.9 a a b b b b
5m
T6 ** (1) 27 4.1 a ab ab b b b b T2 *** 27 8.8 b a ab b b ab b T4 *** 24 16.4 a a b ab c bc
Catalonia Cystoseira
mediterranea ∼20m
T6 ns 25 0.9 - - - - - - -
(1) Non homogeneous variances. Significant differences if p ≤ 0.01

MANUSCRIP
T
ACCEPTED
ACCEPTED MANUSCRIPTTable 4 Summary of ANOVA one-way results for % N values of the macroalgae analyzed. Post hoc associations are shown in lower-case letters. For the sake of simplicity, only SNK test results for significant differences are shown. Ho: there are no significant effects between distances. NS = not significant, *p ≤ 0.05; **p ≤ 0.01; ***p ≤ 0.001.
Samples
ANOVA one-way
(p-value)
SNK -test (distance) Site Specie
Depth Time
df
F-value
0 25 50 100 200 500 1000 T2 ns 26 1.8 - - - - - - -
T4 ** (1) 26 5.5 a b b b b b b
5m T6 *** 26 20.1 c bc bc bc a a b
T2 ns 27 0.9 - - - - - - - T4 ** 26 4.5 ab ab ab ab a b b
Asparagopsis taxiformis
∼20m T6 ** 26 4.6 ab abc abc a bc c abc T2 ns 27 1.1 - - - - - - -
T4 ns (1) 26 2.2 - - - - - - -
5m
T6 * 27 3.4 a a a a a a a T2 ns 27 1.2 - - - - - - -
T4 ns 27 0.4 - - - - - - -
Canary Islands
Stypopodium zonale
∼20m T6 ns 27 2.2 - - - - - - -
T2 ns 27 2.2 - - - - - - -
T4 ns (1) 27 1.1 - - - - - - -
5m
T6 ** 27 4.4 a ab ab a ab ab b T2 ns 27 0.1 - - - - - - -
T4 ** 27 3.9 ab ab ab a a ab b
Dictyopteris polypodioides
∼20m T6 ** (1) 27 5.2 abc a bc ab abc c c T2 ** 27 4.1 ab ab ab a ab b b T4 ns 22 0.5 - - - - - - -
5m
T6 *** 23 7.5 a ab ab bc bc c c T2 ns 27 1.3 - - - - - - -
T4 ns 23 2.4 - - - - - - -
Murcia
Posidonia oceanica epiphytes
∼20m T6 ns 27 2.1 - - - - - - -
T2 *** (1) 26 9.4 a b a a a a a T4 * (1) 25 3.0 - - - - - - -
5m
T6 * 27 2.8 a a a a a a a T2 ** 27 4.2 ab a ab ab b ab b T4 * 22 3.5 a a a a a a a
Catalonia Cystoseira
mediterranea ∼20m
T6 *** (1) 26 10.0 a abc ab abc c bc d
(1) Non homogeneous variances. Significant differences if p ≤ 0.01
MANUSCRIP
T
ACCEPTED
ACCEPTED MANUSCRIPTFigure 1
N
#
#
#
Canary Islands
ATLANTIC OCEAN MEDITERRANEAN SEA
Catalonia
Murcia
600 0 600 1200 Miles
MANUSCRIP
T
ACCEPTED
ACCEPTED MANUSCRIPTFigure 2
Fish farm cages
∼20m 0
0 m 25 m 50 m
100 m
200 m
500 m
1000 m
Bioassays
5m
Main current

MANUSCRIP
T
ACCEPTED
ACCEPTED MANUSCRIPTFigure 3
0 25 50 100 200 500 10000
2
4
6
Distance from fish farm (m)
0 25 50 100 200 500 1000 0 25 50 100 200 500 1000
C. mediterranea T1- 5m T2- 5m T3- 5m
T1- 20m T2- 20m T3- 20m
δ15 N
δ15 N
0
2
4
6
8T1- 5m
S. zonale
0 25 50 100 200 500 10002
3
4
5
0 25 50 100 200 500 1000 0 25 50 100 200 500 1000
C. mediterranea T1- 5m T4- 5m T6- 5m
T2- 20m T4- 20m T6- 20m
δ15N
(‰
)δ15
N (
‰)
2
3
4
5
6T2- 5m
A. taxiformis
0 25 50 100 200 500 10000
1
2
3
Distance from fish farm (m)
0 25 50 100 200 500 1000 0 25 50 100 200 500 1000
C. mediterranea T1- 5m T4- 5m T6- 5m
T2- 20m T4- 20m T6- 20m
δ15N
(‰
)δ15
N (
‰)
0
1
2
3
4T2- 5m
S. zonale
MANUSCRIP
T
ACCEPTED
ACCEPTED MANUSCRIPTFigure 4
0 25 50 100 200 500 10000
2
4
0 25 50 100 200 500 1000 0 25 50 100 200 500 1000
C. mediterranea T1- 5m T4- 5m T6- 5m
T2- 20m T4- 20m T6- 20m
δ15N
(‰
)δ15
N (
‰)
0
2
4
6T2- 5m
D. polypodioides
0 25 50 100 200 500 10000
2
4
Distance from fish farm (m)
0 25 50 100 200 500 1000 0 25 50 100 200 500 1000
C. mediterranea T1- 5m T4- 5m T6- 5m
T2- 20m T4- 20m T6- 20m
δ15N
(‰
)δ15
N (
‰)
0
2
4
6T2- 5m
P. oceanica epiphytes
MANUSCRIP
T
ACCEPTED
ACCEPTED MANUSCRIPTFigure 5
0 25 50 100 200 500 10004
5
6
7
Distance from fish farm (m)
0 25 50 100 200 500 1000 0 25 50 100 200 500 1000
C. mediterranea T1- 5m T4- 5m T6- 5m
T2- 20m T4- 20m T6- 20m
δ15N
(‰
)δ15
N (
‰)
4
5
6
7
8T2- 5m
C. mediterranea

MANUSCRIP
T
ACCEPTED
ACCEPTED MANUSCRIPTFigure 6
0 25 50 100 200 500 10000
1
2
3
Distance from fish farm (m)
0 25 50 100 200 500 1000 0 25 50 100 200 500 1000
C. mediterranea T1- 5m T4- 5m T6- 5m
T2- 20m T4- 20m T6- 20m
% N
% N
0
1
2
3
4T2- 5m
A. taxiformis
0 25 50 100 200 500 10000
1
2
3
Distance from fish farm (m)
0 25 50 100 200 500 1000 0 25 50 100 200 500 1000
C. mediterranea T1- 5m T4- 5m T6- 5m
T2- 20m T4- 20m T6- 20m
% N
% N
0
1
2
3
4T2- 5m
S. zonale

MANUSCRIP
T
ACCEPTED
ACCEPTED MANUSCRIPTFigure 7
0 25 50 100 200 500 10000
1
2
3
Distance from fish farm (m)
0 25 50 100 200 500 1000 0 25 50 100 200 500 1000
C. mediterranea T1- 5m T4- 5m T6- 5m
T2- 20m T4- 20m T6- 20m
% N
% N
0
1
2
3
4T2- 5m
D. polypodioides
0 25 50 100 200 500 10000
1
2
3
Distance from fish farm (m)
0 25 50 100 200 500 1000 0 25 50 100 200 500 1000
C. mediterranea T1- 5m T4- 5m T6- 5m
T2- 20m T4- 20m T6- 20m
% N
% N
0
1
2
3
4T2- 5m
P. oceanica epiphytes

MANUSCRIP
T
ACCEPTED
ACCEPTED MANUSCRIPTFigure 8
0 25 50 100 200 500 10000
1
2
3
Distance from fish farm (m)
0 25 50 100 200 500 1000 0 25 50 100 200 500 1000
C. mediterranea T1- 5m T4- 5m T6- 5m
T2- 20m T4- 20m T6- 20m
% N
% N
0
1
2
3
4T2- 5m
C. mediterranea