an environmental uncertainty-based diagnostic reference ...orca-mwe.cf.ac.uk/62077/2/naim.pdf1 an...
TRANSCRIPT
This is an Open Access document downloaded from ORCA, Cardiff University's institutional
repository: http://orca.cf.ac.uk/62077/
This is the author’s version of a work that was submitted to / accepted for publication.
Citation for final published version:
Gallear, David, Ghobadian, Abby, Li, Yanhong, O'Regan, Nicholas, Childerhouse, Paul and Naim,
Mohamed Mohamed 2014. An environmental uncertainty-based diagnostic reference tool for
evaluating the performance of supply chain value streams. Production Planning & Control 25 (13-
14) , pp. 1182-1197. 10.1080/09537287.2013.808838 file
Publishers page: http://dx.doi.org/10.1080/09537287.2013.808838
<http://dx.doi.org/10.1080/09537287.2013.808838>
Please note:
Changes made as a result of publishing processes such as copy-editing, formatting and page
numbers may not be reflected in this version. For the definitive version of this publication, please
refer to the published source. You are advised to consult the publisher’s version if you wish to cite
this paper.
This version is being made available in accordance with publisher policies. See
http://orca.cf.ac.uk/policies.html for usage policies. Copyright and moral rights for publications
made available in ORCA are retained by the copyright holders.
1
An Environmental Uncertainty-based Diagnostic Reference Tool for Evaluating the Performance of Supply Chain Value Streams
David Gallear, Abby Ghobadian, Rose Li, Nicholas O’Regan, Paul Childerhouse and Mohamed Naim
Dr David Gallear Brunel Business School Brunel University Uxbridge UB8 3PH United Kingdom Email: [email protected] Professor Abby Ghobadian Henley Business School Greenlands Henley-on-Thames Oxfordshire, RG9 3AU United Kingdom Email: [email protected] Rose Li University of Oxford Department of Education 15 Norham Gardens Oxford OX2 6PY United Kingdom Email: [email protected] Professor Nicholas O’Regan Bristol Business School University of the West of England Coldharbour Lane Bristol BS16 1QY United Kingdom Email: Nicholas.O'[email protected] Tel: +44 (0) 117 328 3735 Professor Paul Childerhouse Massey University, Private Bag 11 222 Palmerston North, 4442 New Zealand Email: [email protected] Professor Mohamed Naim Cardiff Business School Aberconway Building Colum Drive Cardiff CF10 3EU Email: [email protected]
2
An Environmental Uncertainty-based Diagnostic Reference Tool for Evaluating the Performance of Supply Chain Value Streams
Abstract
This research has responded to the need for diagnostic reference tools explicitly linking the
influence of environmental uncertainty and performance within the supply chain. Uncertainty
is a key factor influencing performance and an important measure of the operating
environment. We develop and demonstrate a novel reference methodology based on the data
envelopment analysis (DEA) for examining the performance of value streams within the
supply chain with specific reference to the level of environmental uncertainty they face. In
this paper, using real industrial data, 20 product supply value streams within the European
automotive industry sector are evaluated. Two are found to be efficient. The peer reference
groups for the underperforming value streams are identified and numerical improvement
targets are derived. The paper demonstrates how DEA can be used to guide supply chain
improvement efforts through role-model identification and target setting, in a way that
recognises the multiple dimensions/outcomes of the supply chain process and the influence
of its environmental conditions. We have facilitated the contextualisation of environmental
uncertainty and its incorporation into a specific diagnostic reference tool.
Keywords: Diagnostic reference tool; data envelopment analysis; supply chain; performance
measurement; environmental uncertainty; contingency theory

3
1. Introduction
Over the past few decades globalisation coupled with hyper competition has pushed supply
chain management (SCM) to the forefront of research and practice agendas (e.g. Harland,
1996; Storey et al., 2006; Christopher, 2011). A supply chain consists of a geographically
dispersed network of actors that transform raw materials into distributed products (Bowersox
et al., 1999). The coordination, control, and improvement of such a complex network of
activity offers a major challenge to managers. A properly designed performance
measurement system is the cornerstone of effective coordination, control and enhanced
competitiveness, and hence the growing attention to supply chain performance measurement
issues (Gunasekaran et al., 2004). The result is a glut of performance measures (Beamon,
1999), many of which have been criticised principally because they: (a) fail to reflect the
multiple dimensions/goals of business units within the supply chain (Bytheway, 1995;
Beamon, 1999), and (b) ignore the factors that are beyond the control of management, such
as uncertainty (Beamon, 1999).
Data envelopment analysis (DEA) offers a solution to the shortcomings highlighted above.
First, the technique is highly versatile enabling analysts to use ordinal, discrete, interval and
ratio variables side by side to construct a performance model. As such, factors frequently
measured using ordinal variables such as environmental uncertainty can be included in the
analysis. Second, it can contextualise and make allowances for the factors that are outside the
control of management but affect the performance of business units within the supply chain.
Third, it can help management to establish informed improvement targets (Charnes et al.,
1994; Liu et al., 2000; Saranga and Moser, 2010).
4
This paper demonstrates a novel application of how the DEA technique can be used to
facilitate the development of a diagnostic reference tool to analyse the supply chain
performance of product value streams (business units) operating within a supply chain
network. Moreover, it also demonstrates how the tool can be used to guide management’s
efforts to improve the units’ performance through role-model identification and target setting,
in a way that recognises the multiple dimensions/outcomes of the supply chain process and
the influence of its environmental conditions.
Environmental uncertainties have a major impact on the performance of the supply chain and
on managerial decisions, and the ability to align the organisation with the demands of the
external environment is an important source of competiveness. The performance
management technique we present enables managers to establish how well their product
value stream is aligned with the uncertainties of the external environment in comparison with
the best aligned value stream. By applying this technique, they can discriminate between the
most efficient and less efficient product value streams. It enables not only comparison of like
with like, but allows managers to pinpoint weaknesses and set appropriate improvement
targets. Moreover, managers can identify suitable role models (value streams other than those
on the best performing frontier) and systematically improve target levels. The flexibility to
select an appropriate role model is of significant benefit.
Environmental uncertainty in this application is derived from the examination of supply-side
factors, demand-side factors, internal process factors and control factors, across the linkages
of product value streams extending upstream from a focal business unit to the first-tier
suppliers, and downstream to the first-tier customers. As such, the model incorporates data
spanning the focal business units’ immediate supply network (Slack et al., 2004). Real
5
industrial data is used, extracted from a survey conducted within the European automobile
supply chain.
The choice of uncertainty as the input variable in the measurement model is predicated on the
co-alignment and contingency theories of management. Both theories play an important role
in organisational research (Carroll, 1993; Johnson et al., 2002). In the context of the supply
chain, Van der Vorst and Beulens (2002) pointed out that the literature unanimously
recognises that uncertainties in supply, process and demand have a major impact on the
manufacturing function. Davis’s (1993) analysis highlighted the presence of uncertainty at all
levels within a global supply chain from raw materials acquisition to finished product
demand (Talluri and Baker, 2002). Van der Vorst and Beulens (2002) argued that uncertainty
propagates throughout the supply chain and leads to inefficient processing and non-value-
adding activities. As such, uncertain environments bring immense pressure on all
organisations to make ‘carefully considered effective decisions’ (Koutsoukis et al., 2000).
The motivation for this research stems firstly from the increasing recognition within the SCM
literature of the critical influence of uncertainty on the efficiency, effectiveness and flexibility
of supply chains (Wilding, 1998; Koutsoukis et al., 2000; Van der Vorst and Beulens, 2002;
Lockamy et al., 2008), secondly from the paucity of empirical research examining the
influence of uncertainty on supply chain performance, and thirdly from the perceived
advantages offered by the DEA technique for developing diagnostic reference tools for
comparative performance assessment (Talluri and Baker, 2002; Saranga and Moser, 2010).
The paper is organised as follows. First, a discussion of performance measurement within the
supply chain is presented, followed by an explanation of DEA’s general principles and an
6
examination of relevant past applications. The data sources and research design are then
discussed, followed by the application of the DEA model to a sample of firms operating
within the European automobile industry. Finally, managerial implications of the use of the
diagnostic reference model, conclusions and suggested avenues of future research are
discussed.
2. Supply chain strategy and performance evaluation
The supply chain management concept and cycle time compression stem from a shift in
predominance of price competition to simultaneously competing on a broad range of factors
(Hewitt, 1994; Godsell et al., 2011). Maximising the value added to products and satisfying
customers have become more and more important in addition to inventory elimination and
cost reduction. This prompted Hewitt (1994) to suggest that an efficient and effective supply
chain management strategy ought to address value maximisation, process integration, and
responsiveness/cycle time reduction simultaneously. Bytheway (1995) extended this
argument by suggesting that the following three broad types of supply chain strategies were
open to organisations: efficiency, effectiveness and evolution-based strategies. The focus of
an efficiency strategy is on improving productivity, reducing cost and increasing the profit
margin. An effectiveness strategy, on the other hand, is concerned with quality, service
excellence and image. An evolution strategy focuses on developing the organisation’s ability
to respond to changes taking place in its operating environment. According to Bytheway
(1995) hitherto efficiency type strategies have been the most prevalent, however, these
strategies work best in stable and mature markets. In reality, not all markets are mature and,
more importantly, most markets are unstable. The greater environmental turbulence means
that organisations increasingly have to pursue all of the three supply chain strategies
7
simultaneously. Pursuing a single supply chain strategy carries several risks. First, it may
result in a misalignment with the operating environment. Second, it may result in a
misalignment with the organisation’s strategic goals. In either case the organisation’s risk of
failure increases. Bytheway (1995) went on to argue that the supply chain evaluation system
should enable management to understand their business’s strategic position and what can be
improved in the business, thus, he proposed a supply chain performance measurement model
consisting of the following three broad dimensions: efficiency, effectiveness, and market
responsiveness. Li and O’Brien (1999) also recognised multiple goals/dimensions of supply
chains and suggested that profitability, flexibility, reliability and waste limitation are the four
important aspects of SCM. Akyuz and Erkan (2010) and Beamon (1999) conducted a
comprehensive review of supply chain performance measurement models, and concluded that
the current models suffered from the following limitations:
focusing on cost as the primary measure of performance;
reliance on a single, mainly economic oriented, supply chain performance measure;
ignoring the interactions among different supply chain strategies; and
ignoring the potential influence of uncertainty, which is outside management control but
has a strong influence on supply chain performance.
Beamon (1999) proposed a framework for the measurement of supply chain performance
comprising of three broad components critical to supply chain success: efficient use of
resources, quality of products and service, and system flexibility. She further argued that an
adequate supply chain measurement system must at least contain one measure from each of
the three broad performance components, and moreover, that the measures used for
representing each of the dimensions must be consistent with the organisation’s strategic
goals. Beamon’s (1999) proposed model explicitly assumes that the three broad supply chain
8
strategies identified by Bytheway (1995) and discussed earlier, are not mutually exclusive
and that only a comprehensive system of measurement could show the effect of interactions
between different supply chain strategies. A key issue for organisations is the weight to be
attached to each of these strategies.
There is a broad consensus that process-driven analyses provide essential links between
strategy, execution, and ultimate value creation (Melnyk et al., 2004). The literature, while
divided on specific measures, is more united on the desirable attributes of supply chain
performance measures. These important attributes can be summarised as follows (Beamon,
1999; Borenstein et al., 2004; Akyuz and Erkan, 2010):
(a) reliance on cost measures is insufficient and could be potentially misleading in a fast-
changing and increasingly competitive environment;
(b) models ought to reflect a multiplicity of goals and outcomes – they should include
quantitative and qualitative measures – furthermore, measures ought to reflect the
strategic priorities of the organisation;
(c) the measurements used should take into account the effects of contexts or situation-
related factors; and
(d) to enable management to control and plan, the performance/outcomes should be
compared and contrasted against the best possible potential performance.
The above requirements increase the complexity of supply chain performance evaluation
models. One of the biggest problems of using multiple measures is interpretation, because it
is usual for different metrics to move in different directions. Moreover, it is also often
difficult to combine different measures and construct a single index. For control and planning
purposes the performance over one time period can be compared with:
9
past performances of the organisation, that is to say temporal comparisons;
the performance of different divisions of an organisation, that is to say internal cross-
sectional performance; or
the performance of different organisations, that is to say external cross-sectional
performance.
These comparisons would be more meaningful if a robust single diagnostic measure could be
established and the current performance (in temporal studies) or the performance of the
division or organisation in cross-sectional studies could be compared with the most efficient
performance that has occurred. Furthermore, it would be more useful to managers if they
could identify the reasons for inefficiencies. The data envelopment analysis (DEA) technique
discussed in the following sections can potentially address all the desirable attributes of a
multi-goal supply chain diagnostic reference model and facilitate the development of a close
to ideal performance index.
3. Data envelopment analysis (DEA) and its applications
DEA is a linear-programming-based method for assessing the relative performance of
decision-making units (DMUs). It measures the relative efficiency of each DMU in
comparison to other DMUs (Liu et al., 2000). The method was initially proposed by Charnes
et al. (1978) based on the definition of efficiency proposed by Farrell (1957): the ratio of
attainable output to actual inputs. A distinctive feature of DEA, considered to be its primary
advantage (Easton et al., 2002; Cherchye et al., 2008), is that it can establish a combined (or
composite) index of overall performance thus facilitating easy comparison between decision-
making units such as departments, organisations or supply chains. DEA converts multiple

10
input and output measures of a DMU into a single comprehensive measure of efficiency, thus
providing a measure by which one DMU can compare its performance, in relative terms, to
other homogeneous DMUs (Easton et al., 2002). It can also give information on the
individual performance measurements that make up the aggregate score thus enabling the
manager of a DMU to take action on specific measures, and as Easton et al. (2002) further
explain, because both input and output measures are incorporated to provide a measure of
efficiency (i.e. outputs/inputs) a more valid comparison between DMUs is provided.
According to Weber (1996), mathematically DEA starts by identifying an ‘efficient frontier’
from the observed inputs and outputs of the set of decision-making units under examination.
Based on the notion of Pareto optimality, this efficient frontier is determined by the most
efficient DMU(s) under study. A DMU is efficient if there is no other DMU (or combination
of other DMUs) that can produce at least the same levels of all outputs, with less of some
resource input and no more of any other. The relative efficiency of each DMU relative to this
efficient frontier is then calculated (Weber, 1996).
The efficiency score for a DMU is defined as the total weighted score of outputs divided by
the total weighted score of inputs. To avoid the potential difficulty in assigning these weights
among various DMUs, the DEA technique computes weights that give the highest possible
relative efficiency score to a DMU while keeping the efficiency scores of all DMUs less than
or equal to one under the same set of weights (Liu et al., 2000). It is this approach that
ensures that all DMUs are evaluated on the basis of relative efficiency (Easton et al., 2002).
DEA’s total objectivity in the establishment of weights for the input and output measures is
considered to be a further major benefit (Braglia and Petroni, 2000). The feedback potential
of DEA, through the provision of helpful information to managers for use in improving
11
performance, make it a valuable tool for enhancing the quality of decision making (Easton et
al., 2002). A further major advantage of the DEA technique is its versatility – it enables the
analyst to use ordinal, discrete, interval and ratio variables side by side to construct a
diagnostic model. Thus, factors such as environmental uncertainty measured in ordinal
variables can be central in the analysis.
Arguably, one of the main benefits of using DEA over other PM tools that are used for
informing managerial action (for example regression analysis or cost–benefit ratio analysis)
is its ability to provide benchmarking DMUs and a peer reference group for inefficient
DMUs (Yang et al., 2011). The technique enables the analyst to construct an overall
performance index from multiple input and output variables and identify the most efficient
frontier. By identifying efficient DMUs, benchmarks of performance for inefficient DMUs
are established for direct comparison, thus guiding managers’ appreciation of how resources
may be best directed for improvement. Furthermore, it can deal with many different inputs
and outputs simultaneously and, by using the non-parametric approach, without prior
knowledge of the function of inputs and outputs.
From its origins in the not-for-profit sector (Charnes et al., 1981), the use and applications of
DEA have expanded to the private/for-profit sectors (Easton et al., 2002). Applications in the
not-for-profit sector have included: healthcare/hospitals (Pina and Torres, 1992; Chilingerian,
1994), education (Knox Lovell et al., 1994; Beasley, 1995) and governmental organisations
(de Boer and Telgen, 1998) among others. DEA models have successfully been applied in the
private/for-profit sector fields such as manufacturing (Ray and Kim, 1995; Xu et al., 2009),
retailing (Athanassopoulos, 1995; Vaz et al., 2010), banking (Al-Faraj et al., 1993;
Pasiouras, 2008) and transport (Forsund and Hemaes, 1994) among others.
12
Since the early 1990s, the use of DEA in supply chain management-related situations has
also expanded. For example, Talluri and Baker (2002) applied DEA to determining the
optimal number of suppliers, manufacturers and distributors for supply chain network design.
Sevkli et al. (2007) applied DEA for comparing suppliers of an appliance manufacturer in
Turkey. The nature and utility of a range (non-exhaustive) of real-world empirical DEA
applications in the supply chain management arena are presented in Table 1.
“take in Table 1”
This paper extends such applications. Its unique contributions lie in its application to value
stream performance diagnosis within the supply chain and its incorporation of environmental
uncertainty in the measurement model, neither of which have been covered in prior research.
4. An environmental uncertainty-based diagnostic tool
The single input, multiple output DEA evaluation model used in this study is based upon the
Charnes–Cooper–Rhodes (CCR) ratio model (Charnes et al., 1978, 1994).
This is a well-established and extensively applied model, and as such its discussion and
mathematical notation is limited in the main body of this paper. A description of the model
as used in our analysis is presented in Appendix 1.The CCR model was chosen for its
appropriateness to this application given its ability to establish a best-practice frontier based
on best observed performance, and evaluate the efficiency of each decision-making unit
(DMU) relative to this frontier. CCR remains one of the most frequently used DEA models
in practical applications (Green and Cooks, 2004). It is recognised as one of the most
13
influential models by researchers (Seiford 1996), and has been successfully applied in many
operations and supply chain performance studies (for example, Azadeh et al., 2007; Li and
Dai, 2009; Azadi and Saen, 2011; Yang et al., 2011). Furthermore, it is appropriate in
applications, such as the present application, where there are no economies (or diseconomies)
of scale present due to significant variations in the size of DMUs.
We deploy the diagnostic model to compare the performance of 20 product delivery value
streams in the European car industry. In this manner, the DEA model measures the relative
efficiency of each value stream based on multiple criteria when compared to the most
efficient value streams under investigation. The data sources and rationale for the selection of
the input and output variables are discussed in this section. The next section then
demonstrates the application of the diagnostic model.
4.1 Data sources and research design
The primary data used in this application were drawn from the Quick Scan (QS) audit study
(Childerhouse, 2002; Towill et al. 2002) carried out by a UK-based university research
group. This choice was influenced by two important considerations. First, the purpose of the
QS study was to collect information to assess and evaluate supply chain performance. More
specifically it was to study the uncertainty and related factors capable of influencing the
performance of supply chains. Thus, the information collected by the QS audits was highly
relevant to the development of this diagnostic tool. Second, the organisations covered by the
study sample were from the European automotive industry and thus the data set was
homogenous. This eliminated potential variations in supply chain performance due to
industrial contingencies, making direct comparison plausible. A detailed description of the
Quick Scan methodology is beyond the scope of this paper. The reader is referred to
14
Childerhouse (2002) and Towill et al. (2002) for a full description of the procedure.
Specifically, for this study the focal decision-making units (DMUs) to be evaluated and
compared are (single echelon) business units representing product delivery processes from
the European automotive industry sector. Data incorporated in the DEA model’s input
variable (discussed fully in the next section) are derived from the examination of the
characteristics of (i) the supply-side linkage of each of the business units to their first-tier
suppliers, and (ii) the demand-side linkage of each of the business units to their first-tier
customers, in addition to the business unit’s internal process and control factors. As such, the
evaluation model incorporates data from beyond the boundaries of a single business unit
echelon. The DMUs are referred to in this paper as (product delivery) value streams for
accuracy. An organisation typically consists of a number of delivery value streams, and by
focusing on a single delivery value stream we avoid aggregating environmental conditions
that are likely to be different for different value streams. This approach helps us to avoid loss
of important data and provides a more focused and meaningful reference model and analysis.
4.2 Selection of DEA variables
The selection of input and output variables plays a key role in the efficacy of the diagnostic
model. The choice is influenced by the strategic goals of the supply chain, ease of defining
the relevant variables, the ability to measure the selected variables at regular intervals, level
of aggregation, ease of understanding, and cost/benefit trade-off of the measures involved.
The model presented in this paper is based on the assumption that the goal of the supply
chain is simultaneous improvement of its efficiency, effectiveness and flexibility. The
variables selected for the model presented in this paper are given in Table 2.
“take in Table 2”
15
4.2.1 DEA input variable – environmental uncertainty
Traditionally, input in the operations management context is defined as the labour, material
and capital cost. However, in the case of highly complex systems in a supply chain it is very
difficult if not impossible to identify the labour, material and capital cost that is a direct input
to a complex multistage process. On the other hand, as highlighted previously, many authors
have identified uncertainty as a key factor influencing the efficiency, effectiveness and
flexibility of the supply chain (Wilding, 1998; Koutsoukis et al., 2000; Van der Vorst and
Beulens, 2002; Lockamy et al., 2008). Sabri and Beamon (2000) state that ‘uncertainty is one
of the most challenging but important problems in supply chain management’, and the
existing body of knowledge suggests that uncertainty is an important input to any supply
chain performance measurement model. Christopher (2011) and Bowersox and Closs (1996)
also point out that the performance of different supply chains and the decision-making units
within them is influenced by the level of uncertainty they experience.
In this application, uncertainty is deliberately chosen as the sole input variable defining the
reference model. The extant management literature suggests that the environment is a source
of constraints, contingencies, problems and opportunities that affect the terms on which
organisations transact business (Khandwalla, 1977; Mintzberg, 1979). As open systems,
organisations need to adapt to the changing environment through changes in the way they
transact business (Katz and Kahn, 1966; Lawrence, 1981). Environment is defined as the
aggregate of factors that have an impact or the potential to have an impact on an
organisation’s functioning (Emery and Trist, 1965; Thompson, 1967). The choice of
uncertainty as the sole input variable in the model is predicated on the co-alignment and
contingency theories. Both co-alignment and contingency theory play an important role in
16
organisational and operations management research (Hofer, 1975; Carroll, 1993; Johnson et
al., 2002).
The co-alignment theory suggests that the ability of an organisation to adapt to the changing
environmental contingencies to ‘fit ’ with the operating context is the key to survival and
enhanced performance (Chandler, 1962; Jauch et al., 1980; Lawrence, 1981; Yasai-Ardekani
and Nystrom, 1996). The effectiveness of the adaptive response is dependent on aligning the
response to the environmental circumstances faced by the organisation (Miles and Snow,
1978; Hambrick, 1983; Lee and Miller, 1996; Strandholm et al., 2004). Contingency theory
suggests that managers play an active but limited role in the continuous process of adapting
to the emerging contingencies (Thompson, 1967; Hofer, 1975; Grandori, 1984). Managers
are viewed as a component of the total system that is technically constrained by the
environment (Astley and Fombrun, 1983; Bourgeois, 1984). The focus of managerial
decision making is not primarily choice, but on gathering correct information about changes
in the environment and examining the consequences of alternative responses because
strategic choice among contingencies are more consequential (Astley and Van de Ven, 1983).
In other words, the key input to an organisational unit is provided by the environment and
managers who respond appropriately are likely to achieve superior performance. As such, the
uncertainty is an important measure of the operating environment and an input that managers
need to react to. The nature of the reaction, to a large extent, determines the likelihood of
organisational success.
Measuring uncertainty is not simple. Both Davis (1993) and Mason-Jones and Towill (1998)
segmented supply chain uncertainties into four areas within the supply chain so that root-
causes and methods for minimisation can be developed. The latter identify the four areas of:
17
value-adding process uncertainty, supply uncertainty, demand uncertainty and control
(system) uncertainty.
The measure for the DEA input variable uncertainty score was the aggregate (sum) of four
individual scores (each on a four point Likert scale) given for (i) supply-side uncertainty, (ii)
demand-side uncertainty, (iii) process uncertainty and (iv) [system] control uncertainty.
Accordingly, an uncertainty score of 16 represents the highest perceived value stream
uncertainty, and an uncertainty score of one the lowest. Table 3 shows the simple
questionnaire completed with respect to each value stream (Towill et al., 1999, 2002;
Childerhouse, 2002), and Appendix 2 presents the primary data collected and used for
assessing uncertainty in the four supply chain areas during the QS audit investigations. Each
QS audit involved multiple site visits to each value stream business unit by the QS team (a
multidisciplinary team of researchers, site engineers and managers, and experts from the
research partner). The questionnaire was completed by members of the QS team on the basis
of the total information relating to uncertainty at their disposal. To ensure comparability, the
questionnaires for all 20 value streams were activated only once all had been analysed, and
where necessary the Likert scores were verified by cross-reference to detailed QS reports and
re-visiting various data banks. The choice of a four point Likert scale was aimed at reducing
any tendency to regress towards the mean, and instead to focus on strengths and weaknesses
of individual value streams (Saunders et al., 2002). In summary, the uncertainty score
measure is an assessment of the environmental conditions in which the business is operating,
and for the reasons stated previously it is the input variable in our diagnostic model.
“take in Table 3”
18
4.2.2 DEA output variables
The three output variables used in the diagnostic model are profit margin, delivery window
and schedule stability (Table 2). These three variables were chosen, in the context of the
European automobile industry, to reflect the three essential dimensions of supply chain
strategies identified by Beamon (1999). Profit margin measures the efficient use of resources.
Efficient resource management is critical to profitability (Beamon, 1999). Profit margin is a
generally accepted performance measure and is used to measure efficient use of resources in
this application because unlike other measures such as total cost of manufacturing and
amount of obsolete inventory for example, it provides a more extensive representation of
each value stream’s resource performance. The measure for profit margin is price minus
variable cost, divided by price. Delivery window is the measure of on-time delivery, a critical
component in customer service. The measure for delivery window is the percentage of orders
delivered by the value stream to the customer on or before the specified due date. Schedule
stability is a measure of each value stream’s flexibility. It is a measure of the value stream’s
achieved response to its changing requirements in terms of product volume, delivery and
product mix. The measure of schedule stability is the percentage variation of the actual
monthly schedule for the value-adding process against the planned monthly schedule. These
measures were collected from the 20 value streams by the researchers while on their site
visits to conduct the QS audits.
The output variables included in the model were chosen very carefully. For instance, one
important variable, representing on-time delivery, was used to measure the quality of
customer service dimension. The same applies to the measure of system flexibility. Schedule
stability, the variable used in this study, is considered highly appropriate in this application
since it measures the capability of each value stream system to meet its final monthly
19
production schedule after the required volume, delivery and mix adjustments have been
incorporated into the schedule. As such it is a measure of the value stream’s achieved
response (flexibility) to its changing requirements in terms of product volume, delivery and
product mix.
Arguably it may be considered desirable to construct a diagnostic model containing a wider
set of input and output measures. However, it is a requirement to restrict the numbers of
variables utilised in the DEA model, since too many variables would result in loss of
discrimination among value streams (Thanassoulis et al., 1987). There is a need to strike a
balance between the number of measures deployed and the discriminatory power of the DEA
model. The set of output measures used here meets the requirement of any DEA-based
analysis for robust measures whilst at the same time providing the power to discriminate.
These output measures are in alignment with the overall supply chain strategy of the industry
sector.
5. Diagnostic results and analysis
The original data set contained 25 value streams. Five value streams were discarded for the
purposes of this analysis because they contained missing data, thus 20 value streams
remained in the data set. All of the value streams were located in Europe, with the majority
(12) in England, three in Germany and in Wales respectively, and two in Scotland. All of the
value streams were from the automotive manufacturing sector and resided within the local
supply network supplying automotive components or assemblies to larger original equipment
manufacturers (OEMs). All of the value stream products were automotive
components/assemblies and were primarily from the engine or braking system areas. The

20
major value-adding processes represented by the value streams in the sample were machining
and assembly; machining; automated/final assembly; heat treatment; forging; and distribution
warehousing. Appendix 3 summarises the location, product types and major value-adding
processes of the data set. The DEA results and analysis are presented in the following
sections.
5.1 Overall value stream performance scores
For planning and control purposes, an important starting point when assessing value stream
performance is to determine which value stream or value streams have achieved the best
output results given the input. In our model, we need to identify which value streams have
achieved the best output results (profit maximisation, high level of customer service and
system flexibility) given the different degrees of uncertainty faced by the value streams. In
the analysis that follows, DEA results for value stream six (VS6) are highlighted in order to
illustrate the managerial interpretation.
The DEA programme identifies a group of value streams that performed optimally and
assigns them a score of one. These value streams are then used to create a frontier, or data
envelope, against which the performance of other value streams is assessed and compared.
The value streams that produce less weighted output per weighted input than the best-
performing value streams (the frontier) are considered technically inefficient. They are given
a score of less than one, but greater than zero. The closer the DEA rating is to one, the closer
the value stream is to the efficient frontier. The DEA ratings of overall performance for each
value stream are shown in Table 4.
“take in Table 4”
21
The DEA analysis identified two out of 20 value streams – VS4 and VS17 – that lie on the
efficient frontier. That is to say, they have performed most efficiently given the uncertainty
conditions and were rated as 100 percent efficient relative to the other value streams in the
sample. All other value streams, by comparison to the most efficient, are under performing
given the uncertainty conditions. The DEA ratings of the other value streams ranged from a
low of 0.1414 to a high of 0.7475. Value streams 18 and 19 have the poorest performance. In
addition to the overall rating scores, DEA also provides management with further useful
information that can be used to guide improvement of the performance of the value streams.
Peer reference comparisons are discussed more fully in the next section. As shown in Table
4, value streams four and 17 have been identified (either jointly or solely) as the peer
references for each of the value streams rated as inefficient. In the first instance therefore,
value streams four and 17 could be further studied by management to reveal operating or
management processes and practices that lead to improved performance.
5.2 Peer references for under-performing value streams
With respect to each of the inefficient value streams, DEA identifies its peer references. The
peer references for each of the inefficient value streams are one or more of those that have an
overall DEA performance rating of unity. The DEA calculation allows each value stream to
choose values for the input variable and output variable weights that serve to show it in the
best possible light. These weights render its peers relatively efficient. This makes the peers
useful reference points because they have better performance in precisely the areas that the
value stream chooses to emphasise (i.e. weight heavily) when compared with other value
streams. As a result it is likely that there is a measure of agreement (explicit or implicit)
between a value stream and its efficient peers on the relative values of the outcomes and the
22
relative strength of the environmental influences on these outcomes. Thus, the efficient peers
for each value stream can act as its role models in its effort to improve its performance.
Value stream six was found to have relative efficiency of 0.56 (Table 4). This means that
relative to its efficient peers, the overall output level of VS6 is only 56 percent of its potential
level. The efficient peers for VS6 are both VS4 and VS17. The performance of VS6 can now
be contrasted with that of its efficient peers to see why it has attained a lower relative
efficiency score.
Table 5 shows the original data for VS6 and its peer references VS4 and VS17. In order to
make the comparison between the inefficient value stream and its efficient peers as clear as
possible, the data have been scaled by the factor labelled ‘scale’. Thus, both inefficient VS6
and its efficient peer VS17 have been scaled so that their input levels are the same as the
input level of efficient peer VS4. With the input level for all three value streams adjusted to
the same amount (i.e. 6.0), a relatively simple comparison can now be performed on the
outputs.
“take in Table 5”
Table 5 clearly shows that the efficient peers VS4 and VS17 perform better than VS6 when
the scale data are compared. The data show that with the same input level as VS4 and VS17,
almost all of the outputs of VS6 are significantly lower than those of VS4 and VS17.
Compared with efficient peer VS17, VS6 has achieved significantly lower performance in
both delivery window and schedule stability, although it has a marginally higher value in the
case of profit margin. With reference to efficient peer VS17, given the uncertainty
conditions, the expected performance of VS6 for delivery window is 13.09, however VS6’s
23
actual relative performance is only 7.2. The scaled data in Table 5 show that compared with
its efficient peer VS17, VS6 is only achieving 55 percent of VS17’s performance level in
delivery window and only 4.5 percent of VS17’s performance level in schedule stability even
though they would both be operating under the same level of environmental uncertainty. It is
worth noting that although both VS4 and VS17 are peer references for VS6, it is reasonable
to argue that VS4 is in fact a better role-model to VS6 than is VS17, because the output
levels for VS4 are more challenging for VS6 to reach than those for VS17. Notice also, from
Table 4, that VS4 is a peer reference to more inefficient value streams than VS17. On the
other hand, the management of VS6 may choose to be more conservative in their
improvement drive and hence select VS17 as the immediate role-model. On the basis of this
analysis, we can conclude that as a strategic decision, the management of value stream six
should concentrate on improving schedule stability in order to be as efficient as their efficient
peers because this lag in performance compared with its efficient peers is the largest.
Contrasting low overall rating scores of value streams with their peers in this way can help
reinforce the case that the inefficient value streams need to improve their performance. Yet
an inefficient value stream can, of course, study and adopt operating practices of any other
value stream regardless of whether it is one of its efficient peers. What makes the reference
peers special is that they are efficient with the very value system that would show the
inefficient value stream in the best light, and hence they are likely to offer operating practices
and environmental comparability with those of the inefficient value stream. This is what
makes them particularly suitable as role models, which the under-performing value stream
can seek to emulate to improve its performance.
5.3 Setting targets for improvement
24
Apart from identifying peer references for the managers of inefficient value streams to study
more closely, the DEA assessment also yields the target values of input and outputs that, in
principle, the inefficient value stream ought to be able to achieve. These target values can be
deduced directly from the optimal solution of model M1 (Appendix 1). However, they are
more conveniently explained with reference to the optimal solution to the dual to model M1,
which is designated as model M2 (Appendix 1).
Through the linear programming solution, one can obtain all the targets for each of the value
streams. These are presented in Table 6. The targets indicate the best possible achievement
for a value stream given its uncertainty condition. The data indicate that for at least 14 of the
inefficient value streams there is considerable room for improvement, despite the demands of
their operating environment. All efficient value streams have already attained the optimal
performance for the data set, compared with the inefficient value streams. These efficient
value streams are used as benchmarks to derive the goals for inefficient value streams. For
instance, value stream six has only achieved 56.00 percent, 1.88 percent and 55.99 percent of
its potential performance for delivery window, schedule stability, and profit margin
respectively. In other words, given its current operating level of environmental uncertainty,
this value stream can improve 44 percent, 98 percent and 44 percent in delivery window,
schedule stability and profit margin respectively. Similarly, the management of value stream
10 know that given its current operating level of environmental uncertainty, it should be able
to improve its performance in delivery window, schedule stability and profit margin
respectively by as much as 27 percent, 25 percent and 59 percent respectively. In both cases
therefore, there is significant room for improvement.
25
Targets such as those in Table 6 do not reflect any emphasis on improving a specific output
of a value stream; they merely indicate the maximum pro rata improvement feasible to all
outputs of a value stream. However, it is often desirable to have variable degrees of
improvement across all the outputs of a value stream, in that it may be desirable at a
particular time to improve, for example, profit margin by a larger proportion than say
schedule stability. In such circumstances, more advanced DEA allows weights to be imposed
on a particular output or group of outputs to make more restrictive comparative evaluation.
“take in Table 6”
6. Managerial implications
A key attribute of a robust performance measure system is its ability to provide information
to enhance the organisation’s strategic goal. The traditional performance measurement
techniques offer a useful first step but they are not sufficiently future-oriented or externally
focused. Furthermore, traditional techniques are not sufficiently robust in allowing
management to identify the desired level of improvement. The DEA approach allows
management to link performance with external factors, in this case, uncertainties in supply,
process, demand and control. In doing so, it allows managers to address key questions
important in making strategic as well as key tactical decisions. Questions such as: how does
the performance of our supply chain compare with the performance of best performing
supply chain actors with reference to the environmental uncertainties faced collectively by all
supply chain actors?; and where do we need to improve our performance and by how much
given the environmental uncertainties we face on the supply, processing, demand and control
side? Clear answers to these questions allow managers to better align the supply chain they
26
manage to the demands of the external environment by allocating scarce resources to where it
is needed and instigating improvement projects.
The performance management techniques described in this paper enable managers of a DMU
to compare their performance with the best performing DMUs or a selected reference DMU.
This provides managers with a totally objective account of how well their DMU is
performing relative to other DMUs as well as the most efficient DMUs. By applying this
technique, managers can discriminate between the most efficient and less efficient DMUs
(supply chains). It enables not only comparison of like with like, but allows managers to
pinpoint weaknesses and set appropriate improvement targets. Moreover, managers can
identify suitable role models (DMUs other than those on the efficient frontier) and
systematically improve target levels. The flexibility to select an appropriate role model is of
significant benefit.
Environmental uncertainties have a major impact on the performance of the supply chain and
managerial decisions. The performance management technique discussed in this paper
enables managers to establish how well their DMU is aligned with the uncertainties of the
external environment vis-à-vis the best aligned DMU. The ability to align the organization
with the demands of external environment is an important source of competitiveness.
The diagnostic model presented is applied in a cross-sectional manner and includes a group
of independent DMUs. However, comparison between a group of DMUs belonging to a
single organisation and temporal performance comparison are among key benchmarking
approaches (Ghobadian et al., 2001). Managers can therefore use the same ideas to develop
internal cross-sectional comparison. This is particularly useful in the case of multinational

27
companies operating many different DMUs. Alternatively the model could be used to
identify periods where performance was optimal in the temporal study of a single supply
chain value stream. That is, instead of comparing one value stream to another, the DEA
evaluation can be conducted in a longitudinal manner to determine if a value stream is
becoming more or less efficient over time given its environmental uncertainty conditions.
This would enable the managers of the value stream to identify the periods when the value
stream best demonstrates its capacity to deal with its environmental uncertainty
characteristics. The supplementary managerial analysis could then be used to identify
particular management or manufacturing practices that have underpinned this performance.
The deployment of this DEA-based diagnostic tool to evaluate the overall performances of
value streams for the purpose of performance improvement could equally be applied to other
manufacturing sectors. To this end, the output side of the model can be modified according to
various contextual manufacturing goals and considerations.
Despite the perceived advantages of DEA, a few caveats regarding its use generally and in
this diagnostic reference application need to be made. It should be noted that DEA is only an
evaluation technique. Whilst our application incorporates considerable information about
each value stream’s supply and demand environment, through the specifically selected DEA
input variable uncertainty, it applies no judgement in reaching its evaluation. As such, the
managers of the value streams under investigation should use DEA only as an indicator of
any problems or inefficiencies, and further analysis should be undertaken prior to
implementing DEA recommendations or taking action based on them (Easton et al., 2002). It
may be the case that the targets identified by the diagnostic evaluation are neither desirable
nor achievable in reality (Easton et al., 2002). Additional managerial analysis should be
28
undertaken to delineate the connections between the management and manufacturing
practices of the value streams and the diagnostic results.
7. Conclusions and future research directions
The exploratory study presented in this paper demonstrates the value of DEA in enabling
DMU managers to establish an externally linked and future-oriented performance
measurement system that permits them not only to identify where the performance of their
DMU lags behind that of best performing DMUs, but also allows them to establish realistic
improvement targets. In this application the DMUs were supply chain value streams in the
European automotive industry sector. The model used in this study shows how
environmental uncertainty of the whole system (supply, processing, demand and control) can
be contextualised and incorporated into a diagnostic reference model. This is of significant
importance because it links performance with the external environment and both contingency
and co-alignment theories suggest that environmental alignment is a key source of sustained
competitive advantage.
DEA overcomes some of the key shortcomings of the traditional approaches to measuring
performance within the supply chain, such as ratio analysis and financial measures. The
traditional methods are not externally focused in that they do not seek to link performance
with the operating environment. Furthermore, they predominately take an economic
perspective, focusing on cost and time and ignoring other factors that influence the overall
performance of the value stream such as institutional factors. Therefore, they are unable to
fully reflect the efficiency/effectiveness of the value stream because they fail to completely
reflect the multi-goal/dimensional nature of modern supply chains. They also do not readily
29
lend themselves to construction of a single performance index taking into account continuous
and categorical variables side by side. DEA overcomes these shortcomings and has enabled
the construction of a diagnostic reference model that reflects the multi-goal, input and output
character of modern supply chains.
A key contribution of the study presented in this paper is the development of a comparative
performance evaluation model that measures and incorporates the influence of environmental
uncertainty. Nevertheless, the authors are aware that uncertainty is one dimension of external
environment and, as is pointed out later in this section, future research should consider
inclusion of a more comprehensive dimension of environment. Furthermore, output measures
might bear re-examination particularly if the industry context is different. The three output
variables in our model were chosen to reflect the three essential dimensions of supply chain
strategies identified by Beamon (1999), in the context of the European automobile industry.
Although these output measures are generally useful in most manufacturing industry
contexts, they may be considered to be context specific. In general, when using the CCR
DEA model adopted here, there is a need for the number of decision-making units to be
greater than the product of inputs and outputs in the model. This is a recognised and accepted
limitation of DEA. Without a sufficient number of decision-making units, a large proportion
of DMUs would be included on the efficient frontier and it would be difficult to determine
which value streams in fact are the role models. The data sets used in this application have
met this specification. Based on Dyson et al.’s (2001) guidelines, there would nevertheless be
some scope in our model for extending the set of output measures without the requirement
for extending the number of data points, if this were deemed appropriate to other industry
contexts or in further research.
30
Arguably, the availability of data represents a potential hurdle to the full exploitation of this
diagnostic reference model. Specifically, the focal business units have to make a commitment
to collect the necessary data on a regular basis. However, it should be recognised that this
situation is not specific to comparative performance evaluation using DEA. It equally applies
to other non-mathematical benchmarking and reference model approaches. Repeated
application periodically over time would facilitate continual evaluation and organisational
learning and value stream process improvement.
In this study we relied on a composite measure of environment, that is to say, environmental
uncertainty. We considered and developed a measure of environmental uncertainty for each
element of supply chain and used these to create a system measure of uncertainty. However,
environment has a number of other important dimensions (Misangyi et al., 2006), for
example, munificence (the capacity to support organisations) and velocity (the rate of
change). In future studies it is important to develop and include additional dimensions of the
environment. Recent developments in the field of strategic management suggest that
institutional polycentricity – formal and informal institutional forces – influence performance
(Sirmon et al., 2007). The formal institutional forces refer to regulations at national and local
level, while the informal refer to culture and dominant beliefs. We suggest that future studies
should include institutional dimensions. Finally, we looked at the performance of the whole
system. In future research it would be useful to examine and compare the performance of
constituent elements of supply chain to determine any difference between component and the
whole system.
31
References Akyuz, G.A. and Erkan, T.E., 2010. Supply chain performance measurement: a literature review. International Journal of Production Research, 48 (17), 5137–5155. Anthanassopoulos, A.D., 1995. Performance improvement decision aid systems (PIDAS) in retailing organizations using data envelopment analysis. Journal of Productivity Analysis, 6 (2), 153–170. Al -Faraj, T.N., Alidi, A.S. and Bu-Bshait, K.A., 1993. Evaluation of bank branches by means of data envelopment analysis. International Journal of Operations and Production Management, 13 (9), 45–52. Astley, W.G. and Fombrun, C.J., 1983. Collective strategy: the social ecology of organizational environments. Academy of Management Review, 8 (4), 576–587. Astley, W.G. and Van de Ven, A.H., 1983. Central perspectives and debates in organization theory. Administrative Science Quarterly, 28 (2), 245–273. Azadeh, A., Ghaderi, S.F. and Ebrahimipour, V., 2007. An integrated PCA DEA framework for assessment and ranking of manufacturing systems based on equipment performance. Engineering Computations: International Journal for Computer-Aided Engineering and Software, 24 (40), 347–372. Azadi, M. and Saen, R.F., 2011. Developing a WPF-CCR model for selecting suppliers in the presence of stochastic data. OR Insight, 24 (1), 31–48. Beamon, B., 1999. Measuring supply chain performance. International Journal of Operations and Production Management, 19 (3–4), 275–292. Beasley, J.E., 1995. Determining teaching and research efficiencies. Journal of the Operational Research Society, 46 (4), 441–452. Biehl, M., Cook, W. and Johnston, D.A., 2006. The efficiency of joint decision making in buyer–supplier relationships. Annals of Operational Research, 145 (1), 15–34. Borenstein, D., Luiz Becker, J. and Prado, V.J. do, 2004. Measuring the efficiency of Brazilian post office stores using data envelopment analysis. International Journal of Operations and Production Management, 24 (10), 1055–1078. Bourgeois, L.J., 1984. Strategic management and determinism. Academy of Management Review, 9 (4), 586–597.
32
Bowersox, J.D. and Closs, D.J., 1996. Logistical Management, McGraw-Hill, Singapore. Bowersox, J.D., Closs, D.J. and Stank, T.P., 1999. 21st Century Logistics: Making Supply Chain Integration a Reality, Council of Logistics Management, Oak Brook, IL. Braglia, M. and Petroni, A., 2000. A quality assurance-oriented methodology for handling trade-offs in supplier selection. International Journal of Physical Distribution and Logistics Management, 30 (2), 96–111. Bytheway, A., 1995. Information in the supply chain: measuring supply chain performance. Working Paper SWP 1-95, Cranfield University, School of Management, Cranfield. Carroll, G., 1993. A sociological view of why firms differ. Strategic Management Journal, 14 (4), 237–249. Chandler, A.D., 1962. Strategy and Structure: Chapters in the History of the American Industrial Enterprise, MIT Press, Cambridge, MA. Charnes, A., Cooper, W. and Rhodes, E., 1978. Measuring the efficiency of decision making units. European Journal of Operational Research, 2, 429–444. Charnes, A., Cooper, W.W. and Rhodes, E., 1981. Evaluating program and managerial efficiency: an application of data envelopment analysis to program follow through. Management Science, 27 (6), 668–697. Charnes, A., Cooper, A., Levin, A. and Seiford, L., 1994. Data Envelopment Analysis: Theory, Methodology and Applications, Kluwer Academic Publishers, Norwell, MA. Cherchye, L., Moesen, W., Rogge, N., Van Puyenbroeck, T., Saisana, M., Saltelli, A., Liska, R. and Tarantola, S., 2008. Creating composite indicators with DEA and robustness analysis: the case of the Technology Achievement Index. Journal of the Operational Research Society, 59, 239–251. Chilingerian, J.A., 1994. Exploring why some physicians’ hospital practices are more efficient: taking DEA inside the hospital, In: Charnes, A., Cooper, A., Levin, A. and Seiford, L. (Eds.), Data Envelopment Analysis: Theory, Methodology and Applications, Kluwer Academic Publishers, Norwell, MA, 167–193. Childerhouse, P., 2002. Enabling Seamless Market Orientated Supply Chains, Ph.D. Thesis, Cardiff University.
33
Childerhouse, P., Disney, S.M. and Towill, D.R., 2000. The uncertainty circle as a value stream audit tool. Proceedings of the 11th International Working Seminar on Production Economics, Innsbruck, Austria, 21–25 February, 119–130. Christopher, M., 2011. Logistics and Supply Chain Management, 4th Ed., FT Prentice Hall, London. Davis, T., 1993. Effective supply chain management. Sloan Management Review, 34 (4), 35–46. De Boer, L. and Telgen, J., 1998. Purchasing practice in Dutch municipalities. International Journal of Purchasing and Materials Management, 34 (2), 31–36. Dotoli, M. and Falagario, M., 2012. A hierarchical model for optimal supplier selection in multiple sourcing contexts. International Journal of Production Research, 50 (11), 2953–2967. Dyson, R.G., Allen, R., Camanho, A.S., Podinovski, V.V., Sarrico, C.S. and Shale, E.A., 2001. Pitfalls and protocols in DEA. European Journal of Operational Research, 132, 245–259. Easton, L., Murphy, D.J. and Pearson, J.N., 2002. Purchasing performance evaluation: with data envelopment analysis. European Journal of Purchasing and Supply Management, 8 (3), 123–134. Emery, F.E. and Trist, E.L., 1965. The casual texture of organizational environments. Industrial Relations, 18, 21–32. Farrell, M., 1957. The measurement of productive efficiency. Journal of the Royal Statistical Society, A120, 253–281. Saen, R. F., 2009. Supplier selection by the pair of nondiscretionary factors–imprecise data envelopment analysis models. Journal of the Operational Research Society, 60 (11), 1575–1582. Forsund, F.R. and Hemaes, E., 1994. A comparative analysis of ferry transport in Norway, In: Charnes, A., Cooper, A., Levin, A. and Seiford, L. (Eds.), Data Envelopment Analysis: Theory, Methodology and Applications, Kluwer Academic Publishers, Norwell, MA, 285–311. Ghobadian, A., Woo, H., Gallear, D., Viney, H. and Liu, J., 2001. Benchmarking – Concept and Practice – With Particular Reference to the Finance Function, CIMA Publishing, London.

34
Godsell, J., Diefenbach, T., Clemmow, C., Towill, D. and Christopher, M., 2011. Enabling supply chain segmentation through demand profiling. International Journal of Physical Distribution and Logistics Management, 41 (3), 296–314. Grandori, A., 1984. A prescriptive contingency view of organizational decision making. Administrative Science Quarterly, 29 (2), 192–210. Green, R.H. and Cooks, W.D., 2004. A free coordination hull approach to efficiency measurement. Journal of the Operational Research Society, 55, 1059–1063. Gunasekaran, A., Patel, C. and McGaughey, R.E., 2004. A framework for supply chain performance measurement. International Journal of Production Economics, 87 (3), 333–347. Harland, C., 1996. International comparisons of supply-chain relationships. Logistics Information Management, 9 (4), 35–38. Hambrick, D.C., 1983. Some tests of the effectiveness and functional attributes of Miles and Snow's strategic types. Academy of Management Journal, 26 (1), 5–26. Hewitt, F., 1994. Supply chain redesign. International Journal of Logistics Management, 5 (2), 1–9. Hofer, C., 1975. Toward a contingency theory of business strategy. Academy of Management Journal, 18 (4), 784–810. Jalalvand, F., Teimoury, E., Makui, A., Aryanezhad, M.B. and Jolai, F., 2011. A method to compare supply chains of an industry. Supply Chain Management: An International Journal, 16 (2), 82–97. Jauch, L.R., Osborn, R.N. and Glueck, W.F., 1980. Short term financial success in large business organizations: the environment–strategy connection. Strategic Management Journal, 1 (1), 49–63. Johnson, P., Klassen, R., Leenders, M. and Fearon, H., 2002. Determinants of purchasing team usage in the supply chain. Journal of Operations Management, 20 (1), 77–89. Katz, D. and Kahn, R.L., 1966. The Social Psychology of Organizations, Wiley, New York. Khandwalla, P.N., 1977. The Design of Organizations, Harcourt Brace Jovanovich, New York. Knox Lovell, C., Walters, L.C. and Wood, L.L., 1994. Stratified models of education production using modified DEA and regression analysis, In: Charnes, A., Cooper, A., Levin,

35
A. and Seiford, L. (Eds.), Data Envelopment Analysis: Theory, Methodology and Applications, Kluwer Academic Publishers, Norwell, MA, 329–351. Koutsoukis, N-S., Dominguez-Ballesteros, B., Lucas, C.A. and Mitra, G., 2000. A prototype decision support system for strategic planning under uncertainty. International Journal of Physical Distribution and Logistics Management, 30 (7/8), 640–660. Kuo , R.J., Lee, L.Y. and Hu, T-L., 2010. Developing a supplier selection system through integrating fuzzy AHP and fuzzy DEA: a case study on an auto lighting system company in Taiwan. Production Planning and Control, 21 (5), 468–484. Lawrence, P., 1981. The Harvard Organization and Environment Research Program, In: Van de Ven, A. and Joyce, W. (Eds.), Perspectives of Organization Design and Behaviour, Wiley & Sons, New York, 311–337. Lee, J. and Miller, D., 1996. Strategy, environment and performance in two technological contexts: strategic contingency theory in a Korean setting. Organization Studies, 17 (5), 729–750. Li, D. and O’Brien C., 1999. Integrated decision modeling of supply chain efficiency. International Journal of Production Economics, 59 (1–3), 147–157. Li, D-C. and Dai, W-L., 2009. Determining the optimal collaborative benchmarks in a supply chain. International Journal of Production Research, 47 (16), 4457–4471. Liang, Y-C. and Fang, N., 2011. Supplier productivity and quality performance evaluation in the TFT-LCD industry. Asia-Pacific Journal of Operational Research, 28 (6), 787–802. Liang, L., Li, Z-Q., Cook, W.D. and Zhu, J., 2011. Data envelopment analysis efficiency in two-stage networks with feedback. IIE Transactions, 43 (5), 309–322. Liu, J., Ding, F-Y. and Lall, V., 2000. Using data envelopment analysis to compare suppliers for supplier selection and performance improvement. Supply Chain Management: An International Journal, 5 (3), 143–150. Lockamy, A., Childerhouse, P., Disney, S.M., Towill, D.R. and McCormack, K., 2008. The impact of process maturity and uncertainty on supply chain performance: an empirical study. International Journal of Manufacturing Technology and Management, 15 (1), 12–27. Mahdiloo, M., Noorizadeh, A. and Saen, R.F., 2012. Suppliers ranking by cross-efficiency evaluation in the presence of volume discount offers. International Journal of Services and Operations Management, 11 (3), 237–254.
36
Mason-Jones, R. and Towill, D.R., 1998. Shrinking the supply chain uncertainty circle. IOM Control, 24 (7), 17–22. Melnyk, S.A., Stewart, D.M. and Swink, M., 2004. Metrics and performance measurement in operations management: dealing with the metrics maze. Journal of Operations Management, 22 (3), 209–219. Miles, R.E. and Snow, C.C., 1978. Organizational Strategy, Structure and Process, McGraw-Hill, New York. Min, H. and Joo, S. J., 2006. Benchmarking the operational efficiency of third party logistics providers using data envelopment analysis. Supply Chain Management: An International Journal, 11 (3), 259–265. Mintzberg, H., 1979. Structuring of Organizations, Prentice-Hall, Englewood Cliffs, NJ. Misangyi, V.F., Elms, H., Greckhamer, T. and Lepine, J. A., 2006. A new perspective on a fundamental debate: a multilevel approach to industry, corporate, and business unit effects. Strategic Management Journal, 27 (6), 571–590. Pasiouras, F., 2008. International evidence on the impact of regulations and supervision on banks’ technical efficiency: an application of two-stage data envelopment analysis. Review of Quantitative Finance and Accounting, 30 (2), 187–223. Pina, V. and Torres, L., 1992. Evaluating the efficiency of nonprofit organizations: an application of data envelopment analysis to the public health service. Financial Accountability & Management, 8 (3), 213–224. Ray, S.C. and Kim, H.J., 1995. Cost efficiency in the US steel industry: a nonparametric analysis using data envelopment analysis. European Journal of Operational Research, 8 (3), 654–671. Reiner, G. and Hofmann, P., 2006. Efficiency analysis of supply chain processes. International Journal of Production Research, 44 (23), 5065–5087. Sabri, E.H. and Beamon, B.M., 2000. A multi-objective approach to simultaneous strategic and operational planning in supply chain design. Omega, 28 (5), 581–598. Saranga, H. and Moser, R., 2010. Performance evaluation of purchasing and supply management using value chain DEA approach. European Journal of Operational Research, 207 (1), 197–205. Saunders, M., Lewis, P. and Thornhill, A., 2002. Research Methods for Business Students, 3rd Ed., Financial Times Prentice Hall, Harlow.
37
Seiford, L.M., 1996. Data envelopment analysis: the evolution of the state of the art (1978–1995). Journal of Productivity Analysis, 7, 99–137. Sevkli, M., Koh, S.C.L., Zaim, S., Demirbag, M. and Tatoglu, E., 2007. An application of data envelopment analytic hierarchy process for supplier selection: a case study of BEKO in Turkey. International Journal of Production Research, 45 (9), 1973–2003. Sirmon, D.G., Hitt, M.A. and Ireland, R.D., 2007. Managing firm resources in dynamic environments to create value: looking inside the black box. Academy of Management Review, 32 (1), 273–292. Slack, N., Chambers, S. and Johnston, R., 2004. Operations Management, 4th Ed., FT Prentice Hall, Harlow. Storey, J., Emberson, C., Godsell, J. and Harrison, A., 2006. Supply chain management: theory, practice and future challenges. International Journal of Operations & Production Management, 26 (7), 754–774. Strandholm, K., Kumar, K. and Subramanian, R., 2004. Examining the interrelationships among perceived environmental change, strategic response, managerial characteristics, and organizational performance. Journal of Business Research, 57 (1), 58–69. Talluri, S. and Baker, R. C., 2002. A multi-phase mathematics programming approach for effective supply chain design. European Journal of Operational Research, 141 (3), 544–558. Thanassoulis, E., Dyson, R. and Foster, M., 1987. Relative efficiency assessments using data envelopment analysis: an application to data on rates departments. Journal of the Operational Research Society, 38 (5), 397–411. Thompson, J.D., 1967. Organizations in Action, McGraw-Hill, New York. Towill, D., Childerhouse, P. and Disney, S., 1999. Speeding up the progress towards effective supply chain management. Occasional Paper No. 57, Department of Maritime Studies and International Transport, Cardiff University. Towill, D., Childerhouse, P. and Disney, S., 2002. Integrating the automotive supply chain: where are we now? International Journal of Physical Distribution & Logistics Management, 32 (2), 79–95. Van der Vorst, J.G.A.J. and Beulens, A.J.M., 2002. Identifying sources of uncertainty to generate supply chain redesign strategies. International Journal of Physical Distribution & Logistics Management, 32 (6), 409–430.

38
Vaz, C.B., Camanho, A.S. and Guimarães, R.C., 2010. The assessment of retailing efficiency using Network Data Envelopment Analysis. Annals of Operations Research, 173 (1), 5–24. Weber, C., 1996. A data envelopment analysis approach to measuring vendor performance. Supply Chain Management, 1 (1), 28–39. Wilding, R., 1998. The supply chain complexity triangle: uncertainty generation in the supply chain. International Journal of Physical Distribution & Logistics Management, 28 (8), 519–676. Wu, D. and Olson, D. L., 2010. Enterprise risk management: a DEA VaR approach in vendor selection. International Journal of Production Research, 48 (16), 4919–4932. Yang, F., Wu, D., Liang, L., Bi, G. and Wu, D.D., 2011. Supply chain DEA: production possibility set and performance evaluation model. Annals of Operations Research, 185 (1), 195–211. Yasai-Ardekani, M. and Nystrom, P.C., 1996. Designs for environmental scanning systems. Management Science, 42 (2), 187–204. Xu, J., Li, B. and Wu, D., 2009. Rough data envelopment analysis and its application to supply chain performance evaluation. International Journal of Production Economics, 122 (2), 628–638.

39
Appendix 1. The DEA model (a) Rating the overall supply chain performance Model M1 set up to assess the performance of observation j0.
Min Z = UusUSj0 subject to
Vpm PMj0 + VdwDWj0 + VssSSj0 = 100 VpmPMj0 + VdwDWj0 +VSSSSj0 – UusUSj0 0 (M1) Vpm, Vdw, Vss , Uus 0.0001
where US = uncertainty score PM = profit margin DW = delivery window SS = schedule stability N.B. In the formulation, the subscript j identifies each of the observed supply chains (j = 1… .j0 ...20). Vpm, Vdw, Vss, Uus are weights attaching to PM, DW, SS and US respectively, and they are the variables in this model. The notation j0 denotes a focal supply chain. Each supply chain becomes a focal one, in turn, when its efficiency score is computed. The relative performance of supply chain j0 is Ej0 = 100/Z*, Z* being the optimal value of Z in model M1. (For the derivation of the full DEA model see Charnes et al. (1994).) Ej0 is the proportion supply chain j0 achieves of the maximum output levels it could have achieved if it operated efficiently. Supply chain j0 is relatively efficient if Ej0 = 1. (b) Peer references for under-performing supply chains Efficient peers for supply chain j0 are readily identified by the fact that if the jth supply chain is an efficient peer to supply chain j0 then at the optimal solution to model M1 the constraint
VpmPM j0 + VdwDW j0 +VssSSj0 – UusUS j0 0 J =1 .....j0….20 is binding.
(c) Setting targets for improvement
Max Z = + 0.001 (SUS + SDW + SPM + SSS) subject to
US SUS USjj
j j
21
0
PM SPM PMjj
j j
21
0
40
DW SDW DWj jj
j21
0 (M2)
SS SSS SSj jj
j21
0
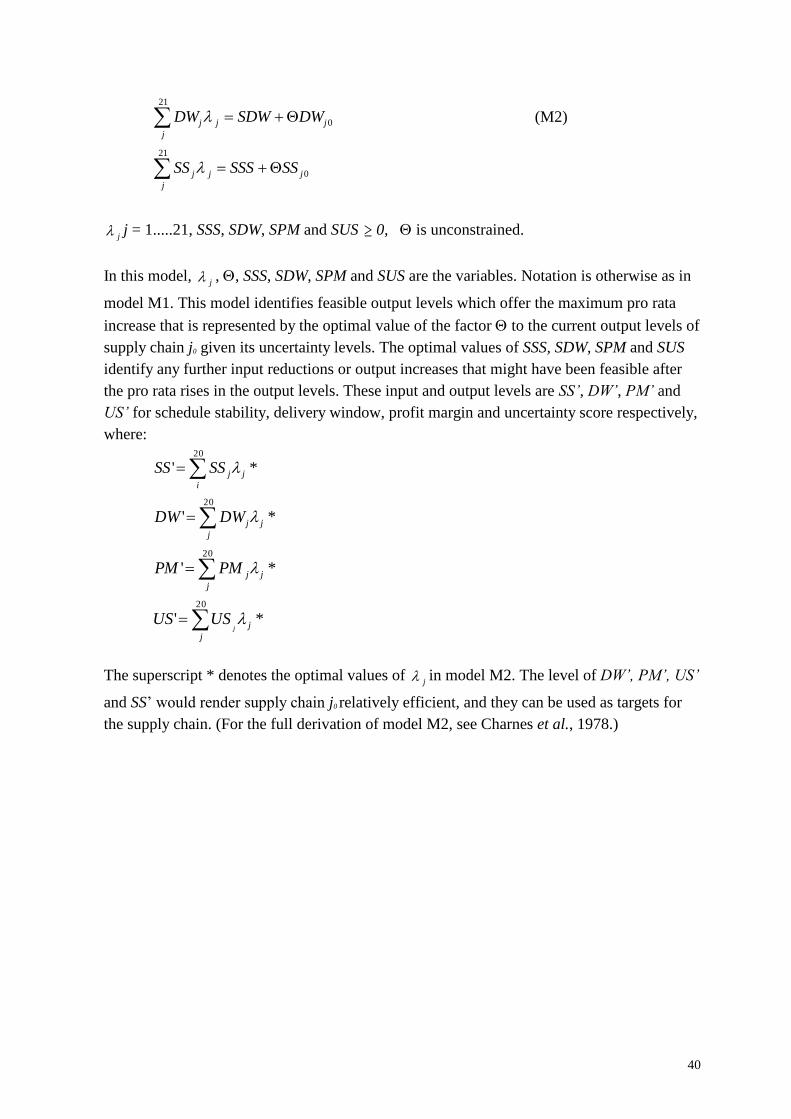
j j = 1.....21, SSS, SDW, SPM and SUS 0, is unconstrained.
In this model, j , , SSS, SDW, SPM and SUS are the variables. Notation is otherwise as in
model M1. This model identifies feasible output levels which offer the maximum pro rata
increase that is represented by the optimal value of the factor to the current output levels of supply chain j0 given its uncertainty levels. The optimal values of SSS, SDW, SPM and SUS identify any further input reductions or output increases that might have been feasible after the pro rata rises in the output levels. These input and output levels are SS’, DW’, PM’ and US’ for schedule stability, delivery window, profit margin and uncertainty score respectively, where:
*'20
ji
jSSSS
*'20
jj
jDWDW
*'20j
jjPMPM
*'20
jj
jUSUS
The superscript * denotes the optimal values of j in model M2. The level of DW’, PM’, US’
and SS’ would render supply chain j0 relatively efficient, and they can be used as targets for the supply chain. (For the full derivation of model M2, see Charnes et al., 1978.)

41
Appendix 2. Primary data used for assessing uncertainty during Quick Scan (QS) investigations Uncertainty score Typical primary data used during Quick Scan investigation
Supply side MOPs placed on suppliers especially schedule adherence, invoices, call-offs, BOM, forecasts, receipts, supplier quality reports, MRP, lead times, stock reports
Demand side Delivery frequency, echelons to end consumer, marketplace variability, stage of product life cycle, customer ordering procedures, forecast accuracy
Process side Scrap reports, cycle times and variability of cycle times, production targets and output, downtime reports, stock consolidations, costed BOM, capacity planning, asset register
Control side Time series of customer orders, supplier orders, demand forecasts, kanban logic, batching rules, MRP logic, call-offs, purchase orders, BGOM number of variants, delivery frequency, number of completing PDPs
Sources: Childerhouse et al. (2000); Towill et al. (2002) Appendix 3. Overview of the value stream sample
Location Product Description Value stream ID
Major value-adding process(es)
England Diesel engine component 1 Machining and assembly
England Petrol engine component 2 Automated assembly
England Automotive sensor 3 Automated assembly
England Automotive engine system component 4 Machining and assembly
England Diesel engine 5 Final assembly
England Diesel engine component 6 Machining
England Automotive component 7 Heat treatment
England Automotive component 8 Heat treatment
Scotland Automotive component 9 Machining
Scotland Automotive component 10 Machining
England Automotive engine component 11 Machining and assembly
England Automotive engine component 12 Machining and assembly
Germany Petrol engine component 13 Forging
Germany Diesel engine component 14 Forging
England Petrol engine component 15 Machining and assembly
England Diesel engine component 16 Machining and assembly
Germany Automotive braking component 17 Machining
Wales Automotive braking component 18 Distribution warehousing
Wales Automotive braking component 19 Machining and assembly
Wales Automotive braking component 20 Machining and assembly
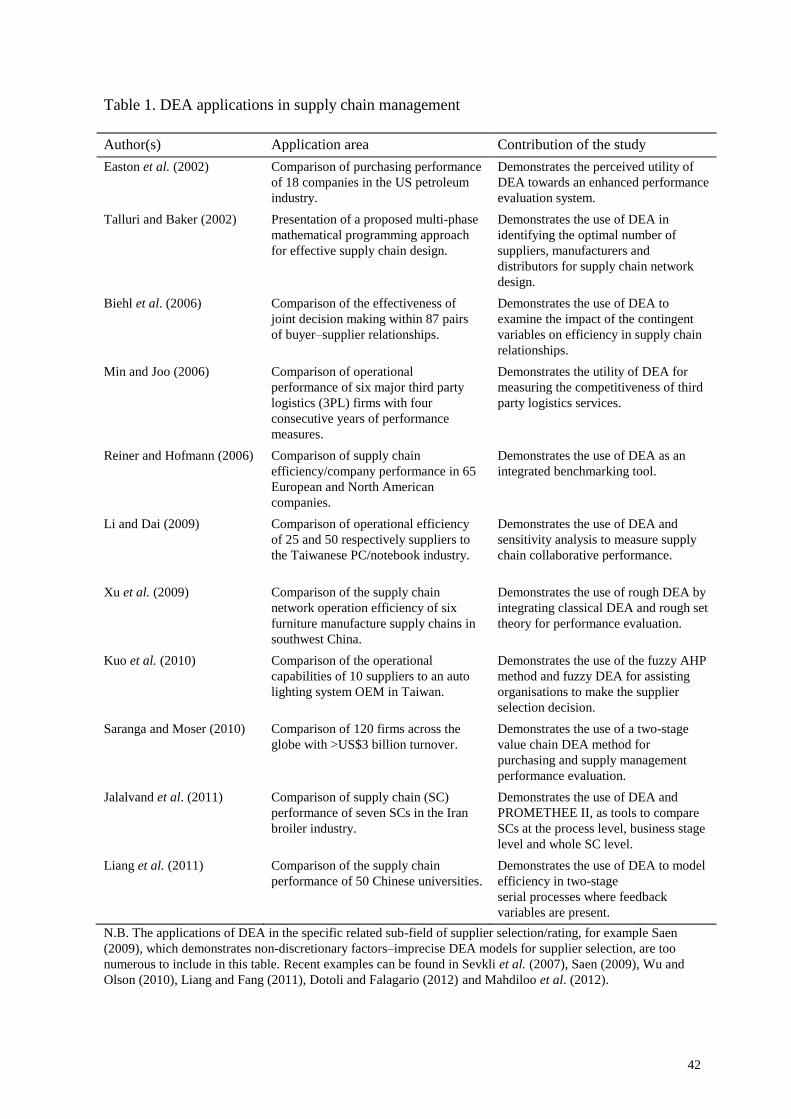
42
Table 1. DEA applications in supply chain management
Author(s) Application area Contribution of the study
Easton et al. (2002) Comparison of purchasing performance of 18 companies in the US petroleum industry.
Demonstrates the perceived utility of DEA towards an enhanced performance evaluation system.
Talluri and Baker (2002) Presentation of a proposed multi-phase mathematical programming approach for effective supply chain design.
Demonstrates the use of DEA in identifying the optimal number of suppliers, manufacturers and distributors for supply chain network design.
Biehl et al. (2006) Comparison of the effectiveness of joint decision making within 87 pairs of buyer–supplier relationships.
Demonstrates the use of DEA to examine the impact of the contingent variables on efficiency in supply chain relationships.
Min and Joo (2006) Comparison of operational performance of six major third party logistics (3PL) firms with four consecutive years of performance measures.
Demonstrates the utility of DEA for measuring the competitiveness of third party logistics services.
Reiner and Hofmann (2006) Comparison of supply chain efficiency/company performance in 65 European and North American companies.
Demonstrates the use of DEA as an integrated benchmarking tool.
Li and Dai (2009) Comparison of operational efficiency of 25 and 50 respectively suppliers to the Taiwanese PC/notebook industry.
Demonstrates the use of DEA and sensitivity analysis to measure supply chain collaborative performance.
Xu et al. (2009) Comparison of the supply chain network operation efficiency of six furniture manufacture supply chains in southwest China.
Demonstrates the use of rough DEA by integrating classical DEA and rough set theory for performance evaluation.
Kuo et al. (2010) Comparison of the operational capabilities of 10 suppliers to an auto lighting system OEM in Taiwan.
Demonstrates the use of the fuzzy AHP method and fuzzy DEA for assisting organisations to make the supplier selection decision.
Saranga and Moser (2010) Comparison of 120 firms across the globe with >US$3 billion turnover.
Demonstrates the use of a two-stage value chain DEA method for purchasing and supply management performance evaluation.
Jalalvand et al. (2011) Comparison of supply chain (SC) performance of seven SCs in the Iran broiler industry.
Demonstrates the use of DEA and PROMETHEE II, as tools to compare SCs at the process level, business stage level and whole SC level.
Liang et al. (2011) Comparison of the supply chain performance of 50 Chinese universities.
Demonstrates the use of DEA to model efficiency in two-stage serial processes where feedback variables are present.
N.B. The applications of DEA in the specific related sub-field of supplier selection/rating, for example Saen (2009), which demonstrates non-discretionary factors–imprecise DEA models for supplier selection, are too numerous to include in this table. Recent examples can be found in Sevkli et al. (2007), Saen (2009), Wu and Olson (2010), Liang and Fang (2011), Dotoli and Falagario (2012) and Mahdiloo et al. (2012).
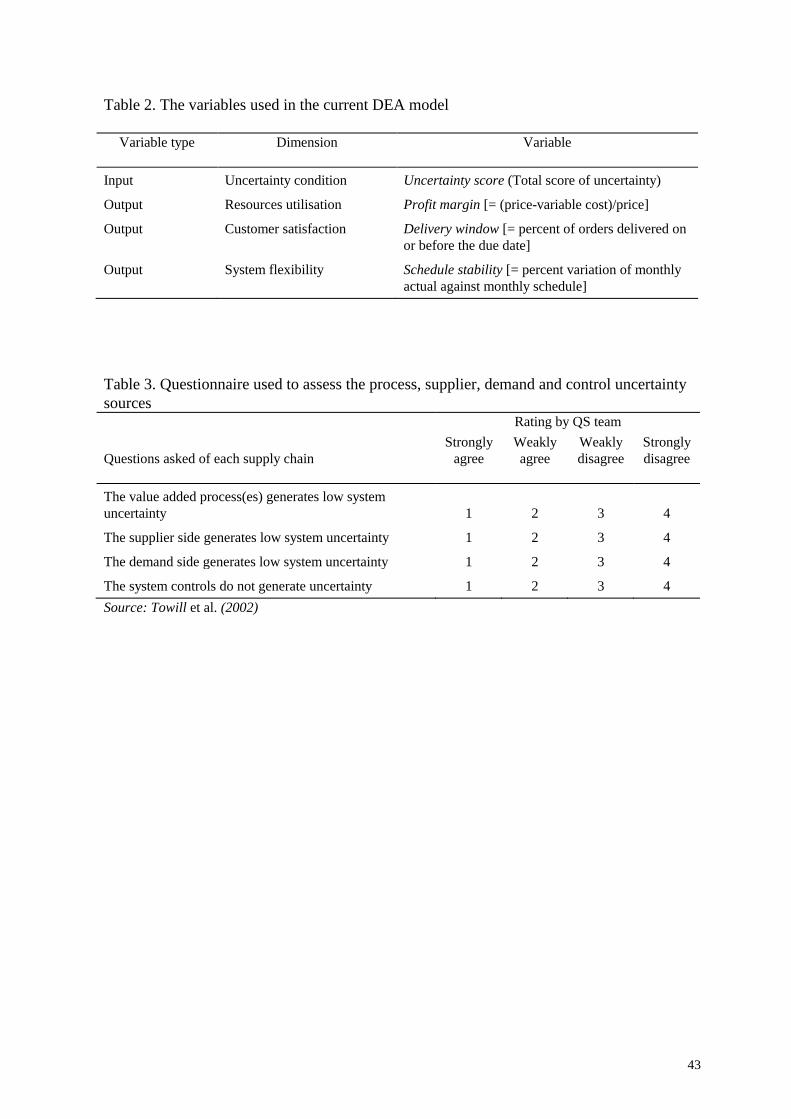
43
Table 2. The variables used in the current DEA model
Variable type
Dimension Variable
Input Uncertainty condition Uncertainty score (Total score of uncertainty)
Output Resources utilisation Profit margin [= (price-variable cost)/price]
Output Customer satisfaction
Delivery window [= percent of orders delivered on or before the due date]
Output System flexibility Schedule stability [= percent variation of monthly actual against monthly schedule]
Table 3. Questionnaire used to assess the process, supplier, demand and control uncertainty sources Rating by QS team
Questions asked of each supply chain
Strongly agree
Weakly agree
Weakly disagree
Strongly disagree
The value added process(es) generates low system uncertainty
1
2
3
4
The supplier side generates low system uncertainty 1 2 3 4
The demand side generates low system uncertainty 1 2 3 4
The system controls do not generate uncertainty 1 2 3 4
Source: Towill et al. (2002)
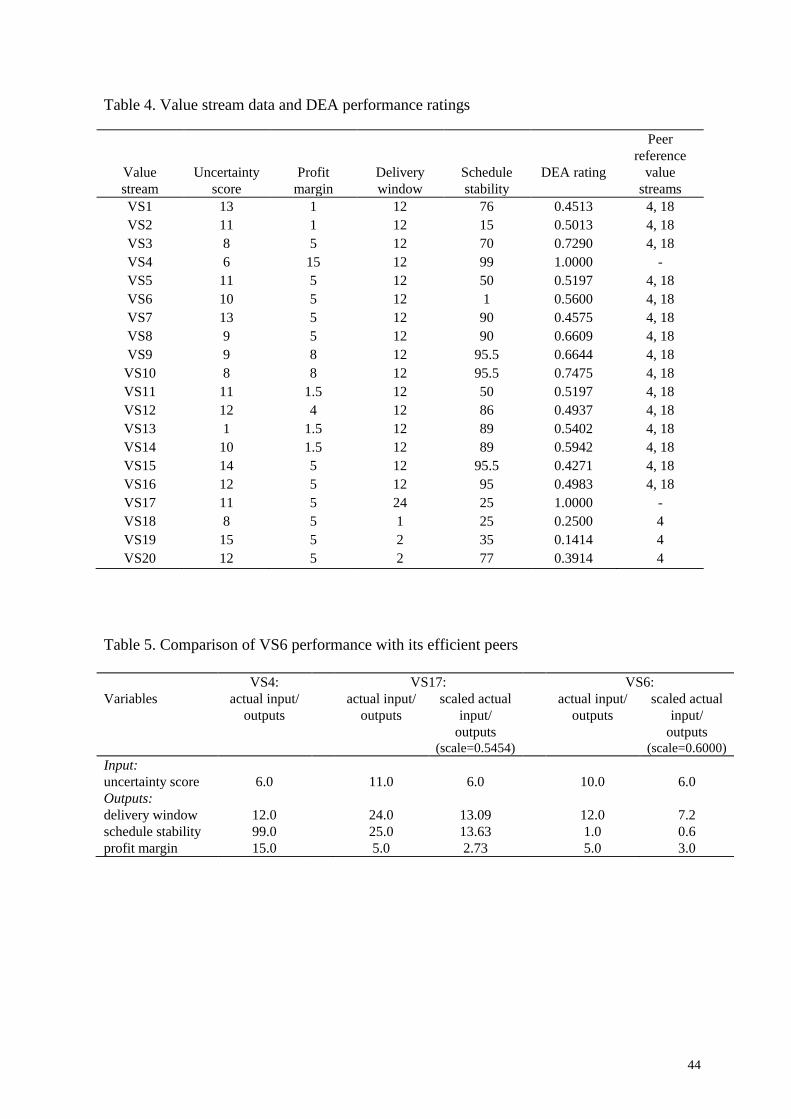
44
Table 4. Value stream data and DEA performance ratings
Value stream
Uncertainty score
Profit margin
Delivery window
Schedule stability
DEA rating
Peer reference
value streams
VS1 13 1 12 76 0.4513 4, 18 VS2 11 1 12 15 0.5013 4, 18 VS3 8 5 12 70 0.7290 4, 18 VS4 6 15 12 99 1.0000 - VS5 11 5 12 50 0.5197 4, 18 VS6 10 5 12 1 0.5600 4, 18 VS7 13 5 12 90 0.4575 4, 18 VS8 9 5 12 90 0.6609 4, 18 VS9 9 8 12 95.5 0.6644 4, 18 VS10 8 8 12 95.5 0.7475 4, 18 VS11 11 1.5 12 50 0.5197 4, 18 VS12 12 4 12 86 0.4937 4, 18 VS13 1 1.5 12 89 0.5402 4, 18 VS14 10 1.5 12 89 0.5942 4, 18 VS15 14 5 12 95.5 0.4271 4, 18 VS16 12 5 12 95 0.4983 4, 18 VS17 11 5 24 25 1.0000 - VS18 8 5 1 25 0.2500 4 VS19 15 5 2 35 0.1414 4 VS20 12 5 2 77 0.3914 4
Table 5. Comparison of VS6 performance with its efficient peers VS4: VS17: VS6: Variables actual input/
outputs actual input/
outputs scaled actual
input/ outputs
(scale=0.5454)
actual input/ outputs
scaled actual input/
outputs (scale=0.6000)
Input: uncertainty score
6.0
11.0
6.0
10.0
6.0
Outputs: delivery window schedule stability profit margin
12.0 99.0 15.0
24.0 25.0 5.0
13.09 13.63 2.73
12.0 1.0 5.0
7.2 0.6 3.0
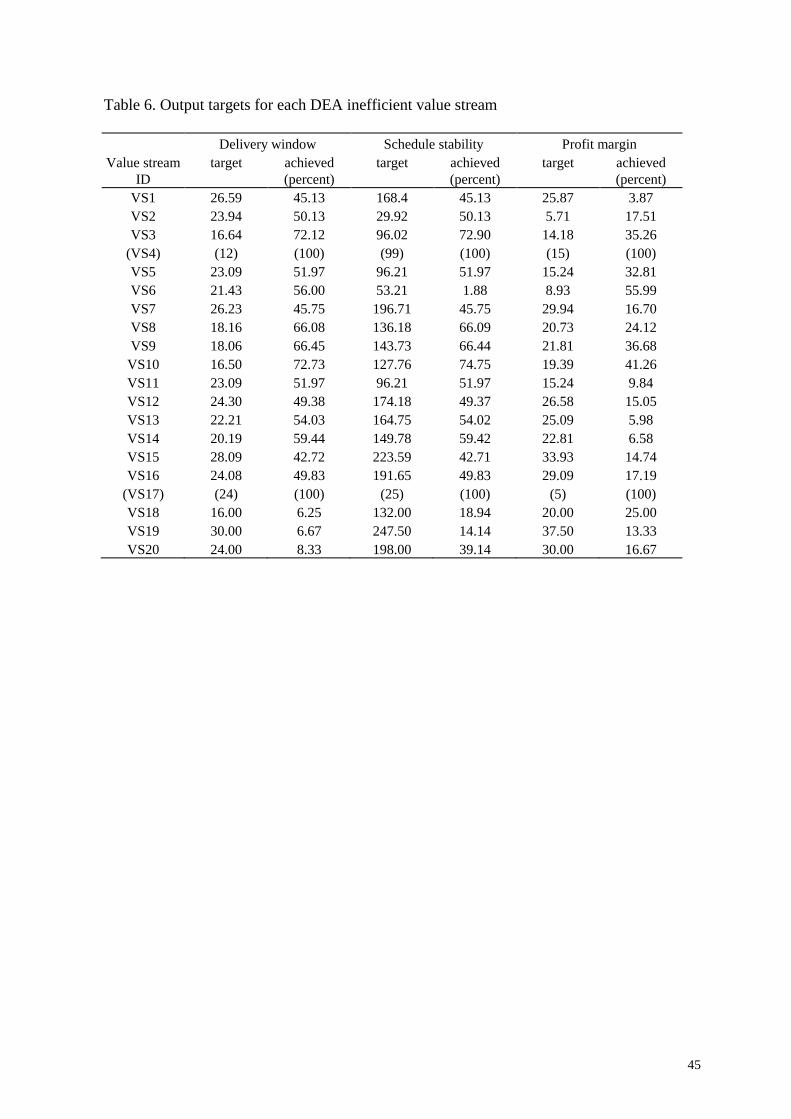
45
Table 6. Output targets for each DEA inefficient value stream
Delivery window Schedule stability Profit margin Value stream
ID target achieved
(percent) target achieved
(percent) target achieved
(percent) VS1 26.59 45.13 168.4 45.13 25.87 3.87 VS2 23.94 50.13 29.92 50.13 5.71 17.51 VS3 16.64 72.12 96.02 72.90 14.18 35.26
(VS4) (12) (100) (99) (100) (15) (100) VS5 23.09 51.97 96.21 51.97 15.24 32.81 VS6 21.43 56.00 53.21 1.88 8.93 55.99 VS7 26.23 45.75 196.71 45.75 29.94 16.70 VS8 18.16 66.08 136.18 66.09 20.73 24.12 VS9 18.06 66.45 143.73 66.44 21.81 36.68 VS10 16.50 72.73 127.76 74.75 19.39 41.26 VS11 23.09 51.97 96.21 51.97 15.24 9.84 VS12 24.30 49.38 174.18 49.37 26.58 15.05 VS13 22.21 54.03 164.75 54.02 25.09 5.98 VS14 20.19 59.44 149.78 59.42 22.81 6.58 VS15 28.09 42.72 223.59 42.71 33.93 14.74 VS16 24.08 49.83 191.65 49.83 29.09 17.19
(VS17) (24) (100) (25) (100) (5) (100) VS18 16.00 6.25 132.00 18.94 20.00 25.00 VS19 30.00 6.67 247.50 14.14 37.50 13.33 VS20 24.00 8.33 198.00 39.14 30.00 16.67