an enhanced developmental staging table for the …fjanzen/pdf/14jmorphol.pdfan enhanced...
TRANSCRIPT

An Enhanced Developmental Staging Table for thePainted Turtle, Chrysemys picta (Testudines: Emydidae)
Gerardo A. Cordero* and Fredric J. Janzen
Department of Ecology, Evolution, and Organismal Biology, Iowa State University, 251 Bessey Hall, Ames, Iowa50011
ABSTRACT Normal developmental staging tablesoften undergo expansion and enhancement in responseto advancing research paradigms and technologies. ThePainted Turtle, Chrysemys picta, has long been a pre-ferred reference taxon for comparative embryology andrecently became the first turtle species to feature asequenced genome. However, modern descriptive stud-ies on embryogenesis are lacking and an earlier devel-opmental staging table has been ignored. To addressthese problems, we re-evaluated descriptions of devel-opmental stages by studying embryos under standar-dized laboratory conditions. We created an enhancednormal developmental staging table that clarifies andvalidates previous descriptions of developmental proc-esses in this species. Moreover, we emphasized descrip-tion of turtle-specific developmental characters such asthe carapacial ridge. We demonstrated that embryogrowth rate, length of incubation period, and timing todevelopmental stages are predictable under controlledenvironmental conditions. The appearance of charac-ters associated with eye, limb, and shell anatomy wascongruent with observations made in other turtle spe-cies. To reduce experimental bias, we recommend theuse of our enhanced staging table when describingembryogenesis in the Painted Turtle. J. Morphol.275:442–455, 2014. VC 2013 Wiley Periodicals, Inc.
KEY WORDS: carapacial ridge; Chrysemys picta;embryogenesis; normal developmental staging table;shell development
INTRODUCTION
One of the first steps in biological researchrequires the observation and accurate descriptionof pattern or process. Developmental biologistsand morphologists have thus created andenhanced normal developmental staging tablesthat describe embryogenesis in a handful of repre-sentative vertebrate animals. Moreover, the crea-tion and revision of staging tables has beenmotivated by changes in technology, researchparadigms, and preference of study species (Hop-wood 2007, 2011).
Non-avian sauropsids represent a substantialportion of the amniote tree of life and are increas-ingly popular research subjects in developmentalbiology (Vickaryous and McLean, 2011; Nomuraet al., 2013). Historically, these taxa have beenoverlooked because their physiology and life his-
tory renders their embryos difficult to manipulateexperimentally (New, 1966; Billet et al., 1985).Even the application of modern developmentalassays continues to be challenging in taxa such asturtles (Gilbert, 2009). Consequently, research onthe developmental origins of morphological novel-ties, such as the turtle’s shell, has been hinderedby lack of knowledge of underlying gene regula-tory networks (Wagner and Lynch, 2010). Thesequenced genome of the Painted Turtle (Emydi-dae: Chrysemys picta; Shaffer et al., 2013) is likelyto facilitate reconstruction of gene regulatory net-works associated with shell development. Even so,modern descriptive studies on most aspects ofembryonic development are lacking for this repre-sentative model taxon. Furthermore, many impor-tant questions concerning the evolution anddevelopmental underpinnings of temporal bonearrangement of the skull (Werneburg, 2012) andsex-determining mechanisms of turtles (Janzenand Krenz, 2004; Janzen and Phillips, 2006)remain unanswered.
A lack of standardized laboratory conditions anddescriptions of embryos became problematic forcomparing and replicating studies of developmen-tal processes in the Painted Turtle (discussed inSmith, 1914; Cagle, 1954; Ewert, 1985). Earlyattempts to standardize protocols for the study ofembryos included descriptive criteria for fivestages of pectoral girdle development (Walker,1947). These stages cannot be identified reliablybecause detailed descriptions of whole embryoswere not provided and a small sample size wasused. The normal developmental staging table of
Contract grant sponsor: National Science Foundation grant; Con-tract grant number: DEB-0640932.
*Correspondence to: Gerardo Antonio Cordero; Department ofEcology, Evolution, and Organismal Biology, Iowa State, University,251 Bessey Hall, Ames, IA 50011. E-mail:[email protected]
Received 30 August 2013; Revised 8 October 2013;Accepted 13 October 2013.
Published online 3 December 2013 inWiley Online Library (wileyonlinelibrary.com).DOI 10.1002/jmor.20226
VC 2013 WILEY PERIODICALS, INC.
JOURNAL OF MORPHOLOGY 275:442–455 (2014)
Mahmoud et al. (1973) was created to addresssuch issues, but has been underutilized becauseillustrations were not highly detailed and a fluctu-ating incubation temperature (21–23�C) was used.As a result, investigators have traditionally refer-enced the staging table for the phylogeneticallydisparate Snapping Turtle (Chelydridae: Chelydraserpentina; Yntema, 1968) when describingembryogenesis in the Painted Turtle (discussed inEwert, 1985, 2008).
Analyses of developmental data generated underthe guidance of staging tables that were not mod-eled after the species of interest could be a poten-tial source of bias in comparative studies(Werneburg, 2009). For example, temporal varia-tion in developmental stages is considered a sourceof technical error in gene expression studies (Gal-lego-Romero et al., 2012). Lack of information ondevelopmental stages could also bias studies ofecological and physiological embryology in reptil-ian sauropsids (Andrews, 2004). Also, because sau-ropsid embryos are highly sensitive to theenvironment, egg incubation conditions must beaccounted for if staging criteria are to be comparedacross species (Miller, 1985). Given the imminentincrease in research centered on the Painted Tur-tle as a representative model for the study ofdevelopmental processes among amniotes (Valen-zuela, 2009), improving developmental staging cri-teria is timely and highly relevant.
The objective of this study was to enhance thedevelopmental staging table for the Painted Tur-tle. Specifically, we: (1) clarified and validated pre-vious descriptions of normal developmental stages;and (2) quantified embryonic growth rate, lengthof incubation period, and timing to respectivedevelopmental stages under highly controlled andreplicable laboratory conditions.
MATERIALS AND METHODS
During the nesting seasons of 2010–2013, 316 eggs of theWestern Painted Turtle, Chrysemys picta bellii (Gray, 1831)were collected at the Thomson Causeway Recreation Area inThomson, IL (lat. 41� 570 N; described in Schwanz et al., 2010)within the same day of oviposition. In addition, 35 eggs werecollected at the Avocet and De Fair Lake Wildlife ManagementAreas (Hyannis, NE) for scanning electron microscopy (SEM;described below). Sampling was undertaken following institu-tionally approved guidelines (protocol # 12-03-5570-J). Eggsbegan incubation under seminatural conditions (1–3 days)before transport to Iowa State University where they wereplaced in environmental chambers at a constant 27�C. Eggswere half-buried in moist (2150 kPa water potential) vermicu-lite. Weekly, the vermiculite was rehydrated and containerswere rotated to control for potential thermal gradient effects.Oxygen levels in the chambers were typically at 20–21%.
Embryos (N 5 234) were dissected from eggs and extraem-bryonic membranes using distilled water and phosphate-buffered saline before preservation. Embryos in the first weekof development were stained (in vivo) with neutral red agar tofacilitate dissection. Embryos were then fixed in 10% bufferedformalin at a mean sampling interval of 1.14 d through day 40of incubation. Some embryos of representative stages (15–21)
were also fixed in Bouin’s solution to facilitate imaging of theeye and skin. Most embryos were fixed overnight at room tem-perature and then removed for washing and dehydration usingan increasing ethanol series. Embryos from representativestages were chosen for imaging on compound (Nikon Eclipse55i) and dissecting (Nikon SMZ 745T) microscopes withmounted digital camera (Nikon DS-Vi1). Some embryos wereimaged while partially embedded in plates of 1.5% agarose inTris/Borate/EDTA. Images were edited and formatted usingprograms Preview 5.5 (Apple, Inc.), Paintbrush 2.1 (Soggy Waf-fles), and ImageJ 1.44 (NIH). Fixed embryos were staged bydirect examination on the microscope followed by review of pho-tomicrographs. Some unfixed embryos were also examined. TheMahmoud et al. (1973) staging table (MHK table hereafter) wasused to stage embryos. These descriptive criteria were re-evaluated and enhanced following generally accepted guidelinesfor the staging of reptilian embryos (Miller, 1985).
Eggs showing early signs of pipping were sampled to esti-mate total length of the embryonic incubation period. Egg pip-ping is a generally accepted index for the end of embryogenesis(Gutzke et al., 1984). Museum (ISU research collection) speci-mens of hatchling turtles were studied to describe the develop-mental stage immediately after the end of embryogenesis. Dialdigital calipers were used to record crown-rump length (CRL)and carapace length (CL) to assess the relationship betweenembryo size and developmental time (i.e., growth rate) usingregression analysis for comparison to the MHK table. Allembryo measurements were taken after fixation and dehydra-tion and choice of fixative did not appear to have an effect onsize. Statistical analyses were conducted in JMP 10.
Embryos (stages 13, 15–16) assigned to SEM imaging weresubmerged in half-strength Karnovsky’s fixative (Karnovsky,1965) and left to soak overnight at 4�C. Embryos were thendehydrated in an ethanol series and submitted to the IowaState University Bessey Microscopy and Nanoimaging Facilityfor the implementation of standard SEM methodology. Briefly,embryos were subjected to critical-point drying and sputtercoating procedures in preparation for imaging in a SEM.Images were edited and formatted as described earlier.
RESULTSRevisiting the MHK Table
Descriptions of the MHK embryonic develop-mental stages (3–22) for the Painted Turtle werevalidated and enhanced. The “hatching” stage (23)was also described. Descriptions were clarified andnew diagnostic features were provided for somestages. Embryos progressed rapidly through stages1–2; thus, observations were limited during thattime. Images of lateral or ventral aspects of wholeor parts of embryos are presented for stages 3–23(Figs. 1–9). Early formation of the apical ectoder-mal ridge (AER) of the limb bud is shown in Fig.4. Images of the carapacial ridge (CR), the turtle-specific structure involved in shell development(reviewed in Nagashima et al., 2013), are pre-sented at stages 15–16 (Fig. 6).
Stage 1 (described in MHK). The blastoporeis apparent on the dorsoposterior surface of theembryo. The chordamesodermal canal connects theblastopore to the ventral surface of the embryo.Mesoderm has begun to condense on the anteriorand posterior periphery of the embryonic disc.
Stage 2 (described in MHK). The blastoporeis U-shaped. The chordamesodermal canal
443PAINTED TURTLE DEVELOPMENTAL STAGES
Journal of Morphology

expands (anteriorly) on the ventral surface of theembryo.
Stage 3 (Fig. 1a). Somites are not visible. Theneural and head folds begin to form. The noto-chord is apparent (ventrally) and the head processbegins to flex.
Stage 4 (Fig. 1b). Three paired somites arepresent. Formation of the neural folds extendsalong the entire dorsal length of the embryo.
Stage 5 (Fig. 1c). Five paired somites arepresent. The neural folds begin to fuse anteriorly.The anterior intestinal portal has formed.
Stage 6 (Fig. 2a–b). Seven paired somites arepresent. The prosencephalon is apparent and for-mation of the optic vesicle begins. The anteriorintestinal portal is near the presumptive pericar-dial region. The neural folds have fused alongmost of the anteroposterior axis.
Stage 7 (Fig. 2c–d). Nine paired somites arepresent. The mandibular arch is apparent. Theauditory pit appears. The mesencephalon is distin-guishable. The pericardial protuberance is presentand blood islands are visible on the area vaculosa.The anterior intestinal portal has shifted caudally.
Stage 8 (Fig. 2e–f). Fourteen paired somitesare present. The stomodeum has formed and thepericardial protuberance features an S-shapedheart anlage. The lateral body folds have formedalong the entire anteroposterior axis of theembryo. The embryo is slightly oriented to the leftand has flexed dorsally. A slight tail process ispresent.
Stage 9 (Fig. 3a–b). Twenty paired somitesare present. The neuropores have closed. The firstpharyngeal slit has opened and the second andthird pharyngeal arches are visible. The maxillaand olfactory pit begin to form. The primordialheart has begun to pump blood. The optic fissureappears and formation of the lens vesicle has
begun. The embryo has now shifted its orientationto the left side (anteriorly). Early limb budsappear as condensations on the Wolffian ridge.
Stage 10 (Fig. 3c–d). Twenty five pairedsomites are present. All four pharyngeal slits arevisible and the first, second, and third ones areopen. The posterior intestinal portal has formedand the tail process is longer and curved. Limbbuds have begun to grow along the anteroposterioraxes.
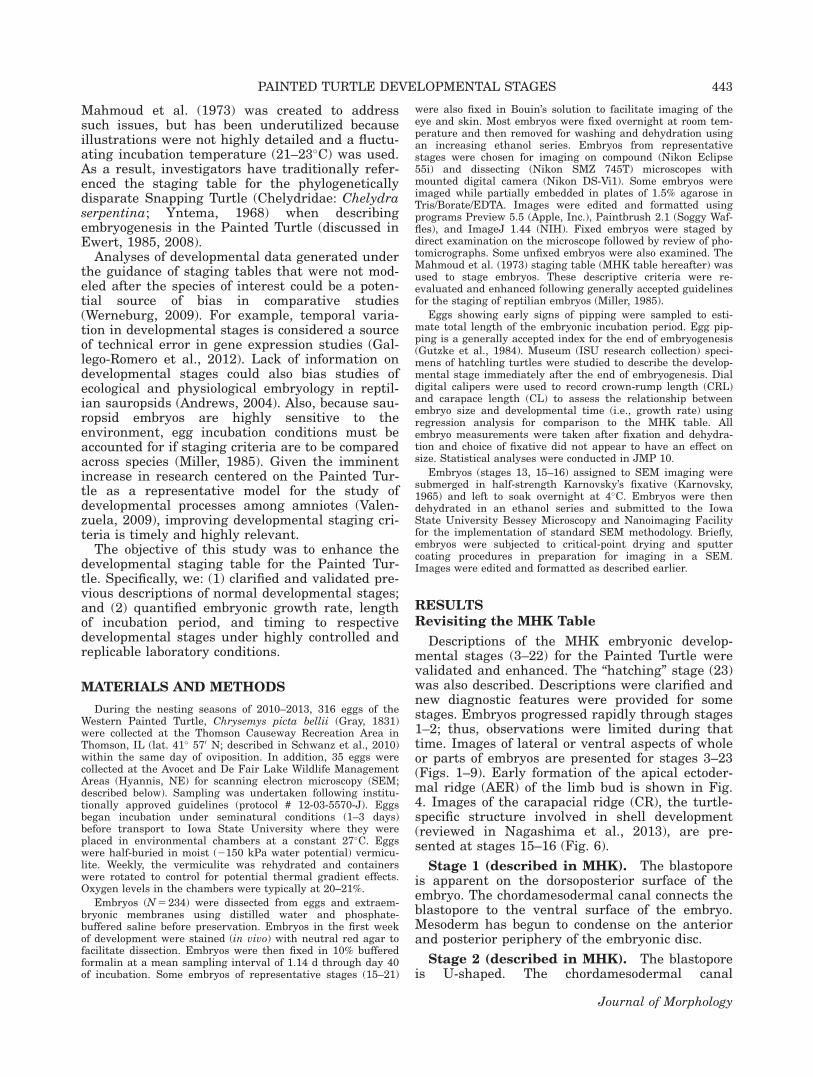
Stage 11 (Figs. 3e–f, 4). Thirty paired somitesare present. All four pharyngeal slits are nowopen and the fourth pharyngeal arch is visible.Pigmentation of the retina has begun. The tailprocess is narrower distally. The allantois hasbegun to form. The limb buds are wider (antero-posteriorly) than they are long (proximodistally).The AER appears on the periphery of the limbbuds.
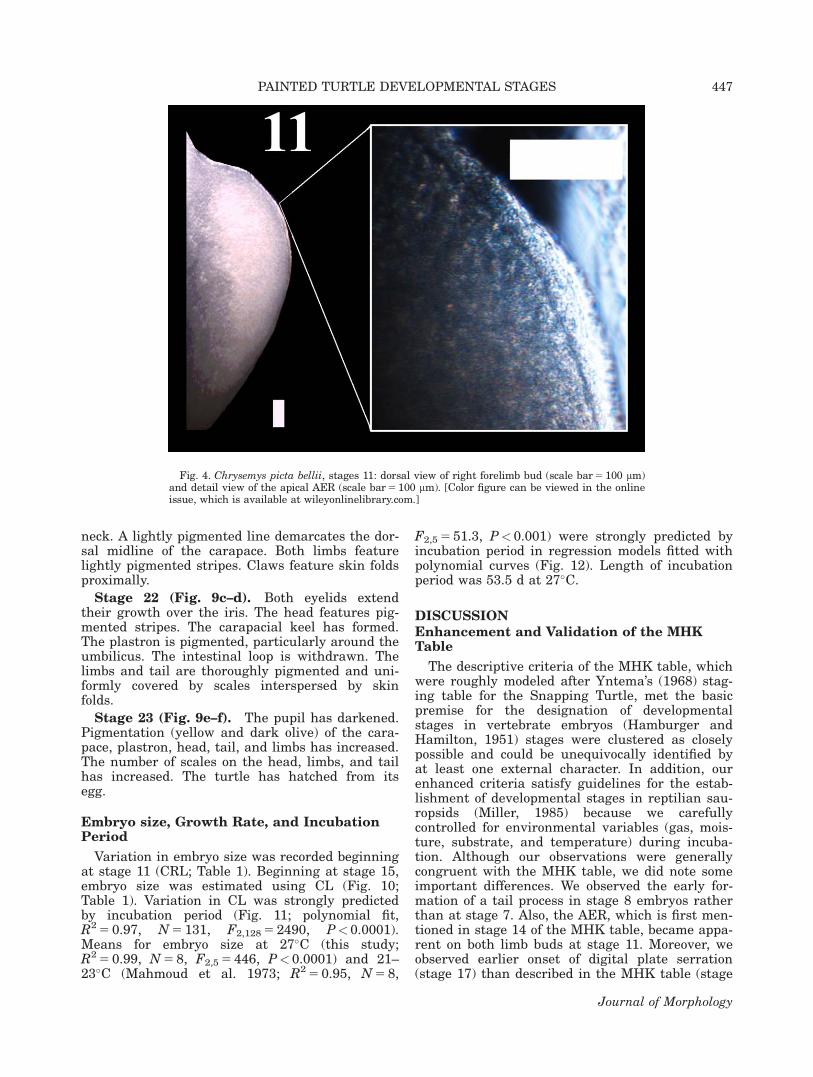
Stage 12 (Fig. 5a–c). Somites are difficult tocount. The fourth pharyngeal slit has closed andthe fifth has become visible. The nasolacrimalgroove and cervical sinus have formed. The uro-genital papilla appears. The limb buds are longerthan wide.
Stage 13 (Figs. 5d–f, 6a–b). External out-growth of the pharyngeal arches is highly reduced.The mandible is posterior to the eye. The retina ispigmented uniformly. The anterior intestinal por-tal has shifted to a central position on the embry-onic trunk. The limb buds assume aventroposterior orientation and are “paddle” likein form.
Stage 14 (Fig. 5g–i). The pharyngeal archesand nasolacrimal groove have disappeared. Theiris features light pigmentation. Early outgrowthof the CR is visible along the posterior flank of theembryo. The intestines have herniated into anexternal loop. The limbs feature a vaguely defined
Fig. 1. Chrysemys picta bellii, stages 3–5: embryos in ventral view (a–c; scale bars 5 1 mm).[Color figure can be viewed in the online issue, which is available at wileyonlinelibrary.com.]
444 G. A. CORDERO AND F. J. JANZEN
Journal of Morphology

digital plate. The forelimb is slightly longer thanthe hindlimb.
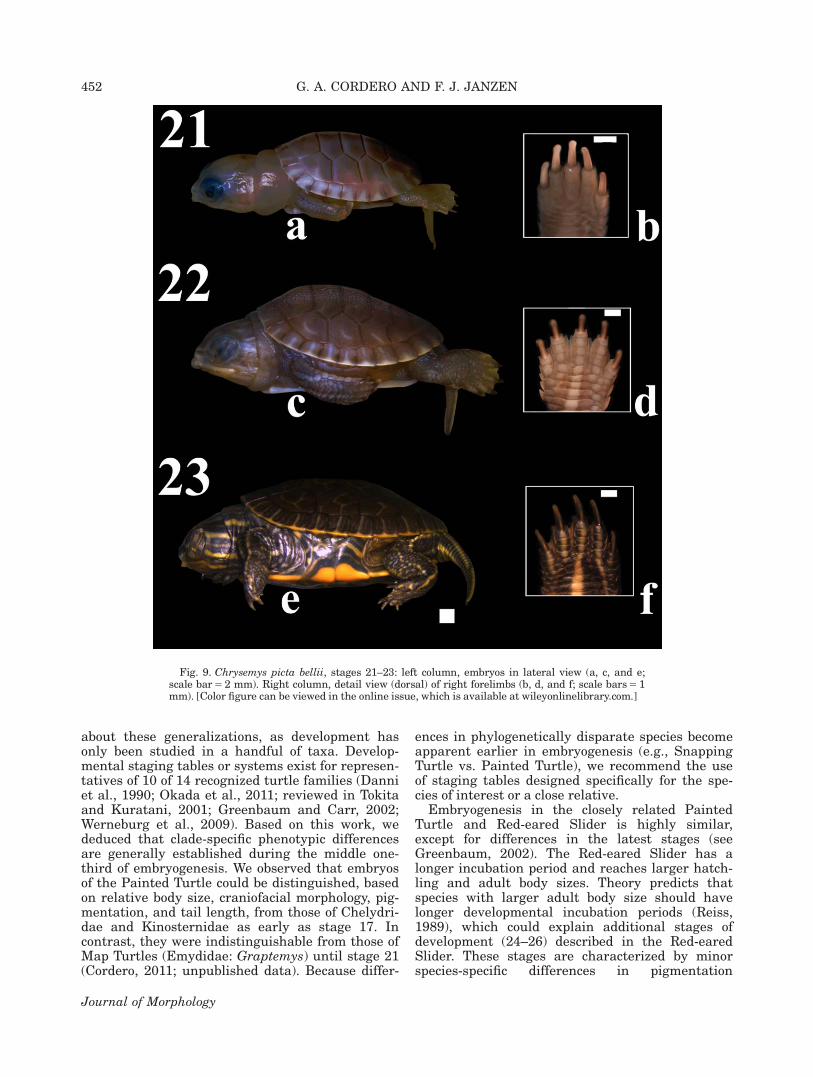
Stage 15 (Figs. 6c–d, 7a–b). The cervicalsinus has closed. The maxilla has fused with thefrontonasal process and the external nares haveformed. The iris is entirely pigmented and theoptic fissure is no longer visible. The CR hasextended along the entire flank of the embryo andcarapacial ectoderm has begun to differentiate.The forelimb features an elbow.
Stage 16 (Figs. 6e–f, 7c–d). The caruncle hasbegun to form on the frontonasal process. The
mandible is positioned at the axial level of the pos-terior margin of the eye. Scleral papillae havebegun to form on the lower half of the retina. Con-centric growth of the CR is complete and the pri-mordial carapace now extends beyond the anteriorand posterior limb buds. The plastron has begunto form peripherally and anterior to the pericar-dial protuberance. The digital rays are visible.
Stage 17 (Fig. 7e–f). The mandible is posi-tioned at the axial level of the lens. The ectoder-mal plates (scutes) of the carapace are delineatedand the plastron extends over and across a much
Fig. 2. Chrysemys picta bellii, stages 6–8: left column, embryos in ventral view (a, c, and e; scalebars 5 1 mm). Right column, detail view of head and pharyngeal regions (b, d, and f; scale bars5 100lm). [Color figure can be viewed in the online issue, which is available at wileyonlinelibrary.com.]
445PAINTED TURTLE DEVELOPMENTAL STAGES
Journal of Morphology

reduced pericardial protuberance. The AER isreduced and serration of the digital plate hasbegun. Sparse pigmentation is visible at the baseof the limbs.
Stage 18 (Fig. 8a–b). The mandible is posi-tioned beyond the axial level of the anterior mar-gin of the lens. Scleral papillae cover the entireretina and the lower eyelid is present. The plas-tron has completed its growth along the entireanteroposterior axis of the embryo. The carapacialscutes are clearly differentiated. Interdigital webshave begun to differentiate on the digital plate.
Stage 19 (Fig. 8c–d). The anterior margin ofthe mandible is positioned between the eye andfrontonasal process. The lower eyelid has begun togrow over the sclera and the upper eyelid is pres-
ent. Pigmentation of the carapacial scutes hasbegun. The digits extend beyond the interveningwebbing. Pigmentation of the limbs has increased.
Stage 20 (Fig. 8e–f). The rhampothecae aredifferentiated. Scleral papillae are no longer visi-ble. Cutaneous papillae have begun to grow on theneck. Plastral scutes are delineated and marginalcarapacial scutes feature a pigmented line. Thelimbs feature ectodermal scales and presumptiveclaws are lightly pigmented. The cloaca is fullydifferentiated.
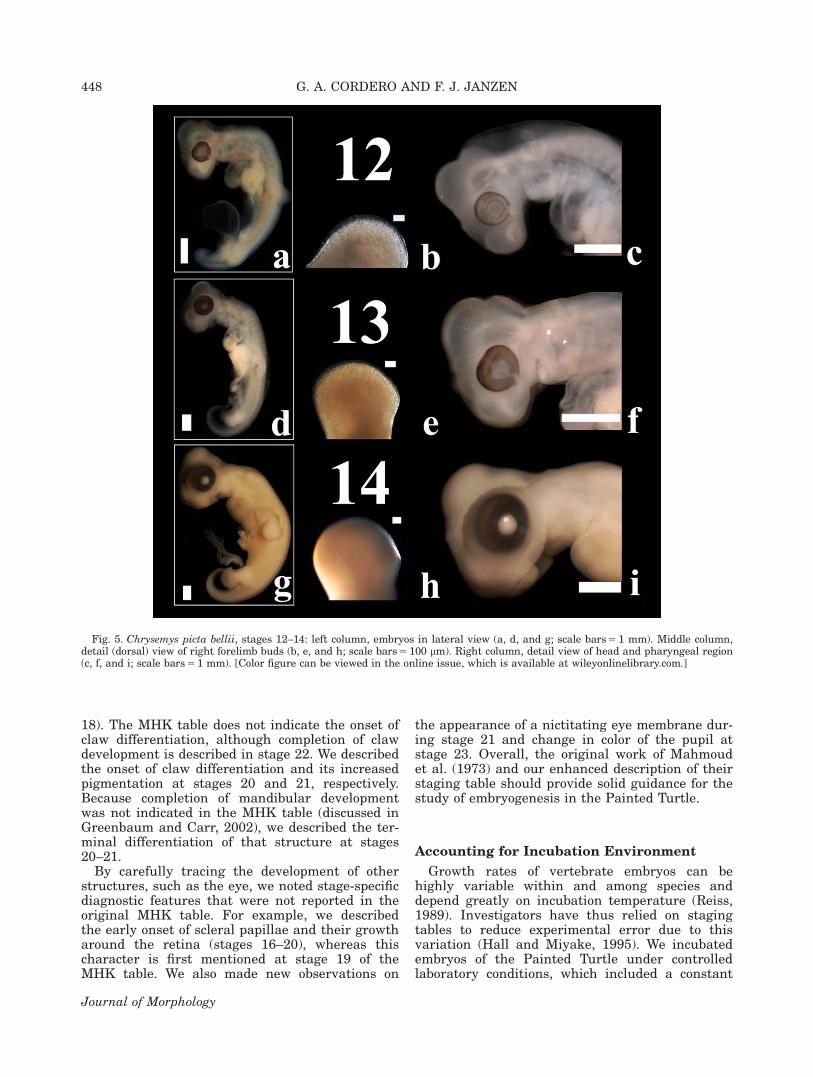
Stage 21 (Fig. 9a–b). The mandible is at itsocclusion point with the maxilla. The upper eyelidhas begun to grow over the sclera and the nictitat-ing membrane has formed. Cervical constriction isreduced and a skin fold has formed on the dorsal
Fig. 3. Chrysemys picta bellii, stages 9–11: left column, embryos in lateral view (a, c, and e; scalebars 5 1 mm). Right column, detail view of head and pharyngeal regions (b, d, and f; scale bars5 1mm). [Color figure can be viewed in the online issue, which is available at wileyonlinelibrary.com.]
446 G. A. CORDERO AND F. J. JANZEN
Journal of Morphology
neck. A lightly pigmented line demarcates the dor-sal midline of the carapace. Both limbs featurelightly pigmented stripes. Claws feature skin foldsproximally.
Stage 22 (Fig. 9c–d). Both eyelids extendtheir growth over the iris. The head features pig-mented stripes. The carapacial keel has formed.The plastron is pigmented, particularly around theumbilicus. The intestinal loop is withdrawn. Thelimbs and tail are thoroughly pigmented and uni-formly covered by scales interspersed by skinfolds.
Stage 23 (Fig. 9e–f). The pupil has darkened.Pigmentation (yellow and dark olive) of the cara-pace, plastron, head, tail, and limbs has increased.The number of scales on the head, limbs, and tailhas increased. The turtle has hatched from itsegg.
Embryo size, Growth Rate, and IncubationPeriod
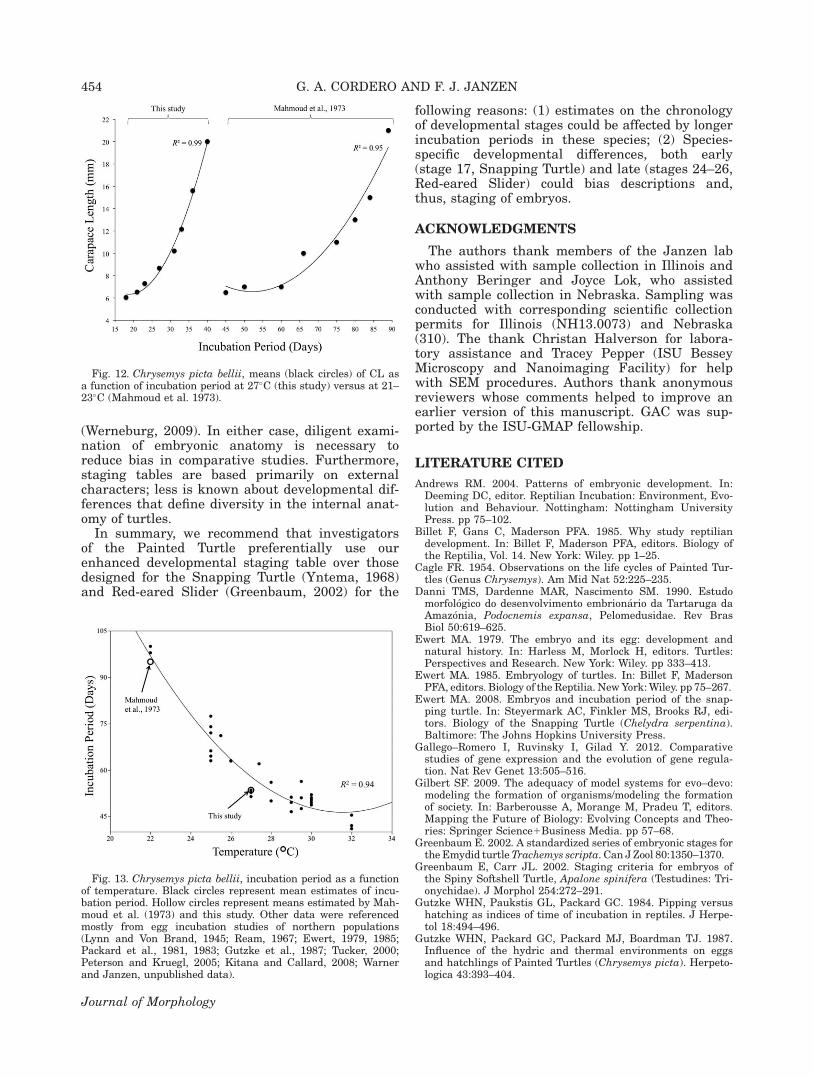
Variation in embryo size was recorded beginningat stage 11 (CRL; Table 1). Beginning at stage 15,embryo size was estimated using CL (Fig. 10;Table 1). Variation in CL was strongly predictedby incubation period (Fig. 11; polynomial fit,R2 5 0.97, N 5 131, F2,128 5 2490, P<0.0001).Means for embryo size at 27�C (this study;R2 5 0.99, N 5 8, F2,5 5 446, P< 0.0001) and 21–23�C (Mahmoud et al. 1973; R2 5 0.95, N 5 8,
F2,5 5 51.3, P<0.001) were strongly predicted byincubation period in regression models fitted withpolynomial curves (Fig. 12). Length of incubationperiod was 53.5 d at 27�C.
DISCUSSIONEnhancement and Validation of the MHKTable
The descriptive criteria of the MHK table, whichwere roughly modeled after Yntema’s (1968) stag-ing table for the Snapping Turtle, met the basicpremise for the designation of developmentalstages in vertebrate embryos (Hamburger andHamilton, 1951) stages were clustered as closelypossible and could be unequivocally identified byat least one external character. In addition, ourenhanced criteria satisfy guidelines for the estab-lishment of developmental stages in reptilian sau-ropsids (Miller, 1985) because we carefullycontrolled for environmental variables (gas, mois-ture, substrate, and temperature) during incuba-tion. Although our observations were generallycongruent with the MHK table, we did note someimportant differences. We observed the early for-mation of a tail process in stage 8 embryos ratherthan at stage 7. Also, the AER, which is first men-tioned in stage 14 of the MHK table, became appa-rent on both limb buds at stage 11. Moreover, weobserved earlier onset of digital plate serration(stage 17) than described in the MHK table (stage
Fig. 4. Chrysemys picta bellii, stages 11: dorsal view of right forelimb bud (scale bar 5 100 lm)and detail view of the apical AER (scale bar 5 100 lm). [Color figure can be viewed in the onlineissue, which is available at wileyonlinelibrary.com.]
447PAINTED TURTLE DEVELOPMENTAL STAGES
Journal of Morphology
18). The MHK table does not indicate the onset ofclaw differentiation, although completion of clawdevelopment is described in stage 22. We describedthe onset of claw differentiation and its increasedpigmentation at stages 20 and 21, respectively.Because completion of mandibular developmentwas not indicated in the MHK table (discussed inGreenbaum and Carr, 2002), we described the ter-minal differentiation of that structure at stages20–21.
By carefully tracing the development of otherstructures, such as the eye, we noted stage-specificdiagnostic features that were not reported in theoriginal MHK table. For example, we describedthe early onset of scleral papillae and their growtharound the retina (stages 16–20), whereas thischaracter is first mentioned at stage 19 of theMHK table. We also made new observations on
the appearance of a nictitating eye membrane dur-ing stage 21 and change in color of the pupil atstage 23. Overall, the original work of Mahmoudet al. (1973) and our enhanced description of theirstaging table should provide solid guidance for thestudy of embryogenesis in the Painted Turtle.
Accounting for Incubation Environment
Growth rates of vertebrate embryos can behighly variable within and among species anddepend greatly on incubation temperature (Reiss,1989). Investigators have thus relied on stagingtables to reduce experimental error due to thisvariation (Hall and Miyake, 1995). We incubatedembryos of the Painted Turtle under controlledlaboratory conditions, which included a constant
Fig. 5. Chrysemys picta bellii, stages 12–14: left column, embryos in lateral view (a, d, and g; scale bars 5 1 mm). Middle column,detail (dorsal) view of right forelimb buds (b, e, and h; scale bars 5 100 lm). Right column, detail view of head and pharyngeal region(c, f, and i; scale bars 5 1 mm). [Color figure can be viewed in the online issue, which is available at wileyonlinelibrary.com.]
448 G. A. CORDERO AND F. J. JANZEN
Journal of Morphology

temperature (27�C) within the range of those usedby most investigators (Fig. 13) and typical of nesttemperatures in our Illinois population (Weisrockand Janzen, 1999). Temperature strongly influen-ces embryonic growth rate and duration of incuba-tion period in this ectothermic sauropsid (Janzenand Morjan, 2002). Substrate moisture and oxygenavailability can also affect growth rate and incuba-tion period (reviewed in Packard and Packard,1988). The methodology used to establish stages ofthe MHK table did not carefully control for thesevariables, as in many classical works on reptilianembryology (Miller, 1985). Such neglect of theincubation environment has likely confoundedattempts to compare developmental chronology in
turtles (e.g., Renous et al., 1989; Tokita and Kura-tani, 2001).
We found that incubation period, and thusduration and timing to developmental stages,might be replicable when controlling for hydricand thermal environment. Our estimate of incu-bation period was the same (53.5 d) as that of astudy that sampled eggs from a similar latitude(42� 520 N) under similar laboratory conditions(53.5 d at constant 27�C and 2150 kPa; Gutzkeet al., 1987). Developmental variation might notbe explained solely by environment, as weobserved embryo size variation within stages.Even so, we more effectively characterized embry-onic growth rate and with larger sample sizes
Fig. 6. Chrysemys picta bellii, scanning electron micrographs of stages 13, 15–16: left column, detail views of the posterolateral(left side) region of embryos where the CR forms (a, c, and e; scale bar 5 1 mm). Right column, dorsal view of right forelimb buds fea-turing the apical AER (b, d, and f; scale bar 5 1 mm). Arrows (bottom, middle column) indicate planes of orientation (A 5 anterior,P 5 posterior, D 5 dorsal, V 5 ventral).
449PAINTED TURTLE DEVELOPMENTAL STAGES
Journal of Morphology

than Mahmoud et al. (1973). Future studiesshould carefully address incubation environmentor adjust experimental designs accordingly. Also,we recommend increased awareness of embryo-genesis in the Painted Turtle and other reptiliansauropsids, as it could inform current knowledgeon phenotypes that are strongly affected by theincubation environment (e.g., temperature-dependent sex determination; discussed inAndrews, 2004).
Comparisons to Other Turtle Species
Our observations of embryogenesis in the PaintedTurtle not only enhance its developmental staging
table, but also disprove assumptions made in previ-ous comparative analyses. For example, followingdescriptions from the MHK table, Tokita and Kura-tani (2001) speculated that embryogenesis in thePainted Turtle was “unique,” presumably due todelayed development of the carapace, eye, limb, andplastron. Although those authors had only observedembryogenesis in the Chinese Softshell Turtle (Trio-nychidae: Pelodiscus sinensis), they claimed thatdevelopment in the Painted Turtle differed in com-parison to that species, the Snapping Turtle, andmarine turtles. We clarified that the timing of dif-ferentiation for the carapace, eye, limb, and plas-tron is not delayed in the Painted Turtle.
Fig. 7. Chrysemys picta bellii, stages 15–17: left column, embryos in lateral view (a, c, and e;scale bars 5 1 mm). Right column, detail view (dorsal) of right forelimbs (b, d, and f; scale bars5 100lm). [Color figure can be viewed in the online issue, which is available at wileyonlinelibrary.com.]
450 G. A. CORDERO AND F. J. JANZEN
Journal of Morphology

We confirmed that formation of the AER pre-cedes digital plate differentiation, as demonstratedin most turtle species. This structure was alreadyapparent in embryos of the Painted Turtle at thesame developmental stage (12) as in the ChineseSoftshell Turtle (Tokita and Kuratani, 2001) andSnapping Turtle (Yntema, 1968). Similarly, theappearance and maturation of the CR did not dif-fer in the Painted Turtle. Our direct examinationof embryos of the Snapping Turtle and Spiny Soft-shell Turtle (Apalone spinifera), a close relative ofthe Chinese Softshell Turtle, supports that pattern(Cordero, 2012; unpublished data). We observedsome aspects of eye, limb, and shell differentiation
earlier than in the MHK table, which was consistentwith staging tables for the closely related emydidRed-eared Slider (Trachemys scripta, Greenbaum,2002), as well as the Chinese Pond Turtle (Chinemysreevesii, Tan et al., 2001) and the Japanese PondTurtle (Mauremys japonica, Okada et al., 2011) ofthe sister family Geoemydidae. We demonstratedthat important developmental processes are notdelayed in the Painted Turtle relative to other stud-ied turtles.
Overall, timing of differentiation of the basic tur-tle body plan and externally positioned sensoryorgans appear to be highly conserved across deeplydivergent turtle lineages. However, we are cautious
Fig. 8. Chrysemys picta bellii, stages 18–20: left column, embryos in lateral view (a, c, and e;scale bar 5 1 mm). Right column, detail view (dorsal) of right forelimbs (b, d, and f; scale bars 5 1mm). [Color figure can be viewed in the online issue, which is available at wileyonlinelibrary.com.]
451PAINTED TURTLE DEVELOPMENTAL STAGES
Journal of Morphology
about these generalizations, as development hasonly been studied in a handful of taxa. Develop-mental staging tables or systems exist for represen-tatives of 10 of 14 recognized turtle families (Danniet al., 1990; Okada et al., 2011; reviewed in Tokitaand Kuratani, 2001; Greenbaum and Carr, 2002;Werneburg et al., 2009). Based on this work, wededuced that clade-specific phenotypic differencesare generally established during the middle one-third of embryogenesis. We observed that embryosof the Painted Turtle could be distinguished, basedon relative body size, craniofacial morphology, pig-mentation, and tail length, from those of Chelydri-dae and Kinosternidae as early as stage 17. Incontrast, they were indistinguishable from those ofMap Turtles (Emydidae: Graptemys) until stage 21(Cordero, 2011; unpublished data). Because differ-
ences in phylogenetically disparate species becomeapparent earlier in embryogenesis (e.g., SnappingTurtle vs. Painted Turtle), we recommend the useof staging tables designed specifically for the spe-cies of interest or a close relative.
Embryogenesis in the closely related PaintedTurtle and Red-eared Slider is highly similar,except for differences in the latest stages (seeGreenbaum, 2002). The Red-eared Slider has alonger incubation period and reaches larger hatch-ling and adult body sizes. Theory predicts thatspecies with larger adult body size should havelonger developmental incubation periods (Reiss,1989), which could explain additional stages ofdevelopment (24–26) described in the Red-earedSlider. These stages are characterized by minorspecies-specific differences in pigmentation
Fig. 9. Chrysemys picta bellii, stages 21–23: left column, embryos in lateral view (a, c, and e;scale bar 5 2 mm). Right column, detail view (dorsal) of right forelimbs (b, d, and f; scale bars 5 1mm). [Color figure can be viewed in the online issue, which is available at wileyonlinelibrary.com.]
452 G. A. CORDERO AND F. J. JANZEN
Journal of Morphology

patterns and ectodermal morphology. For example,a translucent sheath on the ventral claw of theRed-eared Slider was described, although we didnot observe it in embryos of the Painted Turtle.This character was also observed in the late devel-opmental stages (24–26) of the Japanese PondTurtle (Okada et al., 2011) and Snapping Turtle(Yntema, 1968), both of which are larger and havelonger incubation periods than the Painted Turtle.
The staging table for the Red-eared Slider wasdesigned to mirror the descriptive criteria ofYntema (1968). For example, both tables describethe appearance of scattered pigment cells on stage15 limb buds. Yet this early onset of limb pigmen-tation in the Red-eared Slider would seem to be
unusual, as it is not apparent until stage 17 in thePainted Turtle, although we have observed pig-mentation as early as stage 16 in the SnappingTurtle. Efforts to adhere to the criteria of Yntema(1968) may have biased descriptions in the stagingtable of the Red-eared Slider. Our staging table isbetter suited to describe embryogenesis in emydidturtles before species-specific differences are estab-lished late in development. We acknowledge thatsome aspects of developmental staging tables areinherently subjective and encourage the combineduse of alternative approaches, such as the Stand-ard Event System for vertebrate embryology
TABLE 1. Chrysemys picta bellii, Embryo size, developmental chronology, and defining characters of developmental stages
Stage CRLa (mm 6 SEb) CLc (mm 6 SEb) N Day(s) Week(s) Defining characterd
3 4 3 1 Notochord4 3 4 1 Somites5 6 5 1 Anterior intestinal portal6 7 6 1 Optic vesicles7 9 7 1 Mandibular arch8 8 7–8 1–2 Stomodeum9 6 7–9 2 First pharyngeal slit is open10 5 10 2 Posterior intestinal portal11 5.57 (0.30) 5 10–12 2 Limb buds with apical ectodermal ridge12 6.49 (0.23) 7 10–15 2–3 Urogenital papilla13 7.01 (0.14) 6 11–16 2–3 Retina is uniformly pigmented14 7.30 (0.30) 6 14–17 3 Carapacial ridge15 6.06 (0.42) 12 16–18 3 External nares16 6.53 (0.13) 11 17–21 3–4 Caruncle17 7.30 (0.12) 14 18–23 3–4 Serration of digital plate18 8.67 (0.20) 18 22–27 4 Interdigital webs19 10.2 (0.37) 17 24–31 4–5 Carapace pigmentation20 12.2 (0.32) 14 26–33 4–5 Claws21 15.6 (0.26) 20 27–36 4–6 Pigmented stripes on limbs22e 18.5 (0.18) 27 37–53 6–8 Plastron pigmentation
aCRL 5 Crown-rump length (mm) measurements were used to estimate embryo size during stages 11–14.b6 SE 5 Standard error.cCL 5 Carapace length (mm) was used as an index of embryo size during stages 15–22.dA character that first appears or undergoes change during the listed stage of development.eSize measurements were taken when embryos first reached stage 22 (�37–38 d). Embryos (N 5 5) in pipped eggs (i.e., immedi-ately before hatching; �53.5 d) were>22 mm in carapace length.
Fig. 10. Chrysemys picta bellii, variation in size (estimated byCL) of embryos at stages 15–22. * 5 Measurements were takenwhen embryos first reached that stage (�37–38 d).
Fig. 11. Chrysemys picta bellii, CL as a function of incubationperiod (at 27�C).
453PAINTED TURTLE DEVELOPMENTAL STAGES
Journal of Morphology
(Werneburg, 2009). In either case, diligent exami-nation of embryonic anatomy is necessary toreduce bias in comparative studies. Furthermore,staging tables are based primarily on externalcharacters; less is known about developmental dif-ferences that define diversity in the internal anat-omy of turtles.
In summary, we recommend that investigatorsof the Painted Turtle preferentially use ourenhanced developmental staging table over thosedesigned for the Snapping Turtle (Yntema, 1968)and Red-eared Slider (Greenbaum, 2002) for the
following reasons: (1) estimates on the chronologyof developmental stages could be affected by longerincubation periods in these species; (2) Species-specific developmental differences, both early(stage 17, Snapping Turtle) and late (stages 24–26,Red-eared Slider) could bias descriptions and,thus, staging of embryos.
ACKNOWLEDGMENTS
The authors thank members of the Janzen labwho assisted with sample collection in Illinois andAnthony Beringer and Joyce Lok, who assistedwith sample collection in Nebraska. Sampling wasconducted with corresponding scientific collectionpermits for Illinois (NH13.0073) and Nebraska(310). The thank Christan Halverson for labora-tory assistance and Tracey Pepper (ISU BesseyMicroscopy and Nanoimaging Facility) for helpwith SEM procedures. Authors thank anonymousreviewers whose comments helped to improve anearlier version of this manuscript. GAC was sup-ported by the ISU-GMAP fellowship.
LITERATURE CITED
Andrews RM. 2004. Patterns of embryonic development. In:Deeming DC, editor. Reptilian Incubation: Environment, Evo-lution and Behaviour. Nottingham: Nottingham UniversityPress. pp 75–102.
Billet F, Gans C, Maderson PFA. 1985. Why study reptiliandevelopment. In: Billet F, Maderson PFA, editors. Biology ofthe Reptilia, Vol. 14. New York: Wiley. pp 1–25.
Cagle FR. 1954. Observations on the life cycles of Painted Tur-tles (Genus Chrysemys). Am Mid Nat 52:225–235.
Danni TMS, Dardenne MAR, Nascimento SM. 1990. Estudomorfol�ogico do desenvolvimento embrion�ario da Tartaruga daAmaz�onia, Podocnemis expansa, Pelomedusidae. Rev BrasBiol 50:619–625.
Ewert MA. 1979. The embryo and its egg: development andnatural history. In: Harless M, Morlock H, editors. Turtles:Perspectives and Research. New York: Wiley. pp 333–413.
Ewert MA. 1985. Embryology of turtles. In: Billet F, MadersonPFA, editors. Biology of the Reptilia. New York: Wiley. pp 75–267.
Ewert MA. 2008. Embryos and incubation period of the snap-ping turtle. In: Steyermark AC, Finkler MS, Brooks RJ, edi-tors. Biology of the Snapping Turtle (Chelydra serpentina).Baltimore: The Johns Hopkins University Press.
Gallego–Romero I, Ruvinsky I, Gilad Y. 2012. Comparativestudies of gene expression and the evolution of gene regula-tion. Nat Rev Genet 13:505–516.
Gilbert SF. 2009. The adequacy of model systems for evo–devo:modeling the formation of organisms/modeling the formationof society. In: Barberousse A, Morange M, Pradeu T, editors.Mapping the Future of Biology: Evolving Concepts and Theo-ries: Springer Science1Business Media. pp 57–68.
Greenbaum E. 2002. A standardized series of embryonic stages forthe Emydid turtle Trachemys scripta. Can J Zool 80:1350–1370.
Greenbaum E, Carr JL. 2002. Staging criteria for embryos ofthe Spiny Softshell Turtle, Apalone spinifera (Testudines: Tri-onychidae). J Morphol 254:272–291.
Gutzke WHN, Paukstis GL, Packard GC. 1984. Pipping versushatching as indices of time of incubation in reptiles. J Herpe-tol 18:494–496.
Gutzke WHN, Packard GC, Packard MJ, Boardman TJ. 1987.Influence of the hydric and thermal environments on eggsand hatchlings of Painted Turtles (Chrysemys picta). Herpeto-logica 43:393–404.
Fig. 12. Chrysemys picta bellii, means (black circles) of CL asa function of incubation period at 27�C (this study) versus at 21–23�C (Mahmoud et al. 1973).
Fig. 13. Chrysemys picta bellii, incubation period as a functionof temperature. Black circles represent mean estimates of incu-bation period. Hollow circles represent means estimated by Mah-moud et al. (1973) and this study. Other data were referencedmostly from egg incubation studies of northern populations(Lynn and Von Brand, 1945; Ream, 1967; Ewert, 1979, 1985;Packard et al., 1981, 1983; Gutzke et al., 1987; Tucker, 2000;Peterson and Kruegl, 2005; Kitana and Callard, 2008; Warnerand Janzen, unpublished data).
454 G. A. CORDERO AND F. J. JANZEN
Journal of Morphology

Hall B, Miyake T. 1995. Heterochrony in Evolution. In: McNa-mara KJ, editor. Evolutionary Change and Heterochrony.New York: Wiley. pp 3–20.
Hamburger V, Hamilton HL. 1951. A series of normal stages inthe development of the chick embryo. J Morph 88:49–92.
Hopwood N. 2007. A history of normal plates, tables and stagesin vertebrate embryology. Intl J Dev Biol 51:1–26.
Hopwood N. 2011. Approaches and species in the history of ver-tebrate embryology. Methods Mol Biol 770:1–20.
Janzen FJ, Krenz JG. 2004. Phylogenetics: which was first,TSD or GSD? In: Valenzuela N, Lance VA, editors. Tempera-ture–Dependent Sex Determination in Vertebrates. Washing-ton, D.C.: Smithsonian Press. pp 121–130.
Janzen FJ, Morjan CL. 2002. Egg size, incubation temperature,and posthatching growth in Painted Turtles (Chrysemyspicta). J Herpetol 36:308–311.
Janzen FJ, Phillips PC. 2006. Exploring the evolution of envi-ronmental sex determination, especially in reptiles. J EvolBiol 19:1775–1784.
Karnovsky MJ. 1965. A formaldehyde-glutaraldehyde fixativeof high osmolarity for use in electron microscopy. J Cell Biol27:137A.
Kitana N, Callard IP. 2008. Effect of cadmium on gonadaldevelopment in freshwater turtle (Trachemys scripta,Chrysemys picta) embryos. J Env Sci Health A 43:262–271.
Lynn WG, Brand TV. 1945. Studies on the oxygen consumptionand water metabolism of turtle embryos. Biol Bull 88:112–125.
Mahmoud IY, Hess GL, Klicka J. 1973. Normal embryonicstages of the Western Painted Turtle, Chrysemys picta bellii.J Morphol 141:269–280.
Miller J. 1985. Criteria for staging reptilian embryos. In: GriggG, Shine R, Ehmann H, editors. Biology of Australian Frogsand Reptiles. Chipping Norton, New South Wales: SurreyBeatty and Sons, in association with The Royal ZoologicalSociety of New South Wales. pp 305–310.
Nagashima H, Kuraku S, Uchida K, Kawashima–Ohya Y, NaritaY, Kuratani S. 2013. Origin of the turtle body plan: the foldingtheory to illustrate turtle–specific developmental repatterning.In: Brinkman D, Holroyd P, Gardner J, editors. Morphologyand Evolution of Turtles: In: Proceedings of the Gaffney TurtleSymposium (2009) in Honor of Eugene S. Gaffney. Dordrecht:Springer Science1Business Media. pp 37–50.
New DAT. 1966. The Culture of Vertebrate Embryos. New York:Logos Press/Academic Press. p. 245.
Nomura T, Kawaguchi M, Ono K, Murakami Y. 2013. Reptiles:A new model for brain evo-devo research. J Exp Zool B MolDev Evol 9999B:1–17.
Okada Y, Yabe T, Oda S–I. 2011. Embryonic development of theJapanese Pond Turtle, Mauremys japonica (Testudines: Geoe-mydidae). Curr Herpetol 30:89–102.
Packard G, Packard M. 1988. The physiological ecology of rep-tilian eggs and embryos. In: Huey R, editor. Biology of theReptilia. New York: Alan R. Liss, Inc. pp 523–605.
Packard GC, Packard MJ, Boardman TJ. 1981. Patterns andpossible significance of water exchange by flexible–shelledeggs of Painted Turtles (Chrysemys picta). Physiol Zool 54:165–178.
Packard GC, Packard MJ, Boardman TJ, Morris KA, ShumanRD. 1983. Influence of water exchanges by flexible–shelledeggs of Painted Turtles Chrysemys picta on metabolism andgrowth of embryos. Physiol Zool 56:217–230.
Peterson CC, Kruegl A. 2005. Peaked temporal pattern ofembryonic metabolism in an Emydid turtle (Chrysemys pictapicta). J Herpetol 39:678–681.
Ream CH. 1967. Some aspects of the ecology of Painted Turtles,Lake Mendota, Wisconsin [Dissertation]. Madison (WI): Uni-versity of Wisconsin. 84 p.
Reiss JO. 1989. The meaning of developmental time: a metricfor comparative Embryology. Am Nat 134:170–189.
Renous S, Rimblot–Baly F, Fretey J, Pieau C. 1989. Caract�eris-tiques du d�eveloppement embryonnaire de la Tortue Luth,Dermochelys coriacea (Vandelli, 1761). Ann Sci Nat Zool 10:197–229.
Shaffer BH, Minx P, Warren DE, Shedlock AM, Thomson RC,Valenzuela N, Abramyan J, Ameniya CT, Badenhorst D,Biggar KK, Borchert GM, Botka CW, Bowden RM, Braun EL,Bronikowski AM, Bruneau BG, Buck LT, Capel B, Castoe TA,Czerwinski M, Delehaunty KD, Edwards SV, Fronick CC,Fujita MK, Fulton L, Graves TA, Green RE, Haerty W,Hariharan R, Hernandez O, Hillier LW, Holloway AK, JanesD, Janzen FJ, Kandoth C, Kong L, de Koning J, Li Y,Literman R, McGaugh SE, Mork L, O’Laughlin M, Paitz RT,Pollock DD, Ponting CP, Radhakrishnan S, Raney BJ,Richman JM, St. John J, Schwartz T, Sethuraman A, SpinksPQ, Storey KB, Thane N, Vinar T, Zimmerman LM, WarrenWC, Mardis ER, Wilson RK. 2013. The western painted turtlegenome, a model for the evolution of extreme physiologicaladaptations in a slowly evolving lineage. Genome Biol 14:R28.
Schwanz LE, Spencer R–J, Bowden RM, Janzen F. 2010. Cli-mate and predation dominate juvenile and adult recruitmentin a turtle with temperature–dependent sex determination.Ecology 91:3016–3026.
Smith LW. 1914. The origin and development of the columellaauris in Chrysemys marginata. Anat Anz 46:547–560.
Tan Lj, Liu Y, Chen Sq. 2001. A Series of stages in the embry-onic development of the turtle Chinemys reevesii. Acta Hydro-biol Sin 25:605–612.
Tokita M, Kuratani S. 2001. Normal embryonic stages of theChinese Softshelled Turtle Pelodiscus sinensis (Trionychidae).Zool Sci 18:705–715.
Tucker JK. 2000. Body size and migration of hatchling turtles:inter– and intraspecific comparisons. J Herpetol 34:541–546.
Valenzuela N. 2009. The Painted Turtle, Chrysemys picta: amodel system for vertebrate evolution, ecology, and humanhealth. Cold Spring Harb Protoc 4:1–9.
Vickaryous MK, McLean KE. 2011. Reptile embryology. In:Pelegri F, editor. Vertebrate Embryogenesis, Methods inMolecular Biology (Springer Protocols). New York: HumanaPress. pp. 439–455.
Wagner GP, Lynch VJ. 2010. Evolutionary novelties. Cur Biol20:R48–R52.
Walker WF. 1947. The development of the shoulder region ofthe turtle, Chrysemys picta marginata, with special referenceto the primary musculature. J Morphol 80:195–249.
Weisrock DW, Janzen FJ. 1999. Thermal and fitness–relatedconsequences of nest location in Painted Turtles (Chrysemyspicta). Funct Ecol 13:94–101.
Werneburg I. 2012. Temporal bone arrangements in turtles: anoverview. J Exp Zool B, Mol Dev Evol 318:235–249.
Werneburg I. 2009. A standard system to study vertebrateembryos. PLoS One 4:e5887.
Werneburg I, Hugi J, Muller J, Sanchez–Villagra MR. 2009.Embryogenesis and ossification of Emydura subglobosa (Tes-tudines, Pleurodira, Chelidae) and patterns of turtle develop-ment. Dev Dyn 238:2770–2786.
Yntema CL. 1968. A series of stages in the embryonic develop-ment of Chelydra serpentina. J Morphol 125:219–252.
455PAINTED TURTLE DEVELOPMENTAL STAGES
Journal of Morphology