an engineering understanding of the small intestineetheses.bham.ac.uk/3522/2/fonseca_12_phd.pdf ·...
TRANSCRIPT

1
An Engineering Understanding of the
Small Intestine
by
MONICA ROSALIA JAIME FONSECA
A thesis submitted to
The University of Birmingham
for the degree of
DOCTOR OF PHILOSOPHY
School of Chemical Engineering
The University of Birmingham
September 2011

University of Birmingham Research Archive
e-theses repository This unpublished thesis/dissertation is copyright of the author and/or third parties. The intellectual property rights of the author or third parties in respect of this work are as defined by The Copyright Designs and Patents Act 1988 or as modified by any successor legislation. Any use made of information contained in this thesis/dissertation must be in accordance with that legislation and must be properly acknowledged. Further distribution or reproduction in any format is prohibited without the permission of the copyright holder.

ii
ABSTRACT
The main objective of this research was to understand phenomena occurring during food
digestion and nutrients absorption in the small intestine from an engineering perspective.
Intestinal flow and mixing processes were simulated using a dynamic in vitro Small Intestine
Model (SIM). Of particular interest was to study the effect that mixing and food formulation
has on glucose absorption and starch hydrolysis.
Results showed the effect of segmentation motion on nutrient delivery to the intestinal wall as
a consequence of changes in the mass transfer coefficient. This is most likely due to the
increased mixing in the SIM. Experiments of starch digestion with and without the presence
of guar gum have shown that viscous fibres reduce the rate of starch digestion and glucose
absorption by impairing mixing and reducing diffusion within the fluid. Similarly, use of
particulate systems demonstrated a significant effect on the delivery rates. Flow visualization
techniques used for studying flow paths in the SIM showed that this in vitro model
reproduces the characteristic flow events and mixing found in the small intestine in vivo.
This research provides insights into the role of mixing on enhancing mass transfer on the
course of digestion-absorption processes and also the action of viscous polysaccharides on
the delay of glucose absorption in the small intestine. The end findings resulted in a better
understanding of the factors which control the development of new functional food that could
be applied both in academia and industry.

iii
This project was partially supported by the Programme Alßan, the European Union
Programme of High Level Scholarships for Latin America, scholarship number
E07D402060MX and by the Mexican National Council for Science and Technology
(CONACYT), scholarship number 230576. This PhD was also possible thanks to the support
of the National Polytechnic Institute Mexico (CICATA-IPN).
iv
Specially dedicated to my family

v
ACKNOWLEDGEMENTS
I would like to thank my supervisors Prof. Peter J. Fryer and Dr. Serafim Bakalis for their
guidance, understanding and support on this project. Thanks for placing your trust in me and
giving me the opportunity to grow intellectually. I will be always indebted to you and the
staff of the School of Chemical Engineering.
I thank Programme Alßan from the European Union, the Mexican National Council for
Science and Technology (CONACYT) and the National Polytechnic Institute (CICATA-IPN)
from Mexico for their financial support. The support of Dr. José Antonio I. Díaz Góngora
from CICATA is also appreciated.
I would also like to express my gratitude to Prof. Clare Mills, Prof. Ian Norton, Dr. Fotis
Spyropoulos and Dr. Taghi Miri, for providing helpful advice and useful comments on my
work. I also thank EngD Ajay Tharakan for introducing me the Small Intestine Model (SIM)
and Dr. Alan Smith for teaching me how liposomes are made and analysed. From University
of Manchester and the Institute of Food Research in Norwich, UK, I thank Dr. Martin
Wickhan, Dr. Geraldine Toole and Dr. Elisa Selvatico for giving me the invaluable
opportunity to follow in vitro digestion experiments and show me how the Model Gut works.
For the Positron Emission Particle Tracking (PEPT) facility, I would like to thank Dr. David
Parker, Dr. Thomas Leadbeater and Dr. Joseph Gargiuli. With regards to the use of the Flow
visualization laboratory, I would like to thank Dr. Mark Simmons for sharing his expertise
and assisting me with the use of the Planar Laser Induced Fluorescence (PLIF) technique I
would also like to show appreciation to Ms. Lynn Draper and Ms. Elizabeth Kent for their
assistance during my PhD.

vi
Special thanks go to Victor M. Landassuri, Alan Islas and Faridah Yaya for the countless
discussions on my work and more importantly their emotional support. I am also particularly
grateful to Karin Mehauden, Ian Brown, Mauricio Angeles, Ken Chung, Marie Lunel, Asja
Posh, Aleksandra Pawlik, Sala Odeen, Ricardo Roque, Luis Hernández, Margarita Velasco
and Luis A. Román for their unconditional support and friendship.
Finally, I would like to thank my beloved family, my parents Carlos Jaime and Rosario
Fonseca; my sisters Paty, Bety, Diana and Angelica; my brothers in love Jaime, Gerardo and
Cesar and my sweet niece and nephews Mitzel, Evan, Matías and Leo, for their never-ending
support, encouragement and strength, without which I would not be here.
Muchas gracias por todo su cariño y el apoyo incondicional que me brindaron en los cuatro
años que estuve lejos de casa, sin el cual mi doctorado no podría ser una realidad.

vii
Table of Contents
CHAPTER 1 - INTRODUCTION .................................................................................................. 1
1.1 Obesity overview - challenges .................................................................................................. 1
1.2 Mass transfer phenomena in the small intestine ........................................................................ 5
1.3 Objectives ................................................................................................................................ 6
1.4 Thesis layout............................................................................................................................ 7
1.5 Publications and Conferences ................................................................................................... 8
CHAPTER 2 - LITERATURE REVIEW ..................................................................................... 11
2.1. Introduction .......................................................................................................................... 11
2.2. Gastrointestinal Tract overview ............................................................................................. 11
2.2.1 Mouth ............................................................................................................................. 12
2.2.2 Stomach .......................................................................................................................... 14
2.2.3 Small intestine ................................................................................................................ 17
2.2.4. Large intestine................................................................................................................ 19
2.2.5 Liver and gallbladder ...................................................................................................... 20
2.2.6 Pancreas .......................................................................................................................... 21
2.3 Food digestion and actives absorption processes .................................................................... 22
2.3.1. Mechanical digestion: propulsion and mixing in the small intestine ................................ 22
2.3.1.1 Peristalsis ................................................................................................................. 22
2.3.1.2 Segmentation ............................................................................................................ 23
2.3.2 Chemical digestion in the small intestine ......................................................................... 24
2.3.2.1. Protein digestion ...................................................................................................... 25
2.3.2.2 Lipids ....................................................................................................................... 26
2.3.2.3 Carbohydrates - main source of energy ..................................................................... 27
2.3.3 Absorption of active molecules ....................................................................................... 29
2.4 Models for studying digestion and absorption......................................................................... 32
2.4.1 In vivo studies ................................................................................................................. 33
2.4.2 In vitro models ................................................................................................................ 36
2.4.3 In silico and theoretical models ....................................................................................... 44
2.5 The small intestine bioreactor: modeling digestion with chemical engineering ........................ 46
2.5.1 Fluid dynamics ................................................................................................................ 47
2.5.2 Mixing fundamentals....................................................................................................... 49
viii
2.5.3 Molecular delivery .......................................................................................................... 51
2.5.3.1 Diffusion and convection .......................................................................................... 51
2.5.3.2 Mass transfer coefficients ......................................................................................... 52
2.6 Food formulation (structured foods) ....................................................................................... 55
2.7 Encapsulation ........................................................................................................................ 58
2.7.1 Ionotropic gelation .......................................................................................................... 59
2.7. 2. Liposome entrapment .................................................................................................... 60
2.8 Conclusion............................................................................................................................. 61
CHAPTER 3 - MATERIALS AND METHODS .......................................................................... 62
3.1. Introduction .......................................................................................................................... 62
3.2 Materials................................................................................................................................ 63
3.2.1 Glucose (C6H12O6) .......................................................................................................... 63
3.2.2 Starch (C6H10O5)n ............................................................................................................ 64
3.2.3 Biopolymers and soluble fibres ....................................................................................... 64
3.2.3.1 Guar Gum ................................................................................................................ 65
3.2.3.2 Carboxymethyl cellulose (CMC) .............................................................................. 65
3.2.3.3 Citrus pectin ............................................................................................................. 65
3.2.3.4 Sodium Alginate ....................................................................................................... 66
3.2.4 Enzymes ......................................................................................................................... 66
3.3. Small Intestine Model description ......................................................................................... 67
3.3.1. Membrane description/characteristics ............................................................................. 68
3.3.2 The core section of the SIM: lumen and recipient sides.................................................... 68
3.3.3 The mixing or segmentation mechanism .......................................................................... 69
3.4 Methods ................................................................................................................................. 72
3.4.1. Absorption of glucose in the SIM ................................................................................... 73
3.4.1.1 Effect of mixing and food formulation ...................................................................... 73
3.4.1.2 Effect of frequency of contractions and food formulation .......................................... 75
3.4.2 Density and viscosity measurements ................................................................................ 77
3.4.3 Glucose determination ..................................................................................................... 78
3.4.4 Mass transfer coefficients ................................................................................................ 79
3.4.5 Chemical Digestion in the SIM........................................................................................ 80
3.4.5.1 Starch preparation .................................................................................................... 81
3.4.5.2. Enzyme preparation ................................................................................................. 81
3.4.5.3 Gastric digestion ....................................................................................................... 81

ix
3.4.5.4 Intestinal digestion in the SIM .................................................................................. 81
3.4.5.5 Data analysis ............................................................................................................ 85
3.4.6. Flow visualization techniques ......................................................................................... 86
3.4.6.1 Planar Laser Induced Fluoresce (PLIF) ..................................................................... 87
3.4.6.2 Positron Emission Particle Tracking (PEPT) ............................................................. 90
3.4.7 Encapsulation of actives .................................................................................................. 92
3.4.7.1 Gelled particles......................................................................................................... 93
3.4.7.2 Liposomes ................................................................................................................ 94
3.5 Conclusion............................................................................................................................. 97
CHAPTER 4 - ABSORPTION OF ACTIVES IN THE SIM ....................................................... 98
4.1. Introduction .......................................................................................................................... 98
4.2 Effect of mixing and food formulation on glucose absorption ................................................. 99
4.2.1 Glucose absorption rates.................................................................................................. 99
4.2.2 Overall mass transfer coefficients (OMTC) ................................................................... 105
4.2.3 Mass transfer coefficients in the biopolymer side ........................................................... 107
4.3. Effect of mixing frequency and food formulation ................................................................ 113
4.3.1 Glucose absorption rates: effect of frequency of contractions and formulation ............... 115
4.3.1.1 Glucose absorption rates for guar gum solutions ..................................................... 115
4.3.1.2 Glucose absorption rates for citrus pectin solutions ................................................. 117
4.3.1.3 Glucose absorption rates for CMC solutions ........................................................... 119
4.3.2 Overall mass transfer coefficients (OMTC): effect of frequency of segmentation ........... 120
4.3.2.1 Overall mass transfer coefficients for guar .............................................................. 121
4.3.2.2 Overall mass transfer coefficients for pectin ........................................................... 122
4.2.3.3 Overall mass transfer coefficients for CMC ............................................................ 124
4.3.3 Local mass transfer coefficients ..................................................................................... 126
4.3.3.1 Local mass transfer coefficient for guar gum........................................................... 126
4.3.3.2 Local mass transfer coefficient for pectin solutions ................................................. 129
4.3.3.3 Local mass transfer coefficient for CMC solutions .................................................. 131
4.4. Biopolymer and their impact on absorption ......................................................................... 136
4.4.1. Absorption versus rheology of the biopolymers ............................................................ 136
4.4.2 Absorption and chemical structure of the chyme ............................................................ 140
4.4.2.1 Guar gum and chemical structure ............................................................................ 140
4.4.2.2. Pectin and chemical structure................................................................................. 141
4.4.2.3 CMC and chemical structure................................................................................... 141

x
4.5 Conclusions ......................................................................................................................... 142
CHAPTER 5 - STARCH DIGESTION IN THE SIM ................................................................ 144
5.1 Introduction ......................................................................................................................... 144
5.2 Starch hydrolysis in the closed SIM configuration ................................................................ 146
5.2.1 Starch digestion: effect of mixing .................................................................................. 146
5.2.2 Starch digestion: effect of food formulation ................................................................... 150
5.2.2.1 Mass transfer coefficients ....................................................................................... 153
5.3. Starch hydrolysis in the open SIM configuration ................................................................. 156
5.3.1 Effect of flow rate and enzyme concentration ................................................................ 157
5.3.2 Effect of substrate concentration and food formulation .................................................. 161
5.3.2.1 Effect of flow rate of the enzyme ............................................................................ 162
5.3.2.2 Effect of the concentration of the enzyme ............................................................... 165
5.3.2.3 Effect of concentration of substrate ......................................................................... 166
5.3.2.4 Effect of viscosity of the digesta ............................................................................. 171
5.4 Michaelis – Menten kinetics ................................................................................................. 174
5.5 Conclusions ......................................................................................................................... 176
CHAPTER 6 - MIXING PROCESSES IN THE SIM ................................................................ 178
6.1 Introduction ......................................................................................................................... 178
6.2 Optical flow visualization techniques ................................................................................... 179
6.2.1 Preliminary flow visualization experiments ................................................................... 179
6.2.2 Planar Laser Induced Fluorescence (PLIF) .................................................................... 185
6.3 Positron Emission Particle Tracking (PEPT) ........................................................................ 191
6.4 Conclusions ......................................................................................................................... 205
CHAPTER 7 – ENCAPSULATION OF ACTIVES ................................................................... 207
7.1 Introduction ......................................................................................................................... 207
7.2 Gelled particles .................................................................................................................... 208
7.2.2 Particles morphology..................................................................................................... 210
7.2.3 Release under simulated gastro-intestinal conditions...................................................... 211
7.3 Liposomes ........................................................................................................................... 216
7.3.1 Liposomes: particle size and entrapment efficiency (EE) ............................................... 217
7.3.2 Liposomes morphology ................................................................................................. 217

xi
7.3.3 Liposomes: zeta-potential measurement ........................................................................ 218
7.3.4 Liposomes internal structure: cryo-SEM analysis .......................................................... 220
7.3.5 Liposomes pH stability .................................................................................................. 221
7.3.6 Release of ALP ............................................................................................................. 222
7.3.7 Activity of ALP ............................................................................................................ 223
7.4 In vitro release of gel particles and liposomes in the SIM ..................................................... 225
7.5 Conclusions ......................................................................................................................... 225
CHAPTER 8 – CONCLUSIONS AND FUTURE WORK ......................................................... 227
8.1 Main conclusions ................................................................................................................. 228
8.1.1 Actives absorption......................................................................................................... 228
8.1.2 Starch digestion............................................................................................................. 230
8.1.3 Mixing processes .......................................................................................................... 231
8.1.4 Encapsulation ................................................................................................................ 232
8.2 Future work ......................................................................................................................... 233
8.2.1 Absorption studies......................................................................................................... 234
8.2.2 Digestion studies ........................................................................................................... 235
8.2.3 Flow visualization studies ............................................................................................. 236
8.2.4 Encapsulation studies .................................................................................................... 236
REFERENCES……………………………………………………………………………………..237
APPENDIX……………………………………………………………………………..…………...247

xii
Nomenclature
C(x,t) Drug concentration at any distance along the intestine at time t, mass/m3
c1 Concentration in the bulk solution, mol/m3
c1i Concentration at the interface, mol/m3
Cinf Concentration at the infinite, mol/m3
D Diameter of the pipe, m
DAB Diffusion coefficient or diffusivity, m2/s
Dmem Diffusion coefficient of nutrient through the membrane
F Frequency of oscillation, s-1
xo Amplitude centre-to-peak, m
J Diffusion flux of material per unit area, mol/m2s
K Overall mass transfer coefficient, m/s
ka Apparent first-order absorption rate constant
kbp Local mass transfer coefficient, m/s
Km Michaelis half saturation constant
krep Recipient side mass transfer coefficient, m/s
L Characteristic length, m
lmem Thickness of the membrane, m
N1 Molar flux at the interface, mmol/m2s
Nu Nusselt number
Re Reynolds number
Ren Net Reynolds number
Reo Oscillatory Reynolds number

xiii
Rsystem Resistance from the system
S Substrate concentration, mol/m3
Sh Sherwood number
Shn Sherwood number from net flow
Sho Sherwood number from oscillatory flow
So Initial substrate concentration, mol/m3
T Time, s
vave Average velocity due to segmentation and peristalsis, m/s
Vmax Maximal rate of changing
vosc Oscillatory velocity induced by segmentation, m/s
W Lambert W function
x, y, z Position, m
Greek letters
Α Longitudinal spreading coefficient, m2/s
Β Linear flow velocity, m/s
Shear rate, s-1
Density of the fluid, Kg/m3
Mean velocity, m/s
Viscosity of the fluid, Pa.s
app Apparent viscosity, Pa.s

xiv
Abbreviations
ALP Alkaline Phosphatase
ANOVA Analysis of Variance
BMI Body Mass Index
CCD Charged Coupled Device
CFD Computational Fluid Dynamics
CMC Carboxymethyl cellulose
CT Computer Tomography
DNS 3,5-dinitrosalicylic acid
DPPC Dipalmitoylphosphatidylcholine
EE Entrapment encapsulation
EPI Echoplanar Magnetic Resonance Imaging
ESEM Environmental Scanning Electron Microscopy
GI Gastrointestinal
IFR Institute of Food Research
LUV Large Unilamellar Vesicles
MLV Multilamellar vesicles
MMC Migration Motor Complex
MRI Magnetic Resonance Imaging
MS Microspheres
MTC Mass Transfer Coefficients
MWCO Molecular Weight Cut Off
NHS National Health Service

xv
OMTC Overall Mass Transfer Coefficients
PAMPA Parallel Artificial Membrane Permeation Assay
PC Phosphatidylcholine
PE Phosphatidyl ethanolamine
PEPT Positron Emission Particle Tracking
PET Positron Emission Tomography
PI Phosphatidylinositol
PIV Particle Image Velocimetry
PLIF Planar Laser Induced Fluorescence
pNPP p-nitrophenyl phosphate
RC Regenerated cellulose
RDS Rapidly Digestible Starch
RS Resistant Starch
SDS Slowly Digestible Starch
SEM Scanning Electron Microscopy
SGF Simulated Gastric Fluid
SHIME Simulator of the Human Intestinal Microbial Ecosystem
SIF Simulated Intestinal Fluid
SIM Small Intestine Model
STR Stirred Tank Reactor
TIM Gastrointestinal Tract Model
VMD Volume Mean Diameter
WHO World Health Organization

xvi
List of Figures
CHAPTER 2 - LITERATURE REVIEW
Figure 2.1 Scheme of the gastrointestinal tract. ................................................................................ 12 Figure 2.2 Diagram of the side view of the structures of the mouth. ................................................. 13 Figure 2.3 Diagram of the stomach showing the different sections (Widmaier et al., 2006). .............. 14 Figure 2.4 Diagram of the stomach and small intestine..................................................................... 17 Figure 2.5 Diagram of the large intestine ......................................................................................... 19 Figure 2.6 Accessory organs of the GI tract (Widmaier et al., 2006) ................................................. 21 Figure 2.7 Pancreatic and bile ducts responsible for feeding digestives fluids into the duodenum ..... 21 Figure 2.8 Segmentation movements in the small intestine (Guyton and Hall, 2006) ........................ 24 Figure 2.9 Absorptive surface of the small intestine: villi, epithelial cells and microvilli ................... 30 Figure 2.10 Schematic representation of the main mechanisms of membrane transport ..................... 32 Figure 2.11 A schematic of the TNO model (Minekus et al., 1995) .................................................. 42 Figure 2.12 A picture of the Model gut developed by the Institute of Food Research in Norwich, UK........................................................................................................................................................ 43 Figure 2.13 Blood glucose levels of human subjects following ingestion of 50g glucose in 250ml orange drink, with or without 9g guar gum. Results are expressed as a mean with the standard errors of six observations (taken from Blackburn et al. 1984). .................................................................... 57 CHAPTER 3 - MATERIALS AND METHODS
Figure 3.1 Starch structure (a) amylose and (b) amylopectin. ........................................................... 64 Figure 3.2 Small Intestine Model (SIM), (a) membrane and inflatable cuffs and (b) solenoid valves panel to control the segmentation pneumatic mechanisms. ............................................................... 70 Figure 3.3 A schematic representation of the main components of the SIM. ..................................... 71 Figure 3.4 Photographs of the SIM (a) with and (b) without segmentation contraction cuffs ............. 75 Figure 3.5 Viscosity profiles of solutions of glucose (55 mM) added with (a) guar gum, (b) high methoxyl pectin and (c) CMC at various concentrations. .................................................................. 78 Figure 3.6 Glucose calibration curve in a range from 0.0 to 5.0 mM................................................. 79 Figure 3.7 In vitro models used for starch hydrolysis, (a) Stirred Tank Reactor (STR) and (b) Small Intestine Model (SIM). .................................................................................................................... 82 Figure 3.8 Experimental SIM set up including visualization cell for PLIF experiments..................... 87 Figure 3.9 PLIF Experimental Set up ............................................................................................... 88 Figure 3.10 PEPT Experimental Set up ............................................................................................ 92 CHAPTER 4 - ABSORPTION OF ACTIVES IN THE SIM
Figure 4.1 Absorption of glucose in (a) aqueous solutions (1.0 mPa.s) and (b) guar gum solutions (2.0 mPa.s) when segmentation and no segmentation motion take place in the SIM............................... 100 Figure 4.2 Absorption of glucose in 0.1 and 0.5% (w/v) CMC solutions with zero shear viscosities of 20 mPa.s and 200 mPa.s, respectively, when segmentation and no segmentation motion take place in the SIM. ........................................................................................................................................ 102

xvii
Figure 4.3 Overall Mass Transfer Coefficients as a function of the zero shear viscosity of the lumen contents for water (control), guar (0.1%, w/v) and CMC (0.1 and 0.5%, w/v) under segmentation and no segmentation conditions. ........................................................................................................... 107 Figure 4.4 Schematic of the resistances to mass transfer in the SIM. .............................................. 107 Figure 4.5 A diagram of a segment of the SIM that represents the volume displace forwards by an inflated cuff (0.12 m length) when segmentation occurs. ................................................................ 110 Figure 4.6 Experimental and theoretical values of the Sherwood numbers for water, guar (0.1%, w/v) and CMC (0.1 and 0.5%, w/v). ...................................................................................................... 111 Figure 4.7 Deformation profiles of segmentation contractions applied to the SIM, in black the movements of cuff 1 and in blue the contractions of cuff 2, represented as ‘1’ and ‘2’, respectively, for 1 - 3 seconds. Each segmentation contraction has a symmetric delay, inflation and deflation times....................................................................................................................................................... 114 Figure 4.8 Glucose absorption in the SIM for solutions supplemented with guar gum at various concentrations: (a) 0.25, (b) 0.50, (c) 0.65 and (d) 0.75% (w/v) in a glucose solution (1.0, w/v) under segmentation contractions produced every 1, 2 or 3 seconds. ......................................................... 117 Figure 4.9 Glucose absorption in the SIM for solutions added with high methoxyl pectin at various concentrations: (a) 1.0, (b) 2.0, (c) 2.5 and (d) 3.0% in a glucose solution (1.0%, w/v) under segmentation contractions at 1, 2 and 3 seconds. ............................................................................ 118 Figure 4.10 Glucose absorption in the SIM for solutions added with CMC at various concentrations (a) 0.25, (b) 0.50, (c) 1.00 and (d) 1.25% (w/v) in a glucose solution (1%, w/v) under segmentation contractions at 1, 2 and 3 seconds. ................................................................................................. 120 Figure 4.11 OMTC for glucose-guar solutions as a function of (a) the number of contractions per minute applied to the SIM and (b) the zero shear viscosity of the test food (glucose solution). ....... 122 Figure 4.12 OMTC for glucose-pectin solutions as a function of (a) the number of contractions per minute applied to the SIM and (b) zero shear viscosity of the solution............................................ 124 Figure 4.13 OMTC for glucose-CMC solutions as a function of (a) the number of contractions per minute applied to the SIM and (b) zero shear viscosity of the solution............................................ 125 Figure 4.14 Local mass transfer coefficients of the biopolymer side from different glucose guar solutions. ....................................................................................................................................... 127 Figure 4.15 Sherwood versus oscillatory Reynolds numbers for guar solutions at different mixing frequencies (1, 2, and 3 seconds). .................................................................................................. 129 Figure 4.16 Local mass transfer coefficients of the biopolymer side from different glucose pectin solutions. ....................................................................................................................................... 130 Figure 4.17 Sherwood versus oscillatory Reynolds numbers for pectin solutions at different mixing frequencies (1, 2, and 3 seconds). .................................................................................................. 131 Figure 4.18 Local mass transfer coefficients of the biopolymer side from different glucose CMC solutions. ....................................................................................................................................... 132 Figure 4.19 Sherwood versus oscillatory Reynolds numbers for CMC solutions at different mixing frequencies (1, 2, and 3 seconds). .................................................................................................. 133 Figure 4.20 Rheological behaviour of guar (0.75%, w/v), pectin (3.0%, w/v) and CMC (1.25, w/v)....................................................................................................................................................... 137 Figure 4.21 Rheological behaviour of pectin (2.5%, w/v) and CMC (1.0%, w/v). ........................... 138 Figure 4.22 Rheological behaviour of guar (0.625%, w/v) and pectin (2.0%, w/v). ......................... 139 Figure 4.23 A schematic of the chemical structure of guar gum...................................................... 140 Figure 4.24 A schematic of chemical structure of pectin ................................................................ 141 Figure 4.25 A schematic of the chemical structure of the CMC. ..................................................... 142

xviii
CHAPTER 5 - STARCH DIGESTION IN THE SIM
Figure 5.1 Schematic of the experimental SIM set-up for starch hydrolysis. ................................... 147 Figure 5.2 Starch digestion in the Stirred Tank Reactor (STR) and in the Small Intestine Model (SIM)...................................................................................................................................................... 149 Figure 5.3 Glucose absorption levels in the recipient side of the SIM for 1.0% (w/v) corn starch with and without (control) 0.5% (w/v) of guar gum. .............................................................................. 151 Figure 5.4 Glucose absorption levels in the recipient side of the SIM for 50 g of white bread with and without (control) 0.5% (w/v) of guar gum. ..................................................................................... 152 Figure 5.5 SEM microphotographs of corn starch (a-b) before hydrolysis and (c-d) after 60 minutes of hydrolysis of pancreatic α-amylase at room temperature in the presence of 0.5% (w/v) of guar gum....................................................................................................................................................... 155 Figure 5.6 Digestion in the SIM, (a) starch digestion in lumen and (b) glucose absorption in recipient side. .............................................................................................................................................. 159 Figure 5.7 Starch digestion and glucose absorption in the (a) lumen and (b) recipient side of the SIM, respectively, varying the flow rate at which the pancreatic solution was fed into the membrane. .... 164 Figure 5.8 Starch digestion and glucose absorption in the (a) lumen and (b) recipient side of the SIM, respectively, varying the activity of α-amylase. .............................................................................. 165 Figure 5.9 Starch digestion in the lumen side of the SIM for various amylase’s activities (5 - 25 U/ml). ........................................................................................................................................... 166 Figure 5.10. Starch digestion in the lumen side of the SIM, varying the concentration of starch: (a) 0.5, (b) 1.0, (c) 2.0 and (d) 3.0% (w/v). .......................................................................................... 168 Figure 5.11 Starch digestion in the lumen side of the SIM, varying the concentration of starch from 0.5 to 3.0% (w/v). .......................................................................................................................... 169 Figure 5.12 Glucose absorption in the recipient side of the SIM, varying the concentration of starch from 0.5 to 3.0% (w/v). ................................................................................................................. 170 Figure 5.13 Glucose absorption in the recipient side of the SIM, varying the concentration of guar gum from 0.25 to 0.75% (w/v). ...................................................................................................... 172 Figure 5.14 Simulated substrate depletion data (cross) along with the model predictions (solid line) for 1.0% (w/v) starch digestion in the STR at concentrations of enzyme constant. ............................... 176 CHAPTER 6 - MIXING PROCESSES IN THE SIM
Figure 6.1 Diffusion of the dye through the SIM in water; (a) steady state and (b) propulsion by a peristaltic pump (volumetric flow of 1.2 x10⁻⁵ m3/s), after one minute of the dye injection. .......... 180 Figure 6.2 Mixing flow patterns of the dye in the SIM when segmentation occurs in water. The direction of the flow imposed by each contraction is represented by the block arrows. ................... 181 Figure 6.3 Diffusion of the dye through the SIM in 1.0% (w/v) of CMC; (a) steady state and (b) propulsion by a peristaltic pump (volumetric flow of 1.2 x10⁻⁵ m3/s), after ten minutes of dye injection. ....................................................................................................................................... 183 Figure 6.4 Mixing flow patterns of the dye in the SIM when segmentation occurs in 1.0% (w/v) CMC. The direction of the flow imposed by each segmentation contraction is represented by the block arrows. .......................................................................................................................................... 184 Figure 6.5 Dispersion of the dye in (a) water and (b) CMC (1.0%, w/v) after one minute of applied segmentation in the SIM at 2s. ....................................................................................................... 185 Figure 6.6 Dye bolus motion as a left contraction develops in the SIM, images captured by Planar Laser Induced Fluorescence (PLIF) for 0.5% (w/v) CMC. ............................................................. 187

xix
Figure 6.7 Dye bolus motion for a set of segmentation contractions for 0.5% (w/v) CMC solution; contractions generated every one (a-c) or two seconds (d-f). .......................................................... 189 Figure 6.8 Dye bolus motion for a set of segmentation contractions for 1.0% (w/v) CMC solution; contractions generated every one (a-c) or two seconds (d-f). .......................................................... 190 Figure 6.9 Schematic of the experimental set up used for PEPT. .................................................... 192 Figure 6.10 Flow path of a radioactive tracer (600 m) under segmentation contractions in the SIM for 0.5% (w/v) guar solution (a) segmentation and (b) segmentation and peristalsis. ....................... 195 Figure 6.11 Flow path of the tracer over time under segmentation contractions generated every 2 seconds in the SIM for 0.5% (w/v) guar solution. Schematic ‘A-C’ represents the relative position of the particle as a function of both cuffs............................................................................................ 197 Figure 6.12 Characteristic eddy identified in the SIM as a result of a segmentation contraction in guar gum (0.5%, w/v). ........................................................................................................................... 198 Figure 6.13 Flow path induced under segmentation in guar gum solutions (0.5%, w/v). ................. 199 Figure 6.14 Characteristic eddies identify in guar gum solutions generated as a result of the segmentation contractions (a) 56-60 seconds and (b) 67-71 seconds. .............................................. 200 Figure 6.15 Characteristic eddies identify in guar gum solutions generated as a result of the segmentation contractions (a) 80-84 seconds and (b) 56-84 seconds. .............................................. 201 Figure 6.16 Characteristic eddies identify in guar gum solutions (0.5%, w/v) generated as a result of segmentation contractions (a) 80-84 seconds and (b) 56-84 seconds. .............................................. 202 Figure 6.17 Flow pattern of a radioactive tracer (600 µm) under segmentation contractions in the SIM for 1.0% (w/v) guar solution (a) 500-1000 seconds and (b) 60 seconds. ......................................... 203 CHAPTER 7 – ENCAPSULATION OF ACTIVES
Figure 7.1 SEM micrographs of Ca-alginate particles showing the effect of drying process: (a) air- dried particles and (b) freeze-dried particles prepared with alginate (3.0%, w/v)............................. 211 Figure 7.2 Dynamic release of riboflavin from (a) 1.0 and (b) 2.0% (w/v) Ca-alginate beads into SGF and SIF at room temperature. ......................................................................................................... 213 Figure 7.3 Dynamic release of riboflavin from 3.0% (w/v) Ca-alginate beads into SGF and SIF at room temperature. ......................................................................................................................... 214 Figure 7.4 ESEM micrograph of (a) gel core liposomes and (b) conventional liposomes. ............... 218 Figure 7.5 Measurements of -potential for samples of liposomes and gel core liposomes (cross-linked and non-cross-linked) with and without ALP. ...................................................................... 219 Figure 7.6 Cryo-ESEM micrographs of (a) gel core liposomes before fracture, (b) cross-section of gel core liposome, (c) cluster of crosss-sectioned gel core liposomes showing aggregation, (d) ALP-loaded liposome before fracture, (e) cross-sectioned ALP-loaded liposome with no evidence of aggregation.................................................................................................................................... 221 Figure 7.7 The effect of pH on the size of (a) MLV’s loaded with ALP and (b) gel core liposomes over a period of 10 days................................................................................................................. 222 Figure 7.8 Release profiles of ALP from standard liposomes and gel core liposomes. Points represent mean values with vertical error bars indicating standard deviation, n=3. ......................................... 223 Figure 7.9 Percent of ALP activity retained during 2 hours of exposure to simulated gastric fluid, pH 2, for standard liposomes, gel core liposomes and free ALP. .......................................................... 224

xx
List of Tables CHAPTER 2 - LITERATURE REVIEW
Table 2.1 Common materials used in food microencapsulation ........................................................ 60 CHAPTER 3 - MATERIALS AND METHODS
Table 3.1 Summary of the experiments designed to study the mixing effect ..................................... 74 Table 3.2 Summary of the experiments designed to study the effect of frequency of contractions ..... 77 Table 3.3 Summary of the experiments done for studying starch hydrolysis ..................................... 84 Table 3.4 Summary of the experiments done for studying the effect of food formulation on starch digestion.......................................................................................................................................... 85 Table 3.5 Summary of the experiments performed with the PLIP technique ..................................... 90 Table 3.6 Summary of the experiments performed with the PEPT camera ........................................ 92 CHAPTER 4 - ABSORPTION OF ACTIVES IN THE SIM
Table 4.1 Glucose absorption rates for experimental solutions. ...................................................... 103 Table 4.2 Overall Mass Transfer Coefficients (OMTC) for glucose absorption. .............................. 106 Table 4.3 Local mass transfer coefficients of the biopolymer side from different viscous materials. 108 Table 4.4 Experimental and theoretical Sherwood numbers estimated for the SIM and a circular pipe with similar fluid motion. .............................................................................................................. 111 Table 4.5 Reynolds and Sherwood numbers calculated from the net (Ren) and oscillatory flows (Reo)....................................................................................................................................................... 112 Table 4.6 Physical properties of the experimental guar gum-glucose solutions. .............................. 116 Table 4.7 Physical properties of glucose-pectin solutions. .............................................................. 118 Table 4.8 Physical properties for glucose-CMC solutions............................................................... 119 Table 4.9 OMTC for guar gum solutions as a function of mixing frequency. .................................. 121 Table 4.10 OMTC for pectin solutions as a function of mixing frequency. ..................................... 123 Table 4.11 OMTC for CMC solutions as a function of frequency of segmentation ......................... 124 Table 4.12 Velocity values estimated for each type of contraction in the SIM. ............................... 127 Table 4.13 Oscillatory Reynolds numbers and Sherwood estimated for guar solutions. .................. 128 Table 4.14 Oscillatory Reynolds numbers and Sherwood estimated for pectin solutions. ................ 130 Table 4.15 Oscillatory Reynolds numbers and Sherwood estimated for CMC solutions. ................. 133 Table 4.16 OMTC for guar, CMC and pectin are compared at the highest concentration used. ....... 137 Table 4.17 OMTC for CMC and pectin are compared at different concentration. ........................... 138 Table 4.18 OMTC for guar and pectin are compared at different concentrations. ............................ 139 CHAPTER 5 - STARCH DIGESTION IN THE SIM
Table 5.1 Experimental conditions used for starch digestion. ......................................................... 147 Table 5.2 Kinetic constant based on first order reaction behaviour ................................................. 150 Table 5.3 Rates of absorption and overall mass transfer coefficient (OMCT) for two food models. 154 Table 5.4 Experimental conditions used for starch digestion. ......................................................... 158 Table 5.5 Digestion and absorption rates for experimental conditions in the SIM. .......................... 160 Table 5.6 Experimental conditions for starch hydrolysis in the SIM ............................................... 162

xxi
Table 5.7 Percentage of starch digested after 120 minutes .............................................................. 167 Table 5.8 Rate of absorption and Overall Mass Transfer Coefficient at various starch concentrations....................................................................................................................................................... 170 Table 5.9 Rate of absorption and Overall Mass Transfer Coefficient at various concentrations of guar. Concentration in the lumen side at enzyme saturation was 31.35 mM. ........................................... 173 CHAPTER 6 - MIXING PROCESSES IN THE SIM
Table 6.1 Experimental conditions for studying flow patterns of the dye in the SIM ....................... 179 Table 6.2 Experimental conditions used for PEPT ......................................................................... 192 Table 6.3 Flow velocities along the x-axis estimated in the SIM by PEPT ...................................... 204 CHAPTER 7 – ENCAPSULATION OF ACTIVES
Table 7.1 Experimental conditions used for building gel particles. ................................................. 209 Table 7.2 Ca-alginate particles formulation and entrapment efficiency (EE) ................................... 210 Table 7.3 Particle size and EE of the standard and alginate core liposomes .................................... 217

1
CHAPTER 1 - INTRODUCTION
1.1 Obesity overview - challenges
According to the latest report from the World Health Organization (WHO) rates of obesity
have more than doubled during the past three decades in virtually every country around the
world. With approximately 1.5 billion people being overweight and over 375 million adults
identified as clinically obese, the problem is reaching epidemic levels with substantial
economical implications (WHO, 2011). Consistent with this global trend, the prevalence of
obesity has been also found to be dramatically increasing in the UK (Yurgin et al., 2008).
Whilst less that 10% of the UK population was classified as obese in 1980, this figure is
expected to have grown to 60% by 2050, with an estimated cost to the National Health
Service (NHS) of about 6.5 billion pounds per annum (Foresight, 2007). One of the biggest
concerns is that this condition is becoming more common in children under the age of five
(WHO, 2011). Although several policies are being proposed to reduce and reverse these
trends, at present, no country in the world has a comprehensive, long-term strategy to deal
with the challenges posed by obesity (Foresight, 2007).
Health implications. Being overweight or obese increases the risk of a wide range of chronic
diseases raising levels of morbidity and mortality and reducing the lifespan by up to nine
years (Johnstone, 2010). People who are overweight (Body Mass Index, BMI ≤ 25) or obese
(BMI > 30) are susceptible to develop depression, type 2 diabetes, hypertension,
cardiovascular diseases (stroke) and in some cases even cancer (WHO, 2011, Foresight,
2007). Latest studies also suggest a correlation between obesity and the risk of developing
neurological diseases (Scott, 2011, Profenno et al., 2010). Thus, obese people are more
susceptible to develop Alzheimer’s disease than slim people (Scott, 2011). Although obesity

Chapter 1- Introduction
2
can be prevented, the combination of the modern lifestyle, physical inactivity and the
availability of high caloric foods in the market makes it difficult to reduce and reverse the
incidence of people under this condition.
Foods in a hectic life. Nowadays, as a result of lifestyles with less time to prepare or eat our
own food at home, most people are eating more highly-processed and easy-to-cook foods;
adding saturated lipids and rapidly digested carbohydrates on their daily diets. According to
different studies, when rapidly digested carbohydrates and refined sugars are included in diets
on a daily basis, blood glucose and insulin responses could be enhanced, resulting in
detrimental health effects (Norton et al., 2006, Englyst et al., 1999, Read and Welch, 1985).
To avoid this scenario, food and pharmaceutical industries face a new challenge to develop
novel food and drug formulations with structural and functional properties to prevent and
reduce obesity worldwide.
In an effort to do this, foods with reduced fat and sugars have been designed. These
ingredients can be substituted with fibres, modified starches and natural or artificial
sweeteners to reduce the caloric content of the food. By using fat replacers, for example, the
energy density of foods can be potentially reduced. It has been reported that a reduction in the
proportion of fat in the diet by 10% can result in a corresponding decrease of 238 kcal per
day of the total energy intake and can produce a weight loss of approximately 3.2 kg (Jones
and Jonnalagadda, 2005). Fat replacers on the market encompasses carbohydrates-, protein-
and fat-based fat replacers (Jones and Jonnalagadda, 2005).
On the other hand, sugars have been substituted with natural and artificial sweeteners.
Natural sweeteners include polyols (sugar alcohols), e.g. sorbitol, xylitol, mannitol or extracts

Chapter 1- Introduction
3
from plants such as Stevia rebaudiana and glycyrrhizin from licorice root. Artificial
sweeteners are 100 to 25,000 times sweeter than sucrose with low caloric values, such as
aspartame, acesulfame K, sucralosa, neotame and saccharin (Samra and Anderson, 2005). As
fat substitutes, the replacement of sugars with artificial sweeteners has a substantial impact on
the intake of calories (Norton et al., 2006). For example, the caloric values of the most
frequently used sugar replacers range from 1.6 to 3.0 calories per gram whereas sugar and
most other carbohydrates provide up to 4 calories per gram, having little or no effect on blood
glucose and insulin levels. As a result, a variety of foods with low- or free- fat and sugar can
be found in the market.
Furthermore, potassium has been used as an alternative to reduce sodium intake levels in
foods to decrease conditions such as hypertension (Gyu-Hee, 2011). Nevertheless, it has a
bitter taste that limits its use. Based on that, research has focused on the development of salt
substitutes and their applications in foods (Braschi et al., 2009, Horita et al., 2011).
Regardless of all this effort, these products tend to be unsuccessful in the marked because of
their flavour and texture (Norton et al., 2006) and their effect on satiety is still controversial
(Bellisle and Perez, 1994). In addition, new drugs that can help to regulate appetite control
and energy intake might be developed with no side-effects that can limit the efficacy of
current treatments.
The above figures emphasize the importance to develop high quality foods with specific
health benefits. Nonetheless, these new developments cannot be achieved without a
fundamental understanding of the impact that food formulation and structure has on human
digestive processes. As a consequence, food digestion and absorption must be evaluated by

Chapter 1- Introduction
4
considering the physical processes occurring in the gastrointestinal tract. This is a crucial step
in the design of food and drug formulations that can deliver nutrients or active molecules at
specific time and location i.e. controlled and sustainable release.
Through this thesis, the term ‘active molecules’ or ‘actives’ refers to compounds present in
food or drug formulations that have physiological functions; providing health benefits to the
consumer. Some examples are vitamins, antioxidant and probiotics. Due to their importance
on human physiology, a better fundamental understanding of actives absorption is crucial to
develop novel foods for specific applications.
Structured foods opportunity. Processed foods could be structured to control the rate of
release of certain nutrients or slow the rate of stomach emptying, which would limit the
amount of food that people could consume (Foresight, 2007). For instance, by adding soluble
fibres such as guar gum, β-glucans, pectin and insoluble fibres into food systems it may be
possible to reduce the risk of insulin intolerance and type 2 diabetes by changing the
absorption rate of molecules such as glucose into the blood (Norton et al., 2006, Brennan,
2005, Blackburn et al., 1984, Jenkins et al., 1978). Minekus et al. (2005) have demonstrated
that by adding guar gum to a low fat yogurt, cholesterol levels were reduced. Individual
macronutrients could also control the rate of digestive processes influencing satiety and
condition the absorption of nutrients (Johnstone, 2010). To do this successfully will however
require new approaches to food processing and manufacturing.
Since food formulation has a large influence on the rate of food digestion and absorption,
special interest is shown in this project to understand the effect that food formulation has on
digestion. This is quite challenging because it is not easy to evaluate the performance of

Chapter 1- Introduction
5
foods under in vivo (in the human body) digestion and absorption processes. These
limitations could be overcome by using realistic models in vitro that are able to reproduce the
physiological conditions found in the gastrointestinal tract, taking into account motility and
fluid dynamics of the lumen content. There are similar challenges for the pharmaceutical
sector, i.e. the design of oral drug delivery vehicles which effectively carry drugs from the
mouth to the small intestine. The interests of food and pharma industries thus coincide.
Overall, the development of new food and pharmaceutical formulations must be driven by a
better understanding of the processes by which products are digested and absorbed in the
body, combined with knowledge of the release and absorption of the nutrient in the
gastrointestinal tract. Since most of the absorption takes place in the small intestine this work
is focus on the digestive processes that occur there.
1.2 Mass transfer phenomena in the small intestine
In engineering, molecular and convective transport phenomena can be described by mass
transfer. Mass transfer operations have been widely studied in a variety of chemical
applications both to separate molecules from one phase to another and to increase the rate and
yield of chemical reactions. Mass transfer phenomena are also important in the scale-up of
processes and in their control and optimization. Likewise, mass transfer concepts can be also
applied to physiological processes. For example, in the intestine actives absorption can be
modelled using diffusion and mass transfer coefficients. In this context, the present research
combines mass transfer theory with relevant aspects of gastrointestinal physiology to increase
understanding of the impact that food formulation and structure has on the digestion and
absorption rates inside the body.

Chapter 1- Introduction
6
1.3 Objectives The main objective of this work was to understand the physicochemical phenomena
occurring during food digestion by using a dynamic in vitro Small Intestine Model (SIM). Of
particular interest was to study the effect of mixing and food formulation on starch hydrolysis
and glucose absorption by:
Modelling of the processes underway in flow and digestion
Estimating the mass transfer coefficients between bulk and wall as a function
of mixing and food formulation
Describing flow patterns in the SIM using flow visualization techniques
In addition, an attempt was made to use novel coating structures to reduce the rate of actives
digestion and absorption throughout the epithelium.
Release of encapsulated actives was studied under controlled conditions, similar to those
found in the small intestine. A development of an efficient way of encapsulating actives was
also tested to make the structures.
This work provides insight into the role of mixing on enhancing mass transfer on the course
of digestion-absorption processes and also the action of viscous polysaccharides on the delay
or reduction of glucose absorption in the small intestine. The end results will be a better
understanding of the factors which control the development of new functional food which
could be applied both in academia and industry.

Chapter 1- Introduction
7
1.4 Thesis layout
Chapter 2. Literature review
The chapter presents an overview of the fundamental aspects of the gastrointestinal
physiology along digestion and absorption processes. A comprehensive review of the models
developed to study these phenomena are also included. As digestion and absorption would be
studied from an engineering perspective, relevant concepts of fluid dynamic and mass
transfer are briefly discussed in this chapter. The last part is related to the impact that
structured foods such as viscous liquids and encapsulated actives may have on the delivery of
nutrients in the small intestine.
Chapter 3. Materials and methods
A list of the materials and a description of the common experimental techniques used through
this project is included in this chapter.
Chapter 4. Absorption of actives in the SIM
This chapter is related to absorption processes in the SIM, studying mass transfer in single
phase liquids. The chapter is divided into two sections related to: (i) the impact of mixing on
mass transfer coefficient and (ii) the effect that wall movements or segmentation contractions
(frequency) has on glucose absorption. To visualize the effect of food formulation and mixing
on glucose absorption techniques such as Planar Laser Induced Fluorescence (PLIF) and
Positron Emission Particle Tracking (PEPT) were also used (Chapter 6).
Chapter 5. Digestion and absorption in the SIM
This chapter describes a set of experiments that include both chemical digestion and actives
absorption in the SIM. The main objective of this chapter was to investigate the effect of

Chapter 1- Introduction
8
increasing viscosity of digesta on starch hydrolysis and glucose absorption. Furthermore,
parameters such as enzyme and substrate concentration were studied to evaluate starch
kinetics within the model system.
Chapter 6. Mixing processes in the SIM
A description of the experiments performed with PLIF and PEPT to study the fluid flow
inside the SIM is included in this chapter. Parameters such as viscosity and mixing were
investigated. PEPT has also been used to determine the velocity field in the system and
suggest what velocities of lumen content may occur (using a free tracer particle).
Chapter 7. Encapsulation of actives
The seventh chapter covers the production of micro- and nano-capsules for controlled release
of encapsulated actives. The first section focuses on gelled particles, including morphology,
entrapment efficiency and in vitro release whereas the second section describes the results of
producing multilamellar liposomes for control release of proteins. The physicochemical
properties of the standard liposomes are compared with gelosomes for stability and control
release.
Chapter 8. Conclusions and future work
The conclusions and recommendations for future work are summarized in Chapter 8.
1.5 Publications and Conferences
The results from this work have been published and presented at different forums as
described below.

Chapter 1- Introduction
9
Publications Monica R. Jaime-Fonseca, Serafim Bakalis and Peter J. Fryer. 2011. Starch hydrolysis
and glucose absorption in the small intestine. ICEF 11 Proceedings.
Alan M. Smith, Monica R. Jaime-Fonseca, Liam M. Grover, and Serafim Bakalis.
2010. Alginate-Loaded Liposomes Can Protect Encapsulated Alkaline Phosphatase
Functionality When Exposed to Gastric pH. Journal of Agricultural and Food
Chemistry, 58, 4719-4724. DOI: 10.1021/jf904466p.
M. R. Jaime-Fonseca, A. Tharakan, I. Norton, P. J. Fryer and S. Bakalis. 2009. An in-
vitro small intestine model for studying absorption of encapsulated actives, ISFRS 2009
Proceedings, 196-199.
A. M. Smith, L. M. Grover, M. R. Jaime-Fonseca, F. Yahya, and S. Bakalis. 2009.
Encapsulation and stability of Bioactive Proteins in Gel loaded Liposomes, ISFRS 2009
Proceedings, 564-565.
S. Bakalis, A. Tharakan, M. R. Jaime-Fonseca, P.J. Fryer and I.T. Norton. 2009.
Modelling of Physical Processes in the Small Intestine. In: Gums and Stabilisers for the
Food Industry 15, 377-383.
Conferences ICEF 11, Athens, Greece, 24-28 May 2011. Starch hydrolysis and glucose absorption in
the small intestine. Monica R. Jaime-Fonseca, Serafim Bakalis and Peter J. Fryer.
BerlinFOOD 2010, Berlin, Germany, 8-10 September 2010. An in-vitro small intestine
model to study glucose absorption, Monica R. Jaime-Fonseca. Serafim Bakalis and Peter
J. Fryer.
15th Gums & Stabilisers for the Food Industry Conference, Wrexham, UK, 22 - 25
July 2009. Modelling of Physical Processes in the Small Intestine. S. Bakalis, A.
Tharakan, M. Jaime-Fonseca, P.J. Fryer and I.T. Norton.
Chapter 1- Introduction
10
3rd Alban Conference, Porto 19-20 June 2009. Glucose absorption in an in-vitro small
intestine model. Monica R. Jaime-Fonseca, Peter J. Fryer and Serafim Bakalis.
ISFRS, Zurich, Switzerland, 15 -18 June 2009. An in-vitro small intestine model for
studying absorption of encapsulated actives. M. R. Jaime-Fonseca, A. Tharakan, I.
Norton, P. J. Fryer and S. Bakalis.
ISFRS, Zurich, Switzerland, 15 -18 June 2009. Encapsulation and stability of Bioactive
Proteins in Gel loaded Liposomes. A. M. Smith, L. M. Grover, M. R. Jaime-Fonseca, F.
Yahya, and S. Bakalis.
Food Processing Faraday Fasttrack Awards, York, UK, 19 May 2009. Development
of self-assembling bioactive particles to release the health benefits of nutraceuticals.
Monica R. Jaime-Fonseca, Alan M. Smith, Liam M. Grover and Serafim Bakalis.
CoFe'09, Columbus Ohio, USA 5 - 8 April 2009. Mass transfer of glucose in an in-vitro
small intestine model. M. R. Jaime-Fonseca, P. J. Fryer and S. Bakalis

11
CHAPTER 2 - LITERATURE REVIEW
2.1. Introduction
As mentioned in Chapter 1, predicting the extent of food digestion and absorption in the
gastrointestinal tract is essential to the selection and development of structured foods that are
inherently healthier. To predict the in vivo performance of food after ingestion, it is crucial to
establish the physiological and physicochemical factors affecting chemical reaction and
absorption processes in the human body. This chapter describes the literature related to
digestion and absorption in the gastrointestinal (GI) tract and the physicochemical
phenomena involved from an engineering perspective. Firstly, an overview of the GI tract is
presented. Special interest is given to the physiology of the small intestine, describing the
fluid dynamics and mixing processes taking place in it. Food digestion and actives absorption
principles are also included, followed by a description of the models developed to study these
phenomena in vivo, in vitro and in silico. Secondly, as the small intestine can be considered
as a tubular bioreactor in which enzymatic reactions occur, an overview of the basic
principles of fluid flow and chemical reactions is given. Finally, a description of how food
structure and formulation influence the rate of digestion and absorption in our body is
included; highlighting the effect that encapsulation techniques and encapsulated structures
have on the release of active components.
2.2. Gastrointestinal Tract overview
Details of the physiology of the GI tract can be found in Guyton and Hall (2006), Levy et al.
(2006) and Widmaier et al. (2006), and from which most of the discussion below has been
taken. Few studies have considered the role of the GI tract in an engineering way, and these
will be discussed later. The human GI tract is a highly regulated multistage system in which

Chapter 2 - Literature review
12
solid/liquid foods are processed, dissolved and broken down into small molecules that can be
easily absorbed through the epithelial cells and then into the bloodstream. Once ingested,
food undergoes a series of unit operations that allow the bodies’ energy requirements to be
met. These operations take place in four distinctive reactive sections of the GI tract; mouth,
stomach, small and large intestine, as shown in Figure 2.1.
Each compartment has a specific function and similar purpose; to maximize digestion and
absorption in the GI tract. The next section presents a brief description of the GI tract organs
and processes involve on food digestion.
Figure 2.1 Scheme of the gastrointestinal tract.
2.2.1 Mouth
Food digestion starts in the mouth (Figure 2.2), an oral cavity, in which foods are reduced in
size by the teeth through chewing cycles that increase the surface area available for digestion.
The number of chewing cycles not only varies among individuals but also according to the
food characteristics and structure (van der Bilt, 2009). During mastication, food particles are

Chapter 2 - Literature review
13
mixed with saliva produced by three pairs of major glands: parotid, submandibular and
sublingual glands (Figure 2.2).
Figure 2.2 Diagram of the side view of the structure of the mouth.
Saliva, a complex dynamic biological fluid, is mainly composed of water (99.5%), proteins
(0.3%) and inorganic and trace substances (0.2%) (van Aken et al., 2007). Proteins and
inorganic components in saliva are mainly: glycoproteins such as mucins, proline-rich
glycoproteins; enzymes (α-amylase, carbonic anhydrase); immunoglobulins; peptides
(cystatins, statherin, histains) and electrolytes (sodium, potassium, chloride and bicarbonate).
Secretion of saliva ranges from 0.3 to 7.0 ml of saliva per minute with about 0.5 - 1.5 litres of
saliva secreted per day and a pH from 6.2 to 7.4 (van Aken et al., 2007). Saliva is a non-
Newtonian fluid and its viscosity decreases upon increasing shear rate. Rheological properties
of saliva are consistent with the behaviour of a weak gel in which a liquid, gaseous and gel
phases coexists simultaneously (van Aken et al., 2007). This behaviour stimulates flavour
perception and lipid melting phase occurring at the first stages of mastication (Norton et al.,
2006, Taylor and Linforth, 1996).
During mastication, water present in saliva moistens and dissolves the food to help further
digestion whereas mucus composed of mucins functions as a glue to bind food tiny particles

Chapter 2 - Literature review
14
into a smooth paste called ‘bolus’ that can be easily swallowed. Salivary amylase, on the
other hand, starts the digestion of the starch contained in food.
Once swallowed, the bolus is transported into the stomach through the pharynx and
oesophagus by peristaltic waves. Although these elements of the GI tract do not contribute
directly to the digestion process, they play an important function in transporting the bolus
from the mouth to the stomach.
2.2.2 Stomach
The stomach functions as a storage vessel in which the bolus is partially ground and
combined with digestive juices secreted by gastric glands. Anatomically, the stomach can be
divided into four major sections: fundus, body, antrum and pylorus (Figure 2.3).
Figure 2.3 Diagram of the stomach showing the different sections (Widmaier et al., 2006).
The fundus and the body integrate the proximal part of the stomach, where large volumes of
food (1.5 - 4.0 litres) can be stored for long periods of time (3 - 4 hours) (Kong and Singh,
2008a). As long as food is in the stomach, peristaltic constrictor waves occur in the proximal
region of the stomach. Nevertheless, these waves are normally weak, occurring once every 15
Fundus
Body Pylorus
Antrum
Esophagus
Doudenum

Chapter 2 - Literature review
15
or 20 seconds, i.e. much of the gastric contents remain unmixed for long periods as shown by
the echoplanar magnetic resonance images (Marciani et al., 2001). The antrum, or distal
stomach, functions as a grinder-mixer-pump. Here contractions are vigorous, compressing the
food several times into the stomach walls, reducing food particle size and mixing the contents
of the stomach by ‘retropulsion’. The resulting mixture of food and gastric juices is called
“chyme”; a semi fluid paste with varied rheological properties that contains molecular
fragments of proteins, polysaccharides and fat droplets (Widmaier et al., 2006). Finally, the
antral section of the stomach propels chyme into the upper part of the intestine by means of
the pylorus through the pyloric valve (Figure 2.3).
Motility in the stomach is not only fundamental for mixing enzymes and substrates but also
to control the passage of chyme. The residence time of food inside the stomach depends on
its composition and physical properties (Kong and Singh, 2008a). In the stomach foods are
‘classified’ according to their density or particle size: liquids are located in the antrum
whereas solid particles and lipids are mainly placed in the body of the stomach (Schulze,
2006). That means that the stomach serves like a sieve where liquid and small particles leave
the stomach more quickly than larger ones. Large particles move through the stomach more
slowly than smaller ones, since they have to be small enough, less than 2.0 mm, to pass the
pyloric valve between the stomach and the next compartment of the GI tract: the small
intestine (Hunt, 1983). In healthy individuals, the half-emptying time for non-nutrients
liquids is around 20 minutes (Camilleri, 2006). In contrast, solids are retained selectively in
the stomach for “churning” or trituration by the high shearing forces set up by contractions in
the antrum as solids are propel toward the closed pylorus. As result of trituration, solid foods
are emptied after their size has been reduced to 2.0 mm (Camilleri, 2006).

Chapter 2 - Literature review
16
Gastric emptying into the intestine is regulated in response to the nature of duodenal contents
and is influenced by several factors including the volume, consistency and fat content.
Gastric emptying of solids is a two-phase process: an initial lag or retention period followed
by a generally linear postlag emptying phase (Camilleri, 2006). The stomach empties solids
completely after approximately 3 - 4 hours. Motor and digestive processes are modulated by
several hormones, including gastrin, cholecystokinin (CCK) and glucose-regulating
hormones such as insulin, glucagon and incretins (Camilleri, 2006). Gastric content is
delivered to the duodenum through a negative feedback mechanism mediated by duodenal
receptors (Kong and Singh, 2008a) at a rate of 200 kcal per hour (Hunt, 1983, Camilleri,
2006). Although controversial, it has been reported that increasing the viscosity of liquid
meals delays gastric emptying and increases satiety (Kong and Singh, 2008a).
Within the stomach, protein and lipid digestion starts as a result of pepsins and gastric lipases
respectively. Meanwhile, starch digestion by salivary amylase continues until the acidic
environment of the stomach inhibits the hydrolytic action of this enzyme - that can be up to
an hour after food enters the stomach. Gastric secretion (2 - 3 litres per day) contains about
0.8 to 1.0 mg/ml pepsin and about 1.5 mg/ml of mucin (Kong and Singh, 2008a).
Furthermore, about 2.0 L of hydrochloric acid are also secreted in the stomach per day
increasing the concentration of hydrogen ions in the lumen of the stomach up to ~150 mM
(Widmaier et al., 2006). Secretion of HCl causes a reduction in the pH of the stomach and
food proteins unfolding. Gastric secretion is a viscous fluid with viscosity in the range of 0.01
to 2.0 Pa.s and density close to the density of water. Under fasten conditions, the rate of
gastric secretions is approximately 1.0 mL/min, increasing from 10 to 50 mL/min
immediately after food digestion (Kong and Singh, 2008a). Gastric pH varies from 2.0-

Chapter 2 - Literature review
17
6.5/7.0 depending on food and phase of gastric emptying. Increase in food amount, protein
content and meal viscosity increases secretion.
2.2.3 Small intestine
The small intestine, the focus of this thesis, is responsible for most of the digestion and
absorption through the epithelial cells that line it’s surface. Comprised of the duodenum,
jejunum and ileum (Figure 2.4), the small intestine is the longest part of the GI tract, reaching
a length between 2 and 6 meters (Guyton and Hall, 2006). The external diameter of the gut is
on average 2.5 cm, varying from 5 cm in the upper portions of the duodenum to less than 2
cm in the distal ileum (Stoll et al., 2000). The duodenum, the upper part of the small intestine,
is a tubular organ with muscular walls in which chyme is mixed with biliary and pancreatic
secretions from the liver and pancreas (sections 2.2.5 and 2.2.6), employed for digestion and
emulsification of lipids, respectively. Normally, most of the chyme is digested and absorbed
in the first segments of the small intestine, in the duodenum and jejunum (Widmaier et al.,
2006).
Figure 2.4 Diagram of the stomach and small intestine
Within the duodenum, the acidic chyme (pH ~2.5) from the stomach is initially neutralized
with sodium bicarbonate from the pancreas to avoid denaturalization of the digestive

Chapter 2 - Literature review
18
enzymes. Once neutralized (pH ~ 6.5), the chyme is mixed with hydrolytic enzymes present
in the pancreatic secretions: proteases, amylases and lipases that continue the digestion of
proteins, carbohydrates and lipids, respectively. In the small intestine, approximately 8.0 L of
ingested and secreted water enter per day, however, only 1.5 L pass on the large intestine
because almost 80% of the fluid is absorbed in the small intestine (Widmaier et al., 2006). All
these processes are highly regulated by hormones and neural mechanisms (Levy et al., 2006,
Widmaier et al., 2006).
As in the stomach, motility enhances chemical reactions and brings partially digested
molecules such peptides and oligomers to the brush border of the intestinal wall where
digestion is completed by the enzymes present on the intestinal wall. These biopolymers are
broken down into simple molecules; aminoacids and monosaccharides for further absorption.
Contractions of the duodenum typically follow gastric antrum contractions, preventing
regurgitation of duodenal contents into the stomach. The flow and mixing of chyme in the
intestine, the main area of interest of this research, is determined by the movements of the
muscle layers described in detail in section 2.3.1. Analysis of this flow should be done by
formulation of the equations that govern muscle movement and chyme rheology (Macagno
and Christensen, 1980).
The small intestine transport solids and liquid at approximately the same rate. As a result of
the lag phase for the transport of solids from the stomach, liquids typically arrive in the
intestine before solids. However, it takes about 150 minutes for half the solid and liquid
chyme of similar caloric density to traverse the small bowel (Camilleri, 2006). It is believed
that complex carbohydrates or fat that reach the distal part of the small intestine serves as
feedback control of proximal intestinal motility (Camilleri, 2006).

Chapter 2 - Literature review
19
2.2.4. Large intestine
The last stage of digestion is the large intestine (colon) in which the remaining water from
indigestible food matter is absorbed and unusable food matter (wastes) is stored and finally
eliminated from the body.
Figure 2.5 shows the anatomical structure of the large intestine. The major sections of the
large intestine consist of ascending, transverse, descending, and sigmoid portions. The
ileocecal valve of the ileum in the small intestine moves material into the large intestine at the
caecum. The portion of the ileum containing the ileocecal valve projects slightly into the
caecum. Increases in colonic pressure squeeze the valve shut, whereas increases in ileal
pressure open it, therefore effectively preventing reflux of colonic contents into the ileum
(Guyton and Hall, 2006). Material passes through the ascending, transverse, descending and
sigmoid portions of the colon and finally enters into the rectum where the undigested material
is excreted from the body. The large intestine removes about 90% of the fluid, it converts
1000-2000 ml of isotonic chyme that enters it each day from the ileum, to about 200 - 250 ml
of semisolid waste.
Figure 2.5 Diagram of the large intestine

Chapter 2 - Literature review
20
Accessory organs of the GI tract
Digestive secretions such as saliva, salts and the enzymes required by the GI tract are
produced by accessory organs: salivary glands, liver, gallbladder and pancreas as discussed
below.
2.2.5 Liver and gallbladder
The liver (Figure 2.6), located in the upper right portion of the abdomen is in charge of a
variety of endocrine and exocrine functions. As only the latter are directly involved in
gastrointestinal functions, this section focuses on the exocrine functions of the liver. The
hepatic function most important to the digestion is the synthesis and secretion of bile. Bile
contains bicarbonate ions, cholesterol, phospholipids, bile pigments, and most important for
digestion, bile salts; essential for both digestion and absorption of lipids. Between meals, bile
is stored in the gallbladder, a small sac underneath the liver that branches from the common
hepatic duct (Widmaier et al., 2006). The gallbladder is an active storage vessel of
approximately 8 cm lengthwise and 4 cm in diameter (Figure 2.6), which absorbs mineral
salts and water received from the liver and converts it into a thick, mucus substance called
"bile", to be released when food is present in the stomach (Levy et al., 2006). During
digestion, the smooth muscles in the gallbladder wall contract, causing the concentrated bile
solution to be injected into the duodenum via the common bile duct, an extension of the
common hepatic duct (Figure 2.7) (Widmaier et al., 2006, Guyton and Hall, 2006).

Chapter 2 - Literature review
21
Figure 2.6 Accessory organs of the GI tract (Widmaier et al., 2006)
2.2.6 Pancreas
The pancreas is an elongated gland of 12.5 – 15.0 cm of longitude located behind the
stomach. Like the liver, pancreas has both endocrine and exocrine functions. The exocrine
portion of the pancreas secretes into the duodenum digestive enzymes (Levy et al., 2006) and
a fluid rich in bicarbonate ions via the pancreatic duct. From the pancreas amylase is secreted
via the pancreatic duct and then common bile ducts (Figure 2.7) into the duodenum where it
plays an important role in digestion of complex carbohydrates.
Figure 2.7 Pancreatic and bile ducts responsible for feeding digestives fluids into the duodenum (Widmaier et al., 2006).
Duodenum
Pancreaticduct
Gallbladder
Common bile ductfrom gallbladder
Pancreas
Duodenum
Stomach
Pancreas
Gallblader
Liver
~ 3 cm
~ 12.5 cm
Chapter 2 - Literature review
22
Since the small intestine is a crucial step in the digestion and absorption of essentially all
dietary organic molecules, this work is focused on reproducing the physical and chemical
phenomena occurring in the human small intestine. The following section describes in detail
the physiological digestive and absorptive functions of the small intestine and the fluid
dynamics occurring there as a result of propulsion and mixing movements during food
digestion.
2.3 Food digestion and actives absorption processes
Food digestion involves two types of processes: (i) mechanical digestion, related to the
motility process that promote food mixing and displacement thought the GI tract and (ii)
chemical digestion, responsible for the catabolic reactions that breakdown proteins, lipids
and carbohydrates into small molecules that could be absorbed by the cell membranes.
2.3.1. Mechanical digestion: propulsion and mixing in the small intestine
Fluid motion within the small intestine is generated by three movement patterns: (i)
peristalsis, (ii) segmentation and (iii) pendular movements (Macagno and Christensen, 1980).
Peristalsis and segmentation are basic electrical rhythm movements that cause contractions of
the circular muscle layer of the intestinal wall. Peristaltic contractions spread along down the
intestine whereas segmentation contractions are stationary and local. Pendular movements, on
the other hand, cause retropulsion of lumen contents with a characteristic back and forth
pattern. Peristalsis and segmentation will be reviewed in detail in sections below.
2.3.1.1 Peristalsis
Peristalsis is the progressive contraction of successive sections of circular smooth muscle.
Peristaltic waves occur in the small intestine involving a very short segment of intestine.

Chapter 2 - Literature review
23
Slow waves and action potentials determine the frequency and force of intestinal contractions
(Levy et al., 2006). Peristalsis propels chyme through the small intestine in about 3 - 6 hours
(Liu et al., 2003) with an average velocity of 1.0 cm per minute (Guyton and Hall, 2006).
2.3.1.2 Segmentation
Mixing contractions or segmentation occur when a section of the small intestine becomes
filled with digesta; as a result, a localized concentric contraction takes place in the gut as
shown in Figure 2.8 (Guyton and Hall, 2006). This process is repeated at spaced intervals
along the intestine and is responsible for the fluid dynamics of its contents. Segmentation,
unlike peristalsis, produces mixing of the intestinal content with little net flow. Consequently,
segmental contractions create a continuous division and subdivision of the intestinal content
modifying concentration gradients of any substance in the chyme (Macagno et al., 1982).
Although these type of contractions are only a few cm long and the contraction last a few
seconds (Widmaier et al., 2006), the effect that mixing has on mass transfer phenomena
occurring in the intestine may be significant. Furthermore, nutrient absorption could be
modified in different ways, increasing, for example, as a result of the intestinal wall
movements (Nguyen et al., 2008, Udaykumar et al., 2006, Macagno et al., 1982). Intestinal
contractions create turbulence and convection currents, which mix the luminal content
bringing material from the centre of the lumen to the epithelium (Macagno et al., 1982,
Edwards et al., 1988). Actives have to diffuse across a thin relatively unstirred layer of fluid
lying adjacent to the epithelium (Blackburn et al., 1984).

Chapter 2 - Literature review
24
Figure 2.8 Segmentation movements in the small intestine (Guyton and Hall, 2006)
In humans, these regular slow waves occur all along the small intestine at a frequency of 11 -
13 per minute in the duodenum which declines along the length of the small bowel to a
minimum of 8 - 9 per minute in the terminal part of the ileum (Levy et al., 2006). The slow
waves may be accompanied by bursts of action potential spikes. Action potential bursts are
localized to short segments of the intestine, promoting the highly localized contractions of the
circular smooth muscle that cause segmentation. Major mixing and propulsive movements of
the small intestine take place as a consequence of action potentials that stimulate much
stronger contractions of the smooth muscle (Levy et al., 2006).
2.3.2 Chemical digestion in the small intestine
As chyme enters the small intestine and flows axially down, macromolecules such as
proteins, lipids and carbohydrates are digested (into amino acids, fatty acids and
monosaccharides, respectively) by the action of enzymes present in the gastrointestinal
secretions as described in following sections.
~ 3 cm
~ 3 cm

Chapter 2 - Literature review
25
2.3.2.1. Protein digestion
Most protein digestion occurs in the stomach and the upper part of the small intestine. In the
stomach digestion of proteins is accomplished by the acidic enzyme pepsin within a working
pH range from 3.3 to 5.0. Pepsin is secreted into the stomach in the form of an inactive
precursor (pepsinogen). Exposure to low pH, by secretion of hydrochloric acid in the lumen
of the stomach causes conversion of pepsinogen to active pepsin (Widmaier et al., 2006).
Pepsin secretion in adults has been estimated between 20 - 30 kUnits of enzyme activity at
37 °C and 24 hours (Wickham et al., 2006). Although gastric pepsins are essential for the
digestion of proteins, this step only provides 10 to 20% of the total protein digestion (Guyton
and Hall, 2006). More extensive hydrolysis of proteins occurs in the upper small intestine
where protein digestion continues under the action of proteases from the pancreatic
secretions. The most important proteases segregated into the small intestine are: (i) trypsin
and chymotrypsin which cleave the internal peptidic bonds of proteins, split them into small
polypeptides and (ii) carboxypolypeptidase that produces individual amino acids from the
carboxyl ends of the polypeptides (Guyton and Hall, 2006). At this stage, the main products
of the proteins are di- and tri-peptides that in turn are converted into amino acids by the
peptidases present on the brush border of the small intestine (Figure 2.9).
The efficacy of digestive peptidases in the GI tract depends on protein microstructure and its
molecular interactions with other food constituents (Lundin et al., 2008). For example, in the
case of milk proteins, the open structure of sodium caseinates allows pepsin and trypsin
access to target residues, resulting in rapid proteolysis and faster uptake and absorption of
amino acids during digestion (Guo et al., 1995). In contrast, the compact globular structure of
β-lactoglobulin inhibits enzyme access to potential cleavage sites and therefore the protein is
considerably more resistant to hydrolysis. However, changes in conformation and structure

Chapter 2 - Literature review
26
induced by heating or changes in pH make β-lactoglobulin susceptible to peptic hydrolysis
(Guo et al., 1995). Precipitation of casein around the isoelectric point (4.5) has been reported
to result in delayed gastric emptying, while β-globulin, which is not subject to acid
precipitation, empties rapidly into the duodenum (Lundin et al., 2008).
Moreover, molecular interactions between proteins and carbohydrates induced by enzymes
and Maillard reactions may also affect the rate at which proteins are digested in the stomach
and intestine (Lundin et al., 2008). Overall, the rate of protein digestion in the GI tract is
influenced by several factors that must be taken into account to design structured foods that
could impact on satiety and weight regulation.
2.3.2.2 Lipids
Digestion of lipids, triglycerides in a normal diet, starts by the action of lingual and acid-
stable gastric lipases secreted in the mouth and the stomach, respectively. Once in the
duodenum, lipids are converted into 2-monoglycerides and fatty acids by the action of
pancreatic lipase in the presence of surface active bile salts (Guyton and Hall, 2006). During
food digestion, between 200 and 250 mg of pancreatic lipase are secreted to convert all the
ingested fat (Lundin et al., 2008).
Since lipids are slightly soluble in water they have to be ‘pre-processed’ before they can
interact with the pancreatic lipase. As such, a crucial step for fat digestion involves the
mechanical breakdown of fat globules into small particles that the water-soluble digestive
enzymes can act on. This process is called emulsification of the fat, and it begins in the
stomach by mixing the fat with the products of stomach digestion. Then, most of the
emulsification occurs in the duodenum under the influence of bile from the liver. Bile

Chapter 2 - Literature review
27
contains a large quantity of bile salts as well as the phospholipid lecithin that form micelles
with lipids. Once fatty acids are released and emulsified with bile, they can cross the
epithelium for absorption.
As with proteins, the rate of lypolysis is highly influenced by the structure of the emulsion
formed in the stomach, one of the crucial factors on fat digestion is the emulsion surface area
(Lundin et al., 2008). For example, in gastric aspirates the lypolysis of a fine emulsion was
almost three-fold faster than a coarse emulsion (Armand et al., 1999). Understanding the
interaction of emulsions with gastrointestinal environments will enable to develop and design
emulsions with specific structures and health benefits in vivo.
2.3.2.3 Carbohydrates - main source of energy
Major sources of carbohydrates within a normal human diet are; sucrose, a disaccharide from
the cane sugar, lactose from milk and starch from cereals, roots and tubers (Guyton and Hall,
2006). Starch can represent up to 80% of the carbohydrates present in staple foods of
population around the world. Since starch is one of the most important glycemic carbohydrate
components in foods, this section presents a comprehensive overview of its digestion.
As described in section 2.2.1, digestion of starchy food begins in the mouth when particle
food size is reduced and mixed with amylase from the salivary glands. This process continues
until food bolus is mixed with the hydrochloric acid secreted into the stomach inactivating the
salivary -amylase and stopping the reaction. When chyme enters to the duodenum, a more
powerful -amylase in the pancreatic secretions continues the hydrolysis of starch in the
small intestine. The pancreatic -amylase is an endoglycosidase with a molecular weight of
54000 Daltons that cleaves the internal α-1,4 links of the starch structure (Dona et al., 2010).

Chapter 2 - Literature review
28
-Amylase secretions in adults has been reported between 5 to 15 nM with high activities
(Slaughter et al., 2001). The main products of the hydrolysis of starch are: maltose,
maltotriose and -limit-dextrins. These oligosaccharides are completely hydrolysed as
glucose by enzymes present on the brush border (Figure 2.9) of the intestinal surface mainly:
maltase-glucoamylase and sucrose-iso-maltase.
Digestion of starch could be studied as a solid-liquid two phase reaction (Zhang et al., 2009),
where amylase must (i) diffuse into the food matrix, (ii) bind the substrate, and (iii) cleave the
glycosidic linkages of the starch molecules (Leloup et al., 2004). Therefore, any factor
affecting enzyme activity such as quantity, different isoforms, inhibitors, and the
susceptibility of substrate to hydrolytic enzymes will influence starch digestion and the
resulting nutritional properties of the material. Factors affecting the binding of amylase to
starch will also slow down the enzyme reaction. As such, susceptibility of starch hydrolysis
to amylase depends on physical features (Lehmann and Robin, 2007, Englyst et al., 1992),
chemical modifications (Chung et al., 2006, Wolf et al., 1999) and processing degree
(Anguita et al., 2006, Chung et al., 2006). Physicochemical characteristics of starch such as
morphology and particle size, are critical factors on starch digestion and as a consequence, on
glucose absorption (Li et al., 2004, Snow and O'Dea, 1981). Generally, -1,6 glycosidic
bonds are more difficult to cleave compared with -1,4 glycosidic, therefore more -1,6
glycosidic bonds slow starch digestion (Leloup et al., 2004). Amorphous or completely
dispersed starches are highly susceptible to enzyme action. On the other hand, starches that
are physically entrapped, such as B-type, raw starch granules, retrograde amylose and
chemically modified starches are resistant to digestion (Leloup et al., 2004). Starches may
have an intermediate slow digestion pattern if either some degree of physical structure is
retained during food processing or structural aspects slow kinetics of digestion.

Chapter 2 - Literature review
29
Starch digestion rates in particular have been directly correlated to postprandial glucose and
insulin responses (Zhang et al., 2009). Rapidly absorbed sugars and carbohydrates, such as
sucrose, result in high glucose blood levels (Read and Welch, 1985). Healthy people are able
to cope with this condition by adjusting their insulin levels as required. Nevertheless, people
with diabetes either do not produce insulin or are resistant to its action. In the first case, they
need to inject it (type 1 or insulin-dependent diabetes mellitus) while in the second, they can
control their glucose levels with specific diets (type 2 or non-insulin-dependent diabetes
mellitus). In each case they cannot deal effectively with a rapid rise in blood glucose.
During the passage of foods through the gastrointestinal tract, there are other factors that
affect food digestion and absorption including gastric emptying, enzyme inhibitors and
viscosity in the digestive tract affecting enzymes accessibility to substrate and the absorption
of glucose. It is possible that these can be used to generate a slow digestion effect (Zhang et
al., 2009). Overall, the rate at which chemical reactions occurs in the gastrointestinal tract
determinate the release of nutrients from the complex matrix of the digesta.
2.3.3 Absorption of active molecules
Absorption is related to the transport of nutrients or active molecules through the epithelium
(epithelial cells) to the blood stream. Most of the absorption of water and nutrients including
vitamins and electrolytes occurs in the small intestine. The absorption surface area of the
small intestine is roughly 250 m2, as a result of the corrugations of the intestinal wall to
maximize absorption. The intestinal mucosa is a physical and biochemical barrier to
absorption, composed by the three distinctive features as shown in Figure 2.9.

Chapter 2 - Literature review
30
Wall structure. The small intestinal wall consists of the serosa, the muscularis externa
(longitudinal and circular muscle layers), the submucosa and the intestinal mucosa (Figure
2.9). The latter represents the main barrier of the intestinal wall of nutrient and drug uptake
(Deferme et al., 2008). Four layers encompass the intestinal mucosa: (i) surface monolayer,
(ii) basal membrane, (iii) lamina propia and (iv) lamina muscularis mucosa. The laminar
propia layer is composed by conective tissue, nerves, macrophages, mass cells lymphatic and
blood vessels that serves to the transport of substances around the body (Deferme et al.,
2008).
The inner surface of the small intestine is organized into circular or mucosal folds which not
only increase surface area but are hypothesised to act as baffles, mixing the lumen contents
(Peters and Brain, 2009). Extending from the luminal surface into de lumen of the small
intestine are fingerlike projections known as villi. The surface of the each villi is covered
with a layer of epithelial absorptive cells (enterocytes) whose surface membranes form small
projections called microvilli (brush border).
Figure 2.9 Absorptive surface of the small intestine: villi, epithelial cells and microvilli
~0.5 - 1.6 mm ~30 mm

Chapter 2 - Literature review
31
The luminal plasma membrane of the absorptive epithelial cells is a selective barrier to the
passages of molecules. Membrane regulates transport of actives compounds in and out the
membranes surrounding cell organelles (Levy et al., 2006). The transport of molecules across
the epithelial cells located around the villus of the small intestinal wall is a complex process
involving some of the mechanisms described below.
Main mechanisms of transport occurring in the plasma membrane
Transport across the epithelial cells of the small intestine surface can be via different
mechanisms, such as the following (Duchateau and Klaffke, 2009):
(i) Passive diffusion, mechanism driven by a concentration gradient, applicable for small
and lipophilic molecules, e.g. fructose.
(ii) Carrier-mediated transport, for small hydrophilic molecules. Since a carrier protein is
involved, this system is saturable and dependent on a sodium ion gradient. Examples:
luminal monosaccharides such as glucose and galactose are transported by this
mechanisms across the entocyte brush border (Camilleri, 2006).
(iii) Endocytosis, uptake of particles or large macromolecules. It also requires energy, is
slow and limited in capacity, e.g. larger polypeptides.
(iv) Paracellular transport across the tight junctions between adjacent epithelial cell
characteristic of hydrophilic molecules (Peters and Brain, 2009).
Hydrophobic and lipophilic molecules are absorbed through the lipid bilayer and the
membrane-bound protein regions of the cell membrane located on the microvilli of the small
intestine (Peters and Brain, 2009). The mechanisms of membrane transport described above
are illustrated in Figure 2.10.
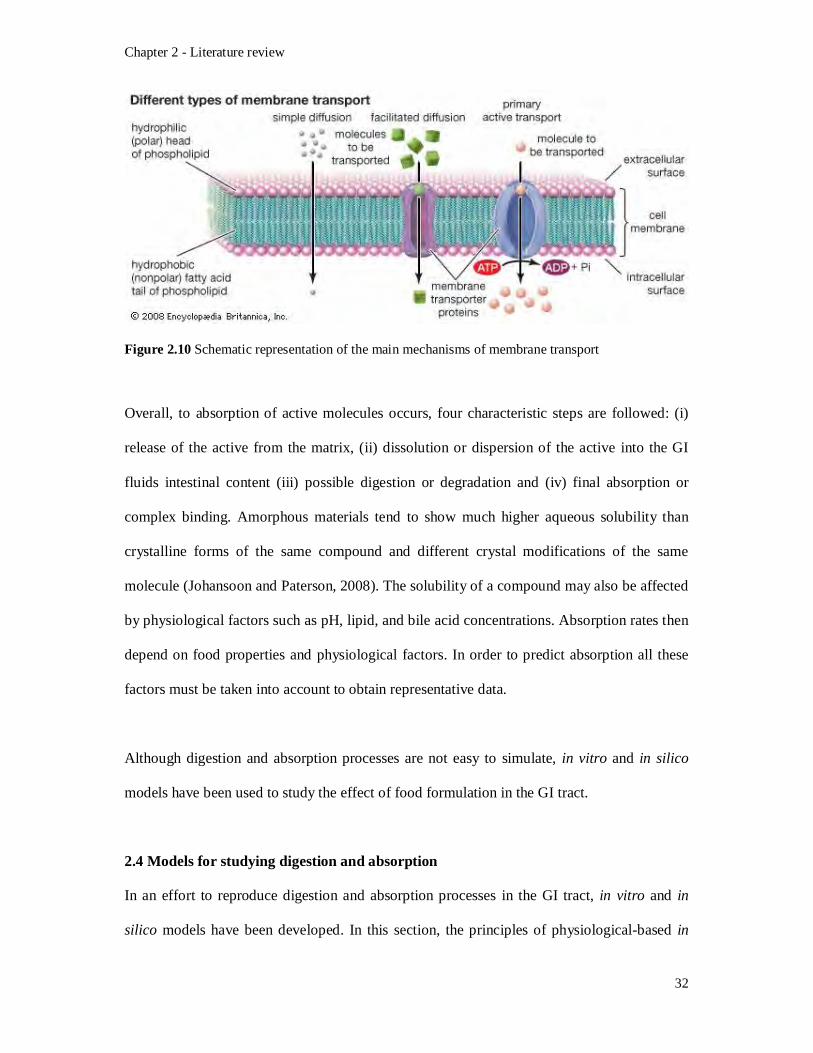
Chapter 2 - Literature review
32
Figure 2.10 Schematic representation of the main mechanisms of membrane transport
Overall, to absorption of active molecules occurs, four characteristic steps are followed: (i)
release of the active from the matrix, (ii) dissolution or dispersion of the active into the GI
fluids intestinal content (iii) possible digestion or degradation and (iv) final absorption or
complex binding. Amorphous materials tend to show much higher aqueous solubility than
crystalline forms of the same compound and different crystal modifications of the same
molecule (Johansoon and Paterson, 2008). The solubility of a compound may also be affected
by physiological factors such as pH, lipid, and bile acid concentrations. Absorption rates then
depend on food properties and physiological factors. In order to predict absorption all these
factors must be taken into account to obtain representative data.
Although digestion and absorption processes are not easy to simulate, in vitro and in silico
models have been used to study the effect of food formulation in the GI tract.
2.4 Models for studying digestion and absorption
In an effort to reproduce digestion and absorption processes in the GI tract, in vitro and in
silico models have been developed. In this section, the principles of physiological-based in

Chapter 2 - Literature review
33
vitro and in silico models for the study and prediction of the human digestion and absorption
phenomena are briefly described. Since a wide variety of models have been developed, the
discussion is limited to models that could be relevant to this work. A review of the in vivo
studies used to evaluate motility and mixing in the GI tract is also presented.
2.4.1 In vivo studies
To evaluate the efficacy of newly developed delivery systems, the most accurate results are
obtained indeed from in vivo feeding methods, using humans and animals (Hur et al., 2011).
For instance, the disintegration of food in the GI tract can be directly monitored in humans by
aspirating fluids from stomach and upper small intestine through a naso-gastric or naso-
jejunal tube. Nevertheless, only fluid foods can be tested by this method. Naso-gastric
monometric catheters can be also used to monitor gastric motility, however, this study is
limited and the intubation procedure is invasive and may cause discomfort to the subjects. As
such, non-invasively imaging techniques such as Scintigraphy, Ultrasonography and
Echoplanar Magnetic Resonance Imaging (EPI) have been employed to visualize and monitor
gastrointestinal functions (Kong and Singh, 2008a).
Scintigraphy is a diagnostic technique used in nuclear medicine, wherein the emitted
radiation of radioisotopes or radiopharmaceuticals, are recorded by external gamma cameras
in a form of two-dimensional images. Being non-invasive, scintigraphic techniques have been
used to evaluate the effects of gastric surgery or autonomic neurophaty (Spiller et al., 2009).
These techniques have allowed studying multiphase meals to evaluate gastric emptying of
liquids and solids. However, one of the limitations is that subjects could be exposed to
substantial doses of ionising radiation.

Chapter 2 - Literature review
34
Ultrasonography is an ultrasound-based diagnostic imaging technique used for visualizing
subcutaneous body structures including tendons, muscles, joints, vessels and internal organs.
Ultrasonographic techniques are limited to views of the antrum because assessment of the
whole gastric volume is difficult due to air/fluid interfaces, which disrupt the ultrasound
beam (Marciani et al., 2000).
Magnetic Resonance Imaging (MRI) and Computer Tomography (CT) scans can produce
deep tissue images making these techniques widely used to study gastric motility. Echoplanar
Magnetic Resonance Imaging (EPI) is an ultrahigh speed MRI used to study gastric
emptying, motility in the gastric lumen and to obtain three-dimensional images of the
intragastric distribution of water-containing meals (Marciani et al., 2000). Recent
developments in functional EPI techniques have allowed in vivo visualisation of a range of
formulations (Marciani et al., 2001). For instance, images of alginate beads in the stomach
have been presented by different authors (Rayment et al., 2009, Hoad et al., 2009). Hoad et
al. (2009) investigated the effect of model solid foods on satiety and reported that gastric
emptying was delayed by the presence of gelled beads used as a model.
One of the advantages of EPI is that can be adapted to monitor the viscosity of gastric
contents as their dilution by gastric secretions (Schulze, 2006, Kong and Singh, 2008a,
Marciani et al., 2001). For instance, when the viscosity of test meals modified with locust
bean gum (0.25 - 1.5g/100g) was monitored in vivo by the EPI technique; it was found that
the viscosity of the meals decreased after ingestion due to dilution with saliva and gastric
secretions. For instance it was found that by adding 1.5g/100g meal, the viscosity of the meal
fell from 11 to 2 Pa.s. In contrast, the less viscous meal (0.25g/100g) had a much smaller
absolute fall (Marciani et al., 2000).

Chapter 2 - Literature review
35
Other imaging techniques used to monitor gastric emptying and motility includes: electrical
impedance tomography and manometry. Electrical impedance tomography is an inexpensive
technique used in high-conductivity meals to monitor gastric motility (Spiller et al., 2009).
On the other hand, the migration motor complex (MMC) of the stomach in the fasting state
has been studied by manometry measures pressure; nevertheless with viscous meals the
ability to detect movement of the gastric wall is impaired (Spiller et al., 2009). Although
these techniques have limitations, they provide useful information on the pattern of flow
produced by peristalsis and segmentation movements in the small intestine. According to
Imam et al. (2004), when techniques such as videofluoroscopy, manometry, and multiple
intraluminal impedance are combined, patterns of flow in the small bowel can be obtained
with a good resolution. In addition, fluorescent nanotubes attached to a medication have been
used to evaluate the accuracy of the drug in reaching its target whereas the internal organs
can be imaged simultaneously (Bergeron, 2011). This is a real time technique that showed
promise to study the performance of an active molecule in the GI tract.
Although unanswered questions remain, the last developments in flow visualization imaging
techniques will enable a better understanding of gastrointestinal motor functions in future,
especially regarding the small intestine in which assessment of flow is difficult.
A significant problem is that in vivo studies and experiments are expensive, time consuming
and ethical constraints can limit their use in human experimentation. However, they are
critical in establishing accurate parameters that have to be reproduced in any model, either in
vitro or in silico. Animal studies offer an alternative but again ethical considerations and
concerns are frequently raised regarding their relevance to human systems (Wickham et al.,
2006).

Chapter 2 - Literature review
36
2.4.2 In vitro models
In vitro models can be useful tools in developing structured foods that guarantee their safety
in human subjects. In order to design foods with specific functions, in vitro gut models have
been developed to study how food and drugs perform in the digestive tract. The importance
of this is demonstrated by the wide variety of models that have been already developed.
These models vary greatly in their complexity and type, as each has been developed for
different applications.
GI tract in vitro models could be static or dynamic. Static or biochemical models such as
membrane- and cell-based models are basically focused on studying the release, absorption
and bioaccessibility of actives molecules. On the other hand, dynamic models simulate
physical processing and physiological actions that occur in vivo such as shear rates, mixing or
hydration, changing conditions over time (Kong and Singh, 2008a).
To study passive diffusion of actives through biological membranes and therefore predict the
extent of absorption from the GI tract, membrane- and cellular- based models have been
developed as explained below.
2.4.2.1 Membrane-Based Models (PAMPA)
This method provides an in vitro model for studying passive diffusion. As described in
section 2.3.3, passive diffusion is an important transport mechanism in the GI tract to
transport active molecules across cell membranes. The Parallel Artificial Membrane
Permeation Assay (PAMPA) provides a straightforward approach to evaluate the
permeability of various actives across artificial membranes. The use of artificial membranes
to investigate permeation processes uses filter-supported lipid membrane systems to predict

Chapter 2 - Literature review
37
the absorption profile of a drug, for example, where lipids composition can change
accordingly. To make lipid membranes, phospholipids and other membrane constituents are
added to the filter support as a solution in an organic solvent. As different tissues have
different lipid composition; lipid composition is important and can be selected as required.
Among the lipids available for designing these artificial membranes are: Phosphatidylcholine
(PC), Phosphatidylethanolamine (PE), Phosphatidylinositol (PI) and cholesterol. Various pH
profiles can be used to evaluate permeability (Deferme et al., 2008). They are widely used in
pharma-related studies, providing information about the passive-transport permeability of a
compound. The compounds can be categorised into low apparent permeability (Papp < 10 x
10-6cm/s) and high (Papp >10 x 10-6cm/s) permeability (Deferme et al., 2008). The ability of
this assay to evaluate permeability over a large pH range is valuable for an early
understanding of how new oral compounds might be absorbed across the entire
gastrointestinal tract.
2.4.2.2 Cell-based models
Cell based assays, such as Caco-2, assess permeability by transcellular passive diffusion as
well as active and paracellular transport. Caco-2 cell systems are the most extensively
characterized cell-based model because of their morphological and functional characteristics
of the small intestinal absorptive cells, including the effective permeability (Deferme et al.,
2008). The Caco-2 model is an in vitro static model consisting of one single cell type. One of
the disadvantages of these models is that low molecular weight hydrophilic compounds
showed poor permeability (Deferme et al., 2008). Caco-2 cells monolayers have been applied
as an effective screening tool to address food factors associated with iron availability,
deficiency and anemia, for example. The PAMPA and Caco-2 assays can be valuable when
used in conjunction to identify the cause of poor absorption.

Chapter 2 - Literature review
38
2.4.4.3 Mechanical models
Mechanical models have a wide selection features and different degrees of complexity
depending on their intended final application. For instance, Arnold and Dubois (1983)
simulated gastric mixing in a silicone rubber tube (i.d. 19 mm) placed in a peristaltic pump.
The frequency of peristalsis was adjusted to 0, 1 and 3 waves per minute. The authors found
that the diameter of solid food particles was reduced when the rate of contractions was
increased. Food disintegration was also influenced by composition of fluid surrounding
particles and reaction time.
De Boever et al. (2000) developed a model composed of a series of five double-jacketed
vessels. This successive system was used as a Simulator of the Human Intestinal Microbial
Ecosystem (SHIME) and was first developed by Molly et al. (1993). The original model
consisted of five computer controlled reactors mimicking the conditions of
duodenum/jejunum, ileum, caecum ascending, transverse and descending colon. De Boever et
al. (2000) included a sixth reactor to mimic the chemical reactions occurring in the stomach.
The SHIME is a validated model which provides more reproducible results for mechanistic
studies. This model has been used to simulate the kinetics of the chyme passage through the
GI tract; gastric enzymes, bile and small intestinal enzymes, pH, temperature, feed
composition, transit time in the GI tract, anaerobic environment. However, absorption and
feedback mechanism are not included.
Similar studies have been done by Probert and Gibson (2004), in which chemostats were used
to study bacteria inside the intestine. The bioavailability of actives has been also tested in
food and pharmaceutical areas using similar methods. For instance, the bioaccesibility of
Chapter 2 - Literature review
39
ingested mycotoxins from food and soil contaminants have been studied by Versantvoort et
al. (2005) and Oomen et al. (2003), respectively.
All mechanical models described above are mixed with an impeller, a magnetic stirrer, an
orbital shaker or in the worst scenario are not mixed at all. However, the kneading type of
mixing as occur in vivo cannot be simulated by any of these devices. As there is evidence that
intestinal wall movements influence actives absorption, the next section is focus on
discussing in vitro models that were implemented with mechanism of mixing with
physiological relevant features, i.e. peristalsis and segmentation movements are mimicked by
different mechanisms.
Macagno et al. (1982) developed a physical and mathematical model of the small intestine to
study absorption by mimicking different types of contractions and therefore degrees of
convective transport. The physical model used by these authors consisted of a dialysis tubing
1.6 cm in diameter connected to two reservoirs and immersed in a water bath at a constant
temperature. Mixing contractions were produced by two rotating parallel cylinders mounted
symmetrically. Two configurations were used to produce either a net flow in one direction or
a back-and-forth flow when one end of the tube was closed. Oscillation flow was produced
rather than through flow in order to simulate conditions more like those of the intestine. They
measured the permeability of the tube wall when the tubing was filled with an aqueous
solution of sodium chloride.
The mathematical model was developed from equations of conservation of volume, mass and
momentum in which the wall movements, mass transfer and flow were taken into account.
The effect of different type of contractions on diffusion was also evaluated. Results showed
Chapter 2 - Literature review
40
that different type of contractions produced different degrees of convective transport.
Absorption was increased by up to 30% when symmetric non-propagative contractions were
induced, more than doubling (70%) due to asymmetric propagative contractions and
increased almost 100% for symmetric propagative contractions, showing that wall
movements enhanced mass transfer across the wall.
Edwards et al. (1988) demonstrated the importance of diffusion and convection of active
molecules across the unstirred layer in viscous solutions by means of an in vitro model
composed of dialysis tubing (12 x 1.5 cm). The tubing was tied at each end and anchored in a
Perspex reservoir containing distilled water. Intestinal contractions were simulated using two
pairs of paddles located at each end of the tubing. The volume of solution introduced into the
tubing was less than its capacity but sufficient to be displaced backwards and forwards along
the tubing by alternate contractions at either end of the dialysis tubing without causing
distension of the tubing. The motor was set to generate either 36 or 72 contractions per
minute. The effect of food formulation was also evaluated by adding 0.5% of guar gum to the
solution of NaCl. They concluded that guar gum has no significant effect on diffusion of
sodium. However, convection was greatly inhibited in the presence of guar gum. This
biopolymer delays the mixing of solutions of differing conductivity. Reduction in absorption
by guar gum is probably due to resistance of convection by viscous solutions of the
convective effects of intestinal contractions.
Large and more sophisticated models includes: (i) the TIM model from the TNO Nutrition
and Food Research (Zeist, The Netherlands) and (ii) the Gut Model developed in the Institute
of Food Research in Norwich, UK.
Chapter 2 - Literature review
41
TNO in the Netherlands has developed two models: the Gastro Intestinal Tract Model (TIM-
1) and the Large Intestinal Model (TIM-2). The TIM-1 is a dynamic in vitro model composed
of four compartments to simulate the: stomach (A), duodenum (C), jejunum (E) and ileum
(G), as illustrated in Figure 2.11. Each compartment is connected by two basic units and
equipped with a flexible membrane inside, and outer glass jackets that allow the passage of
water for both temperature and pressure control. The TIM mimics the interactions with
gastrointestinal fluids and reactions while peristalsis is reproduced by altering external
pressures; however, segmentation is not included in this model. Human physiological
conditions in the stomach and the small intestine are mimicked, including simulation of pH
changes, temperature, peristaltic movements, and secretion of digestion enzymes, bile,
pancreatic juices, and absorption of active molecules (Kong and Singh, 2008a). The TIM has
been used to validate the “biodrug” concept and to study the behaviour of orally administered
drug dosage forms under physiological conditions (Blanquet et al., 2001). This model has
been used in nutritional studies (Mateo Anson et al., 2010), to evaluate the bioavailability of
active components (Duchateau and Klaffke, 2008, Minekus et al., 2005) and stability of
antioxidants such as xanthophylls (Blanquet-Diot et al., 2009); and micronutrients such as
iron, folic acid and ferulic acid (Mateo Anson et al., 2009). Studies indicate that the TIM
shows to be a useful tool for various research purposes dealing with; availability for
absorption of mutagenic; as well as antimutagenic components in food, probiotics and
pharma studies to design and develop of new drug formulations and to predict the
performance of several formulations in vivo.

Chapter 2 - Literature review
42
Figure 2.11 A schematic of the TNO model (TIM-1). A. gastric compartment; B. pyloric sphincter; C. duodenal compartment; D. peristaltic valve; E. jejunal compartment; F. peristaltic valve; G. ileal compartment; H. ileo-caecal valve; I. pH electrodes; J. gastric secretion bottles with acid and enzymes; K. duodenal secretion bottles with bile, pancreatin, bicarbonate; L. secretion of bicarbonate to control the intestinal pH; M. pre-filter system; N. hollow fibre semi-permeable membrane system; O. water absorption system; P. closed dialysing system. Taken from National Enzyme Company Literature (© National Enzyme Company, 2004).
In addition, the TIM-2 was designed under the same principles that the gastrointestinal model
TIM-1, with flexible walls between which the intestinal content is circulated and a glass
jacketed where water regulates the temperature and peristaltic movements of the chyme.
The Institute of Food Research (Norwich, UK) has recently developed a fully automated
dynamic gastric model that simulates the human stomach digestion using a conical flexible
walled vessel and a cylinder that processes the food at representative shear rates. This model
simulates with accurate replication the physical mixing, transit and breakdown forces in the
stomach, as well as the physiological conditions (pH gradient and enzymes) and emptying
cycles measured within the main body of the human stomach (Marciani et al., 2001). The
Model gut (Figure 2.12) can processes real food and drugs adjusting the residence time, acid

Chapter 2 - Literature review
43
and enzyme secretions according to the components of the food. It has been recently used to
study the effect of allergens in foods (Chambers et al., 2004), release of nutrients or bioactive
components (Vardakou et al., 2011), performance of functional foods and survival of
probiotics (Lo Curto et al., 2011, Mandalari et al., 2010a).
Figure 2.12 A picture of the Model gut developed by the Institute of Food Research in Norwich, UK. Taken from BBC website (2006).
Kong and Singh (2008b) also developed a model stomach system to investigate disintegration
kinetics of solid foods during digestion. The model stomach consisted mainly of a turntable
and a jacketed glass chamber containing simulated gastric juice in which plastic beads were
added to simulate food particulates as well as to provide a suitable mechanical destructive
force on food samples (Kong and Singh, 2008b). The disintegration of foods is simulated by
applying representative shear stresses to break the food structure and evaluate the effect of
microstructure on digestion. They reported that a good correlation was observed between the
kinetics of food disintegration and in vivo stomach emptying.

Chapter 2 - Literature review
44
The effect of wall motility particularly segmentation movements on absorption profiles was
recently studied by a dynamic in vitro model of the small intestine at the University of
Birmingham (UK). The model consists of a dialysis membrane and a mechanical system that
simulates segmentation movements. The Small Intestine Model (SIM) allows the study of
motility and chemical digestion including food digestion and actives absorption (Tharakan et
al., 2010). The SIM was used for studying mass transfer, starch digestion and flow
visualization of the lumen contents. While simulating the small intestinal flow profile,
experiments have shown that the functional ingredient guar gum reduces the mass transfer
coefficient by up to 30% of the model nutrient riboflavin. This together with computational
modelling suggests an explanation for the observed functionality of guar gum to reduce the
peak increase in blood glucose levels after ingestion of test meals. This is the starting point of
this thesis.
2.4.3 In silico and theoretical models
Over the last decades, biological processes have been studied by developing mathematical
models in order to obtain a fundamental understanding of the effect of a variety of
physiological processes. In silico models have been used to evaluate the residence time
distribution, release and inactivation of bioactives such as probiotics, drugs and foods in the
GI tract mimicking the intestinal fluid flow (Stoll et al., 2000). These models have proved to
be useful tools to predict the human fraction dose absorbed from orally administrated drugs.
Computational models have been created to study absorption processes in the GI tract.
Although these models were fitted to the experimental data their use is limited due to the
complexity of the problem. As a first approach, an equation based model without considering
complex fluid dynamics must be developed. Computational Fluid Dynamics (CFD) has been
Chapter 2 - Literature review
45
used to simulate segmentation and peristalsis in these in vitro and in silico models describing
momentum transport during single phase flow which incorporates moving boundaries
(Tharakan, 2008). Consideration was given to the design to ensure that the mechanical
processing of the digesta in the human small intestine was being accurately represented.
Pal et al. (2004) for example, developed a two-dimensional computer model of the human
stomach based on the “lattice-Boltzmann” method. The model demonstrated that antral
contraction waves (ACW) are responsible for gastric mixing. Thus, the strongest fluid
motions were found in the antrum with two basic flow patterns: (i) retropulsive flow
velocities up to 7.5 mm/s and (ii) recirculating flow velocities of 2.0 mm/s. The authors
concluded that both flow patterns enhance mixing process in complementary ways in the
stomach. While particles are separated longitudinally by retropulsive flow, they are
transported transversally to the gastric wall due to recirculation flow patterns.
Moreover, there are several commercially available software packages, e.g. GastroPlusTM,
iDEATM, Intellipharm PK and PK-Sim, all capable of reproducing and predict the human
absorption processes with fairly high degree of accuracy. These based in silico models have
been designed for the prediction of oral drug absorption (Johansson and Paterson, 2008).
On the other hand, theoretical and phenomenological models have been also designed to
study, for instance, digestion and gustatory responsiveness for insect herbivores using
chemical reactor models (Wolesensky et al., 2005).
Based on macrotransport analysis Stoll et al. (2000) developed a theoretical model for
molecular absorption from the small intestine. The inputs used in the model were primarily
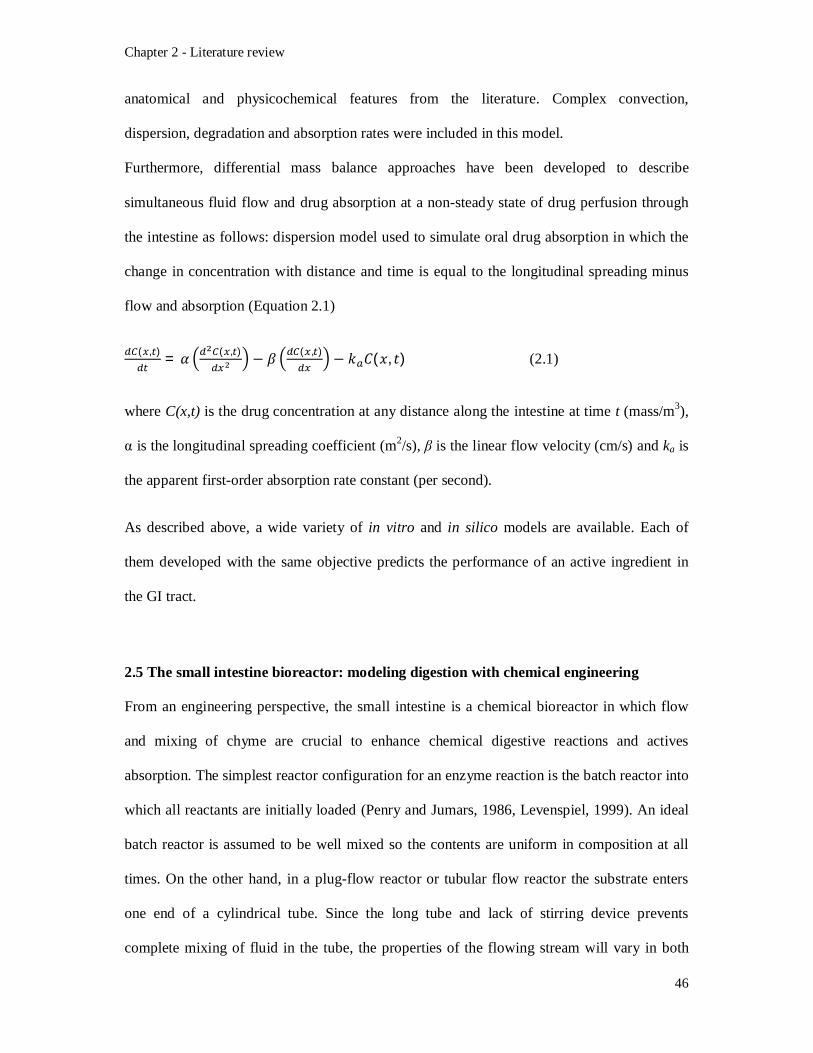
Chapter 2 - Literature review
46
anatomical and physicochemical features from the literature. Complex convection,
dispersion, degradation and absorption rates were included in this model.
Furthermore, differential mass balance approaches have been developed to describe
simultaneous fluid flow and drug absorption at a non-steady state of drug perfusion through
the intestine as follows: dispersion model used to simulate oral drug absorption in which the
change in concentration with distance and time is equal to the longitudinal spreading minus
flow and absorption (Equation 2.1)
( , ) = 훼 ( , ) − 훽 ( , ) − 푘 퐶(푥, 푡) (2.1)
where C(x,t) is the drug concentration at any distance along the intestine at time t (mass/m3),
α is the longitudinal spreading coefficient (m2/s), β is the linear flow velocity (cm/s) and ka is
the apparent first-order absorption rate constant (per second).
As described above, a wide variety of in vitro and in silico models are available. Each of
them developed with the same objective predicts the performance of an active ingredient in
the GI tract.
2.5 The small intestine bioreactor: modeling digestion with chemical engineering
From an engineering perspective, the small intestine is a chemical bioreactor in which flow
and mixing of chyme are crucial to enhance chemical digestive reactions and actives
absorption. The simplest reactor configuration for an enzyme reaction is the batch reactor into
which all reactants are initially loaded (Penry and Jumars, 1986, Levenspiel, 1999). An ideal
batch reactor is assumed to be well mixed so the contents are uniform in composition at all
times. On the other hand, in a plug-flow reactor or tubular flow reactor the substrate enters
one end of a cylindrical tube. Since the long tube and lack of stirring device prevents
complete mixing of fluid in the tube, the properties of the flowing stream will vary in both

Chapter 2 - Literature review
47
longitudinal and radial directions (Levenspiel, 1999). Since the variation in the radial
direction is small compared to that in the longitudinal direction, it is called a plug-flow
reactor. Due to its geometry and flow characteristics, the small intestine resembles a plug
flow reactor in which lumen contents will also vary in both longitudinal and radial directions.
Fluid dynamic processes occurring in the human small intestine are a result of intestinal
motility, specifically segmentation movements (section 2.3.2), and are responsible for mixing
lumen contents. Therefore, intestinal motion primarily defines the fluid mixing profiles of the
food materials in the small intestine; mass transfer occurs through convective mixing and
diffusion processes taking place on a non-newtonian fluid (Tharakan, 2008). To understand
these processes is important to review some basic concepts that could be applied at digestion-
absorption phenomena in the small intestine.
2.5.1 Fluid dynamics
The study of fluid dynamics involves application of the fundamental principles of general
mechanics to liquids and gases. These principles involve conservation of matter, energy and
Newton´s laws of motion (Massey and Ward-Smith, 1998). Overall a fluid flow can be
divided into two types: laminar and turbulent flow. Laminar flow occurs when a fluid flows
in parallel layers without disruption between the layers. In turbulent flow, however, the fluid
undergoes irregular fluctuations and circulating vortices result in transference of fluid on a
larger scale, with cyclic fluctuations in the flow rate. Turbulent flow is a flow regime
characterized by property changes, low momentum diffusion and high momentum convection
and variation of pressure and velocity in space and time (Re > 4000).
Turbulent flow is often more desirable to many engineering process as it gives greater mass
transfer (Cussler, 2009). Particles of fluid which are initially separated by a long distance can

Chapter 2 - Literature review
48
be closed together by eddy motions in turbulent flows. As a consequence, heat, mass and
momentum are very effectively exchanged. Such effective mixing gives a rise of diffusion
coefficients for mass, momentum and heat transfer.
The type of flow is dependent on the velocity, physical properties of the fluid and the
geometry of the surface (Coulson and Richardson, 1998). To describe these properties a
suitable correlation widely used by engineers is the Reynolds number (Re) which gives the
relation between inertia forces and viscosity forces; for high Re numbers inertia is greater
than viscous forces and the flow is turbulent, when the Reynolds number is low, viscous
forces are greater and the flow is laminar. Re can be calculated using Equation 2.2.
D
Re (2.2)
where is the density of the fluid, the mean velocity, D is the diameter of the pipe and
the viscosity of the fluid. For pipe flow, laminar flow occurs when Re < 2100, while turbulent
flow occurs when Re > 10000.
In digesta, solid particles can also modify the flow properties, but by comparison with soluble
polysaccharides, their intrinsic viscosity is lower. The overall viscosity of fluid digesta
(stomach and small intestine) can be increased by significant amounts of soluble
polysaccharides. Evaluating the viscosity generated by soluble dietary fibres in dilute digesta
is not an easy task, also because their concentration in the lumen is different from those
ingested, as shown by Marciani et al. (2000). In particular, the total volume of digesta may
adapt in response of ingestion of viscous solution, partly offsetting the difference in initial
viscosity (Guillon and Champ, 2000).

Chapter 2 - Literature review
49
Fluid flow in the small intestine is provided by the peristaltic movements that bring chyme
from stomach to the small intestine. The velocity of peristaltic flow as well as the physical
properties of the chyme will determine the flow type either laminar or turbulent.
As described in section 2.3, the small intestine model can be considered as a baffled reactor
due to the intestinal wall structure in which oscillatory Reynolds numbers describe the type of
flow occurring in the small intestine, enhancing heat and mass transfer processes. Oscillatory
Reynolds numbers can be calculated by Equation 2.3.
Dfx o
o2
Re (2.3)
where is the fluid density, f the frequency of oscillation, xo is the centre-to-peak amplitude,
D is the tube diameter, and the viscosity of the fluid.
While there is some information from animal models, shear rates and flow profiles have not
been well established for the human small intestine due to its complexity and location
(Tharakan, 2008). For instance, Jeffrey et al. (2003) modelled flow profiles numerically,
using inputs from luminal pressures, outflow and wall movements of isolated segments of
guinea pig ileum.
2.5.2 Mixing fundamentals
Mixing is one of the most common operations in chemical and biochemical processing. It is
used to enhance mass transfer processes, dissolving the solute homogenously in the medium
and reducing the gradient of concentration. Mixing is provided by the segmentation
movements of the intestinal wall while motility in the gastric antrum plays an important role
in mixing and food transport. Mechanical agitation in the gut promotes not only chemical
Chapter 2 - Literature review
50
reactions but also mass transfer processes. Mixing by eddy diffusion is much faster than
mixing by molecular diffusion and, consequently turbulent mixing occurs much more rapidly
than laminar mixing.
Mixing mechanisms (Paul et al., 2004):
Molecular diffusion is diffusion caused by relative molecular motion and is
characterized by the molecular diffusivity DAB. Diffusion is responsible for the fluid
micromixing at small scales.
Eddy diffusion or turbulent diffusion is dispersion in turbulent flows caused by the
motion of large groups of molecules known as eddies. This motion is measured as the
turbulent velocity fluctuations. The turbulent diffusivity, Dt is a conceptual analogy to
DAB but is a property of the local flow rather of the fluid.
Convection is dispersion caused by bulk motion at large length scales, driven by gross
flow or macromixing.
Taylor dispersion is a special case of convection, where the dispersion is produced by
velocity gradients across the flow. It is most often referred to in the case of laminar
pipe flow, where axial dispersion arises due to the parabolic velocity gradient in the
pipe, i.e. the centre of the flow is moving faster than that at the walls.
In a flowing fluid, the rates of transfer processes and reactions are affected by the flow.
Convective mixing of the chyme has been recognized as one of the functions accomplished
by intestinal motility, but besides general statements to this effect, little is known about the
quantitative nature of such mixing. A first step into gaining some insight into the transport of
mixing of the chyme is achieved if a proper visualization of the flow induced by the wall
movements is attained (Macagno and Christensen, 1980).

Chapter 2 - Literature review
51
2.5.3 Molecular delivery
The delivery of active molecules to the intestinal wall is a result of both diffusion and
convective mixing of the intestinal contents (digesta). Molecular delivery occurs by
convection and diffusion across the intestinal wall or membrane. Mass transfer could be
described by two models, represented by using either diffusion or mass transfer coefficient.
The concentration gradient between the fluid inside the small intestine and blood outside
drives the diffusion phenomenon (Tharakan, 2008). Diffusion and convection are briefly
discussed in the next section.
2.5.3.1 Diffusion and convection
Diffusion is a process by which molecules, ions, or other small particles spontaneously mix,
moving from regions of relatively high concentration into regions of lower concentration.
The rate of movement of material by diffusion is described mathematically by Fick’s laws.
Fick’s first law is described by Equation 2.4, which relates the diffusion flux J to the gradient
of the change in concentration (dc/dx).
퐽 = −퐷 (2.4)
where J is the diffusion flux of material per unit area (mol/m2s); measures the amount of
substance that will flow through a small area during a small time interval, D is the diffusion
coefficient or diffusivity in (m2/s), c (for ideal mixtures) is the concentration (mol/m3) and x
is the position (m). The negative sign indicates that flow is down the concentration gradient
(from high to low concentration).
D is proportional to the squared velocity of the diffusing particles, which depends on the
temperature, viscosity of the fluid and the size of the particles according to the Stokes-

Chapter 2 - Literature review
52
Einstein relation. In dilute aqueous solutions the diffusion coefficients of most ions are
similar and have values that at room temperature are in the range of 0.6 x 10⁻⁹ to 2 x 10⁻⁹
m2/s. For biological molecules the diffusion coefficients normally range from 10−11 to 10−10
m2/s.
Fick's second law for unidimensional flow (Equation 2.5) describes how concentration
changes as a function of time. The rate of change of the concentration as a function of time is
a function of the change in concentration gradient (Cussler, 1997).
= 퐷 (2.5)
where c is the concentration (mol/m3), t is time (s), D is the diffusion coefficient (m2/s) and
x is the position (m).
On the other hand, convective transport occurs when a constituent of the fluid (mass, energy,
a component in a mixture) is carried along with the fluid. Convective heat and mass transfer
take place through both diffusion random Brownian motion of individual particles in the
fluid, and by advection, in which matter is transported by the larger-scale motion of currents
in the fluid. By the nature of the small intestine, convention is a result of induced flow by the
intestinal movements that transport and mix chyme along the intestine ‘force convection’.
2.5.3.2 Mass transfer coefficients
Assuming that the lumen content is a well-mixed solution, the mass transferred from some
interface is proportional to the concentration difference and the interfacial area as stated in
Equation 2.6 (Cussler, 2009).

Chapter 2 - Literature review
53
(푎푚표푢푛푡표푓푚푎푠푠푡푟푎푠푓푒푟푟푒푑) = 퐾(푖푛푡푒푟푓푎푐푖푎푙푎푟푒푎)(푐표푛푐푒푛푡푟푎푡푖표푛푑푖푓푓푒푟푒푛푐푒) (2.6)
where K is the mass transfer coefficient (m/s).
Dividing both sides of the equation by the area, equation (2.6) could be arranged as:
푁 = 푘(푐 − 푐 ) (2.7)
where N1 is the flux at the interface and c1i and c1 are the concentrations at the interface and
in the bulk solution, respectively.
The simplest theory for interfacial mass transfer, assumes that a stagnant film exists near
every interface. This film, also called an unstirred layer, is almost always hypothetical, for
fluid motions commonly occur right up to even a solid interface. The steady-state flux across
this thin film can be written in terms of the mass transfer coefficient.
A common dimensionless number used in the analysis of mass transfer phenomena is the
Sherwood number (Sh) or mass transfer Nusselt number (Nu) that represents the ratio of
convective to diffusive mass transport (Equation 2.8).
푆ℎ = =
(2.8)
where L is a characteristic length (m), DAB is mass diffusivity (m2/s) and kbp is the local mass
transfer coefficient (m/s).
The flow within a given process will be highly complex and difficult to evaluate fully and
even if a full CFD model were available, it is likely that it would be too complex to use in
practice. Mass transfer coefficients are defined in terms of measurable quantities, such as the
bulk concentration, the concentration in the receiving medium, and the flux of mass between

Chapter 2 - Literature review
54
the two. The active concentration is assumed to have an average value, and the flux between
the two regions is related to the difference between these average concentrations. Thus, mass
transfer coefficients are used to describe how the concentration changes with position or how
concentration changes with time (Cussler, 2009).
The convective mixing of intestinal contents is one of the functions of intestinal motility. In
practice little is known about the quantitative nature of this mixing. Mass transfer
experiments, visualisation and modelling of the flow, induced mixing by the wall
movements, will achieve an insight into the transport and mixing of digesta and how food
formulations can affect this (Tharakan, 2008).
In order to study flow as a function of the intestinal motility, techniques such as Planar Laser-
Induced Fluorescence (PLIF) and Particle Image Velocimetry (PIV) have been successfully
used in problems of fluid flow visualization in which transparent solutions are used (Hu et al.,
2012, Li et al., 2011). Both are powerful flow diagnostic techniques based on image analysis.
Whilst PLIF is widely used to monitor macromixing time, PIV is commonly employed to
study velocity distributions. PLIF is a non-invasive technique in which a tracer e.g.
rhodamine, is injected into flow which fluoresces upon excitation by laser light. PLIF
supplies conventional two-dimensional images which are digitally processed. The greyscale
intensity of the images can be related to local tracer concentration. Spatial resolution however
is limited by the camera magnification; image can be processed pixel by pixel is required. In
PIV paired laser pulses illuminate neutrally buoyant seeding particles suspended in flow.
Here, statistical analysis of particle images yields information regarding local fluid velocity.

Chapter 2 - Literature review
55
However, one of the problems is that the above techniques need transparent fluids, i.e. their
use is limited. A very powerful alternative technique is the Positron Emission Particle
Tracking (PEPT). PEPT is a variant of the Positron Emission Tomography (PET), which is
well established in medicine for imaging the human body. In terms of engineering
applications, the PEPT technique has been utilised to study solids motion within a variety of
equipment including spouted beds, rotating cans fluidised beds and mixers (Cox et al., 2003,
Kuo et al., 2002, Seiler, 2001).
2.6 Food formulation (structured foods)
Intestinal absorption is not only related to the flow and mixing of fluids in the gut but also to
the structure of the food within the intestine. It has been well established that food structure
has a significant impact on the food digestive behavior (Lundin et al., 2008). For instance, it
has been demonstrated that by adding dietary fibre such as guar gum, pectins, β-glucans,
cellulose and fibres into foods can notably delay absorption of glucose into the bloodstream
(Blackburn et al., 1984, Jenkins et al., 1978, Salmerón et al., 1997).
Dietary fibre is defined as a heterogeneous mixture of substances predominantly found in
plant cell wall that are not hydrolised by the digestive enzymes in man. Indigestibility implies
that dietary fibre is not broken down by enzymes in the upper part of the gastrointestinal
tract, because the human small intestine does not contain enzymes capable of cleaving β-1-4
bonds present in dietary fibres. Dietary fibre or Non Starch Polysaccharides (NSP) are used
as a ‘fuel’ for the gut microbiota which promotes the production of short fatty acids in the
large bowel that are easily absorbed and contribute to energy metabolism.

Chapter 2 - Literature review
56
Dietary fibre is classified into two groups, water-soluble and water-insoluble fibres (Anttila et
al., 2004). Soluble viscous fibres contribute to formations of the unstirred layer adjacent to
the mucosa, which serves as a physical barrier to nutrient absorption and bile acid
reabsorption. Water insoluble fractions; such as cellulose and lignin and water-soluble
components, encompassing the major part of hemi-cellulose compounds, gums, β-glucans,
mucilages and pectins (Ryttig, 2005).
The two major benefits associated with soluble and viscous dietary fibres are attenuation of
glycemic response and plasma cholesterol lowering (Anttila et al., 2004). It is generally
recognized today that the physiological value of soluble dietary fibre is based on its ability to
increase the viscosity of food digesta in the intestine (Anttila et al., 2004). Studies have
shown that addition of soluble fibres such as pectin, guar gum and locust bean gum in food
reduces gastric emptying, delays absorption of actives, reduces the plasma glucose response
and slows down the return of hunger. Soluble fibres have been combined in diet for treating
pathological conditions such as obesity, hypercholesterolemia and diabetes (Kong and Singh,
2008a).
The rate of starch hydrolysis and glucose absorption could be reduced when foods are
supplemented by gelling fibres such as guar gum, pectin, tragacanth or cellulose. It has been
stated that postprandial glucose levels have been reduced when foods are supplemented with
fibres. Gastric emptying and intestinal motility are delayed or modified when viscous
biopolymers are added to foods, slowing glucose diffusion trough the blood stream because
of increasing of the unstirred layer from the chyme to the epithelium of the small intestine.
Furthermore, amylase accessibility is reduced as a result of increased viscosity of lumen

Chapter 2 - Literature review
57
contents (Leclere et al., 1994, Snow and O'Dea, 1981). Fibre could “hide” or isolate starch
from amylases avoiding formation of the complex starch-enzyme delaying starch hydrolysis.
Addition of guar to nutrient drinks and solid meals markedly prolongs the duration of a
postpandrial motility pattern (Schönfeld et al., 1997). Meyer et al (1988), suggested that guar
slows emptying of the liquid part of the meal, but speeds emptying of particulate matter.
Gastric sieving may be impaired by guar (Meyer et al., 1986 and 1988).
Blackburn et al. (1984) found that by adding 9 g of guar to a liquid model food containing
glucose significantly improve glucose tolerance; as one can see in Figure 2.13, compared
with the control, blood glucose levels were lower at 30 and 40 minutes. These authors also
observed a delay in gastric emptying of the glucose drink when guar was added to the
solution.
Figure 2.13 Blood glucose levels of human subjects following ingestion of 50g glucose in 250ml orange drink, with or without 9g guar gum. Results are expressed as a mean with the standard errors of six observations (taken from Blackburn et al. 1984).
Control (no guar)
With guar (9g)
Chapter 2 - Literature review
58
The rate of intestinal digestion, absorption and transit of the food could be also influenced by
the physical form of food ingested and the physical properties of the intestinal contents
produced (Jenkins et al., 1982).
Overall, the food industry needs to develop foods that deliver active ingredients with specific
functions over an extended period of time. Potentially, this could be accomplished by
changing food formulation and developing encapsulated structures which can be released at
the right place and time. Two approaches are attempted in this thesis:
(i) The change in bulk viscosity of fluid in a model gut and
(ii) A model encapsulation system
By changing the bulk viscosity of the intestinal fluid, the biopolymers will interact with each
other because of entanglements i.e. no permanent bonds between individual polymers are
formed. On the contrary, in the case of polysaccharide gels (networks) or microstructures
formation, the polymers are cross-linked into a tridimensional structure and the addition of
solvent, in most cases, not change the integrity of the network. In both cases, a physical
barrier is developed to delay the release, digestion and further absorption of key molecules to
design functional and structured foods with health benefits to the consumer.
Therefore, a briefly review about encapsulation, wall materials and techniques such as
ionotropic gelation and liposomes is presented below.
2.7 Encapsulation
Encapsulation is a physicochemical process widely used in different areas such as
pharmaceutical, textile, agrochemical and foods, aiming to protect a bioactive ingredient
against a variety of environmental conditions (e.g. pH, temperature, oxygen).

Chapter 2 - Literature review
59
Microencapsulation has been used to pack solids, liquids or gaseous materials into micro- or
nano-size sealed capsules for release at controlled rates using desired released triggers
(Klaypradit and Huang, 2008, Pothakamury and Barbosa-Cánovas, 1995).
The compounds that have been more commonly encapsulated in the food industry include:
proteins e.g. insulin; probiotics (Annan et al., 2008), (Soottitantawat et al., 2005),
antioxidants and nutraceuticals (Chiou and Langrish, 2007), vitamins (Chen and Wagner,
2004), minerals (Gouin, 2004), essential oils (Ahn et al., 2008) and sugars like sucrose
encapsulated in oil cotton (Jozwiakowski et al., 1990). The simplest microcapsulate consists
of a core or active ingredient surrounded by a wall, shell or barrier. Nevertheless, whether the
active ingredient is embedded inside of a matrix the structure is known as a microsphere. The
core is the component that required protection and it may be composed of one or more
ingredients (Klaypradit and Huang, 2008). The wall could be single or multilayer
(Pothakamury and Barbosa-Cánovas, 1995). Encapsulation techniques used in this thesis
include
2.7.1 Ionotropic gelation
Ionic gelation is one of the methods that much research attention has attracted, to the
formation of microspheres using macromolecules that can bond divalent ions such as Ca ++. It
has been used for insulin-chitosan particles nanoencapsulation, adding a tripolyphosphate
(TPP) solution (Agnihotri et al., 2004). Moreover, different wall materials have been used
such as pectin and alginate with calcium chloride as a cross-linking agent, obtaining good
results in the entrapment of drugs and foods (Goh et al., 2012, Annan et al., 2008, de Vos et
al., 2006, Draget et al., 1994).

Chapter 2 - Literature review
60
2.7. 2. Liposome entrapment
It is a process commonly used by the pharmaceutical industry for the protection of vaccines,
enzymes or drugs (Feng et al., 2004a). The capsules produced by this technique are formed
by a phospholipid, such as phosphatidylcholine, which may include in its structure
hydrophilic or hydrophobic material providing greater versatility and endurance (Lee et al.,
2008, Colletier et al., 2002, Kokkona et al., 2000, Kim and Baianu, 1991).
The most common shell materials used in the food industry are listed in Table 2.1.
Table 2.1 Common materials used in food microencapsulation
Component Examples References Carbohydrates
Starch derivates: Modified resistant starches Cyclodextrins Maltodextrins (DE < 20) Corn syrup solids (DE > 20)
Dimantov et al. (2004) Szente and Szejtli (2004) Yoshii et al. (2001) Che Man et al. (1999)
Cellulose derivates: Carboxymethyl-cellulose (CMC) Hidroxyprophylmethyl-cellulose (HPMC)
Shahidi and Han (1993) Dimantov et al. (2004)
Hydrocolloids: Arabic gum, mesquite Carrageenan Pectin, agar Chitosan Sodium alginate
Su et al. (2008) Krishnan et al. (2005) Shahidi and Han (1993) Drush, (2007) Agnihotri et al. (2004) Gouin (2004)
Proteins
Gelatin Milk proteins: casein, albumins Wheat, corn and soy proteins
Shadini and Han (1993) Je Lee and Rosenberg (2000) Yoshii et al. (2001)
Lipids
Wax, paraffins Mono-, di- glicerides Fosfoglicerides Oils, fats
Shadini and Han (1993)
Feng et al. (2004b)
DE = Dextrose Equivalent
Chapter 2 - Literature review
61
The wall materials used in the encapsulation of an active substance must have emulsification
and film forming properties, give low viscosities at high solids concentration (300 cps > 35%
solids), have low hygroscopicity, bland taste and low-cost, release the active ingredient when
it is reconstituted, provide good protection against environmental conditions (Shahidi and
Han, 1993). Some of the materials above could be employed in combination with others to
improve their film forming properties, for instance, it have been used successfully starch -
gum arabic or chitosan – alginate (Agnihotri et al., 2004) for encapsulating agents flavoring
mixtures. In addition, the pharmaceutical industry uses enteric materials such as “Eudragit®”,
to encapsulate different types of drugs. These enteric coatings have different dissolution
profiles according to the pH and are designed to release the active ingredient at a specific pH.
Most of these materials are methacrylate polymers able to protect the active material against
the acidic pH of the stomach.
2.8 Conclusion
Despite of its importance on the delivery of active molecules relatively little work has been
done to understand and study mass transfer phenomena inside the small intestine. In summary
the study of physiological processes involved in food digestion and active absorption is quite
challenging, offering an infinite number of possibilities and opportunities in the design and
develop of structured foods.
The first section of this Chapter covered the basic aspects of the GI tract including:
anatomical features, physiology, mechanical and chemical digestion, together with absorption
and some relevant models developed to study these phenomena in vitro. According to this
information there are opportunities to design and develop structured foods with health
benefits for the consumers.
62
CHAPTER 3 - MATERIALS AND METHODS
3.1. Introduction
As discussed in the previous chapters, the design and development of novel functional foods
require a better understanding of the impact that food formulation and structure have on
digestion and absorption processes in the gastrointestinal tract. To predict the rate at which
molecules are digested and absorbed through the epithelium, interactions between
macronutrients after food processing must be also understood. The study of these phenomena
‘in vivo’ is very complex, expensive and time consuming. As such, realistic in vitro models
must be used to give representative data of what happens inside the body during digestion. In
this context, a dynamic ‘in vitro’ small intestine model (SIM) was used here to study the
effect of mixing and formulation on mass transfer phenomena during nutrient digestion and
actives absorption. The strategies proposed in this research were based on key features of the
human small intestine taking into account its physiology and the physicochemical properties
of the digesta.
This Chapter describes the materials and experimental procedures that were used to study
mass transfer in the small intestine during digestion. As mentioned in the following sections,
the effect of mixing and food formulation on glucose absorption was evaluated in the SIM
under physiological conditions. Food formulation was varied by adding different
concentrations of viscous fibres such as guar gum, pectin and cellulose. The second section of
this chapter is focused on the hydrolysis of starch, since it is the main carbohydrate in human
nutrition and its digestion in vivo is an indicator of the resulting postprandial glucose levels
(Lehmann and Robin, 2007). Visualization techniques such as Planar Laser Induced
Fluorescence (PLIF) and Positron Emission Particle Tracking (PEPT) were employed to
Chapter 3 - Materials and Methods
63
study velocity profiles and mixing performance in the SIM as a function of food formulation
- viscosity. In the last section, a description of the encapsulation techniques used to produce
structures for delaying the release of actives was included along with studies of entrapment
efficiency, morphological characterization and in vitro release kinetics.
3.2 Materials
This section gives a brief description of all chemicals and enzymes used through this work,
including: monosaccharides and polysaccharides: glucose and starch, respectively;
biopolymers: guar gum, pectin, alginate, carboxymethyl cellulose and enzymes: -amylase
and amyloglucosidase for starch and food digestion. All reagents and digestive enzymes were
ACS reagents purchased from Sigma-Aldrich Company (Poole, UK), unless otherwise
specified.
3.2.1 Glucose (C6H12O6)
Due to its importance as a biological fuel for most of the living cells, D-(+)-glucose (G5767
from Sigma-Aldrich, UK), was selected to model absorption in the small intestine. As an
energy source, glucose plays an important role in the glycolysis metabolic pathway and it is
critical in the synthesis of proteins, lipids and nucleotides. This monosaccharide is the basic
unit of complex molecules such as starch, cellulose and glycogen. Glucose is the major sugar
in blood and is constantly regulated by insulin. Insulin is a hormone, produced by the
pancreas, which is essential in carbohydrate and fat metabolism regulation in the body.
Insulin is responsible for cells in the liver, muscle, and fat tissue to incorporate glucose from
the blood, storing it as glycogen inside these tissues (Guyton and Hall 2006). Normal blood
glucose levels are between 4.4 mM and 6.7 mM in an adult. To low or high glucose levels in

Chapter 3 - Materials and Methods
64
blood can result in a health detriment. Physical properties: molecular weight 180.16 g/mol
and melting point 150-152 °C.
3.2.2 Starch (C6H10O5)n
Starch is a highly organized biopolymer composed of two polysaccharides: amylose (25%)
and amylopectin (70-75%) arranged in starch granules. Amylose is a lower-molecular-weight
(MW > 105) crystalline linear biopolymer compressed by glucose residues linked by α(1→4)
bonds (Figure 3.1a). On the other hand, the semicrystalline branched biopolymer
amylopectin is a high-molecular-weight (MW > 106), with a linear chain of α(1→4) glucose
residues and branched point linked by α(1→6) bonds occurring every 25 units of glucose
(Figure 3.1b). As starchy foods are very important part of our diet, starch from corn (S4126,
Sigma-Aldrich, UK) was used to study digestion.
Figure 3.1 Starch structure (a) amylose and (b) amylopectin (Chaplin, 2012)
3.2.3 Biopolymers and soluble fibres
Since soluble viscous polysaccharides such as guar gum, pectin and CMC have a significant
effect on glucose and insulin tolerance when added to food (Ellis et al., 1995; Blackburn,
Holgate and Read, 1984; Jenkins et al., 1978), they were chosen to study the effect of food
(a) (b)

Chapter 3 - Materials and Methods
65
formulation on absorption by increasing the viscosity of the sample. As intestinal enzymes
cannot hydrolyze these biopolymers, soluble fibres remain undigested in the small intestine.
3.2.3.1 Guar Gum
Guar gum is a galactomanan extracted from the endosperm of the seed of Cyamopsis
tetragonolobus. The principal backbone is a chain of -(1,4)-D-mannopyranosyl units with
single -(1-6)-D-galactopyranosyl units linked to the main chain. The mannose:galactose
ratio is 1.2 to 1.8, however, this can change according to the temperature of the solution
(Casas et al., 2000). Guar gum (105008, ICN Biomedicals, USA) has been employed in this
research to modify the formulation of the food by improving viscosity, as it has shown to be
one of the most effective soluble fibres to reduce the glucose blood levels (Blackburn et al.,
1984).
3.2.3.2 Carboxymethyl cellulose (CMC)
Carboxymethyl cellulose sodium salt high viscosity (C5013, supplied by Sigma-Aldrich, UK)
was used in glucose absorption studies to improve the viscosity of the sample. CMC is a
slightly yellowish powder derived from cellulose with a linear chain of -1,4 linked glucose
units and carboxymethyl groups. Due to its properties CMC is used as a thickener, stabilizer
and suspending agent. Like guar, by adding CMC the viscosity of the digesta can be
modified.
3.2.3.3 Citrus pectin
Pectin is a poly-D-galacturonic acid methyl ester commonly extracted from the apple pomace
and citrus peel. Due to its ability to form hydrogels upon addition of divalent cations such as
Ca++, pectin has been widely used in the food and pharma industries to produce gel

Chapter 3 - Materials and Methods
66
microstructures. Pectin could also be used as a functional ingredient in food or drink
preparations to reduce postprandial glucose levels in both normal and diabetic patients. On
this context, citrus pectin high methoxyl (7680, degree of esterification ~60% from Fluka,
UK) was used to increase the viscosity of glucose solutions and to estimate the effect that
mixing frequency has on absorption. Compare to low methoxyl-pectin, high-methoxyl pectin
was selected in this research due to its greater inhibitive effect on intestinal absorption of
glucose (Kim, 2005).
3.2.3.4 Sodium Alginate
Extracted from the native brown seaweed (Phaeophyceae), alginate is an unbranched block
copolymer composed of 1-4-linked residues of β-D-mannuronic acid and -L-guluronic acid.
Since alginate produces hydrogel membranes for encapsulation, whose characteristics (gel
thickness, volume, mechanical resistance and porosity) can be easily modified, encapsulation
of actives was done by using sodium alginate as encapsulating material. Gelling microspheres
were produced with sodium alginate supplied by Sigma-Aldrich, UK (section 7.2) whereas
liposomes were made with sodium alginate isolated from laminaria Hyperborea, high in
guluronate residues, from FMC Biopolymer (Norway), section 7.3.
3.2.4 Enzymes
For starch digestion studies, two enzymes were used: α-amylase isolated from porcine
pancreas (EC 3.2.1.1. A3176 Type VI-B, ≥ 30 units/mg solid, Sigma, UK) and
amyloglucosidase isolated from Aspergillus niger (EC 3.2.1.3. A7095, ≥ 300 U/mL, aqueous
solution, Sigma, UK). Both enzymes were used together at ‘physiological concentrations’ to
mimic the starch-containing food digestion in the intestinal lumen. Although data in the
literature are sparse and hence difficult to define concentrations of pancreatic enzymes in the
Chapter 3 - Materials and Methods
67
duodenum, α-amylase secretions in adults has been reported between 5-15 nM (Slaughter et
al., 2001). α-Amylase is a glycoprotein with a single polypeptide chain of ~475 residues
containing two SH groups and four disulfide bridges. For activity and stability this enzyme
requires both calcium and chlorine ions. As specified by the supplier the pH range for activity
is from 5.5 to 8.0, with the pH optimum at 7.
Amyloglucosidase (AMG) from A. niger was used to convert maltose and maltodextrins to
glucose in the lumen side of the SIM, mimicking hydrolysis occurring by the microflora
present in the intestinal wall. AMG from Aspergillus or Rhizopous have been extensively
used in mechanism of digestion in vitro to complete hydrolysis of carbohydrates to glucose
(Englysh et al. (1992). Commercial pancreatin was not used in this work as the amylase
activity in unknown and only starch was used as food model.
3.3. Small Intestine Model description
The small intestine model (SIM) used in this work, was designed and implemented by
Tharakan (2008) in the School of Chemical Engineering at the University of Birmingham,
UK. The SIM functions as a concentrically mass transfer exchanger composed of an inner
semi-permeable RC membrane (Spectra/Por 7®, MWCO 8000 Daltons, 32 mm of diameter,
Medicell International Ltd London, UK) and an outer non-active and impermeable silicone
transparent tubing (Flexible Hose Supplies, UK, diameter of 50 mm and wall thickness 3
mm). This dynamic in vitro model has a unique pneumatic mechanism to reproduce the
characteristic segmentation movements responsible for the flow and mixing in the human
small intestine.

Chapter 3 - Materials and Methods
68
3.3.1. Membrane description/characteristics
A semi-permeable membrane of regenerated cellulose RC (Spectra/Por® 7 Dialysis
Membrane Medicell International Ltd., London, UK) was used to represent the lumen side of
the small intestine model (SIM). This is a flexible, transparent membrane with an
approximate Molecular Weight Cut Off (MWCO) of 8000 Daltons, a nominal thickness of
0.05 mm and flat width of 50 mm. RC membranes are stable in a pH range of 5 - 9,
compatible with most organics, with no fixed charges and no absorption of most of the
solutes.
Although semi-permeable membranes have been widely used to mimic absorption of actives
(e.g. TIM models), they have limitations on reproducing absorption processes. Within most
of commercial membranes, only mechanisms of diffusion can be modelled. Their anatomical
and physiological features restrict their used when active transport process of substances such
as glucose, needs to be mimicked. A permeable membrane of cellulose has neither the
characteristic anatomical structure of the intestinal wall (villus and microvillis) nor the plasma
membrane of the epithelium cells as shown in Figures 2.9 and 2.10. Therefore, the area
available for absorption in the SIM is reduced to 0.05 m2 and re-circulation of intestinal
content must be done. By using the SIM model only part of the absorption process can be
predicted. On the other hand, the concentration of glucose in the recipient side of the SIM can
be compared with blood glucose levels in adults (4.4 mM and 6.7 mM), after clearance of
absorbed molecules from the circulation by the liver and the other organs and tissues.
3.3.2 The core section of the SIM: lumen and recipient sides
The SIM comprises by two independent and flexible compartments: the food or lumen side
where digestion reactions take place and the recipient side where the products of absorption

Chapter 3 - Materials and Methods
69
can be collected. The inner side or lumen of the SIM is represented by the semi-permeable
dialysis membrane described in section 3.3.1, with a characteristic length of 50 cm and 3.0
cm of diameter, whereas the outer or recipient side is represented by an outer transparent tube
(50 cm and a 5 cm of diameter). Each side of the SIM, including the membrane and the
transparent tube were holding on independent stainless steel tube claps with fluid
inlets/outlets for the inner and outer side as shown in Figure 3.2a. The membrane and the
tubing were held in place using on each end two rubber gaskets and two aluminum hose
clamps, respectively, to form water tight seals and to avoid leaks during experimentation. The
design used a length of 50 cm of tubing available for mass transfer. The flexible tubing
allowed being deformed in a physiologically representative manner (Tharakan, 2008).
As shown in Figure 3.2 and 3.3, each compartment (lumen and recipient side) includes a
peristaltic pump (Watson-Marlow, 323S/D) to feed and propels the solution into the system
along with a surge tank or reservoir for fluids storage. The following lists the main
components of the small intestine model (SIM) including the segmentation control section
that will be described in detail in section 3.3.3.
3.3.3 The mixing or segmentation mechanism
Segmentation contractions in the SIM were produced by inflation and deflation of two
inflatable rubber cuffs (from an Omron Blood Pressure monitor) around the wall of the
intestinal rig (Figure 3.2a). When the cuff was fully inflated the external wall of the SIM was
compressed and occluded, generating mixing and propulsion of the lumen content. On the
contrary, when the cuff was deflated relaxation of the membrane was produced. In the SIM,
inflation was induced by supplying pressurized air into the cuff whereas deflation was
attained by applying vacuum. The air flow and vacuum were controlled by solenoid valves

Chapter 3 - Materials and Methods
70
(Burkert W2YLE, Germany) fixed on a control panel (Figure 3.2b). The opening or closing
of the solenoid valves was automatically controlled by a programmable logic controller
(PLC, National Instruments NI USB-9162) connected to a computer by the National
Instruments NI-DAWMAX software. The PLC was powered by a 24V power supply (Power-
one, 24VDC at 2.4A). A pressure indicator (Sunx: DP2-42E) was used to monitor the rate at
which the cuff was inflated by the compressed air. Additionally, pressure relief valves
(Norgen: 61B2) were implemented to the compressed air lines for safety reasons.
Figure 3.2 Small Intestine Model (SIM), (a) membrane and inflatable cuffs and (b) solenoid valves panel to control the segmentation pneumatic mechanisms.
(a)
(b)
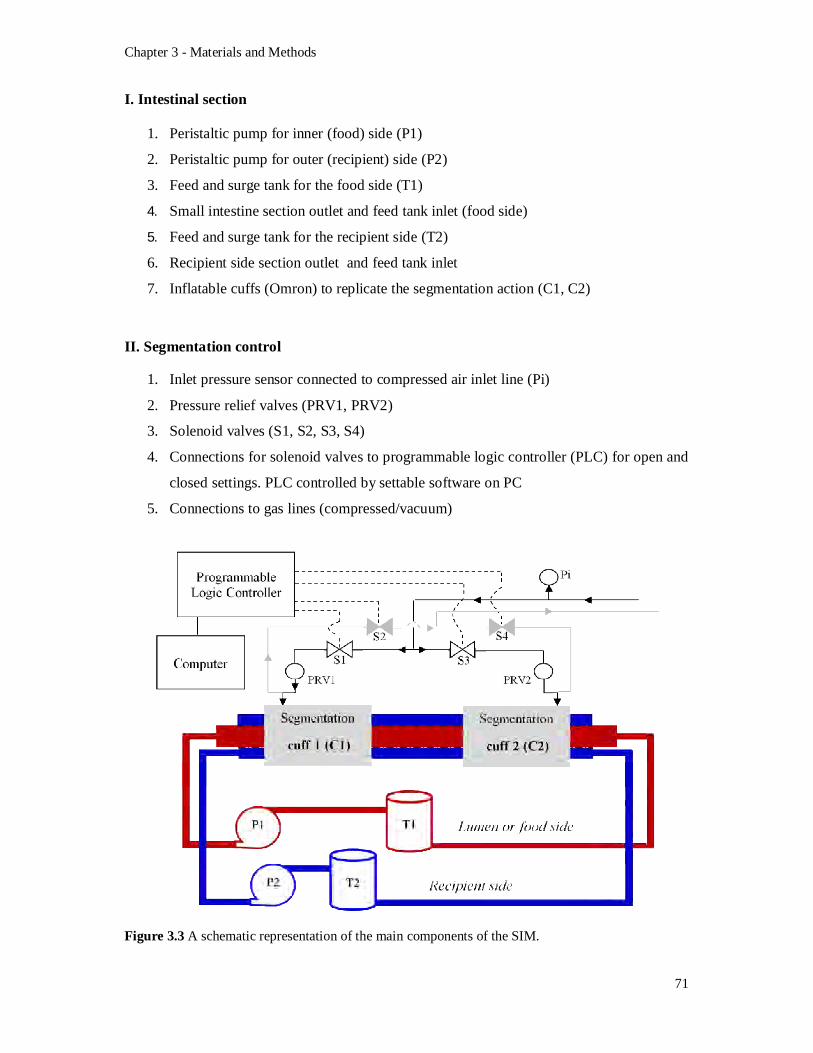
Chapter 3 - Materials and Methods
71
I. Intestinal section
1. Peristaltic pump for inner (food) side (P1)
2. Peristaltic pump for outer (recipient) side (P2)
3. Feed and surge tank for the food side (T1)
4. Small intestine section outlet and feed tank inlet (food side)
5. Feed and surge tank for the recipient side (T2)
6. Recipient side section outlet and feed tank inlet
7. Inflatable cuffs (Omron) to replicate the segmentation action (C1, C2)
II. Segmentation control
1. Inlet pressure sensor connected to compressed air inlet line (Pi)
2. Pressure relief valves (PRV1, PRV2)
3. Solenoid valves (S1, S2, S3, S4)
4. Connections for solenoid valves to programmable logic controller (PLC) for open and
closed settings. PLC controlled by settable software on PC
5. Connections to gas lines (compressed/vacuum)
Figure 3.3 A schematic representation of the main components of the SIM.

Chapter 3 - Materials and Methods
72
The SIM was designed to give flexibility on the segmentation sequences by controlling the
inflation, deflation and delay time intervals (1-6 s) through a LabVIEW programme designed
by Derek Green from the School of Biosciences in the University of Birmingham, UK.
3.4 Methods
This section is divided into four parts that explain in detail the methodology used to gain a
better understanding of the impact that mixing and food formulation have on digestion and
absorption occurring in the upper small intestine. The methods described here are organized
according to the next chapters as follows:
(i) Absorption of actives (Chapter 4)
(ii) Starch digestion and glucose absorption (Chapter 5)
(iii) Flow visualization techniques (Chapter 6) and
(iv) Encapsulation of actives (Chapter 7)
Experiments were carefully designed to reproduce as closely as possible the physiological
features of the gastrointestinal tract emphasizing the flow and mixing processes found in the
human small intestine.
Two configurations of the SIM were used: opened and closed
I. Closed SIM configuration. Chyme was static during the experiment. No net flow
was induced by the peristaltic pump in the lumen side. The only movement of the
chyme was imposed by the segmentation cuffs.
II. Opened SIM configuration. In the opened SIM configuration, both peristalsis
and segmentation movements were induced in the lumen side, then chyme was
recirculated several times during the experiment trough the inner side (membrane)
Chapter 3 - Materials and Methods
73
of the SIM to obtain representative data since the surface area of the small
intestine is much larger than that of a tube with the same diameter.
Both experiments were done for at least one hour to obtain representative data on glucose
absorption.
3.4.1. Absorption of glucose in the SIM
As food formulation plays a key point in the rate of absorption and delivery of molecules. A
series of experiments were performed in the SIM to study (i) the effect of mixing and food
formulation on glucose absorption and then (ii) the effect of the frequency of contractions and
food formulation on absorptive processes through the membrane.
3.4.1.1 Effect of mixing and food formulation
The effect of mixing and food formulation, specifically viscosity, on glucose absorption rates
was investigated in the closed SIM configuration (with no net flow in the lumen side).
Experiments were performed using aqueous solutions, as a control, and the biopolymers:
guar gum (0.1%, w/v) and CMC (0.1 and 0.5%, w/v) when segmentation and no
segmentation take place in the SIM (Table 3.1). The biopolymer (0.1 – 0.5%, w/v) and
glucose (55 mM) were homogeneously dispersed in distilled water using a magnetic stirrer
for two hours to ensure the complete hydration of the biopolymer.
The biopolymer-glucose solution was placed in the dialysis membrane (approximately 400
mL) and in the outside tubing the active was collected. Distilled water (1.0 L) was used in the
outer tube for all experiments. The experiment was run at room temperature by around 1 hour
taking samples every 10 minutes. All samples were prepared the same day of use. Two
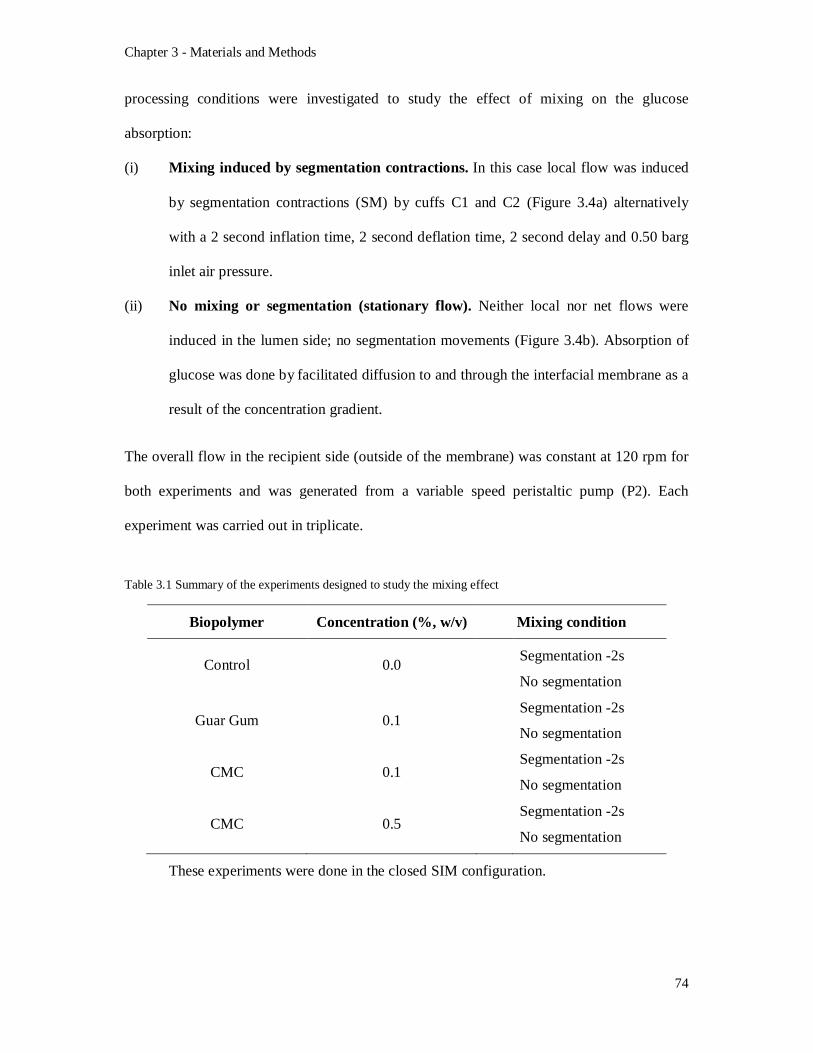
Chapter 3 - Materials and Methods
74
processing conditions were investigated to study the effect of mixing on the glucose
absorption:
(i) Mixing induced by segmentation contractions. In this case local flow was induced
by segmentation contractions (SM) by cuffs C1 and C2 (Figure 3.4a) alternatively
with a 2 second inflation time, 2 second deflation time, 2 second delay and 0.50 barg
inlet air pressure.
(ii) No mixing or segmentation (stationary flow). Neither local nor net flows were
induced in the lumen side; no segmentation movements (Figure 3.4b). Absorption of
glucose was done by facilitated diffusion to and through the interfacial membrane as a
result of the concentration gradient.
The overall flow in the recipient side (outside of the membrane) was constant at 120 rpm for
both experiments and was generated from a variable speed peristaltic pump (P2). Each
experiment was carried out in triplicate.
Table 3.1 Summary of the experiments designed to study the mixing effect
Biopolymer Concentration (%, w/v) Mixing condition
Control 0.0 Segmentation -2s
No segmentation
Guar Gum 0.1 Segmentation -2s
No segmentation
CMC 0.1 Segmentation -2s
No segmentation
CMC 0.5 Segmentation -2s
No segmentation
These experiments were done in the closed SIM configuration.

Chapter 3 - Materials and Methods
75
Figure 3.4 Photographs of the SIM (a) with and (b) without segmentation contraction cuffs
Intestinal Cell Set up Characteristics. The mass transfer cell (dialysis membrane) had a
length of 0.5 m that could be extended and adjusted according to the experiment; the cuff
length was 0.12 m, the inner tube and the outer tube had a diameter of 0.03 m and 0.05 m,
respectively.
3.4.1.2 Effect of frequency of contractions and food formulation
As glucose absorption could be influenced by the wall movements of the small intestine
(Macagno et al., 1982), the experiments described here were designed to study the effect of
different mixing frequencies (1, 2 and 3s-1) on glucose absorption.
To study the effect that the number of contractions per minute has on glucose absorption a
series of experiments was carried out by changing the frequency at which segmentation
contractions took place in the SIM.
(b)
(a)

Chapter 3 - Materials and Methods
76
The formulation or viscosity of the luminal side was changed by using a range of
biopolymers: guar gum, citrus pectin and CMC at different concentrations (Table 3.2) in a
limited range of viscosities (0.1 - 3.0 Pa.s). The range of viscosities selected is in the range
found by Marciani et al., (2000) from highly viscous meals after their transit through the
stomach. The study was done when segmentation was applied to the opened SIM in which
chyme was recirculated by means of a peristaltic pump (P1, Figure 3.2) during 1 hour
through the inner side of the SIM to obtain representative data. Contrary to the previous
experiment, here flow and mixing in the SIM were induced by peristalsis (net flow) and
segmentation (local flow). The overall net flow in the lumen side was constant at 1.6 x 10⁻⁴
m3/s for all the experiments and was generated from a variable speed peristaltic pump. The
segmentation movement responsible for mixing of the intestinal content was reproduced as
described in section 3.3.3 by the occlusion of the tube with the use of inflatable bladders.
For this experiment, each biopolymer (guar, pectin and CMC) was dissolved in 2.0 L of
glucose solution (55 mM) where they were homogeneously dispersed overnight by means of
an overheard digital stirrer with a helical impeller at approximately 600 rpm.
The solution was placed in the dialysis membrane side (650 mL) and in the outside tubing the
active - glucose - was collected. Distilled water (1.0 L) was used in the outer tube for all
experiments. The experiment was run at room temperature by around one hour taking
samples every 10 minutes.

Chapter 3 - Materials and Methods
77
Table 3.2 Summary of the experiments designed to study the effect of frequency of contractions
Biopolymer
Concentration (%, w/v)
Mixing frequencies
Control 0.00 1s 2s 3s
Guar Gum
0.25 0.50 0.65 0.75
1s 2s 3s
Pectin
1.00 2.00 2.50 3.00
1s 2s 3s
CMC 0.25 0.50 1.00 1.25
1s 2s 3s
These experiments were done in the opened SIM configuration under segmentation
conditions.
3.4.2 Density and viscosity measurements
The density of the viscous solutions was measured at least in triplicates by using a calibrated
pycnometer at 25 °C. Distilled water was used as a reference.
The apparent viscosity of the biopolymers were determined using an AR1000 rheometer (TA
instruments Newcastle, Delaware, USA) equipped with an acrylic plate geometry (0.06 m
diameter). Each experiment was repeated in triplicate at 25 °C. Based on the literature survey,
viscometry profiles were acquired at different shear rates ranging from 0.1 to 1000 (1/s)
(Marciani et al., 2000). Zero-shear viscosity (o) values (in Pa.s or mPa.s) were calculated
from the viscosity/shear-rate profiles for each biopolymer. The viscometry profiles for each
concentration of guar, pectin and CMC as a function of the applied shear rate ( ) are shown
in Figure 3.5 (a-c).

Chapter 3 - Materials and Methods
78
Figure 3.5 Viscosity profiles of solutions of glucose (55 mM) added with (a) guar gum, (b) high methoxyl pectin and (c) CMC at various concentrations.
For aqueous solutions the viscosity and density were assumed to be the same as those for
water at 25 °C: 8.904 x 10⁻⁴ kg/m3 CRC Handbook of Chemistry and Physics (1989) and
997.08 kg/m3 (Perry et al., 1973), respectively.
3.4.3 Glucose determination
Diffusion across the membrane was monitored at time intervals during one hour by
measuring glucose concentration in the recipient side using the method of 3,5-dinitrosalicylic
acid (DNS) reagent for reducing sugars (Miller, 1959). This method tests for the presence of
Shear rate (1/s)
0.01 0.1 1 10 100 1000 10000
Visc
osity
(Pa.
s)
0.001
0.01
0.1
1
10
0.25% (w/v)0.50% (w/v)0.65% (w/v)0.75% (w/v)
Shear rate (1/s)
0.01 0.1 1 10 100 1000 10000
Vis
cosi
ty (P
a.s)
0.01
0.1
1
1.0% (w/v) 2.0% (w/v)2.5% (w/v) 3.0% (w/v)
Shear rate (1/s)
0.01 0.1 1 10 100 1000 10000
Vis
cosi
ty (P
a.s)
0.01
0.1
1
0.25% (w/v) 0.50% (w/v) 1.00% (w/v) 1.25% (w/v)
(c)
(b) (a)

Chapter 3 - Materials and Methods
79
the free carbonyl group (C=O) in monosaccharides. The reaction involves the oxidation of the
aldehyde functional group present in glucose to a carboxylate ion group under alkali
conditions. Simultaneously, the DNS reagent is reduced to 3-amino-5-nitrosalicylic acid. For
the determination of reducing sugars a UV-VIS spectrophotometer Libra S12 (Biochrom,
Cambridge, UK) was used for measuring the absorbance of the standards and samples at 540
nm. All absorbance measurements were done at least in duplicates.
For glucose calibration curve (Figure 3.6) standards covering the range 0 - 5.0 mM in the
final assay solution were used. The standards were assayed by the same procedure as the
samples. Reducing sugar concentrations were expressed as glucose equivalents.
Glucose concnetration (mM)
0 1 2 3 4 5 6
Abs
orba
nce
at 5
40 n
m
0.0
0.2
0.4
0.6
0.8
1.0
1.2
1.4
Figure 3.6 Glucose calibration curve in a range from 0.0 to 5.0 mM
3.4.4 Mass transfer coefficients
Overall mass transfer coefficients (K) were estimated by Equation 3.1.
푁 = 퐾(푐 − 푐 ) (3.1)
where N1 is the molar flux (mmol/m2s) including both diffusion and convection and ci
(mol/m3) is the concentration at the interface of the same fluid as the bulk concentration c∞
y = 0.0277x - 0.0421 r = 0.997

Chapter 3 - Materials and Methods
80
(mmol/m3). The reciprocal of the overall mass transfer coefficient K can be represented by
the sum of the film resistances and that through the membrane and the recipient side
(Equation 3.2)
= + + (3.2)
where kbp is the biopolymer side mass transfer coefficient, Dmem is the diffusion coefficient of
nutrient through the membrane, lmem is the thickness of the membrane and krep is the recipient
side mass transfer coefficient.
To find the mass transfer enhancement from mixing it is important to calculate the Sherwood
number (Equation 3.3)
푆ℎ = (3.3)
where kbp is the biopolymer side mass transfer coefficient, L is the length scale (0.032 m) and
DAB is the diffusion coefficient of glucose 6.9 x 10⁻¹⁰ m2/s (Perry et al., 1973).
3.4.5 Chemical Digestion in the SIM
Chemical digestion in the SIM involves the breakdown of macromolecules such as proteins,
lipids and carbohydrates into small molecules, amino acids, fatty acids and sugars,
respectively. Since glucose blood levels could be correlated in vitro to the starch digestion
rates, this work was limited to starch-containing foods.
Chapter 3 - Materials and Methods
81
3.4.5.1 Starch preparation
Corn starch (0.5 – 3.0%, w/v) was previously gelatinized in a boiling water bath during 30
minutes with intermitted mixing. After gelatinization, the starch solution was cooled at room
temperature.
3.4.5.2. Enzyme preparation
Pancreatic -amylase (Type VI-B, ≥10 units/mg solid, A3176 Sigma) and 0.5 ml of
amyloglucosidase (from Aspergillus niger, ≥ 300 U/mL, aqueous solution, A7095, Sigma)
were dissolved in a pancreatic mix solution (50 ml) at room temperature. The pancreatic mix
solution was prepared by dissolving in 1 L of distilled water the following salts: NaCl
(146mM), KCl (4.8mM), CaCl2 (2.6mM), MgCl2 (0.3 mM), ZnSO4·7H2O (4.1 M). These
concentrations are based on those reported by Lo Curto et al. (2011) and Madalari et al.
(2010b) from the Instutite of Food Research in Norwich, UK.
3.4.5.3 Gastric digestion
Gastric digestion was mimicked by reducing the pH of the corn starch solution from 5.5 to
2.5 with 1.0 M HCl. After 30 min, the solution was neutralized increasing the pH from 2.5 to
6.5 with 1.0 M NaHCO3 or 0.1 N NaOH. BIS-Tris buffer (0.1 M, Sigma-Aldrich, UK) to
adjust the pH of the samples at 6.5. For mimicking this step and considering that most of the
starch hydrolysis occurs in the mouth and the intestine, no enzymes were added to the
solution.
3.4.5.4 Intestinal digestion in the SIM
The starch was fed into the lumen side of the SIM. Starch digestion started when the
pancreatic mix solution (50 ml) containing -amylase (300 U/l) was pumped into the

Chapter 3 - Materials and Methods
82
membrane (~3 ml/min). The enzyme solution (25 or 50 ml) was freshly prepared for the
digestion analysis by dissolving the pancreatic α-amylase (25 U/ml) and amyloglucosidase (3
U/ml) into the pancreatic solution for 10 minutes at room temperature. Starch digestion was
done by using two in vitro models: (i) a stirred tank reactor and (ii) a small intestine model.
I. Stirred Tank Reactor (STR). Starch hydrolysis was carried out in a STR (Figure 3.7a)
equipped with a Rushton turbine impeller and four baffles to create turbulence increasing the
mixing. During the reaction, the impeller speed, temperature, and pH were kept constant at
300 ± 50 rpm, 25 ± 2 °C and 6.50 ± 0.05, respectively. The reactions were carried out in 250
ml of aqueous solutions containing 10 g/l corn starch.
II. Small Intestine Model (SIM). The digestion of starch was carried out in the inner tubing
(membrane) or lumen side (Figure 3.7b) with 600 ml of liquid and semisolid food system
containing 10 g/l corn starch. For these experiments, the closed-SIM configuration was used.
The reaction was started by pumping the pancreatic mix solution into the reactor of the STR
or in the lumen side of the SIM at ~3.0 ml/min (Figure 3.7 a,b).
As before, two configurations were used for studying starch and food digestion: an open and
a closed SIM.
(a) (b)
Figure 3.7 In vitro models used for starch hydrolysis, (a) Stirred Tank Reactor (STR) and (b) Small Intestine Model (SIM).
0.08 m
0.0085 m
0.045 m
0.075 m
Pancreatic solution
0.02 m
0.12 m
Inner tube Lumen side Biopolymer
Outer tube Recipient side Water side
Pancreatic solution
0.5 m
0.6 m
0.0305 m
Chapter 3 - Materials and Methods
83
One of the innovations of the SIM compared with previous works is the implementation of an
internal system to feed the enzyme into the SIM (similar to the pancreatic duct in the
duodenum). As a first approach a long polypropylene tubing (3 mm of diameter) was
introduced in the membrane section to feed the enzymes. This system allows changing the
flow rate at which the enzyme is fed into the lumen side.
Food formulation was evaluated by adding guar (0.5%, w/v) to solutions of starch and white
bread as model foods. For bread (50 g), the aqueous solution containing 0.5% (w/v) of guar
was added into small pieces (~ 5 mm) simulating mechanical breakdown in mouth. In both
cases, 1.0 L of the solution was prepared. Experiments were carried out in the closed-SIM
configuration.
Preliminary experiments were done in the open-SIM configuration to study the effect of both
flow rate and enzyme concentration on starch digestion. These experiments were carried out
using corn starch solutions (1.0%, w/v) after gastric digestion section. For intestinal
digestion, the enzyme solution (50 ml) was freshly prepared for the digestion analysis by
dissolving the pancreatic α-amylase (2.5 and 25 U/ml) and amyloglucosidase (3 U/ml) into a
pancreatic mix solution for 10 minutes at room temperature. The reaction was started by
pumping the pancreatic solution into the SIM at 0.3 and 3.0 ml/min. The feeding flow rates at
which the pancreatic solution was injected to the lumen side of the SIM were 0.3 and 3.0
ml/min. All combinations were tested to evaluate the effect of the way at which the enzymes
were fed into the system.

Chapter 3 - Materials and Methods
84
Simulation of intestinal digestive processes is very challenging due to the difficulty to assess
the small intestine environment and the variability of physiological conditions such as
enzymes concentration and flow rates from person to person.
A number of conditions were studied to validate digestion and absorption processes in the
SIM. As such, the flow of the enzyme solution together within the concentration of both
enzyme and starch were studied in preliminary experiments as described in Table 3.3.
Table 3.3 Summary of the experiments done for studying starch hydrolysis
Factors Experiment 1 Experiment 2 Experiment 3
Starch concentration
1.0% (w/v)
1.0% (w/v) 0.5% (w/v)
2.0% (w/v)
3.0% (w/v)
Enzyme concentration
10 U/ml 5 U/ml
10 U/ml
15 U/ml
15 U/ml
Feeding enzyme
flow rate
1.5 ml/min
3.0 ml/min
4.5 ml/min
3.0 ml/min
3.0 ml/min
Experiments done in the closed SIM configuration at pH 6.5 and room temperature at 2s segmentation All experiments were performed in triplicate. No previous gastric digestion was done in these experiments. Following the first section of glucose absorption, the effect of the food formulation and
mixing frequencies were also evaluated (Table 3.4). Starch-containing foods were formulated
by adding guar gum at different concentrations.

Chapter 3 - Materials and Methods
85
Table 3.4 Summary of the experiments done for studying the effect of food formulation on starch digestion
Biopolymer
Concentration (%, w/v)
Mixing frequency
Control 0.00 2s
Guar Gum
0.25
0.50
0.75
2s
Experiments done in the closed SIM configuration at pH 6.5 and room temperature All experiments were performed in triplicate.
Glucose concentration was monitored in the lumen and the recipient side (outer tube).
Samples (1.0 mL) were taken at time intervals to determine glucose absorption. The
concentration of reducing sugars was calculated following the method of 3,5-dinitrosalicylic
acid (DNS) reagent for reducing sugars measured samples absorbance using a UV-VIS
spectrophotometer Libra S12 (Biochrom, Cambridge, UK) at 540 nm. For glucose calibration
curve, standards covering the range 0 - 5mM in the final assay solution were used. The
standards were assayed by the same procedure as the samples. Reducing sugar concentrations
were expressed as glucose equivalents.
3.4.5.5 Data analysis
The starch hydrolysis results were analyzed according to the rate of digestion (lumen side)
and absorption (recipient side) calculating the slope of the curve by linear regression using
the method of least squares. These results were used later to calculate the overall mass
transfer coefficients as described in section 3.4.4.

Chapter 3 - Materials and Methods
86
Kinetic parameters
The in vitro kinetic parameters, based on Michaelis-Menten kinetics as described below for
starch hydrolysis were estimated from the progress of the reaction. This relation assumes that
the concentration of substrate (starch) is much bigger that the concentration of the enzyme.
The Michaelis-Menten equation in the differential form can be used to describe the dynamics
of substrate depletion as described in Equation 3.4
= − (3.4)
where S is the substrate concentration, and Vmax and Km are the maximal rate and Michaelis
half saturation constant, respectively. Equation 3.4 can be readily integrated to obtain the
integral form of the Michaelis-Menten (Equation 3.5.)
퐾 ln + 푆 − 푆 = 푉 푡 (3.5)
where So is the initial substrate concentration. The parameters of equation 3.5 were initially
estimated by linearization and then recalculated using an explicit solution based on the
Lamber W function (Goudar et al., 2004).
3.4.6. Flow visualization techniques
Particle imaging techniques measure the motion of a fluid on a small pre-determined region.
Various techniques are available for flow visualisation in which markers are added at various
densities. Two or more successive images are taken one after another and from the positions
of the markers on the successive images; the flow field can be reconstituted.

Chapter 3 - Materials and Methods
87
3.4.6.1 Planar Laser Induced Fluoresce (PLIF)
The PLIF technique is a non-intrusive approach to visualize the mixing mechanisms
characterized by the tracer concentration -in this case Rhodamine 6G was selected for its
fluorescence properties. The principle is based on the monotonic relationship between the
tracer concentration and the fluorescence intensity (Hu et al., 2010).
Experimental cell configuration
The PLIF experiments were carried out in a Perspex rectangular cell (Figure 3.8), designed
and implemented by Tharakan (2008) for this specific purpose. Within a length of 0.2 m and
a height of 0.055 m, the cell containing an inner Perspex cylinder in the middle at which 20
cm of a transparent polypropylene tube was attached at both ending sides of the SIM (Figure
3.8 and 3.9).
Figure 3.8 Experimental SIM set up including visualization cell for PLIF experiments.

Chapter 3 - Materials and Methods
88
PLIF/PIV system has a modular design comprised of a TSI Powerview system (TSI Inc.
USA) which is made from the following: (i) a single 1000×1016 pixel, (ii) 8 bit Charged
Coupled Device (CCD) camera (TSI PIVCAM 10-30, TSI Inc, USA); (iii) synchronizer, (iv)
a dual head Nd-Yag laser emitting at 532 nm (New Wave Inc., USA); and (v) laser sheet
optics. The synchronizer is controlled by a Dell Precision 620 workstation (Dell Corp. USA)
that triggers the laser pulse and camera with the correct sequence and timing. PLIF images
were captured by a high speed CCD camera within a very short time between them as a
sequence.
Figure 3.9 PLIF Experimental Set up
Cuff 1
Visualisation cell
Laser
Cuff 2

Chapter 3 - Materials and Methods
89
For these experiments, a -15 mm cylindrical lens and a 200 mm spherical lens were used, to
give a minimum thickness of the laser sheet. The system was controlled by the INSIGHT 6.0
software.
After fixing the relative position of the SIM, the laser and the camera, three different
concentrations of Rhodamine B previously dissolved in the correspondent liquid (water,
CMC 0.5 or 1.0%, w/v) were filled in the stirred tank, then the fluorescence signals captured
by the high speed camera were used for further calibration.
In the intestinal lumen, liquids are viscous with non-Newtonian characteristics. In these
experiments, distilled water (control) and CMC solutions at two different concentrations (0.5
and 1.0%, w/v) were fed into the SIM to investigate the effect of the liquid viscosity on the
mixing. The zero-shear viscosity of the solutions were 20 and 200 mPa.s for CMC 0.5%
(w/v) and CMC 1.0% (w/v), respectively with a Reynolds number between 10 and 100. For
the purposes of PLIF a single frame was captured each time and a sharp cut-off high-pass
wavelength filter (ALP545, TSI Inc.) was used on the camera to eliminate the light from the
laser and only allow fluorescent light from the tracer fluid to pass through. Images were
captured at a rate of 2.0 Hz and the experiments were conducted for approximately 60
seconds.
Once the inner cylindrical system was homogenously filled with the distilled water and the
CMC solution, the acrylic box was filled with tap water to reduce the light distortion due to
the curved surface. 0.2 ml of fluorescent dye (Rhodamine 6G, Sigma Aldrich) was introduced
as the tracer (at a concentration of 0.5 mg/l) into the fluid by a syringe at the centre of the
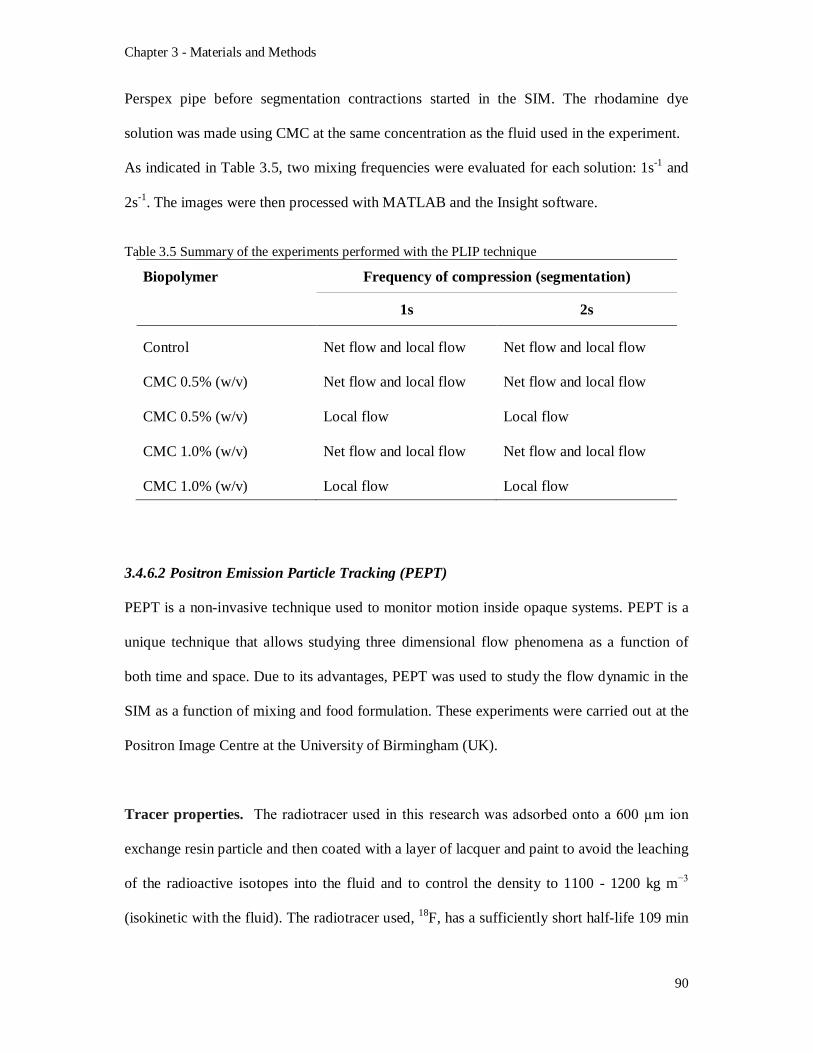
Chapter 3 - Materials and Methods
90
Perspex pipe before segmentation contractions started in the SIM. The rhodamine dye
solution was made using CMC at the same concentration as the fluid used in the experiment.
As indicated in Table 3.5, two mixing frequencies were evaluated for each solution: 1s-1 and
2s-1. The images were then processed with MATLAB and the Insight software.
Table 3.5 Summary of the experiments performed with the PLIP technique
Biopolymer Frequency of compression (segmentation)
1s 2s
Control Net flow and local flow Net flow and local flow
CMC 0.5% (w/v) Net flow and local flow Net flow and local flow
CMC 0.5% (w/v) Local flow Local flow
CMC 1.0% (w/v) Net flow and local flow Net flow and local flow
CMC 1.0% (w/v) Local flow Local flow
3.4.6.2 Positron Emission Particle Tracking (PEPT)
PEPT is a non-invasive technique used to monitor motion inside opaque systems. PEPT is a
unique technique that allows studying three dimensional flow phenomena as a function of
both time and space. Due to its advantages, PEPT was used to study the flow dynamic in the
SIM as a function of mixing and food formulation. These experiments were carried out at the
Positron Image Centre at the University of Birmingham (UK).
Tracer properties. The radiotracer used in this research was adsorbed onto a 600 µm ion
exchange resin particle and then coated with a layer of lacquer and paint to avoid the leaching
of the radioactive isotopes into the fluid and to control the density to 1100 - 1200 kg m−3
(isokinetic with the fluid). The radiotracer used, 18F, has a sufficiently short half-life 109 min

Chapter 3 - Materials and Methods
91
that radiation does not persist in the system. The tracer was added to the fluid and used to
track the fluid motion in the SIM.
PEPT camera. The motion of the tracer was tracked using an ADAC Forte positron camera
(Parker et al., 2002) which employs two digital camera heads of size 500 × 400 mm2
operating in coincidence, the separation of the heads was adjusted to a maximum of 100 cm.
The size of the camera field of view is therefore 800 × 500 × 400 mm3. Each detector head
contains a gamma digital camera comprising of a 16 mm thick NaI(Tl) scintillator, backed by
an array of 55 photomultiplier tubes which are connected to analogue to digital converters
and then to a computer.
Experimental set up. First, the lumen side of the SIM was placed between the detectors of
PEPT dual camera leaving a gap of 0.55 m as shown in the Figure 3.10. Then the guar
solution (0.5 or 1.0%, w/v) was fed into the membrane by means of a peristaltic pump
(Watson-Marlow 323S/D). Once the system was filled with the solution the tracer previously
dissolved in 5 ml of the same solution, it was injected with a syringe and a needle BD 16G1
(PrecisionGlide Needle No. 305197) in the tubing of the SIM approximately at 5 cm before
the left exit. Experiments (Table 3.6) were performed on the SIM varying the fluid viscosity
by addition of guar gum (0.5 - 1.0%, w/v). Factors such as mixing frequency and net flow on
the mixing efficiency were studied. Each experiment was performed for at least 50 minutes in
order to ensure sufficient sampling time. A summary of the experiments that were carried out
is given in Table 3.6.

Chapter 3 - Materials and Methods
92
Table 3.6 Summary of the experiments performed with the PEPT camera
Biopolymer Frequency of compression (segmentation)
1s 2s
Guar gum 0.5% (w/v) Net flow and local flow Net flow and local flow
Guar gum 0.5% (w/v) Local flow Local flow
Guar gum 1.0% (w/v) Net flow and local flow Net flow and local flow
Guar gum 1.0% (w/v) Local flow Local flow
From the PEPT experiments, 2-D and 3-D data of the position of the tracer versus time were
obtained. The data obtained from the PEPT experiments were further processed using Matlab
version 7.
Figure 3.10 PEPT Experimental Set up
3.4.7 Encapsulation of actives
To study stability of functional ingredients under gastrointestinal conditions and potential use
in control delivery, riboflavin and alkaline phosphatase were encapsulated in gel particles and
liposomes.
Z
X
Y

Chapter 3 - Materials and Methods
93
3.4.7.1 Gelled particles
Sodium alginate (1.0 - 3.0%, w/v), and riboflavin were homogeneously dispersed in distilled
water by means of a magnetic stirrer. This solution was dropped using a syringe (0.7 mm of
inner diameter) in a second solution, containing CaCl2 (0.1, 0.3 and 0.5 mM) under gentle
stirring. Microspheres (MS) were instantaneously produced by ionotropic gelation. The MS
formed were allowed to stand in the solution for 15 minutes and then separated from the
reaction mixture by filtration and washed with distilled water.
Entrapment efficiency
An indirect method was used to quantify the amount of active trapped in the MS (González-
Rodrı ́ guez et al., 2002). Aliquots from the filtered solutions remaining after removal of the
beads were assayed using a spectrophotometer (CECIL instrument CE 1020) at 665 nm. The
amount of substance entrapped was calculated from the difference between the total amount
of the colorant added and the amount found in the filtered solution.
Release of actives
In order to determine the amount of vitamin released from the MS of alginate, 1.0 g of each
formulation was placed in a STR containing 20 ml of either gastric or intestinal fluid. The
composition of each solution (gastric or intestinal) is described below (Rayment et al., 2009):
Simulated Gastric Fluid (SGF): NaCl 49.0 mM, KCl 11.6 mM, and CaCl2 3.6 mM, simulate
conditions of the stomach and adjust pH to 2.0.
Simulated Intestinal Fluid (SIF): NaCl 111.0 mM, KCl 11.2 mM, CaCl2 2.0 mM and
NaHCO3 16.5 mM, to mimic the pH of the small intestine, pH was adjusted to 7.0.
To simulate the release under gastric conditions, MS were placed in the SGF during 2 hours
and then they were transferred to the SIF. After three hours in the SIF, the remaining MS
Chapter 3 - Materials and Methods
94
were placed in a buffer solution (pH 7.4). Samples (1.0 mL) were taken every hour and then
analysed spectrophotometrically at 445 nm. The release was monitored during five hours.
Percentage of cumulative release was calculated to obtain the dynamic profile release
represented graphically. The release data were expressed as mean ± standard deviation based
on three measurements. All experiments were done at room temperature.
3.4.7.2 Liposomes
Multilamellar vesicles (MLV) were prepared using the dry lipid film hydration method first
developed by Bangham et al. (1965). Briefly, the neutral lipid
Dipalmitoylphosphatidylcholine (DPPC) from Avanti polar lipids was dissolved in a 9:1
solvent mixture of chloroform and methanol. The solvent was evaporated on a rotary
evaporator to obtain a dry film, which was hydrated with a solution of alkaline phosphatase
(ALP) in 10mM Tris HCl buffer pH 7.4 (to give final lipid concentration 32 µmol/ml) in a
round bottomed flask at 45 °C with intermittent vortexing. Unentrapped ALP was removed
from the liposome suspension by repeated centrifugation decanting the supernatant and
washing the pellet with 10mM Tris HCl until no ALP was detected in the supernatant.
Preparation of Gel loaded liposomes
Liposomes loaded with sodium alginate and the enzyme ALP where prepared using the thin
lipid evaporation method described previously and hydrating with a mixture of 1% (w/v)
sodium alginate containing 10mg/ml ALP. Following removal of unentrapped alginate/ALP
the gel loaded liposomes were suspended in 200mM CaCl2 for 30 min to induce gelation of
the entrapped alginate. The diffusion of Ca2+ across the liposome bilayer was facilitated by
increasing the temperature of the liposome suspension to the Tm of DPPC (42 °C) which, has

Chapter 3 - Materials and Methods
95
the effect of increasing bilayer permeability (Hong et al., 2008). The CaCl2 was then removed
by centrifugation and the liposomes were re-suspended in 10mM Tris HCl.
Sizing and zeta potential measurements of liposomal dispersions
The volume mean diameter (VMD) of the liposomes was measured using a Mastersizer
(Malvern Instruments, Malvern, UK) at 25 °C, diluting 30µl of the dispersion to the
appropriate volume with double distilled water. The zeta-potential, which is an indirect
measurement of the liposome surface charge, was measured in 1.0mM Tris HCl pH 7.4 using
a Zetamaster (Malvern Instruments, Malvern, UK).
Entrapment efficiency
The concentration of entrapped ALP was determined using the Bicinchoninic acid (BCA)
assay (Sigma, Poole, UK). Quantification of protein in aqueous solutions using this assay was
determined by the extent of reduction of Cu2+ to Cu+ which was measured colorimetricly
using a UV-VIS spectrophotometer at 562 nm.
Catalytic activity of ALP
Catalytic activity of ALP was determined using an ALP activity kit (ABD Bioquest,
California, USA). Briefly, p-nitrophenyl phosphate (pNPP) acted as the substrate which was
hydrolysed by alkaline phosphatase releasing the chromomeric p-nitrophenol which was
measured using a UV-VIS spectrophotometer at 450 nm. To quantify the protective effect of
encapsulation, samples of ALP loaded liposomes, gel core liposomes and naked ALP were
exposed to simulated gastric pH (pH 2) for up to 2 h. At selected time points samples were
taken and the pH was raised to pH 8 by addition of 1.0M NaOH. The ALP was then released
from the liposomes and gel core liposomes by treatment with 2% (w/v) sodium dodecyl

Chapter 3 - Materials and Methods
96
sulphate and 2% (w/v) sodium citrate. The catalytic activity of the released ALP was then
measured as a function of time exposed to pH 2. The amount of ALP released while
incubated at pH 2 was also monitored, samples were taken over a 2 h period, centrifuged and
the ALP content of the supernatant was quantified using the BCA assay.
pH Stability Study
Samples of liposomes and gel core liposomes loaded with ALP were prepared and stored in
10mM Tris HCl maintained at pH 3.8, 7.4 and 10 at 4 °C. The particle size of the samples
was measured (using the method described above) during storage at selected time intervals up
to 10 days.
Environmental Scanning Electron Microscopy (ESEM)
The external morphology of the liposomes and the gel core liposomes was visualized using
Environmental Scanning Electron Microscopy (ESEM). The internal morphology of the
liposomes was analyzed by Cryogenic Scanning Electron Microscopy (Cryo-SEM). All
ESEM analyses were performed with a Philips XL30 ESEM-FEG. The accelerating voltage
was 3 kV and the working distance 5 mm. Sample preparation for the Cryo-SEM was
performed as follows: Liposomes samples were frozen in liquid nitrogen slush (-196 °C)
under vacuum. The samples were then fractured and coated with a thin layer of gold (approx.
10nm) to make the sample conductive. Finally, each sample was placed on a stage cooled to
around -140 °C to be imaged.
Statistical Analysis
Comparison of means was conducted using a one-way analysis of variance (ANOVA) with
post-hoc Tukey (HSD) test to identify significant differences (p<0.05) between data sets.

Chapter 3 - Materials and Methods
97
3.5 Conclusion
This chapter summarizes the experimental methods used throughout this work to fulfil the
objectives proposed. A description of the chemicals and enzymes used was also included
within this chapter. Glucose, starch and viscous polymers are some of the materials use to
understand digestion and absorption processes occurring in the small intestine using an in
vitro small intestine (SIM). A brief description of the SIM was also included with its main
components. Basically, this chapter was divided accordingly to the following chapters
including; (i) glucose absorption, (ii) starch digestion, (iii) flow visualization and (iv)
encapsulation of actives.

98
CHAPTER 4 - ABSORPTION OF ACTIVES IN THE SIM
4.1. Introduction
The development of functional foods and novel drug formulations require a better
fundamental understanding of digestion and absorption processes occurring in the GI tract.
As the main portal of absorption of the GI tract is the small intestine, Chapters 4 and 5 are
focused in understanding how mass transfer takes place in the SIM during absorption and
digestion, respectively. Absorption of nutrients is needed not simply for energy but general
metabolism and growth. Before absorption can take place in the gut, digestion of food is
required to break polymers and other molecules into small fragments which can be absorbed
through the epithelial cells of the small intestine.
Previous studies have shown that absorption of actives is influenced by the wall intestinal
motility (Nguyen et al., 2008, Udaykumar et al., 2006, Macagno et al., 1982), however, little
evidence exists to relate wall movements generated by peristaltic and segmentation
contractions to mucosal transport. Since the small intestine is not subject to direct quantitative
study (Macagno et al., 1982) due its location, studies on fluid motion and motility are quite
challenging. As such, the development of in vitro models to study digestion and absorption is
increasing. However, absorption models have structural and anatomical limitations that
restrict their use in modelling these processes.
This chapter covers a systematic-quantitative study of the effect that mixing or segmentation
contractions has on mass transfer of actives. As glucose is an essential marker in control
dietary chronic disease such as diabetes, it was selected as the model molecule for
experiments described in the following sections. The effect that mixing and formulation has
on glucose absorption was also studied in the SIM. The chapter is divided into two sections in

Chapter 4. Absorption of actives
99
which the effect of: (i) mixing or segmentation and (ii) the frequency of segmentation
contractions have on absorption were studied. In both sections, the impact of food
formulation was also evaluated by adding viscous polymers such as guar, pectin and CMC to
glucose-food models. The effect of mixing was evaluated in the closed-SIM configuration
while the effect of frequency in the open-SIM configuration (see section 3.4).
4.2 Effect of mixing and food formulation on glucose absorption
4.2.1 Glucose absorption rates
To evaluate the influence of mixing on absorption a series of experiments applying
segmentation contractions in the SIM were performed as described in section 3.4.1.1. The
experiments were carried out at room temperature for one hour in the SIM configuration, in
which both ends of the lumen side (membrane) were closed, i.e. no recirculation of the chyme
was done. Segmentation contractions pattern used in this section was as follows: 2s cuff
inflation, 2s cuff deflation and 2s delay for each cuff.
The increase in glucose over time on the recipient side (outside of the membrane) has been
plotted in Figure 4.1 (a) and (b) respectively, for aqueous glucose solutions (control) and
glucose-guar (0.1%, w/v) solutions with low zero shear rate viscosity (1 - 2 mPa.s). Results
showed that glucose absorption was accelerated when segmentation occurred in the SIM.
After one hour, glucose concentration in control solution (without guar) was:
Under segmentation conditions, almost 6.0 mM, around 10% of the initial glucose
concentration (55 mM) as shown in Figure 4.1 (a) and
Without segmentation, only 4.0 mM that represents only 7.0% of 55 mM (initial
concentration) as Figure 4.1 (a) shown.
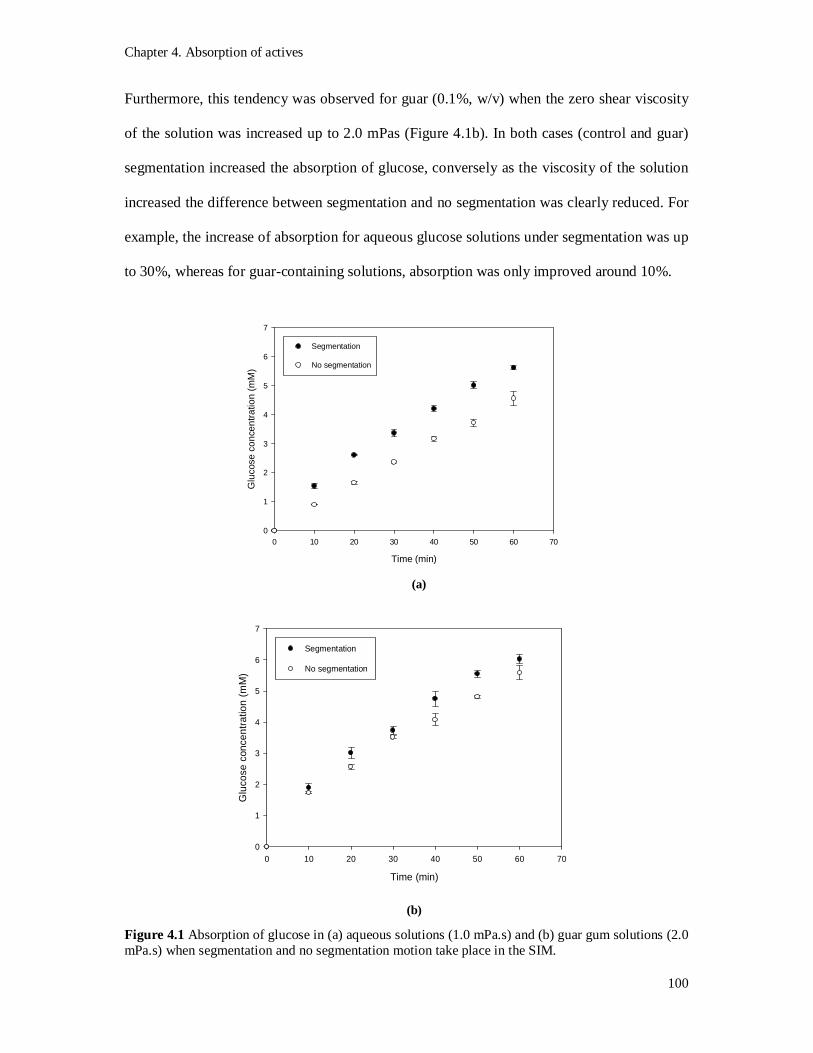
Chapter 4. Absorption of actives
100
Furthermore, this tendency was observed for guar (0.1%, w/v) when the zero shear viscosity
of the solution was increased up to 2.0 mPas (Figure 4.1b). In both cases (control and guar)
segmentation increased the absorption of glucose, conversely as the viscosity of the solution
increased the difference between segmentation and no segmentation was clearly reduced. For
example, the increase of absorption for aqueous glucose solutions under segmentation was up
to 30%, whereas for guar-containing solutions, absorption was only improved around 10%.
Time (min)
0 10 20 30 40 50 60 70
Glu
cose
con
cent
ratio
n (m
M)
0
1
2
3
4
5
6
7
Segmentation
No segmentation
Time (min)
0 10 20 30 40 50 60 70
Glu
cose
con
cent
ratio
n (m
M)
0
1
2
3
4
5
6
7
Segmentation
No segmentation
Figure 4.1 Absorption of glucose in (a) aqueous solutions (1.0 mPa.s) and (b) guar gum solutions (2.0 mPa.s) when segmentation and no segmentation motion take place in the SIM.
(a)
(b)

Chapter 4. Absorption of actives
101
The effect of CMC (0.1 and 0.5%, w/v) on glucose absorption process is shown in Figure 4.2.
There was a clear reduction on glucose absorption when the viscosity of the solution
increased from 20 to 200 mPas. After one hour, glucose concentration in 0.1% (w/v) of
highly viscosity CMC solution was:
Under segmentation conditions, almost 4.5 mM, around 8.0% of the initial
concentration of glucose in the lumen (55 mM) and
With no segmentation, only 3.55 mM; 6.5% of the total glucose in the lumen side of
the SIM.
Nevertheless, these figures were significantly reduced when 0.5% (w/v) of highly viscosity
CMC was added to the glucose solution:
Under segmentation after one hour, glucose concentration in the recipient side was
1.5 mM, about 3.0% of the concentration of glucose in the lumen (55 mM) and
With no segmentation, glucose reached only 0.3 mM, less than 1.0% of the glucose
present in the lumen side of the SIM at the beginning of the experiment.
In both cases, segmentation increased absorption of glucose; the difference between
segmentation and no segmentation was more significant as the viscosity of the solution
increased.

Chapter 4. Absorption of actives
102
Time (min)
0 10 20 30 40 50 60 70
Glu
cose
con
cent
ratio
n (m
M)
0
1
2
3
4
5
6
7
Segmentation 0.1% (w/v) No segmentation 0.1% (w/v) Segmentation 0.5% (w/v) No segmentation 0.5% (w/v)
Figure 4.2 Absorption of glucose in 0.1 and 0.5% (w/v) CMC solutions with zero shear viscosities of 20 mPa.s and 200 mPa.s, respectively, when segmentation and no segmentation motion take place in the SIM.
Relative to the control (water) under segmentation, glucose absorption was reduced up to 20
and 75% when 0.1 and 0.5% (w/v) of CMC were added to the solution of glucose,
respectively. Furthermore, when no segmentation (diffusive transfer) was applied to the
solution containing 0.5% (w/v) of CMC, the biopolymer restricts mass transport and the
concentration of glucose was close to zero (Figure 4.2).
Overall, glucose was rapidly absorbed when segmentation contractions occur (convective
transport by mixing), however, passive diffusion following Fick’s law took place when no
segmentation contractions were applied. The greater the viscosity of the solution is, the lower
the absorption. This is thought to be caused by decreased mixing in the lumen content.
Segmentation has a significant effect on glucose absorption rate increasing up to 30% for
aqueous solutions. On the contrary, when viscous solutions were tested the impact of

Chapter 4. Absorption of actives
103
segmentation was impaired and the difference between applying segmentation (convective
transport) or not applying segmentation (diffusion transport) was only 10 - 20% for guar and
CMC solutions. Since addition of CMC produced solutions with higher viscosity than guar
solutions, CMC was more effective for controlling and delaying glucose absorption in the
SIM. To compare the effect that each polymer has on glucose absorption experiments with
similar viscosities must be done.
The glucose absorption rates (µM/s) were estimated from the slope of the curves in Figures
4.1 and 4.2 and are given in Table 4.1. Only the linear region of the curve was used to
calculate the slope for each data series, i.e. from t0 = 10 to t = 60 min, once the flow was fully
developed. The concentration at time zero was not included as the actual position of zero is
unknown. Triplicates were obtained for each condition.
The results indicate that both segmentation motion and viscosity have a significant effect on
glucose absorption rates (Table 4.1). Whereas segmentation motion seems to increase the
rates of glucose absorption, the increase in viscosity (from 1 to 200 mPa.s) resulting in a
significant decrease on glucose concentration in the recipient side. The latter effect was even
more drastic when no segmentation was applied to the SIM. As concentration of guar was
increased and therefore the viscosity increased the effect of segmentation was reduced.
Table 4.1 Glucose absorption rates for experimental solutions.
Biopolymer
Concentration (%, w/v)
Zero shear viscosity ± std
(mPa.s)
Absorption rate ± std (µM/s)
Segmentation No segmentation
Control
0.0
1.0 ± 0.2
1.41 ± 0.19
1.04 ± 0.33
Guar gum 0.1 2.0 ± 0.4 1.40 ± 1.02 1.03 ± 0.57
CMC 0.1 20.0 ± 0.2 1.20 ± 0.14 0.90 ± 0.98
CMC 0.5 200.0 ± 0.1 0.02 ± 0.26 0.001 ± 0.102

Chapter 4. Absorption of actives
104
Experiments were performed in the closed-SIM configuration.
These results are in agreement with previous studies done in vitro by Tharakan et al., (2010)
and in vivo by Blackburn et al., (1984), in which the addition of guar gum to glucose
solutions fed to humans reduced the increase in blood glucose level, resulting in only 50% of
that observed without guar. Blackburn et al. (1984) proposed that the mechanism of reduction
is by inhibiting the effects of intestinal motility on fluid convection. Possible mechanisms are
that viscous polysaccharides act by delaying gastric emptying and thus slow delivery to the
small intestine and reduce the rate at which glucose is absorbed from the intestine (probably
due to a reduced mixing efficiency).
The data obtained here can be compared with absorption rates in the human small intestine
from Blackburn, et al. (1984). The rates of glucose absorption were estimated by the slope of
the plasma glucose curves developed in the first 30 min period after ingestion of 50 g glucose
in 250 ml of an orange drink with and without 9 g of guar gum (Figure 2.13). The absorption
rates were:
1.85 µM/s for drinks without guar gum and
0.90 µM/s when guar was added to the solution of glucose (6.9 mM)
A significant (p<0.05) reduction (50%) of the rate of absorption in blood glucose levels was
observed in humans after ingestion of drinks supplemented with 9 g of guar (36 g/l).
Although the concentration of glucose and guar were higher than those used in this research,
a ‘good’ correlation between experiments carried out in the human small intestine and in the
SIM can be established. The two sets have the same order of magnitude. However, it is
important to remember this is a roughly comparison that could serve as a reference to
correlate experimental data from the SIM to those obtained in vivo, in which glucose
absorption is a carried-mediated transport that follows an electrochemical concentration

Chapter 4. Absorption of actives
105
gradient in the cellular membrane of the epithelial cells.The intestinal epithelial cell
membrane is a complex structure that consists of a double layer of lipid molecules containing
embedded proteins responsible for transporting glucose from the cell to the blood vessels.
However, the SIM used in this work is comprised by a semi-permeable membrane that
simplifies the anatomical features of the intestinal wall.
4.2.2 Overall mass transfer coefficients (OMTC)
The overall mass transfer rate is given by equation 4.1, assuming that the lumen is a well-
mixed solution and the mass transferred is proportional to the concentration difference and
the interfacial area (Cussler, 2009).
푁 = 퐾(푐 − 푐 ) (4.1)
where N1 is the flux (mmol/m2s), K is the mass transfer coefficient (m/s) and c1i and c1
(mol/m3) are the concentrations at the interface and in the bulk solution, respectively.
Considering for example, the case of the aqueous glucose solution under segmentation, the
rate of glucose transferred is equal to 1.41 x 10⁻³ mM/s, from the slope of the curve in Figure
4.1(a), the membrane surface area was 0.05m2 with a diameter of 0.03 m and the recipient
side total volume was 0.001 m3. By dividing the rate of glucose transferred by the membrane
surface area, the molar flux of this system is found to be 2.94 x 10⁻² mmol/m2s.
The overall mass transfer coefficient (K) can be estimated from equation 4.1 with a
concentration difference of 55 mM, i.e. K is equal to 5.35 ± 0.07 x 10⁻⁷ m/s (water under
segmentation) and 3.09 ± 0.12 x 10⁻⁷ m/s (water without segmentation). Similarly, K was
estimated for guar and CMC.
The overall mass transfer coefficients (OMTC) for glucose absorption are presented in Table
4.2. The maximum OMTC were found for water (control) under segmentation conditions.

Chapter 4. Absorption of actives
106
This was expected as in this low viscosity solution, the resistance to mass transfer from the
bulk of the fluid to the surface of the membrane was minimum. The OMTC decreased
approximately 15% when the fluid viscosity increased ten-fold. On the other hand, when
viscosity increased from 1.0 mPa.s (water) to 200 mPa.s (CMC 0.5%, w/v), K was reduced
up to 90%.
Table 4.2 Overall Mass Transfer Coefficients (OMTC) for glucose absorption.
Biopolymer Concentration
(%, w/v)
Zero shear viscosity ± std
(mPa.s)
OMTC ± std (10-7 m/s)
Segmentation No segmentation
Control 0.0 1.0 ± 0.2 5.35 ± 0.07 3.94 ± 0.13
Guar gum 0.1 2.0 ± 0.4 5.31± 0.39 4.93 ± 0.22
CMC 0.1 20.0 ± 0.2 4.55 ± 0.05 3.41 ± 0.37
CMC 0.5 200.0 ± 0.1 0.76 ± 0.06 0.32 ± 0.23
Again these values can be compared with the limited in vivo data from the rates of glucose
absorption calculated in section 4.2.1 for the human small intestine data (Blackburn et al.,
1984). The OMTC was estimated as 5.47 x10⁻⁷ m/s for solutions without guar and 2.91 x 10⁻⁷
m/s, when 9 g of guar were added. The length of the small intestine was assumed to be 6.0 m
with area of 0.575 m2 and a volume of 0.012 m3. This assumes that everything is fully filled
and the area of the small intestine is equal to a pipe with an average diameter of 0.03 m.
Figure 4.3 shows the effect of viscosity on mass transfer of glucose under both segmentation
and no segmentation conditions. As it is shown in Figure 4.3, when viscosity increases from
0.001 to 0.200 Pa.s the mass transfer coefficient falls drastically from 5.35 x 10⁻⁷ m/s to
nearly zero.

Chapter 4. Absorption of actives
107
Zero shear viscosity (Pa.s)
0.0001 0.001 0.01 0.1 1
Ove
rall
Mas
s Tr
ansf
er C
oeffi
cien
t (m
/s)
0
1e-7
2e-7
3e-7
4e-7
5e-7
6e-7Segmentation No segmentation
Figure 4.3 Overall Mass Transfer Coefficients as a function of the zero shear viscosity of the lumen contents for water (control), guar (0.1%, w/v) and CMC (0.1 and 0.5%, w/v) under segmentation and no segmentation conditions.
4.2.3 Mass transfer coefficients in the biopolymer side
As Figure 4.4 shows, K consists of three resistances: the biopolymer side kbp (donor), the
membrane and the water film (recipient side).
Figure 4.4 Schematic of the resistances to mass transfer in the SIM.
The local mass transfer coefficient (kbp) in the lumen or biopolymer side was calculated based
on Equations 4.2 - 4.4 (Tharakan, 2008). This relation is based on the resistance that the
membrane and the recipient side water film contribute to the OMTC (K). The last two terms
in equation 4.3 can be considered as the resistance from the system Rsystem (membrane and

Chapter 4. Absorption of actives
108
recipient side film). For these experiments the Rsystem was found to be 1.86 x 10⁶ s/m water
under segmentation. This value was calculated as the inverse of the mass transfer coefficient
found for water (5.35 x 10⁻⁷m/s, Table 4.2). For fluids containing guar gum or CMC, kbp was
estimated by Equation 4.4.
= + + (4.2)
푅 = + (4.3)
푘 = (4.4)
where kbp is the biopolymer side mass transfer coefficient, Dmem is the diffusion coefficient of
nutrient through the membrane, lmem is the thickness of the membrane and krep is the recipient
side mass transfer coefficient.
The range of mass transfer coefficients in the lumen side (biopolymer side) are shown in
Table 4.3 under segmentation conditions.
Table 4.3 Local mass transfer coefficients of the biopolymer side from different viscous materials.
Biopolymer (w/v) kbp (10-6 m/s)
Guar_0.1% 3.22 ± 1.32
CMC_0.1% 1.49 ± 0.10
CMC_0.5% 0.01 ± 0.02
These results demonstrate that transport of actives to the membrane can be controlled by the
properties of the chyme under physiological conditions. As concentration of CMC is
increased, under segmentation conditions, mixing and flow at the membrane surface is
decreased resulting in a reduction of kbp from 1.5 to 0.01 x 10⁻⁶ m/s.

Chapter 4. Absorption of actives
109
To quantify the mass transfer enhancement of the system with convection compared to
diffusion the Sherwood number (Sh) was estimated by Equation 4.5.
푆ℎ = (4.5)
where kbp is the biopolymer side mass transfer coefficient (Table 4.3), L is the length scale
(0.032 m) and DAB is the diffusion coefficient of glucose 6.9 x 10⁻¹⁰ m2/s.
In addition, the average Reynolds number (Re) of the fluids in the lumen or biopolymer side
was calculated by Equation 4.6.
푅푒 = (4.6)
where is the density of the solution, v is the velocity of the fluid (v = 0.06 m/s), D is the
diameter of the membrane (0.03 m) and µ is the viscosity of the solution (Table 4.1).
To calculate the Re of each solution, the maximum velocity (0.06 m/s) was estimated using
the volume displaced by segmentation contractions at 2s. The velocity was calculated by
assuming that the volume displaced by the cuff during each contraction is equal to 9.65 x 10⁻⁵
m3. This value was estimated from the volume of a cylinder with a diameter of 0.03 m
(membrane) and length of 0.12 m (length of the cuff in the SIM) as shown in Figure 4.5. By
dividing the volume by the time each contraction is applied (2s), the volumetric flow was
obtained (4.83 x 10⁻⁵ m3/s). Finally, the mean velocity was estimated by dividing this
volumetric flow by the cross sectional area of the flow (7.07 x 10⁻⁴ m2).

Chapter 4. Absorption of actives
110
Figure 4.5 A diagram of a segment of the SIM that represents the volume displace forwards by an inflated cuff (0.12 m length) when segmentation occurs.
The Sherwood numbers (Sh) against the Reynolds numbers (Re) for experiments when
segmentation took place are shown in Figure 4.6. As the Reynolds number increases the
Sherwood number increases as well, indicating that for low viscosity fluids mass transfer
phenomena take place by convective forces. Mixing brings material (glucose) to the wall of
the lumen side reducing the unstirred layer and resistance of the membrane to the transport of
actives molecules. In contrast, diffusion occurs more likely when the effect of mixing is
impaired by the viscosity of the fluid in the lumen side increasing the unstirred layer in the
biopolymer side.
A suitable correlation (Treybal, 1980) was also used to estimate the Sh inside circular pipes
with similar dimensions and fluid flow than those studied in the SIM. Results are summarized
and compared in Table 4.4 and Figure 4.6. Interestedly, experimental and theoretical values
of Sh were similar.

Chapter 4. Absorption of actives
111
Table 4.4 Experimental and theoretical Sherwood numbers estimated for the SIM and a circular pipe with similar fluid motion.
Sc =/D where is the viscosity, is the density and D is the diffusivity of glucose
**Sh =0.023 Re0.83 Sc1/3 (Treybal, 1980).
Reynolds number
1 10 100 1000 10000
Sher
woo
d nu
mbe
r
1
10
100
1000
Sh experimental Sh theoretical
Figure 4.6 Experimental and theoretical values of the Sherwood numbers for water, guar (0.1%, w/v) and CMC (0.1 and 0.5%, w/v).
To estimate conditions more like those found in the small intestine where oscillatory flow is
produced by wall movements, a suitable correlation between oscillatory Reynolds number
(Reo) and the net flow Reynolds number (Ren) was done. Oscillatory Reynolds numbers were
calculated by Equation 4.7 developed according to Harvey et al., (2003).
Biopolymer Ren *Sc Shexp **Shthe
Control 2050 1300 650 140
Guar (0.1%, w/v) 900 3000 145 94
CMC (0.1%, w/v) 90 30000 66 30
CMC (0.5%, w/v) 90 300000 4 9

Chapter 4. Absorption of actives
112
푅푒 = (4.7)
where is the fluid density, f the frequency of oscillation (2s), xo is the centre-to-peak
amplitude (0.12 m) and the viscosity of the fluid.
Results are summarized and compared in Table 4.5. Reynolds and Sherwood numbers were
increased by ten-fold, when the oscillatory flow was used.
Table 4.5 Reynolds and Sherwood numbers calculated from the net (Ren) and oscillatory flows (Reo).
Fluid motion in the small intestine is determined by the intestinal contractions generated
during peristalsis and segmentation. Segmentation contractions are local constrictor waves
that induce powerful radial mixing of the lumen contents enhancing mass transfer across the
epithelium (Macagno and Christensen, 1980).
In conclusion, the results presented in this section suggest that segmentation enhanced mass
transfer processes in the SIM. Nevertheless, mixing was impaired when the viscosity of the
solution was increased as a result of a significant reduction in the rates of glucose absorption
and the OMTC was achieved for viscous test food models.
Biopolymer Ren Shn Reo Sho
Control 2050 140 25000 1133
Guar (0.1%, w/v) 900 94 11300 760
CMC (0.1%, w/v) 90 30 1133 240
CMC (0.5%, w/v) 90 9 113 77

Chapter 4. Absorption of actives
113
4.3. Effect of mixing frequency and food formulation
Having established the importance of flow and mixing on mass transfer, the following
experiments were designed to study the effect that frequency of contractions have on mass
transfer during glucose absorption in the SIM. One of the advantages of this in vitro system is
that different patterns or sequence of contractions in a physiological context can be studied by
changing inflation time and delay between contractions (section 3.3.3). As a result,
segmentation contractions can vary in intensity, duration and number of contractions per
minute. The results presented in this section were obtained by using three types of
segmentation contractions lasting from 1 to 3 seconds. The duration and the number of
contractions per minute were changed accordingly to the patterns showed on Figure 4.8,
resulting in three different frequencies:
(i) 1s delay, 1s inflation, 1s deflation 20 contractions/minute (0.333 s-1)
(ii) 2s delay, 2s inflation, 2s deflation 10 contractions/minute (0.166 s-1)
(iii) 3s delay, 3s inflation, 3s deflation 7 contractions/minute (0.116 s-1)
The inflation and deflation terms refer to the time at which each inflatable cuff was supplied
with compressed air (inflation) or vacuum (deflation) to generate segmental movements in
the lumen side. The range of frequencies selected for these experiments were set in a
physiological scenario in which 10-12 contractions per minute take place in the duodenum,
decreasing in the jejunum and ileum until 7-8 in normal subjects (Guyton and Hall, 2006,
Levy et al., 2006). An extreme case of study (20 contractions per minute) was selected to
mimic gastrointestinal disorders such as irritable bowel syndrome, in which contractions or
movements could be twice than those found in normal conditions.

Chapter 4. Absorption of actives
114
1 2 1 2 1 2
1s 1s
1 2 1
2s
2s
1 2
3s 3s
Figure 4.7 Deformation profiles of segmentation contractions applied to the SIM, in black the movements of cuff 1 and in blue the contractions of cuff 2, represented as ‘1’ and ‘2’, respectively, for 1 - 3 seconds. Each segmentation contraction has a symmetric delay, inflation and deflation times.
These values resulted in three different segmentation contractions profiles varying in
intensity and duration. For 1s, the mixing or segmentation contraction was shallow; the
inflation time was short and the cuff was not fully inflated applying a weak compression on
the tube section of the SIM as demonstrated later in Chapter 6 section 6.2.2. Since this type of
contraction was produced every second, the number of contractions per minute was
approximately 20. In contrast, when cuffs were inflated for about 2s the contraction was
deeper than the contractions generated every second. When segmentation contractions were
applied every 2s, 10 pulses per minute were produced. The last type of contraction was the
deepest with 3s of inflation, however, because the delay between contractions was extended
to three seconds, around 7 pulses per minute were generated. During these experiments,
recirculation of the lumen contents was done by using a peristaltic pump (open SIM
Occlusion of the membrane
Relaxation of the membrane

Chapter 4. Absorption of actives
115
configuration). The net flow rate in the lumen side was 1.2 x10⁻⁵ m3/s (12 ml/s) resulting in
an average velocity of 1.6 x 10⁻⁴ m/s.
The effect of food formulation was evaluated by using three viscous polysaccharides: guar
gum, pectin and carboxymethyl cellulose (CMC). The viscosity of the solution was modified
by increasing the concentration of the biopolymer added to a solution of glucose used as a
model food within an initial concentration of 10 g/L (~55 mM). Experiments were designed
to have four solutions of each polymer with similar range of zero shear viscosities. The
concentration of guar, pectin and CMC was adjusted to have solutions of low (0.01 - 0.1
Pa.s), medium (0.2 - 0.5 Pa.s) and high (>1.0 Pa.s) viscosities. The final range of viscosities
was from 0.01 to 3.0 Pa.s. This range was selected according to the zero-shear viscosities of
the chyme measured in vivo by Marciani et al. (2000). These authors found that the viscosity
of model meals added with locust bean gum decreased from 11 to 2 Pa.s after ingestion, due
to the salivary and gastric secretions. Accordingly, the chyme enters to the duodenum within
the range of viscosities chosen for the following experiments. All experiments were
performed in duplicate and in a randomized order.
4.3.1 Glucose absorption rates: effect of frequency of contractions and formulation
4.3.1.1 Glucose absorption rates for guar gum solutions
The first biopolymer studied to modify the formulation of the test food was guar gum for a
range of concentrations between 0.25 and 0.75% (w/v), densities close to water and zero-
shear viscosities from 0.02 to 3.2 Pa.s (Table 4.6). Among the polymers used in this work,
guar had the wider range of viscosities with a small change in concentration. As the
concentration of guar increased the zero-shear viscosity increased as well, small doses of guar
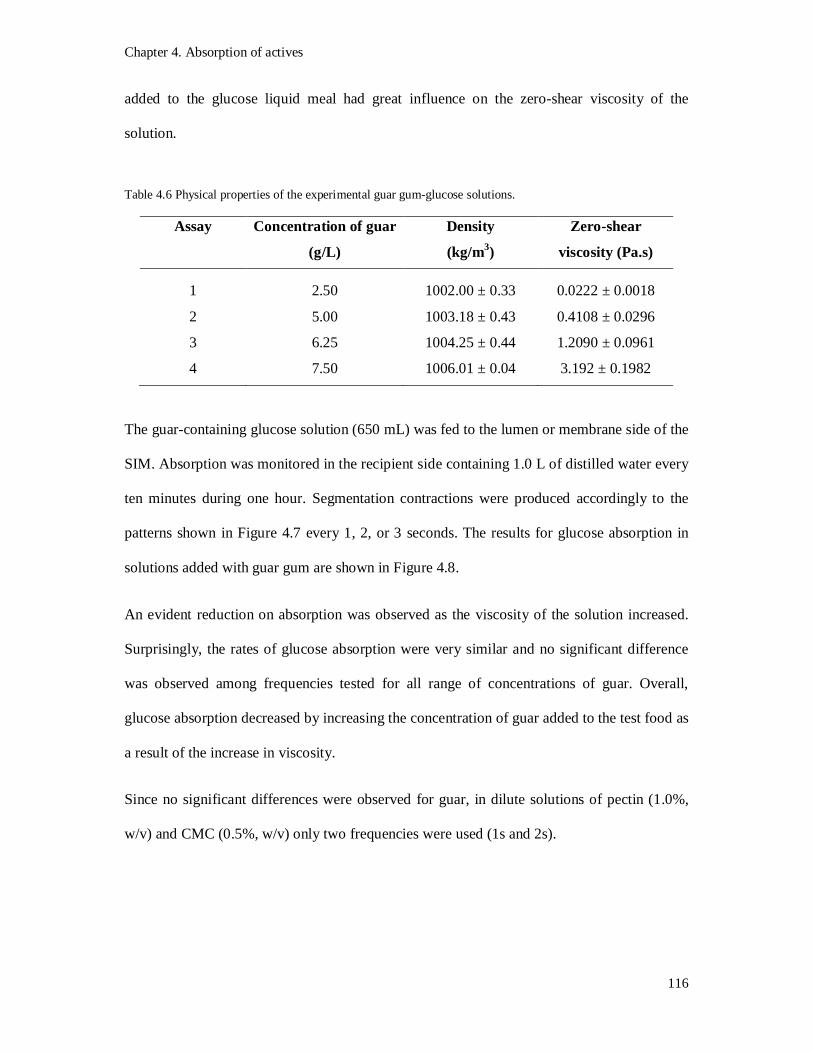
Chapter 4. Absorption of actives
116
added to the glucose liquid meal had great influence on the zero-shear viscosity of the
solution.
Table 4.6 Physical properties of the experimental guar gum-glucose solutions.
Assay Concentration of guar
(g/L)
Density
(kg/m3)
Zero-shear
viscosity (Pa.s)
1 2.50 1002.00 ± 0.33 0.0222 ± 0.0018
2 5.00 1003.18 ± 0.43 0.4108 ± 0.0296
3 6.25 1004.25 ± 0.44 1.2090 ± 0.0961
4 7.50 1006.01 ± 0.04 3.192 ± 0.1982
The guar-containing glucose solution (650 mL) was fed to the lumen or membrane side of the
SIM. Absorption was monitored in the recipient side containing 1.0 L of distilled water every
ten minutes during one hour. Segmentation contractions were produced accordingly to the
patterns shown in Figure 4.7 every 1, 2, or 3 seconds. The results for glucose absorption in
solutions added with guar gum are shown in Figure 4.8.
An evident reduction on absorption was observed as the viscosity of the solution increased.
Surprisingly, the rates of glucose absorption were very similar and no significant difference
was observed among frequencies tested for all range of concentrations of guar. Overall,
glucose absorption decreased by increasing the concentration of guar added to the test food as
a result of the increase in viscosity.
Since no significant differences were observed for guar, in dilute solutions of pectin (1.0%,
w/v) and CMC (0.5%, w/v) only two frequencies were used (1s and 2s).

Chapter 4. Absorption of actives
117
Figure 4.8 Glucose absorption in the SIM for solutions supplemented with guar gum at various concentrations: (a) 0.25, (b) 0.50, (c) 0.65 and (d) 0.75% (w/v) in a glucose solution (1.0 w/v) under segmentation contractions produced every 1, 2 or 3 seconds.
4.3.1.2 Glucose absorption rates for citrus pectin solutions
Pectin was also used to modify the formulation of the digesta. In this case, however, the
range of concentrations was threefold higher than guar from 10 to 30 grams per litre of
digesta (glucose solution) to reach the same range of viscosities established, like guar
densities were close to water (Table 4.7).
Time (min)
0 10 20 30 40 50 60 70
Con
cent
ratio
n of
glu
cose
(mM
)
0
1
2
3
4
5
1s 2s 3s
Time (min)
0 10 20 30 40 50 60 70
Con
cent
ratio
n of
glu
cose
(mM
)
0
1
2
3
4
5
1s 2s 3s
Time (min)
0 10 20 30 40 50 60 70
Con
cent
ratio
n of
glu
cose
(mM
)
0
1
2
3
4
5
1s 2s 3s
Time (min)
0 10 20 30 40 50 60 70
Con
cent
ratio
n of
glu
cose
(mM
)
0
1
2
3
4
5
1s 2s 3s
(a) (b)
(d) (c)
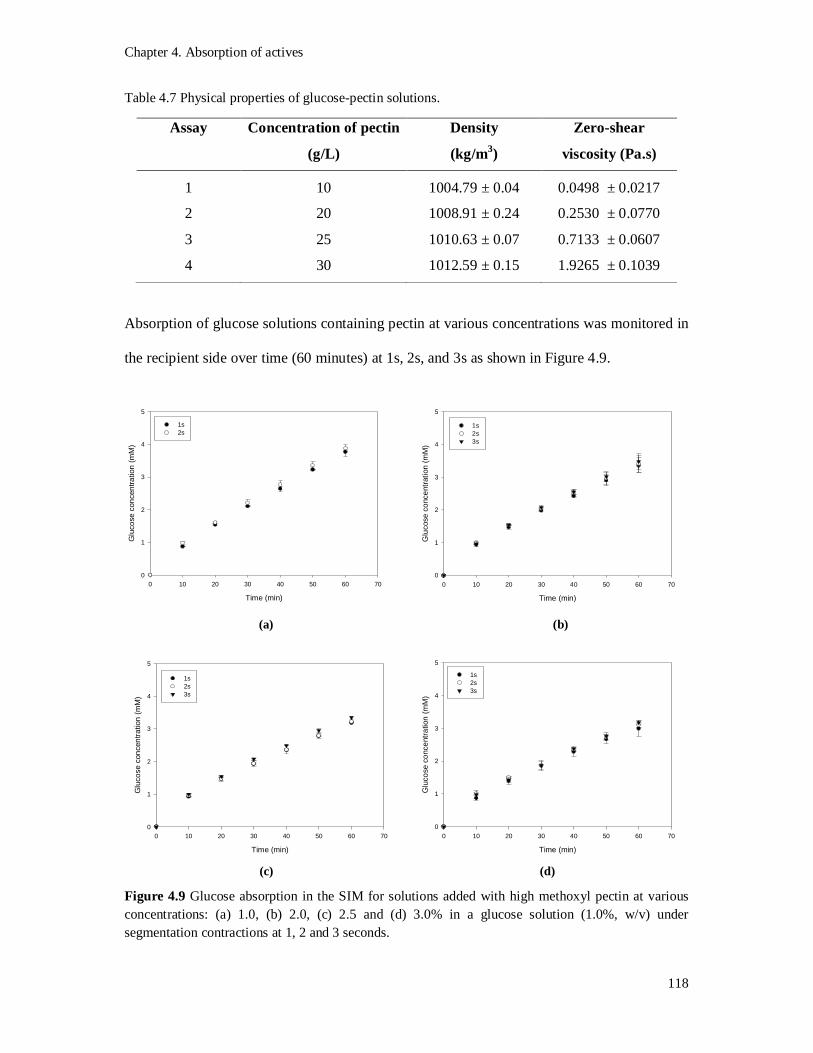
Chapter 4. Absorption of actives
118
Table 4.7 Physical properties of glucose-pectin solutions.
Assay Concentration of pectin
(g/L)
Density
(kg/m3)
Zero-shear
viscosity (Pa.s)
1 10 1004.79 ± 0.04 0.0498 ± 0.0217
2 20 1008.91 ± 0.24 0.2530 ± 0.0770
3 25 1010.63 ± 0.07 0.7133 ± 0.0607
4 30 1012.59 ± 0.15 1.9265 ± 0.1039
Absorption of glucose solutions containing pectin at various concentrations was monitored in
the recipient side over time (60 minutes) at 1s, 2s, and 3s as shown in Figure 4.9.
Figure 4.9 Glucose absorption in the SIM for solutions added with high methoxyl pectin at various concentrations: (a) 1.0, (b) 2.0, (c) 2.5 and (d) 3.0% in a glucose solution (1.0%, w/v) under segmentation contractions at 1, 2 and 3 seconds.
Time (min)
0 10 20 30 40 50 60 70
Glu
cose
con
cent
ratio
n (m
M)
0
1
2
3
4
5
1s 2s
Time (min)
0 10 20 30 40 50 60 70
Glu
cose
con
cent
ratio
n (m
M)
0
1
2
3
4
5
1s 2s 3s
Time (min)
0 10 20 30 40 50 60 70
Glu
cose
con
cent
ratio
n (m
M)
0
1
2
3
4
5
1s 2s 3s
Time (min)
0 10 20 30 40 50 60 70
Glu
cose
con
cent
ratio
n (m
M)
0
1
2
3
4
5
1s 2s 3s
(a)
(d) (c)
(b)

Chapter 4. Absorption of actives
119
Similar to guar, the results showed that for food structured with pectin at various
concentrations (1.0 - 3.0%, w/v), the number of contractions per minute and the intensity of
the contraction gave rise to similar glucose absorption levels.
4.3.1.3 Glucose absorption rates for CMC solutions
The last biopolymer tested to study the effect of the mixing frequencies was CMC. As with
guar and pectin, viscosity of the glucose solution increased as the concentration of CMC
increased. In this case the range of concentrations was closer than those used with guar. The
concentration of CMC that fixes the zero-shear viscosities previously selected was in the
range between 0.25 to 1.25% (w/v), with densities close to water (Table 4.8).
Table 4.8 Physical properties for glucose-CMC solutions.
Assay Concentration
(%, w/v)
Density
(kg/m3)
Zero-shear viscosity (Pa.s)
1 0.25 1002.06 ± 0.03 0.0854 ± 0.0025
2 0.50 1002.88 ± 0.07 0.2698 ± 0.0004
3 1.00 1004.92 ± 0.14 0.5314 ± 0.0075
4 1.25 1006.01 ± 0.05 1.4503 ± 0.0410
Interestingly, when CMC was used the absorption of glucose seems to be affected by the
frequency of segmentation contractions as shown in Figure 4.10. At 1s, the absorption of
glucose was dramatically reduced compared with the other two frequencies, 2 and 3s, for
concentrations equals or higher than 10 g of CMC per litre of digesta (Figure 4.10b-d). As the
viscosity increases from 0.5 to 1.5 Pa.s, there seems to be also a difference when
segmentation contractions were produced at 2 and 3s (Figures 4.10c and 4.10d). These results
suggested that maybe the rheological behaviour of CMC at higher frequencies changed
somehow that do not represent a physical barrier in mass transfer processes.

Chapter 4. Absorption of actives
120
Figure 4.10 Glucose absorption in the SIM for solutions added with CMC at various concentrations (a) 0.25, (b) 0.50, (c) 1.00 and (d) 1.25% (w/v) in a glucose solution (1%, w/v) under segmentation contractions at 1, 2 and 3 seconds.
4.3.2 Overall mass transfer coefficients (OMTC): effect of frequency of segmentation
The OMTC were estimated as described in section 4.2.2 by dividing the rate of absorption
obtained from the slope of the curves in Figures 4.8, 4.9 and 4.10 for guar, pectin and CMC,
respectively, by the surface area (0.5 m2), K the overall mass transfer coefficient, can hence
be calculated from Equation 4.2.
Time (min)
0 10 20 30 40 50 60 70
Glu
cose
con
cent
ratio
n (m
M)
0
1
2
3
4
5
1s 2s
Time (min)
0 10 20 30 40 50 60 70
Glu
cose
con
cent
ratio
n (m
M)
0
1
2
3
4
5
1s 2s 3s
Time (min)
0 10 20 30 40 50 60 70
Glu
cose
con
cent
ratio
n (m
M)
0
1
2
3
4
5
1s 2s 3s
Time (min)
0 10 20 30 40 50 60 70
Glu
cose
con
cent
ratio
n (m
M)
0
1
2
3
4
5
1s 2s 3s
(a) (b)
(c) (d)

Chapter 4. Absorption of actives
121
4.3.2.1 Overall mass transfer coefficients for guar
In Table 4.9 the results of the OMTC as a function of both frequency and concentration of
guar gum are summarized.
Table 4.9 OMTC for guar gum solutions as a function of mixing frequency.
Concentration of
guar gum (%, w/v)
1s
(10-7 m/s)
2s
(10-7 m/s)
3s
(10-7 m/s)
0.00 4.57 ± 0.10 4.56 ± 0.11 4.36 ± 0.22
0.25 4.48 ± 0.12 4.65 ± 0.02 4.66 ± 0.39
0.50 3.53 ± 0.06 3.55 ± 0.23 3.62 ± 0.02
0.65 3.33 ± 0.06 3.35 ± 0.09 3.47 ± 0.05
0.75 3.30 ± 0.20 3.37 ± 0.15 3.43 ±0.01
The OMTC estimated for guar was not affected by the mixing frequencies used in these
experiments. Although a significant reduction of the OMTC was observed when the
concentration of guar was increased from 0.25 to 0.50% (w/v), for all the frequencies used,
increasing the concentration of guar from 0.5 to 0.75% (w/v) did not appear to have a
significant impact on the OMTC. Figure 4.11 shows the OMTC for guar as a function of the
number of contractions (Figure 4.11a) and viscosity of the solution (Figure 4.11b). Clearly,
mass transport was reduced up to 30% as the viscosity increased from 0.02 to 0.42 Pa.s.
Nevertheless, it seems that no higher reduction was reached for guar-containing solutions
with zero shear viscosities of 1.2 and 3.2 Pa.s.
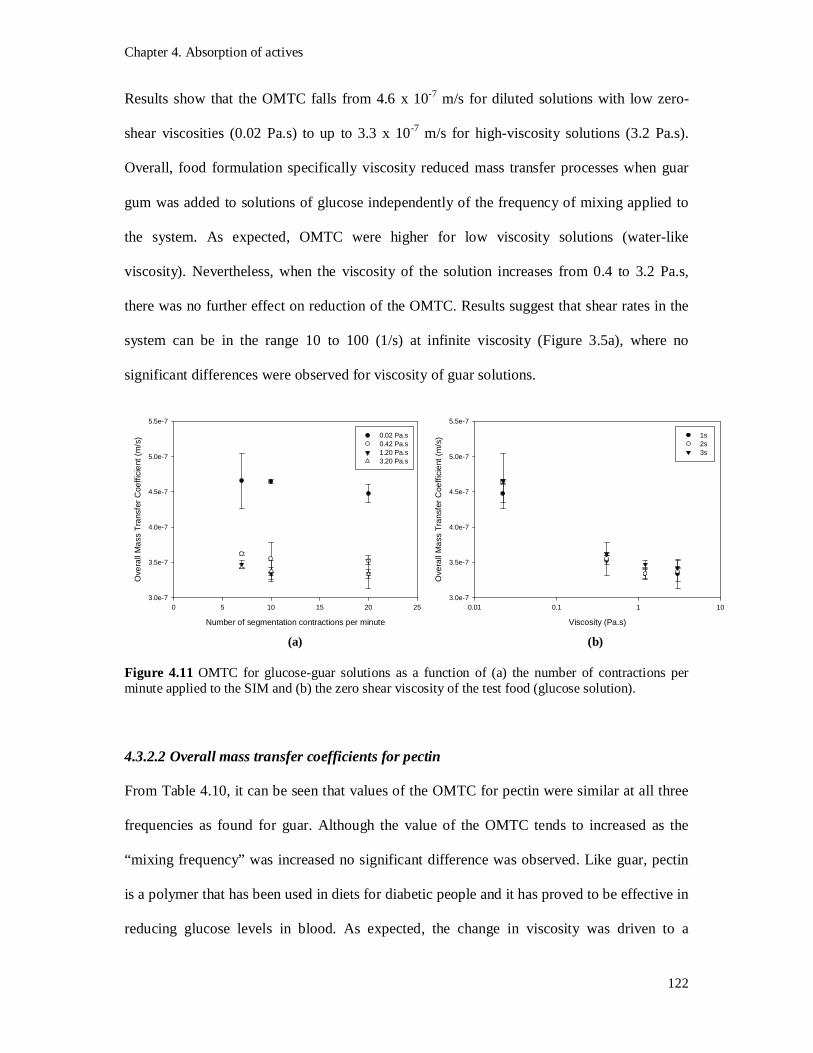
Chapter 4. Absorption of actives
122
Number of segmentation contractions per minute
0 5 10 15 20 25
Ove
rall
Mas
s Tr
ansf
er C
oeffi
cien
t (m
/s)
3.0e-7
3.5e-7
4.0e-7
4.5e-7
5.0e-7
5.5e-7
0.02 Pa.s0.42 Pa.s1.20 Pa.s3.20 Pa.s
Viscosity (Pa.s)
0.01 0.1 1 10
Ove
rall
Mas
s Tr
ansf
er C
oeffi
cien
t (m
/s)
3.0e-7
3.5e-7
4.0e-7
4.5e-7
5.0e-7
5.5e-7
1s 2s 3s
Results show that the OMTC falls from 4.6 x 10⁻⁷ m/s for diluted solutions with low zero-
shear viscosities (0.02 Pa.s) to up to 3.3 x 10⁻⁷ m/s for high-viscosity solutions (3.2 Pa.s).
Overall, food formulation specifically viscosity reduced mass transfer processes when guar
gum was added to solutions of glucose independently of the frequency of mixing applied to
the system. As expected, OMTC were higher for low viscosity solutions (water-like
viscosity). Nevertheless, when the viscosity of the solution increases from 0.4 to 3.2 Pa.s,
there was no further effect on reduction of the OMTC. Results suggest that shear rates in the
system can be in the range 10 to 100 (1/s) at infinite viscosity (Figure 3.5a), where no
significant differences were observed for viscosity of guar solutions.
Figure 4.11 OMTC for glucose-guar solutions as a function of (a) the number of contractions per minute applied to the SIM and (b) the zero shear viscosity of the test food (glucose solution).
4.3.2.2 Overall mass transfer coefficients for pectin
From Table 4.10, it can be seen that values of the OMTC for pectin were similar at all three
frequencies as found for guar. Although the value of the OMTC tends to increased as the
“mixing frequency” was increased no significant difference was observed. Like guar, pectin
is a polymer that has been used in diets for diabetic people and it has proved to be effective in
reducing glucose levels in blood. As expected, the change in viscosity was driven to a
(b) (a)

Chapter 4. Absorption of actives
123
reduction of the OMTC. Clearly, by increasing the concentration of pectin the OMTC
dropped drastically for all frequencies applied. When the concentration of pectin increased by
twofold (2.0%, w/v), the OMTC was reduced about 20% at 1s and up to 30% when
contractions were applied every 2s to the system.
Table 4.10 OMTC for pectin solutions as a function of mixing frequency.
Concentration of
pectin (%, w/v)
1s
(10-7 m/s)
2s
(10-7 m/s)
3s
(10-7 m/s)
1.0 3.77 ± 0.14 3.89 ± 0.13 ---
2.0 3.31 ± 0.11 3.37 ± 0.24 3.44 ± 0.26
2.5 3.13 ± 0.02 3.15 ± 0.02 3.30 ± 0.06
3.0 2.98 ± 0.20 3.00 ± 0.06 3.11 ± 0.03
Figures 4.12 (a) and (b) show the OMTC as a function of both segmentation contractions and
food formulation (viscosity). Once more, the mixing frequency did not appear to affect
significantly glucose absorption when pectin was added to the solution. A clear difference in
mass transport was only observed between dilute solutions (1.0%, w/v) and solutions with
concentration of pectin 2.0% (w/v). The OMTC values were clearly reduced by 30% as the
viscosity of the solution increased.

Chapter 4. Absorption of actives
124
Number of segmentation contractions per minute
0 5 10 15 20 25
Ove
rall
Mas
s Tr
ansf
er C
oeffi
cien
t (m
/s)
2.0e-7
2.5e-7
3.0e-7
3.5e-7
4.0e-7
4.5e-7
0.05 Pa.s0.25 Pa.s0.70 Pa.s 2.00 Pa.s
Zero shear viscosity (Pa.s)
0.0 0.5 1.0 1.5 2.0 2.5
Ove
rall
Mas
s Tr
ansf
er C
oeffi
cien
t (m
/s)
2.6e-7
2.8e-7
3.0e-7
3.2e-7
3.4e-7
3.6e-7
3.8e-7
4.0e-7
4.2e-7
1s 2s 3s
Figure 4.12 OMTC for glucose-pectin solutions as a function of (a) the number of contractions per minute applied to the SIM and (b) zero shear viscosity of the solution.
4.2.3.3 Overall mass transfer coefficients for CMC
The results of the OMTC as a function of both frequency and concentration of CMC are
presented in Table 4.11. As shown previously for absorption, the frequency of the
segmentation contractions had a great impact on mass transfer when CMC was used. On the
other hand, increasing the viscosity of the digesta by adding CMC slightly reduced the
OMTC. At 2s for example, the OMTC was reduced only 20% when the viscosity was
increased ten-fold. However, when the viscosity increased by three times no significant
difference was observed for the OMTC.
Table 4.11 OMTC for CMC solutions as a function of frequency of segmentation
Concentration of
CMC (%, w/v)
1s
(10-7 m/s)
2s
(10-7 m/s)
3s
(10-7 m/s)
0.25 4.19 ± 0.09 4.24 ± 0.01 ----
0.50 1.49 ± 0.34 3.79 ± 0.29 3.87 ± 0.18
1.00 1.55 ± 0.05 3.06 ± 0.13 3.31 ± 0.01
1.25 1.08 ± 0.15 3.05 ± 0.04 3.24 ± 0.04
(a) (b)

Chapter 4. Absorption of actives
125
Unlike guar and pectin, the OMTC estimated from the CMC-containing solutions were
significantly influence by the number of segmentation contractions, decreasing up to
threefold when the frequency was increased from 7 - 10 to 20 contractions per minute.
Figure 4.13 (a) and (b) show the OMTC as a function of both segmentation contractions and
food formulation. The mixing frequency appears to affect significantly glucose absorption
when CMC was added to the solution.
Figure 4.13 OMTC for glucose-CMC solutions as a function of (a) the number of contractions per minute applied to the SIM and (b) zero shear viscosity of the solution.
Figure 4.13 (a) and (b) shows that for low viscosities (0.08 Pa.s) solution of CMC the effect
of frequency was not significant, with similar OMTC. However, when the viscosity of the
lumen increased the mass transfer and the mixing frequency have a significant effect on the
mass transfer phenomena. When the number of contractions applied to the SIM increases
from 7 to 10 pulses/min, the OMTC decreased (Figure 4.13a). Increasing the frequency of the
contractions may well decrease the amplitude of the fluid pulsing along the SIM, and
therefore mass transfer decreases when pulses were applied every second. Overall, for
glucose solution supplemented with CMC, the frequency of segmentation contractions has a
Number of segmentation contractions per minute
0 5 10 15 20 25
Ove
rall
Mas
s Tr
ansf
er C
oeffi
cien
t
5.0e-8
1.0e-7
1.5e-7
2.0e-7
2.5e-7
3.0e-7
3.5e-7
4.0e-7
4.5e-7
0.08 Pa.s0.26 Pa.s 0.53 Pa.s1.45 Pa.s
Zero shear viscosity (Pa.s)
0.0 0.2 0.4 0.6 0.8 1.0 1.2 1.4 1.6
Ove
rall
Mas
s Tr
ansf
er C
oeffi
cien
ts (m
/s)
5.0e-8
1.0e-7
1.5e-7
2.0e-7
2.5e-7
3.0e-7
3.5e-7
4.0e-7
4.5e-7
1s 2s3s
(a) (b)

Chapter 4. Absorption of actives
126
significant effect (P<0.001) on the mass transfer coefficient. As segmentation decreases from
1 to 3s the OMTC increased.
Diffusion to the membrane interface is one mechanism for mass transfer, however, small
volumes or elements of this interfacial region are not static, but are constantly exchanged or
replaced with new elements from the bulk region (Cussler, 2000). ‘Surface renewal’ theories
or mass transfer describe the process in terms the length of time that small fluid elements
spend in the interfacial area. The influence of the wall movements on the transfer process is
significant, therefore.
4.3.3 Local mass transfer coefficients
4.3.3.1 Local mass transfer coefficient for guar gum
The range of mass transfer coefficients in the lumen side (biopolymer side) are shown in
Figure 4.14 when segmentation movements were applied.
In accordance with the results for the OMTC, as the viscosity of the digesta was raised from
0.02 to 0.4 Pa.s by increasing the guar concentration, the resistance of the biopolymer to mass
transfer substantially increases reaching a plateau for viscosities higher than 1.0 Pa.s. As such
there is a clear reduction in the biopolymer side mass transfer coefficient as a consequence of
increasing concentrations of guar gum up to 0.75% (w/v).

Chapter 4. Absorption of actives
127
Zero shear viscosity (Pa.s)
0.0 0.5 1.0 1.5 2.0 2.5 3.0 3.5
Bio
poly
mer
Mas
s Tr
ansf
er C
oeffi
cien
t (m
/s)
1e-6
1e-5
1s2s3s
Figure 4.14 Local mass transfer coefficients of the biopolymer side from different glucose guar solutions.
The oscillatory Reynolds number of the fluid in the biopolymer side was calculated by
equation 4.6. The maximum velocities were estimated by using the volume displaced by
segmentation contractions produced at 1, 2 and 3 seconds, respectively, data are shown in
Table 4.12. These velocities were calculated by assuming that the volume the cuff displaced
during each contraction is equal to 9.65 x 10⁻⁵ m3 as previously described in section 4.2.3.
Table 4.12 Velocity values estimated for each type of contraction in the SIM.
Time
(s)
Volumetric flow rates
(10 -5 m3/s)
Mean velocity
(m/s)
1 9.65 0.1365
2 4.82 0.0680
3 3.21 0.0455
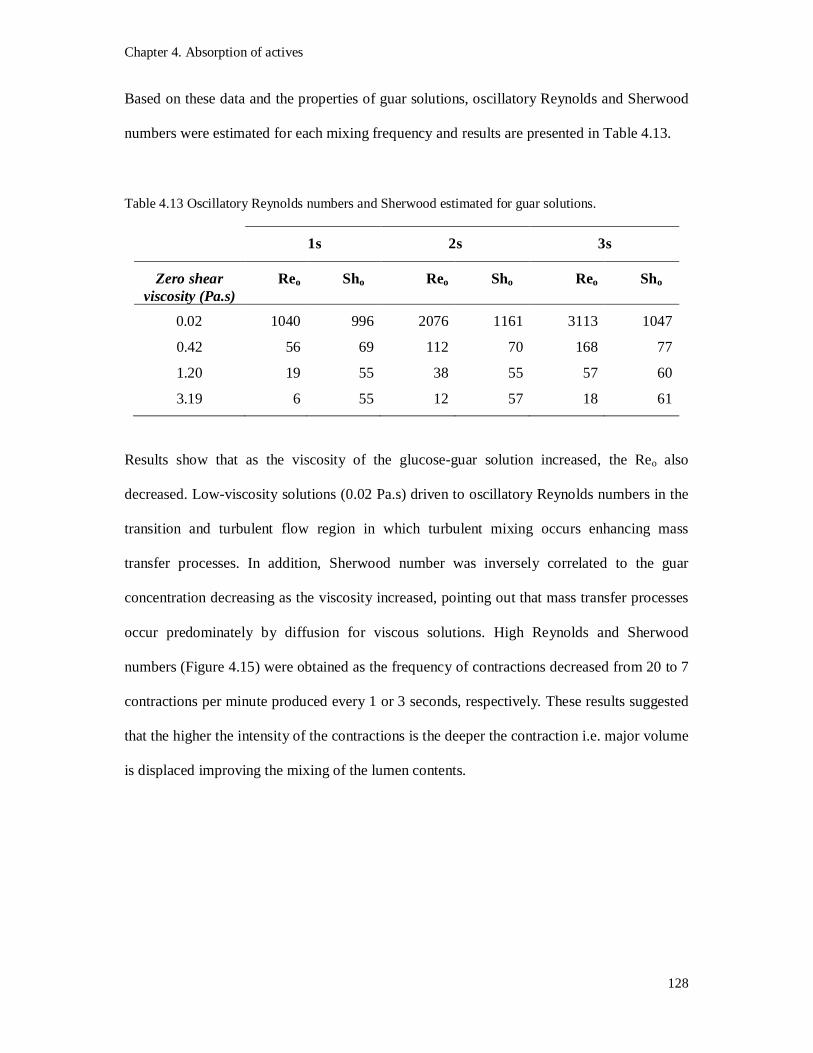
Chapter 4. Absorption of actives
128
Based on these data and the properties of guar solutions, oscillatory Reynolds and Sherwood
numbers were estimated for each mixing frequency and results are presented in Table 4.13.
Table 4.13 Oscillatory Reynolds numbers and Sherwood estimated for guar solutions.
1s 2s 3s
Zero shear viscosity (Pa.s)
Reo Sho Reo Sho Reo Sho
0.02 1040 996 2076 1161 3113 1047
0.42 56 69 112 70 168 77
1.20 19 55 38 55 57 60
3.19 6 55 12 57 18 61
Results show that as the viscosity of the glucose-guar solution increased, the Reo also
decreased. Low-viscosity solutions (0.02 Pa.s) driven to oscillatory Reynolds numbers in the
transition and turbulent flow region in which turbulent mixing occurs enhancing mass
transfer processes. In addition, Sherwood number was inversely correlated to the guar
concentration decreasing as the viscosity increased, pointing out that mass transfer processes
occur predominately by diffusion for viscous solutions. High Reynolds and Sherwood
numbers (Figure 4.15) were obtained as the frequency of contractions decreased from 20 to 7
contractions per minute produced every 1 or 3 seconds, respectively. These results suggested
that the higher the intensity of the contractions is the deeper the contraction i.e. major volume
is displaced improving the mixing of the lumen contents.

Chapter 4. Absorption of actives
129
Oscillatory Reynolds number
1 10 100 1000 10000
She
rwoo
d nu
mbe
r
10
100
1000
10000
1s 2s 3s
Figure 4.15 Sherwood versus oscillatory Reynolds numbers for guar solutions at different mixing frequencies (1, 2, and 3 seconds).
4.3.3.2 Local mass transfer coefficient for pectin solutions
The mass transfer coefficients in the lumen side (biopolymer side) for pectin are shown in
Figure 4.16 when segmentation movements were applied.
As the viscosity of the digesta was raised from 0.05 to 2.00 Pa.s (Figure 4.12), by increasing
the concentration of pectin, the biopolymer mass transfer coefficient (kbp) substantially
decreases. As such there is a clear reduction in the biopolymer side mass transfer coefficient
as a consequence of increasing concentrations of pectin up to 3.0% (w/v).

Chapter 4. Absorption of actives
130
Zero shear viscosity (Pa.s)
0.0 0.5 1.0 1.5 2.0 2.5
Ove
rall
Mas
s Tr
ansf
er C
oeffi
cien
t (m
/s)
5.0e-7
1.0e-6
1.5e-6
2.0e-6
2.5e-6
3.0e-6
3.5e-6
1s 2s 3s
Figure 4.16 Local mass transfer coefficients of the biopolymer side from different glucose pectin solutions.
Oscillatory Reynolds and Sherwood number were estimated for each mixing frequency and
results are presented in Table 4.14. Again, Sherwood number was inversely correlated to the
pectin concentration, decreasing as the viscosity increased. Reynolds in the transition region
and Sherwood numbers were relatively higher as the frequency increased suggesting that at
3s segmentation contractions displace major volume improving the mixing of the lumen
contents in the SIM (Figure 4.17).
Table 4.14 Oscillatory Reynolds numbers and Sherwood estimated for pectin solutions.
1s 2s 3s
Zero shear viscosity (Pa.s)
Reo Sho Reo Sho Reo Sho
0.05 532 96 1063 117 ---- ----
0.25 106 53 213 57 319 62
0.70 37 44 75 45 112 53
2.00 14 38 28 39 42 43

Chapter 4. Absorption of actives
131
Oscillatory Reynolds number
10 100 1000
She
rwoo
d nu
mbe
r
10
100
1s 2s 3s
Figure 4.17 Sherwood versus oscillatory Reynolds numbers for pectin solutions at different mixing frequencies (1, 2, and 3 seconds).
4.3.3.3 Local mass transfer coefficient for CMC solutions
The local mass transfer coefficients (biopolymer side) for CMC solutions are shown in Figure
4.18 when segmentation movements were applied.
As the viscosity of the digesta was raised from 0.08 to 1.45 Pa.s, by increasing the
concentration of CMC, the biopolymer mass transfer coefficient (kbp) substantially decreases.
There is a clear reduction in the biopolymer side mass transfer coefficient as a consequence
of increasing concentrations of CMC up to 1.25% (w/v).
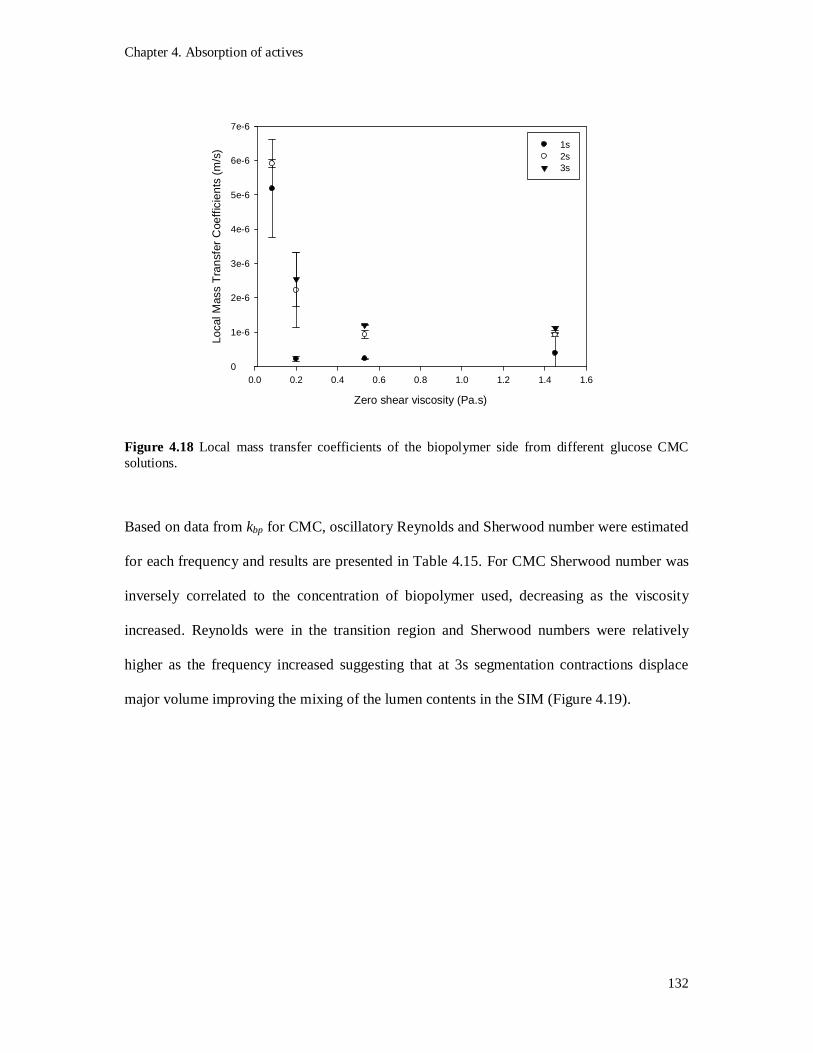
Chapter 4. Absorption of actives
132
Zero shear viscosity (Pa.s)
0.0 0.2 0.4 0.6 0.8 1.0 1.2 1.4 1.6
Loca
l Mas
s Tr
ansf
er C
oeffi
cien
ts (m
/s)
0
1e-6
2e-6
3e-6
4e-6
5e-6
6e-6
7e-6
1s 2s3s
Figure 4.18 Local mass transfer coefficients of the biopolymer side from different glucose CMC solutions.
Based on data from kbp for CMC, oscillatory Reynolds and Sherwood number were estimated
for each frequency and results are presented in Table 4.15. For CMC Sherwood number was
inversely correlated to the concentration of biopolymer used, decreasing as the viscosity
increased. Reynolds were in the transition region and Sherwood numbers were relatively
higher as the frequency increased suggesting that at 3s segmentation contractions displace
major volume improving the mixing of the lumen contents in the SIM (Figure 4.19).

Chapter 4. Absorption of actives
133
Table 4.15 Oscillatory Reynolds numbers and Sherwood estimated for CMC solutions.
1s 2s 3s
Zero shear viscosity (Pa.s)
Reo Sho Reo Sho Reo Sho
0.09 270 229 540 261 --- ---
0.30 115 10 231 98 346 112
0.50 43 10 87 41 130 53
1.45 16 17 32 41 48 49
Oscillatory Reynolds number
10 100 1000
She
rwoo
d nu
mbe
r
1
10
100
1000
1s 2s 3s
Figure 4.19 Sherwood versus oscillatory Reynolds numbers for CMC solutions at different mixing frequencies (1, 2, and 3 seconds).
The comparison of absorption of glucose with open or close SIM configurations disclosed
highly significant differences. The absorption rate was higher when recirculation of the
chyme was done (open-SIM) with up to 50% of increasing of the absorption rate.
The results indicate that, as a whole, the absorption rates i.e. OMTC were higher when the
viscosity of the food increased.

Chapter 4. Absorption of actives
134
As the number of contractions per minute increases, glucose absorption decreases (Figure
4.19). For low viscosity, changes in the number of pulses per minute does not have a
significant impact on glucose absorption having only about 10% of absorption after one hour.
However, as the viscosity increases absorption of glucose was clearly modified by frequency.
As shown by Macagno et al. (1982), when different types of contractions are applied different
degrees of convective transport are induced because of the different kinematics and volumes
that they displaced.
‘1s’ generates 20 pulses per minute this is a very short contraction that displace a very
small volume and less longitudinal mixing.
‘2s’ is equal to 10 pulses per minute this is a deeper contraction compare with the one
generated at 1s, with a major volume displace.
At 3s, the deepest contraction was generated displacing the highest volumes through
the SIM and as a consequence convective transport in the lumen side was achieved.
As the frequency increases but the time of exposure to diffusion decreases the absorption of
glucose decreases as well. However for 3s the time of exposure increases driven to higher
glucose absorption enhancing mass transfer.
The effect of the type of polymer and its rheological behavior at characteristic physiological
shear rates must be taken into account to predict the effect that biopolymers such as guar,
pectin or CMC has on glucose or actives absorption.
Each contraction reduces the area available for absorption occluding the flexible tube- lumen
and recipient sides- leaving no much area for absorption. Absorption has place when the
tubing is relaxed.

Chapter 4. Absorption of actives
135
These experiments suggest that glucose absorption in solution containing guar and pectin in
the range of concentration tested is little affected by the mixing frequencies used in this work.
In contrast, CMC showed to have a significant difference among processing conditions. This
could be explained based not only on the rheological behaviour of the biopolymer employed
but also based on the chemical structure and composition of this biopolymer compare to guar
(discussed in next section). According to the viscosity and the results of the OMTC in which
no great difference was observed at zero shear viscosities higher than 0.1 Pa.s. It can be
suggested the working shear rate could be from 10 to 50-100 (1/s) at which guar and pectin
seems to have similar viscosity independently of the concentration of biopolymer used. On
the other hand, CMC has different viscosities at this range of shear rates this could explain
why only with CMC significant differences were observed at carious frequencies.
Reduction on absorption of glucose in the presence of guar is probably due to resistance by
viscous solutions of convective effect of the intestinal contractions.
In the GI tract the frequency, amplitude and duration of segmentation contractions depend on
the physical and chemical properties of the chyme. Large meals, for example, stimulate
powerful phasic contractions through the body-antral reflex in the stomach (Schulze, 2006).
Liquid foods stimulate deep contractions whereas shallow contractions are generated when
contents are highly viscous (Schulze, 2006). Propagative and non propagative contractions
generate flow effects that are likely to enhance digestion and absorption. It is believed that
intestinal motility in vivo increases the exposure of the mucosa to absorbable materials.
The concentration gradients of any active in chyme that is being absorbed could be modified
by segmentation as a result of the dispersion, spread, mixing transport and distribution of
particles present in the chyme. By understanding these phenomena it will be possible to

Chapter 4. Absorption of actives
136
influence on the design of structured food and drug delivery systems to provide specific
benefits to consumers.
4.4. Biopolymer and their impact on absorption
Within the range of soluble fibres used in this work, the OMTC were reduced as the
concentration/viscosity of the biopolymer increase. Each polymer acts as a physical barrier to
nutrient absorption contributing to the formation of unstirred layer adjacent to the mucosa
(Anttila et al., 2003). However, each biopolymer shows different effect on glucose absorption
that could be related to their rheological behaviour.
4.4.1. Absorption versus rheology of the biopolymers
While pectin has a Newtonian behaviour in most of the shear rates used (0.1 – 1000 s-1), guar
gum and CMC are non-Newtonian/pseudoplastic fluids with shear thinning characteristics i.e.
viscosity decreases as shear rate increases (see Figure 3.5). To understand how their
rheological behaviour affects absorption, the OMTC of each biopolymer (section 4.3.2) are
compared in the following section. Only three cases of study were selected:
(i) Biopolymers (guar, pectin and CMC) at the highest concentration
(iii) Biopolymers (pectin and CMC) with similar zero-shear viscosities
(iv) Biopolymers (guar and pectin) with a cross over at shear rate of 100 (1/s)
Case I. A comparison among viscometry profiles of guar (0.75%, w/v), pectin (3.0%, w/v)
and CMC (1.25%, w/v) is presented in Figure 4.20. Table 4.16 shows the values of the
OMTC for each biopolymer at the highest concentration used.

Chapter 4. Absorption of actives
137
Table 4.16 OMTC for guar, CMC and pectin are compared at the highest concentration used.
Biopolymer 2s 3s
Guar (0.75%, w/v) 3.37 ± 0.15 3.43 ±0.01
CMC (1.25%, w/v) 3.05 ± 0.04 3.24 ± 0.04
Pectin (3.0%, w/v) 3.00 ± 0.06 3.11 ± 0.03
Shear rate (1/s)
0.01 0.1 1 10 100 1000 10000
Visc
osity
(Pa.
s)
0.01
0.1
1
10
Guar 0.75% w/v CMC 1.25% w/vPectin 3.0% w/v
Figure 4.20 Rheological behaviour of guar (0.75%, w/v), pectin (3.0%, w/v) and CMC (1.25, w/v).
As shown in Figure 4.20 guar gum shows the highest low-shear viscosities however is also
strongly shear-thinning. However, CMC and pectin have similar behaviours at low shear rates
(0.1 to 50 s-1). The three polymers have a crossover at shear rate of ~50 s-1. At high shear
rates 100 - 1000 s-1, this trend changed and pectin has the highest viscosity, then CMC and
finally guar. Interestedly, the OMTC at low frequencies of segmentation 2 and 3s (Table
4.16) are in agreement with the rheological behaviour of the biopolymers at high shear rates.
In this case, the OMTC for pectin were lower than CMC and guar. Based on the OMTC,
pectin was more effective than CMC to reduce absorption, and CMC was more effective than
guar.

Chapter 4. Absorption of actives
138
Overall, guar gum with the highest zero shear viscosity value displayed the highest OMTC
(Table 4.16), i.e. glucose absorption. However, pectin and CMC with similar zero shear
viscosities had similar OMCT values at 2s frequency. Results from Table 4.16 suggested that
pectin was the most effective biopolymer on reducing glucose absorption. This could be
explained by the rheological behaviour of the biopolymers at high shear rates after 100 s-1
where pectin has the highest viscosity, then CMC and finally guar.
Case II. It was also possible to observe that similar zero shear viscosities from pectin and
CMC resulting in similar OMTC (Table 4.17 and Figure 4.21).
Table 4.17 OMTC for CMC and pectin are compared at different concentration.
Biopolymer 2s 3s
Pectin (2.5%, w/v) 3.15 ± 0.02 3.30 ± 0.06
CMC (1.0%, w/v) 3.06 ± 0.13 3.31 ± 0.01
Shear rate (1/s)
0.01 0.1 1 10 100 1000 10000
Visc
osity
(Pa.
s)
0.1
1
Pectin 2.5% (w/v) CMC 1.0% (w/v)
Figure 4.21 Rheological behaviour of pectin (2.5%, w/v) and CMC (1.0%, w/v).

Chapter 4. Absorption of actives
139
Case III. On the other hand, when the viscometry profiles from guar and pectin (Figure 4.22)
showed a crossover at 100 s-1 the OMTC (Table 4.18) were very similar. These figures
confirm that the working shear rates in the SIM could be considered around 100 s-1.
Table 4.18 OMTC for guar and pectin are compared at different concentrations.
Biopolymer 1s 2s 3s
Guar (0.65%, w/v) 3.33 ± 0.06 3.35 ± 0.09 3.47 ± 0.05
Pectin (2.0%, w/v) 3.31 ± 0.11 3.37 ± 0.24 3.44 ± 0.26
Shear rate (1/s)
0.01 0.1 1 10 100 1000 10000
Visc
osity
(Pa.
s)
0.01
0.1
1
10
guar 0.65% (w/v) pectin 2.00% (w/v)
Figure 4.22 Rheological behaviour of guar (0.625%, w/v) and pectin (2.0%, w/v).
Overall, the different flow characteristics of each biopolymer are of practical value in
determining the type of gum required to delay glucose uptake form the intestinal lumen.
However, in some cases rheological behaviour is limited and the results could be
controversial and not conclusive. For that reason, it is fundamental to understand how
chemical structure of each biopolymer affects the interactions among chains (entanglements)
that could also influence biopolymers networks structure in lumen and most importantly in

Chapter 4. Absorption of actives
140
the stagnant region or the unstirred layer in the gut. Both physical and chemical interactions
are important to the physiological functions of the polymer in the GI tract.
4.4.2 Absorption and chemical structure of the chyme
4.4.2.1 Guar gum and chemical structure
Guar gum is a neutral biopolymer consisting of 1,4-linked β-D-mannopyranose back bone
with the branches of 1,6-linked α-D-galactopyranose (Figure 4.23). Previous studies in vivo
have stated that comparing the three polymers used in this work on postprandial glucose and
insulin levels, guar showed to be the most effective biopolymer on reducing plasma glucose
levels (Brenelli et al., 1997). This behaviour was explained as guar showed the greatest
stability and viscosity under acidic conditions in vitro i.e. under gastric conditions. Being
non-ionic, guar gum is not significantly affected by ionic strength or pH. Although guar
results in slightly higher OMTC, the concentration of guar used to increased the viscosity of
the digesta was ten-fold less than pectin. This criterion must be also considered in selecting
ingredients to develop functional food or drug formulations.
Figure 4.23 A schematic of the chemical structure of guar gum (Chaplin, 2012)

Chapter 4. Absorption of actives
141
4.4.2.2. Pectin and chemical structure
On the other hand, pectins are rich in galacturonic acid groups with linear chains (Figure
4.24). Pectins are divided into two major groups on the basis of their degree of esterification
that result in different functional properties.
Figure 4.24 A schematic of chemical structure of pectin (Chaplin, 2012)
The association of pectin chains leads to the formation of tridimensional networks that leads
to gel formation in presence of divalent ions such as Ca++. In human digestion, studies have
revealed that pectin could bind to cholesterol in the GI tract slowing absorption by entrapping
carbohydrates (Kim, 2005). Therefore, high-methoxy pectin showed to be more effective than
low-methoxy pectin on reducing blood glucose levels (Kim, 2005).
Polysaccharides with some charged groups such as pectins will be generally soluble in saline
solution due to the electrostatic repulsion that inhibits ordered packing (Guillon and Champ,
2000).
4.4.2.3 CMC and chemical structure
On the other hand, CMC has carboxymethyl groups bound to the hydroxyl groups of the
glucopyranose structure (Figure 4.25). As guar, solutions of sodium-CMC are non-
Newtonian with a pseudoplastic behaviour. Degree of pseudoplasticity results from the
nonuniform substitution of the carboxymethyl groups along the cellulose chain. The
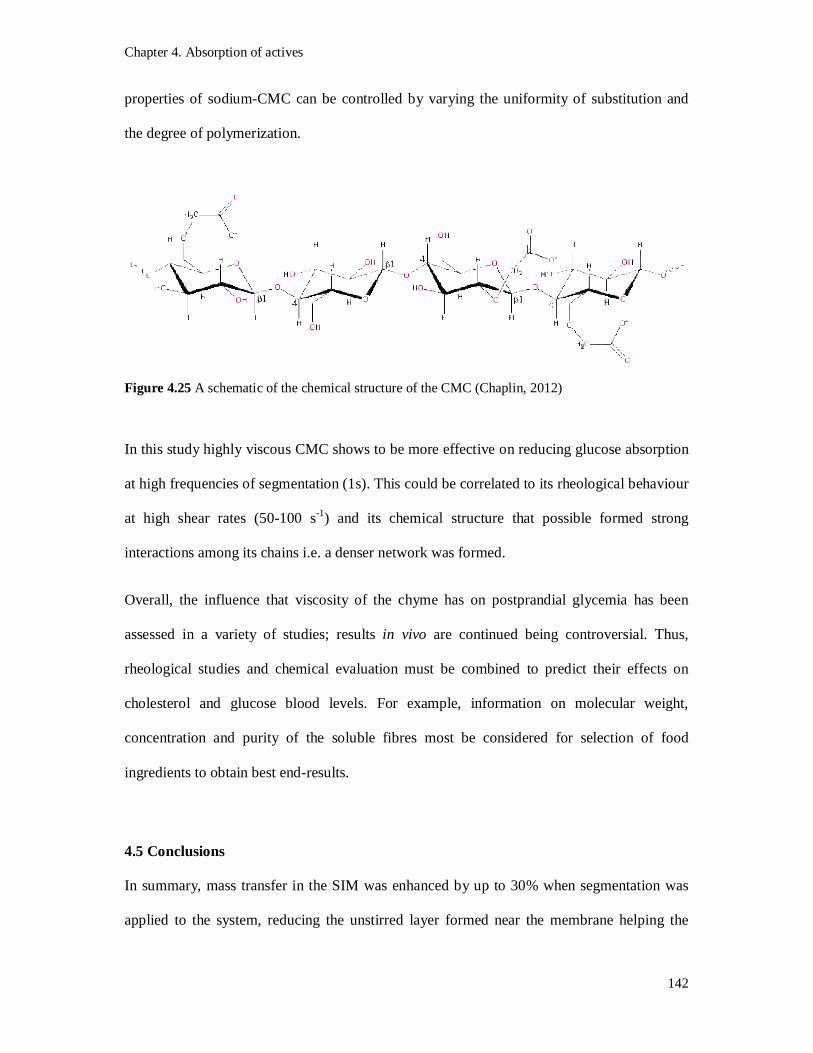
Chapter 4. Absorption of actives
142
properties of sodium-CMC can be controlled by varying the uniformity of substitution and
the degree of polymerization.
Figure 4.25 A schematic of the chemical structure of the CMC (Chaplin, 2012)
In this study highly viscous CMC shows to be more effective on reducing glucose absorption
at high frequencies of segmentation (1s). This could be correlated to its rheological behaviour
at high shear rates (50-100 s-1) and its chemical structure that possible formed strong
interactions among its chains i.e. a denser network was formed.
Overall, the influence that viscosity of the chyme has on postprandial glycemia has been
assessed in a variety of studies; results in vivo are continued being controversial. Thus,
rheological studies and chemical evaluation must be combined to predict their effects on
cholesterol and glucose blood levels. For example, information on molecular weight,
concentration and purity of the soluble fibres most be considered for selection of food
ingredients to obtain best end-results.
4.5 Conclusions
In summary, mass transfer in the SIM was enhanced by up to 30% when segmentation was
applied to the system, reducing the unstirred layer formed near the membrane helping the

Chapter 4. Absorption of actives
143
diffusion of glucose. Mixing processes increase the rate of glucose transferred by bringing
material to the epithelium. In contrast, mixing was impaired by the viscous fluids used: guar
and CMC.
When the viscosity of the lumen increases the effect of mixing was reduced by up to 90% for
0.5% (w/v) CMC solutions (no significant difference was observed between segmentation
and no segmentation for viscous solutions).
Overall, mixing and food formulation of the sample have a significant effect on the mass
transfer phenomena of glucose absorption in the SIM. Whilst mixing enhances mass transfer
phenomena in the intestine, increasing the viscosity of the food results in a reduction of the
mass transfer across the membrane of the SIM.
Wall movements influence intestinal absorption by bringing material to the sites of
absorption. However, the only biopolymer that seems to have a significant effect on glucose
absorption at different frequencies was CMC. Mass transfer coefficients were very similar
when guar gum and pectin were added to the glucose solution, as a function of different
frequencies of contractions.
Overall, results show that mass transfer coefficients increased as the frequency of
contractions decreased. On the other hand, increasing the viscosity of the lumen or
biopolymer side resulted in a decrease of the mass transfer coefficients.

144
CHAPTER 5 - STARCH DIGESTION IN THE SIM
5.1 Introduction
Most of food digestion takes place in the small intestine in which intestinal motility promotes
interactions between food particles and digestive fluids. In order to understand and reproduce
these processes, an in vitro dynamic small intestine model (SIM) was used to study starch
digestion. Starch was selected as model in this work due to its importance as glycemic
carbohydrate component in foods; contributing significantly to the exogenous supply of
glucose and the total food energy intake (Slaughter et al., 2001). This work focuses on the
effect that mixing and food formulation has on the rates of starch digestion.
Starch in the human diet is digested in the mouth, stomach and small intestine into di- and
monosaccharides, which are the only form which can be absorbed (Guyton and Hall, 2006).
According to the rate of hydrolysis in the gut, starch could be classified into rapidly digestible
starch (RDS), slowly digestible starch (SDS), and resistant starch (RS). RDS is absorbed in
the duodenum and proximal regions of the small intestine within the first 20 minutes, and it is
correlated to the glycemic values of the sample. On the other hand, RS is the starch not
hydrolysed after 120 minutes of incubation, i.e. not digested in the upper gastrointestinal
tract, while SDS is the digested portion between RDS and RS and it is thought to be digested
along the whole small intestine between 20 and 120 minutes (Englyst et al., 1992, van
Kempen et al., 2010). Concerning to glucose delivery, RDS provides a rapid and high level of
glucose (high glycaemic index), RS theoretically does not provide glucose and SDS provides
a slow and prolonged glucose delivery (low glycaemic index). Control of glucose delivery in
foods can be determined by food structure and the physicochemical properties of the
carbohydrate components in foods (Lundin et al., 2008, Snow and O'Dea, 1981). When

Chapter 5 - Starch digestion
145
refined sugars and rapidly digested carbohydrates are included on daily diets, blood glucose
and insulin responses are usually enhanced, resulting in dietary related chronic diseases such
as diabetes and obesity (Read and Welch, 1985). Since the relationship between an ingested
carbohydrate and its related glycaemic index value is not always intuitively obvious (Monell,
2005), structured foods with specific health benefits should be designed in conjunction with
studies to understand how food formulation impacts on digestion and absorption rates in the
gastrointestinal tract.
As established in section 4.2, intestinal absorption was influenced by the physical properties
(viscosity, density, concentration, flow rate) of the lumen content. Increasing viscosity of the
lumen reduces the rate of nutrient absorption and mass transfer to the membrane. On this
context, addition of viscous fibres into foods may also protect starch from enzymatic attack
(Leclere et al., 1994). Such as rates of digestion and nutrients absorption could be modified
by changing food formulation resulting in structured food with improved health properties.
The main objective of the experiments presented in this Chapter was to reproduce and model
starch digestion by studying the effect that mixing and food formulation has on glucose
absorption. Furthermore, starch digestion was studied varying the concentration of starch, α-
amylase and flow rate at which the enzyme solution was fed. Digestion and absorption
processes were studied in the SIM by simulating as close as possible the physiological
conditions of the human small intestine. Two different SIM configurations were used: (i)
closed-SIM, with no recirculation of the chyme and (ii) open-SIM, in which recirculation of
the chyme was induced by a peristaltic pump.

Chapter 5 - Starch digestion
146
5.2 Starch hydrolysis in the closed SIM configuration
5.2.1 Starch digestion: effect of mixing
Due to the importance of mixing on enzymatic digestion processes, in this section, starch
hydrolysis in the SIM is compared with the hydrolysis performed in a well-mixed reactor as
described in section 3.4.5.
Model I. The Stirred Tank Reactor (STR) was equipped with a Rushton turbine impeller and
four baffles as described in section 3.4.5.4 (Figure 3.7a). The diameter of the tank and the
impeller were 0.075 m, and 0.045 m, respectively. The turbine was operated at 300 rpm and
reactions were carried out in 250 ml of aqueous solutions containing 10 g/l of corn starch
pregelatinized during 10 minutes in boiling water.
Model II. In the Small Intestine Model (SIM) mixing was induced by two inflatable cuffs
(Figure 3.7b) to represent the characteristic segmentation contractions in the small intestine.
Contractions were generated by two inflatable cuffs at a rate of ten cycles per minute with the
following standard pattern: 2 seconds inflation, 2 seconds deflation and 2 seconds delay
between each cuff. Reactions were carried out in the lumen side (membrane side) of the SIM
with 600 ml of aqueous solutions containing 10 g/l of corn starch previously gelatinized (10
minutes in boiling water) and with no recirculation of the chyme.
Enzyme solution (25 ml for the STR and 50 ml for the SIM) was freshly prepared for the
digestion analysis by dissolving the pancreatic α-amylase (5 U/ml) and amyloglucosidase
(0.5 U/ml) into a pancreatic mix solution for 10 minutes at room temperature (according to
the method described in section 3.4.5.2). According to the supplier, one unit of pancreatic
amylase will liberate 1.0 mg of maltose from starch in 3 min at pH 6.9 at 20 °C.

Chapter 5 - Starch digestion
147
The pancreatic solution was fed into the reactor using a thin polyvinylchloride tube ending
approximately 5.0 cm distally to the first cuff of the SIM (Figure 5.1) and 3.0 cm from the
base of the STR. Before hydrolysis, the tubing was connected to a micro peristaltic pump and
filled with the pancreatic solution. This micro-system was implemented here to mimic the
injection of enzymes and salts from the pancreas into the small intestine. The pancreatic duct
(see section 2.2.6) was represented by the long tubing (0.003 m of diameter) showed in
Figure 5.1.
Figure 5.1 Schematic of the experimental SIM set-up for starch hydrolysis.
The reaction was started by pumping the pancreatic mix solution into the reactor of the STR
or in the lumen side of the SIM at an apparent flow rate of 3.0 ml/min (Table 5.1). At time
zero before injection of the pancreatic solution, a sample was taken and used as control/blank
for glucose determination.
Table 5.1 Experimental conditions used for starch digestion.
Starch Enzyme Flow rate
STR 1.0%, w/v 5 U/ml 3.0 ml/min
SIM 1.0%, w/v 5 U/ml 3.0 ml/min
0.12 m Outer tube Pancreatic
0.5 m
0.0305 m
Amylase in pancreaticmix solution[Enzyme] = 25 U/mlFlow rate= 3.0 ml/minVolumen = 50 ml

Chapter 5 - Starch digestion
148
Samples were taken from the STR and the SIM reaction mixture at time intervals up to 90
minutes before determination of reducing sugars. Since the closed-SIM configuration was
used, samples from the lumen side of the SIM were taken with a needle and syringe placed in
the peristaltic pump tubing, at the distal end of the membrane. To inactivate the enzyme the
glass tube containing the sample was placed into boiling water during 5 minutes. The
concentration of glucose was calculated following the method of 3,5-dinitrosalicylic acid
(DNS) for reducing sugars (expressed as ‘mM’ of glucose). All experiments were performed
at room temperature and in triplicate.
Figure 5.2 shows the increase in glucose concentration after starch hydrolysis in both models
the STR and the SIM. By using the STR, starch digestion has a fast rate of reaction (44.8
µM/s) at the beginning of the hydrolysis process following by a decreased rate, reaching a
plateau (saturation of the enzyme) after approximately 20 min with maximum glucose
concentration of 31 mM. On the other hand, the hydrolysis of starch in the SIM appears to
have a sigmoidal behavior with a ‘lag phase” due to the incomplete mixing of the starch and
amylase at the early stage of the hydrolysis within the first ten minutes. After the lag time,
kinetics of starch in the SIM appeared to have the same trend than those in the STR, with a
rapid rate (24 µM/s) from 10 to 30 minutes followed by a decreasing rate until equilibrium is
reached. Maximum glucose concentration (31 mM) in the SIM was achieved after 40 minutes
of digestion. This behaviour depends on the mixing mechanism applied to the system. Faster
reactions took place in the STR, in which enzymes and substrate were well-mixed, due to the
turbulence created by the baffles and the impeller at 300 rpm with Re = 11300. On the
contrary, fluids in the SIM are in the transitional regime (Re = 2100) in which mixing was
provided as concentric contractions (10 per minute) by means of the two inflatable rubber

Chapter 5 - Starch digestion
149
cuffs section. The SIM represents a more realistic model with representative anatomical and
physiological features and flow occurring in the human small intestine.
Time (min)
0 20 40 60 80 100
Glu
cose
con
cent
ratio
n (m
M)
0
10
20
30
40
Stirred Tank ReactorSmall Intestine Model
Figure 5.2 Starch digestion in the Stirred Tank Reactor (STR) and in the Small Intestine Model (SIM)
The hydrolysis reaction behaviour in the STR and in the SIM was assumed to follow first
order reaction in the first minutes of the reaction. Therefore, it is assumed that the reaction
follows first order equation which is arranged as follows:
[ ] = −푘[푆] (5.1)
Integration of equation 5.1 gives:
ln [ ][ ]
= −푘푡 (5.2)
where S is the concentration of starch at time t, S0 is the concentration of starch (mM) at t = 0,
k is the kinetic constant (min-1), and t is time (Levenspiel, 1999). Based on the data from
Figure 5.2, starch concentration was estimated according to equation 5.2. The data were
analysed by linear regression where the slope of the curve represents the value of –k (Table

Chapter 5 - Starch digestion
150
5.2). Kinetic behaviour trends give a fairly good correlation to first order reaction behaviour
marked by the r2 value of 0.94. However, kinetic behaviour of starch hydrolysis in the SIM
(Figure 5.2) gives a correlation with r2 less than 0.9. This is a result of the characteristic “lag
phase” at the onset of the reaction (first 10 minutes).
Table 5.2 Kinetic constant based on first order reaction behaviour
Model Mixing method Kinetic constant, k (min-1)
STR Impeller (300 rpm) 0.052
SIM Segmentation contractions (2s) 0.012
The results of kinetic parameters described previously provide strong evidence that mixing
mechanism has a considerable effect on constant values, thus, it affects the rate of hydrolysis
reaction as well. Turbulent flow leads to rapid hydrolysis reaction.
From this experiment, it is possible observed that the type and degree of agitation can affect
significantly the rate of starch hydrolysis mostly in the early stage of digestion. During food
digestion, mixing is essential to bring substrates and enzymes together and increase the rate
of reactions taking place in the GI tract. The small intestine can be modelled as a plug reactor
in which the concentration of substrates changes with both time and position.
5.2.2 Starch digestion: effect of food formulation
Corn starch hydrolysis was also studied in the SIM, while varying the viscosity of the digesta
by adding guar gum (0.5%, w/v) to a 1.0% (w/v) starch solution and 50 g of white bread
(section 3.4.5). For these experiments, glucose concentration was only monitored in the
recipient side (outer tube) of the SIM because glucose quantification inside of the membrane
is difficult due to viscosity of the digesta Samples (1.0 mL) were taken at time intervals to
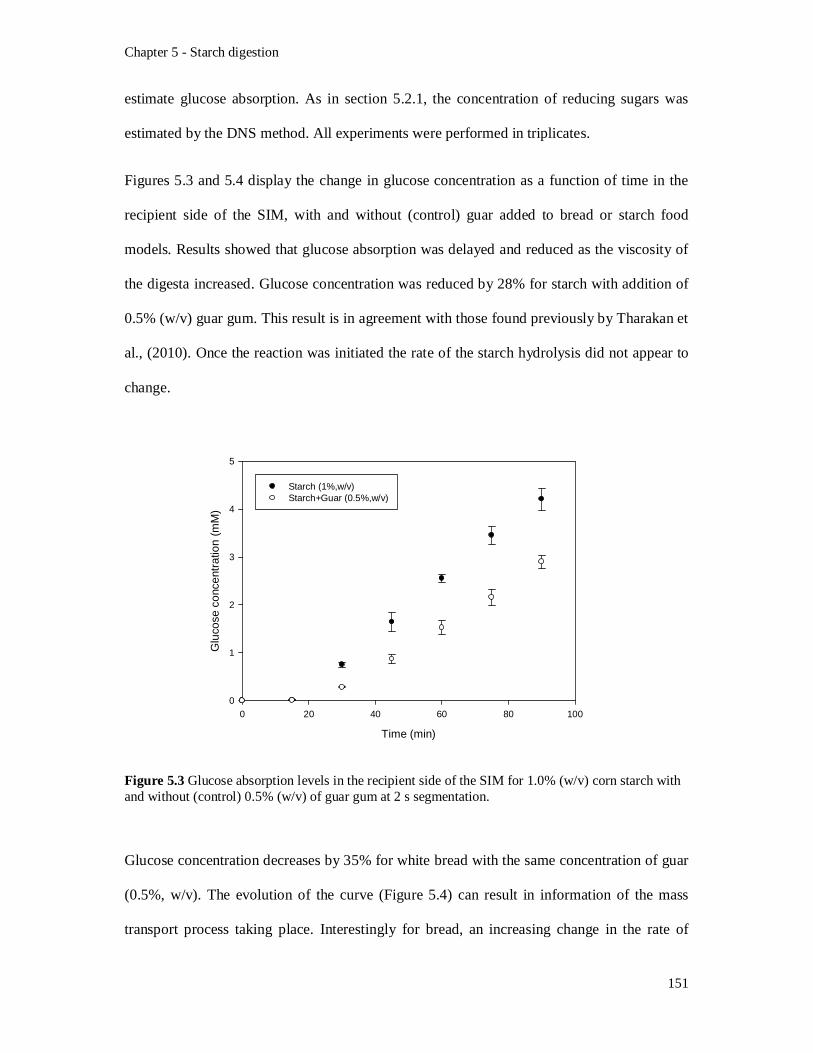
Chapter 5 - Starch digestion
151
estimate glucose absorption. As in section 5.2.1, the concentration of reducing sugars was
estimated by the DNS method. All experiments were performed in triplicates.
Figures 5.3 and 5.4 display the change in glucose concentration as a function of time in the
recipient side of the SIM, with and without (control) guar added to bread or starch food
models. Results showed that glucose absorption was delayed and reduced as the viscosity of
the digesta increased. Glucose concentration was reduced by 28% for starch with addition of
0.5% (w/v) guar gum. This result is in agreement with those found previously by Tharakan et
al., (2010). Once the reaction was initiated the rate of the starch hydrolysis did not appear to
change.
Time (min)
0 20 40 60 80 100
Glu
cose
con
cent
ratio
n (m
M)
0
1
2
3
4
5
Starch (1%,w/v) Starch+Guar (0.5%,w/v)
Figure 5.3 Glucose absorption levels in the recipient side of the SIM for 1.0% (w/v) corn starch with and without (control) 0.5% (w/v) of guar gum at 2 s segmentation.
Glucose concentration decreases by 35% for white bread with the same concentration of guar
(0.5%, w/v). The evolution of the curve (Figure 5.4) can result in information of the mass
transport process taking place. Interestingly for bread, an increasing change in the rate of

Chapter 5 - Starch digestion
152
absorption illustrated by the crossover in Figure 5.4, was observed. At the beginning of the
absorption process, diffusion could be predominant under convection with a lower rate of
absorption. However, after approximately one hour, the rate at which glucose and sugars are
absorbed was twofold faster; from 0.47 µM/s to 0.89 µM/s. This result could be related to the
point at which viscosity of the lumen contents decreases, allowing that glucose mass transport
occur faster than in the first stage of absorption likely by convection after glucose generation
by starch hydrolysis. In the future, rheology measurements must be done to follow the
progress curve of starch hydrolysis and confirm this explanation. As the viscosity of the
digesta increases, enzymatic reactions and molecular delivery across the semipermeable
membrane operates under mass transfer restriction (Table 5.3.). For rapidly digested foods
such as white bread and cooked and homogenised potato, Englyst et al., (1992) pointed out
that more than 80% percent of the starch present is converted into glucose within the first 10
minutes. Subsequently, the rate of hydrolysis declines so that only a further 5-10% of the
starch is converted to glucose after this period (Englyst et al., 1992).
Time (min)
0 20 40 60 80 100 120 140
Glu
cose
con
cent
ratio
n (m
mol
/l)
0
1
2
3
4
5
Bread (control)Bread + Guar (0.5%, w/v)
Figure 5.4 Glucose absorption levels in the recipient side of the SIM for 50 g of white bread with and without (control) 0.5% (w/v) of guar gum.

Chapter 5 - Starch digestion
153
This suggests that mass transport to the dialysis membrane could be controlled by the
properties of the chyme under physiologically representative process conditions (Tharakan, et
al., 2009) and also impact directly on some metabolic disorders such as diabetes and
hyperlipidemia. Results are in accordance with previous findings when viscous polymers
such as guar, tragacanth and pectin were adding to food systems, decreasing the postprandial
glucose and insulin responses (Jenkins et al., 1978).
5.2.2.1 Mass transfer coefficients
From data in Figures 5.3 and 5.4, the overall mass transfer coefficient was estimated as
described in section 4.2 by the slope in each curve of glucose absorption. The data were
analysed in the linear region of the curve, once the flow was fully developed from 10 to 90
min. Absorption appeared to be linear (R2 of 0.95) resulting in a gradient of 7.45 x 10⁻³ mM/s.
The flux, N, was calculated to be 1.55 x 10⁻⁵ mol/m2s. By dividing the molar flux by the
concentration difference (mmol/m3) an overall mass transfer coefficient, K, was obtained as
4.83 x 10⁻⁷ m/s for the aqueous starch solution and 3.10 x 10⁻⁷ m/s for the starch solution
added with guar, both under segmentation conditions.
The effect of the presence of guar was shown a 36% reduction in the mass transfer coefficient
when mixing was applied (Table 5.3). The data not only suggest that the rate of enzymatic
reactions was reduced when guar was added but also that viscous solutions can delay the
access of actives to the absorptive epithelium due to a decrease of both propulsion and
mixing (Read and Welch, 1985). Similarly, this tendency was observed when bread digestion
was mimicked in an aqueous solution (control) and in the presence of guar. When viscosity of
the lumen content was increased from 2 to 200 mPa.s, glucose absorption was reduced almost
15% after one hour, however, no significant difference was observed within the first minutes
of digestion (Figure 5.3 and 5.4) while the overall mass transfer coefficient from bread with

Chapter 5 - Starch digestion
154
guar gum was reduced 20%. These results are in agreement to those reported by Tharakan et
al. (2010).
Table 5.3 Rates of absorption and overall mass transfer coefficient (OMCT) for two food models.
Experiment Absorption (µM/s) OMTC (µm/s)
Starch
Control 0.75 ± 0.05 0.48 ± 0.05
Guar gum (0.5%, w/v) 0.48 ± 0.02 0.31 ± 0.08
Bread
Control 0.67 ± 0.01 0.43 ± 0.04
Guar gum (0.5%, w/v) 0.50 ± 0.02 0.32 ± 0.02
Overall, mass transfer coefficient was reduced when guar gum (0.5%, w/v) was added to the
solution of starch and bread. That could be explained by inhibition of propulsion and mixing
in the membrane making interactions between the starch and amylase also difficult. Thus,
starch digestion was lower in the presence of guar. Results suggest that molecular delivery is
largely influenced by the fluid dynamics of the lumen side. Viscous polymers create a
physical resistance for active release and delivery that could modify the rate of nutrients
absorption for the design of healthy diets with specific targets. Since diffusion of amylase
into the substrate is considered an essential step in carbohydrates hydrolysis mechanisms
(Lehmann and Robin, 2007), interactions of starch with fibre, protein and other food
components that can prevent effective diffusion and absorption of the enzyme into the starch
structure will reduce or delay rates of digestion and further absorption (Collonna et al., 1992;
Lehmann and Robin, 2007).
Starch granules were examined by Scanning Electron Microscopy (SEM) before and after
hydrolysis. Analysis of the microstructure of the starch was done after one hour of digestion

Chapter 5 - Starch digestion
155
in samples of starch previously washed with distilled water and dried in an oven at 50 °C.
Scanning electron micrographs of normal corn starch before and after hydrolysis by porcine
pancreatic α-amylase are shown in Figures 5.4 (a-d). Before gelatinization and hydrolysis,
granules present a spherical-polyhedric shape with a diameter between 2 and 30 µm (Figures
5.4a-b). After cooking and digestion by α-amylse in the presence of guar, formation of
clusters was observed due most likely to both cooking and presence guar (Figure 5.4c). Under
higher magnification (Figure 5.4d) the starch residue appeared as clustered compactly
particles with some fragmented granules (hollow granules) from which the layered granule´s
structure could be seen. This clustered structure could also “protect” at some level the granule
from amylase delaying enzyme diffusion into the granule of starch.
Figure 5.5 SEM microphotographs of corn starch (a-b) before hydrolysis and (c-d) after 60 minutes of hydrolysis of pancreatic α-amylase at room temperature in the presence of 0.5% (w/v) of guar gum.
c d
a b
Chapter 5 - Starch digestion
156
There is evidence in the literature that enzymatic susceptibility of starch is highly dependable
of its microstructure and physicochemical characteristics (Dona et al., 2010). As such any
process that can change this orderly structure makes granules of starch available for
enzymatic reactions. Digestibility is for example, significantly impacted by shearing and
heating the solution of starch (Dona et al., 2010).
5.3. Starch hydrolysis in the open SIM configuration
Having established that mixing and soluble viscous polymers affect digestion and absorption
processes in the SIM. A series of experiments were performed to assess the effect that factors
such as enzyme activity, flow rate and substrate concentration has of digestion and
absorption. However, these experiments were performed in the open-SIM configuration
because it was observed that in the closed configuration mixing was not effectively done. As
such chyme was recirculated by a peristaltic pump to facilitate mixing and propulsion of the
lumen contents. Samples from the lumen side of the SIM were taken from the starch
reservoir, no agitation was provided to this vessel to avoid reactions take place there. The
volume of the solution in this vessel was kept constant (no more than 150 ml) allowing the
volume of liquid displaced by the cuff moves forward and backward. The first set of
experiments described in this section was performed to study the effect that enzyme
concentration has on glucose absorption. Four experimental conditions were used (Table 5.4),
varying (i) the initial concentration of amylase in the pancreatic solution and (ii) the flow rate
at which the solution was fed into the lumen side of the SIM. As pancreatic secretions in vivo
change not only from one person to another but also according to the chemical composition
of the food, a wide range of physiological relevant flow rates and amylase concentrations
were used for these experiments. The flow rate and amylase concentration were varied from
0.3 to 3.0 ml/min and from 2.5 to 25 units, respectively. The levels of these parameters were
Chapter 5 - Starch digestion
157
selected based on data from the literature (Mandalari et al., 2010b, Blanquet et al., 2004,
Gregg and Sharma, 1978), to simulate slow and fast digestion processes in the small intestine
after intake of starch-containing foods. Table 5.4 summarized the experiments performed for
starch digestion.
Experiment (I) was performed with the minimum levels of flow and amylase concentration,
resulting in low rates of digestion and absorption. In this case, simulated pancreatic secretions
(50 ml in total) were injected continuously into the lumen during approximately 2.5 hours at
0.3 ml/min.
On the contrary, experiment (IV) was performed with the highest values selected for both
enzyme and flow rate (tenfold higher than those in experiment I). Here, the pancreatic
solution was fed into the lumen at an apparent rate of 3.0 ml/min. At this rate, the total
pancreatic solution was already injected into the system within the first 20 minutes (16.6
minutes approximately). After that, the concentration of enzyme in the lumen was constant.
Experiments II and III were designed to feed the enzyme at the same ratio either by changing
concentration or flow rate, into the lumen side of the SIM.
As the purpose of these experiments was to study the effect of amylase on the rate of
reaction, the concentration of amyloglucosidase was kept constant (5 U/ml of food) in the
pancreatic solution.
5.3.1 Effect of flow rate and enzyme concentration
Digestion was performed in corn starch solutions (1.0%, w/v) previously cooked in boiling
water during 30 minutes. Once starch was at room temperature, gastric digestion was

Chapter 5 - Starch digestion
158
simulated by adjusting the pH of the sample from 5.4 to 2.5 with 1.0 M HCl. After one hour
under magnetic agitation, the solution was neutralized with 1.0 M NaHCO3, increasing the
pH from 2.5 to 6.5 to simulate phenomena occurring in the gastro duodenal system. Then, the
solution (600 ml) was fed into the lumen side of the SIM. Intestinal digestion started when
simulated pancreatic mix (50 ml) was pumped into the lumen side of the SIM and continued
for up to 3 hours. Mixing in the small intestine was induced as concentric contractions
induced every 2 seconds with the same pattern described in section 4.3. Samples were taken
at different time intervals until the end of the experiment to measure reducing sugars, as
glucose, by the acid 3,5-dinitrosalycilic acid (DNS) method, in the lumen side of the SIM
(inside of the dialysis membrane) and in the recipient side (outside of the membrane).
Experiments were done in triplicates from independent experiments as shown in Table 5.4.
Table 5.4 Experimental conditions used for starch digestion.
Experiment Starch (%, w/v) Enzyme (U/ml) Flow rate (ml/min)
I 1.0 2.5 0.3
II 1.0 25.0 3.0
III 1.0 2.5 0.3
IV 1.0 25.0 3.0
The results from starch hydrolysis and glucose absorption obtained from the lumen side
(membrane) and glucose absorption after generation in the recipient side (outer side) of the
SIM varying the concentration of amylase per minute are presented in Figure 5.6 (a) and (b),
respectively. An increase in glucose was observed in both sides of the SIM as the
concentration of amylase increased over time. Starch hydrolysis exhibited a characteristic
“lag phase” in the early stage of the enzymatic reaction followed by a fast rate and decreased
rate, reaching steady state after approximately 60 minutes depending on the experimental

Chapter 5 - Starch digestion
159
conditions with maximum glucose concentration ( ~35 mM). Glucose absorption seems to be
linear in the recipient side with a maximum of approximately 5 mM after one hour, around
ten percent of the glucose released from starch digestion in the lumen. Similar percentages
were obtained in experiments of glucose absorption (Chapter 4) for aqueous solutions in
which only ten percent of glucose from the lumen moves across the membrane after one hour.
Here, this percentage was reached after approximately 120 minutes of digestion, implying
that in the first hour, glucose is released from the complex structure of starch (lag phase in
Figure 5.6b) and then free sugars with low molecular weight could diffuse to the recipient
side of the SIM.
Figure 5.6 Digestion in the SIM, (a) starch digestion in lumen and (b) glucose absorption in recipient side.
Table 5.5 shows the rate of digestion of starch and glucose absorption calculated from linear
regressions of the data plot in Figure 5.6 (a-b). The Overall Mass Transfer coefficients were
estimated from the flux of the lumen to the recipient side with the concentration difference at
the maximum concentration reached at the steady state in the lumen (31 mM).
Time (min)
0 20 40 60 80 100 120 140 160 180 200
Cha
nge
in g
luco
se (m
M)
0
1
2
3
4
5
6
2.5 U at 0.3 ml/min 25.0 U at 0.3 ml/min 2.5 U at 3.0 ml/min 25.0 U at 3.0 ml/min
Time (min)
0 20 40 60 80 100 120 140 160 180 200
Cha
nge
in g
luco
se (m
M)
0
10
20
30
40
2.5 U at 0.3 ml/min 25.0 U at 0.3 ml/min 2.5 U at 3.0 ml/min 25.0 U at 3.0 ml/min
(a) (b)

Chapter 5 - Starch digestion
160
The rate of starch hydrolysis increased up to 90% as the concentration of enzyme increased
ten-fold in the lumen side, reaching its maximum value at 25.0 units and 3.0 ml/min while the
minimum was observed for the lowest concentration of enzyme at 2.5 units and 0.3 ml/min.
Table 5.5 Digestion and absorption rates for experimental conditions in the SIM.
Experiment Digestion
(µM/s)
Absorption OMTC (µm/s)
(µM/s) (min)
2.5 U at 0.3 ml/min 6.91 ± 1.23 0.40 ± 0.04 60 0.33 ± 0.03
25.0 U at 0.3 ml/min 9.22 ± 2.34 0.49 ± 0.21 45 0.35 ± 0.09
2.5 U at 3.0 ml/min 8.43 ± 0.78 0.51 ± 0.01 45 0.38 ± 0.05
25.0 U at 3.0 ml/min 54.55 ± 2.11 0.48 ± 0.05 30 0.30 ± 0.02
Results in the lumen side also showed no significant difference between experiments II and
III, indicating that the method used to feed the enzyme had no significant effect on the rate of
starch digestion. This implies that regardless how fast or concentrated the pancreatic solution
is fed into the SIM, whether activity of enzyme in digesta is the same the hydrolysis will take
place at similar rates of reaction in well-mixed solutions with viscosities like water. Thus,
enzyme activity in the lumen can be controlled either by the flow rate at which the pancreatic
fluid is fed into the small intestine or the concentration of enzyme present in the digestive
secretions.
The increase of enzyme concentration per ml of digesta markedly increased the hydrolysis of
starch but had little effect on glucose absorption (Table 5.5). However, the activity of
amylase impacted significantly the time at which glucose was absorbed. From the highest
enzyme concentration, the change in glucose was detectable at 30 min in the recipient side.
There was a ‘delay’ on glucose absorption (from 30 to 60 min) when the rate of starch
digestion decreased. Once glucose was generated and released from the starch structure in the

Chapter 5 - Starch digestion
161
lumen side, absorption took place. Assuming that the chyme moves along the small intestine
at 1.0 cm/min (Guyton and Hall, 2006), glucose absorption under conditions presented in
Table 5.5, will take place in the first 30, 45 and 60 cm of the duodenum and jejunum.
Interestingly, absorption phenomena could be correlated to the point where viscosity of the
starch solution in the lumen falls allowing diffusion of nutrients. The glucose profiles in the
recipient side appeared to be linear with no appreciable amounts of glucose at the beginning
of the experiment.
From the starch digestion experiment it was possible to show the effect that segmentation
motion and food formulation had on nutrient delivery to the intestinal wall as a consequence
of changes in the mass transfer coefficient. On the other hand, the rate of food digestion
might be important in assessing the extension at which they raise blood glucose levels in
normal and diabetic people.
5.3.2 Effect of substrate concentration and food formulation
To complement the results above, a series of experiments were performed in the SIM to study
the effect that starch concentration has on the rate of glucose absorption. The influence of
food formulation was also studied by adding guar gum (0.5 - 0.75%, w/v) to the starch
solution. Based on the experimental conditions used in section 5.3.1, preliminary experiments
were done to select the ‘optimal’ concentration of amylase and the flow rate at which the
enzyme should be injected into the SIM to obtain representative data from the next set of
experiments. Table 5.6 summarizes the parameters used.

Chapter 5 - Starch digestion
162
Table 5.6 Experimental conditions for starch hydrolysis in the SIM
These experiments carried out at room temperature and pH 6.5. The levels of the flow rate were
selected to represent the range found by Gregg and Sharma, (1975) in human’s pancreatic
secretions (4.13 ± 0.88 ml/min). The maximum concentration of amylase (25 U/ml) was
selected according to the protocol established by the Institute of Food Research (IFR) in
Norwich, UK (Mandalari et al., 2010b).
Digestion was performed at room temperature in 600 ml of digesta consisting of 550 ml of
pregelatinized (boiling water/30 minutes) starch solution (1.0%, w/v) and 50 ml of 0.1M Bis-
Tris buffer (pH 6.5 ± 0.2). Digestion was monitored in the lumen whereas glucose absorption
was monitored in the recipient side of the SIM. Chyme was recirculated along the SIM by a
peristaltic pump during 2 hours while the pancreatic solution was fed as shown in Figure 5.1.
Mixing of the lumen contents was done by applying segmentation contractions every 2
seconds as described in section 3.2.2. All experiments were done in duplicate or triplicate
from independent experiments.
5.3.2.1 Effect of flow rate of the enzyme
In Figures 5.7 (a) and (b) results for starch digestion and glucose absorption at various flow
rates are shown. During these experiments the concentration of starch 1.0% (w/v) and the
initial concentration of amylase (10 U/ml of food) were constant. Pancreatic solution (50 ml)
was fed into the lumen side at 1.5, 3.0 and 4.5 ml/min, meaning that the whole solution (50
Parameters Experimental values
x1 = Flow rate (mL/min) 1.5 3.0 4.5
x2 = Enzyme concentration (U/mL) 5 10 15 25
x3 = Starch concentration (%, w/v) 0.5 1.0 2.0 3.0
x4 = Biopolymer concentration (%, w/v) 0.0 0.25 0.50 0.75
Chapter 5 - Starch digestion
163
ml) was injected after 33, 17 and 11 minutes, respectively. After this period the concentration
of the enzymes in the lumen of the SIM was constant.
As expected, the rate of starch digestion increased as the flow rate increased. Starch was
hydrolyzed to the extent of 85%, reaching the maximum glucose concentration (31 mM) after
60, 30 and 30 minutes for 1.5, 3.0 and 4.5 ml/min, respectively. Increasing the flow rate from
1.5 to 3.0 has a significant influence in both rate of digestion and time to reach saturation.
However when the rate of digestion was increased from 3.0 to 4.5 ml/min, no significant
difference was observed neither in rate nor in time of digestion.
In agreement with the results of digestion, no significant variation in glucose absorption was
found when the flow rate increased. No glucose was detected in the recipient side during the
first twenty minutes of digestion. Interestingly, the delay in glucose corresponds to the lag
time in the lumen side. Over this period, glucose increased linearly over time reaching a
concentration up to 3.5 mM around 10% of glucose generated in the lumen of the SIM.
As no significant difference was observed in digestion and absorption process between 3.0
and 4.5 ml/min in further experiments a flow rate of 3.0 ml/min would be used.

Chapter 5 - Starch digestion
164
Time (min)
0 20 40 60 80 100 120 140
Glu
cose
con
cent
ratio
n (m
M)
0
10
20
30
40
1.5 ml/min 3.0 ml/min 4.5 ml/min
Time (min)
0 20 40 60 80 100 120 140
Glu
cose
con
cent
ratio
n (m
M)
0
1
2
3
4
1.5 ml/min 3.0 ml/min 4.5 ml/min
Figure 5.7 Starch digestion and glucose absorption in the (a) lumen and (b) recipient side of the SIM, respectively, varying the flow rate at which the pancreatic solution was fed into the membrane.
(a)
(b)

Chapter 5 - Starch digestion
165
5.3.2.2 Effect of the concentration of the enzyme
Pancreatic amylase is present in high activity in the lumen of the small intestine and it has
been assumed that the enzyme does not contribute significantly to the rate-limiting process
governing carbohydrate digestion and absorption (Slaughter et al., 2001). In order to study
the effect of α-amylase concentration upon the reaction rate, a series of experiments were
carried out keeping the concentration of starch and the enzyme´s feeding flow rate constant at
1.0% (w/v) and 3 ml/min, respectively. Any change in the amount of product formed over a
specified period of time will be dependent upon the level of enzyme present. As Figures 5.8
(a) and (b) show, the rate of digestion and absorption exhibited no significant difference for
the range of concentrations of α-amylase used in this set of experiments. The characteristic
“lag phase” was observed within the first 10 minutes of the reaction. Prior to this time, the
concentration of glucose was less than 2 mM. As time increased the velocity of the reaction
increased rapidly reaching a plateau after approximately 30 minutes.
Figure 5.8 Starch digestion and glucose absorption in the (a) lumen and (b) recipient side of the SIM, respectively, varying the activity of α-amylase.
Samples containing 1.0% (w/v) of starch were digested at room temperature and pH 6.5,
whereas pancreatic solution was fed a 3.0 ml/min for all experiments.The velocity of the
reaction increased proportionally as the activity of amylase increased. When hydrolysis was
done with 5 U/l the rate of digestion was significantly reduced compared with higher
Time (min)
0 20 40 60 80 100 120 140
Glu
cose
con
cent
ratio
n (m
M)
0
10
20
30
40
5 U/ml 10 U/ml 15 U/ml 25 U/ml
Time (min)
0 20 40 60 80 100 120 140
Glu
cose
con
cent
ratio
n (m
M)
0
1
2
3
4
5
5 U/ml 10 U/ml 15 U/ml 25 U/ml
(b) (a)

Chapter 5 - Starch digestion
166
concentrations of enzyme however, no significant differences were found when the enzyme
increased from 10 to 25 units (Figure 5.9).
Time (min)
0 10 20 30
Glu
cose
con
cent
ratio
n (m
M)
0
10
20
30
40
5 U/ml 10 U/ml 15 U/ml 25 U/ml
Figure 5.9 Starch digestion in the lumen side of the SIM for various amylase’s activities (5 - 25 U/ml).
Since no significant difference was observed between 15 and 25 units of amylase, in
following experiments of starch digestion 15 units per ml of food would be used.
5.3.2.3 Effect of concentration of substrate
In Figures 5.10 (a-d) the starch hydrolysis at various initial concentration of starch are
presented. Samples were digested at room temperature and pH 6.5, whereas pancreatic
solution containing 15 U/ml of α-amylase and 0.5 U/ml of amyloglucosidase was fed at 3.0
ml/min for all experiments. Results showed that the concentration of glucose at enzyme
saturation (Cinf) was influenced by the initial concentration of starch used, increasing as the
starch increased from 0.5% to 3.0% (w/v). As the concentration of available substrate
molecules increased, concentration of glucose released during amylolysis increased as well.

Chapter 5 - Starch digestion
167
Over the course of this set of experiments a maximum of 87% of the starch has been
converted into glucose (Table 5.7). The percentage of starch transformed can be estimated
readily for each initial concentration of starch as follows; whether the molecular weight of the
starch monomer (C6H10O5)x is 162 g/mol, the maximum concentration for total starch
digestion is therefore 19 mM, for 0.5% (w/v) of starch in 600 ml of digesta. Since the
maximum concentration achieved was ~16 mM (Figure 5.10), the percentage of starch
digested after 2 hours was approximately 87%.
Table 5.7 Percentage of starch digested after 120 minutes
Starch (%,w/v)
Maximum glucose Percentage of starch digested
(%) Theoretical
(mM) Experimental
(mM)
0.5 18.51 16.20 87
1.0 37.04 31.39 84
2.0 74.00 56.46 76
3.0 111.10 82.27 74
On average, 80% of starch digestion was reached under segmentation and in the range of
experimental conditions used in the SIM. The differences could be explained due to the
increasing viscosity of the sample or inhibition by products. As the concentration of starch
increased the viscosity of the solution also increased reducing further interactions between
enzymes and substrates. Time course curves in Figure 5.10 suggest that the rate of the
reaction was not affected significantly by the initial concentration of starch.

Chapter 5 - Starch digestion
168
Figure 5.10 Starch digestion in the lumen side of the SIM, varying the concentration of starch: (a) 0.5, (b) 1.0, (c) 2.0 and (d) 3.0% (w/v).
In Figure 5.11 the ratio C/Cinf versus time for all concentrations of starch used above was
plotted. Interestingly, the curves seem to be very similar regardless the concentration of
starch employed in the experiment of digestion. Nevertheless, as the concentration of starch
increased there was a delay in reaching equilibrium. For 0.5 – 2.0% (w/v) of starch the
maximum concentration at equilibrium was reached at about 30 minutes. However, for 3.0%
(w/v) the required time to reach equilibrium was double (60 minutes). This is thought to be
Time (min)
0 20 40 60 80 100 120 140
Glu
cose
con
cent
ratio
n (m
M)
0
10
20
30
Time (min)
0 20 40 60 80 100 120 140
Glu
cose
con
cent
ratio
n (m
M)
0
10
20
30
Time (min)
0 20 40 60 80 100 120 140
Glu
cose
con
cent
ratio
n (m
M)
0
20
40
60
80
Time (min)
0 20 40 60 80 100 120 140
Glu
cose
con
cent
ratio
n (m
M)
0
20
40
60
80
(a) (b)
(c) (d)

Chapter 5 - Starch digestion
169
due to the viscosity of the starch solution. Here, diffusion of the enzyme rather than
convection took place to reach the surface of the granules of starch.
Time (min)
0 20 40 60 80 100 120 140
C/C
inf
0.0
0.2
0.4
0.6
0.8
1.0
1.2
0.5% (w/v) starch1.0% (w/v) starch2.0% (w/v) starch3.0% (w/v) starch
Figure 5.11 Starch digestion in the lumen side of the SIM, varying the concentration of starch from 0.5 to 3.0% (w/v).
Results of glucose absorption in the recipient side of the SIM are presented in Figure 5.12. As
expected concentration of glucose increased proportionally as the concentration of starch
increased resulting in around 10% of the total concentration of sugars generated in the lumen
side of the SIM after 2 hours of digestion. In accordance with the results obtained for
digestion, at low concentrations of starch, glucose absorption trends were very similar
compared to those obtained at high concentration of starch with faster absorption rates (Table
5.8).

Chapter 5 - Starch digestion
170
Time (min)
0 20 40 60 80 100 120 140
Glu
cose
con
cent
ratio
n (m
M)
0
2
4
6
8
10
0.5% (w/v) 1.0% (w/v) 2.0% (w/v) 3.0% (w/v)
Figure 5.12 Glucose absorption in the recipient side of the SIM, varying the concentration of starch from 0.5 to 3.0% (w/v).
Based on data from Figure 5.12, mass transfer coefficients were estimated as described
previously. The data were analysed in the linear region of the curve, once the flow was fully
developed from 30 to 60 minutes. As the initial concentration of starch increased, glucose in
the recipient side and the rate of absorption increased as well. Nevertheless, no significant
differences were observed in the mass transfer coefficients for 1.0 – 3.0% (w/v) of starch.
Table 5.8 Rate of absorption and Overall Mass Transfer Coefficient at various starch concentrations.
Concentration Absorption (10-7 M/s)
OMTC
(10-7 m/s) Starch
(%, w/v) Glucose saturation
(mM)
0.5 16.20 3.16 ± 0.26 4.19 ± 0.56
1.0 31.39 5.19 ± 0.22 3.39 ± 0.21
2.0 56.46 10.08 ± 0.11 3.66 ± 0.19
3.0 82.27 13.49 ± 0.45 3.36 ± 0.64

Chapter 5 - Starch digestion
171
5.3.2.4 Effect of viscosity of the digesta
Samples containing 1.0% (w/v) of starch and different concentrations of guar gum (0.25-
0.75%, w/v) were digested in the lumen side at room temperature and pH 6.5. Pancreatic
solution containing 15U/ml of α-amylase was fed at 3.0 ml/min for all experiments. In Figure
5.13 the effect that the viscosity of the lumen contents had on the rate of glucose absorption is
shown. In this particular case, only glucose in the recipient side of the SIM was monitored,
because the viscosity in the lumen makes glucose measurement very inaccurate by the
colorimetric method employed here. For these experiments, the initial volume of the starch
solution in the lumen side was increased from 600 ml in previous experiments to 650 ml due
to the viscosity of the solution. The concentration of amylase was adjusted to keep the same
concentration of enzyme (15 Units per ml of food).
The rates of glucose absorption were significantly reduced as a result of increasing the
viscosity of the lumen contents by adding guar gum. When initial viscosity was increased
from 0.3 (0.5% w/v guar) to 7.0 Pa.s (0.75% w/v guar) glucose concentration was reduced up
to 45%. Moreover, compared with results in Figure 5.12 for 1.0% (w/v), glucose absorption
was delayed. Glucose could be monitored in the recipient side after 20 minute of starting
digestion (Figure 5.12), however, for viscous solutions glucose was measured after 30
minutes the reaction started (Figure 5.13). As viscosity of the digesta increased interactions
between substrates and enzymes were impaired, resulting in a reduction of glucose released
from starch structure.

Chapter 5 - Starch digestion
172
Time (min)
0 20 40 60 80 100 120 140
Glu
cose
con
cent
ratio
n (m
M)
0
1
2
3
4
Control (no guar)0.25% (w/v) guar0.50% (w/v) guar0.75% (w/v) guar
Figure 5.13 Glucose absorption in the recipient side of the SIM, varying the concentration of guar gum from 0.25 to 0.75% (w/v).
The rate of glucose absorption and mass transfer coefficients are shown in Table 5.9. Both
were reduced as the viscosity of digesta increased. Restrictions in mass transfer due to
variations of viscosity cause a reduction in the rates of diffusion of substrate and products
associated with digestion processes in the small intestine.
These results give insights about physical and chemical phenomena occurring in the small
intestine and also how rates of digestion and absorption are impacted, based on food
formulation and fluid properties of the chyme. Again, these trends are consistent with the in
vivo findings that viscous fibres reduced postprandial glucose levels (Jenkins et al., 1982).
A comparison between the OMTC obtained for starch-guar solutions and those calculated for
glucose-guar solutions in Chapter 4 (section 4.3.2.1) is presented in Table 5.9.

Chapter 5 - Starch digestion
173
Table 5.9 Rate of absorption and Overall Mass Transfer Coefficient at various concentrations of guar. Concentration in the lumen side at enzyme saturation was 31.35 mM.
Guar concentration
(%, w/v)
Absorption OMTC starch
(10-7 m/s)
*OMTC glucose
( 10-7 M/s) (10-7 m/s)
0.00 5.84 ± 0.12 3.82 ± 0.33 4.56 ± 0.02
0.25 5.42 ± 0.52 3.54 ± 0.16 4.66 ± 0.39
0.50 3.74 ± 0.17 2.73 ± 0.19 3.47 ± 0.05
0.75 3.26 ± 0.34 2.13 ± 0.04 3.43 ± 0.01
*Results taken from section 4.3.2.1 from glucose solutions added with guar gum at different concentrations.
As results show, increasing viscosity of the starch solution reduced mass transfer by up to
45%. However, when glucose-guar solutions were evaluated in Chapter 4, absorption was
only reduced 25%. The OMCT for glucose-guar solutions were higher than those obtained
after digestion of starch added with similar concentrations of guar gum. Compare to glucose
solutions in which glucose is already available, adding soluble fibres to starch had a
significant impact on glucose absorption. In starch solutions, glucose needs to be released
first from the complex matrix of starch to be able to cross the membrane then. However, the
enzyme has an additional physical barrier formed by guar.
These results suggest that adding viscous polymers to foods inhibit not only the absorption of
glucose from the intestinal lumen to the wall but also to diffusion of enzyme to reach starch
molecules.
Chapter 5 - Starch digestion
174
5.4 Michaelis – Menten kinetics
Michaelis-Menten equation was used to characterise the behaviour of reaction in which the
enzyme concentration is remarkably small compared to the substrate concentration (Dona et
al, 2010). The main principle of Michaelis – Menten reaction is as follow:
퐸 + 푆 ⇔ 퐸푆 → 퐸 + 푃
where E is the concentration of the enzyme, S refers to the substrate and P refers to the
product.
The Michaelis-Menten equation in the differential form can be used to describe the dynamics
of substrate depletion as
= − (5.3)
where S is the substrate concentration, and Vmax and Km are the maximal rate and Michaelis
half saturation constant, respectively. Equation 5.3 can be readily integrated to obtain the
integral form of the Michaelis-Menten equation
퐾 ln + 푆 − 푆 = 푉 푡 (5.4)
where So is the initial substrate concentration. Equation 5.4 is not linear and clearly implicit
with respect the substrate concentration.
Numerical approaches such as bisection and Newton-Raphson methods are necessary to
calculate S. In order to obtain the explicit form of Equation 5.4, Goudar et al. (2004)
rearrange to form:
푆 + 퐾 ln(푆) = 푆 + 퐾 ln(푆 )− 푉 푡 (5.5)
Substituting =S/Km in Equation 5.5 results in

Chapter 5 - Starch digestion
175
퐾 + 퐾 ln(퐾 ) = 푆 + 퐾 ln(푆 ) − 푉 푡 (5.6)
Dividing Equation 5.6 by Km and rearranging results in
+ ln() = + 푙푛 − (5.7)
The left hand side of Equation 5.7 is analogous to the Lambert W function (Corless et al.,
1996).
푊(푥) + 푙푛{푊(푥)} = ln(푥) (5.8)
where W is the Lambert W function and x the argument of W from equations and expression
for may be obtained as
= 푊 푒푥푝 (5.9)
푆 = 퐾 푊 푒푥푝 (5.10)
Linearization
( ⁄ )= ( )
( ⁄ )+ (5.11)
( )( ⁄ )
= 푉 − 푙푛(푆 푆⁄ ) (5.12)
( ⁄ )= ( ⁄ )
( )+ (5.13)
This approach involves the use of substrate depletion rather than initial velocity-substrate
concentration.
From Equations 5.11 to 5.13 it was possible to estimate the initial values of the kinetics
parameters Vmax and Km, from the progress curve analysis. These parameters were used to

Chapter 5 - Starch digestion
176
calculate the resulting in the curve of Figure 5.13. Fit was not very good by this method,
needing to look into more detail to compare with kinetic parameters reported in literature.
Figure 5.14 Simulated substrate depletion data (cross) along with the model predictions (solid line) for 1.0% (w/v) starch digestion in the STR at concentrations of enzyme constant.
5.5 Conclusions
This research has demonstrated the capability of using an in vitro rig to simulate and obtain
an engineering understanding of transport phenomena occurring in the small intestine leading
to absorption of active components.
By using the STR, starch digestion has a fast rate of reaction (44.8 µM/s). However, the
hydrolysis of starch in the SIM has a sigmoidal behavior with a rapid rate (24 µM/s) after the
first ten minutes of digestion and with a ‘lag phase’ at the beginning of the reaction due to the
0 10 20 30 40 50 60 70 800
0.5
1
1.5
2
2.5
3
3.5
4
Time (min)
Sta
rch
depl
etio
n (m
M)
experimentaltheoretical
Vmax = 0.59 mM/min
Km= 9.02 mM

Chapter 5 - Starch digestion
177
incomplete mixing of the starch and amylase at the early stage of the hydrolysis within the
first ten minutes.
The effect of the presence of guar showed a 36% reduction on the mass transfer coefficient
when mixing or segmentation was applied. Overall, the rate of enzymatic reactions was
reduced when guar (0.5%, w/v) was added to starch solutions and bread, delaying the access
of actives to the absorptive epithelium due to a decrease of both propulsion and mixing.
The rate of starch hydrolysis increased up to 90% as the concentration of enzyme increased
ten-fold in the lumen side, reaching its maximum value at 25.0 units and 3.0 ml/min while the
minimum was observed for the lowest concentration of enzyme at 2.5 units and 0.3 ml/min.
The velocity of the reaction increased proportionally as the activity of amylase increased. As
the concentration of starch increases the viscosity of the solution also increases. In this case,
for high concentrations of starch (3.0%, w/v), diffusion of the enzyme rather than convection
took place to reach the surface of the granules of starch.
Overall, the rate of glucose absorption and mass transfer coefficients were reduced as the
viscosity of digesta increased. Restrictions in mass transfer due to variations of viscosity
cause a reduction in the rates of diffusion of substrate and products associated with digestion
processes in the small intestine.
From the starch digestion experiments present in this Chapter it was possible to show the
effect that segmentation motion and food formulation had on nutrient delivery to the
intestinal wall as a consequence of changes in the mass transfer coefficient. On the other
hand, the rate of food digestion might be important in assessing the extension at which they
raise the blood glucose levels in normal and diabetic people.

178
CHAPTER 6 - MIXING PROCESSES IN THE SIM
6.1 Introduction
Food to be processed in the gastrointestinal tract requires an adequate degree of mixing.
Particularly, in the small intestine, mixing is a result of segmentation contractions that keep
solid food particles dispersed in the chyme and promote chemical reactions between
substrates and enzymes. Mixing is responsible for mass transfer enhancement and is crucial
for absorption. As established in Chapter 4, mixing or segmentation increased glucose
absorption up to 30%. Isolated longitudinal contractions enhance mass transfer processes in
the small intestine by providing radial mixing of the chyme (Schulze and Clark, 2008,
Macagno et al., 1982). Most studies of flow motion in the small intestine point out that
oscillatory flow promotes ‘turbulent mixing’, in which radial velocity components are
significant (Mackley and Stonestreet, 1995). Long stroke oscillations, for example, have
shown to improve heat and mass transfer as a result of fluid mixing (Howes et al., 1991).
In the gastrointestinal tract, various types of movements have been identified. Retrograde jets
and oscillatory flow vortices, for example, mix two separate fluid boluses enhancing mass
transfer in the lumen. As few experimental preparations exist to record the complex flow that
underlie digestion and absorption processes (Schulze and Clark, 2008) in the small intestine,
this Chapter describes visual flow patterns occurring as a result of mixing or segmentation
contractions in the SIM. Flow visualization techniques such as PLIF (Particle Laser-Induced
Fluorescence) and PEPT (Positron Emission Particle Tracking) were used to identify fluid
patterns and velocities profiles of Newtonian and non-Newtonian model fluids in the SIM.
Chapter 6. Mixing processes
179
6.2 Optical flow visualization techniques
6.2.1 Preliminary flow visualization experiments
To study flow patterns in the SIM as a function of segmentation contractions, a series of
preliminary experiments were carried out in water and CMC solutions (1.0%, w/v). In order
to visualize the motion of these fluids, a red food coloring was injected into the lumen side of
the SIM. The movements of the dye were recording for about 1 - 2 minutes by a high
definition dual camera (Sanyo, Xacti HD VPV-FH1). The camera was located in front of the
SIM, between the two segmentation cuffs area. For these experiments, the dialysis membrane
was substituted by a flexible transparent polyethylene tube with the same diameter and length
of the membrane used in previous experiments: 0.03 m. Representative frames were extracted
at selected times from each video to study the flow patterns of the dye. After filling the lumen
side with the test solution, either water (control) or CMC (1.0%, w/v), the red dye was fed at
a flow rate of 3.0 ml/min into the centre of the intestinal segment by means of a tubing
(0.003m of diameter) simulating the pancreatic duct as shown in Figure 6.1(a). The rig used
in this section to feed the dye was similar to that used in Chapter 5 (Figure 5.1) to feed the
enzyme solution into the lumen side of the SIM. The main purpose of these experiments was
to track the path that amylase (represented by the red dye) follows during digestion as a
function of both segmentation and food formulation. Fluid motion was studied at
experimental conditions listed in table 6.1.
Table 6.1 Experimental conditions for studying flow patterns of the dye in the SIM
Fluid Experiment I Experiment II Experiment III
Newtonian: Water
Steady state
Net flow induced by a peristaltic pump
Segmentation induced
by inflatable cuffs Non Newtonian:
CMC (1.0%, w/v)
Steady state
Net flow induced by
a peristaltic pump
Segmentation induced
by inflatable cuffs

Chapter 6. Mixing processes
180
Segmentation contractions were generated at a rate of ten cycles per minute (selected for
being physiological relevant in the small intestine (Guyton and Hall, 2006)) with the
following standard pattern: 2 seconds inflation, 2 seconds deflation and 2 seconds delay
between each cuff. As previously described in section 3.2, two cuffs located in the proximal
and distal ends of the intestinal segment (50 cm of length) were used to generate sequential
contractions along the SIM.
As shown in Figure 6.1 (a) when the dye was injected in the SIM in the absence of bulk flow
and segmentation (experiment I), the dye exhibits spontaneous diffusion through water.
When net flow of the fluid was generated by a peristaltic pump (3 rpm), the diffusion of the
dye into water was accelerated, displaying segregation and a characteristic parabolic flow
pattern in which the maximum velocity was observed, as expected, in the centre of the pipe
(radius equal to zero) (Figure 6.1b).
Overall, reverse flow in the SIM occurs both during the contraction and during the relaxation
of the segment and as a result, the lumen content is constantly refilling fluid from the
reservoir. Similarly, reverse flow and refilling of cleared segments are regularly observed in
the small intestine in situ (Schulze and Clark, 2008).
Figure 6.1 Diffusion of the dye through the SIM in water; (a) steady state and (b) propulsion by a peristaltic pump (volumetric flow of 1.2 x10⁻⁵ m3/s), after one minute of the dye injection.
(a) (b)
Dye injection point
Flow direction

Chapter 6. Mixing processes
181
As segmentation progresses, the dye is moving forward and backward within the fluid
promoting striation of the dye. Once the contraction stops (relaxation of the lumen) the dye
returns to the initial point of injection. During relaxation, convective mixing stops and
diffusion of the dye occurs until the next contraction. These periodical movements keep
mixing the dye throughout the fluid. The cycle of contractions distributes and disperses the
dye through the intestinal segment in which simultaneous reduction of intensity and scale of
segregation occurs over time.
In Newtonian fluids such as water, segmentation contractions generate strong intraluminal
flow, inducing retropropulsive and recirculating (oscillatory) flows that contribute to the
mixing processes in the small intestine. Whilst backflow helps to mix the dye over the long
axis of the SIM, flow vortices or eddies distribute the dye (enzyme and food particles) over
the radius of the SIM (Figure 6.2).
Figure 6.2 Mixing flow patterns of the dye in the SIM when segmentation occurs in water. The direction of the flow imposed by each contraction is represented by the block arrows.
Second contraction First contraction

Chapter 6. Mixing processes
182
Although both contribute to mass transfer phenomena, it is though that the latter contributes
the most by promoting radial mixing of the lumen contents. Retrograde and radial flows
promote mixing and absorption of active molecules in the small intestine by generating
turbulent mixing in the lumen, helping to distribute food particles over the surface of the
intestine and promoting enzyme-substrate interactions.
Segmentation contractions produced turbulent mixing, creating vortices along the radial axis
of the flexible tube. The occurrence of flow vortices was seen during experimentation and
that further evidence on this is provided later when PEPT results were presented in section
6.2.2. Vortices promote radial mixing reducing the mixing time required to obtain a
homogeneous solution along the length of the tube (axial and radial axis). These flow events
are essential during digestion and absorption processes increasing mass transfer in the gut.
For instance, when solid particles sediment in the small intestine due to their particle size,
contractions keep food particles of the chyme dispersed, helping to interact with intestinal
and pancreatic secretions improving mass transfer in the intestine. Similar flow events were
already studied in the duodenum and ileum of guinea pigs in the research conducted by
Schulze-Delrieu (2008).
For CMC solution (1.0%, w/v), minimal dye dispersion (Figure 6.3a) was observed as a result
of increasing the viscosity of the fluid. Although diffusion was increased when a peristaltic
pump was used (Figure 6.3b), the dispersion of the dye was not as fast as it was for water due
to the increasing viscosity.
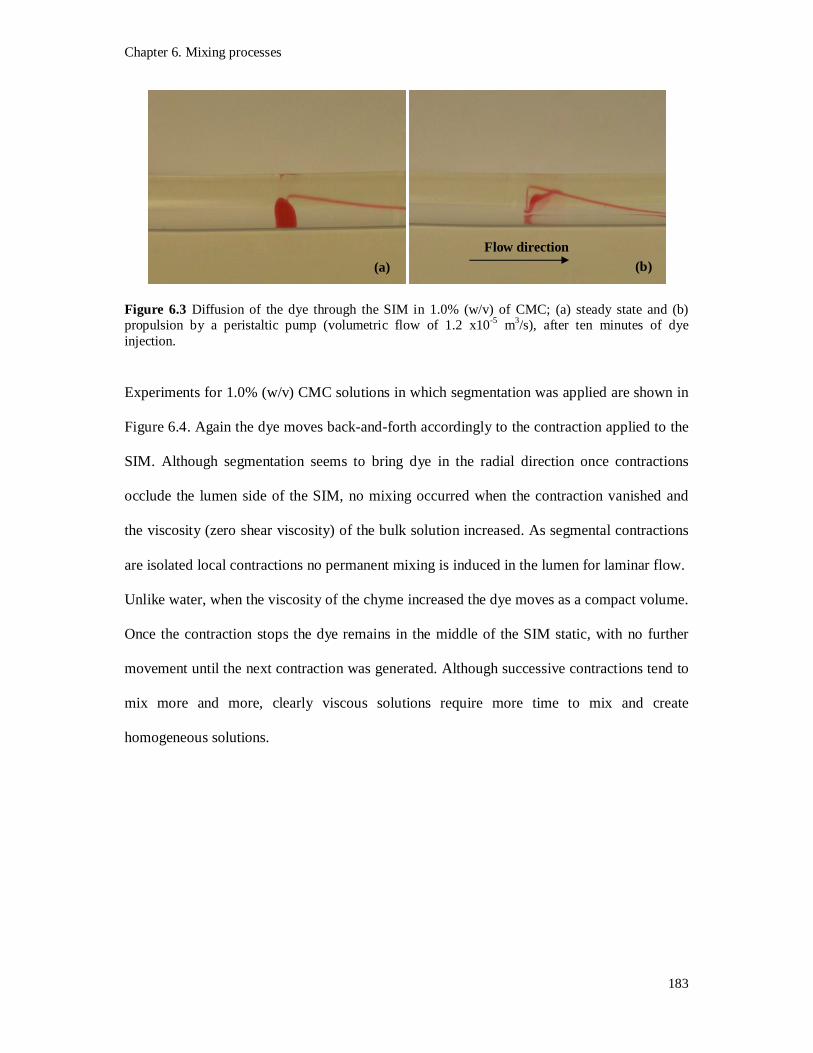
Chapter 6. Mixing processes
183
Figure 6.3 Diffusion of the dye through the SIM in 1.0% (w/v) of CMC; (a) steady state and (b) propulsion by a peristaltic pump (volumetric flow of 1.2 x10⁻⁵ m3/s), after ten minutes of dye injection.
Experiments for 1.0% (w/v) CMC solutions in which segmentation was applied are shown in
Figure 6.4. Again the dye moves back-and-forth accordingly to the contraction applied to the
SIM. Although segmentation seems to bring dye in the radial direction once contractions
occlude the lumen side of the SIM, no mixing occurred when the contraction vanished and
the viscosity (zero shear viscosity) of the bulk solution increased. As segmental contractions
are isolated local contractions no permanent mixing is induced in the lumen for laminar flow.
Unlike water, when the viscosity of the chyme increased the dye moves as a compact volume.
Once the contraction stops the dye remains in the middle of the SIM static, with no further
movement until the next contraction was generated. Although successive contractions tend to
mix more and more, clearly viscous solutions require more time to mix and create
homogeneous solutions.
(a) (b) Flow direction

Chapter 6. Mixing processes
184
Figure 6.4 Mixing flow patterns of the dye in the SIM when segmentation occurs in 1.0% (w/v) CMC. The direction of the flow imposed by each segmentation contraction is represented by the block arrows.
As segmentation progresses the intensity of mixing increases. After one minute, intensity and
scale of segregation was higher in CMC solutions than segregation in water as Figure 6.2
revealed. For water, for example, the distribution of the dye was homogenous after one
minute, on the contrary, when the viscosity of the solution increases mixing takes longer. In
Figure 6.5, a comparison of the distribution of the dye into water and CMC solutions (0.5 and
1.0%, w/v) after one minute was presented. Clearly the distribution of the dye was more
homogeneous in water than in CMC solutions. This is thought to be caused by a reduction of
convective mixing in viscous fluids. Viscous solutions resist the effect of gastro-intestinal
contractions, inhibiting both propulsion and mixing (Read and Welch, 1985).
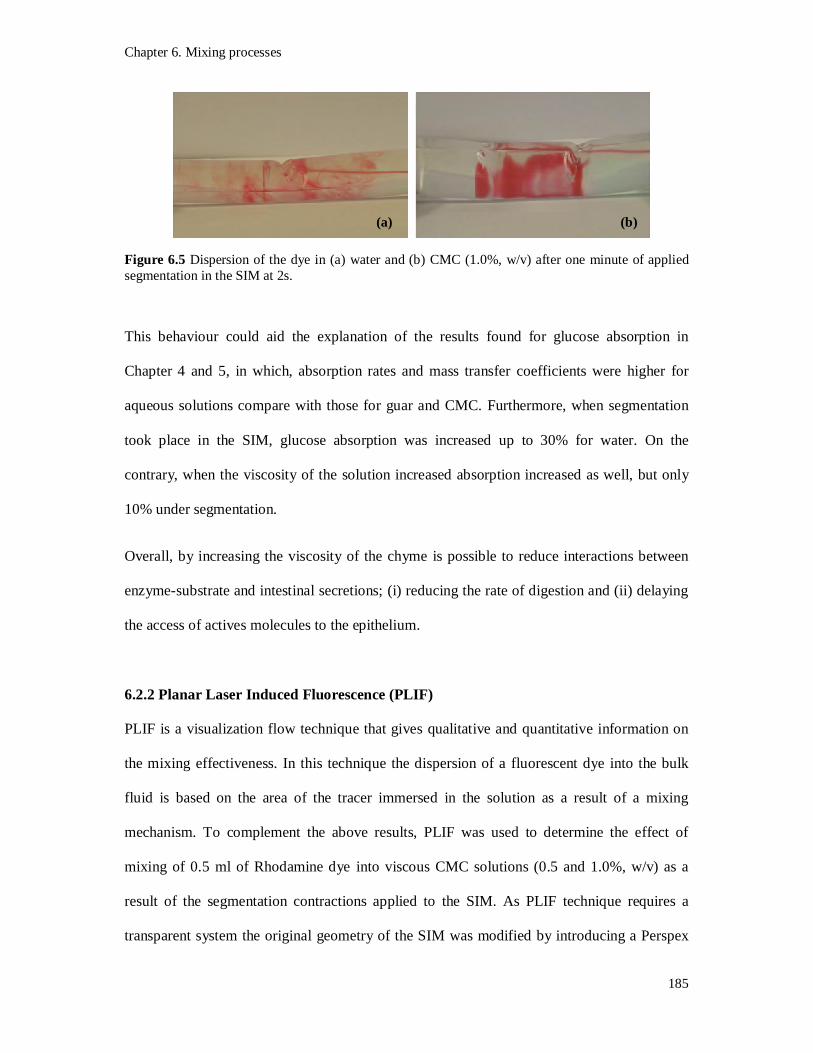
Chapter 6. Mixing processes
185
Figure 6.5 Dispersion of the dye in (a) water and (b) CMC (1.0%, w/v) after one minute of applied segmentation in the SIM at 2s.
This behaviour could aid the explanation of the results found for glucose absorption in
Chapter 4 and 5, in which, absorption rates and mass transfer coefficients were higher for
aqueous solutions compare with those for guar and CMC. Furthermore, when segmentation
took place in the SIM, glucose absorption was increased up to 30% for water. On the
contrary, when the viscosity of the solution increased absorption increased as well, but only
10% under segmentation.
Overall, by increasing the viscosity of the chyme is possible to reduce interactions between
enzyme-substrate and intestinal secretions; (i) reducing the rate of digestion and (ii) delaying
the access of actives molecules to the epithelium.
6.2.2 Planar Laser Induced Fluorescence (PLIF)
PLIF is a visualization flow technique that gives qualitative and quantitative information on
the mixing effectiveness. In this technique the dispersion of a fluorescent dye into the bulk
fluid is based on the area of the tracer immersed in the solution as a result of a mixing
mechanism. To complement the above results, PLIF was used to determine the effect of
mixing of 0.5 ml of Rhodamine dye into viscous CMC solutions (0.5 and 1.0%, w/v) as a
result of the segmentation contractions applied to the SIM. As PLIF technique requires a
transparent system the original geometry of the SIM was modified by introducing a Perspex
(b) (a)

Chapter 6. Mixing processes
186
flow visualization cell of 20 cm long and 5 cm both deep and wide (section 3.5). Experiments
were carried out as before using the characteristic two cuffs set up with 2s inflation, 2s
deflation and 2s delay times. The air pressure used for the inflation was 0.5 barg. The net
flow rate was set at approximately 1.0 cm per minute, as established by Guyton and Hall
(2006) for the small intestine. This was achieved using a peristaltic pump to give a volumetric
flow of 1.2 x 10⁻⁵ m3/min (velocity of 1.6 cm/min), which was the minimum flow rate of the
pump. For these experiments, the injection of the fluorescence dye was done manually by
means of a 1.0 ml syringe and needle. The needle was previously fixed into the visualization
cell to inject the Rhodamine at the centre of the Perspex tube to avoid diffusion of the dye
before segmentation contractions start. Since produced clear solutions, CMC was selected in
PLIF flow visualization experiments. Experiments were done in water and CMC solutions
(0.5 and 1.0%, w/v) at two different mixing frequencies (one and two seconds). The images
taken were in the form of a digital picture (as seen in Figure 6.11 (a) and all the images for
each experiment were taken from time zero (when full injection of the dye had taken place)
until approximately 60 seconds, at an image acquisition rate of 2 Hz. This provided 80
images that were analysed for each experiment using MATLAB.
Figure 6.6 presents a typical sequence of images that were recorded for a 0.5% (w/v) CMC
solution after the first contraction was fully developed. The clear circular area in each image
represents the Rhodamine dye injected into the SIM. The purpose of these experiments was
to model the movement of a discrete bolus (represented by the dye) in the centre of the lumen
as a function of both mixing and viscosity of the fluid. As contraction develops the dye
moves within the fluid from the centre of the pipe to the distal part of the segment (Figure
6.6). As the first contraction vanishes the lumen segment relaxes and the dye returns at the
initial position of injection (back and forth movement).
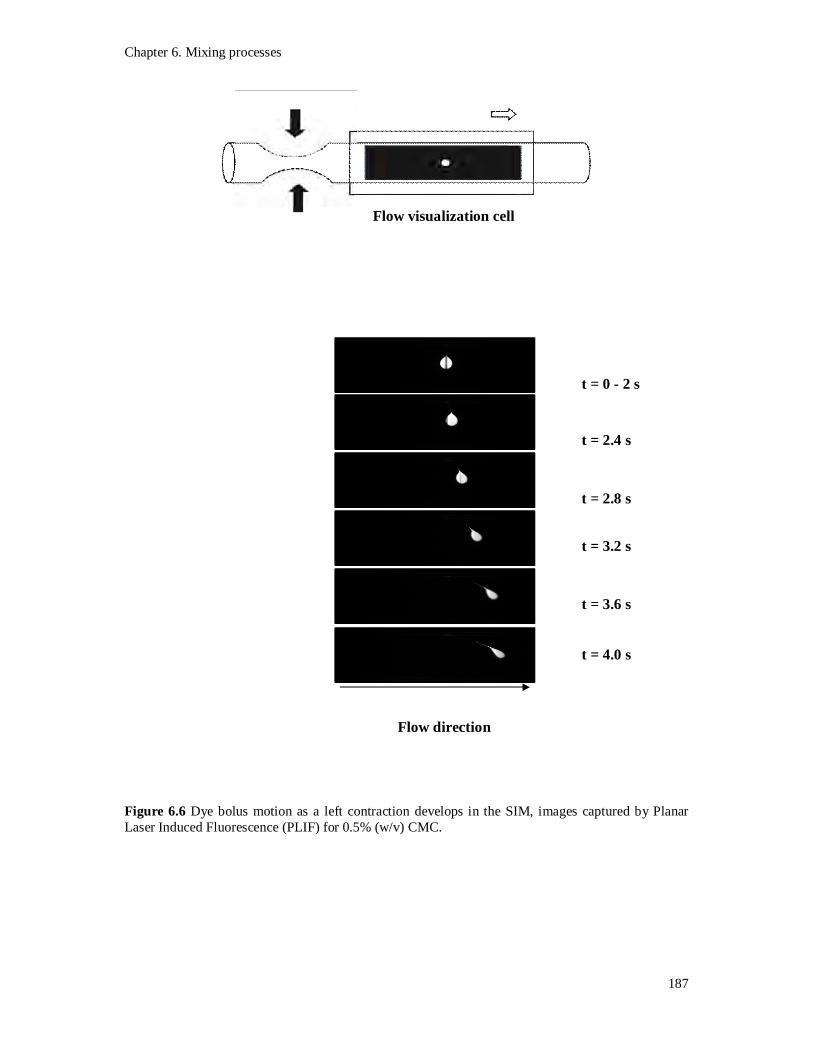
Chapter 6. Mixing processes
187
Figure 6.6 Dye bolus motion as a left contraction develops in the SIM, images captured by Planar Laser Induced Fluorescence (PLIF) for 0.5% (w/v) CMC.
t = 0 - 2 s
t = 2.4 s
t = 2.8 s
t = 3.2 s
t = 3.6 s
t = 4.0 s
Flow direction
Flow visualization cell

Chapter 6. Mixing processes
188
When the cuff in the left occluded the flexible wall of the SIM, fluid moves faster through the
length of the SIM and as a consequence the dye starts to mix due to motion. As the cuff
deflates the dye returns slowly to the original location in the centre of the pipe. After
approximately 4 seconds, the second cuff in the right starts to inflate and the particle moves
back along with the volume of fluid displaced. These periodic contractions help not only to
mix the chyme along the SIM but also to increase the residence time of the food, maximizing
Figure 6.7 displays three representative images of the dye movement in 0.5% (w/v) CMC
after the first set of segmentation contractions take place. The tiny bolus simulated by the
clear circle (2D) in the middle of the picture moves according to the left or the right
segmentation contraction. Images show the characteristic retropulsive or pendular movements
found in the small intestine by segmentation contractions (Macagno and Chistensen (1982).
Once segmentation started, the bolus moves accordingly back and forward. The displacement
of the dye is a function of the resistance of the fluid to movement (viscosity). In the control
solution (water) the dye was quickly dispersed with a reduction of the area of the initial
sphere shape (data are not shown). As segmentation continues it was possible to identify
three characteristics zones:
i. Frames in the left. Maximum displacement after first contraction occurs from the
centre to the right, in the same direction as contraction occurs (Figure 6.7 (c) and (f)).
ii. Frames in the middle. Relaxation of the lumen no segmentation was applied to the
SIM (Figure 6.7 (b) and (e)).
iii. Frames in the right. Maximum displacement after second contraction occurs from the
centre to the left, opposite direction of the contraction (Figure 6.7 (a) and (d)).

Chapter 6. Mixing processes
189
Figure 6.7 (a) and (b) shows that the displacement of the dye is higher when the duration of
the contraction increases from 1 to 2 seconds. Whilst the dye moves from 0.5 to 0.6 along the
length of pipe when contractions last only one second, the displacement increases from 0.5 to
0.7 when the contraction last 2 seconds. As frequency increases the volume displaced by the
cuff increases and the contraction is shallow. This is in accordance with the results found in
section 4.3.3 in which mass transfer coefficient were higher when the mixing frequency was
increased from 1 to 2 seconds in CMC solutions.
At time zero the dye was injected, after 2 seconds of delay the contraction in the left develops
and after 4s the dye reaches the maximum displacement in 0.7 (Figure 6.7 c,d). As the
contractions vanishes (6s) the dye returns to the centre of the pipe and remains in the centre
during 4 more seconds (t = 10s) in this position until the next contraction (right cuff)
develops t =10 s and it is hold for 2s (t =12 s) 0.2 more and the cycle starts again.
Figure 6.7 Dye bolus motion for a set of segmentation contractions for 0.5% (w/v) CMC solution; contractions generated every one (a-c) or two seconds (d-f).
0.0
1.5
3.0
0.0 0.2 0.4 0.6 0.8 1.0 0.0 0.2 0.4 0.6 0.8 1.00.0 0.2 0.4 0.6 0.8 1.0
0.0 0.2 0.4 0.6 0.8 1.00.0 0.2 0.4 0.6 0.8 1.00.0
1.5
3.0
0.0 0.2 0.4 0.6 0.8 1.0
t = 4s t = 6 - 8s t = 10s
x/L
x/L
Diameter, cm
Diameter, cm (a) (b) (c)
(d) (e) (f)

Chapter 6. Mixing processes
190
Images also defined how the contraction stretched the gray bolus within the surrounding
black fluid, separated the bolus into portions, and replaced the original small interface
between bolus and fluid with multiple large interfaces of layers.
For CMC 1.0% (w/v), however, deformation of the dye was not as significant as it was for
0.5% (w/v) CMC solutions. Again when the mixing frequency increased the displacement
was increased (Figure 6.8). Overall the first cuff was not as effective in mixing as the second
cuff by the action of the peristaltic pump which limited the back flow. As it can be seen in
Figure 6.8c, the segmentation contraction in the left produced a major displacement, than the
contraction in the right because in this particular case, the flow motion comes in the same
direction of the flow. Thus, when the right cuff is inflated, the movement of the dye bolus
from right to left but with a minor displacement, because in this case the movement is against
the net flow as previously said. As such both propulsion and mixing contribute to the bulk
flow bringing particles of food and enzymes together and creating a better distribution of the
dye in the fluid.
Figure 6.8 Dye bolus motion for a set of segmentation contractions for 1.0% (w/v) CMC solution; contractions generated every one (a-c) or two seconds (d-f).
0.0
1.5
3.0
0.0 0.2 0.4 0.6 0.8 1.0 0.0 0.2 0.4 0.6 0.8 1.00.0 0.2 0.4 0.6 0.8 1.0
0.0 0.2 0.4 0.6 0.8 1.00.0 0.2 0.4 0.6 0.8 1.00.0
1.5
3.0
0.0 0.2 0.4 0.6 0.8 1.0
(a) (b) (c)
(d) (e) (f) x/L
x/L
Diameter, cm
Diameter, cm
t = 10s t = 6 - 8s t = 4s

Chapter 6. Mixing processes
191
From these images it is evident that the viscosity of the fluid and the frequency of
contractions affect the effectiveness of mixing and as a consequence mass transfer
phenomena in the small intestine.
6.3 Positron Emission Particle Tracking (PEPT)
The PEPT technique is a powerful non-intrusive 2D and 3D flow visualisation tool that
allows tracking a labelled tracer particle in opaque multiphase systems that cannot be studied
by optical methods. With PEPT, the tracer is located by means of a dual positron camera and
an algorithm for computing the tracer location (Barigou, 2004, Fangary et al., 2000, Parker et
al., 2002).
PEPT is a variation of the Positron Emission Tomography (PET) used in medical studies to
evaluate physiological functions of the body by introducing a positron emitting radioactive
tracer (Barigou, 2004). PEPT has been used successfully to study mixing patterns in powders,
semi-solids and liquids (Bakalis et al., 2004). This technique is particularly useful for the
study of multiphase flows, to map the flow of fluids and particles (Barigou, 2004).
To monitor the flow through the small intestine a single label tracer (600 m) was injected
into the SIM as shown in Figure 6.9. These experiments were carried out in the opened SIM
configuration in which fluid was re-circulated by a peristaltic pump at 1.2 x 10⁻⁵ m3/s (see
section 3.5.2). As in section 6.2, the dialysis membrane of the system was substituted with a
polyethylene flexible tube of 0.03 m of diameter and 0.40 m of length.
Although the equipment and the camera were aligned the axis of the camera does not
necessarily coincide with the coordinate system of the SIM.

Chapter 6. Mixing processes
192
Figure 6.9 Schematic of the experimental set up used for PEPT.
Three different conditions were studied, the effect of: viscosity of the biopolymer (guar gum
0.5 and 1.0%, w/v), frequency of segmentation (1s and 2s) and the net flow rate (0 and 3
rpm). Experiments were done at room temperature and 0.5 barg inlet air pressure for each
cuff. Table 6.2 summarizes the experimental conditions used for PEPT. During experiments
the activity of the tracer was monitored to ensure proper detection. In this case, no control
solution was used because the activity of the tracer decays in aqueous solutions.
Table 6.2 Experimental conditions used for PEPT
Assay Guar gum concentration
(%, w/v)
Net flow
(ml/min)
Segmentation
contractions
1 0.5 No net flow 2s
2 0.5 12.0 2s
3 0.5 12.0 1s
4 1.0 No net flow 2s
5 1.0 12.0 2s
6 1.0 12.0 1s
zz
z
x
y
Tracer injection
Lumen segment
PEPT camera
CUFF 1 CUFF 2
PEPT camera
(0,0,0)

Chapter 6. Mixing processes
193
The experimental flow conditions are explained below:
No net flow induced by peristaltic pump and local flow from segmentation
contractions by cuffs ‘1’ and ‘2’ alternatively with a two second inflation time, two
second deflation time and two second delay.
Net flow induced by a peristaltic pump and local flow from segmentation contractions
by cuffs ‘1’ and ‘2’ alternatively with a two second inflation time, two second
deflation time, two second delay, generating 10 contractions per minute (0.166 s-1).
Net flow induced by a peristaltic pump and local flow from segmentation contractions
by cuffs ‘1’ and ‘2’ alternatively with one second inflation time, one second deflation
time, one second delay, generating 20 contractions per minute (0.333 s-1).
Both set of contractions, 10 and 20 contractions/minute, were chosen in a physiological
context in which contractions occurring in the duodenum are simulated in (i) normal subjects
(10/min) according to those reported by (Guyton and Hall, 2006) and (ii) when
gastrointestinal disorders such as gastroenteritis or intestinal obstruction affect the bowel
motility, producing weak contractions and increasing in some cases the contractions observed
in the duodenum up to 20/min.
PEPT produces a set of particle trajectories showing how tracer moved thought the SIM as a
consequence of the segmentation contractions. PEPT data include locations of the particle in
‘x’, ‘y’ and ‘z’ coordinates as a function of time. In the SIM the axial (vx) and radial velocity
(vy) components are of importance on mixing of the lumen content. The velocity in the SIM is
a contribution of both segmentation (local velocity) and the net flow displacement produced
by the peristaltic pump (net flow velocity) (Equation 6.1).

Chapter 6. Mixing processes
194
푣 = 푣 + 푣 (6.1)
where vosc is the oscillatory velocity induced by the segmentation contractions in the SIM and
vave is the average velocity due to segmentation and peristalsis (net flow velocity).
The velocity component along the axis of the SIM (vx) is related to the particle path by
Equation (6.2)
푣 = ∆∆
= (6.2)
where x is the axial coordinate and t is time.
Using regression analysis a line was fitted to a number of the ‘x’ locations of the particle
versus time. The slope of the line was the axial velocity component of the particle.
Figures 6.10 (a) and (b) show a characteristic retropulsive flow pattern in the ‘x’ direction of
the tracer for guar solutions (0.5%, w/v), as a result of the segmentation contractions
generated by the second cuff of the SIM (see Figure 6.9). In Figure 6.10 (a), no net flow was
induced by the peristaltic pump, i.e. the motion of the particle was induced only by
segmentation. Since the particle was located in the last cuff of the system, the effect of the
first cuff was not observed in this experiment (flat part of the graph). Figure 6.10 (a) shows
that the tracer remains essentially in the same cross channel position. On the other hand,
when the net flow of the fluid was induced by the peristaltic pump (Figure 6.10b) the particle
moved little faster along the ‘x’ axis. In both cases the back-and forth movement of the
particle was clearly observed due to the contraction produced by distal cuff of the SIM.
Particle moves within an average velocity in the x-axis at 2.0 cm per minute due to the
contribution of both the net and the local flows induced by the peristaltic pump and the
segmentation contractions, respectively. This value is in accordance with those reported by
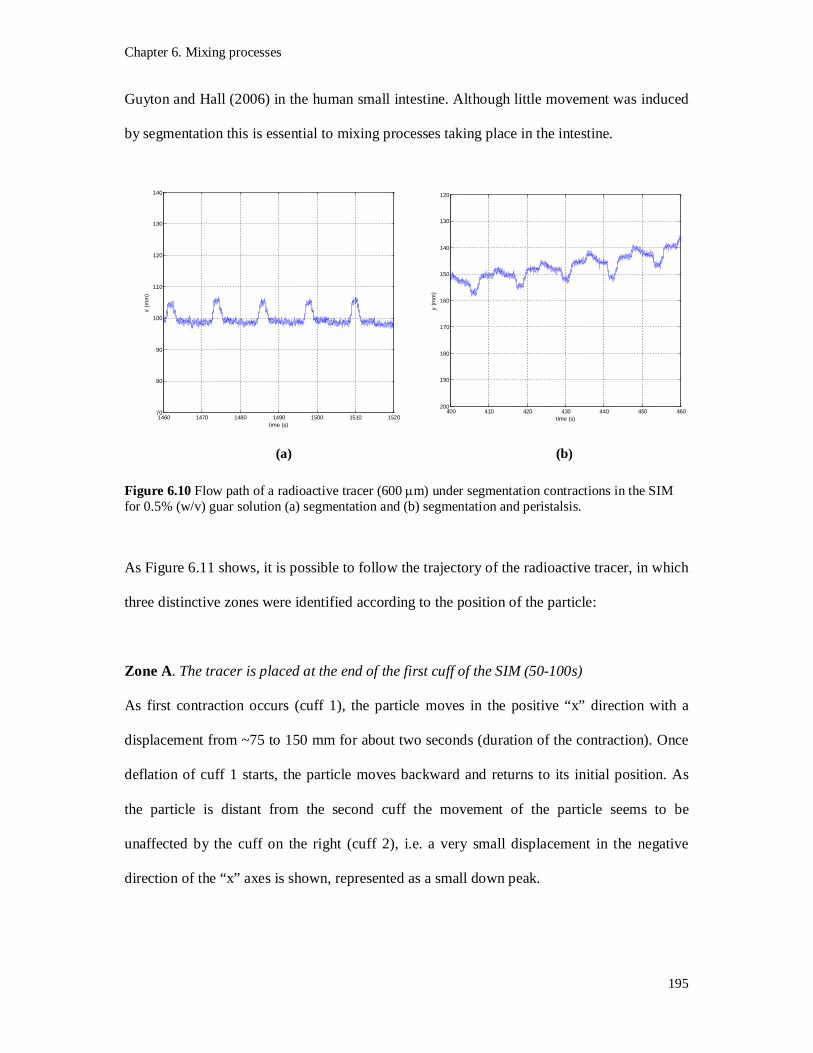
Chapter 6. Mixing processes
195
1460 1470 1480 1490 1500 1510 152070
80
90
100
110
120
130
140
time (s)
x (m
m)
400 410 420 430 440 450 460
120
130
140
150
160
170
180
190
200
time (s)
y (m
m)
Guyton and Hall (2006) in the human small intestine. Although little movement was induced
by segmentation this is essential to mixing processes taking place in the intestine.
Figure 6.10 Flow path of a radioactive tracer (600 m) under segmentation contractions in the SIM for 0.5% (w/v) guar solution (a) segmentation and (b) segmentation and peristalsis.
As Figure 6.11 shows, it is possible to follow the trajectory of the radioactive tracer, in which
three distinctive zones were identified according to the position of the particle:
Zone A. The tracer is placed at the end of the first cuff of the SIM (50-100s)
As first contraction occurs (cuff 1), the particle moves in the positive “x” direction with a
displacement from ~75 to 150 mm for about two seconds (duration of the contraction). Once
deflation of cuff 1 starts, the particle moves backward and returns to its initial position. As
the particle is distant from the second cuff the movement of the particle seems to be
unaffected by the cuff on the right (cuff 2), i.e. a very small displacement in the negative
direction of the “x” axes is shown, represented as a small down peak.
(a) (b)
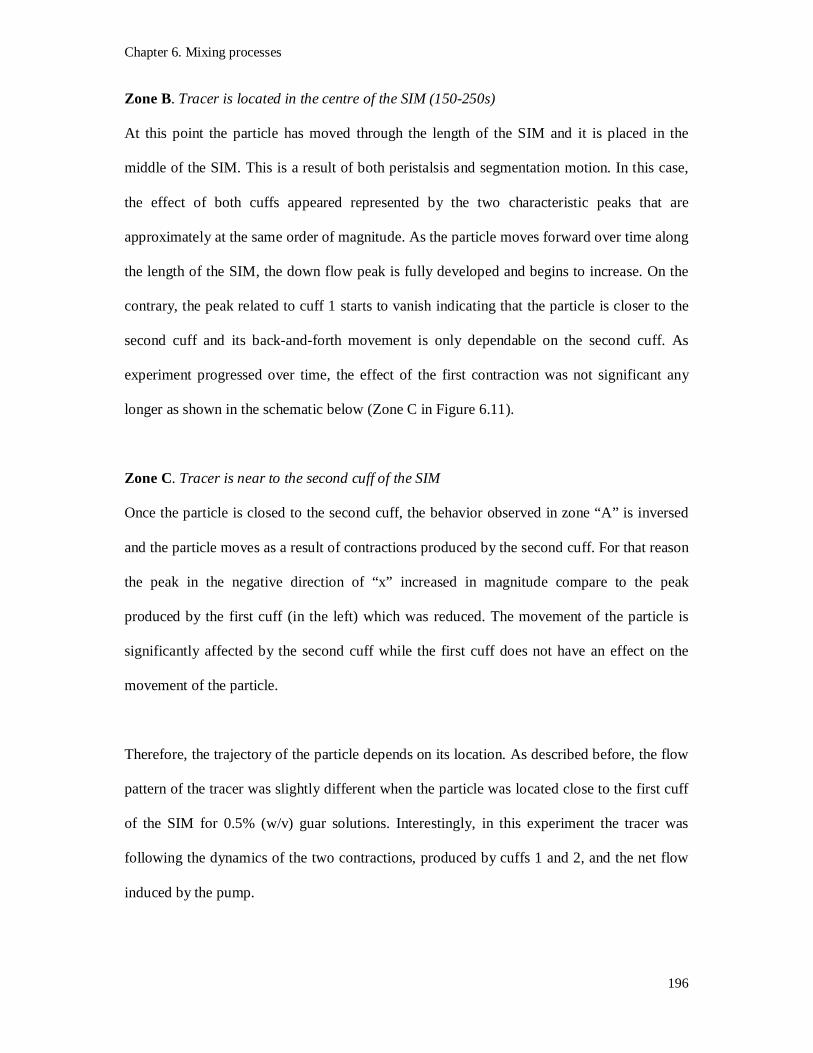
Chapter 6. Mixing processes
196
Zone B. Tracer is located in the centre of the SIM (150-250s)
At this point the particle has moved through the length of the SIM and it is placed in the
middle of the SIM. This is a result of both peristalsis and segmentation motion. In this case,
the effect of both cuffs appeared represented by the two characteristic peaks that are
approximately at the same order of magnitude. As the particle moves forward over time along
the length of the SIM, the down flow peak is fully developed and begins to increase. On the
contrary, the peak related to cuff 1 starts to vanish indicating that the particle is closer to the
second cuff and its back-and-forth movement is only dependable on the second cuff. As
experiment progressed over time, the effect of the first contraction was not significant any
longer as shown in the schematic below (Zone C in Figure 6.11).
Zone C. Tracer is near to the second cuff of the SIM
Once the particle is closed to the second cuff, the behavior observed in zone “A” is inversed
and the particle moves as a result of contractions produced by the second cuff. For that reason
the peak in the negative direction of “x” increased in magnitude compare to the peak
produced by the first cuff (in the left) which was reduced. The movement of the particle is
significantly affected by the second cuff while the first cuff does not have an effect on the
movement of the particle.
Therefore, the trajectory of the particle depends on its location. As described before, the flow
pattern of the tracer was slightly different when the particle was located close to the first cuff
of the SIM for 0.5% (w/v) guar solutions. Interestingly, in this experiment the tracer was
following the dynamics of the two contractions, produced by cuffs 1 and 2, and the net flow
induced by the pump.

Chapter 6. Mixing processes
197
Figure 6.11 Flow path of the tracer over time under segmentation contractions generated every 2 seconds in the SIM for 0.5% (w/v) guar solution. Schematic ‘A-C’ represents the relative position of the particle as a function of both cuffs.
The tracer patterns show that the strongest fluid motions are produced under segmentation
with velocities of oscillation up to 0.05 m/s (Figure 6.11). This experimental measured
velocity is in agreement with the theoretical value (0.06 m/s), estimated in Chapter 4.
The motion of the fluid induced by segmentation contraction waves generates recirculating
vortices or eddies that promotes turbulence, mixing the lumen content. To show clearly the
50 100 150 200 250 300 350 40050
100
150
200
250
300
350
400
time (s)
x (m
m)
A B C
A
B
C
First contraction Second contraction

Chapter 6. Mixing processes
198
recirculating flow pattern due to a segmentation contraction, a 3D plot was built for time, x-
axis and y-axis data from isolated contractions in Figure 6.12. The x-axis and y-axis represent
the axial and the radial position of the tracer, respectively, whereas the time (in seconds) is
represented by the color bar aside in Figure 6.12.
Figure 6.12 Characteristic eddy identified in the SIM as a result of a segmentation contraction in guar gum (0.5%, w/v).
As shown in Figure 6.12, oscillatory flow induced by segmentation, is an efficient way to mix
the lumen contents along the radial y-axis of the SIM, transporting particles laterally towards
the intestinal wall. As the contraction develops (A-B) from 92 to 94 seconds (2s duration),
the fluid moves rapidly along the y-axis ~ 1.0 cm of the diameter of the tube from position A
to B, once the contraction vanishes, the particle returns to its initial position (B-C).
80 100 120 140 160 180 200 220346
348
350
352
354
356
358
360
x (mm)
y (m
m)
92
93
94
95
96
97
A
B
C
time (s)

Chapter 6. Mixing processes
199
Phenomena observed during experimentation suggest that segmentation movements are
responsible for oscillatory flow that brings dissolved food material from the centre of the
small intestine to the wall (A-B).Thus, segmentation affect the rates at which digestion and
absorption take place in the intestine, it was also demonstrated that mass transfer processes
are enhanced by segmentation motion.
As Figure 6.13 shown, four consecutive peaks were extracted from Figure 6.11 to identify
formation of vortices or eddies generated by oscillatory flow in the SIM when segmentation
was applied.
Figure 6.13 Flow path induced under segmentation in guar gum solutions (0.5%, w/v).
Results are displayed in Figures 6.14 and 6.15 for each peak at (a) 56, (b) 67, (c) 80 and 92
seconds. In Figure 6.16 all of these recirculating eddies are shown together (identified by
colour).
50 55 60 65 70 75 80 85 90 95 10040
60
80
100
120
140
160
180
200
220
time (s)
x (m
m)

Chapter 6. Mixing processes
200
Figure 6.14 Characteristic eddies identify in guar gum solutions generated as a result of the segmentation contractions (a) 56-60 seconds and (b) 67-71 seconds.
60 80 100 120 140 160 180350
352
354
356
358
360
362
x (mm)
y (m
m)
56.0
56.5
57.0
57.5
58.0
58.5
59.0
60 80 100 120 140 160 180 200348
350
352
354
356
358
360
362
364
x (mm)
y (m
m)
67
68
69
70
71
(b)
time (s)
time (s)
(a)
Chapter 6. Mixing processes
201
Figure 6.15 Characteristic eddies identify in guar gum solutions generated as a result of the segmentation contractions (a) 80-84 seconds and (b) 56-84 seconds.
80 100 120 140 160 180 200 220348
350
352
354
356
358
360
x (mm)
y (m
m)
80
81
82
83
84
85
80
81
82
83
84
80 100 120 140 160 180 200 220346
348
350
352
354
356
358
360
x (mm)
y (m
m)
92
93
94
95
96
97
(a)
time (s)
time (s)
(b)

Chapter 6. Mixing processes
202
Figure 6.16 Characteristic eddies identify in guar gum solutions (0.5%, w/v) generated as a result of segmentation contractions (a) 80-84 seconds and (b) 56-84 seconds.
Segmental flow produced vortex formation cycles (oscillation) (Figures 6.14-16) which
enhanced mixing and dispersion of chyme in the SIM. As a result, mass transfer processes are
enhanced in low-viscosity fluids. This could explain why the OMTC obtained in Chapter 4
are 30% higher in viscosity like water fluids in which oscillation flow is induced by
segmentation.
On the other hand, when the viscosity of the solution increases by adding 1.0% (w/v) of guar
gum, a similar back-and-forth pattern was observed. However, the velocity of the tracer due
to segmentation was reduced by increasing the viscosity of the chyme. Figure 6.17 shows a
characteristic flow pattern over time in the axial direction of the SIM. From Figure 6.17(b), it
was possible to identify 10 sequential movements every minute. Peaks in the same ‘x’
60 80 100 120 140 160 180 200 220348
350
352
354
356
358
360
362
x (mm)
y (m
m)
60
65
70
75
80
85
time (s)

Chapter 6. Mixing processes
203
direction are a result of the left contraction (cuff 1) while small peaks in the opposite
direction of the x-axis, are produced by the right contraction of the SIM.
Figure 6.17 Flow pattern of a radioactive tracer (600 µm) under segmentation contractions in the SIM for 1.0% (w/v) guar solution (a) 500-1000 seconds and (b) 60 seconds.
Assuming that the tracer is isokinetic with the fluid (density-matching must be tested for
further experiments) the tracer patterns show that the strongest fluid motions are closed to the
segmentation cuffs and two basic flow patterns are produced by the retropulsive back and
500 550 600 650 700 750 800 850 900 950 1000140
160
180
200
220
240
260
280
300
320
time (s)
x (m
m)
500 510 520 530 540 550 560220
225
230
235
240
245
250
255
time (s)
x (m
m)
12 s
12 s
CUFF 1
CUFF 2
(a)
(b)

Chapter 6. Mixing processes
204
forth movements with the highest velocity up to 0.008 m/s. As previously found in PLIF
experiments, contractions produced by the first cuff were more effective in terms of fluid
motion than that produced by the second cuff. This could be explained by the restriction that
the peristaltic pump imposed to the fluid movement.
Table 6.3 summarizes the mean flow velocities estimated from the experimental data
obtained with PEPT.
Table 6.3 Flow velocities along the x-axis estimated in the SIM by PEPT
Guar gum
(%, w/v)
Net flow Local flow Velocity (osc)
m/s
Velocity (ave)
(10-4) m/s
0.5 No net flow 2s 0.003 7.00
0.5 3 rpm 2s 0.050 9.10
0.5 3 rpm 1s 0.005 5.50
1.0 No net flow 2s
1.0 3rpm 2s 0.007 2.70
1.0 3rpm 1s
Segmentation motion produces rhythmical contractions and relaxation of the intestine that
mixing the lumen content. Flow profiles indicated that these concentric contractions produced
micromixing of the digesta and as a consequence, mass transfer could be enhanced. In
turbulent flow with Reynolds numbers > 2100, particles of digesta flow rapidly changing
from one position to the other developed oscillatory movements or eddies showed in Figure
6.16. These eddies bring dissolved material to the intestinal wall increasing mass transfer
processes. As eddies move rapidly, mass transfer in fluids with turbulent behavior is also
rapid, much more so than that resulting from molecular diffusion in the unstirred laminar
sublayer of the small intestine. Nevertheless, when viscous polymers are added to the food,
mixing is impaired, retarding also absorption of actives.

Chapter 6. Mixing processes
205
Although the SIM has proved that is able to reproduce the characteristic movements found in
the small intestine, some considerations must be taken into account. There are limitations
when blood pressure cuff in the SIM are used to reproduce segmentation. For example, the
amplitude, pressure and frequency of contractions could vary compare to the real gut,
resulting in different patterns of fluid motion dynamics.
On the other hand, the open-SIM was used through this chapter to be a more effective way of
mixing because net and local flow are simulated in this configuration. On the contrary, the
closed-SIM only allows local flow caused by segmental contractions. As both ends are
closed, pendular movements cannot be simulated in the closed configuration, reducing
mixing. Moreover, there is not net flow induced by the peristaltic pump due to both ends of
the system are closed. This could impact on velocities and flow dynamics. Thus, regardless
re-circulation, the open-SIM could be a closer representation of the real small intestine, in
which longitudinal and radial mixing take placed due to retropulsion and recirculation flow
patterns.
6.4 Conclusions
Flow patterns studied in this Chapter lead to the conclusion that segmentation produces little
net flow of the fluid but it is a powerful medium of mixing in the small intestine bringing
food particles to the radial axis of the lumen. Retropropulsive and oscillatory flows of the
lumen content were generated during segmentation in the SIM. Flow vortices and eddies
were identified as responsible for mass transfer enhancement.
Flow visualization techniques such as PLIF and PEPT shown to be useful techniques to
describe flow fluid patterns in the small intestine as a result of mixing or segmentation
Chapter 6. Mixing processes
206
contractions. Turbulent mixing was generated in solutions with low viscosity under
segmentation. Nonetheless, mixing was impaired as the viscosity of the fluid increases.
The SIM is a realistic model that is able to predict digestion and absorption of foods in a
physiological manner since it can reproduce in an accurate form the segmentation movements
found in the small intestine. The SIM simulates the characteristic movement found in the
small intestine with representative physiological features, volumes and flow rates. Although
it has limitations, the SIM promises to be a powerful tool all in further studies of digestion
and absorption.

207
CHAPTER 7 – ENCAPSULATION OF ACTIVES
7.1 Introduction
To impact on the delivery rate of active ingredients, structured and functional foods can be
developed in a variety of ways. For example, as shown in previous chapters, by adding
soluble fibres such as guar, pectin and CMC to model liquid foods, rates of digestion and
absorption were significantly reduced. Although controversial, it is generally recognized
today that dietary fibre plays a crucial role on postprandial glucose and insulin responses in
vivo. By changing the bulk viscosity of the intestinal fluid, the biopolymers will interact with
each other because of entanglements creating a physical barrier for actives (e.g. glucose)
crossing from the bulk to the intestinal wall.
Nonetheless, another area of opportunity to address dietary-related conditions such as
obesity, hypertension and diabetes is building structures (encapsulated actives) capable to
deliver molecules at the desired place and rate in the GI tract. Unlike viscous solutions in
which no permanent bonds between individual biopolymers are formed, in encapsulated
ingredients the biopolymers are cross-linked into a tridimensional structure. By encapsulating
functional ingredients it could be possible, for example, to impact on satiety and control the
release of active molecules such as glucose (Norton et al., 2006). Encapsulation also
improves the stability of a bioactive compound by protection from factors such as pH,
oxygen, UV light. As encapsulation can solve formulation problems, it is becoming very
popular in the food sector for protection and sustainable release of actives.
This Chapter focuses on the behaviour of alginate gel particles and liposomes under
simulated gastrointestinal conditions that can impact the rate of actives release in vitro by

Chapter 7 – Encapsulation of actives
208
using a STR. As solid particles can also modify the flow properties of the chyme, the
performance of the particles would also studied in the SIM as a function of mixing.
Preliminary experiments were carried out for encapsulating glucose in alginate microspheres;
however, the release of this sugar was fast due to the porosity of alginate beads and the
molecular weight of glucose (MW 180). For that reason, riboflavin (MW 376) was selected
as model to study the effect that encapsulation has on active release. Riboflavin and alkaline
phosphatase (ALP) were encapsulated within alginate gels by ionotropic gelation (section
7.2) and liposomes (section 7.3) respectively, to produced micro- and nano- scale particles.
Encapsulation efficiency and stability when stored at various pH and release of actives were
some of the parameters evaluated to study whether these structures could be potential
vehicles for the gastrointestinal delivery of bioactives. In addition, breakdown and release of
actives was studied in the SIM as a function of 2s segmentation (see pattern in section 4.3).
7.2 Gelled particles
To form gel particles of riboflavin, aqueous solutions (5.0 ml) of alginate (1.0 - 3.0%, w/v)
containing the vitamin (2.65 M) were added dropwise into 20 ml solutions of calcium
chloride (gelation medium) at various concentrations 0.1, 0.3 or 0.5 M. The solution was
stirred gently under constant speed at room temperature. Agitation was left during 15 minutes
to ensure gelation. Then, particles were filtered and washed with distilled water for further
characterization. Table 7.1 summarizes experimental conditions used to encapsulated
riboflavin. Since all the combinations were done, nine different formulations varying the
concentration of alginate and calcium were tested.

Chapter 7 – Encapsulation of actives
209
Table 7.1 Experimental conditions used for building gel particles.
Formulation Alginate (%, w/v) CaCl2 (M) Cross-linking time (min)
I 1.0 0.1 15
II 2.0 0.3 15
III 3.0 0.5 15
7.2.1 Gelled particles: size and entrapment efficiency (EE)
The resulting beads were spherical, with a mean diameter of 1.5 ± 0.3 mm. As table 7.2
shows the diameter of the beads decreased as the concentration of CaCl2 increased, as a result
of the cross links formed between calcium ions and alginate molecules. It is well known that
during gel formation calcium alginate gels shrink resulting in loss of water (syneresis) and an
increase in the concentration of the biopolymer. The structures produced with low
concentrations of calcium (0.1 mM) were approximately 15% bigger than those elaborated
with higher concentration of calcium ions reflecting a reduction of syneresis of the gel at low
calcium concentrations. This is in agreement with results reported by Rayment et al. (2009).
The formulation of the microspheres produced and entrapment efficiency (EE) are also listed
in Table 7.2. The EE of alginate gelled particles loaded with riboflavin was higher at low
concentration of alginate and CaCl2. For example, when 1% (w/v) of alginate was used the
EE diminished from 88% to 77% when CaCl2 concentration was increased from 0.1 to 0.5M.
Overall as the concentration of alginate increased the EE decreased when compared at the
same concentration of CaCl2. These results are in agreement with those found by others
authors (Rayment et al., 2009, Lee et al., 2008). The EE of gelled particles is usually reduced
with increasing the concentration of calcium chloride in gelling medium and cross-linking
time. This behavior could be explained as a denser and more compact structure was formed

Chapter 7 – Encapsulation of actives
210
with less volume available for the entrapment of active substances. As a result of syneresis,
harder and more organized networks were formed when gelled particles are exposed to high
concentration of calcium ions during extended periods of time.
Table 7.2 Ca-alginate particles formulation and entrapment efficiency (EE)
Assay Alginate (%, w/v) CaCl2 (mM) Diameter (mm) EE (%)
1 1 0.1 1.66 ± 0.03 88.09 ± 0.03
2 1 0.3 1.51 ± 0.09 86.56 ± 0.25
3 1 0.5 1.32 ± 0.02 77.45 ± 0.09
4 2 0.1 1.83 ± 0.04 86.96 ± 0.10
5 2 0.3 1.75 ± 0.10 86.78 ± 0.22
6 2 0.5 1.56 ± 0.06 86.60 ± 0.06
7 3 0.1 2.24 ± 0.19 85.36 ± 0.02
8 3 0.3 1.97 ± 0.08 84.98 ± 0.05
9 3 0.5 1.67 ± 0.13 83.83 ± 0.12
7.2.2 Particles morphology
The microspheres produced by ionotropic gelation were dried at room temperature and by
means of a freeze-dryer, to evaluate the effect of drying process. Figure 7.1 shows scanning
electron micrographs of the structure of gelled Ca-alginate particles dried at room
temperature and by freeze drying. During air drying, the gel beads become smaller with dense
matrices in which the active is embedded. Small fissures in the matrix surface were observed
(Figure 7.1a). When the gelled beads were freeze dried, spherical porous matrices were
formed which easily break upon handling. The size of freeze-dried particles remained almost
the same as before drying while those of air-drying particles became smaller and denser.
Drying method selection depends on the final application of these particles.

Chapter 7 – Encapsulation of actives
211
Figure 7.1 SEM micrographs of Ca-alginate particles showing the effect of drying process: (a) air- dried particles and (b) freeze-dried particles prepared with alginate (3.0%, w/v).
7.2.3 Release under simulated gastro-intestinal conditions
Release studies were carried out to examine the suitability of using calcium alginate matrix
gel beads for actives control release. Release of actives was first studied in a STR simulating
the physiological pH during gastric (pH=2.0) and intestinal (pH=7.0) digestion and then,
using the SIM to have an approach of the release in vivo and the effect of mixing. The
movements of the small intestine wall are considerably important on the absorption of the
actives and their transport through the intestinal mucosa.
Microspheres from each formulation (1.0 g) were placed in 10 ml of simulated gastric fluid
(SGF) (section 3.2.5) at pH 2.0. Vitamin (riboflavin) loaded microspheres were left in
agitation for 2 hours at room temperature. After this time, the capsules were filtered and
transferred into 10 ml of simulated intestinal fluid (SIF) pH 7 (section 3.2.5), trying to mimic
the transition from the stomach to the intestine where they remained in agitation for 3 hours
at room temperature. In order to determine the amount of vitamin released from the capsules
in these two different environments, aliquots of 1.0 ml of the remaining solution under
agitation were taken every hour during 5 hours for each experiment. The samples were then
a b

Chapter 7 – Encapsulation of actives
212
analyzed with a UV/Vis spectrophotometer at 445 nm. Percentage of cumulative release was
estimated to obtain the dynamic release profile.
The cumulative release expressed as percentage is plotted in Figures 7.2 and7.3 according to
alginate formulation. As figures show the rate of release was highly dependent of the
concentration of both alginate and calcium concentration.
Figure 7.2a shows the release profile of the riboflavin entrapped within the 1.0% (w/v)
alginate beads after being exposed to gastric pH (2.0) within 2 hours. The release of vitamin
from the gel particles was very fast during the first 2 hours in gastric solution reaching up to
60% of the original concentration of vitamin. After this period under intestinal condition
release gradually decreased reaching in most cases equilibrium.
The release of riboflavin from microspheres formed with 1.0% (w/v) of alginate into
simulated gastric fluid at pH 2.0 shown up to 50% of release after 2 hours independently of
the concentration of CaCl2 in gelling media. However, as the pH increased microspheres
produced with 0.5M CaCl2 appeared to be more stables with minimum release. As expected,
the cumulative release of vitamin increased as concentration of calcium ions decreased. This
is thought to be caused by a reduction of Ca2+-induced alginate cross-linking in the structure
of the microsphere resulting maybe into bigger ‘pores’. Over time, disintegration of beads
was observed with most of them breaking completely before the end of the experiment or in
the worst scenario after exposure to simulated gastric fluid. Results from beads formed with
2% (w/v) of alginate are shown in Figure 7.2b. These trends were slightly different when
compare with those for 1.0% (w/v) of alginate. In this particular case, microspheres were
very unstable with almost 100% of the release of vitamin after 4 hours for formulations
within 0.3 and 0.5M of CaCl2. However, over time, disintegration of the beads was observed
with one set of 1.0% (w/v) alginate beads breaking down completely before the end of the
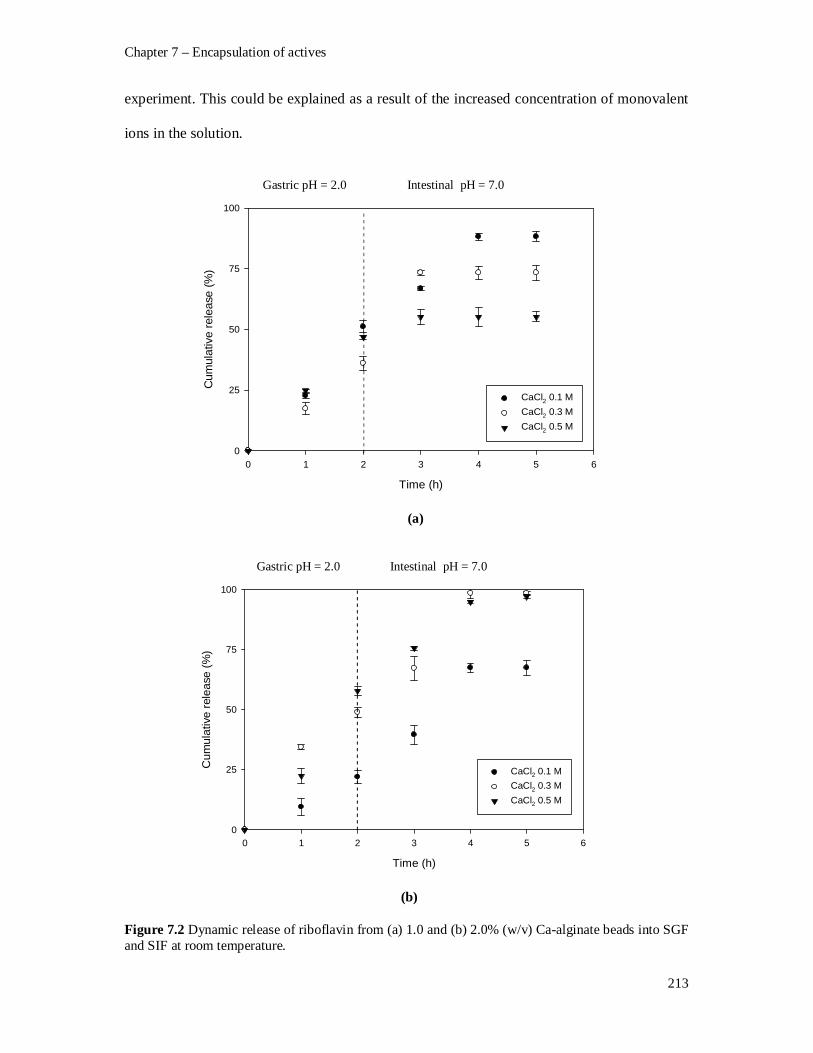
Chapter 7 – Encapsulation of actives
213
experiment. This could be explained as a result of the increased concentration of monovalent
ions in the solution.
Time (h)
0 1 2 3 4 5 6
Cum
ulat
ive
rele
ase
(%)
0
25
50
75
100
CaCl2 0.1 M CaCl2 0.3 M CaCl2 0.5 M
Time (h)
0 1 2 3 4 5 6
Cum
ulat
ive
rele
ase
(%)
0
25
50
75
100
CaCl2 0.1 M CaCl2 0.3 M CaCl2 0.5 M
Figure 7.2 Dynamic release of riboflavin from (a) 1.0 and (b) 2.0% (w/v) Ca-alginate beads into SGF and SIF at room temperature.
Gastric pH = 2.0 Intestinal pH = 7.0
Gastric pH = 2.0 Intestinal pH = 7.0
(a)
(b)

Chapter 7 – Encapsulation of actives
214
Dynamic release of vitamin from microspheres formed with 3% (w/v) of alginate is shown in
Figure 7.3. When exposed to simulated gastric fluid, around 40% of the entrapped riboflavin
was released during the first 2 hours for 0.1 and 0.5M CaCl2. Nevertheless for 0.3M up to
75% had been released after gastric fluid exposure. Once placed in the intestinal solution, the
rate of release was almost constant reaching equilibrium at 80, 75 and 50% for beads formed
with 0.3, 0.1 and 0.5 M CaCl2, respectively.
Time (h)
0 1 2 3 4 5 6
Cum
ulat
ive
rele
ase
(%)
0
25
50
75
100
CaCl2 0.1 M CaCl2 0.3 M CaCl2 0.5 M
Figure 7.3 Dynamic release of riboflavin from 3.0% (w/v) Ca-alginate beads into SGF and SIF at room temperature.
Overall, an inverse relationship between calcium ions concentration and vitamin release rates
was found. As the concentration of calcium increases from 0.1 to 0.5 M the release of
riboflavin was delayed. Thus, higher concentration of calcium ions in the gelling media
induced a greater degree of cross-linking resulting in higher gel strength and limiting
swelling patters. This is agreement with results obtained by other authors (Rayment et al.,
2009).
Gastric pH = 2.0 Intestinal pH = 7.0

Chapter 7 – Encapsulation of actives
215
Regarding the concentration of alginate, all formulations follow similar trends; with a fast
release during the first 3 hours, most notably when structures were placed into the simulated
gastric solution at low pH. This suggests an initial weak structure of the bead possible due to
dissociation of calcium ions at low pH (Rayment et al., 2009).
Alginate molecules are linear block co-polymers of β-D-mannuronic (M block) and α-L-
guluronic acids (G block) with a variation in composition and sequential arrangements. When
the alginate beads area placed in the gastric fluid (pH 2.0), the negatively changed carboxilate
groups from uronic acids of alginate begin to protonate to form uncharged –COOH groups.
This reduces the crosslinking due to decrease in ionic and electrostatic interactions. As a
result, the bead structure becomes unstable with a subsequent faster release of encapsulated
vitamin.
After 3 hours when the beads are transferred into the SIF at pH 7, the carboxylic groups of
alginate are deprotonated –COO-. Therefore, the beads begin to disintegrate along with the
release of the encapsulated vitamin. In addition to this, the ion exchange between Na+ ions
from the simulated fluids and Ca2+ ions from the egg-box cavities of the polyguluronate
blocks of alginate also contributes towards the disintegration of alginate beads.
The ion exchange phenomena will impact not only on the swelling process and solubility of
the particle but also the release of the active compound as a result of the surface area
available for absorption. However, based on the results an increase in alginate concentration
seems to improve the stability of the capsules under acidic conditions and i.e. towards
swelling.
Chapter 7 – Encapsulation of actives
216
From these figures, there is a clear effect on the interactions of alginate and calcium ions at
different concentration, in terms of the encapsulation of the active and most importantly in
the release of active components under simulated intestinal conditions. The encapsulation of
vitamin B2 in Ca-alginate gels strongly depends on the cross-linking of calcium ions into the
polymeric structure of the alginate. Thus, it would be recommended that the capsules were
stable, dense and with high available volume to allow the entrapment of the active and
therefore their resistance to the physiological conditions of the stomach (pH 2.0) to be
released in the small intestine.
In conclusion, release tests performed simulating the GI pH variation also evidenced a direct
relationship between alginate and CaCl2 concentration to the release of riboflavin; higher
calcium concentration leads to a greater degree of cross-linking, thus should had resulted in a
subsequent slowing of vitamin release rate.
Overall, the effect of cross-linking of the calcium ions with alginate plays an important role
in the release of actives, the denser and more compact the capsule is, the smaller the pore of
the beads are, therefore more resistance to the release at different values of pH. Although
particles made with high concentration of alginate had a low EE, were more resistant to
breakage in acidic conditions, so more appropriate for the release of actives in the intestine.
7.3 Liposomes
In this section liposomes were designed to protect the activity of active components from
acidic condition in the stomach. As a model molecule in this particular case, alkaline
phosphatase (ALP) was used and encapsulated within alginate gel core liposomes.
Multilamellar vesicles (MLV) were prepared using the dry lipid film hydration by dissolving
the enzyme in a solution of alginate and encapsulating this mixture in liposomes then

Chapter 7 – Encapsulation of actives
217
crosslinked the alginate by addition of CaCl2 to the liposome suspension creating liposomes
with a crosslinked gel core. These particles were characterised and compared to liposomes
prepared without alginate (standard liposomes) using particle size analysis, ESEM and Cryo-
SEM, entrapment efficiency, zeta potential and activity of the encapsulated enzyme following
exposure to simulated gastric pH.
7.3.1 Liposomes: particle size and entrapment efficiency (EE)
Characterisation of the ALP loaded liposomes and gel core liposomes using laser diffraction
revealed a large difference in mean particle size. The gel core liposomes were over twice the
size of the standard MLV 30.8 ± 3.1 and 13.4 ± 0.1 m respectively (Table 7.3). Entrapment
however, showed no significant difference (p>0.05) between the vesicle types.
Table 7.3 Particle size and EE of the standard and alginate core liposomes
Vesicle type Vesicle size ± std
(µm)
EE ± std
(%)
MLV Liposomes 13.4 ± 0.1 0.9 ± 0.3
Gel Core Liposomes 30.8 ± 3.1 1.6 ± 0.3
7.3.2 Liposomes morphology
As ESEM images shown, vesicle aggregation occurred in the gel core liposome sample
(Figure 7.4a) with the individual particle size in the region of 10-15 m which is in the same
order of size as the standard liposomes, in which aggregation did not appear (Figure 7.4b).
This is likely to be due to alginate present on the surface of the liposomes entangling with
adjacent liposomes prior to crosslinking, then once crosslinking is initiated by addition of
calcium, gelation occurs causing adhesion of the particles. The use of ESEM for studying
changes in liposome morphology has been used previously which confirmed the utility of this

Chapter 7 – Encapsulation of actives
218
technique in providing a real-time alternative assay for liposomes stability and formulation
(Mohamed et al., 2004).
Figure 7.4 ESEM micrograph of (a) gel core liposomes and (b) conventional liposomes.
7.3.3 Liposomes: zeta-potential measurement
To determine whether alginate or ALP were present on the surface of the liposomes,
measurements of zeta potential which is an indirect measurement of surface charge (Perrie
and Gregoriadis, 2000) were performed on liposomes loaded with ALP and gel core
liposomes loaded with ALP before and after crosslinking. These measurements were also
performed on samples without ALP. Figure 7.5 shows that liposomes containing ALP and/or
uncrosslinked alginate have a negative zeta potential however when the alginate is
crosslinked the surface charge becomes positive. Interestingly the crosslinked liposomes
containing ALP gave a significantly greater zeta potential (p < 0.05) than when there was no
ALP encapsulated, 15.75mV ± 1.28 and 12.38 ± 1.38, respectively.
10m 10m a b

Chapter 7 – Encapsulation of actives
219
Figure 7.5 Measurements of -potential for samples of liposomes and gel core liposomes (cross-linked and non-cross-linked) with and without ALP.
These measurements support the presence of alginate on the surface of the vesicles as
samples of gel loaded liposomes gave a negative zeta potential indicating the presence of
negatively charged sodium alginate. When the gel loaded liposomes were crosslinked using
calcium, the vesicles became positively charged due to the Ca2+ ions suppressing the negative
charge of the alginate. The presence of ALP which has an overall net negative charge (Beratis
et al., 1970) affected the zeta potential on the standard liposomes which indicated that there
may be some protein incorporated in the external lipid bilayer.
The binding of protein within the bilayers of liposomes is a well known phenomenon and
occurs due to favorable electrostatic interactions between the protein and the phospholipid
(Colletier et al., 2002). Surprisingly when ALP was incorporated with the crosslinked gel
core liposomes there was an increase in zeta potential due to the overall net negative charge
of the protein. ALP, however, is known to act as a calcium binding protein (de Bernard et al.,
-35.00-30.00-25.00-20.00-15.00-10.00-5.000.005.00
10.0015.0020.00
Lipo
som
es
No
ALP
Lipo
som
es
with
ALP
Gel
cor
e lip
osom
esN
o A
LP
Gel
cor
e lip
osom
es
with
ALP
Unc
ross
linke
d G
el
core
lipo
som
es n
o A
LP
Unc
ross
linke
d G
el
core
lipo
som
es
with
ALP
mV

Chapter 7 – Encapsulation of actives
220
1986) therefore addition of Ca2+ as a crosslinker for the alginate, may have also been bound
to the ALP shifting the overall charge of the ALP from negative to positive.
7.3.4 Liposomes internal structure: cryo-SEM analysis
Further evidence of alginate incorporated onto the surface of the gel loaded liposomes was
revealed in the cryo-ESEM micrographs given in Figure 7.6a which shows the surface of a
gel loaded liposome having small solid sections upon the surface thought to be crosslinked
alginate. The presence of several thick layers is also evident when cross sectioned (Figure
7.6b) indicating gel is incorporated throughout the many lamellae of the liposome. Clusters of
cross sectioned gel loaded liposomes are shown in figure 7.6c further indicating aggregation.
Although it is clearly visible that the conventional liposomes are multilamellar as expected
for MLV’s (Figure 7.6e) the aggregation characteristics and the thick layered lamella were
not witnessed (Figure 7.6d-f) therefore it can be argued that incorporation of alginate alters
the structural characteristics of liposomes potentially affecting the functional properties.
The presence of calcium alginate on the surface of alginate loaded liposomes has been
hypothesised previously by Monshipouri and Rudolph (1995) who used differential scanning
calorimetry to indicate a marked reduction in the enthalpy of the main gel to liquid crystalline
phase transition of the lipid in MLV and LUV dispersions when alginate was encapsulated in
the core (Monshipouri and Rudolph, 1995).

Chapter 7 – Encapsulation of actives
221
Figure 7.6 Cryo-ESEM micrographs of (a) gel core liposomes before fracture, (b) cross-section of gel core liposome, (c) cluster of crosss-sectioned gel core liposomes showing aggregation, (d) ALP-loaded liposome before fracture, (e) cross-sectioned ALP-loaded liposome with no evidence of aggregation.
7.3.5 Liposomes pH stability
The effects of pH on the stability of both vesicle types were analysed by monitoring vesicle
size over a period of 10 days when incubated at pH 3.8 pH 7.4 and pH 10 (Figure 7.7).
Standard MLV samples showed no dramatic change in mean diameter across the range of pH
tested (Figure 7.7a). The gel core liposomes, however, appeared to decrease in size when
stored at acidic pH and at pH 7.4 there was a substantial rise in mean diameter after 10 days
storage (Figure 7.7b).
These results indicate that standard liposome samples remained stable over a range of pH (pH
3.8 - pH 10) perhaps showing slight instability at pH 3.8 highlighted by a slight increase in
particle size (13m to 15m) (Figure 7.7a). The reduction in particle size of the gel core
liposomes at pH 3.8 (below the iso-electric point of ALP but above the pKa the negatively
charged carboxylate groups on the alginate) was possibly a result of the alginate gel
contracting (Draget et al., 1994) as the pH approaches the pKa of the carboxylate group.
C a b c
d e f

Chapter 7 – Encapsulation of actives
222
Time (Days)
0 2 4 6 8 10 12
VM
D (
m)
0
10
15
20
pH 3.4pH 7.4pH 10.0
Time (Days)
0 2 4 6 8 10 12VM
D (
m)
0
10
20
30
40
50
pH 3.8pH 7.4pH 10.0
When stored at pH 7.4 the increased size of the alginate containing liposomes following 10
days incubation may be due to the alginate gel gradually swelling. This 50% gain in size is
similar to what was reported by Martins et al. (2007) for alginate beads.
Figure 7.7 The effect of pH on the size of (a) MLV’s loaded with ALP and (b) gel core liposomes over a period of 10 days
7.3.6 Release of ALP
To determine the protective effect encapsulation in liposomes and gel core liposomes had on
ALP, the loaded samples were exposed to simulated gastric pH (pH 2) for 2 hours then
enzyme activity of the encapsulated ALP was evaluated in addition the quantity of ALP
released by the liposomes and gel core liposomes was also monitored. The release curves in
figure 7.8 reveal that the gel core liposomes released 13% of its entrapped ALP compared
with 20% released from the standard liposomes over 2 hours. Multilamellar vesicles are
expected to be more stable than other liposome types due to the many bilayers surrounding
the encapsulated material (Kokkona et al., 2000) however the addition of alginate appeared to
increase the stability in acid, where 7% less ALP was released from the gel core liposomes
(b) (a)
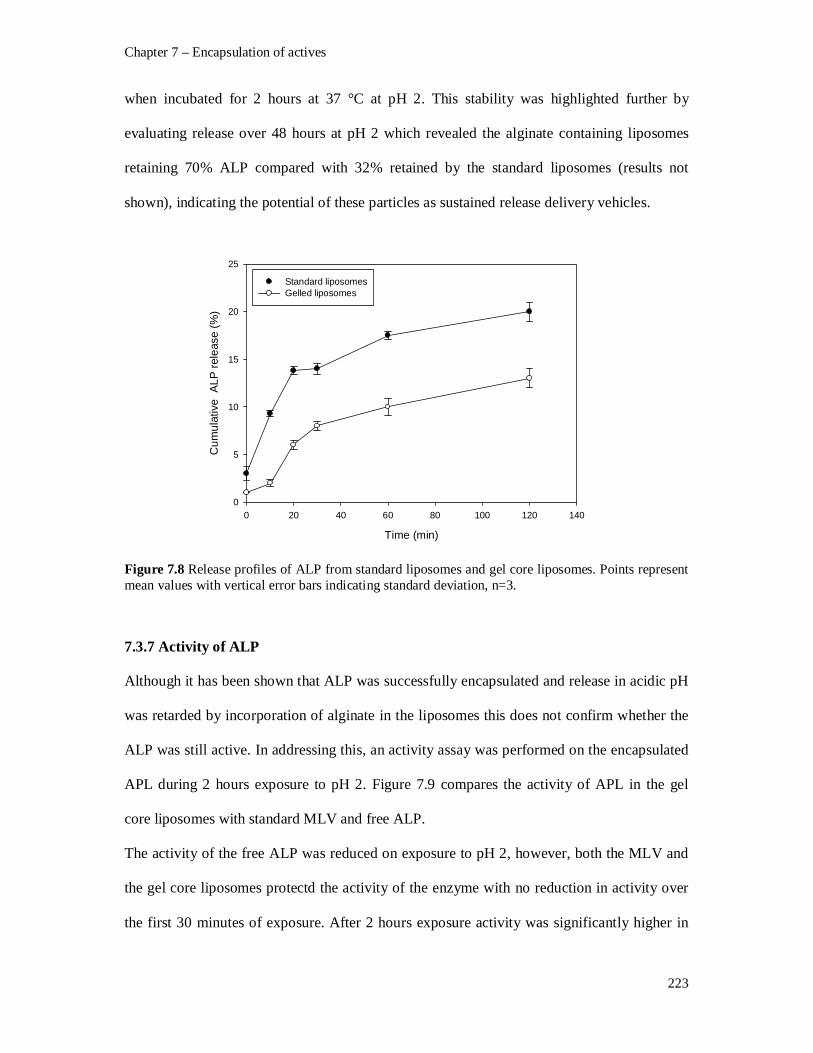
Chapter 7 – Encapsulation of actives
223
when incubated for 2 hours at 37 °C at pH 2. This stability was highlighted further by
evaluating release over 48 hours at pH 2 which revealed the alginate containing liposomes
retaining 70% ALP compared with 32% retained by the standard liposomes (results not
shown), indicating the potential of these particles as sustained release delivery vehicles.
Time (min)
0 20 40 60 80 100 120 140
Cum
ulat
ive
ALP
rele
ase
(%)
0
5
10
15
20
25
Standard liposomesGelled liposomes
Figure 7.8 Release profiles of ALP from standard liposomes and gel core liposomes. Points represent mean values with vertical error bars indicating standard deviation, n=3.
7.3.7 Activity of ALP
Although it has been shown that ALP was successfully encapsulated and release in acidic pH
was retarded by incorporation of alginate in the liposomes this does not confirm whether the
ALP was still active. In addressing this, an activity assay was performed on the encapsulated
APL during 2 hours exposure to pH 2. Figure 7.9 compares the activity of APL in the gel
core liposomes with standard MLV and free ALP.
The activity of the free ALP was reduced on exposure to pH 2, however, both the MLV and
the gel core liposomes protectd the activity of the enzyme with no reduction in activity over
the first 30 minutes of exposure. After 2 hours exposure activity was significantly higher in

Chapter 7 – Encapsulation of actives
224
the gel core liposomes (80% of original activity) than in the standard liposomes (55% of
original activity) (p < 0.05).
Time (min)
0 20 40 60 80 100 120 140
ALP
act
ivity
(%)
0
20
40
60
80
100
120 Free ALPStandard liposomesGelled liposomes
Figure 7.9 Percent of ALP activity retained during 2 hours of exposure to simulated gastric fluid, pH 2, for standard liposomes, gel core liposomes and free ALP.
The reduction in activity in the standard liposomes is a possible consequence of degradation
of the liposomes or by acid ingress due to the pH gradient across the lipid bilayer. Moreover,
evidence from the measurements of zeta potential (Figure 7.5) of ALP on the surface of the
liposomes could also explain the reduction in activity. In the gel core liposomes, ALP activity
is reduced over the 2 hours period but at a slower rate than was seen in the standard MLV.
This can be explained by the acid insoluble properties of alginate gels. This acid insolubility
however, is thought not to prevent a reduction in activity over longer periods of time as acid
is gradually imbibed by the gel forming an alginic acid gel. This reduction in pH within the
gel would ultimately reduce the activity of the enzyme.

Chapter 7 – Encapsulation of actives
225
The tailorability of liposomes and biopolymers such as alginate provide scope for further
investigation of these gel loaded particles as oral delivery vehicles as properties such as
surface charge, particle size and stability are easily manipulated further by selecting
alternative lipids to form the liposomes (e.g. cationic phospholipids), the addition of
secondary processing steps such as extrusion and incorporating a bilayer stabilizer such as
cholesterol.
7.4 In vitro release of gel particles and liposomes in the SIM
Release experiments were also carried out in the SIM to study the effect of mixing on the
release of riboflavin and ALP, under physiological conditions. However, in the case of gel
particles with a mean diameter of 1.5 mm, peristaltic pumps and the connectors used in the
SIM, restricts its use to nanoscale particles. On the other hand, as concentration of riboflavin
and ALP entrapped in gel particles and liposomes, respectively, was low, quantification of
active released in the recipient side of the SIM (1.0 L) was very inaccurately. Liposomes for
example, should be produced in large amounts to obtain representative results in the SIM. On
the other hand, to measure ALP absorption in the recipient side of the SIM, the semi-
permeable membrane must be changed because the molecular weight of the ALP is in the
range of 140-160 kDa and the membrane has a MWCO of 8.0 kDa i.e. the enzyme cannot
cross the permeable membrane used in this research.
7.5 Conclusions
To develop effective active delivery systems for controlled release, gel particles and
liposomes were built for encapsulating riboflavin and ALP, respectively. Sodium alginate
was used as a coating material. In both cases, alginate produced micro or nanocapsules that

Chapter 7 – Encapsulation of actives
226
protected the active ingredient from the acidic gastric environment. Gel particles were
produced at various concentrations of alginate and CaCl2.
The in vitro release study shows that microparticles of alginate have high pH sensitivity with
a faster release under gastric conditions with a faster release at pH 2 (SGF). This behaviour
was caused possibly by the surface area available for diffusion. The alginate structures were
easily destabilized in the SGF. Overall, the release of encapsulated riboflavin decreased with
increased capsule size and alginate concentration.
Alginate was also incorporated within the core of liposomes which dramatically affected
liposomal characteristics both in terms of morphology and stability. Incorporating alginate
into liposomes appears to improve stability at acidic pH however at neutral pH the alginate
causes swelling and aggregation of the liposomes. This study also suggested that alginate was
present on the surface as well as in the core of the liposomes. The alginate loaded liposomes
offer potential as an delivery platform for functional proteins, verified by maintaining the
80% of the original activity of ALP following exposure to simulated gastric pH for a period
of 2 hours.

227
CHAPTER 8 – CONCLUSIONS AND FUTURE WORK
This work focused on understanding mass transfer phenomena occurring during digestion and
absorption processes in the small intestine from an engineering perspective. To predict the in
vivo behavior of food digestion and actives absorption, a dynamic in vitro small intestine
model was used. This versatile model reproduces anatomical features of the human small
intestine simulating characteristic flow and mixing of the digesta by a unique pneumatic
system. However, differences between the semipermeable membrane used in the SIM and the
intestinal epithelial cell membrane must be taken into account when these processes are
simulated.
On the other hand, it was found the configuration of the SIM (open or close) affects the rates
of absorption. For glucose absorption and starch digestion, it was possible observed that the
open-SIM with recirculation of the chyme, had a better performance in mimicking mixing in
the small intestine than the close SIM. Since the latter restrict the movement of lumen
content, longitudinal mixing was impaired, this was more evident when viscous solutions and
starch food models were used. Another drawback of using the closed system is that the semi-
permeable membrane could be easily damaged by the mechanical contractions applied to the
SIM. Since the internal pressure of the lumen side of the SIM increased, the membrane could
be submitted to mechanical deformation that can change its permeability i.e. driven to
different results.
Basically, in this work two main points have shown; (i) how bulk-phase viscosity can have
effects and (ii) how encapsulation of actives might work under gastrointestinal conditions. In
both cases, a physical barrier was created to delay the rate of digestion and absorption of

Chapter 8 - Conclusions and future work
228
active molecules. Some combination of the use of viscosity modifiers and encapsulated
actives would be used useful to control two parts of behavior.
8.1 Main conclusions
8.1.1 Actives absorption
Absorption of glucose was studied in the closed-SIM as a function of (i) mixing and (ii) food
formulation. Results showed that mixing, induced by segmental contractions, increased the
rate of glucose transferred by bringing material to the membrane of the SIM and i.e. to the
epithelium of the small intestine in vivo; reducing the unstirred layer formed near the
membrane and helping diffusion of nutrients. Overall, mass transfer was enhanced when
segmentation was applied to the system. It was found that when viscosity of the chyme
increased, mixing and propulsion of the lumen contents were impaired, reducing the rates of
glucose absorption.
On the other hand, food formulation has a significant incidence on glucose absorption and as
a consequence on mass transfer. By increasing the viscosity of the digesta from 2 to 200
mPa.s, it was possible to reduce glucose absorption up to 90%.
Both mixing and food formulation have a significant effect on mass transfer phenomena in
the SIM. Whilst mixing enhances mass transfer processes, increasing the viscosity of the food
results in a reduction of the absorption across the membrane of the SIM.
In the second section, the open SIM configuration was used to study the effect that different
biopolymers has on glucose absorption due to the viscosity of the solution and the frequency
of segmental contractions (oscillation).

Chapter 8 - Conclusions and future work
229
The results showed that by adding soluble fibres such as guar gum, pectin and CMC on
glucose solutions the rate of absorption i.e. mass transfer coefficients were slow down. On
the other hand, wall movements influenced intestinal absorption. It was established that as the
number (frequency) of segmental contractions decreased mass transfer coefficients were
increased in viscous polymers such as CMC. However, frequency of the contractions does
not seem to affect significantly the mass transfer coefficients in food models added with guar
or pectin. This could be related to the shear thinning behaviour that each biopolymer has at
higher shear rates.
CMC was more effective than other biopolymers and its performance was also affected by
the frequency of contractions. This might relate to the shear tinning behaviour of CMC at
high frequencies. According to the results the characteristic shear rate in the SIM can be set
between 10 and 100 s-1. However, these values must be validated in vivo by evaluating the
performance of guar, pectin and CMC added to glucose solutions and monitoring the increase
on blood glucose levels.
Thus, by understanding how polymers affect viscosity, novel functional foods and drugs can
be designed to respond special needs of the consumer. On the basis of the results of this work
it would be also possible to predict how other polymers might behave during intestinal
digestion and absorption based on their chemical structure and rheological behaviour. These
findings are very promising in designing diets for diabetic and obese people to cope with
blood glucose levels.

Chapter 8 - Conclusions and future work
230
8.1.2 Starch digestion
For starch hydrolysis, the parameters investigated were degree of mixing by using a STR and
the SIM, (ii) concentration of enzyme and substrate (starch); flow rate and food formulation
in starch solutions and white bread.
It was observed that the degree of mixing impacted the performance and velocity of
digestion. Compare to the STR a ‘lag time’ was observed in the SIM. The kinetics of starch
hydrolysis in the SIM showed a sigmoidal behaviour with a characteristic ‘lag phase’ or
‘delay’ for both digestion of starch and absorption of glucose. Regarding to digestion, this
behaviour is one of the main contributions of this work which is physiologically relevant and
must be considered to further models development.
The rate of enzymatic reactions was reduced when guar was added delaying the access of
actives to the absorptive epithelium due to a decrease of both propulsion and mixing.
Similarly, this tendency was observed when bread digestion was mimicked in an aqueous
solution (control) and in the presence of guar. When viscosity of the lumen content was
increased, glucose absorption was reduced up to 45%. Compare with glucose and guar, it was
observed that absorption was faster in a model glucose system in which no chemical reactions
take place before absorption. On the other hand, absorption was delayed due to the presence
of starch that increases the viscosity of the bulk lumen.
When white bread was tested in the presence of guar, absorption decreases. Consequently,
viscous solutions impaired both enzyme-substrate binding and glucose diffusion from the
bulk to the wall of the lumen side of the SIM.

Chapter 8 - Conclusions and future work
231
By using the SIM it was demonstrated that increasing the viscosity of food digesta resulted in
a reduction of concentration of nutrients available for absorption. Increasing the viscosity of
the lumen or biopolymer side resulted in a decrease of the mass transfer coefficients.
The model provides and accurate and meaningful method for predicting the performance in
vivo of compounds and nutrients in the small intestine. The food formulation, starch and
enzyme concentrations are key factor to control digestion of foods during in vitro digestion
that should be taken into account in designing in vitro GI tract models.
8.1.3 Mixing processes
Since mixing processes are crucial for chemical reactions and absorption processes in the GI
tract. Flow visualization techniques were employed to understand the impact that
segmentation has on mass transfer in the gut. It was hypothesized that mass transfer in the
lumen side was enhanced by formation of eddies or recirculating flow as a result of mixing.
Furthermore, mixing brings material to the intestinal wall reaching the absorptive sites
present in the gut.
Based on the results, it was concluded that segmentation produces little net flow of the lumen
content but promotes radial mixing. It was found that contractions applied in the SIM are a
powerful medium of mixing in the small intestine, bringing food particles to the wall of the
lumen. Retropropulsive and oscillatory flows of the lumen content were generated during
segmentation. Flow vortices or eddies were identified as responsible for mass transfer
enhancement in the SIM. Turbulent mixing was generated in solutions with low viscosity
under segmentation. Nonetheless, mixing was impaired as the viscosity of the fluid increases.

Chapter 8 - Conclusions and future work
232
Flow visualization techniques such as PLIF and PEPT shown to be useful techniques to
describe flow fluid patterns in the small intestine as a result of mixing or segmentation.
8.1.4 Encapsulation
Novel structures were developed for sustained release of actives. Riboflavin was
encapsulated in gel microspheres while liposomes were used to encapsulate ALP.
The stability of alginate beads loaded with riboflavin were affected by both concentration of
CaCl2 and sodium alginate. The encapsulation efficiency was higher as the concentration of
calcium decreased creating structures with high water content. Even though the efficiency of
encapsulation was low for beads with high concentration of CaCl2, these microspheres were
more resistant to the simulated acidic conditions of the stomach pH 2. Those can be used to
delivery of actives in the intestinal conditions due to its stability.
Incorporating alginate into liposomes appears to improve stability at acidic pH, however, at
neutral pH the alginate causes swelling and aggregation of the liposomes. This study also
suggested that alginate was present on the surface as well as in the core of the liposomes. The
alginate loaded liposomes offer potential as an delivery platform for functional proteins,
verified by maintaining the 80% of the original activity of ALP following exposure to
simulated gastric pH for a period of 2 h.
By understanding how food is processed in the GI tract it would be able to design and
develop structured food to manipulate digestion, reducing and delaying absorption of actives
Understanding how food breaks down during digestion and absorption processes can be
applied to designing foods specifically targeted to a particular consistency and composition of

Chapter 8 - Conclusions and future work
233
the bolus. The results showed that adding soluble fibres such as guar gum, pectin and CMC in
glucose solutions affected rate of absorption i.e. mass transfer coefficients delaying the
concentration of glucose. Then, foods can be structured in a variety of ways and each
structure can have a different physiological response.
The SIM is a realistic model able to predict digestion and absorption of foods in a
physiological manner since it reproduce in an accurate form the segmentation movements
found in the human small intestine. This in vitro model simulates the characteristic movement
found in the small intestine with representative physiological features, volumes and flow
rates. Although it has limitations, the SIM promised to be a powerful tool in further studies of
digestion and absorption.
8.2 Future work
The future work could be potentially done in various areas:
Model validation. A proper validation must be done in order to correlate the results obtained
in the SIM with in vivo studies. Experiments by using MRI or visualization techniques could
help to monitor contractions (amplitude, frequency) occurring in the small intestine and to
evaluate the flow and concentration of enzymes as chyme enters to the gut. To avoid
complications of further metabolism/clearance of glucose from the circulation, it is proposed
to measure glucose in the hepatic portal vain rather than the periphery.
Different biopolymers such as β-glucans and fructans e.g. inulins at various concentrations
and frequencies of segmentation could be also tested in the SIM. It has been stated recently
that those biopolymers have a great impact on reducing glucose and cholesterol levels
(Anttila et al., 2004). The SIM has been proved to be a useful tool to predict the performance
of a biopolymer in the gut it could be interesting to evaluate the effect of other soluble fibres.

Chapter 8 - Conclusions and future work
234
Digestion of complex foods, including additional points of segmentation. This work was
focused on model viscous fluids from either starch or glucose. However, real foods are very
complex structures in which macromolecular interactions must be taken into account when
processes of digestion and absorption are being modeled. There is also crucial to add not only
amylases but also proteases and lipases for proteins and lipids digestion, respectively.
Study of encapsulated particles in combination with the bulk viscosity of the SIM.
Although the design of the SIM allows to test different semisolid foods, the study of
encapsulate particles in this model has limitations for the use of peristaltic pumps that can
break those particles before they arrive to the intestinal side of the SIM. As such the
mechanical system of the SIM can be modified to test the release of micro or nanostructures
on simulated intestinal conditions. Structures breakdown can be also evaluated in the SIM.
8.2.1 Absorption studies
The present work was limited at three different biopolymers (guar, pectin and CMC) and
frequencies (1s, 2s and 3s), however, further experiments can be done by using additional
soluble and insoluble fibres and by changing the sequence of segmental contractions in a
physiological context. For example, the maximum delay time between contractions is fixed at
6s (Labview software) but it could be possible to extend until ten seconds modelling a slow
transit and less effective degree of mixing that could be physiological relevant in some real
cases. The SIM could be also used along with other models such as Caco-2 to evaluate
permeability of actives to the cellular membrane. By combining both models, complementary
results can be obtained i.e. limitations of the SIM could be overcome. Caco-2 cells are able to
mimic active transport absorption process.
Chapter 8 - Conclusions and future work
235
Moreover, additional segmentation points can be included to the model by implementation of
three or more inflatable cuffs. As such the length of the membrane has to be increased and
maybe food recirculation could be avoided. To simulate motility in the human small intestine
a period of no contractions, long period of contractions and regular contractions can be also
simulated. One of the advantages of the SIM is that a variety of conditions can be simulated.
8.2.2 Digestion studies
Related to digestion studies, various starch types could be evaluated in the SIM. For instance,
starches with different crystallinity or resistance to amylolytic attack (resistant starch) can be
testing. Interactions among macronutrients (proteins, carbohydrates and lipids) must be also
assessed. In this work, homogeneous solutions of starch were used, nevertheless foods have
heterogeneous structures, thus for further experiments it is suggested to study complex foods
and the interactions between ingredients. Multiphase meals, e.g. emulsions, can be also used
to evaluate interactions among food components. Moreover, a mixture of proteases and
lipases must be employed in combination with amylases to represent physiological relevant
conditions in the small intestine.
Improvements in the method to feed the enzyme in the lumen side of the SIM must be done,
including additional sampling points inside of the membrane during experimentation, taking
into account that the concentration of the lumen changes with time and position, driven to a
better understanding of the kinetics in the small intestine.
It is also possible to include additional steps to simulate digestion in the mouth and the
stomach

Chapter 8 - Conclusions and future work
236
8.2.3 Flow visualization studies
Improvements in this area could be done by analysing quantitatively velocities generated in
the SIM as a function of mixing and using another optical imaging techniques such as
Particle Image Velocimetry (PIV). These studies must be done in combination with
mathematical modelling experiments to predict velocity patterns and their influence in
digestion and absorption processes.
A quantitative analysis must be done to calculate velocities and the trajectory of the particle
base on the position of the tracer from PEPT results.
8.2.4 Encapsulation studies
Different encapsulation techniques and materials can be used in the future to evaluate the
effect of microparticle structure in the release of actives and absorption. Structures, for
example, unilamellar liposomes could be made to increase the entrapment efficiency of the
internal structure. Moreover, starch could be encapsulated to delay its digestion and further
glucose absorption. Due to time restrictions, further evaluation of the release and diffusion of
encapsulated actives in the SIM cannot be done in this work. Analysis of the performance of
encapsulated active release in the in vitro model to measure diffusion and mass transfer
coefficients is recommended. In addition, combination of bulk viscosity and encapsulated
actives could be done to evaluate the effect of both.
Validation of the SIM must be an integral part in future works to improve or change not only
mechanical features of the system but also physiological concentrations of enzymes pH, T,
residence time and secretions in the lumen side of the SIM.
237
REFERENCES
AGNIHOTRI, S. A., MALLIKARJUNA, N. N. & AMINABHAVI, T. M. 2004. Recent advances on chitosan-based micro- and nanoparticles in drug delivery. Journal of Controlled Release, 100, 5-28.
AHN, J.-H., KIM, Y.-P., SEO, E.-M., CHOI, Y.-K. & KIM, H.-S. 2008. Antioxidant effect of natural
plant extracts on the microencapsulated high oleic sunflower oil. Journal of Food Engineering, 84, 327-334.
ANGUITA, M., GASA, J., MARTÍN-ORÚE, S. M. & PÉREZ, J. F. 2006. Study of the effect of
technological processes on starch hydrolysis, non-starch polysaccharides solubilization and physicochemical properties of different ingredients using a two-step in vitro system. Animal Feed Science and Technology, 129, 99-115.
ANNAN, N. T., BORZA, A. D. & HANSEN, L. T. 2008. Encapsulation in alginate-coated gelatin
microspheres improves survival of the probiotic Bifidobacterium adolescentis 15703T during exposure to simulated gastro-intestinal conditions. Food Research International, 41, 184-193.
ANTTILA, H., SONTAG-STROHM, T. & SALOVAARA, H. 2004. Viscosity of beta-glucan in oat
products. Agricultural and Food Science, 13, 80-87. ARMAND, M., PASQUIER, B., ANDRÉ, M., BOREL, P., SENFT, M., PEYROT, J., SALDUCCI,
J., PORTUGAL, H., JAUSSAN, V. & LAIRON, D. 1999. Digestion and absorption of 2 fat emulsions with different droplet sizes in the human digestive tract. The American Journal of Clinical Nutrition, 70, 1096-1106.
BAKALIS, S., FRYER, P. J. & PARKER, D. J. 2004. Measuring velocity distributions of viscous
fluids using positron emission particle tracking (PEPT). AIChE Journal, 50, 1606-1613. BANGHAM, A. D., STANDISH, M. M. & WATKINS, J. C. 1965. Diffusion of univalent ions across
the lamellae of swollen phospholipids. J Mol Biol, 13, 238-52. BARIGOU, M. 2004. Particle Tracking in Opaque Mixing Systems: An Overview of the Capabilities
of PET and PEPT. Chemical Engineering Research and Design, 82, 1258-1267. BELLISLE, F. & PEREZ, C. 1994. Low-energy substitutes for sugars and fats in the human diet:
Impact on nutritional regulation. Neuroscience & Biobehavioral Reviews, 18, 197-205. BERGERON, L. 2011. Stanford researchers use fluorescent nanotubes to illuminate the inner
workings of laboratory mice [Online]. Standord, USA. [Accessed July, 2011 2011]. BLACKBURN, N. A., HOLGATE, A. M. & READ, N. W. 1984. Does guar improve post-prandial
hyperglycaemia in humans by reducing small intestinal contact area? British Journal of Nutrition, 52, 197-204.
BLANQUET-DIOT, S., SOUFI, M., RAMBEAU, M., ROCK, E. & ALRIC, M. 2009. Digestive
stability of xanthophylls exceeds that of carotenes as studied in a dynamic in vitro gastrointestinal system. J Nutr, 139, 876-83.
BLANQUET, S., MAROL-BONNIN, S., BEYSSAC, E., POMPON, D., RENAUD, M. & ALRIC,
M. 2001. The ‘biodrug’ concept: an innovative approach to therapy. Trends in Biotechnology, 19, 393-400.

References
238
BLANQUET, S., ZEIJDNER, E., BEYSSAC, E., MEUNIER, J. P., DENIS, S., HAVENAAR, R. & ALRIC, M. 2004. A dynamic artificial gastrointestinal system for studying the behavior of orally administered drug dosage forms under various physiological conditions. Pharm Res, 21, 585-91.
BOEVER, P. D., DEPLANCKE, B. & VERSTRAETE, W. 2000. Fermentation by Gut Microbiota
Cultured in a Simulator of the Human Intestinal Microbial Ecosystem Is Improved by Supplementing a Soygerm Powder. The Journal of Nutrition, 130, 2599-2606.
BRASCHI, A., GILL, L. & NAISMITH, D. J. 2009. Partial substitution of sodium with potassium in
white bread: feasibility and bioavailability. International Journal of Food Sciences and Nutrition, 60, 507-521.
BRENELLI, S. L., CAMPOS, S. D. S. & SAAD, M. J. A. 1997. Viscosity of gums in vitro and their
ability to reduce postprandial hyperglycemia in normal subjects. Brazilian Journal of Medical and Biological Research, 30, 1437-1440.
BRENNAN, C. S. 2005. Dietary fibre, glycaemic response, and diabetes. Molecular Nutrition & Food
Research, 49, 560-570. CAMILLERI, M. 2006. Integrated upper gastrointestinal response to food intake. Gastroenterology,
131, 640-58. CASAS, J. A., MOHEDANO, A. F. & GARCÍA-OCHOA, F. 2000. Viscosity of guar gum and
xanthan/guar gum mixture solutions. Journal of the Science of Food and Agriculture, 80, 1722-1727.
COLLETIER, J.-P., CHAIZE, B., WINTERHALTER, M. & FOURNIER, D. 2002. Protein
encapsulation in liposomes: efficiency depends on interactions between protein and phospholipid bilayer. BMC Biotechnology, 2, 9.
CORLESS, R., GONNET, G., HARE, D., JEFFREY, D. & KNUTH, D. 1996. On the Lambert W
function. Advances in Computational Mathematics, 5, 329-359. COULSON, J. M. & RICHARDSON, J. F. 1998. Chemical Engineering Volume 1: Fluid Flow, Heat
transfer and Mass Transfer, Oxford: Butterworth-Heinemann. CUSSLER, E. L. 2009. Diffusion Mass Transfer in Fluid Systems, Cambrige, UK, Cambrige
University Press. CHAMBERS, S. J., WICKHAM, M. S. J., REGOLI, M., BERTELLI, E., GUNNING, P. A. &
NICOLETTI, C. 2004. Rapid in vivo transport of proteins from digested allergen across pre-sensitized gut. Biochemical and Biophysical Research Communications, 325, 1258-1263.
CHAPLIN, M. 2012. Water structure and science http://www.lsbu.ac.uk/water/ [Online]. [Accessed]. CHE MAN, Y. B., IRWANDI, J. & ABDULLAH, W. J. W. 1999. Effect of different types of
maltodextrin and drying methods on physico-chemical and sensory properties of encapsulated durian flavour. Journal of the Science of Food and Agriculture, 79, 1075-1080.
CHEN, C. C. & WAGNER, G. 2004. Vitamin E Nanoparticle for Beverage Applications. Chemical
Engineering Research and Design, 82, 1432-1437. CHIOU, D. & LANGRISH, T. A. G. 2007. Development and characterisation of novel nutraceuticals
with spray drying technology. Journal of Food Engineering, 82, 84-91.

References
239
CHUNG, H.-J., LIM, H. S. & LIM, S.-T. 2006. Effect of partial gelatinization and retrogradation on
the enzymatic digestion of waxy rice starch. Journal of Cereal Science, 43, 353-359. DE BERNARD, B., BIANCO, P., BONUCCI, E., COSTANTINI, M., LUNAZZI, G. C.,
MARTINUZZI, P., MODRICKY, C., MORO, L., PANFILI, E., POLLESELLO, P. & ET AL. 1986. Biochemical and immunohistochemical evidence that in cartilage an alkaline phosphatase is a Ca2+-binding glycoprotein. J Cell Biol, 103, 1615-23.
DE VOS, P., FAAS, M. M., STRAND, B. & CALAFIORE, R. 2006. Alginate-based microcapsules
for immunoisolation of pancreatic islets. Biomaterials, 27, 5603-5617. DEFERME, S., ANNAERT, P. & AUGUSTIJNS, P. 2008. In vitro screening models to asses
intestinal drug absorption and metabolism. In: EHRHARDT, C. & KIM, K.-J. (eds.) Drug Absorption Studies: In Situ, In Vitro and In Silico Models. New York: Springer.
DIMANTOV, A., GREENBERG, M., KESSELMAN, E. & SHIMONI, E. 2004. Study of high
amylose corn starch as food grade enteric coating in a microcapsule model system. Innovative Food Science & Emerging Technologies, 5, 93-100.
DONA, A. C., PAGES, G., GILBERT, R. G. & KUCHEL, P. W. 2010. Digestion of starch: In vivo
and in vitro kinetic models used to characterise oligosaccharide or glucose release. Carbohydrate Polymers, 80, 599-617.
DRAGET, K. I., SKJÅK BRÆK, G. & SMIDSRØD, O. 1994. Alginic acid gels: the effect of alginate
chemical composition and molecular weight. Carbohydrate Polymers, 25, 31-38. DRUSCH, S. 2007. Sugar beet pectin: A novel emulsifying wall component for microencapsulation
of lipophilic food ingredients by spray-drying. Food Hydrocolloids, 21, 1223-1228. DUCHATEAU, G. & KLAFFKE, W. 2008. Product Composition, Structure, and Bioavailability.
Food Biophysics, 3, 207-212. DUCHATEAU, G. S. M. J. E. & KLAFFKE, W. 2009. Health food product composition, structure
and bioavailability. In: MCCLEMENTS, D. J. & DECKER, E. A. (eds.) Designing fuctional foods. Oxford: WP.
EDWARDS, C. A., JOHNSON, I. T. & READ, N. W. 1988. Do viscous polysaccharides slow
absorption by inhibiting diffusion or convection? European Journal of Clinical Nutrition, 42, 307-312.
ENGLYST, H. N., KINGMAN, S. M. & CUMMINGS, J. H. 1992. Classification and measurement of
nutritionally important starch fractions. European Journal of Clinical Nutrition, 46 Suppl 2, S33-50.
ENGLYST, K. N., ENGLYST, H. N., HUDSON, G. J., COLE, T. J. & CUMMINGS, J. H. 1999.
Rapidly available glucose in foods: an in vitro measurement that reflects the glycemic response. The American Journal of Clinical Nutrition, 69, 448-454.
FANGARY, Y. S., BARIGOU, M., SEVILLE, J. P. K. & PARKER, D. J. 2000. Fluid trajectories in a
stirred vessel of non-newtonian liquid using positron emission particle tracking. Chemical Engineering Science, 55, 5969-5979.
FENG, S.-S., RUAN, G. & LI, Q.-T. 2004a. Fabrication and characterizations of a novel drug
delivery device liposomes-in-microsphere (LIM). Biomaterials, 25, 5181-5189.

References
240
FENG, S. S., RUAN, G. & LI, Q. T. 2004b. Fabrication and characterizations of a novel drug delivery
device liposomes-in-microsphere (LIM). Biomaterials, 25, 5181-9. FORESIGHT 2007. Tacking Obesities: Future Choices - Project Report. In: SKILLS, D. O. I. U. A.
(ed.). UK: Goverment Office for Science. GOH, C. H., HENG, P. W. S. & CHAN, L. W. 2012. Alginates as a useful natural polymer for
microencapsulation and therapeutic applications. Carbohydrate Polymers, 88, 1-12. GONZÁLEZ-RODRı́ GUEZ, M. L., HOLGADO, M. A., SÁNCHEZ-LAFUENTE, C., RABASCO,
A. M. & FINI, A. 2002. Alginate/chitosan particulate systems for sodium diclofenac release. International Journal of Pharmaceutics, 232, 225-234.
GOUDAR, C. T., HARRIS, S. K., MCINERNEY, M. J. & SUFLITA, J. M. 2004. Progress curve
analysis for enzyme and microbial kinetic reactions using explicit solutions based on the Lambert W function. Journal of Microbiological Methods, 59, 317-326.
GOUIN, S. 2004. Microencapsulation: industrial appraisal of existing technologies and trends. Trends
in Food Science & Technology, 15, 330-347. GREGG, J. A. & SHARMA, M. M. 1978. Endoscopic measurement of pancreatic juice secretory flow
rates and pancreatic secretory pressures after secretin administration in human controls and in patients with acute relapsing pancreatitis, chronic pancreatitis, and pancreatic cancer. Am J Surg, 136, 569-74.
GUILLON, F. & CHAMP, M. 2000. Structural and physical properties of dietary fibres, and
consequences of processing on human physiology. Food Research International, 33, 233-245. GUO, M. R., FOX, P. F., FLYNN, A. & KINDSTEDT, P. S. 1995. Susceptibility of β-Lactoglobulin
and Sodium Caseinate to Proteolysis by Pepsin and Trypsin. Journal of dairy science, 78, 2336-2344.
GUYTON, A. C. & HALL, J. E. 2006. Textbook of Medical Physiology, Philadelphia, USA, Elsevier. GYU-HEE, L. 2011. A salt substitute with low sodium content from plant aqueous extracts. Food
Research International, 44, 537-543. HOAD, C., RAYMENT, P., COX, E., WRIGHT, P., BUTLER, M., SPILLER, R. & GOWLAND, P.
2009. Investigation of alginate beads for gastro-intestinal functionality, Part 2: In vivo characterisation. Food Hydrocolloids, 23, 833-839.
HONG, J. S., VREELAND, W. N., DEPAOLI LACERDA, S. H., LOCASCIO, L. E., GAITAN, M.
& RAGHAVAN, S. R. 2008. Liposome-Templated Supramolecular Assembly of Responsive Alginate Nanogels. Langmuir, 24, 4092-4096.
HORITA, C. N., MORGANO, M. A., CELEGHINI, R. M. S. & POLLONIO, M. A. R. 2011.
Physico-chemical and sensory properties of reduced-fat mortadella prepared with blends of calcium, magnesium and potassium chloride as partial substitutes for sodium chloride. Meat Science, 89, 426-433.
HOWES, T., MACKLEY, M. R. & ROBERTS, E. P. L. 1991. The simulation of chaotic mixing and
dispersion for periodic flows in baffled channels. Chemical Engineering Science, 46, 1669-1677.

References
241
HU, Y., LIU, Z., YANG, J., JIN, Y. & CHENG, Y. 2010. Study on the reactive mixing process in an unbaffled stirred tank using planar laser-induced fluorescence (PLIF) technique. Chemical Engineering Science, 65, 4511-4518.
HU, Y., WANG, W., SHAO, T., YANG, J. & CHENG, Y. 2012. Visualization of reactive and non-
reactive mixing processes in a stirred tank using planar laser induced fluorescence (PLIF) technique. Chemical Engineering Research and Design, 90, 524-533.
HUNT, J. N. 1983. Mechanisms and disorders of gastric emptying. Annual Review of Medicine, 34,
219-229. HUR, S. J., LIM, B. O., DECKER, E. A. & MCCLEMENTS, D. J. 2011. In vitro human digestion
models for food applications. Food Chemistry, 125, 1-12. IMAM, H., SANMIGUEL, C., LARIVE, B., BHAT, Y. & SOFFER, E. 2004. Study of intestinal flow
by combined videofluoroscopy, manometry, and multiple intraluminal impedance. American Journal of Physiology - Gastrointestinal and Liver Physiology, 286, G263-G270.
JE LEE, S. & ROSENBERG, M. 2000. Whey Protein-based Microcapsules Prepared by Double
Emulsification and Heat Gelation. LWT - Food Science and Technology, 33, 80-88. JEFFREY, B., UDAYKUMAR, H. S. & SCHULZE, K. S. 2003. Flow fields generated by peristaltic
reflex in isolated guinea pig ileum: impact of contraction depth and shoulders. Am J Physiol Gastrointest Liver Physiol, 285, G907-18.
JENKINS, D., GHAFARI, H., WOLEVER, T., TAYLOR, R., JENKINS, A., BARKER, H.,
FIELDEN, H. & BOWLING, A. 1982. Relationship between rate of digestion of foods and post-prandial glycaemia. Diabetologia, 22, 450-455.
JENKINS, D. J., WOLEVER, T. M., LEEDS, A. R., GASSULL, M. A., HAISMAN, P., DILAWARI,
J., GOFF, D. V., METZ, G. L. & ALBERTI, K. G. 1978. Dietary fibres, fibre analogues, and glucose tolerance: importance of viscosity. BMJ, 1, 1392-1394.
JOHANSSON, F. & PATERSON, R. 2008. Physiologically Based in Silico Models for the Prediction
of Oral Drug Absorption. In: EHRHARDT, C. & KIM, K.-J. (eds.) Drug Absroption Studies In Situ, In Vivo and In Silico Models. NY: Springer.
JOHNSTONE, A. M. 2010. Protein and appetite control. Food Science and Technology, 24, 21-24. JONES, J. M. & JONNALAGADDA, S. 2005. The use of fat replacers for weight loss and control.
In: MELA, D. J. (ed.) Food, diet and obesity. Boca Ratón, Fl, USA: Woodhead Publishing in Food Science and Technology.
KIM, H.-H. Y. & BAIANU, I. C. 1991. Novel liposome microencapsulation techniques for food
applications. Trends in Food Science & Technology, 2, 55-61. KIM, M. 2005. High-methoxyl pectin has greater enhancing effect on glucose uptake in intestinal
perfused rats. Nutrition, 21, 372-7. KLAYPRADIT, W. & HUANG, Y.-W. 2008. Fish oil encapsulation with chitosan using ultrasonic
atomizer. LWT - Food Science and Technology, 41, 1133-1139. KOKKONA, M., KALLINTERI, P., FATOUROS, D. & ANTIMISIARIS, S. G. 2000. Stability of
SUV liposomes in the presence of cholate salts and pancreatic lipases: effect of lipid composition. European Journal of Pharmaceutical Sciences, 9, 245-252.

References
242
KONG, F. & SINGH, R. P. 2008a. Disintegration of Solid Foods in Human Stomach. Journal of food
science, 73, R67-R80. KONG, F. & SINGH, R. P. 2008b. A Model Stomach System to Investigate Disintegration Kinetics
of Solid Foods during Gastric Digestion. Journal of food science, 73, E202-E210. KRISHNAN, S., KSHIRSAGAR, A. C. & SINGHAL, R. S. 2005. The use of gum arabic and
modified starch in the microencapsulation of a food flavoring agent. Carbohydrate Polymers, 62, 309-315.
LECLERE, C., CHAMP, M., BOILLOT, J., GUILLE, G., LECANNU, G., MOLIS, C., BORNET, F., KREMPF, M., DELORT-LAVAL, J. & GALMICHE, J. 1994. Role of viscous guar gums in lowering the glycemic response after a solid meal. The American Journal of Clinical Nutrition, 59, 914-921.
LEE, J.-S., CHUNG, D. & LEE, H. G. 2008. Preparation and characterization of calcium pectinate gel
beads entrapping catechin-loaded liposomes. International Journal of Biological Macromolecules, 42, 178-184.
LEHMANN, U. & ROBIN, F. 2007. Slowly digestible starch – its structure and health implications: a
review. Trends in Food Science & Technology, 18, 346-355. LELOUP, V. M., COLONNA, P. & RING, S. G. 2004. α-Amylase adsorption on starch crystallites.
Biotechnology and Bioengineering, 38, 127-134. LEVENSPIEL, O. 1999. Chemical reaction engineering, New York, Wiley. LEVY, M. N., KOEPPEN, B. M. & STANTON, B. A. 2006. Principles of Physiology, Elsevier
MOSBY. LI, J. H., VASANTHAN, T., HOOVER, R. & ROSSNAGEL, B. G. 2004. Starch from hull-less
barley: V. In-vitro susceptibility of waxy, normal, and high-amylose starches towards hydrolysis by alpha-amylases and amyloglucosidase. Food Chemistry, 84, 621-632.
LI, Z., BAO, Y. & GAO, Z. 2011. PIV experiments and large eddy simulations of single-loop flow
fields in Rushton turbine stirred tanks. Chemical Engineering Science, 66, 1219-1231. LIU, L., FISHMAN, M. L., KOST, J. & HICKS, K. B. 2003. Pectin-based systems for colon-specific
drug delivery via oral route. Biomaterials, 24, 3333-3343. LO CURTO, A., PITINO, I., MANDALARI, G., DAINTY, J. R., FAULKS, R. M. & JOHN
WICKHAM, M. S. 2011. Survival of probiotic lactobacilli in the upper gastrointestinal tract using an in vitro gastric model of digestion. Food Microbiology, 28, 1359-1366.
LUNDIN, L., GOLDING, M. & WOOSTER, T. J. 2008. Understanding food structure and function in
developing food for appetite control. Nutrition & Dietetics, 65, S79-S85. MACAGNO, E. O. & CHRISTENSEN, J. 1980. Fluid Mechanics of the Duodenum. Annual Review
of Fluid Mechanics, 12, 139-158. MACAGNO, E. O., CHRISTENSEN, J. & LEE, C. L. 1982. Modeling the effect of wall movement
on absorption in the intestine. American Journal of Physiology - Gastrointestinal and Liver Physiology, 243, G541-G550.
MACKLEY, M. R. & STONESTREET, P. 1995. Heat transfer and associated energy dissipation for
oscillatory flow in baffled tubes. Chemical Engineering Science, 50, 2211-2224.

References
243
MANDALARI, G., TOMAINO, A., ARCORACI, T., MARTORANA, M., TURCO, V. L.,
CACCIOLA, F., RICH, G. T., BISIGNANO, C., SAIJA, A., DUGO, P., CROSS, K. L., PARKER, M. L., WALDRON, K. W. & WICKHAM, M. S. J. 2010a. Characterization of polyphenols, lipids and dietary fibre from almond skins (Amygdalus communis L.). Journal of Food Composition and Analysis, 23, 166-174.
MANDALARI, G., TOMAINO, A., RICH, G. T., LO CURTO, R., ARCORACI, T., MARTORANA,
M., BISIGNANO, C., SAIJA, A., PARKER, M. L., WALDRON, K. W. & WICKHAM, M. S. J. 2010b. Polyphenol and nutrient release from skin of almonds during simulated human digestion. Food Chemistry, 122, 1083-1088.
MARCIANI, L., GOWLAND, P. A., SPILLER, R. C., MANOJ, P., MOORE, R. J., YOUNG, P., AL-
SAHAB, S., BUSH, D., WRIGHT, J. & FILLERY-TRAVIS, A. J. 2000. Gastric Response to Increased Meal Viscosity Assessed by Echo-Planar Magnetic Resonance Imaging in Humans. The Journal of Nutrition, 130, 122-127.
MARCIANI, L., YOUNG, P., WRIGHT, J., MOORE, R., COLEMAN, N., GOWLAND, P. A. &
SPILLER, R. C. 2001. Antral motility measurements by magnetic resonance imaging. Neurogastroenterology & Motility, 13, 511-518.
MARTINS, S., SARMENTO, B., SOUTO, E. B. & FERREIRA, D. C. 2007. Insulin-loaded alginate
microspheres for oral delivery – Effect of polysaccharide reinforcement on physicochemical properties and release profile. Carbohydrate Polymers, 69, 725-731.
MASSEY, B. S. & WARD-SMITH, A. J. 1998. Mechanics of fluids, Cheltenham, Stanley Thornes. MATEO ANSON, N., HAVENAAR, R., BAST, A. & HAENEN, G. R. M. M. 2010. Antioxidant and
anti-inflammatory capacity of bioaccessible compounds from wheat fractions after gastrointestinal digestion. Journal of Cereal Science, 51, 110-114.
MATEO ANSON, N., VAN DEN BERG, R., HAVENAAR, R., BAST, A. & HAENEN, G. R. M. M.
2009. Bioavailability of ferulic acid is determined by its bioaccessibility. Journal of Cereal Science, 49, 296-300.
MINEKUS, M., JELIER, M., XIAO, J. Z., KONDO, S., IWATSUKI, K., KOKUBO, S., BOS, M.,
DUNNEWIND, B. & HAVENAAR, R. 2005. Effect of partially hydrolyzed guar gum (PHGG) on the bioaccessibility of fat and cholesterol. Biosci Biotechnol Biochem, 69, 932-8.
MONELL, K. T. 2005. Carbohydrates, glycemic respeonses and weight control. In: MELA, D. J.
(ed.) Food, diet and obesity. Boca Ratón, Fl, USA: Woodhead Publising in Food Science and Technology.
MONSHIPOURI, M. & RUDOLPH, A. S. 1995. Liposome-encapsulated alginate: controlled
hydrogel particle formation and release. J Microencapsul, 12, 117-27. NGUYEN, N. Q., BRYANT, L., FRASER, R., BURGSTAD, C., BURNETT, J., BUTLER, R. N. &
HOLLOWAY, R. H. 2008. M1712 Interaction Between Small Intestinal Small Intestinal Motility and Absorption Following Major Abdominal Surgery. Gastroenterology, 134, A-403.
NORTON, I., FRYER, P. & MOORE, S. 2006. Product/Process integration in food manufacture:
Engineering sustained health. AIChE Journal, 52, 1632-1640.

References
244
OOMEN, A. G., ROMPELBERG, C. J., BRUIL, M. A., DOBBE, C. J., PEREBOOM, D. P. & SIPS, A. J. 2003. Development of an in vitro digestion model for estimating the bioaccessibility of soil contaminants. Arch Environ Contam Toxicol, 44, 281-7.
PARKER, D. J., FORSTER, R. N., FOWLES, P. & TAKHAR, P. S. 2002. Positron emission particle
tracking using the new Birmingham positron camera. Nuclear Instruments and Methods in Physics Research Section A: Accelerators, Spectrometers, Detectors and Associated Equipment, 477, 540-545.
PAUL, E. L., ATIEMO-OBENG, V. A. & KRESTA, S. M. (eds.) 2004. Handbook of Industrial
Mixing: science and practice, Hoboken, N. J.: Wiley-Interscience. PENRY, D. L. & JUMARS, P. A. 1986. Chemical Reactor analysis and Optimal Digestion.
BioScience, 36, 310-315. PERRIE, Y. & GREGORIADIS, G. 2000. Liposome-entrapped plasmid DNA: characterisation
studies. Biochim Biophys Acta, 1475, 125-32. PERRY, J. H., PERRY, R. H., CHILTON, C. H. & KIRKPATRICK, S. D. 1973. Chemical engineers'
handbook, New York McGraw-Hill. PETERS, S. E. & BRAIN, C. H. 2009. Benefits of a soy lecithin based nanotechnology for the animal
and human food industry. In: QINGRONG HUANG, P. G. A. M. Q. (ed.) Mciro/Nano-encapsulation of Active Food Ingredients. USA: American Chemical Society.
POTHAKAMURY, U. R. & BARBOSA-CÁNOVAS, G. V. 1995. Fundamental aspects of controlled
release in foods. Trends in Food Science & Technology, 6, 397-406. PROBERT, H. M. & GIBSON, G. R. 2004. Development of a fermentation system to model sessile
bacterial populations in the human colon. Biofilms, 1, 13-19. PROFENNO, L. A., PORSTEINSSON, A. P. & FARAONE, S. V. 2010. Meta-Analysis of
Alzheimer's Disease Risk with Obesity, Diabetes, and Related Disorders. Biological Psychiatry, 67, 505-512.
RAYMENT, P., WRIGHT, P., HOAD, C., CIAMPI, E., HAYDOCK, D., GOWLAND, P. &
BUTLER, M. F. 2009. Investigation of alginate beads for gastro-intestinal functionality, Part 1: In vitro characterisation. Food Hydrocolloids, 23, 816-822.
READ & WELCH 1985. Reduction of Postpandrial Glycaemia by Dietary Manipulation. In: JONES,
J. O. H. A. V. A. (ed.) Food and the Gut RYTTIG, K. 2005. Dietary fibre and weight control. In: MELA, D. J. (ed.) Food, diet and obesity.
Boca Ratón, Fl, USA: Woodhead Publising in Food Science and Technology. SALMERÓN, J., ASCHERIO, A., RIMM, E. B., COLDITZ, G. A., SPIEGELMAN, D., JENKINS,
D. J., STAMPFER, M. J., WING, A. L. & WILLETT, W. C. 1997. Dietary Fiber, Glycemic Load, and Risk of NIDDM in Men. Diabetes Care, 20, 545-550.
SAMRA, R. A. & ANDERSON, G. H. 2005. Intense sweeteners and sugar replacers in the regulation
of food intake and body weight. In: MELA, D. J. (ed.) Food, diet and obesity. Boca Ratón, Fl, USA: Woodhead Publishing in Food Science and Technology.
SCOTT, S. 2011. The Retromer Pathway Links Obesity and Diabetes to Alzheimer's Disease.
Alzheimer's and Dementia, 7, S283-S284.

References
245
SCHULZE, K. 2006. Imaging and modelling of digestion in the stomach and the duodenum.
Neurogastroenterology & Motility, 18, 172-183. SCHULZE, K. S. & CLARK, E. 2008. Ink dispersion by sequential contractions in isolated segments
of guinea pig ileum and duodenum. Neurogastroenterology & Motility, 20, 1317-1327. SHAHIDI, F. & HAN, X. Q. 1993. Encapsulation of food ingredients. Crit Rev Food Sci Nutr, 33,
501-47. SLAUGHTER, S. L., ELLIS, P. R. & BUTTERWORTH, P. J. 2001. An investigation of the action of
porcine pancreatic α-amylase on native and gelatinised starches. Biochimica et Biophysica Acta (BBA) - General Subjects, 1525, 29-36.
SNOW, P. & O'DEA, K. 1981. Factors affecting the rate of hydrolysis of starch in food. The
American Journal of Clinical Nutrition, 34, 2721-2727. SOOTTITANTAWAT, A., TAKAYAMA, K., OKAMURA, K., MURANAKA, D., YOSHII, H.,
FURUTA, T., OHKAWARA, M. & LINKO, P. 2005. Microencapsulation of l-menthol by spray drying and its release characteristics. Innovative Food Science & Emerging Technologies, 6, 163-170.
SPILLER, R., GOWLAND, P. & MARCIANI, L. 2009. Techniques for assesing the funtional
resposnse to food of the estomach and small and large intestine. In: MCCLEMENTS, D. J. & DECKER, E. A. (eds.) Designing funtional foods. Boca Raton: CRC Press.
STOLL, B. R., BATYCKY, R. P., LEIPOLD, H. R., MILSTEIN, S. & EDWARDS, D. A. 2000. A
theory of molecular absorption from the small intestine. Chemical Engineering Science, 55, 473-489.
SU, J., FLANAGAN, J. & SINGH, H. 2008. Improving encapsulation efficiency and stability of
water-in-oil-in-water emulsions using a modified gum arabic (Acacia (sen) SUPER GUM™). Food Hydrocolloids, 22, 112-120.
SZENTE, L. & SZEJTLI, J. 2004. Cyclodextrins as food ingredients. Trends in Food Science & Technology, 15, 137-142.
TAYLOR, A. J. & LINFORTH, R. S. T. 1996. Flavour release in the mouth. Trends in Food Science
and Technology, 7, 444-448. THARAKAN, A. 2008. Modelling of physical and chemical processes in the small intestine. Doctor
of Engineering, University of Birmingham. THARAKAN, A., NORTON, I. T., FRYER, P. J. & BAKALIS, S. 2010. Mass transfer and nutrient
absorption in a simulated model of small intestine. Journal of food science, 75, E339-46. UDAYKUMAR, H. S., KRISHMAN, S., DILLARD, S., MARSHALL, J. S. & SCHULZE, K. 2006.
Computation of peristaltic transport and mixing in the small intestine. Journal of Biomechanics, 39, Supplement 1, S442-S443.
VAN AKEN, G. A., VINGERHOEDS, M. H. & DE HOOG, E. H. A. 2007. Food colloids under oral
conditions. Current Opinion in Colloid & Interface Science, 12, 251-262. VAN DER BILT, A. 2009. Oral physiology, mastication and food perception In: MCCLEMENTS, D.
J. & DECKER, E. A. (eds.) Designing functional foods. Boca Raton: CRC Press WP.

References
246
VAN KEMPEN, T. A. T. G., REGMI, P. R., MATTE, J. J. & ZIJLSTRA, R. T. 2010. In Vitro Starch Digestion Kinetics, Corrected for Estimated Gastric Emptying, Predict Portal Glucose Appearance in Pigs. The Journal of Nutrition.
VARDAKOU, M., MERCURI, A., NAYLOR, T. A., RIZZO, D., BUTLER, J. M., CONNOLLY, P.
C., WICKHAM, M. S. J. & FAULKS, R. M. 2011. Predicting the human in vivo performance of different oral capsule shell types using a novel in vitro dynamic gastric model. International Journal of Pharmaceutics, 419, 192-199.
VERSANTVOORT, C. H. M., OOMEN, A. G., VAN DE KAMP, E., ROMPELBERG, C. J. M. &
SIPS, A. J. A. M. 2005. Applicability of an in vitro digestion model in assessing the bioaccessibility of mycotoxins from food. Food and Chemical Toxicology, 43, 31-40.
WEAST, R. C., LIDE, D. R., ASTLE, M. J. & BEYER, W. H. 1989. CRC handbook of chemistry and
physics : a ready-reference book of chemical and physical data, Boca Raton, Fla., CRC Press. WHO. 2011. Obesity and overweight [Online]. Available:
http://www.who.int/mediacentre/factsheets/fs311/en/ [Accessed May 2011]. WICKHAM, M., FAULKS, R. & MILLS, C. Year. In vitro digestion methods for assessing the effect
of food structure on allergen breakdown. In: (IFBIC), J. H. I. R. F. I. I. F. B. C., ed. Workshop on Assessing the Effects of Food Processing on Allergenicity, 2006 Estoril Portugal. 1-15.
WIDMAIER, E. P., RAFF, H. & STRANG, K. T. 2006. Human Physiology. The Mechanisms of Body
Function, Boston, McGraw-Hill International Edition. WOLESENSKY, W., JOERN, A. & LOGAN, J. D. 2005. A model of digestion modulation in
grasshoppers. Ecological Modelling, 188, 358-373. WOLF, B. W., BAUER, L. L. & FAHEY, G. C., JR. 1999. Effects of chemical modification on in
vitro rate and extent of food starch digestion: an attempt to discover a slowly digested starch. J Agric Food Chem, 47, 4178-83.
YOSHII, H., SOOTTITANTAWAT, A., LIU, X.-D., ATARASHI, T., FURUTA, T., AISHIMA, S.,
OHGAWARA, M. & LINKO, P. 2001. Flavor release from spray-dried maltodextrin/gum arabic or soy matrices as a function of storage relative humidity. Innovative Food Science & Emerging Technologies, 2, 55-61.
YURGIN, N., SECNIK, K. & LAGE, M. J. 2008. Obesity and the use of insulin: a study of patients
with type 2 diabetes in the UK. ZHANG, G., AO, Z. & HAMAKER, B. R. 2009. Controlling the delivery of glucose in foods. In:
MCCLEMENTS, D. J. & DECKER, E. A. (eds.) Designing functional foods. Boca Raton: CRC Press.

247
APPENDIX
Published work from this thesis (Proceedings)
I. Monica R. Jaime-Fonseca, Serafim Bakalis and Peter J. Fryer. 2011. Starch
hydrolysis and glucose absorption in the small intestine. ICEF 11 Proceedings.
II. M. R. Jaime-Fonseca, A. Tharakan, I. Norton, P. J. Fryer and S. Bakalis. 2009. An
in-vitro small intestine model for studying absorption of encapsulated actives, ISFRS
2009 Proceedings, 196-199.
III. A. M. Smith, L. M. Grover, M. R. Jaime-Fonseca, F. Yahya, and S. Bakalis. 2009.
Encapsulation and stability of Bioactive Proteins in Gel loaded Liposomes, ISFRS
2009 Proceedings, 564-565.

Appendix I
Starch hydrolysis and glucose absorption in the small intestine. Monica R. Jaime-Fonseca,
Serafim Bakalis and Peter J. Fryer ICEF 11 Proceedings (2011)
Starch Digestion and Glucose Absorption in the Small Intestine Monica R. Jaime Fonsecaa,b, Peter Fryera, Serafim Bakalisa
a School of Chemical Engineering, University of Birmingham, Edgbaston, B152TT, Birmingham, UK
([email protected], [email protected], [email protected]) b Centro de Investigación en Ciencia Aplicada y Tecnología Avanzada del Instituto Politécnico Nacional.
Legaria 694, Irrigación, 11500, México D. F., México ([email protected])
ABSTRACT
The main objective of this work was to understand phenomena occurring during food digestion by using a dynamic in vitro Small Intestine Model (SIM), of particular interest was to study the effect of mixing and food formulation on starch hydrolysis and glucose absorption. The SIM reproduces the characteristic mixing of the human small intestine by expansion and contraction of two cuffs around the external tube. Corn starch hydrolysis was studied in single phase fluids varying the concentration of amylase and the viscosity of digesta by adding guar gum (0.5 %, w/v) under simulated physiological conditions. Results showed the effect of segmentation motion on nutrient delivery to the intestinal wall as a consequence of changes in the mass transfer coefficient. This is most likely due to the increased mixing in the SIM. The rate of glucose absorption was decreased from 0.75 to 0.48 µM/s when guar gum (0.5%, w/v) was added to the corn starch solution. As the viscosity of the solution increased from 2 to 200 mPa.s glucose absorption was reduced up to 50%. Experiments of starch digestion in the SIM, with and without the presence of guar, have shown that guar reduces the rate of starch digestion by impairing mixing and reducing diffusion within the fluid. This research has demonstrated the capability of using an in vitro rig to simulate and obtain an engineering understanding of transport phenomena occurring in the small intestine leading to absorption of active components. Current work is aimed at developing a reaction engineering understanding of the gastrointestinal tract. Keywords: Starch hydrolysis; digestion; absorption; glucose; small intestine. INTRODUCTION
When refined sugars and rapidly digested carbohydrate are included on a regular basis in our diets, blood glucose and insulin responses are usually enhanced, resulting in dietary related chronic diseases such as diabetes and obesity [1-4]. To avoid this scenario, structured foods with specific health benefits should be designed in conjunction with studies to understand how food formulation impacts on digestion and absorption rates in the gastrointestinal tract (GIT). Digestion is a very complex process at which the small intestine is a key step responsible for most of the active molecules absorption. To understand and reproduce this process, in vitro and in silica models have been designed [5-7]. Nevertheless, details of flow dynamics and mixing have not been extensively studied. Mixing of lumen contents is essential in enhancing food digestion and absorption. Intestinal motility allows interactions between food and pancreatic digestive enzymes and biliary salts that enable food digestion. Intestinal absorption is also influenced by the physical form of the food ingested and the physical properties (viscosity, density, concentration, flow rate) of the lumen content. It has been reported that increasing viscosity of the lumen content, for example, could reduce the nutrient absorption through the epithelium reducing glucose levels in blood [2,3]. Addition of viscous fibers into the food not only increases the viscosity of the lumen but also may protect starch from enzymatic attack. Overall, by changing food formulation, the rate of nutrients absorption could be modified resulting in structured food with a health benefits for the consumer. The main objective of this work was to reproduce and model starch digestion by studying the effect of mixing and viscosity on glucose absorption rate. Digestion and absorption were studied by using a dynamic small intestine model simulated the physiological conditions of the human small intestine.
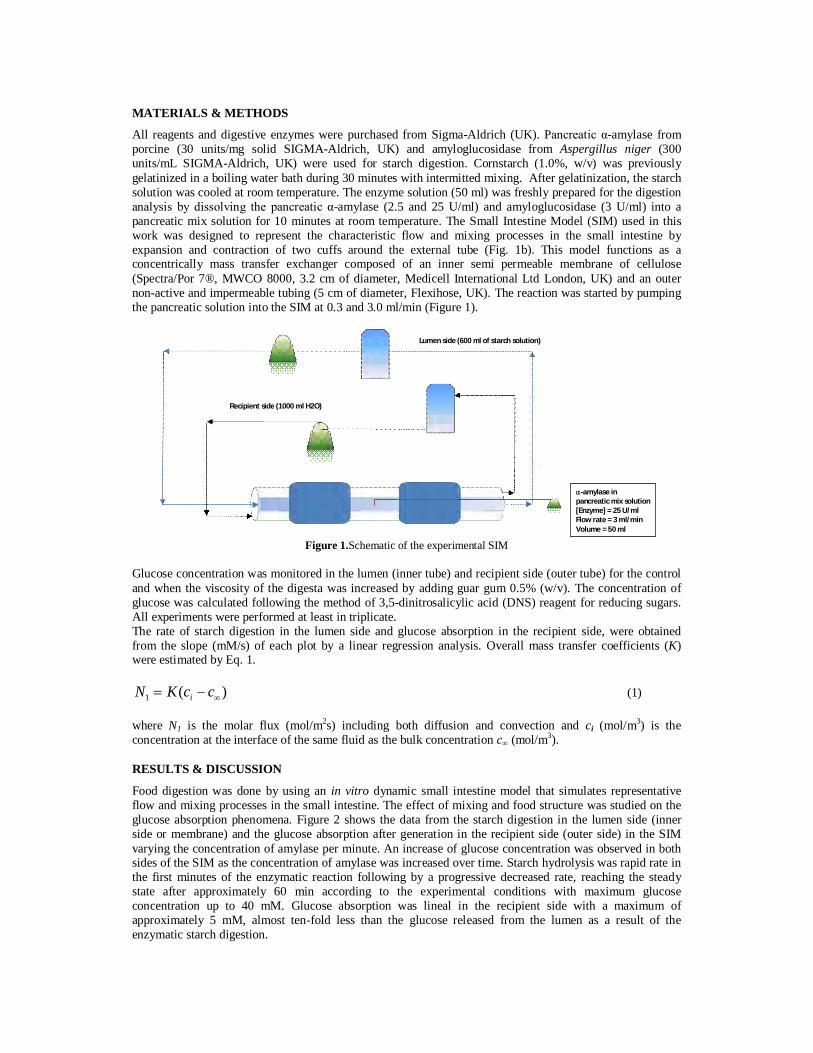
MATERIALS & METHODS
All reagents and digestive enzymes were purchased from Sigma-Aldrich (UK). Pancreatic α-amylase from porcine (30 units/mg solid SIGMA-Aldrich, UK) and amyloglucosidase from Aspergillus niger (300 units/mL SIGMA-Aldrich, UK) were used for starch digestion. Cornstarch (1.0%, w/v) was previously gelatinized in a boiling water bath during 30 minutes with intermitted mixing. After gelatinization, the starch solution was cooled at room temperature. The enzyme solution (50 ml) was freshly prepared for the digestion analysis by dissolving the pancreatic α-amylase (2.5 and 25 U/ml) and amyloglucosidase (3 U/ml) into a pancreatic mix solution for 10 minutes at room temperature. The Small Intestine Model (SIM) used in this work was designed to represent the characteristic flow and mixing processes in the small intestine by expansion and contraction of two cuffs around the external tube (Fig. 1b). This model functions as a concentrically mass transfer exchanger composed of an inner semi permeable membrane of cellulose (Spectra/Por 7®, MWCO 8000, 3.2 cm of diameter, Medicell International Ltd London, UK) and an outer non-active and impermeable tubing (5 cm of diameter, Flexihose, UK). The reaction was started by pumping the pancreatic solution into the SIM at 0.3 and 3.0 ml/min (Figure 1).
-amylase in pancreatic mix solution [Enzyme] = 25 U/ml Flow rate = 3 ml/min Volume = 50 ml
Lumen side (600 ml of starch solution)
Recipient side (1000 ml H2O)
Figure 1.Schematic of the experimental SIM
Glucose concentration was monitored in the lumen (inner tube) and recipient side (outer tube) for the control and when the viscosity of the digesta was increased by adding guar gum 0.5% (w/v). The concentration of glucose was calculated following the method of 3,5-dinitrosalicylic acid (DNS) reagent for reducing sugars. All experiments were performed at least in triplicate. The rate of starch digestion in the lumen side and glucose absorption in the recipient side, were obtained from the slope (mM/s) of each plot by a linear regression analysis. Overall mass transfer coefficients (K) were estimated by Eq. 1.
)(1 ccKN i (1) where N1 is the molar flux (mol/m2s) including both diffusion and convection and ci (mol/m3) is the concentration at the interface of the same fluid as the bulk concentration c∞ (mol/m3). RESULTS & DISCUSSION
Food digestion was done by using an in vitro dynamic small intestine model that simulates representative flow and mixing processes in the small intestine. The effect of mixing and food structure was studied on the glucose absorption phenomena. Figure 2 shows the data from the starch digestion in the lumen side (inner side or membrane) and the glucose absorption after generation in the recipient side (outer side) in the SIM varying the concentration of amylase per minute. An increase of glucose concentration was observed in both sides of the SIM as the concentration of amylase was increased over time. Starch hydrolysis was rapid rate in the first minutes of the enzymatic reaction following by a progressive decreased rate, reaching the steady state after approximately 60 min according to the experimental conditions with maximum glucose concentration up to 40 mM. Glucose absorption was lineal in the recipient side with a maximum of approximately 5 mM, almost ten-fold less than the glucose released from the lumen as a result of the enzymatic starch digestion.

Figure 2. Digestion in the SIM, (a) starch digestion in lumen and (b) glucose absorption in recipient side.
Table 1 shows the rate of digestion of starch and glucose absorption calculated from a linear regression of the data plot in Fig. 2. The Overall Mass Transfer coefficients were estimated from the flux of the lumen to the recipient side with the concentration difference at the maximum concentration reached at the steady state in the lumen.
Table 1. Digestion and absorption rates for the experimental conditions.
Experiment Digestion (µM/s) Absorption (µM/s) Overall Mass Transfer Coefficient (µm/s) 2.5 U at 0.3 ml/min 6.91 ± 1.23 0.40 ± 0.04 0.33 ± 0.03 25.0 U at 0.3 ml/min 9.22 ± 2.34 0.49 ± 0.21 0.35 ± 0.09 2.5 U at 3.0 ml/min 8.43 ± 0.78 0.51 ± 0.01 0.38 ± 0.05 25.0 U at 3.0 ml/min 54.55 ± 2.11 0.48 ± 0.05 0.30 ± 0.02 The rate of starch hydrolysis increased up to 90% as the concentration of enzyme increased ten-fold in the lumen side, reaching the maximum value at 25.0 U and 3.0 ml/min while the minimum was observed for the lowest concentration of enzyme at 2.5 U and 0.3 ml/min. Results in the lumen also indicated that there was no significant difference between the starch hydrolysis rates when the concentration of enzyme per ml of digesta was identical. This implies that no matter how fast or concentrated the pancreatic solution is feeding into the SIM if the units of enzyme per time per volume are the same, the hydrolysis will take place at similar rates of reaction in well-mixed solutions with viscosities like water. The increase of enzyme concentration per ml of digesta markedly increased the hydrolysis of starch but had little effect on glucose absorption (Table 1). The glucose profiles in the recipient side appeared to be linear. No appreciable amounts of glucose were detected at the beginning of the experiment. From the highest enzyme concentration, the change in glucose was detectable at 30 min into the recipient. However, there was a “delay” in glucose absorption (from 30 to 60 min) when the rate of starch digestion decreased. Once glucose was generated and released from the starch structure in the lumen side, absorption took place. Interestingly, this could be correlated to the point where viscosity of the starch solution falls in the lumen. Effect of food formulation
In Figure 3 glucose absorption data are shown for products having different viscosities in the lumen side. Absorption appeared to be linear (R2 of 0.95) resulting in a gradient of 7.45 x 10⁻³ mM/s. The flux, N, was calculated to be 1.55 x 10⁻⁵ mol/m2s. By dividing the molar flux by the concentration difference in mmol/m3 an overall mass transfer coefficient, K, was obtained as 4.83 x 10⁻⁷ m/s for the aqueous starch solution and 3.10 x 10⁻⁷ m/s for the starch solution added with guar both under segmentation conditions.
Time (min)
0 20 40 60 80 100 120 140 160 180 200
Cha
nge
in g
luco
se (m
M)
0
1
2
3
4
5
6
2.5 U at 0.3 ml/min 25.0 U at 0.3 ml/min 2.5 U at 3.0 ml/min 25.0 U at 3.0 ml/min
Time (min)
0 20 40 60 80 100 120 140 160 180 200
Cha
nge
in g
luco
se (m
M)
0
10
20
30
40
2.5 U at 0.3 ml/min 25.0 U at 0.3 ml/min 2.5 U at 3.0 ml/min 25.0 U at 3.0 ml/min
(a) (b)

Figure 3. Glucose absorption levels in the side of the SIM, with (0.5%, w/v) and without guar gum for two food models (a) corn starch and (b) white bread.
The effect of the presence of guar was shown by 36% reduction in the mass transfer coefficient when mixing was applied (Table 2). The data not only suggest that the rate of enzymatic reactions was reduced when guar was added but also that viscous solutions can delay the access of actives to the absorptive epithelium due to decrease of both propulsion and mixing [2]. Similarly, this tendency was observed when bread digestion was mimicked in an aqueous solution (control) and in the presence of guar. When viscosity of the lumen content was increased from 2 to 200 mPa.s, glucose absorption was reduced almost 15% after one hour, however, no significant difference was observed at the first minutes of digestion (Fig 1b). While the overall mass transfer coefficient from bread with guar gum was reduce 20%. These results are in agreement to those reported for Tharakan et al. [7].
Table 2. Rates of absorption and mass transfer coefficients for two food models.
Experiment Absorption (µM/s) Overall Mass Transfer Coefficient (µm/s) 1. Starch solution Control 0.75 ± 0.05 0.48 ± 0.05 Guar gum (0.5%, w/v) 0.48 ± 0.02 0.31 ± 0.08 2. Bread Control 0.67 ± 0.01 0.43 ± 0.04 Guar gum (0.5%, w/v) 0.50 ± 0.02 0.32 ± 0.02 Overall mass transfer coefficient was reduced when guar gum (0.5%, w/v) was added to the solution of starch and bread. That could be explained by inhibition of propulsion and mixing in the membrane making interactions between the starch and amylase also difficult. Thus, starch digestion was lower in the presence of guar. Results suggested that molecular delivery is largely influenced by the fluid dynamics of the lumen side. Viscous polymers create a physical resistance for actives release and delivery that could modified the rate of nutrients absorption for the design of healthy diets with specific targets. From the starch digestion experiment it was possible to show the effect that segmentation motion and food formulation had on nutrient delivery to the intestinal wall as a consequence of changes in the mass transfer coefficient. On the other hand, the rate of food digestion might be important in assessing the extension at which they raise the blood glucose levels in normal and diabetic people [8].
Time (min)
0 20 40 60 80 100 120 140
Cha
nge
in g
luco
se (m
mol
/l)
0
1
2
3
4
5
Bread (50 g)Bread + Guar (0.5%, w/v)
Time (min)
0 20 40 60 80 100
Cha
nge
in g
luco
se (m
mol
/l)
0
1
2
3
4
5
Starch (1%,w/v) Starch + Guar (0.5%,w/v)
(b) (a)
ACKNOWLEDGMENTS
This project was partially supported by the Programme Alßan, the European Union Programme of High Level Scholarships for Latin America, scholarship number E07D402060MX and by the Mexican National Council for Science and Technology (CONACYT), scholarship number 230576. Thanks also to Hanna Siahaan for her contribution to this study. CONCLUSION
This research has demonstrated the capability of using an in vitro rig to simulate and obtain an engineering understanding of transport phenomena occurring in the small intestine leading to absorption of active components. Current work is aimed at developing a reaction engineering understanding of the GIT. Using an in-vitro system it was demonstrated that increasing the viscosity of food digesta results in a reduced the concentration of nutrients available for absorption. REFERENCES [1] Norton I., Fryer P. & Moore S. 2006. Product/Process Integration in Food Manufacture: Engineering Sustained
Health. AIChE Journal 52(5), 1632-1640. [2] Read N.W. & Welch I. McL. 1985. Reduction of Postprandial Glycaemia by Dietary Manipulation. In: Hunter J.O. &
Alun Jones V. (Eds.). Food and the Gut. Balliére Tindall, London, UK. [3] Blackburn N. A., et al. 1984. The Mechanism of Action of Guar Gum in Improving Glucose-Tolerance in Man.
Clinical Science. 66(3), 329-336. [4] Englyst K.N., et al. 1999. Rapidly available glucose in foods: an in vitro measurement that reflects the glycemic
response. American Journal of Clinical Nutrition 69(3), 448-454. [5] Stoll B. R., et al. 2000. A theory of molecular absorption from the small intestine. Chemical Engineering Science. 55
(3) 473-489. [6] Minekus M., et al., 2005. Effect of partially hydrolyzed guar gum (PHGG) on the bioaccessibility of fat and
cholesterol. Bioscience Biotechnology Biochemistry. 69(5), 932–938. [7] Tharakan A., Norton I.T., Fryer P.J. & Bakalis S. 2010. Mass Transfer and Nutrient Absorption in a Simulated Model
of Small Intestine. Journal of Food Science. 75(6), E339-E346. [8] Jenkins D.J.A., et al. 1982. Relationship between rate of digestion of foods and post-prandial glycemia. Diabetologia
22(6):450–5.
Appendix II
An in-vitro small intestine model for studying absorption of encapsulated actives. M. R.
Jaime-Fonseca, A. Tharakan, I. Norton, P. J. Fryer and S. Bakalis. ISFRS 2009 Proceedings,
196-199 (2009)
5th International Symposium on Food Rheology and Structure
196
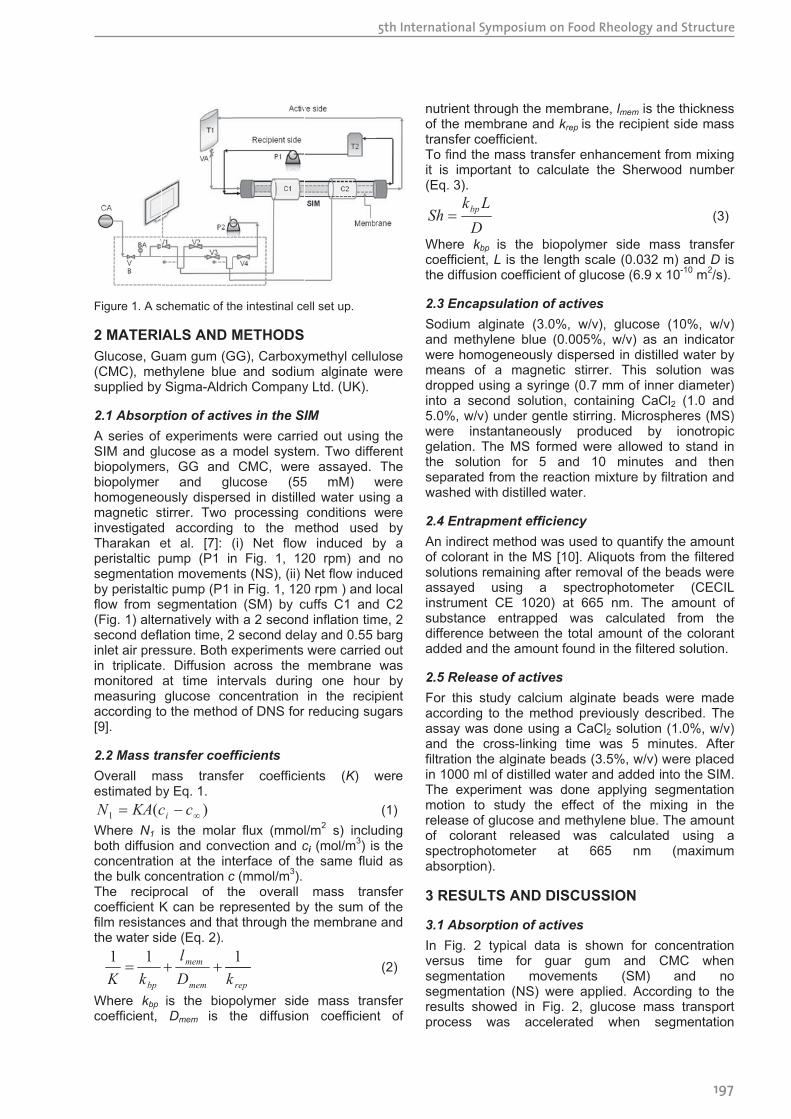
5th International Symposium on Food Rheology and Structure
197

5th International Symposium on Food Rheology and Structure
198

5th International Symposium on Food Rheology and Structure
199

260
Appendix III
Encapsulation and stability of Bioactive Proteins in Gel loaded Liposomes. A. M. Smith, L.
M. Grover, M. R. Jaime-Fonseca, F. Yahya, and S. Bakalis. ISFRS Proceedings, 564-565.
(2009)
5th International Symposium on Food Rheology and Structure
564
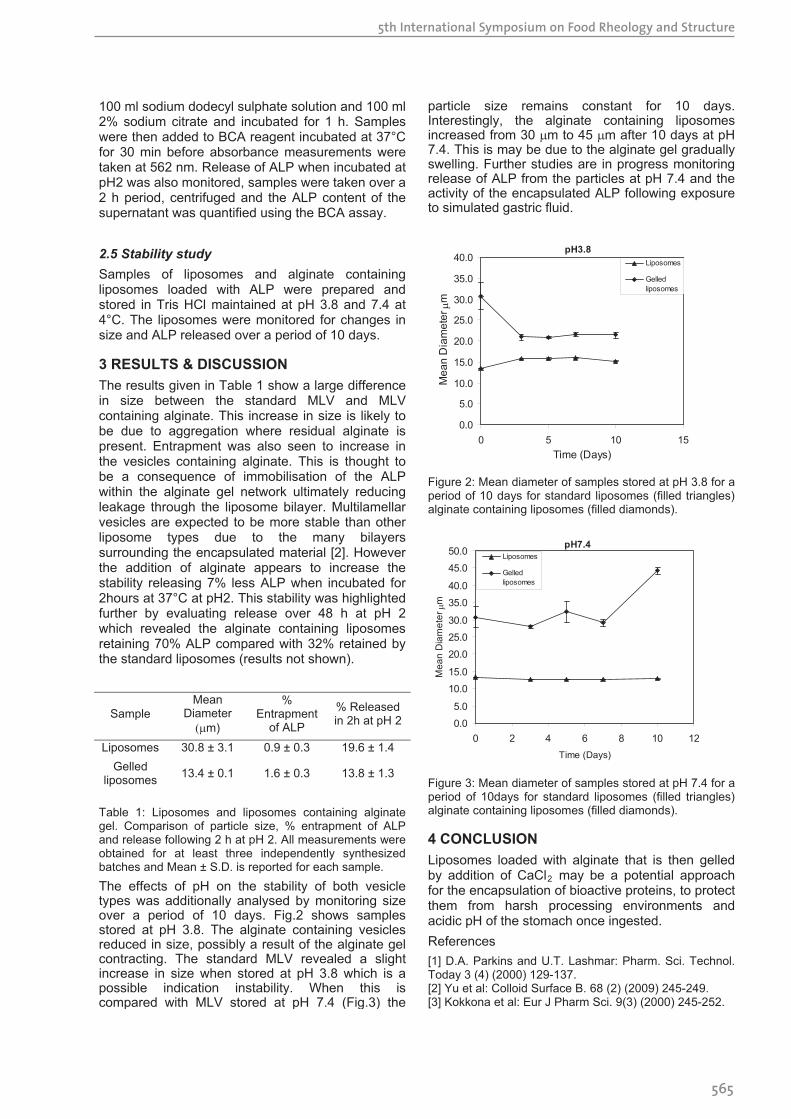
5th International Symposium on Food Rheology and Structure
565