an end to boring data with visualizations in python
TRANSCRIPT

HEATHER SHAPIRO
TECHNICAL EVANGELIST, MICROSOFT
@microheather
An End to Boring DataWith Visualizations in Python
What will we cover?•Why data visualizations are important
•Case study on NYC Restaurant Ratings
•What libraries in python work best for
different types of graphs
HEATHER SHAPIRO | TECHNICAL EVANGELIST, MICROSOFT
@microheather
@microheatherHEATHER SHAPIRO | TECHNICAL EVANGELIST, MICROSOFT
@microheather
Why we need data viz
HEATHER SHAPIRO | TECHNICAL EVANGELIST, MICROSOFT
@microheather
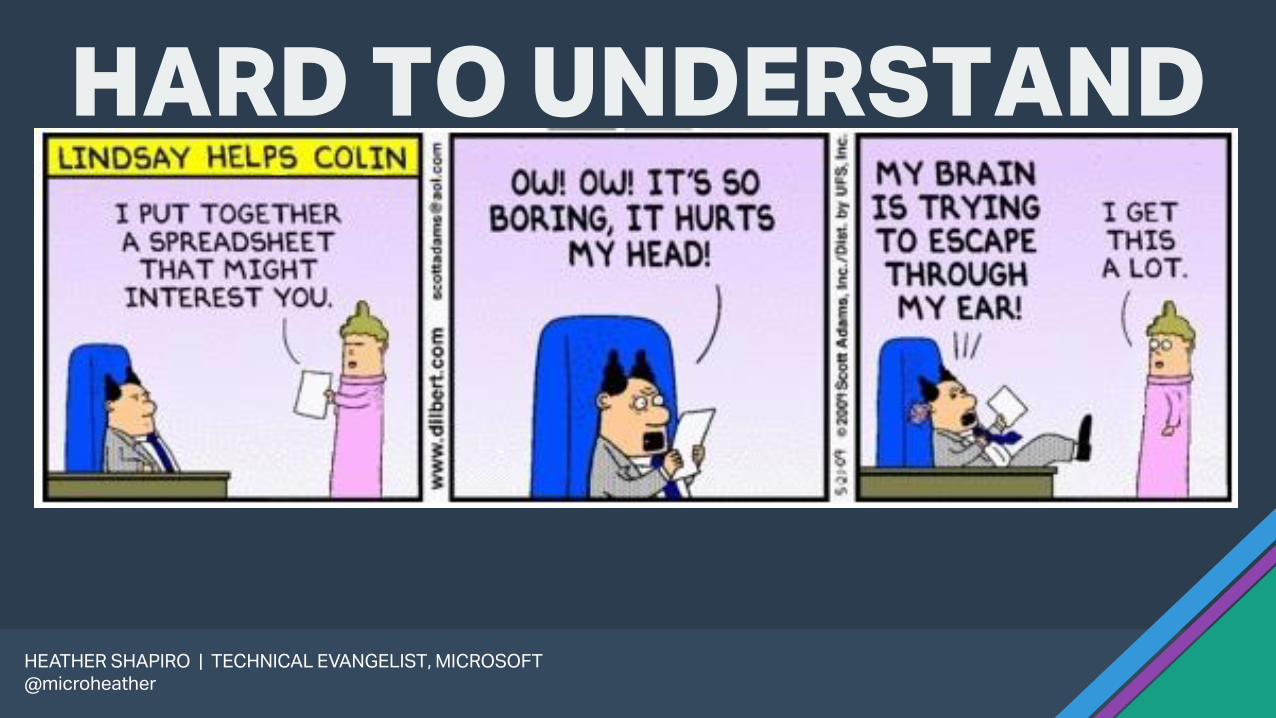
HARD TO UNDERSTAND
HEATHER SHAPIRO | TECHNICAL EVANGELIST, MICROSOFT
@microheather
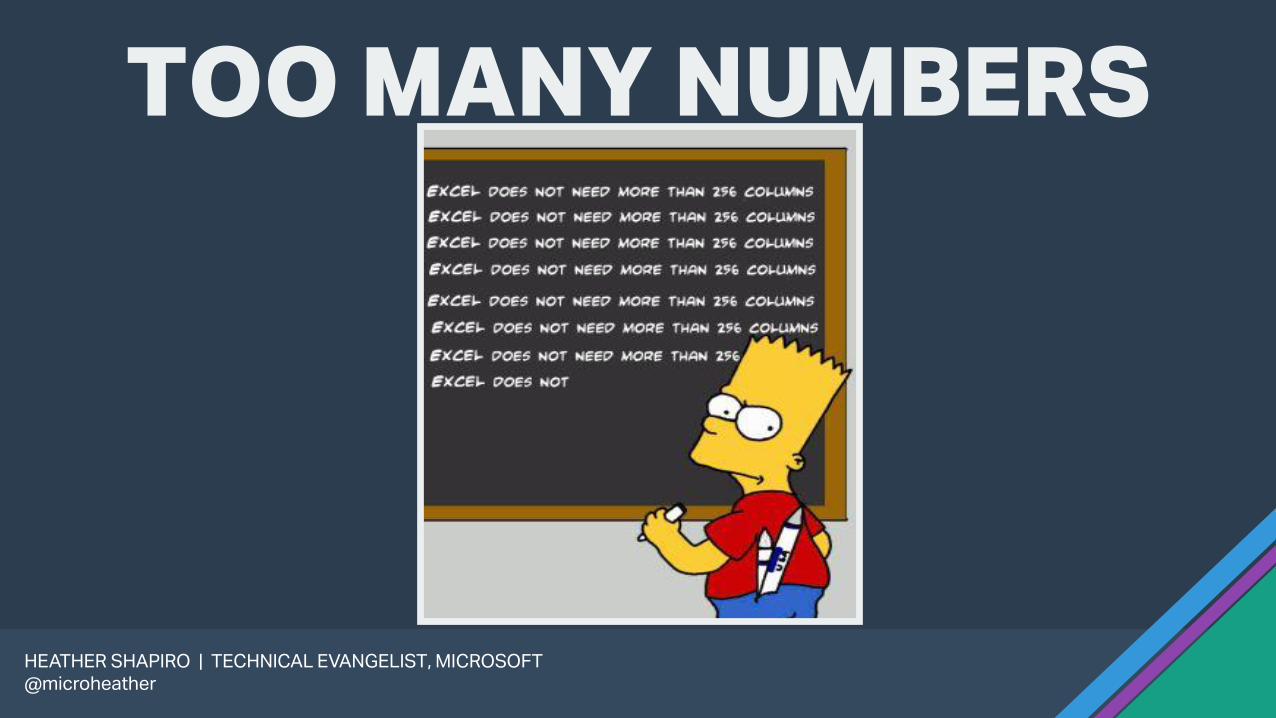
TOO MANY NUMBERS

@microheatherHEATHER SHAPIRO | TECHNICAL EVANGELIST, MICROSOFT
@microheather
BORING MEETINGS

@microheatherHEATHER SHAPIRO | TECHNICAL EVANGELIST, MICROSOFT
@microheather
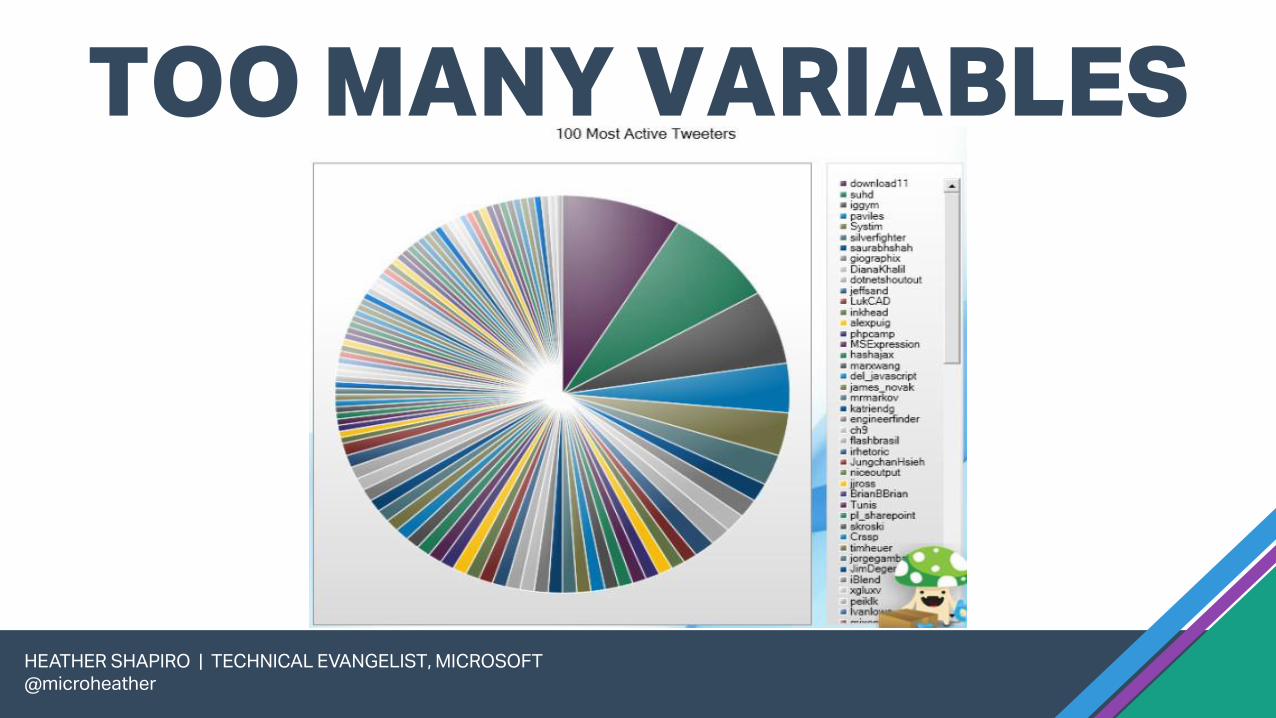
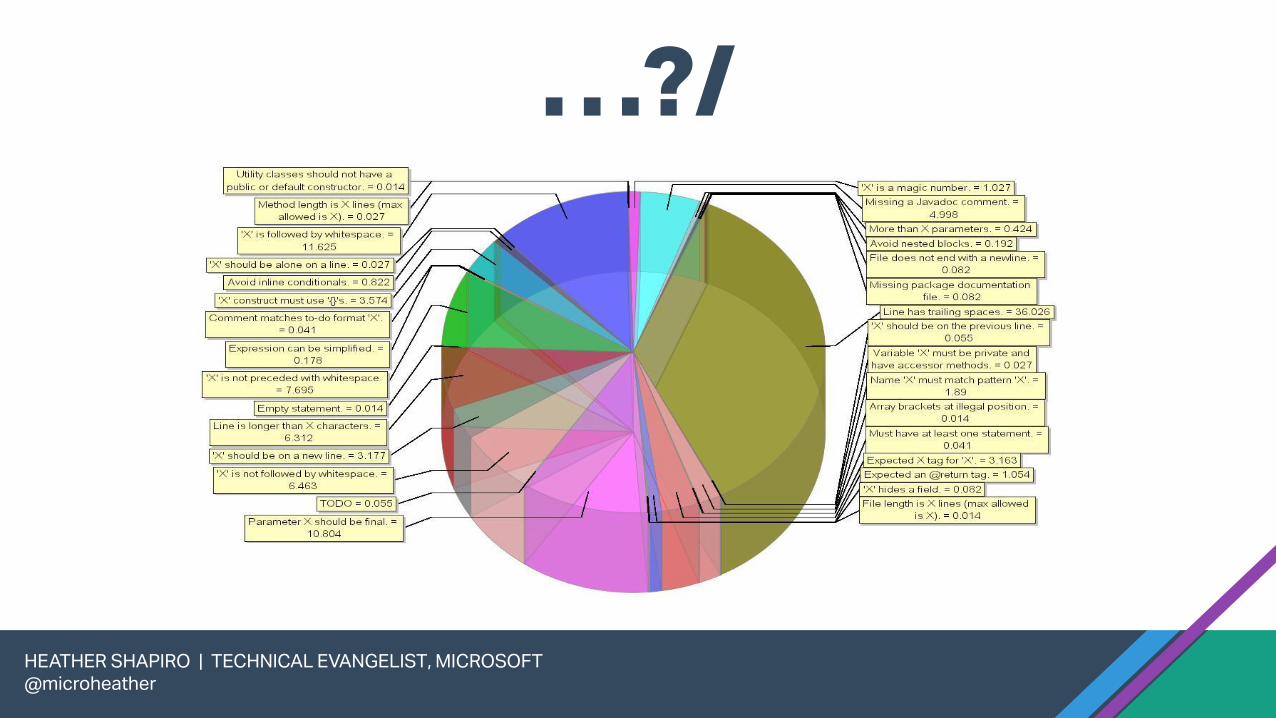
Visualizations gone wrong
@microheatherHEATHER SHAPIRO | TECHNICAL EVANGELIST, MICROSOFT
@microheather
TOO MANY VARIABLES
@microheatherHEATHER SHAPIRO | TECHNICAL EVANGELIST, MICROSOFT
@microheather
…?/
What data viz provides•Helps the visual learner
•Makes sense of tremendous amounts of data
•Helps walk through a problem
•Tells a story in seconds
HEATHER SHAPIRO | TECHNICAL EVANGELIST, MICROSOFT
@microheather
@microheatherHEATHER SHAPIRO | TECHNICAL EVANGELIST, MICROSOFT
@microheather

@microheatherHEATHER SHAPIRO | TECHNICAL EVANGELIST, MICROSOFT
@microheather
CASE STUDYNYC Restaurant Ratings

HEATHER SHAPIRO | TECHNICAL EVANGELIST, MICROSOFT
@microheather

HEATHER SHAPIRO | TECHNICAL EVANGELIST, MICROSOFT
@microheather

@microheatherHEATHER SHAPIRO | TECHNICAL EVANGELIST, MICROSOFT
@microheather
@microheatherHEATHER SHAPIRO | TECHNICAL EVANGELIST, MICROSOFT
@microheather
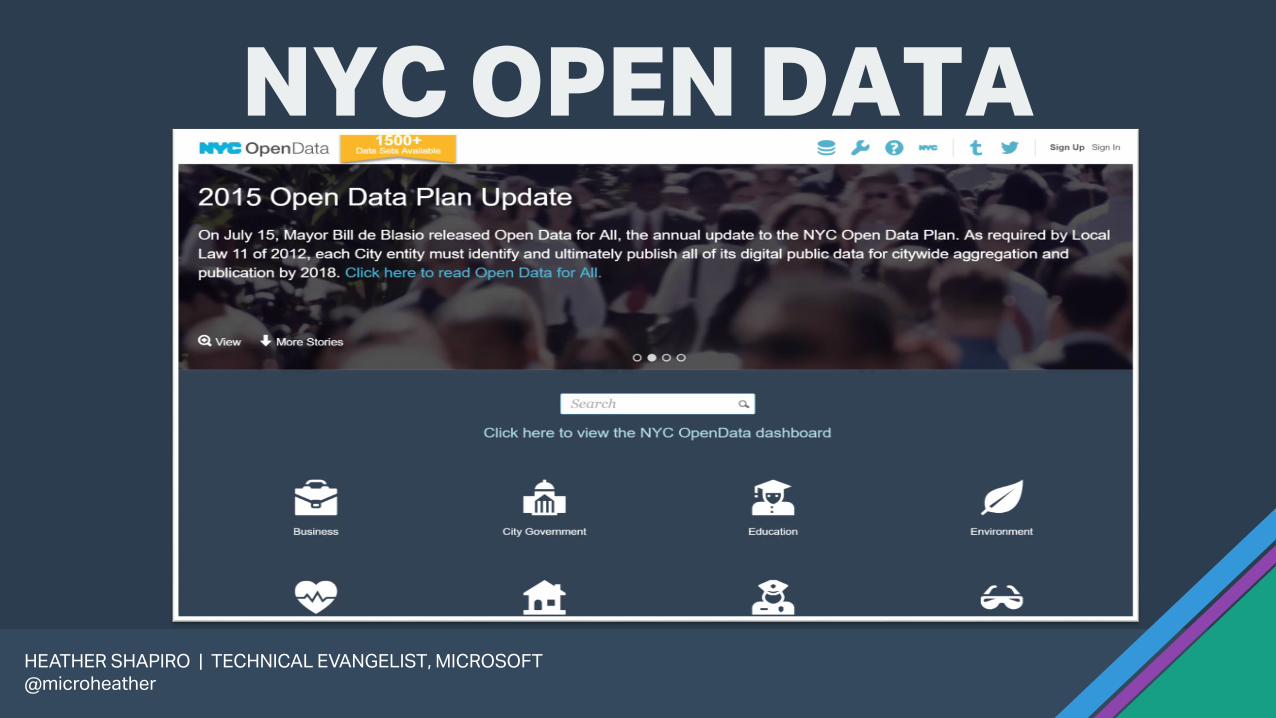
NYC OPEN DATA
@microheather
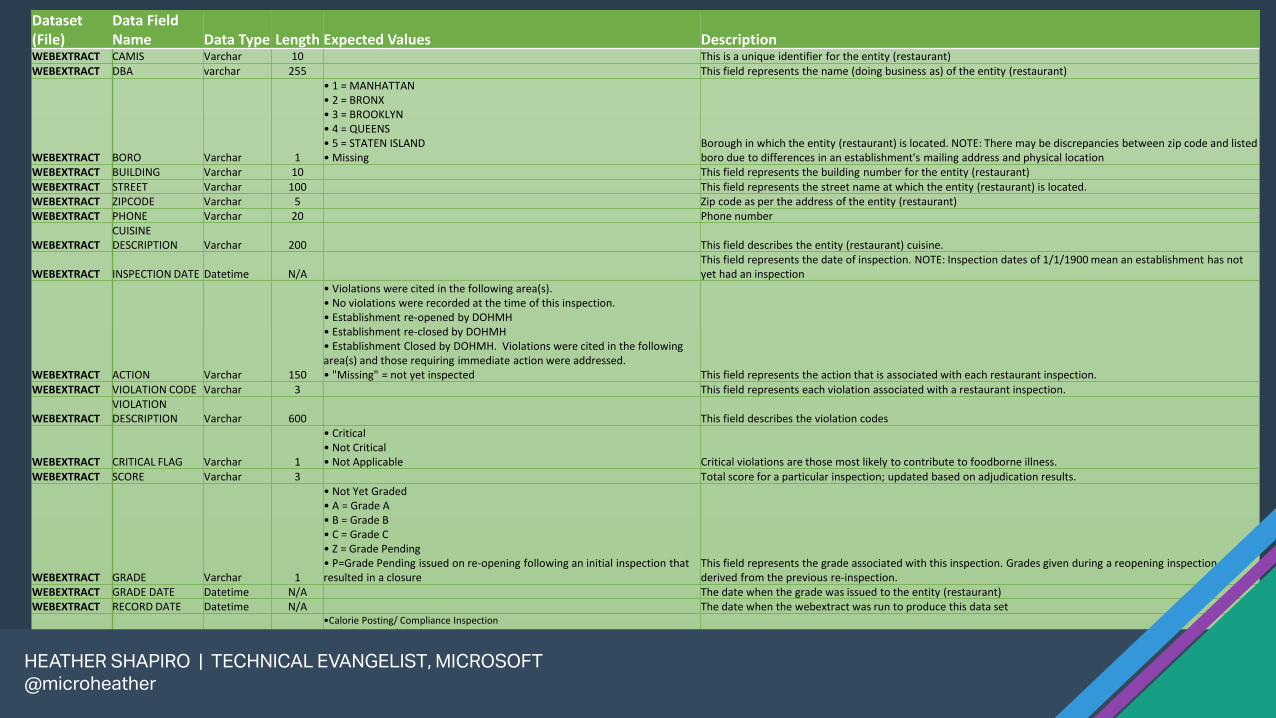
Dataset (File)
Data Field Name Data Type Length Expected Values Description
WEBEXTRACT CAMIS Varchar 10 This is a unique identifier for the entity (restaurant)WEBEXTRACT DBA varchar 255 This field represents the name (doing business as) of the entity (restaurant)
WEBEXTRACT BORO Varchar 1
• 1 = MANHATTAN• 2 = BRONX• 3 = BROOKLYN• 4 = QUEENS• 5 = STATEN ISLAND• Missing
Borough in which the entity (restaurant) is located. NOTE: There may be discrepancies between zip code and listed boro due to differences in an establishment's mailing address and physical location
WEBEXTRACT BUILDING Varchar 10 This field represents the building number for the entity (restaurant)WEBEXTRACT STREET Varchar 100 This field represents the street name at which the entity (restaurant) is located.WEBEXTRACT ZIPCODE Varchar 5 Zip code as per the address of the entity (restaurant)WEBEXTRACT PHONE Varchar 20 Phone number
WEBEXTRACTCUISINE DESCRIPTION Varchar 200 This field describes the entity (restaurant) cuisine.
WEBEXTRACT INSPECTION DATE Datetime N/AThis field represents the date of inspection. NOTE: Inspection dates of 1/1/1900 mean an establishment has not yet had an inspection
WEBEXTRACT ACTION Varchar 150
• Violations were cited in the following area(s).• No violations were recorded at the time of this inspection.• Establishment re-opened by DOHMH• Establishment re-closed by DOHMH• Establishment Closed by DOHMH. Violations were cited in the following area(s) and those requiring immediate action were addressed.• "Missing" = not yet inspected This field represents the action that is associated with each restaurant inspection.
WEBEXTRACT VIOLATION CODE Varchar 3 This field represents each violation associated with a restaurant inspection.
WEBEXTRACTVIOLATION DESCRIPTION Varchar 600 This field describes the violation codes
WEBEXTRACT CRITICAL FLAG Varchar 1
• Critical• Not Critical• Not Applicable Critical violations are those most likely to contribute to foodborne illness.
WEBEXTRACT SCORE Varchar 3 Total score for a particular inspection; updated based on adjudication results.
WEBEXTRACT GRADE Varchar 1
• Not Yet Graded• A = Grade A• B = Grade B• C = Grade C• Z = Grade Pending• P=Grade Pending issued on re-opening following an initial inspection that resulted in a closure
This field represents the grade associated with this inspection. Grades given during a reopening inspection are derived from the previous re-inspection.
WEBEXTRACT GRADE DATE Datetime N/A The date when the grade was issued to the entity (restaurant)WEBEXTRACT RECORD DATE Datetime N/A The date when the webextract was run to produce this data set
•Calorie Posting/ Compliance Inspection•Calorie Posting/Initial Inspection•Calorie Posting/ Re-Inspection•Calorie Posting/ Second Compliance Inspection•Cycle Inspection/Compliance Inspection•Cycle Inspection/Initial Inspection•Cycle Inspection/Re-Inspection•Cycle Inspection/Reopening Inspection•Cycle Inspection/Second Compliance Inspection
HEATHER SHAPIRO | TECHNICAL EVANGELIST, MICROSOFT
@microheather

@microheatherHEATHER SHAPIRO | TECHNICAL EVANGELIST, MICROSOFT
@microheather

• Load modules
• Load Restaurant Rating Data
• Understand the data
• Visualize
@microheatherHEATHER SHAPIRO | TECHNICAL EVANGELIST, MICROSOFT
@microheather
Steps Taken

• Pandas
• Matplotlib
• Basemap
• Folium
• Seaborn
• Bokeh
• Plot.ly
@microheatherHEATHER SHAPIRO | TECHNICAL EVANGELIST, MICROSOFT
@microheather
TOOLS USED

@microheatherHEATHER SHAPIRO | TECHNICAL EVANGELIST, MICROSOFT
@microheather
GETTING STARTED

@microheatherHEATHER SHAPIRO | TECHNICAL EVANGELIST, MICROSOFT
@microheather
PANDAS
@microheatherHEATHER SHAPIRO | TECHNICAL EVANGELIST, MICROSOFT
@microheather
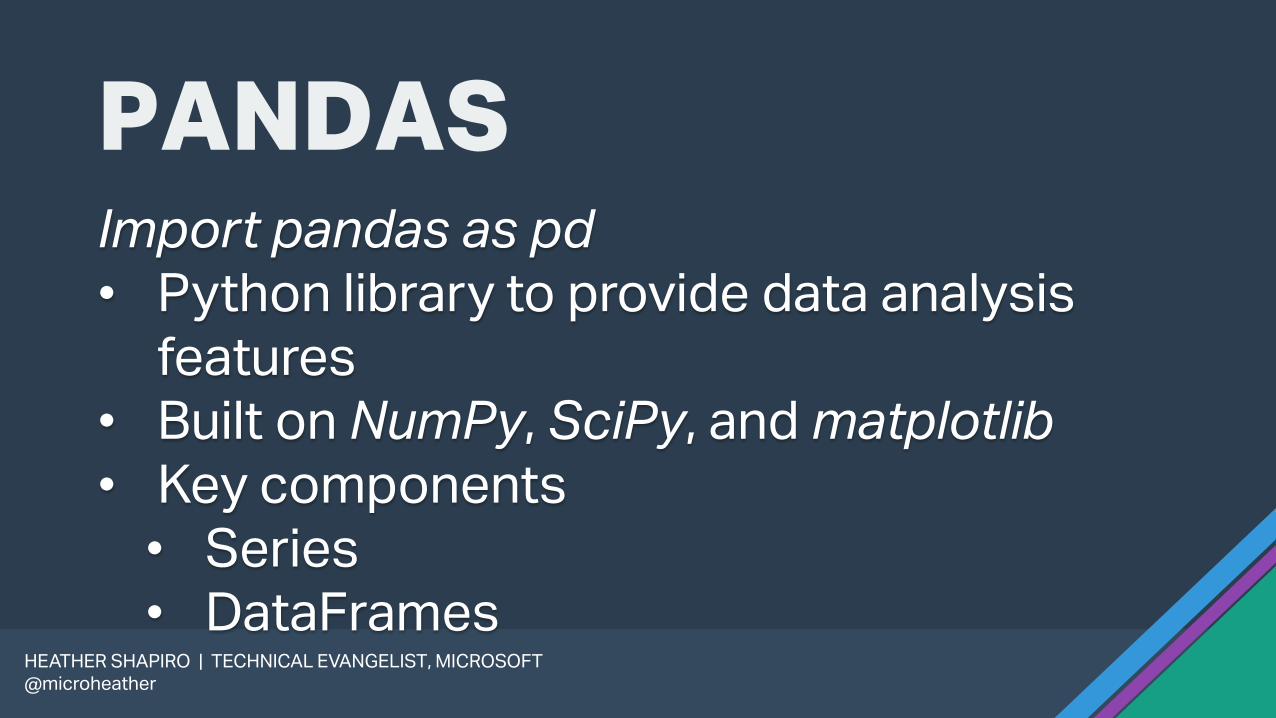
PANDASImport pandas as pd
• Python library to provide data analysis
features
• Built on NumPy, SciPy, and matplotlib
• Key components
• Series
• DataFrames

@microheatherHEATHER SHAPIRO | TECHNICAL EVANGELIST, MICROSOFT
@microheather
LIBRARIES FOR STATISTICAL GRAPHS

@microheatherHEATHER SHAPIRO | TECHNICAL EVANGELIST, MICROSOFT
@microheather
@microheatherHEATHER SHAPIRO | TECHNICAL EVANGELIST, MICROSOFT
@microheather
MATPLOTLIBimport matplotlib.pyplot as plt
• MATLAB-like plotting framework
@microheatherHEATHER SHAPIRO | TECHNICAL EVANGELIST, MICROSOFT
@microheather
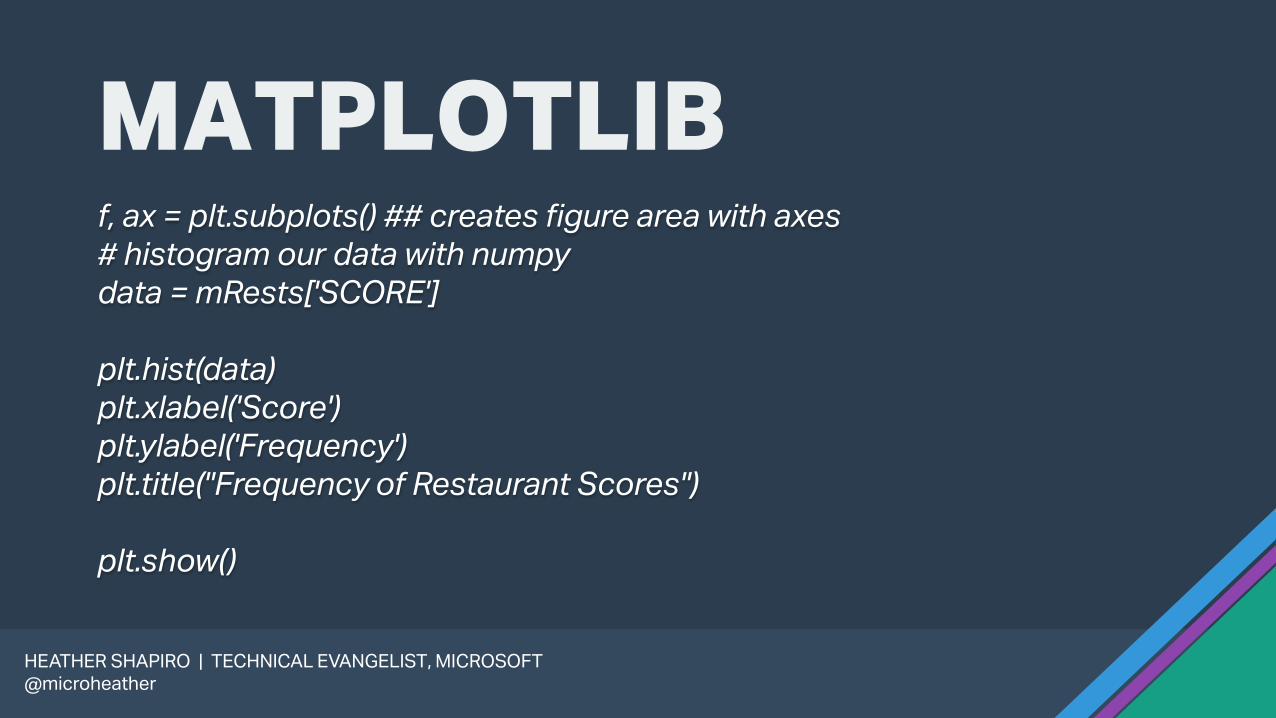
MATPLOTLIBf, ax = plt.subplots() ## creates figure area with axes
# histogram our data with numpy
data = mRests['SCORE']
plt.hist(data)
plt.xlabel('Score')
plt.ylabel('Frequency')
plt.title("Frequency of Restaurant Scores")
plt.show()

@microheatherHEATHER SHAPIRO | TECHNICAL EVANGELIST, MICROSOFT
@microheather
MATPLOTLIB

@microheatherHEATHER SHAPIRO | TECHNICAL EVANGELIST, MICROSOFT
@microheather
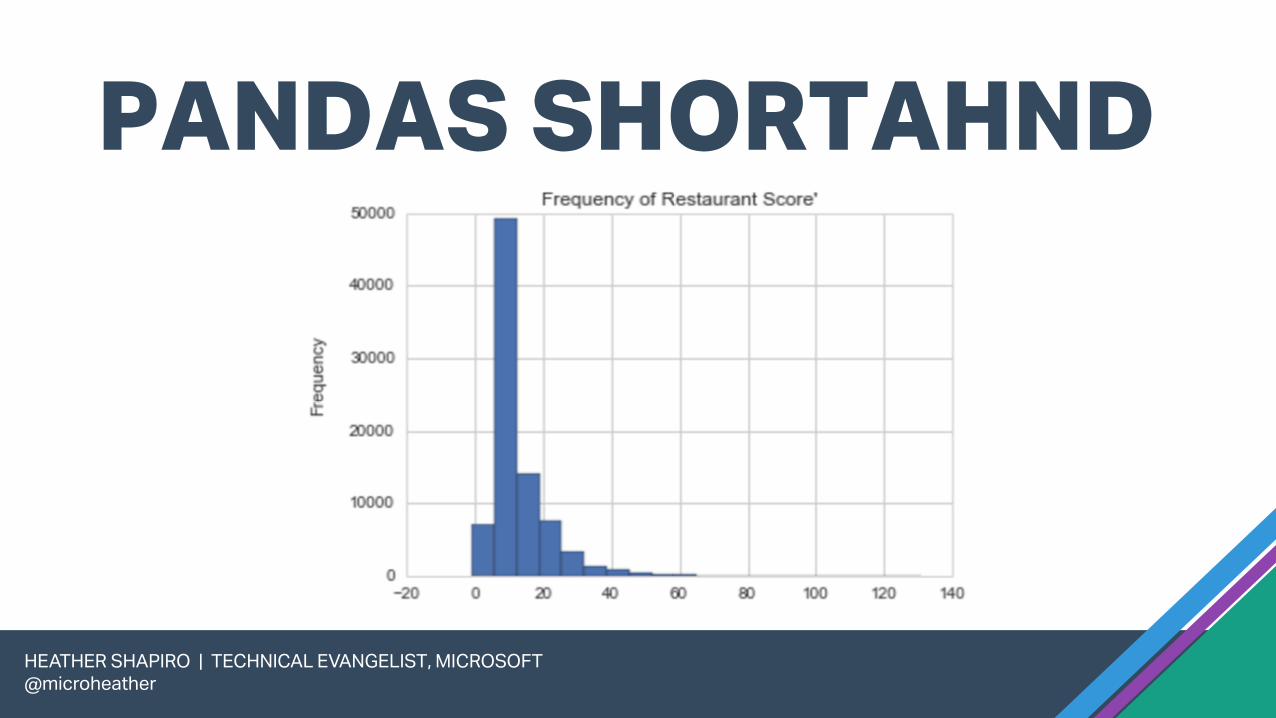
PANDAS SHORTHANDmRests["SCORE"].hist(bins=20)
plt.title("Frequency of Restaurant Score'")
@microheatherHEATHER SHAPIRO | TECHNICAL EVANGELIST, MICROSOFT
@microheather
PANDAS SHORTAHND

@microheatherHEATHER SHAPIRO | TECHNICAL EVANGELIST, MICROSOFT
@microheather
@microheatherHEATHER SHAPIRO | TECHNICAL EVANGELIST, MICROSOFT
@microheather
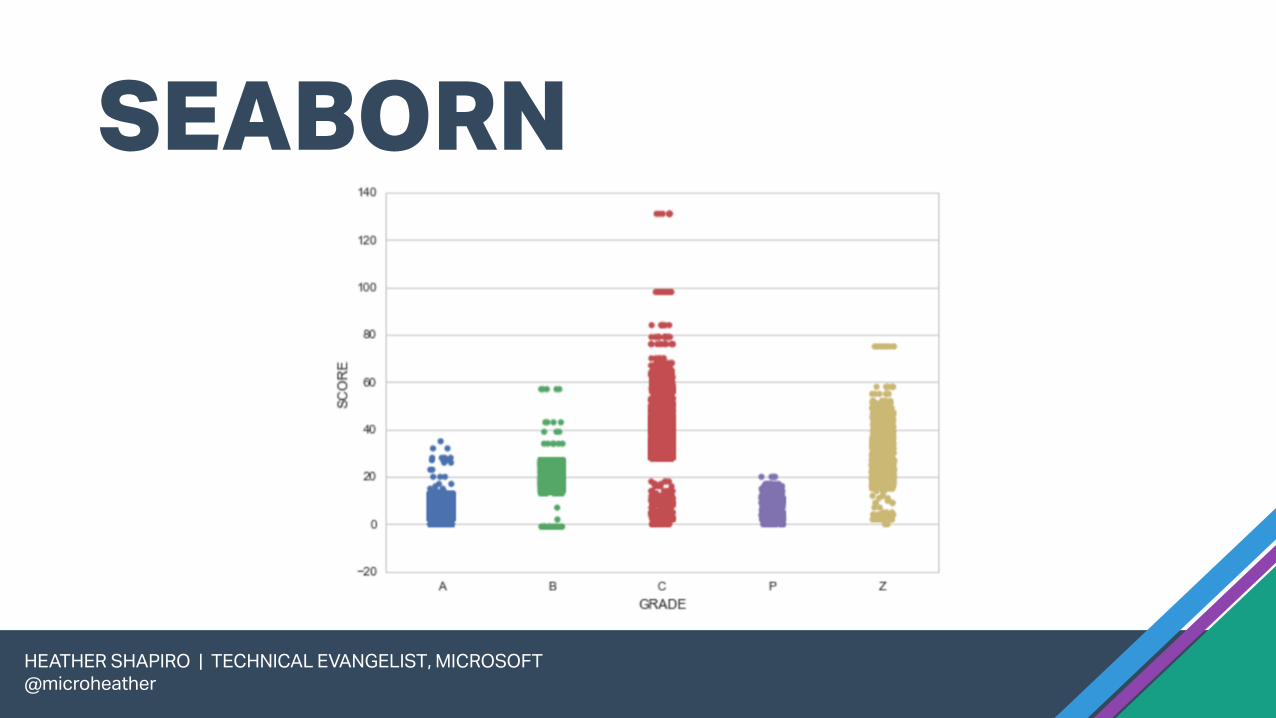
SEABORNImport seaborn
• Built on top of matplotlib
• Creates more sophisticated graphs
• Look more professional
@microheatherHEATHER SHAPIRO | TECHNICAL EVANGELIST, MICROSOFT
@microheather
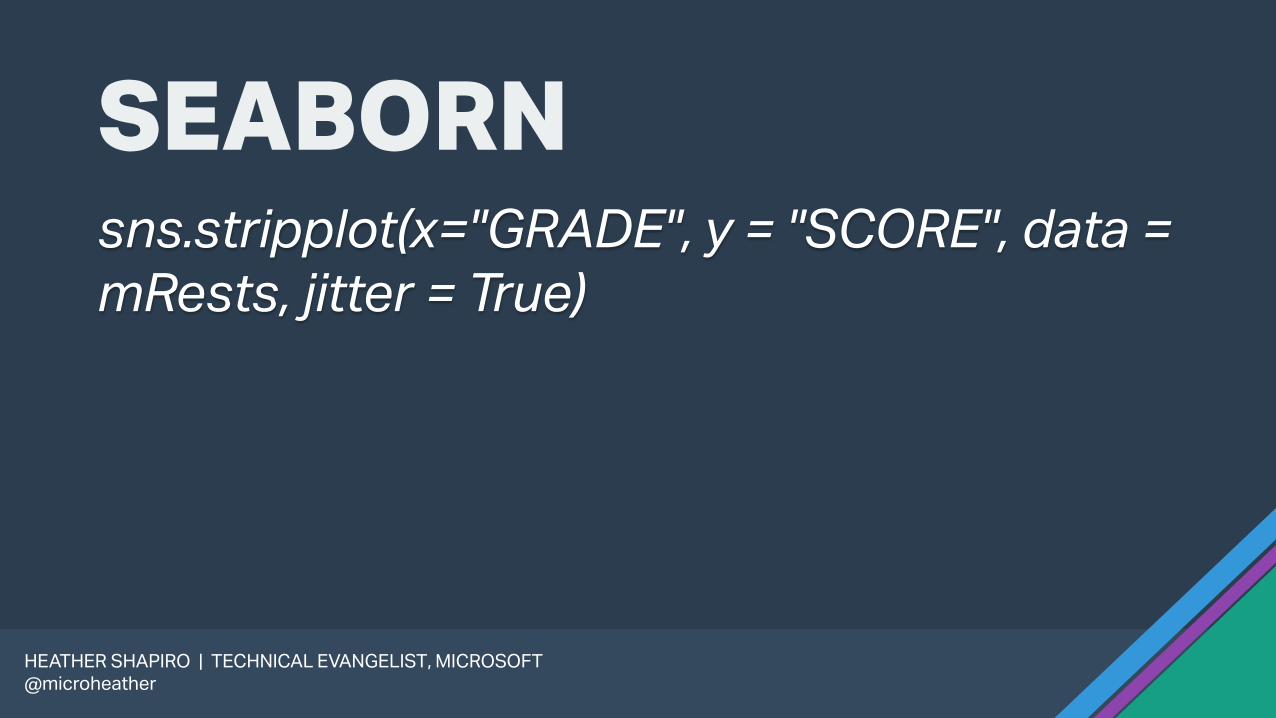
SEABORNsns.stripplot(x="GRADE", y = "SCORE", data =
mRests, jitter = True)
@microheatherHEATHER SHAPIRO | TECHNICAL EVANGELIST, MICROSOFT
@microheather
SEABORN

@microheatherHEATHER SHAPIRO | TECHNICAL EVANGELIST, MICROSOFT
@microheather
LIBRARIES FOR MAPPING
@microheatherHEATHER SHAPIRO | TECHNICAL EVANGELIST, MICROSOFT
@microheather
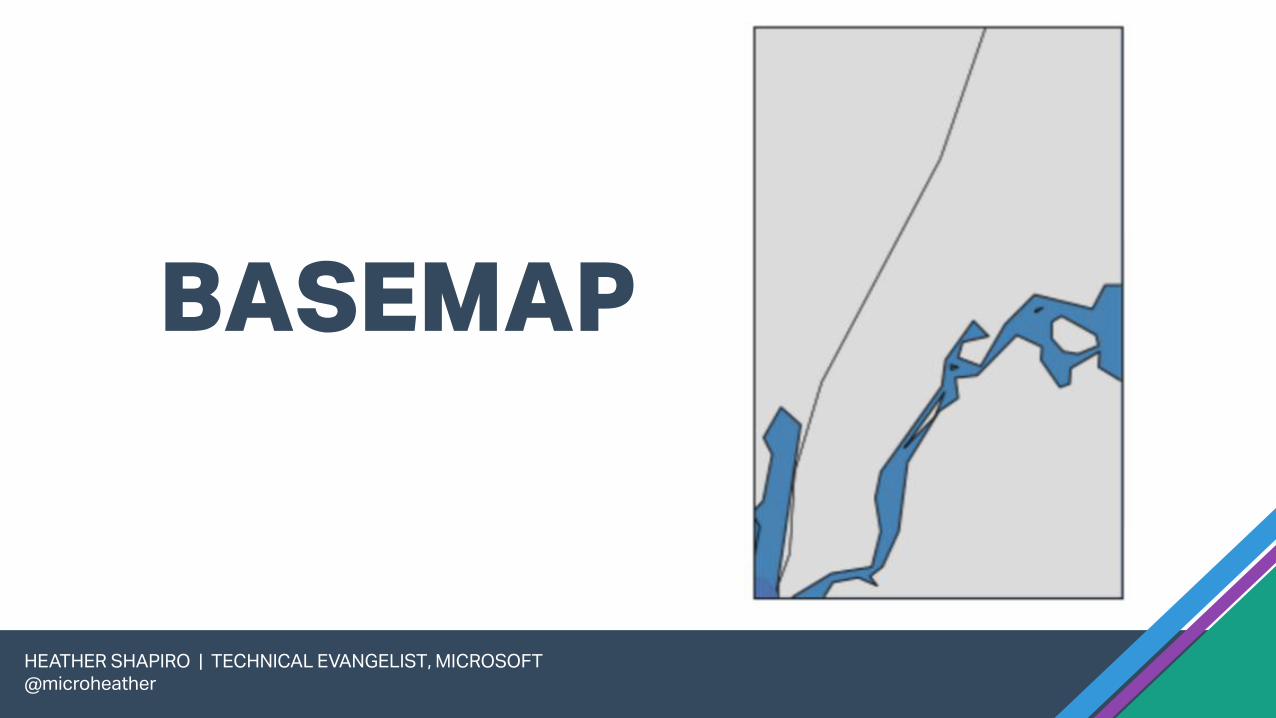
BASEMAP• Hard to install. There are a lot of prereqs
and the documentation isn’t there for
windows
@microheatherHEATHER SHAPIRO | TECHNICAL EVANGELIST, MICROSOFT
@microheather
BASEMAP
@microheatherHEATHER SHAPIRO | TECHNICAL EVANGELIST, MICROSOFT
@microheather
FOLIUMImport folium
• Visualize data on a Leaflet map
• Built-in tilesets from:• OpenStreetMap, MapQuest Open,
MapQuest Open Aerial, Mapbox, and
Stamen, and supports custom tilesets with
Mapbox or Cloudmade API keys.

@microheatherHEATHER SHAPIRO | TECHNICAL EVANGELIST, MICROSOFT
@microheather
LIBRARIES FOR INTERACTIVE PLOTS

@microheatherHEATHER SHAPIRO | TECHNICAL EVANGELIST, MICROSOFT
@microheather

@microheatherHEATHER SHAPIRO | TECHNICAL EVANGELIST, MICROSOFT
@microheather

@microheatherHEATHER SHAPIRO | TECHNICAL EVANGELIST, MICROSOFT
@microheather
GO PUT THEM IN YOUR BLOGS
CLOSING THOUGHTS•Pandashandy for simple plots but you need to
be willing to learn matplotlib to customize.
•Seaborn supports more complex
visualization approaches but still requires
matplotlib. The color schemes are a nice bonus.
HEATHER SHAPIRO | TECHNICAL EVANGELIST, MICROSOFT
@microheather
CLOSING THOUGHTS•Basemap Hard to install. Not very robust and
there is not higt granularity for the maps.
•Folium Great documentation for mapping.
Wish you could add more interactive widgets.
HEATHER SHAPIRO | TECHNICAL EVANGELIST, MICROSOFT
@microheather
CLOSING THOUGHTS•bokehOverkill for simple scenarios and
documentation was not great.
•Plotlymost interactive graphs. You can save
them offline and create rich web-based
visualizations for your blog. Not good with city
level data for maps.
HEATHER SHAPIRO | TECHNICAL EVANGELIST, MICROSOFT
@microheather
What did we cover?• Introduction to data visualizations in python
•How to walk through a data problem
•Which libraries are useful and for what
•Great way to update that blog
HEATHER SHAPIRO | TECHNICAL EVANGELIST, MICROSOFT
@microheather
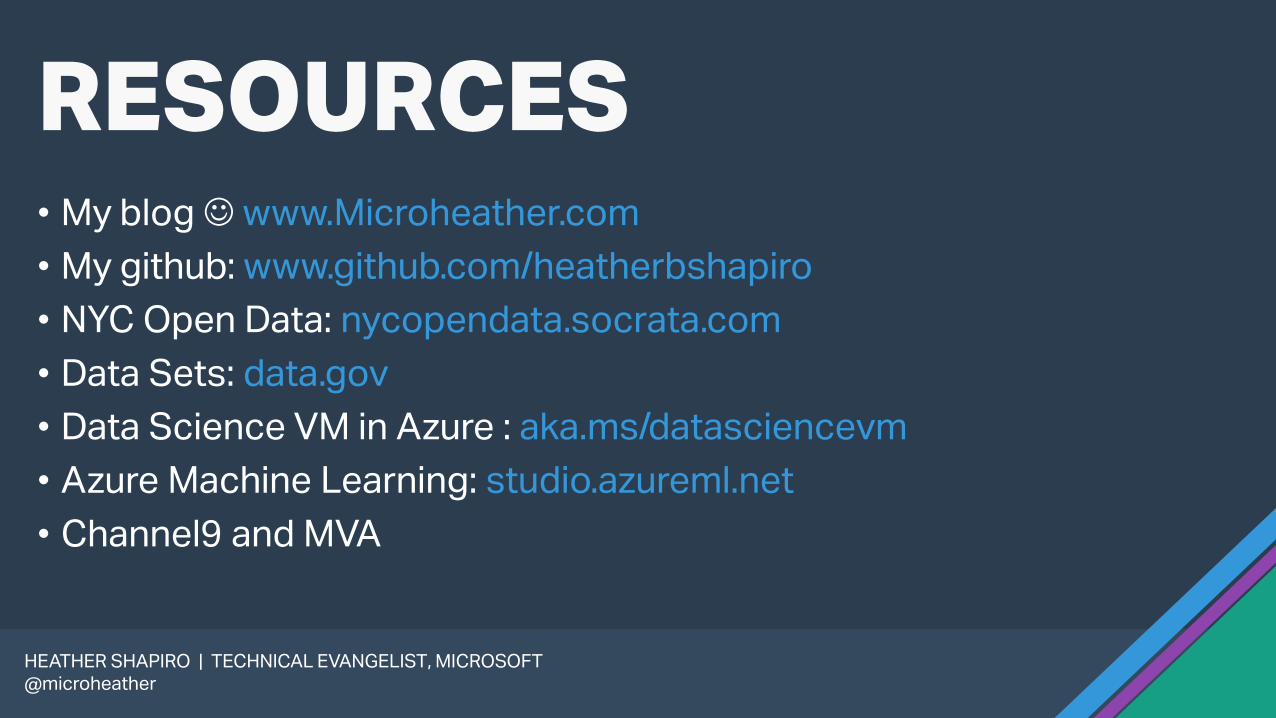
• My blog www.Microheather.com
• My github: www.github.com/heatherbshapiro
• NYC Open Data: nycopendata.socrata.com
• Data Sets: data.gov
• Data Science VM in Azure : aka.ms/datasciencevm
• Azure Machine Learning: studio.azureml.net
• Channel9 and MVA
HEATHER SHAPIRO | TECHNICAL EVANGELIST, MICROSOFT
@microheather
RESOURCES

• Email: [email protected]
• Twitter @microheather
HEATHER SHAPIRO | TECHNICAL EVANGELIST, MICROSOFT
@microheather
CONTACT ME

HEATHER SHAPIRO | TECHNICAL EVANGELIST, MICROSOFT
@microheather
THANKS!