an employee-owned company - escondido · r e e k pauma and yuima reservation pala ... in...
TRANSCRIPT

An Employee-Owned Company
1927 Fifth Avenue, San Diego, CA 92101 | 619.308.9333 | reconenvironmental.com
SAN DIEGO | CENTRAL COAST | BERKELEY | TUCSON
August 28, 2017
Mr. Richard Poolis Exeter 2005 Harmony Grove Land LLC 101 West Elm Street, Suite 600 Conshohocken, PA 19428
Reference: Greenhouse Gas Analysis for the Harmony Grove Industrial Project (RECON Number 8811)
Dear Mr. Poolis:
This letter describes the results of a greenhouse gas (GHG) analysis for the Harmony Grove Industrial Project (project) located in the city of Escondido, California. The project site was previously analyzed as two separate projects: the Victory Industrial Park and the Escondido Innovation Center. While the two sites are located adjacent to each other, the projects were processed independently. RECON prepared GHG technical reports for each project, and it was found that each project would result in less than significant impacts related to GHG emissions (RECON 2016a and 2016b). This report summarizes the GHG impacts associated with the project, which proposes a single industrial building on the combined project site. As discussed below, annual emissions would be less than the City of Escondido’s (City) 2,500 metric tons of carbon dioxide equivalent (MT CO2E) screening threshold; therefore, GHG impacts would be less than significant.
1.0 PROJECT DESCRIPTION
The project site is located at 1925 and 2005 Harmony Grove Road in Escondido, California. Figure 1 shows the regional location of the project site. Figure 2 shows an aerial photograph of the project vicinity. As shown, the 11.04-acre site is currently undeveloped; however, the southern portion of the project site has now been graded in preparation of development associated with the approved Victory Industrial Park project.
The project would construct 215,275 square feet of industrial uses in one building. The light industrial use would consist of 204,775 square feet of warehouse space and 10,500 square feet of office space. The project would include surface parking and truck loading docks. Figure 3 shows the proposed site plan.
2.0 EXISTING CONDITIONS
The City’s 2010 Community-wide Emissions Inventory was adopted in 2013 as a part of the Escondido Climate Action Plan (E-CAP; see Section 3.2). Table 1 summarizes the inventory. As shown, the primary sources of GHG emissions in Escondido are energy (electricity and natural gas) and transportation.
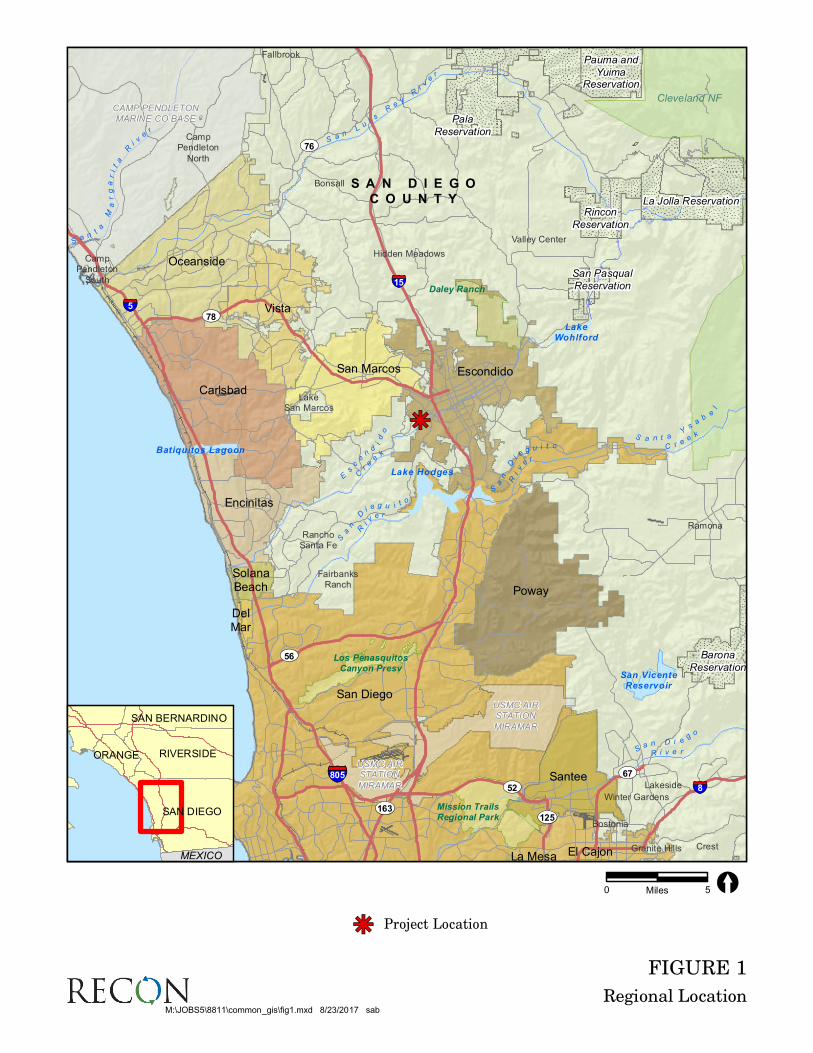
FIGURE 1
Regional Location
kj
USMC AIRSTATION
MIRAMAR
USMC AIRSTATION
MIRAMAR
CAMP PENDLETONMARINE CO BASE
Daley Ranch
Los PenasquitosCanyon Presv
Mission TrailsRegional Park
Cleveland NF
LakeWohlford
Batiquitos Lagoon
Lake Hodges
San VicenteReservoir
Sa
nD
i eg u i t o
Ri
v
er
S a nL
ui s
Re
yR
iv
er
S a n t aY
sa
be
l
C r ee
k
Sa
n
D
i e g u i t o
Ri
v e r
Sa n
t
aM
ar
ga
ri
ta
R
i ve
r
Sa n D i e
go
R i v e r
E
sc
o
nd
id
o
Cr
e
ek
Pauma and
YuimaReservation
Pala
Reservation
San Pasqual
Reservation
Rincon
Reservation
La Jolla Reservation
Barona
Reservation
CampPendleton
South
Bonsall
CampPendleton
North
Fallbrook
Valley Center
Bostonia
Crest
FairbanksRanch
Granite Hills
Hidden Meadows
LakeSan Marcos
Lakeside
RamonaRancho
Santa Fe
Winter Gardens
UV78
UV56
UV125
UV76
UV67
UV163
UV52§̈¦805
§̈¦8
§̈¦5
§̈¦15
S A N D I E G O
C O U N T Y
Carlsbad
DelMar
El Cajon
Encinitas
Escondido
La Mesa
Oceanside
Poway
San Diego
San Marcos
Santee
SolanaBeach
Vista
0 5Miles [
M:\JOBS5\8811\common_gis\fig1.mxd 8/23/2017 sab
SAN DIEGO
RIVERSIDE
SAN BERNARDINO
ORANGE
MEXICO
Project Locationkj

FIGURE 2
Project Location on Aerial Photograph
E
NTE
RPR
ISEST
HARMONY GROVE RD
HO
WA
RD
AV
E
PA
CIF
ICO
AK
SP
L
PR
INC
ES
SK
YR
AP
L
E
NTE
RPR
ISEST
HARMONY GROVE RD
HO
WA
RD
AV
E
PA
CIF
ICO
AK
SP
L
PR
INC
ES
SK
YR
AP
L
Image Source: Nearmaps (flown June 2017)
0 200Feet [
Project Boundary
M:\JOBS5\8811\common_gis\fig2_air.mxd 8/31/2017 fmm

M:\JOBS5\8811\air\graphics\fig3.ai 08/23/17 sab
Map Source: WARE MALCOMB
FIGURE 3
Site Plan
0 100Feet

Mr. Richard Poolis Page 5 August 28, 2017
Table 1 Escondido 2010 Community-Wide GHG Emissions By Source
Category MT CO2E Percent of Total Energy 395,565 44.6% Transportation 368,622 41.6% Area Sources 52,559 5.9% Solid Waste 41,724 4.7% Water and Wastewater 25,360 2.9% Construction 2,288 0.3% TOTAL 886,118 100% SOURCE: City of Escondido 2013a.
The project site is currently vacant and is not a significant source of GHG emissions.
3.0 REGULATORY FRAMEWORK
In response to rising concern associated with increasing GHG emissions and global climate change impacts, several plans and regulations have been adopted at the international, national, and state levels with the aim of reducing GHG emissions. The following is a discussion of the plans and regulations most applicable to the project.
3.1 State
3.1.1 Executive Orders and Statewide GHG Emission Targets
S-3-05 This Executive Order (EO) established the following GHG emission reduction targets for the state of California:
• by 2010, reduce GHG emissions to 2000 levels; • by 2020, reduce GHG emissions to 1990 levels; and • by 2050, reduce GHG emissions to 80 percent below 1990 levels.
This EO also directs the secretary of the California Environmental Protection Agency (EPA) to oversee the efforts made to reach these targets, and to prepare biannual reports on the progress made toward meeting the targets and on the impacts to California related to global warming, including impacts to water supply, public health, agriculture, the coastline, and forestry. With regard to impacts, the report shall also prepare and report on mitigation and adaptation plans to combat the impacts. The first Climate Action Team Assessment Report was produced in March 2006, and has been updated every two years.
B-30-15 This EO, issued on April 29, 2015, establishes an interim GHG emission reduction goal for the state of California by 2030 of 40 percent below 1990 levels. This EO also directed all state agencies with jurisdiction over GHG emitting sources to implement measures designed to achieve the new interim 2030 goal as well as the pre-existing long-term 2050 goal identified in EO S-3-05. Additionally, this EO directed California Air Resources Board (CARB) to update its Climate Change Scoping Plan to address the 2030 goal.
3.1.2 California Global Warming Solutions Act
In response to EO S-3-05, the California Legislature passed Assembly Bill (AB) 32, the California Global Warming Solutions Act of 2006, and thereby enacted Sections 38500–38599 of the California Health and Safety Code. The heart of AB 32 is its requirement that CARB establish an emissions cap and adopt rules and regulations that would reduce GHG emissions to 1990 levels by 2020. AB 32 also required CARB to

Mr. Richard Poolis Page 6 August 28, 2017
adopt a plan by January 1, 2009 indicating how emission reductions would be achieved from significant GHG sources via regulations, market mechanisms, and other actions.
Approved in September 2016, Senate Bill (SB) 32 updates the California Global Warming Solutions Act of 2006 and enacts EO B-30-15. Under SB 32, the state is required to reduce its GHG emissions 40 percent below 1990 levels by 2030. In implementing the 40 percent reduction goal, CARB is required to prioritize emissions reductions and to consider the social costs of the emissions of GHGs. The term “social costs” is defined as “an estimate of the economic damages, including, but not limited to, changes in net agricultural productivity; impacts to public health; climate adaptation impacts, such as property damages from increased flood risk; and changes in energy system costs, per metric ton of greenhouse gas emission per year.”
3.1.3 Climate Change Scoping Plan
As directed by the California Global Warming Solutions Act of 2006, in 2008, CARB adopted the Climate Change Scoping Plan: A Framework for Change (Scoping Plan), which identifies the main strategies California will implement to achieve the GHG reductions necessary to reduce forecasted business as usual (BAU) emissions in 2020 to the state’s historic 1990 emissions level (CARB 2008). In January 2017, CARB released The 2017 Climate Change Scoping Plan Update, The Proposed Strategy for Achieving California’s 2030 Greenhouse Gas Target (Proposed Second Update to the Scoping Plan; CARB 2017a). The comment period for the Proposed Second Update to the Scoping Plan ended in March 2017. The Proposed Second Update to the Scoping Plan identifies the state strategy for achieving the state’s 2030 reduction target. The plan proposes to build on existing programs such as the Cap-and-Trade Regulation, Low Carbon Fuel Standard (LCFS), Advanced Clean Cars (ACC) Program, Renewable Portfolio Standard (RPS), Sustainable Communities Strategy, and the Short-Lived Climate Pollutant Reduction Strategy. It also proposes further strategies to reduce waste emissions through cogeneration, reduce GHG emissions from the refinery sector by 20 percent, and new policies to address GHG emissions from natural and working lands.
3.1.4 California Advanced Clean Car Program
The ACC Program, adopted January 2012, combines the control of smog, soot-causing pollutants, and GHG emissions into a single coordinated package of requirements for model years 2015 through 2025. Accordingly, the ACC Program coordinates the goals of the Pavley, low emissions vehicle, zero emission vehicle, and Clean Fuels Outlet programs in order to lay the foundation for the commercialization and support of these ultra-clean vehicles. AB 1493 (Pavley) directed CARB to adopt vehicle standards that lowered GHG emissions from passenger vehicles and light-duty trucks to the maximum extent technologically feasible, beginning with the 2009 model year. CARB has adopted amendments to its regulations that would enforce AB 1493 but provide vehicle manufacturers with new compliance flexibility. CARB has also adopted a second phase of the Pavley regulations, originally termed “Pavley II” but now called the Low Emission Vehicle III” (LEV III) Standards or ACC Program, that covers model years 2017 to 2025. CARB estimates that LEV III will reduce vehicle GHGs by an additional 4.0 million MT CO2E for a 2.4 percent reduction over Pavley I. These reductions come from improved vehicle technologies such as smaller engines with superchargers, continuously variable transmissions, and hybrid electric drives. On August 7, 2012, the final regulation for the adoption of LEV III became effective.
3.1.5 Low Carbon Fuel Standard
EO S-01-07 directed that a statewide goal be established to reduce the carbon intensity of California’s transportation fuels by at least 10 percent by 2020 through a LCFS. LCFS promotes the use of GHG-reducing transportation fuels, e.g., liquid biofuels, renewable natural gas, electricity, and hydrogen, through a declining carbon intensity standard. The carbon intensity of a fuel is a measure of the GHG emissions associated with the production, distribution, and consumption of a fuel. CARB approved LCFS in 2009 and implemented it in 2010 as an early action measure under AB 32. Subsequently CARB approved amendments to the LCFS, which began implementation on January 1, 2013. Due to a court ruling that found procedural issues related to the original adoption of the LCFS, CARB re-adopted the LCFS regulation in September 2015, which went into effect on January 1, 2016. The program establishes a strong framework to

Mr. Richard Poolis Page 7 August 28, 2017
promote the low carbon fuel adoption necessary to achieve the governor's 2030 and 2050 GHG goals (CARB 2016).
3.1.6 Regional Emissions Targets – Senate Bill 375
SB 375, the 2008 Sustainable Communities and Climate Protection Act, was signed into law in September 2008 and requires CARB to set regional targets for reducing passenger vehicle GHG emissions in accordance with the Scoping Plan. The purpose of SB 375 is to align regional transportation planning efforts, regional GHG reduction targets, and fair-share housing allocations under state housing law. SB 375 requires Metropolitan Planning Organizations (MPOs) to adopt a Sustainable Communities Strategy or Alternative Planning Strategy to address GHG reduction targets from cars and light-duty trucks in the context of that MPO’s Regional Transportation Plan. San Diego Association of Governments (SANDAG) is the San Diego region’s MPO. The currently adopted CARB targets for the SANDAG region require a 7 percent reduction in GHG emissions per capita from automobiles and light-duty trucks compared to 2005 levels by 2020, and a 13 percent reduction by 2035. The proposed updated targets for the SANDAG region require a 15 percent reduction by 2020 and a 21 percent reduction by 2035 (CARB 2017b).
3.1.7 Renewables Portfolio Standard
The RPS promotes diversification of the state’s electricity supply and decreased reliance on fossil fuel energy sources. Originally adopted in 2002 with a goal to achieve a 20 percent renewable energy mix by 2020 (referred to as the “Initial RPS”), the goal has been accelerated and increased by EOs S-14-08 and S-21-09 to a goal of 33 percent by 2020. In April 2011, SB 2 (1X) codified California’s 33 percent RPS goal. In September 2015, the California Legislature passed SB 350, which increases California’s renewable energy mix goal to 50 percent by the year 2030. Renewable energy includes (but is not limited to) wind, solar, geothermal, small hydroelectric, biomass, anaerobic digestion, and landfill gas.
3.1.8 Assembly Bill 341 – Solid Waste Diversion
The Commercial Recycling Requirements mandate that businesses (including public entities) that generate 4 cubic yards or more of commercial solid waste per week and multi-family residential with five units or more arrange for recycling services. Businesses can take one or any combination of the following in order to reuse, recycle, compost, or otherwise divert solid waste from disposal. Additionally, AB 341 mandates that 75 percent of the solid waste generated be reduced, recycled, or composted by 2020.
3.1.9 California Code of Regulations, Title 24 – California Building Code
The California Code of Regulations, Title 24, is referred to as the California Building Code (CBC). It consists of a compilation of several distinct standards and codes related to building construction including plumbing, electrical, interior acoustics, energy efficiency, handicap accessibility, and so on. Of particular relevance to GHG reductions are the CBC’s energy efficiency and green building standards.
The California Code of Regulations, Title 24, Part 6 is the Energy Efficiency Standards or California Energy Code. The Energy Code is updated periodically to incorporate and consider new energy efficiency technologies and methodologies as they become available. New construction and major renovations must demonstrate their compliance with the current Energy Code through submission and approval of a Title 24 Compliance Report to the local building permit review authority and the California Energy Commission (CEC). The previous Energy Code, known as the 2013 Energy Code, became effective July 1, 2014. The most current version of the Energy Code, the 2016 Energy Code, became effective January 1, 2017. Until the 2016 Title 24 requirements take effect, the CEC cannot complete a comprehensive study characterizing the resulting electricity demand and natural gas use reductions. However, preliminary CEC estimates indicate that residences built consistent with 2016 Title 24 requirements will be 28 percent more energy efficient than homes built consistent with 2013 Title 24 requirements, and non-residential uses built consistent with 2016 Title 24 requirements will be 5 percent more energy efficient than those built consistent with 2013 Title 24 requirements (CEC 2015).

Mr. Richard Poolis Page 8 August 28, 2017
The California Green Building Standards Code, referred to as CalGreen, was added to Title 24 as Part 11 first in 2009 as a voluntary code, which then became mandatory effective January 1, 2011 (as part of the 2010 CBC). The 2013 CalGreen institutes mandatory minimum environmental performance standards for all ground-up (i.e., new) construction of non-residential and residential structures. It also includes voluntary tiers (I and II) with stricter environmental performance standards for these same categories of residential and non-residential buildings. Local jurisdictions must enforce the minimum mandatory Green Building Standards and may adopt additional amendments for stricter requirements. The mandatory standards applicable to the project require:
• 20 percent reduction in indoor water use relative to specified baseline levels; • 50 percent construction/demolition waste diverted from landfills; • Inspections of energy systems to ensure optimal working efficiency; and • Low-pollutant emitting exterior and interior finish materials such as paints, carpets, vinyl flooring,
and particle boards.
3.2 Local
3.2.1 Escondido General Plan
The City General Plan was last updated in May 2012. The Resource Conservation Element contains air quality and climate protection policies aimed at reducing GHG emissions. The overall intent of these policies is to support climate protection actions, while retaining flexibility in the design of implementation measures, which could be influenced by new scientific research, technological advances, environmental conditions, or state and federal legislation. As such, these measures include policies such as “implementing land use patterns that reduce automobile dependence” and “promoting local agriculture.”
3.2.2 E-CAP
To address GHG emissions, the City adopted the E-CAP with the target of reducing GHG emissions within Escondido by 15 percent below existing levels by 2020 (City of Escondido 2013a). The E-CAP includes GHG inventories for 2010 and GHG forecasts for 2020 and 2035. The E-CAP identifies local measures to reduce transportation, energy, area source, water, solid waste, and construction emissions in 2020. Local GHG reductions would come from improvements to residential and commercial building energy efficiency (45.8 percent), revised land use policies, and increased public transportation (33.9 percent), and implementation of a Waste Disposal Program (18.1 percent).
3.2.3 Escondido Municipal Code Section 33-924(7) of the Escondido Municipal Code also addresses GHG emissions. It states that “the following incremental GHG emissions are generally not considered significant:
A. Projects that do not generate more than two thousand five hundred (2,500) metric tons (MT) of carbon dioxide equivalent (CO2e) greenhouse gas (GHG) emissions, or
B. Projects generating more than two thousand five hundred (2,500) MT CO2e that have achieved one hundred (100) points implementing reduction measures outlined in the Escondido Climate Action Plan (E-CAP) screening tables, adopted by separate resolution, or
C. Projects generating more than two thousand five hundred (2,500) MT CO2e that demonstrate through a project specific analysis quantifying GHG emissions that through mitigation and design features, the project reduces GHG emissions consistent with the E-CAP”
Mr. Richard Poolis Page 9 August 28, 2017
4.0 THRESHOLDS OF SIGNIFICANCE
The California Environmental Quality Act (CEQA) Guidelines, Appendix G Environmental Checklist, includes the following two questions regarding assessment of GHG emissions:
1) Would the project generate GHG emissions, either directly or indirectly, that may have a significant impact on the environment?
2) Would the project conflict with an applicable plan, policy, or regulation adopted for the purpose of reducing the emission of GHGs?
As stated in the CEQA Guidelines, these questions are “intended to encourage thoughtful assessment of impacts and do not necessarily represent thresholds of significance” (Title 14, Division 6, Chapter 3 Guidelines for Implementation of the CEQA, Appendix G, VII Greenhouse Gas Emissions).
The CEQA Guidelines require lead agencies to adopt GHG thresholds of significance. When adopting these thresholds, a lead agency would be allowed to consider (1) thresholds of significance adopted or recommended by other public agencies, (2) thresholds recommended by experts, provided that the thresholds are supported by substantial evidence, and/or (3) develop their own significance threshold.
Adopted December 4, 2013, the City’s CEQA Thresholds and Screening Tables provides guidance on how to assess the significance of GHG emissions (City of Escondido 2013b). City GHG Guidance recognizes that individual projects do not generate enough GHG emissions to have a significant direct impact to the environment; however, projects do contribute to cumulative emissions that may have a significant effect on the environment. The City’s GHG Guidance includes a screening level of 2,500 MT CO2E to determine the need for additional analysis of project emissions. Where a project’s emission are projected to exceed 2,500 MT CO2E, further analysis with respect to the City’s GHG Guidance is required.
Projects that exceed the 2,500 MT CO2E screening level must demonstrate that the project would achieve GHG reductions that are consistent with City goals established in the E-CAP. This can be demonstrated through one of two methods: (1) a qualitative method using a list of GHG reduction measures contained in the Screening Tables from the City’s CEQA Thresholds and Screening Tables document; or (2) a quantitative method demonstrating that the project would achieve a 20.6 percent reduction in GHG emissions when compared to an “unmitigated” project.
The purpose of the Screening Tables is to provide guidance in measuring the reduction of GHG emissions attributable to certain design and construction measures incorporated into development projects. The Screening Table-method assigns points for project design features and project mitigation measures (collectively referred to as “feature”). Point values correspond to the minimum emissions reduction expected from each feature. The 100-point scale corresponds to an approximate 20.6 percent reduction of GHG emissions from new development as compared to an “unmitigated” condition, which does not include any features to reduce GHG emissions. Projects that garner at least 100 points would be considered consistent with the reduction quantities anticipated in the City’s E-CAP on a project level. As such, those projects would be determined to have a less than significant impact for GHG emissions.
Alternatively, a project may demonstrate consistency without the use of the Screening Tables by demonstrating a 20.6 percent reduction in GHG emissions when compared to its “unmitigated” (business as usual) emissions. The E-CAP includes a forecast of 2020 “unmitigated” emissions from a benchmark of 2010 emissions. Thus, calculation of “unmitigated” project GHG emissions is a calculation of what the project’s GHG emissions would be under average efficiency assumptions for 2010. Project proponents then must calculate their estimate of current GHG emissions including any post-2010 California regulations and applicant-proposed reduction measures to determine if the project would provide a minimum 20.6 percent reduction over the “unmitigated” project.

Mr. Richard Poolis Page 10 August 28, 2017
5.0 METHODOLOGY AND ASSUMPTIONS
The project’s GHG emissions were calculated using the CalEEMod version 2016.3.1 released in September 2016 by California Air Pollution Control Officers Association (CAPCOA; 2016). CalEEMod was developed with the participation of several state air districts, including the San Diego Air Pollution Control District. California Emissions Estimator Model (CalEEMod) can be used to calculate emissions from construction (off-road vehicles), mobile (on-road vehicles), energy (electricity and natural gas), area (landscape maintenance equipment), water and wastewater, and solid waste sources. GHG emissions are estimated in terms of total MT CO2E. Emissions were calculated for project operation in year 2020.
The analysis methodology and input data are described in the following sections. Where project-specific data were not available, model inputs were based on information provided in the CalEEMod User’s Guide (CAPCOA 2016). Thus, the project was modeled with an operational year of 2020 to parallel the year of the City and state GHG reduction goals.
5.1 Construction Emissions
Construction activities emit GHGs primarily through combustion of fuels (mostly diesel) in the engines of off-road construction equipment and through combustion of diesel and gasoline in on-road construction vehicles and the commute vehicles of construction workers. Smaller amounts of GHGs are also emitted through the energy use embodied in water use for fugitive dust control.
Every phase of the construction process, including demolition, grading, paving, and building, emits GHGs in volumes directly related to the quantity and type of construction equipment used. GHG emissions associated with each phase of project construction are calculated by multiplying the total fuel consumed by the construction equipment and worker trips by applicable emission factors. The number and pieces of construction equipment are calculated based on the project-specific design. In the absence of project-specific construction information, equipment for all phases of construction is estimated based on the size of the land use.
Construction emissions were modeled assuming construction would begin in January 2018 and last approximately two years. Grading has already been completed for the southern half of the project site; thus, assumptions assuming emissions associated with grading and construction of the entire site are conservative. Construction emissions are calculated for construction activity based on the construction equipment profile and other factors determined as needed to complete all phases of construction. Based on guidance from the South Coast Air Quality Management District (SCAQMD), total construction GHG emissions resulting from a project should be amortized over 30 years and added to operational GHG emissions to account for their contribution to GHG emissions over the lifetime of a project (SCAQMD 2009).
5.2 Vehicle Emissions
GHG emissions from vehicles come from the combustion of fossil fuels in vehicle engines. The vehicle emissions are calculated based on the vehicle type and the trip rate for each land use. The vehicle emission factors and fleet mix used in CalEEMod are derived from CARB’s 2014 Emission Factors model.
According to the project traffic report, the project would generate 1,085 average daily trips (LLG 2017). Based on regional data compiled by CARB as part of the emission factor model, the average regional trip length for all trips in San Diego County is 5.8 miles. This distance is multiplied by the total trip generation of the project to determine total project annual vehicle miles traveled (VMT) (CARB 2014). Default vehicle emission factors were used.

Mr. Richard Poolis Page 11 August 28, 2017
5.3 Energy Use Emissions
GHGs are emitted as a result of activities in buildings for which electricity and natural gas are used as energy sources. GHGs are emitted during the generation of electricity from fossil fuels off-site in power plants. These emissions are considered indirect but are calculated in association with a building’s operation. Electric power generation accounts for the second largest sector contributing to both inventoried and projected statewide GHG emissions. Combustion of fossil fuel emits criteria pollutants and GHGs directly into the atmosphere. When this occurs in a building, this is considered a direct emissions source associated with that building. CalEEMod estimates emissions from the direct combustion of natural gas for space and water heating.
CalEEMod estimates GHG emissions from energy use by multiplying average rates of residential and non-residential energy consumption by the quantities of residential units and non-residential square footage entered in the land use module to obtain total projected energy use. This value is then multiplied by electricity and natural gas GHG emission factors applicable to the project location and utility provider.
Building energy use is typically divided into energy consumed by the built environment and energy consumed by uses that are independent of the construction of the building such as plug-in appliances. In California, Title 24 governs energy consumed by the built environment, mechanical systems, and some types of fixed lighting. Non-building energy use, or “plug-in energy use,” can be further subdivided by specific end-use (refrigeration, cooking, office equipment, etc.).
Energy consumption values are based on the CEC sponsored California Commercial End Use Survey study, which identifies energy use by building type and climate zone. Because the study is based on older buildings, adjustments have been made in CalEEMod to account for changes to Title 24 Building Codes. CalEEMod 2016.3.1 is based on the 2013 Title 24 Energy Code (Part 6 of the Building Code). The project would be subject to the 2016 Title 24 Energy Code. As discussed in Section 3.1.9, preliminary CEC estimates indicate that non-residential uses built consistent with 2016 Title 24 requirements will be 5 percent more energy efficient than those built consistent with 2013 Title 24 requirements (CEC 2015).
The project would be served by San Diego Gas & Electric (SDG&E). Therefore, SDG&E’s specific energy-intensity factors (i.e., the amount of carbon dioxide [CO2], methane [CH4], and nitrous oxide [N2O] per kilowatt-hour) are used in the calculations of GHG emissions. As discussed, the state mandate for renewable energy is 33 percent by 2020, and SDG&E has already procured 35.2 percent. However, the energy-intensity factors included in CalEEMod by default only represent a 10.2 percent procurement of renewable energy (SDG&E 2011). To account for the continuing effects of RPS through 2020, the energy-intensity factors included in CalEEMod were adjusted to reflect 35.2 percent renewable energy. SDG&E energy intensity factors are shown in Table 2.
Table 2 San Diego Gas & Electric Intensity Factors
GHG 2009
(lbs/MWh) 2020
(lbs/MWh) Carbon Dioxide (CO2) 720.49 519.91 Methane (CH4) 0.029 0.021 Nitrous Oxide (N2O) 0.006 0.004 SOURCE: SDG&E 2011. lbs = pounds; MWh = megawatt hour

Mr. Richard Poolis Page 12 August 28, 2017
5.4 Area Source Emissions
Area sources include GHG emissions that would occur from the use of landscaping equipment. The use of landscape equipment emits GHGs associated with the equipment’s fuel combustion. The landscaping equipment emission values were derived from the 2011 In-Use Off-Road Equipment Inventory Model (CARB 2011).
5.5 Water and Wastewater Emissions
The amount of water used and wastewater generated by a project has indirect GHG emissions associated with it. These emissions are a result of the energy used to supply, distribute, and treat the water and wastewater. In addition to the indirect GHG emissions associated with energy use, wastewater treatment can directly emit both CH4 and N2O.
The indoor and outdoor water use consumption data for each land use subtype comes from the Pacific Institute’s Waste Not, Want Not: The Potential for Urban Water Conservation in California 2003 (as cited in CAPCOA 2016). Based on that report, a percentage of total water consumption was dedicated to landscape irrigation, which is used to determine outdoor water use. Wastewater generation was similarly based on a reported percentage of total indoor water use (CAPCOA 2016).
The project would be subject to CalGreen, which requires a 20 percent increase in indoor water use efficiency. Thus, in order to demonstrate compliance with CalGreen, a 20 percent reduction in indoor water use was included in the water consumption calculations for the project.
In addition to water reductions under CalGreen, the GHG emissions from the energy used to transport the water are affected by RPS. As discussed previously, to account for the effects of RPS through 2020, the energy-intensity factors included in CalEEMod were adjusted to reflect 35.2 percent renewable energy (see Table 2).
5.6 Solid Waste Emissions
The disposal of solid waste produces GHG emissions from anaerobic decomposition in landfills, incineration, and transportation of waste. To calculate the GHG emissions generated by disposing of solid waste for the project, the total volume of solid waste was calculated using waste disposal rates identified by California Department of Resources Recycling and Recovery. The methods for quantifying GHG emissions from solid waste are based on the Intergovernmental Panel on Climate Change method, using the degradable organic content of waste. GHG emissions associated with the project’s waste disposal were calculated using these parameters. According to a CalRecyle report to the Legislature, as of 2013 California has achieved a statewide 50 percent diversion of solid waste from landfills through “reduce/recycle/compost” programs (CalRecycle 2015). However, AB 341 mandates that 75 percent of the solid waste generated be reduced, recycled, or composted by 2020. Therefore, to account for the continuing actions of recycling requirements under state law (i.e., AB 341), a 25 percent solid waste diversion rate was included in the model.
6.0 GHG EMISSION CALCULATIONS
Based on the methodology summarized in Section 5.0, Methodology and Assumptions, the primary sources of direct and indirect GHG emissions have been calculated for the project buildout year of 2020. Table 3 summarizes the project emissions. The complete model outputs for the project are included in Attachment 1.

Mr. Richard Poolis Page 13 August 28, 2017
Table 3 Project GHG Emissions
(MT CO2E per Year) Emission Source Project GHG Emissions
Vehicles 1,192 Energy Use 240 Area Sources 0 Water Use 178 Solid Waste Disposal 76 Construction 19 TOTAL 1,705
The City has determined that new development projects emitting less than 2,500 MT CO2E annual GHG would not contribute considerably to cumulative climate change impacts. For projects that exceed the 2,500 MT CO2E screening threshold, further analysis with respect to the City’s GHG Guidance is required. As shown, the project would result in a total of 1,705 MT CO2E annually, and would not exceed the 2,500 MT CO2E screening level. Therefore, the project’s direct and indirect GHG emissions would have a less than significant impact on the environment.
Further, the project’s 2020 emissions represent the maximum emissions inventory for the project, as project emissions would continue to decline from 2020 through at least 2050 due to regulatory requirements. Given the reasonably anticipated decline in project emissions, due to existing regulatory programs, once the project is fully constructed and operational, the project emissions would continue to decline in line with the GHG reductions needed to achieve the GHG emissions reduction goals.
If you have any questions about the results of this analysis, please contact me at [email protected] or (619) 308-9333 x177.
Sincerely,
Jessica Fleming Associate Environmental Analyst
JLF:eab:jg
Attachments

Mr. Richard Poolis Page 14 August 28, 2017
7.0 REFERENCES CITED California Air Pollution Control Officers Association (CAPCOA) 2016 California Emissions Estimator model (CalEEMod). User’s Guide Version 2016.3.1. September. California Air Resources Board (CARB) 2008 Climate Change Scoping Plan: A Framework for Change.
http://www.arb.ca.gov/cc/scopingplan/document/adopted_scoping_plan.pdf. December. 2011 In-Use Off-Road Equipment (Construction, Industrial, Ground Support, and Oil Drilling) 2011
Inventory Model. 2014 2014 Emission Factors Web Database model. Accessed at https://www.arb.ca.gov/emfac/2014/. 2016 Low Carbon Fuel Standard Program Background. Available at
http://www.arb.ca.gov/fuels/lcfs/lcfs-background.htm. February 2. 2017a The 2017 Climate Change Scoping Plan Update, The Proposed Strategy for Achieving California’s
2030 Greenhouse Gas Target. January 20. 2017b Staff Report – Proposed Update to the SB 375 Greenhouse Gas Emission Reduction Targets. June
2017. California Energy Commission (CEC) 2015 2016 Building Energy Efficiency Standards – Adoption Hearing. Accessed at
http://www.energy.ca.gov/title24/2016standards/rulemaking/documents/. June 10, 2015. California Department of Resources Recycling and Recovery (CalRecycle) 2015 AB 341 Report to the Legislature. August 2015. Escondido, City of 2013a City of Escondido Adopted Climate Action Plan. December 4. 2013b City of Escondido Greenhouse Gas Emissions, Adopted CEQA Thresholds and Screening
Tables. December 4. Linscott, Law, and Greenspan Engineers (LLG) 2017 Victory Industrial Park/Escondido Innovation Center: Warehouse. Prepared for Exeter Property
Group. LLG Ref. 3-17-2780. August 7, 2017. RECON Environmental, Inc. (RECON) 2016a Greenhouse Gas Analysis for the Escondido Victory Industrial Park, Escondido, California.
Prepared for Badiee Development. RECON Number 8175. June 17, 2016. 2016b Greenhouse Gas Analysis for the Escondido Innovation Center, Escondido, California. Prepared
for Badiee Development. RECON Number 8324. October 24, 2016. San Diego Gas and Electric (SDG&E) 2011 March 2011 Semi-Annual Compliance Report Pursuant to the California Renewables Portfolio
Standard. Filed March. South Coast Air Quality Management District (SCAQMD) 2009 Greenhouse Gas CEQA Significance Threshold Stakeholder Working Group 14.
http://www.aqmd.gov/ceqa/handbook/GHG/2009/nov19mtg/ghgmtg14.pdf. November 19.

ATTACHMENT 1
CalEEMod Output

1.1 Land Usage
Land Uses Size Metric Lot Acreage Floor Surface Area Population
General Office Building 10.50 1000sqft 0.24 10,500.00 0
Unrefrigerated Warehouse-No Rail 204.78 1000sqft 10.80 204,775.00 0
1.2 Other Project Characteristics
Urbanization
Climate Zone
Urban
13
Wind Speed (m/s) Precipitation Freq (Days)2.6 40
1.3 User Entered Comments & Non-Default Data
1.0 Project Characteristics
Utility Company San Diego Gas & Electric
2020Operational Year
CO2 Intensity (lb/MWhr)
519.91 0.021CH4 Intensity (lb/MWhr)
0.004N2O Intensity (lb/MWhr)
8811 Escondido IndustrialSan Diego County APCD Air District, Annual
CalEEMod Version: CalEEMod.2016.3.1 Date: 8/10/2017 9:40 AMPage 1 of 32
8811 Escondido Industrial - San Diego County APCD Air District, Annual

Project Characteristics - RPS - SDG&E currently at 35.2%CalEEMod accounts for 10.2%Additional reduction applied(519.91, 0.021, 0.004)
Land Use - 11.04 acres204,775 sf warehouse10,500 sf office
Construction Phase - Arch coatings concurrent with last half of building
Architectural Coating - SDAPCD Rule 67.0.1
Vehicle Trips - 5.8 mile trip length1,085 ADT (all applied to 204,775 sf warehouse = 5.30 trips/ksf)
Vehicle Emission Factors -
Vehicle Emission Factors -
Vehicle Emission Factors -
Area Coating - SDAPCD Rule 67.0.1
Energy Use - 2016 Title 24 - 5% increase in efficiencyElectricity - 4.64, 0.87Natural Gas - 15.27, 1.49
Water And Wastewater - CalGreen - 20% decrease in indoor water use1,492,963.48 37,884,300.00
Waste Mitigation -
Fleet Mix - 8% heavy truckssubtracted from LDALDA = 0.531336HHD = 0.08
Table Name Column Name Default Value New Value
tblArchitecturalCoating EF_Nonresidential_Exterior 250.00 150.00
tblArchitecturalCoating EF_Nonresidential_Interior 250.00 100.00
tblArchitecturalCoating EF_Residential_Exterior 250.00 150.00
tblArchitecturalCoating EF_Residential_Interior 250.00 100.00
tblAreaCoating Area_EF_Nonresidential_Exterior 250 150
CalEEMod Version: CalEEMod.2016.3.1 Date: 8/10/2017 9:40 AMPage 2 of 32
8811 Escondido Industrial - San Diego County APCD Air District, Annual

tblAreaCoating Area_EF_Nonresidential_Interior 250 100
tblAreaCoating Area_EF_Residential_Exterior 250 150
tblAreaCoating Area_EF_Residential_Interior 250 100
tblConstructionPhase NumDays 20.00 150.00
tblEnergyUse T24E 4.88 4.64
tblEnergyUse T24E 0.92 0.87
tblEnergyUse T24NG 16.07 15.27
tblEnergyUse T24NG 1.57 1.49
tblFleetMix HHD 0.02 0.08
tblFleetMix HHD 0.02 0.08
tblFleetMix LDA 0.59 0.53
tblFleetMix LDA 0.59 0.53
tblLandUse BuildingSpaceSquareFeet 204,780.00 204,775.00
tblLandUse LandUseSquareFeet 204,780.00 204,775.00
tblLandUse LotAcreage 4.70 10.80
tblProjectCharacteristics CH4IntensityFactor 0.029 0.021
tblProjectCharacteristics CO2IntensityFactor 720.49 519.91
tblProjectCharacteristics N2OIntensityFactor 0.006 0.004
tblProjectCharacteristics OperationalYear 2018 2020
tblVehicleTrips CC_TL 7.30 0.00
tblVehicleTrips CC_TL 7.30 5.80
tblVehicleTrips CNW_TL 7.30 0.00
tblVehicleTrips CNW_TL 7.30 5.80
tblVehicleTrips CW_TL 9.50 0.00
tblVehicleTrips CW_TL 9.50 5.80
tblVehicleTrips ST_TR 2.46 0.00
tblVehicleTrips ST_TR 1.68 5.30
CalEEMod Version: CalEEMod.2016.3.1 Date: 8/10/2017 9:40 AMPage 3 of 32
8811 Escondido Industrial - San Diego County APCD Air District, Annual

2.0 Emissions Summary
tblVehicleTrips SU_TR 1.05 0.00
tblVehicleTrips SU_TR 1.68 5.30
tblVehicleTrips WD_TR 11.03 0.00
tblVehicleTrips WD_TR 1.68 5.30
tblWater IndoorWaterUseRate 1,866,204.35 1,492,963.48
tblWater IndoorWaterUseRate 47,355,375.00 37,884,300.00
CalEEMod Version: CalEEMod.2016.3.1 Date: 8/10/2017 9:40 AMPage 4 of 32
8811 Escondido Industrial - San Diego County APCD Air District, Annual

2.1 Overall Construction
ROG NOx CO SO2 Fugitive PM10
Exhaust PM10
PM10 Total
Fugitive PM2.5
Exhaust PM2.5
PM2.5 Total Bio- CO2 NBio- CO2 Total CO2 CH4 N2O CO2e
Year tons/yr MT/yr
2018 0.4592 4.2693 3.0552 6.0300e-003
0.3281 0.2227 0.5508 0.1328 0.2084 0.3412 0.0000 547.5127 547.5127 0.1075 0.0000 550.1999
2019 1.2766 1.3114 1.1561 2.3100e-003
0.0494 0.0704 0.1197 0.0133 0.0666 0.0799 0.0000 206.7616 206.7616 0.0349 0.0000 207.6334
Maximum 1.2766 4.2693 3.0552 6.0300e-003
0.3281 0.2227 0.5508 0.1328 0.2084 0.3412 0.0000 547.5127 547.5127 0.1075 0.0000 550.1999
Unmitigated Construction
ROG NOx CO SO2 Fugitive PM10
Exhaust PM10
PM10 Total
Fugitive PM2.5
Exhaust PM2.5
PM2.5 Total Bio- CO2 NBio- CO2 Total CO2 CH4 N2O CO2e
Year tons/yr MT/yr
2018 0.4592 4.2693 3.0552 6.0300e-003
0.3281 0.2227 0.5508 0.1328 0.2084 0.3412 0.0000 547.5123 547.5123 0.1075 0.0000 550.1994
2019 1.2766 1.3114 1.1561 2.3100e-003
0.0494 0.0704 0.1197 0.0133 0.0666 0.0799 0.0000 206.7614 206.7614 0.0349 0.0000 207.6332
Maximum 1.2766 4.2693 3.0552 6.0300e-003
0.3281 0.2227 0.5508 0.1328 0.2084 0.3412 0.0000 547.5123 547.5123 0.1075 0.0000 550.1994
Mitigated Construction
ROG NOx CO SO2 Fugitive PM10
Exhaust PM10
PM10 Total
Fugitive PM2.5
Exhaust PM2.5
PM2.5 Total
Bio- CO2 NBio-CO2 Total CO2 CH4 N20 CO2e
Percent Reduction
0.00 0.00 0.00 0.00 0.00 0.00 0.00 0.00 0.00 0.00 0.00 0.00 0.00 0.00 0.00 0.00
CalEEMod Version: CalEEMod.2016.3.1 Date: 8/10/2017 9:40 AMPage 5 of 32
8811 Escondido Industrial - San Diego County APCD Air District, Annual

2.2 Overall Operational
ROG NOx CO SO2 Fugitive PM10
Exhaust PM10
PM10 Total
Fugitive PM2.5
Exhaust PM2.5
PM2.5 Total Bio- CO2 NBio- CO2 Total CO2 CH4 N2O CO2e
Category tons/yr MT/yr
Area 0.9532 2.0000e-005
1.9900e-003
0.0000 1.0000e-005
1.0000e-005
1.0000e-005
1.0000e-005
0.0000 3.8500e-003
3.8500e-003
1.0000e-005
0.0000 4.1000e-003
Energy 2.8700e-003
0.0261 0.0219 1.6000e-004
1.9800e-003
1.9800e-003
1.9800e-003
1.9800e-003
0.0000 239.5844 239.5844 9.0700e-003
2.1500e-003
240.4506
Mobile 0.3383 2.9184 3.4630 0.0127 0.8126 0.0130 0.8256 0.2181 0.0123 0.2304 0.0000 1,190.0535
1,190.0535
0.0880 0.0000 1,192.2537
Waste 0.0000 0.0000 0.0000 0.0000 41.0570 0.0000 41.0570 2.4264 0.0000 101.7169
Water 0.0000 0.0000 0.0000 0.0000 12.4926 123.9128 136.4054 1.2881 0.0313 177.9208
Total 1.2943 2.9445 3.4869 0.0128 0.8126 0.0150 0.8276 0.2181 0.0143 0.2323 53.5495 1,553.5545
1,607.1040
3.8116 0.0334 1,712.3461
Unmitigated Operational
Quarter Start Date End Date Maximum Unmitigated ROG + NOX (tons/quarter) Maximum Mitigated ROG + NOX (tons/quarter)
1 1-1-2018 3-31-2018 1.6048 1.6048
2 4-1-2018 6-30-2018 1.0242 1.0242
3 7-1-2018 9-30-2018 1.0354 1.0354
4 10-1-2018 12-31-2018 1.0387 1.0387
5 1-1-2019 3-31-2019 0.9199 0.9199
6 4-1-2019 6-30-2019 0.6317 0.6317
7 7-1-2019 9-30-2019 0.5648 0.5648
Highest 1.6048 1.6048
CalEEMod Version: CalEEMod.2016.3.1 Date: 8/10/2017 9:40 AMPage 6 of 32
8811 Escondido Industrial - San Diego County APCD Air District, Annual

2.2 Overall Operational
ROG NOx CO SO2 Fugitive PM10
Exhaust PM10
PM10 Total
Fugitive PM2.5
Exhaust PM2.5
PM2.5 Total Bio- CO2 NBio- CO2 Total CO2 CH4 N2O CO2e
Category tons/yr MT/yr
Area 0.9532 2.0000e-005
1.9900e-003
0.0000 1.0000e-005
1.0000e-005
1.0000e-005
1.0000e-005
0.0000 3.8500e-003
3.8500e-003
1.0000e-005
0.0000 4.1000e-003
Energy 2.8700e-003
0.0261 0.0219 1.6000e-004
1.9800e-003
1.9800e-003
1.9800e-003
1.9800e-003
0.0000 239.5844 239.5844 9.0700e-003
2.1500e-003
240.4506
Mobile 0.3383 2.9184 3.4630 0.0127 0.8126 0.0130 0.8256 0.2181 0.0123 0.2304 0.0000 1,190.0535
1,190.0535
0.0880 0.0000 1,192.2537
Waste 0.0000 0.0000 0.0000 0.0000 30.7927 0.0000 30.7927 1.8198 0.0000 76.2877
Water 0.0000 0.0000 0.0000 0.0000 12.4926 123.9128 136.4054 1.2881 0.0313 177.9208
Total 1.2943 2.9445 3.4869 0.0128 0.8126 0.0150 0.8276 0.2181 0.0143 0.2323 43.2853 1,553.5545
1,596.8398
3.2050 0.0334 1,686.9169
Mitigated Operational
3.0 Construction Detail
Construction Phase
ROG NOx CO SO2 Fugitive PM10
Exhaust PM10
PM10 Total
Fugitive PM2.5
Exhaust PM2.5
PM2.5 Total
Bio- CO2 NBio-CO2 Total CO2 CH4 N20 CO2e
Percent Reduction
0.00 0.00 0.00 0.00 0.00 0.00 0.00 0.00 0.00 0.00 19.17 0.00 0.64 15.91 0.00 1.49
CalEEMod Version: CalEEMod.2016.3.1 Date: 8/10/2017 9:40 AMPage 7 of 32
8811 Escondido Industrial - San Diego County APCD Air District, Annual

Phase Number
Phase Name Phase Type Start Date End Date Num Days Week
Num Days Phase Description
1 Site Preparation Site Preparation 1/1/2018 1/12/2018 5 10
2 Grading Grading 1/13/2018 2/23/2018 5 30
3 Building Construction Building Construction 2/24/2018 4/19/2019 5 300
4 Architectural Coating Architectural Coating 5/18/2019 12/13/2019 5 150
5 Paving Paving 4/20/2019 5/17/2019 5 20
OffRoad Equipment
Residential Indoor: 0; Residential Outdoor: 0; Non-Residential Indoor: 322,913; Non-Residential Outdoor: 107,638; Striped Parking Area: 0 (Architectural Coating – sqft)
Acres of Grading (Site Preparation Phase): 0
Acres of Grading (Grading Phase): 75
Acres of Paving: 0
CalEEMod Version: CalEEMod.2016.3.1 Date: 8/10/2017 9:40 AMPage 8 of 32
8811 Escondido Industrial - San Diego County APCD Air District, Annual

3.1 Mitigation Measures Construction
Phase Name Offroad Equipment Type Amount Usage Hours Horse Power Load Factor
Site Preparation Rubber Tired Dozers 3 8.00 247 0.40
Site Preparation Tractors/Loaders/Backhoes 4 8.00 97 0.37
Grading Excavators 2 8.00 158 0.38
Grading Graders 1 8.00 187 0.41
Grading Rubber Tired Dozers 1 8.00 247 0.40
Grading Scrapers 2 8.00 367 0.48
Grading Tractors/Loaders/Backhoes 2 8.00 97 0.37
Building Construction Cranes 1 7.00 231 0.29
Building Construction Forklifts 3 8.00 89 0.20
Building Construction Generator Sets 1 8.00 84 0.74
Building Construction Tractors/Loaders/Backhoes 3 7.00 97 0.37
Building Construction Welders 1 8.00 46 0.45
Paving Pavers 2 8.00 130 0.42
Paving Paving Equipment 2 8.00 132 0.36
Paving Rollers 2 8.00 80 0.38
Architectural Coating Air Compressors 1 6.00 78 0.48
Trips and VMT
Phase Name Offroad Equipment Count
Worker Trip Number
Vendor Trip Number
Hauling Trip Number
Worker Trip Length
Vendor Trip Length
Hauling Trip Length
Worker Vehicle Class
Vendor Vehicle Class
Hauling Vehicle Class
Site Preparation 7 18.00 0.00 0.00 10.80 7.30 20.00 LD_Mix HDT_Mix HHDT
Grading 8 20.00 0.00 0.00 10.80 7.30 20.00 LD_Mix HDT_Mix HHDT
Building Construction 9 89.00 35.00 0.00 10.80 7.30 20.00 LD_Mix HDT_Mix HHDT
Paving 6 15.00 0.00 0.00 10.80 7.30 20.00 LD_Mix HDT_Mix HHDT
Architectural Coating 1 18.00 0.00 0.00 10.80 7.30 20.00 LD_Mix HDT_Mix HHDT
CalEEMod Version: CalEEMod.2016.3.1 Date: 8/10/2017 9:40 AMPage 9 of 32
8811 Escondido Industrial - San Diego County APCD Air District, Annual

3.2 Site Preparation - 2018
ROG NOx CO SO2 Fugitive PM10
Exhaust PM10
PM10 Total
Fugitive PM2.5
Exhaust PM2.5
PM2.5 Total Bio- CO2 NBio- CO2 Total CO2 CH4 N2O CO2e
Category tons/yr MT/yr
Fugitive Dust 0.0903 0.0000 0.0903 0.0497 0.0000 0.0497 0.0000 0.0000 0.0000 0.0000 0.0000 0.0000
Off-Road 0.0228 0.2410 0.1124 1.9000e-004
0.0129 0.0129 0.0119 0.0119 0.0000 17.3800 17.3800 5.4100e-003
0.0000 17.5152
Total 0.0228 0.2410 0.1124 1.9000e-004
0.0903 0.0129 0.1032 0.0497 0.0119 0.0615 0.0000 17.3800 17.3800 5.4100e-003
0.0000 17.5152
Unmitigated Construction On-Site
ROG NOx CO SO2 Fugitive PM10
Exhaust PM10
PM10 Total
Fugitive PM2.5
Exhaust PM2.5
PM2.5 Total Bio- CO2 NBio- CO2 Total CO2 CH4 N2O CO2e
Category tons/yr MT/yr
Hauling 0.0000 0.0000 0.0000 0.0000 0.0000 0.0000 0.0000 0.0000 0.0000 0.0000 0.0000 0.0000 0.0000 0.0000 0.0000 0.0000
Vendor 0.0000 0.0000 0.0000 0.0000 0.0000 0.0000 0.0000 0.0000 0.0000 0.0000 0.0000 0.0000 0.0000 0.0000 0.0000 0.0000
Worker 3.8000e-004
3.0000e-004
2.9200e-003
1.0000e-005
7.2000e-004
1.0000e-005
7.3000e-004
1.9000e-004
0.0000 2.0000e-004
0.0000 0.6946 0.6946 2.0000e-005
0.0000 0.6952
Total 3.8000e-004
3.0000e-004
2.9200e-003
1.0000e-005
7.2000e-004
1.0000e-005
7.3000e-004
1.9000e-004
0.0000 2.0000e-004
0.0000 0.6946 0.6946 2.0000e-005
0.0000 0.6952
Unmitigated Construction Off-Site
CalEEMod Version: CalEEMod.2016.3.1 Date: 8/10/2017 9:40 AMPage 10 of 32
8811 Escondido Industrial - San Diego County APCD Air District, Annual

3.2 Site Preparation - 2018
ROG NOx CO SO2 Fugitive PM10
Exhaust PM10
PM10 Total
Fugitive PM2.5
Exhaust PM2.5
PM2.5 Total
Bio- CO2 NBio- CO2 Total CO2 CH4 N2O CO2e
Category tons/yr MT/yr
Fugitive Dust 0.0903 0.0000 0.0903 0.0497 0.0000 0.0497 0.0000 0.0000 0.0000 0.0000 0.0000 0.0000
Off-Road 0.0228 0.2410 0.1124 1.9000e-004
0.0129 0.0129 0.0119 0.0119 0.0000 17.3799 17.3799 5.4100e-003
0.0000 17.5152
Total 0.0228 0.2410 0.1124 1.9000e-004
0.0903 0.0129 0.1032 0.0497 0.0119 0.0615 0.0000 17.3799 17.3799 5.4100e-003
0.0000 17.5152
Mitigated Construction On-Site
ROG NOx CO SO2 Fugitive PM10
Exhaust PM10
PM10 Total
Fugitive PM2.5
Exhaust PM2.5
PM2.5 Total Bio- CO2 NBio- CO2 Total CO2 CH4 N2O CO2e
Category tons/yr MT/yr
Hauling 0.0000 0.0000 0.0000 0.0000 0.0000 0.0000 0.0000 0.0000 0.0000 0.0000 0.0000 0.0000 0.0000 0.0000 0.0000 0.0000
Vendor 0.0000 0.0000 0.0000 0.0000 0.0000 0.0000 0.0000 0.0000 0.0000 0.0000 0.0000 0.0000 0.0000 0.0000 0.0000 0.0000
Worker 3.8000e-004
3.0000e-004
2.9200e-003
1.0000e-005
7.2000e-004
1.0000e-005
7.3000e-004
1.9000e-004
0.0000 2.0000e-004
0.0000 0.6946 0.6946 2.0000e-005
0.0000 0.6952
Total 3.8000e-004
3.0000e-004
2.9200e-003
1.0000e-005
7.2000e-004
1.0000e-005
7.3000e-004
1.9000e-004
0.0000 2.0000e-004
0.0000 0.6946 0.6946 2.0000e-005
0.0000 0.6952
Mitigated Construction Off-Site
CalEEMod Version: CalEEMod.2016.3.1 Date: 8/10/2017 9:40 AMPage 11 of 32
8811 Escondido Industrial - San Diego County APCD Air District, Annual

3.3 Grading - 2018
ROG NOx CO SO2 Fugitive PM10
Exhaust PM10
PM10 Total
Fugitive PM2.5
Exhaust PM2.5
PM2.5 Total Bio- CO2 NBio- CO2 Total CO2 CH4 N2O CO2e
Category tons/yr MT/yr
Fugitive Dust 0.1301 0.0000 0.1301 0.0540 0.0000 0.0540 0.0000 0.0000 0.0000 0.0000 0.0000 0.0000
Off-Road 0.0764 0.8928 0.5263 9.3000e-004
0.0395 0.0395 0.0364 0.0364 0.0000 84.9728 84.9728 0.0265 0.0000 85.6341
Total 0.0764 0.8928 0.5263 9.3000e-004
0.1301 0.0395 0.1696 0.0540 0.0364 0.0903 0.0000 84.9728 84.9728 0.0265 0.0000 85.6341
Unmitigated Construction On-Site
ROG NOx CO SO2 Fugitive PM10
Exhaust PM10
PM10 Total
Fugitive PM2.5
Exhaust PM2.5
PM2.5 Total Bio- CO2 NBio- CO2 Total CO2 CH4 N2O CO2e
Category tons/yr MT/yr
Hauling 0.0000 0.0000 0.0000 0.0000 0.0000 0.0000 0.0000 0.0000 0.0000 0.0000 0.0000 0.0000 0.0000 0.0000 0.0000 0.0000
Vendor 0.0000 0.0000 0.0000 0.0000 0.0000 0.0000 0.0000 0.0000 0.0000 0.0000 0.0000 0.0000 0.0000 0.0000 0.0000 0.0000
Worker 1.2800e-003
1.0200e-003
9.7400e-003
3.0000e-005
2.4100e-003
2.0000e-005
2.4200e-003
6.4000e-004
2.0000e-005
6.6000e-004
0.0000 2.3153 2.3153 8.0000e-005
0.0000 2.3173
Total 1.2800e-003
1.0200e-003
9.7400e-003
3.0000e-005
2.4100e-003
2.0000e-005
2.4200e-003
6.4000e-004
2.0000e-005
6.6000e-004
0.0000 2.3153 2.3153 8.0000e-005
0.0000 2.3173
Unmitigated Construction Off-Site
CalEEMod Version: CalEEMod.2016.3.1 Date: 8/10/2017 9:40 AMPage 12 of 32
8811 Escondido Industrial - San Diego County APCD Air District, Annual

3.3 Grading - 2018
ROG NOx CO SO2 Fugitive PM10
Exhaust PM10
PM10 Total
Fugitive PM2.5
Exhaust PM2.5
PM2.5 Total Bio- CO2 NBio- CO2 Total CO2 CH4 N2O CO2e
Category tons/yr MT/yr
Fugitive Dust 0.1301 0.0000 0.1301 0.0540 0.0000 0.0540 0.0000 0.0000 0.0000 0.0000 0.0000 0.0000
Off-Road 0.0764 0.8928 0.5263 9.3000e-004
0.0395 0.0395 0.0364 0.0364 0.0000 84.9727 84.9727 0.0265 0.0000 85.6340
Total 0.0764 0.8928 0.5263 9.3000e-004
0.1301 0.0395 0.1696 0.0540 0.0364 0.0903 0.0000 84.9727 84.9727 0.0265 0.0000 85.6340
Mitigated Construction On-Site
ROG NOx CO SO2 Fugitive PM10
Exhaust PM10
PM10 Total
Fugitive PM2.5
Exhaust PM2.5
PM2.5 Total Bio- CO2 NBio- CO2 Total CO2 CH4 N2O CO2e
Category tons/yr MT/yr
Hauling 0.0000 0.0000 0.0000 0.0000 0.0000 0.0000 0.0000 0.0000 0.0000 0.0000 0.0000 0.0000 0.0000 0.0000 0.0000 0.0000
Vendor 0.0000 0.0000 0.0000 0.0000 0.0000 0.0000 0.0000 0.0000 0.0000 0.0000 0.0000 0.0000 0.0000 0.0000 0.0000 0.0000
Worker 1.2800e-003
1.0200e-003
9.7400e-003
3.0000e-005
2.4100e-003
2.0000e-005
2.4200e-003
6.4000e-004
2.0000e-005
6.6000e-004
0.0000 2.3153 2.3153 8.0000e-005
0.0000 2.3173
Total 1.2800e-003
1.0200e-003
9.7400e-003
3.0000e-005
2.4100e-003
2.0000e-005
2.4200e-003
6.4000e-004
2.0000e-005
6.6000e-004
0.0000 2.3153 2.3153 8.0000e-005
0.0000 2.3173
Mitigated Construction Off-Site
CalEEMod Version: CalEEMod.2016.3.1 Date: 8/10/2017 9:40 AMPage 13 of 32
8811 Escondido Industrial - San Diego County APCD Air District, Annual

3.4 Building Construction - 2018
ROG NOx CO SO2 Fugitive PM10
Exhaust PM10
PM10 Total
Fugitive PM2.5
Exhaust PM2.5
PM2.5 Total Bio- CO2 NBio- CO2 Total CO2 CH4 N2O CO2e
Category tons/yr MT/yr
Off-Road 0.2961 2.5846 1.9426 2.9700e-003
0.1657 0.1657 0.1558 0.1558 0.0000 262.7328 262.7328 0.0644 0.0000 264.3420
Total 0.2961 2.5846 1.9426 2.9700e-003
0.1657 0.1657 0.1558 0.1558 0.0000 262.7328 262.7328 0.0644 0.0000 264.3420
Unmitigated Construction On-Site
ROG NOx CO SO2 Fugitive PM10
Exhaust PM10
PM10 Total
Fugitive PM2.5
Exhaust PM2.5
PM2.5 Total Bio- CO2 NBio- CO2 Total CO2 CH4 N2O CO2e
Category tons/yr MT/yr
Hauling 0.0000 0.0000 0.0000 0.0000 0.0000 0.0000 0.0000 0.0000 0.0000 0.0000 0.0000 0.0000 0.0000 0.0000 0.0000 0.0000
Vendor 0.0203 0.5163 0.1420 1.0700e-003
0.0257 4.0100e-003
0.0297 7.4100e-003
3.8400e-003
0.0113 0.0000 103.5170 103.5170 8.5300e-003
0.0000 103.7303
Worker 0.0420 0.0333 0.3192 8.4000e-004
0.0789 5.8000e-004
0.0795 0.0210 5.4000e-004
0.0215 0.0000 75.9002 75.9002 2.6200e-003
0.0000 75.9657
Total 0.0623 0.5496 0.4612 1.9100e-003
0.1045 4.5900e-003
0.1091 0.0284 4.3800e-003
0.0327 0.0000 179.4173 179.4173 0.0112 0.0000 179.6960
Unmitigated Construction Off-Site
CalEEMod Version: CalEEMod.2016.3.1 Date: 8/10/2017 9:40 AMPage 14 of 32
8811 Escondido Industrial - San Diego County APCD Air District, Annual

3.4 Building Construction - 2018
ROG NOx CO SO2 Fugitive PM10
Exhaust PM10
PM10 Total
Fugitive PM2.5
Exhaust PM2.5
PM2.5 Total Bio- CO2 NBio- CO2 Total CO2 CH4 N2O CO2e
Category tons/yr MT/yr
Off-Road 0.2961 2.5846 1.9426 2.9700e-003
0.1657 0.1657 0.1558 0.1558 0.0000 262.7325 262.7325 0.0644 0.0000 264.3417
Total 0.2961 2.5846 1.9426 2.9700e-003
0.1657 0.1657 0.1558 0.1558 0.0000 262.7325 262.7325 0.0644 0.0000 264.3417
Mitigated Construction On-Site
ROG NOx CO SO2 Fugitive PM10
Exhaust PM10
PM10 Total
Fugitive PM2.5
Exhaust PM2.5
PM2.5 Total
Bio- CO2 NBio- CO2 Total CO2 CH4 N2O CO2e
Category tons/yr MT/yr
Hauling 0.0000 0.0000 0.0000 0.0000 0.0000 0.0000 0.0000 0.0000 0.0000 0.0000 0.0000 0.0000 0.0000 0.0000 0.0000 0.0000
Vendor 0.0203 0.5163 0.1420 1.0700e-003
0.0257 4.0100e-003
0.0297 7.4100e-003
3.8400e-003
0.0113 0.0000 103.5170 103.5170 8.5300e-003
0.0000 103.7303
Worker 0.0420 0.0333 0.3192 8.4000e-004
0.0789 5.8000e-004
0.0795 0.0210 5.4000e-004
0.0215 0.0000 75.9002 75.9002 2.6200e-003
0.0000 75.9657
Total 0.0623 0.5496 0.4612 1.9100e-003
0.1045 4.5900e-003
0.1091 0.0284 4.3800e-003
0.0327 0.0000 179.4173 179.4173 0.0112 0.0000 179.6960
Mitigated Construction Off-Site
CalEEMod Version: CalEEMod.2016.3.1 Date: 8/10/2017 9:40 AMPage 15 of 32
8811 Escondido Industrial - San Diego County APCD Air District, Annual

3.4 Building Construction - 2019
ROG NOx CO SO2 Fugitive PM10
Exhaust PM10
PM10 Total
Fugitive PM2.5
Exhaust PM2.5
PM2.5 Total Bio- CO2 NBio- CO2 Total CO2 CH4 N2O CO2e
Category tons/yr MT/yr
Off-Road 0.0933 0.8326 0.6780 1.0600e-003
0.0510 0.0510 0.0479 0.0479 0.0000 92.8662 92.8662 0.0226 0.0000 93.4317
Total 0.0933 0.8326 0.6780 1.0600e-003
0.0510 0.0510 0.0479 0.0479 0.0000 92.8662 92.8662 0.0226 0.0000 93.4317
Unmitigated Construction On-Site
ROG NOx CO SO2 Fugitive PM10
Exhaust PM10
PM10 Total
Fugitive PM2.5
Exhaust PM2.5
PM2.5 Total
Bio- CO2 NBio- CO2 Total CO2 CH4 N2O CO2e
Category tons/yr MT/yr
Hauling 0.0000 0.0000 0.0000 0.0000 0.0000 0.0000 0.0000 0.0000 0.0000 0.0000 0.0000 0.0000 0.0000 0.0000 0.0000 0.0000
Vendor 6.4800e-003
0.1735 0.0466 3.8000e-004
9.1800e-003
1.2000e-003
0.0104 2.6500e-003
1.1500e-003
3.8000e-003
0.0000 36.7300 36.7300 2.9500e-003
0.0000 36.8037
Worker 0.0139 0.0106 0.1029 2.9000e-004
0.0282 2.1000e-004
0.0284 7.4900e-003
1.9000e-004
7.6800e-003
0.0000 26.3134 26.3134 8.5000e-004
0.0000 26.3346
Total 0.0203 0.1842 0.1495 6.7000e-004
0.0374 1.4100e-003
0.0388 0.0101 1.3400e-003
0.0115 0.0000 63.0434 63.0434 3.8000e-003
0.0000 63.1382
Unmitigated Construction Off-Site
CalEEMod Version: CalEEMod.2016.3.1 Date: 8/10/2017 9:40 AMPage 16 of 32
8811 Escondido Industrial - San Diego County APCD Air District, Annual

3.4 Building Construction - 2019
ROG NOx CO SO2 Fugitive PM10
Exhaust PM10
PM10 Total
Fugitive PM2.5
Exhaust PM2.5
PM2.5 Total Bio- CO2 NBio- CO2 Total CO2 CH4 N2O CO2e
Category tons/yr MT/yr
Off-Road 0.0933 0.8326 0.6780 1.0600e-003
0.0510 0.0510 0.0479 0.0479 0.0000 92.8661 92.8661 0.0226 0.0000 93.4316
Total 0.0933 0.8326 0.6780 1.0600e-003
0.0510 0.0510 0.0479 0.0479 0.0000 92.8661 92.8661 0.0226 0.0000 93.4316
Mitigated Construction On-Site
ROG NOx CO SO2 Fugitive PM10
Exhaust PM10
PM10 Total
Fugitive PM2.5
Exhaust PM2.5
PM2.5 Total Bio- CO2 NBio- CO2 Total CO2 CH4 N2O CO2e
Category tons/yr MT/yr
Hauling 0.0000 0.0000 0.0000 0.0000 0.0000 0.0000 0.0000 0.0000 0.0000 0.0000 0.0000 0.0000 0.0000 0.0000 0.0000 0.0000
Vendor 6.4800e-003
0.1735 0.0466 3.8000e-004
9.1800e-003
1.2000e-003
0.0104 2.6500e-003
1.1500e-003
3.8000e-003
0.0000 36.7300 36.7300 2.9500e-003
0.0000 36.8037
Worker 0.0139 0.0106 0.1029 2.9000e-004
0.0282 2.1000e-004
0.0284 7.4900e-003
1.9000e-004
7.6800e-003
0.0000 26.3134 26.3134 8.5000e-004
0.0000 26.3346
Total 0.0203 0.1842 0.1495 6.7000e-004
0.0374 1.4100e-003
0.0388 0.0101 1.3400e-003
0.0115 0.0000 63.0434 63.0434 3.8000e-003
0.0000 63.1382
Mitigated Construction Off-Site
CalEEMod Version: CalEEMod.2016.3.1 Date: 8/10/2017 9:40 AMPage 17 of 32
8811 Escondido Industrial - San Diego County APCD Air District, Annual

3.5 Architectural Coating - 2019
ROG NOx CO SO2 Fugitive PM10
Exhaust PM10
PM10 Total
Fugitive PM2.5
Exhaust PM2.5
PM2.5 Total Bio- CO2 NBio- CO2 Total CO2 CH4 N2O CO2e
Category tons/yr MT/yr
Archit. Coating 1.1225 0.0000 0.0000 0.0000 0.0000 0.0000 0.0000 0.0000 0.0000 0.0000 0.0000
Off-Road 0.0200 0.1377 0.1381 2.2000e-004
9.6600e-003
9.6600e-003
9.6600e-003
9.6600e-003
0.0000 19.1494 19.1494 1.6200e-003
0.0000 19.1898
Total 1.1425 0.1377 0.1381 2.2000e-004
9.6600e-003
9.6600e-003
9.6600e-003
9.6600e-003
0.0000 19.1494 19.1494 1.6200e-003
0.0000 19.1898
Unmitigated Construction On-Site
ROG NOx CO SO2 Fugitive PM10
Exhaust PM10
PM10 Total
Fugitive PM2.5
Exhaust PM2.5
PM2.5 Total Bio- CO2 NBio- CO2 Total CO2 CH4 N2O CO2e
Category tons/yr MT/yr
Hauling 0.0000 0.0000 0.0000 0.0000 0.0000 0.0000 0.0000 0.0000 0.0000 0.0000 0.0000 0.0000 0.0000 0.0000 0.0000 0.0000
Vendor 0.0000 0.0000 0.0000 0.0000 0.0000 0.0000 0.0000 0.0000 0.0000 0.0000 0.0000 0.0000 0.0000 0.0000 0.0000 0.0000
Worker 5.3200e-003
4.0800e-003
0.0395 1.1000e-004
0.0108 8.0000e-005
0.0109 2.8800e-003
7.0000e-005
2.9500e-003
0.0000 10.1047 10.1047 3.2000e-004
0.0000 10.1128
Total 5.3200e-003
4.0800e-003
0.0395 1.1000e-004
0.0108 8.0000e-005
0.0109 2.8800e-003
7.0000e-005
2.9500e-003
0.0000 10.1047 10.1047 3.2000e-004
0.0000 10.1128
Unmitigated Construction Off-Site
CalEEMod Version: CalEEMod.2016.3.1 Date: 8/10/2017 9:40 AMPage 18 of 32
8811 Escondido Industrial - San Diego County APCD Air District, Annual

3.5 Architectural Coating - 2019
ROG NOx CO SO2 Fugitive PM10
Exhaust PM10
PM10 Total
Fugitive PM2.5
Exhaust PM2.5
PM2.5 Total Bio- CO2 NBio- CO2 Total CO2 CH4 N2O CO2e
Category tons/yr MT/yr
Archit. Coating 1.1225 0.0000 0.0000 0.0000 0.0000 0.0000 0.0000 0.0000 0.0000 0.0000 0.0000
Off-Road 0.0200 0.1377 0.1381 2.2000e-004
9.6600e-003
9.6600e-003
9.6600e-003
9.6600e-003
0.0000 19.1494 19.1494 1.6200e-003
0.0000 19.1898
Total 1.1425 0.1377 0.1381 2.2000e-004
9.6600e-003
9.6600e-003
9.6600e-003
9.6600e-003
0.0000 19.1494 19.1494 1.6200e-003
0.0000 19.1898
Mitigated Construction On-Site
ROG NOx CO SO2 Fugitive PM10
Exhaust PM10
PM10 Total
Fugitive PM2.5
Exhaust PM2.5
PM2.5 Total Bio- CO2 NBio- CO2 Total CO2 CH4 N2O CO2e
Category tons/yr MT/yr
Hauling 0.0000 0.0000 0.0000 0.0000 0.0000 0.0000 0.0000 0.0000 0.0000 0.0000 0.0000 0.0000 0.0000 0.0000 0.0000 0.0000
Vendor 0.0000 0.0000 0.0000 0.0000 0.0000 0.0000 0.0000 0.0000 0.0000 0.0000 0.0000 0.0000 0.0000 0.0000 0.0000 0.0000
Worker 5.3200e-003
4.0800e-003
0.0395 1.1000e-004
0.0108 8.0000e-005
0.0109 2.8800e-003
7.0000e-005
2.9500e-003
0.0000 10.1047 10.1047 3.2000e-004
0.0000 10.1128
Total 5.3200e-003
4.0800e-003
0.0395 1.1000e-004
0.0108 8.0000e-005
0.0109 2.8800e-003
7.0000e-005
2.9500e-003
0.0000 10.1047 10.1047 3.2000e-004
0.0000 10.1128
Mitigated Construction Off-Site
CalEEMod Version: CalEEMod.2016.3.1 Date: 8/10/2017 9:40 AMPage 19 of 32
8811 Escondido Industrial - San Diego County APCD Air District, Annual

3.6 Paving - 2019
ROG NOx CO SO2 Fugitive PM10
Exhaust PM10
PM10 Total
Fugitive PM2.5
Exhaust PM2.5
PM2.5 Total
Bio- CO2 NBio- CO2 Total CO2 CH4 N2O CO2e
Category tons/yr MT/yr
Off-Road 0.0145 0.1524 0.1467 2.3000e-004
8.2500e-003
8.2500e-003
7.5900e-003
7.5900e-003
0.0000 20.4752 20.4752 6.4800e-003
0.0000 20.6371
Paving 0.0000 0.0000 0.0000 0.0000 0.0000 0.0000 0.0000 0.0000 0.0000 0.0000 0.0000
Total 0.0145 0.1524 0.1467 2.3000e-004
8.2500e-003
8.2500e-003
7.5900e-003
7.5900e-003
0.0000 20.4752 20.4752 6.4800e-003
0.0000 20.6371
Unmitigated Construction On-Site
ROG NOx CO SO2 Fugitive PM10
Exhaust PM10
PM10 Total
Fugitive PM2.5
Exhaust PM2.5
PM2.5 Total Bio- CO2 NBio- CO2 Total CO2 CH4 N2O CO2e
Category tons/yr MT/yr
Hauling 0.0000 0.0000 0.0000 0.0000 0.0000 0.0000 0.0000 0.0000 0.0000 0.0000 0.0000 0.0000 0.0000 0.0000 0.0000 0.0000
Vendor 0.0000 0.0000 0.0000 0.0000 0.0000 0.0000 0.0000 0.0000 0.0000 0.0000 0.0000 0.0000 0.0000 0.0000 0.0000 0.0000
Worker 5.9000e-004
4.5000e-004
4.3900e-003
1.0000e-005
1.2000e-003
1.0000e-005
1.2100e-003
3.2000e-004
1.0000e-005
3.3000e-004
0.0000 1.1227 1.1227 4.0000e-005
0.0000 1.1237
Total 5.9000e-004
4.5000e-004
4.3900e-003
1.0000e-005
1.2000e-003
1.0000e-005
1.2100e-003
3.2000e-004
1.0000e-005
3.3000e-004
0.0000 1.1227 1.1227 4.0000e-005
0.0000 1.1237
Unmitigated Construction Off-Site
CalEEMod Version: CalEEMod.2016.3.1 Date: 8/10/2017 9:40 AMPage 20 of 32
8811 Escondido Industrial - San Diego County APCD Air District, Annual

4.0 Operational Detail - Mobile
3.6 Paving - 2019
ROG NOx CO SO2 Fugitive PM10
Exhaust PM10
PM10 Total
Fugitive PM2.5
Exhaust PM2.5
PM2.5 Total Bio- CO2 NBio- CO2 Total CO2 CH4 N2O CO2e
Category tons/yr MT/yr
Off-Road 0.0145 0.1524 0.1467 2.3000e-004
8.2500e-003
8.2500e-003
7.5900e-003
7.5900e-003
0.0000 20.4752 20.4752 6.4800e-003
0.0000 20.6371
Paving 0.0000 0.0000 0.0000 0.0000 0.0000 0.0000 0.0000 0.0000 0.0000 0.0000 0.0000
Total 0.0145 0.1524 0.1467 2.3000e-004
8.2500e-003
8.2500e-003
7.5900e-003
7.5900e-003
0.0000 20.4752 20.4752 6.4800e-003
0.0000 20.6371
Mitigated Construction On-Site
ROG NOx CO SO2 Fugitive PM10
Exhaust PM10
PM10 Total
Fugitive PM2.5
Exhaust PM2.5
PM2.5 Total
Bio- CO2 NBio- CO2 Total CO2 CH4 N2O CO2e
Category tons/yr MT/yr
Hauling 0.0000 0.0000 0.0000 0.0000 0.0000 0.0000 0.0000 0.0000 0.0000 0.0000 0.0000 0.0000 0.0000 0.0000 0.0000 0.0000
Vendor 0.0000 0.0000 0.0000 0.0000 0.0000 0.0000 0.0000 0.0000 0.0000 0.0000 0.0000 0.0000 0.0000 0.0000 0.0000 0.0000
Worker 5.9000e-004
4.5000e-004
4.3900e-003
1.0000e-005
1.2000e-003
1.0000e-005
1.2100e-003
3.2000e-004
1.0000e-005
3.3000e-004
0.0000 1.1227 1.1227 4.0000e-005
0.0000 1.1237
Total 5.9000e-004
4.5000e-004
4.3900e-003
1.0000e-005
1.2000e-003
1.0000e-005
1.2100e-003
3.2000e-004
1.0000e-005
3.3000e-004
0.0000 1.1227 1.1227 4.0000e-005
0.0000 1.1237
Mitigated Construction Off-Site
CalEEMod Version: CalEEMod.2016.3.1 Date: 8/10/2017 9:40 AMPage 21 of 32
8811 Escondido Industrial - San Diego County APCD Air District, Annual

ROG NOx CO SO2 Fugitive PM10
Exhaust PM10
PM10 Total
Fugitive PM2.5
Exhaust PM2.5
PM2.5 Total Bio- CO2 NBio- CO2 Total CO2 CH4 N2O CO2e
Category tons/yr MT/yr
Mitigated 0.3383 2.9184 3.4630 0.0127 0.8126 0.0130 0.8256 0.2181 0.0123 0.2304 0.0000 1,190.0535
1,190.0535
0.0880 0.0000 1,192.2537
Unmitigated 0.3383 2.9184 3.4630 0.0127 0.8126 0.0130 0.8256 0.2181 0.0123 0.2304 0.0000 1,190.0535
1,190.0535
0.0880 0.0000 1,192.2537
4.1 Mitigation Measures Mobile
4.2 Trip Summary Information
4.3 Trip Type Information
Average Daily Trip Rate Unmitigated Mitigated
Land Use Weekday Saturday Sunday Annual VMT Annual VMT
General Office Building 0.00 0.00 0.00
Unrefrigerated Warehouse-No Rail 1,085.33 1,085.33 1085.33 2,137,876 2,137,876
Total 1,085.33 1,085.33 1,085.33 2,137,876 2,137,876
Miles Trip % Trip Purpose %
Land Use H-W or C-W H-S or C-C H-O or C-NW H-W or C-W H-S or C-C H-O or C-NW Primary Diverted Pass-by
General Office Building 0.00 0.00 0.00 33.00 48.00 19.00 77 19 4
Unrefrigerated Warehouse-No Rail
5.80 5.80 5.80 59.00 0.00 41.00 92 5 3
4.4 Fleet Mix
CalEEMod Version: CalEEMod.2016.3.1 Date: 8/10/2017 9:40 AMPage 22 of 32
8811 Escondido Industrial - San Diego County APCD Air District, Annual

5.0 Energy Detail
ROG NOx CO SO2 Fugitive PM10
Exhaust PM10
PM10 Total
Fugitive PM2.5
Exhaust PM2.5
PM2.5 Total Bio- CO2 NBio- CO2 Total CO2 CH4 N2O CO2e
Category tons/yr MT/yr
Electricity Mitigated
0.0000 0.0000 0.0000 0.0000 0.0000 211.1908 211.1908 8.5300e-003
1.6200e-003
211.8883
Electricity Unmitigated
0.0000 0.0000 0.0000 0.0000 0.0000 211.1908 211.1908 8.5300e-003
1.6200e-003
211.8883
NaturalGas Mitigated
2.8700e-003
0.0261 0.0219 1.6000e-004
1.9800e-003
1.9800e-003
1.9800e-003
1.9800e-003
0.0000 28.3936 28.3936 5.4000e-004
5.2000e-004
28.5623
NaturalGas Unmitigated
2.8700e-003
0.0261 0.0219 1.6000e-004
1.9800e-003
1.9800e-003
1.9800e-003
1.9800e-003
0.0000 28.3936 28.3936 5.4000e-004
5.2000e-004
28.5623
5.1 Mitigation Measures Energy
Land Use LDA LDT1 LDT2 MDV LHD1 LHD2 MHD HHD OBUS UBUS MCY SBUS MH
General Office Building 0.531336 0.042913 0.184449 0.110793 0.017294 0.005558 0.015534 0.080000 0.001902 0.002024 0.006181 0.000745 0.001271
Unrefrigerated Warehouse-No Rail
0.531336 0.042913 0.184449 0.110793 0.017294 0.005558 0.015534 0.080000 0.001902 0.002024 0.006181 0.000745 0.001271
Historical Energy Use: N
CalEEMod Version: CalEEMod.2016.3.1 Date: 8/10/2017 9:40 AMPage 23 of 32
8811 Escondido Industrial - San Diego County APCD Air District, Annual

5.2 Energy by Land Use - NaturalGas
NaturalGas Use
ROG NOx CO SO2 Fugitive PM10
Exhaust PM10
PM10 Total
Fugitive PM2.5
Exhaust PM2.5
PM2.5 Total Bio- CO2 NBio- CO2 Total CO2 CH4 N2O CO2e
Land Use kBTU/yr tons/yr MT/yr
General Office Building
204435 1.1000e-003
0.0100 8.4200e-003
6.0000e-005
7.6000e-004
7.6000e-004
7.6000e-004
7.6000e-004
0.0000 10.9094 10.9094 2.1000e-004
2.0000e-004
10.9743
Unrefrigerated Warehouse-No
Rail
327640 1.7700e-003
0.0161 0.0135 1.0000e-004
1.2200e-003
1.2200e-003
1.2200e-003
1.2200e-003
0.0000 17.4841 17.4841 3.4000e-004
3.2000e-004
17.5880
Total 2.8700e-003
0.0261 0.0219 1.6000e-004
1.9800e-003
1.9800e-003
1.9800e-003
1.9800e-003
0.0000 28.3936 28.3936 5.5000e-004
5.2000e-004
28.5623
Unmitigated
NaturalGas Use
ROG NOx CO SO2 Fugitive PM10
Exhaust PM10
PM10 Total
Fugitive PM2.5
Exhaust PM2.5
PM2.5 Total Bio- CO2 NBio- CO2 Total CO2 CH4 N2O CO2e
Land Use kBTU/yr tons/yr MT/yr
General Office Building
204435 1.1000e-003
0.0100 8.4200e-003
6.0000e-005
7.6000e-004
7.6000e-004
7.6000e-004
7.6000e-004
0.0000 10.9094 10.9094 2.1000e-004
2.0000e-004
10.9743
Unrefrigerated Warehouse-No
Rail
327640 1.7700e-003
0.0161 0.0135 1.0000e-004
1.2200e-003
1.2200e-003
1.2200e-003
1.2200e-003
0.0000 17.4841 17.4841 3.4000e-004
3.2000e-004
17.5880
Total 2.8700e-003
0.0261 0.0219 1.6000e-004
1.9800e-003
1.9800e-003
1.9800e-003
1.9800e-003
0.0000 28.3936 28.3936 5.5000e-004
5.2000e-004
28.5623
Mitigated
CalEEMod Version: CalEEMod.2016.3.1 Date: 8/10/2017 9:40 AMPage 24 of 32
8811 Escondido Industrial - San Diego County APCD Air District, Annual

6.1 Mitigation Measures Area
6.0 Area Detail
5.3 Energy by Land Use - Electricity
Electricity Use
Total CO2 CH4 N2O CO2e
Land Use kWh/yr MT/yr
General Office Building
141960 33.4780 1.3500e-003
2.6000e-004
33.5886
Unrefrigerated Warehouse-No
Rail
753572 177.7128 7.1800e-003
1.3700e-003
178.2997
Total 211.1908 8.5300e-003
1.6300e-003
211.8883
Unmitigated
Electricity Use
Total CO2 CH4 N2O CO2e
Land Use kWh/yr MT/yr
General Office Building
141960 33.4780 1.3500e-003
2.6000e-004
33.5886
Unrefrigerated Warehouse-No
Rail
753572 177.7128 7.1800e-003
1.3700e-003
178.2997
Total 211.1908 8.5300e-003
1.6300e-003
211.8883
Mitigated
CalEEMod Version: CalEEMod.2016.3.1 Date: 8/10/2017 9:40 AMPage 25 of 32
8811 Escondido Industrial - San Diego County APCD Air District, Annual

ROG NOx CO SO2 Fugitive PM10
Exhaust PM10
PM10 Total
Fugitive PM2.5
Exhaust PM2.5
PM2.5 Total
Bio- CO2 NBio- CO2 Total CO2 CH4 N2O CO2e
Category tons/yr MT/yr
Mitigated 0.9532 2.0000e-005
1.9900e-003
0.0000 1.0000e-005
1.0000e-005
1.0000e-005
1.0000e-005
0.0000 3.8500e-003
3.8500e-003
1.0000e-005
0.0000 4.1000e-003
Unmitigated 0.9532 2.0000e-005
1.9900e-003
0.0000 1.0000e-005
1.0000e-005
1.0000e-005
1.0000e-005
0.0000 3.8500e-003
3.8500e-003
1.0000e-005
0.0000 4.1000e-003
6.2 Area by SubCategory
ROG NOx CO SO2 Fugitive PM10
Exhaust PM10
PM10 Total
Fugitive PM2.5
Exhaust PM2.5
PM2.5 Total Bio- CO2 NBio- CO2 Total CO2 CH4 N2O CO2e
SubCategory tons/yr MT/yr
Architectural Coating
0.1123 0.0000 0.0000 0.0000 0.0000 0.0000 0.0000 0.0000 0.0000 0.0000 0.0000
Consumer Products
0.8408 0.0000 0.0000 0.0000 0.0000 0.0000 0.0000 0.0000 0.0000 0.0000 0.0000
Landscaping 1.9000e-004
2.0000e-005
1.9900e-003
0.0000 1.0000e-005
1.0000e-005
1.0000e-005
1.0000e-005
0.0000 3.8500e-003
3.8500e-003
1.0000e-005
0.0000 4.1000e-003
Total 0.9532 2.0000e-005
1.9900e-003
0.0000 1.0000e-005
1.0000e-005
1.0000e-005
1.0000e-005
0.0000 3.8500e-003
3.8500e-003
1.0000e-005
0.0000 4.1000e-003
Unmitigated
CalEEMod Version: CalEEMod.2016.3.1 Date: 8/10/2017 9:40 AMPage 26 of 32
8811 Escondido Industrial - San Diego County APCD Air District, Annual

7.1 Mitigation Measures Water
7.0 Water Detail
6.2 Area by SubCategory
ROG NOx CO SO2 Fugitive PM10
Exhaust PM10
PM10 Total
Fugitive PM2.5
Exhaust PM2.5
PM2.5 Total
Bio- CO2 NBio- CO2 Total CO2 CH4 N2O CO2e
SubCategory tons/yr MT/yr
Architectural Coating
0.1123 0.0000 0.0000 0.0000 0.0000 0.0000 0.0000 0.0000 0.0000 0.0000 0.0000
Consumer Products
0.8408 0.0000 0.0000 0.0000 0.0000 0.0000 0.0000 0.0000 0.0000 0.0000 0.0000
Landscaping 1.9000e-004
2.0000e-005
1.9900e-003
0.0000 1.0000e-005
1.0000e-005
1.0000e-005
1.0000e-005
0.0000 3.8500e-003
3.8500e-003
1.0000e-005
0.0000 4.1000e-003
Total 0.9532 2.0000e-005
1.9900e-003
0.0000 1.0000e-005
1.0000e-005
1.0000e-005
1.0000e-005
0.0000 3.8500e-003
3.8500e-003
1.0000e-005
0.0000 4.1000e-003
Mitigated
CalEEMod Version: CalEEMod.2016.3.1 Date: 8/10/2017 9:40 AMPage 27 of 32
8811 Escondido Industrial - San Diego County APCD Air District, Annual

Total CO2 CH4 N2O CO2e
Category MT/yr
Mitigated 136.4054 1.2881 0.0313 177.9208
Unmitigated 136.4054 1.2881 0.0313 177.9208
7.2 Water by Land Use
Indoor/Outdoor Use
Total CO2 CH4 N2O CO2e
Land Use Mgal MT/yr
General Office Building
1.49296 / 1.1438
8.0549 0.0490 1.2100e-003
9.6385
Unrefrigerated Warehouse-No
Rail
37.8843 / 0
128.3505 1.2392 0.0300 168.2824
Total 136.4054 1.2881 0.0313 177.9208
Unmitigated
CalEEMod Version: CalEEMod.2016.3.1 Date: 8/10/2017 9:40 AMPage 28 of 32
8811 Escondido Industrial - San Diego County APCD Air District, Annual

8.1 Mitigation Measures Waste
Institute Recycling and Composting Services
7.2 Water by Land Use
Indoor/Outdoor Use
Total CO2 CH4 N2O CO2e
Land Use Mgal MT/yr
General Office Building
1.49296 / 1.1438
8.0549 0.0490 1.2100e-003
9.6385
Unrefrigerated Warehouse-No
Rail
37.8843 / 0
128.3505 1.2392 0.0300 168.2824
Total 136.4054 1.2881 0.0313 177.9208
Mitigated
8.0 Waste Detail
CalEEMod Version: CalEEMod.2016.3.1 Date: 8/10/2017 9:40 AMPage 29 of 32
8811 Escondido Industrial - San Diego County APCD Air District, Annual

Total CO2 CH4 N2O CO2e
MT/yr
Mitigated 30.7927 1.8198 0.0000 76.2877
Unmitigated 41.0570 2.4264 0.0000 101.7169
Category/Year
8.2 Waste by Land Use
Waste Disposed
Total CO2 CH4 N2O CO2e
Land Use tons MT/yr
General Office Building
9.77 1.9832 0.1172 0.0000 4.9134
Unrefrigerated Warehouse-No
Rail
192.49 39.0737 2.3092 0.0000 96.8035
Total 41.0570 2.4264 0.0000 101.7169
Unmitigated
CalEEMod Version: CalEEMod.2016.3.1 Date: 8/10/2017 9:40 AMPage 30 of 32
8811 Escondido Industrial - San Diego County APCD Air District, Annual

11.0 Vegetation
8.2 Waste by Land Use
Waste Disposed
Total CO2 CH4 N2O CO2e
Land Use tons MT/yr
General Office Building
7.3275 1.4874 0.0879 0.0000 3.6850
Unrefrigerated Warehouse-No
Rail
144.368 29.3053 1.7319 0.0000 72.6026
Total 30.7927 1.8198 0.0000 76.2876
Mitigated
9.0 Operational Offroad
Equipment Type Number Hours/Day Days/Year Horse Power Load Factor Fuel Type
10.0 Stationary Equipment
Fire Pumps and Emergency Generators
Equipment Type Number Hours/Day Hours/Year Horse Power Load Factor Fuel Type
Boilers
Equipment Type Number Heat Input/Day Heat Input/Year Boiler Rating Fuel Type
User Defined Equipment
Equipment Type Number
CalEEMod Version: CalEEMod.2016.3.1 Date: 8/10/2017 9:40 AMPage 31 of 32
8811 Escondido Industrial - San Diego County APCD Air District, Annual

11.0 Vegetation
CalEEMod Version: CalEEMod.2016.3.1 Date: 8/10/2017 9:40 AMPage 32 of 32
8811 Escondido Industrial - San Diego County APCD Air District, Annual