an empirical study: usage of the unified modeling language
TRANSCRIPT
California State University, San Bernardino California State University, San Bernardino
CSUSB ScholarWorks CSUSB ScholarWorks
Theses Digitization Project John M. Pfau Library
2005
An empirical study: Usage of the Unified Modeling Language in An empirical study: Usage of the Unified Modeling Language in
the Bachelor of Science and Master of Science degree programs the Bachelor of Science and Master of Science degree programs
at California State University, San Bernardino at California State University, San Bernardino
Cynthia Patrice Farquhar
Follow this and additional works at: https://scholarworks.lib.csusb.edu/etd-project
Part of the Higher Education Commons, and the Programming Languages and Compilers Commons
Recommended Citation Recommended Citation Farquhar, Cynthia Patrice, "An empirical study: Usage of the Unified Modeling Language in the Bachelor of Science and Master of Science degree programs at California State University, San Bernardino" (2005). Theses Digitization Project. 2929. https://scholarworks.lib.csusb.edu/etd-project/2929
This Thesis is brought to you for free and open access by the John M. Pfau Library at CSUSB ScholarWorks. It has been accepted for inclusion in Theses Digitization Project by an authorized administrator of CSUSB ScholarWorks. For more information, please contact [email protected].
AN EMPIRICAL STUDY: USAGE OF THE UNIFIED MODELING
LANGUAGE IN THE BACHELOR OF
SCIENCE AND MASTER OF SCIENCE
DEGREE PROGRAMS AT CALIFORNIA STATE
UNIVERSITY, SAN BERNARDINO
A Thesis
Presented to the
Faculty of
California State University
San Bernardino
In Partial Fulfillment
Of the Requirements for the Degree
Master of Science
in
Computer Science
byCynthia Patrice Farquhar
March 2005

AN EMPIRICAL STUDY: USAGE OF THE UNIFIED MODELING
LANGUAGE IN THE BACHELOR OF
SCIENCE AND MASTER OF SCIENCE
DEGREE PROGRAMS AT CALIFORNIA STATE
UNIVERSITY, SAN BERNARDINO
A Thesis
Presented to the
Faculty of
California State University,
San Bernardino
By
Cynthia Patrice Farquhar
March 2005
Approved by:
Date
Dr

Copyright 2005 Cynthia Patrice Farquhar
ABSTRACT
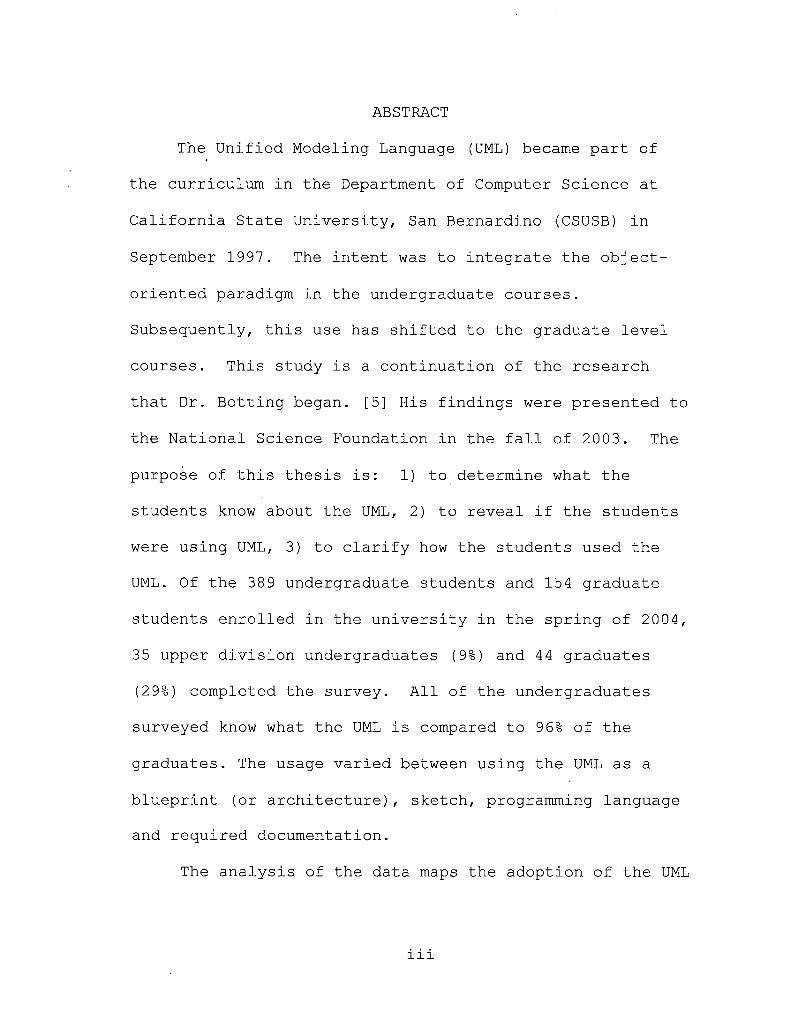
The Unified Modeling Language (UML) became part of
the curriculum in the Department of Computer Science at
California State University, San Bernardino (CSUSB) in
September 1997. The intent was to integrate the object-
oriented paradigm in the undergraduate courses.
Subsequently, this use has shifted to the graduate level
courses. This study is a continuation of the research
that Dr. Botting began. [5] His findings were presented to
the National Science Foundation in the fall of 2003. The
purpose of this thesis is: 1) to determine what the
students know about the UML, 2) to reveal if the students
were using UML, 3) to clarify how the students used the
UML. Of the 389 undergraduate students and 154 graduate
students enrolled in the university in the spring of 2004,
35 upper division undergraduates (9%) and 44 graduates
(29%) completed the survey. All of the undergraduates
surveyed know what the UML is compared to 96% of the
graduates. The usage varied between using the UML as a
blueprint (or architecture), sketch, programming language
and required documentation.
The analysis of the data maps the adoption of the UML
iii
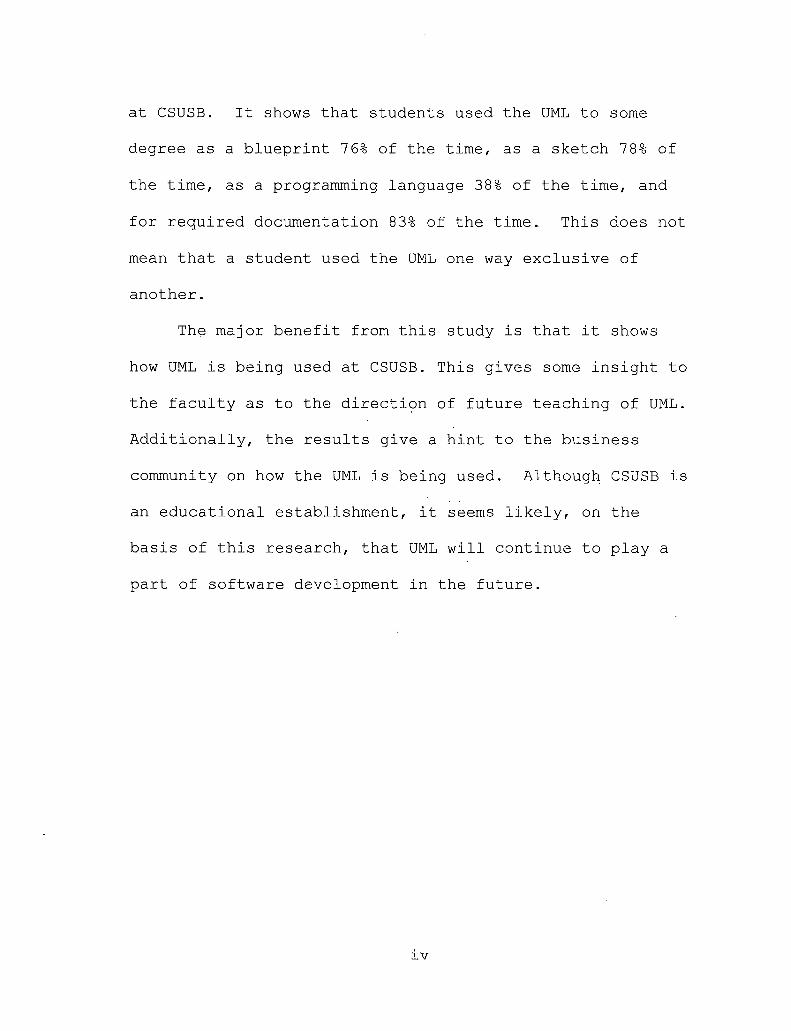
at CSUSB. It shows that students used the UML to some
degree as a blueprint 76% of the time, as a sketch 78% of
the time, as a programming language 38% of the time, and
for required documentation 83% of the time. This does not
mean that a student used the UML one way exclusive of
another.
The major benefit from this study is that it shows
how UML is being used at CSUSB. This gives some insight to
the faculty as to the direction of future teaching of UML.
Additionally, the results give a hint to the business
community on how the UML is being used. Although CSUSB is
an educational establishment, it seems likely, on the
basis of this research, that UML will continue to play a
part of software development in the future.
iv
ACKNOWLE DGEMENT S
I am thankful for all the blessings that have been
bestowed on me throughout this research. The opportunity
to continue with my education.at this level was truly a
gift from God.
You are the wind beneath my wings: words of a popular
song that represent my thought to the following people:
Dr. Karant agreed to become a member on my panel without
even knowing me. He has shown me the exactness I needed
to correctly defend my topic. His direct comments were
very much appreciated. For this, I thank him.
Dr. Concepcion and his wife have always encouraged me
throughout my college career. When I used to see them
outside of the college environment, Dr. Concepcion always
had a kind and welcoming word of advice with an urging to
complete this thesis. As a committee member, he pushed me
to the limit for perfection. I appreciate all that he has
done to encourage me to grow.
How do I begin to thank Dr. Botting? He never gave up on
me. When I received his letter asking me to consider
finishing my thesis, I was numb. I answered his letter
positively, and my journey began. There were missed
deadlines and misunderstandings along the way. He
v

continued to encourage me with kindness. Thank you for
all that you did for me. Without your gentle push, I
would not be writing this paper today.
I want to thank the faculty in the computer science
department for allowing me to take precious time from your
classes to survey the students. Without the student
survey, my thesis would definitely be void of valuable
information.
I give a special thanks to Monica Gonzales and the
office staff for all the background work that was done on
my behalf to complete this paper.
I also want to thank the National Science Foundation
(NSF) for the opportunity to give a presentation with Dr.
Botting in the fall of 2003. The NSF has contributed to
the computer science program at CSUSB through a
generalized grant award 9810708.
To the computer science students, thank you for your
time and effort in completing my survey.
To Maureen, Mike, Cindy, Genna Lynn, Sandy, Maggie, Tina
and Bruce, I thank you for their constant encouragement.
I want to thank my parents for planting the seed many
years ago about the importance of education.
Finally, I want to thank my children and my husband.
vi

To my family

TABLE OF CONTENTS
ABSTRACT.......................... ..................iii
ACKNOWLEDGEMENTS................................... v
LIST OF TABLES.........................................ix
LIST OF FIGURES . .............................. x
CHAPTER ONE: INTRODUCTION .......................... 1
1.1 History .................................. 3
1.2 Diagrams.................................. 4
1.3 Versions.................................. 7
CHAPTER TWO: PURPOSE OF THE STUDY..................... 10
CHAPTER THREE: METHODOLOGY OF RESEARCH
3.1 Student Surveys...............................13
3.2 Master's Projects .......................... 16
3.3 Faculty .....................................17
CHAPTER FOUR: STATISTICAL RESULTS
4.1 Survey Results .............................18
4.2 Master's Thesis and Projects .............. 31
4.3 Faculty .................................. 33
CHAPTER FIVE: CONCLUSION ............................ 34
APPENDIX A: DRAFT PILOT QUESTIONNAIRE .............. 39
APPENDIX B: QUESTIONNAIRE .......................... 42
APPENDIX C: PILOT QUESTIONNAIRE COMMENTS BYCLASS.................................. 4 5
vii
APPENDIX D: FINAL SURVEY COMMENTS ................... 47
APPENDIX E: MEAN/MODE/MEDIAN TOATL POPULATIONFINAL SURVEY............................ 4 9
APPENDIX F: MEAN/MODE/MEDIAN TABLES BY CLASS ........ 52
APPENDIX G: INITIAL APPROVAL LETTER ................. 65
APPENDIX H: PROTOCOL CHANGE APPROVAL ................. 67
APPENDIX I: BACHELOR OF SCIENCE DEGREE IN COMPUTERSCIENCE CURRICULUM FLOW CHART ........... 69
APPENDIX J: MASTER OF SCIENCE CURRICULUM FLOWCHART ..................................... 71
REFERENCES.............................................73
viii
LIST OF TABLES
Table 1. Pilot Questionnaire Results ................ 1,8
Table 2. Pilot Questionnaire Usage Results ....... 20
Table 3. Computer Science 455: SoftwareEngineering............................... 21
Table 4. Computer Science 330: Data Structures ... 22
Table 5. Computer Science 599: Foundations ofSoftware Systems ........................ 22
Table 6. Computer Science 599: Foundations ofSoftware Systems Usage Results .......... 23
Table 7. Computer Science 330: Data StructuresUsage Results ........................... 24
Table 8. Completed Questionnaires .................. 26
Table 9. Questionnaire Results/Heard.......... .. . 27
Table 10. Usage Table ................................ 29
Table 11. Total Usage Results........................ 30
Table 12. Diagram Usage in Thesis/Projects ........ 32
Table 13. Usage in Master's Projects ................ 32
ix
LIST OF FIGURES
Figure 1. Pilot Questionnaire #2 ........................ 19
Figure 2. Total Population Surveyed .................... 25
x
CHAPTER ONE
INTRODUCTION
"Software engineering is the sub-discipline of
computer science that concerns itself with-the entire
process of software creation." [17] One of the biggest
challenges in developing software is communication between
the parties involved. Time is money. Repeatedly
discussing software during its creation takes time, this
in turn costs money. However, with many teams of people
involved in the creation process, this communication must
happen to remove the possibility for error. Additionally,
the more people involved in a project, the more time is
spent on communication. [5] In the computer science arena,
there was'a movement underway that would aid with the need
for extensive communication. There was a desire to
standardize the language unifying "the many threads and
incarnations of the Knowledge Revolution." [4]
"Unification creates a single, consistent system from the
most prominent methods within the industry." [3] The OMG
(Object Management Group) decided to accept and
standardize the method and language for creating and
depicting software development plans.
1

standardization allowed for unification and aided in
minimizing confusion by providing a means to visually see
the interactions and relationships in a program. CSUSB
followed in the same direction. In his report, Dr.
Concepcion states "in September 1997, the Department of
Computer Science, CSUSB, undertook the ROOT (Refashioning
Object-Oriented Technology/Teaching) Project in
partnership with Rational Software through the SEED
(Software Engineering for Educational Development)
program. [8] Five undergraduate classes were targeted to
use object-oriented analysis and design, using the UML.
[8] Since 1997, the UML has been integrated in the
graduate level courses. Because the UML has been the
standard for over six years, the question at hand was how
well it has been accepted and how it has been used at
CSUSB.
1.1 History
The Unified Modeling Language is a language unique to
software development. In particular, it is a language
that is used for "specifying, visualizing, constructing,
and documenting artifacts of software systems, as well as
for business modeling and other non-software systems." [2]
3

As stated earlier, it is to the software engineer what
blueprints are to the architects and engineers. It is
not:
❖ A visual programming language, but a visual modeling
language.
❖ A tool, but a language.
❖ A process, but enables processes. [4]
It is:
♦♦♦ A general-purpose modeling language.
♦♦♦ A broadly applicable modeling language.
❖ A tool-supported modeling language.
❖ An industry-standardized modeling language. [4]
The use of the UML is fundamentally for communication
[11] within the software development process. It can also
be used for code generation.
1.2 Diagrams
The basis of the UML requires using different types
of predetermined diagrams. Following are types of
diagrams used: use case, class (object), interaction
(sequence and collaboration), state, activity, and
physical (deployment and component).
4

The use case diagram is one of the most widely used
diagrams. "Use case diagrams describe the functionality of
a system and users of the system." [3] Use case diagrams
use an actor to model the user's role with respect to the
system. Actors perform what the use case illustrates. 'An
actor might carry out multiple use cases. Similarly, use
cases could have many actors. [12] Actors can be any
entity "that needs some information from the current
system." [12]
The second most used diagram, due to its broad "range
of modeling concepts," [12] is the class diagram. "Class
diagrams describe the static structure of a system, or how
it is structured rather than how it behaves." [3] Each
class diagram consists of: (1) name, (2) structure, and
(3) behavior. The fundamental ideas associated with the
class diagrams that a’re used most include: (1) objects
and (2) relationships. Object diagrams display a picture
of the objects at a specific time. [12] Relationships that
exist between the objects can be broken down to show
associations and subtypes.
Fowler states that there are "three perspectives you
can use in drawing class diagrams[12] These include:
(1) conceptual, (2)’ specification, (3) implementation. To
5
show how concepts interrelate, one would use the
conceptual perspective. The primary use for specification
is when "the interfaces of the software, not the
implementation" [12] are examined. Implementation
demonstrates how the program is set to perform.
"Sequence diagrams describe interactions among
classes." [3] They contain the following:
1) class roles (how objects behave within interaction)
2) lifelines (longevity of object)
3) activations (time performing operation)
4) messages (communication between objects) [3]
State diagrams are used to show "the behavior of an
object in reaction to an event." [15] In other words, when
something happens to a class, the state diagram shows how
the state of the class changes based on the external
stimuli. A state could be active, inactive or in
transition depending on the particular situation.
Activity diagrams depict the class behavior in
response to internal processing. [3] They are good for
modeling algorithms and procedures. Deployment diagrams
show "the assignment of concrete software artifacts to
computational nodes." [15]
6

Deployment diagrams show how resources are being
utilized. These diagrams provide a total view of the
system. The resources shown in a deployment diagram
include computers and printers.
Component diagrams show how the system gets
implemented. These diagrams include all components and
their individual relationships. "Components are classes
that define development-time and run-time physical
objects." [3] They are much like a class diagram except a
component diagram emphasizes "that the interfaces are
important, and it is modular, self-contained and
replaceable." [15]
1.3 Versions
There are many versions of the UML. Initially, it
began as the result of the combined work of Booch (Ada
method) and Rumbaugh (OMT). This version was 0.8. When
Jacobson (Objectory) joined forces with Booch and Rumbaugh
and version 0.9 was released. At this juncture, the name
Unified Modeling Language was adopted.
The UML underwent two main changes and some minor
changes. The major changes happened between UML 1.0 to
1.1 and UML 1.2 to 1.3. These changes included a broader
7

scope for the class diagram, a more definitive
understanding of the {complete} and {frozen} restraint and
the term "role".
From UML 1.2 to 1.3 the changes included
relationships in the use case diagrams and semantics of
the activity diagrams. The use case diagrams in UML 1.3
contain <<include>> (which replaced «uses») , <<extend>>,
and use case generalization. [12] The fork and j pin
replaced the synchronization bar in activity diagrams.
[12] Conditional behavior was noted by the diamond-shaped
decision activity. [12] The profile and artifact appeared
in UML 1.4. Additionally, the symbol emerged as a means
"to handle Java's package visibility." [12]
The most modifications of the UML took place in UML
2.0 in 2004. New diagrams emerged (object and package
diagrams). Name changes to existing diagrams occurred
.(collaboration to communication diagrams). New diagram
types (interaction overview diagrams, timing diagrams, and
composite structure diagrams) surfaced. The class diagram
underwent some changes that included some new keywords.
[10] Sequence diagrams now managed behaviors. Activity
8

diagrams no longer needed to adhere to the matching forks
and joins as in UML 1.
9
CHAPTER TWO
PURPOSE OF THE STUDY
The object oriented (00) paradigm using the UML came
to CSUSB because of the ROOT (Refashioning Object-Oriented
Technology Teaching) project [9] in 1997. This project
was a joint effort of the Department of Computer Science
at CSUSB and Rational Software through the Software
Engineering for Educational Development (SEED)
Partnership. [9] The need for this project arose from the
demands of the software industry. This industry needed
"computer science graduates with training and education in
the object-oriented paradigm." [9] This project was
accomplished by integrating the UML into undergraduate
classes.
The purpose of this study was: 1) to determine what
students knew about UML 2) to reveal if the students were
using UML, and 3) to clarify how the students used UML. By
determining how the UML was being used, the study also
differentiated if usage was due to personal preference or
due to course requirements from the faculty.
Additionally, to determine whether there had been an
increase in Usage of the UML over the last seven years,
10

past theses and projects were reviewed. Faculty responses
to the questionnaire were also documented. Their
responses validated how they used the UML.
Ritu Agarwal and Atish Sinha published their report of
a similar type study that was "aimed at assessing the
usability of UML." [1] The study dealt specifically with
techniques and basic usability of the UML. The population
that was surveyed included developers with prior training
in the UML. The difference with their study and this
thesis lies in the fact that professionals in the computer
science industry rather than students were surveyed.
Students typically-do not have the same exposure and
experience to the UML as do professionals. Surveying
students paints a clear picture of how the UML is used at
the educational level.
Martin Fowler, in his speech at the UML Conference in
San Francisco, challenged academia to determine how the
UML was being used on college campuses. [11] His concern
with this issued was encouragement to continue with this
research, especially since his classifications of the UML
are seminal. Craig Larman, in his book Applying UML and
Patterns, An Introduction to Object-Oriented Analysis and
Design and Iterative Development, uses this same
11
classifications as Fowler. Larman used three of the four
examples: blueprint, sketch, and programming language.
[15] Required documentation is a usage that Fowler added
to his challenge to academia to find.out if students were
using the UML due to requirements rather than personal
preference. Using the UML for required documentation
indicated that the user did not have a choice. The survey
conducted as part of this paper identifies this choice.
Fowler's challenge to academia substantiated the need for
this research.
12
CHAPTER THREE
METHODOLOGY OF RESEARCH
The plan of attack took on three phases. In the
first phase, students that were currently enrolled in a
computer science class at CSUSB were surveyed. Phase 2
involved investigating past computer science master's
projects. The final phase surveyed the faculty members.
Gathering information from all three groups was necessary
to realize the full scope of the use of the UML in the
computer science department.
3.1 Student Surveys
The survey was developed via a pilot survey. Before
distributing this questionnaire to the students,
permission from the Institution Review Board (IRB) was
needed. Approval for distribution of the pilot
questionnaire was given February 20, 2004, and was given
an Exempt Review IRB #03083 (Appendix G). After receiving
IRB approval, the pilot questionnaire was distributed to
three computer science classes to determine the base
knowledge and understanding of the UML. The courses
necessary for a BS degree In Computer Science at CSUSB
13
follows a logical flow. (Appendix I) Two undergraduate
classes and one graduate class participated with the pilot
questionnaire: CSCI 330, CSCI 455, and CSCI 599. These
classes were chosen because they follow CSCI 201 and 202
(Computer Science I and II) in the computer science
curriculum. (Appendix I) These two classes are the
student's first exposure to the UML. After completing
CSCI 202, CSCI 330, Data Structures, is one of the next
classes to be taken.' It includes more UML. This class
deals with "abstract data structures including lists,
stacks, queues and trees; their storage allocation and
associated application algorithms." [7] CSCI 455, Software
Engineering, follows CSCI 330. Software Engineering is a
class that studies "advanced techniques and technology
used to produce large software systems." [7] It is one of
the last core classes taken for a bachelor's degree in
computer science. It uses a lot of UML. CSCI 599,
Foundations of Software Systems, is a graduate class that
has the UML integrated in the course, work. This class must
be taken as an elective for those students who did not
fulfill the data structure and operating system
requirements. Specifically, in this class, students learn
the "software development process which includes software
14

life-cycles,' software techniques and technologies used to
produce large software systems; operating systems
including processes, input/output, memory management, and
file systems." [7] Answers to this survey were analyzed
and used to refine the questionnaire for the actual
survey.
Next, the final questionnaire was created and needed
approval from the IRB for a protocol change. This was
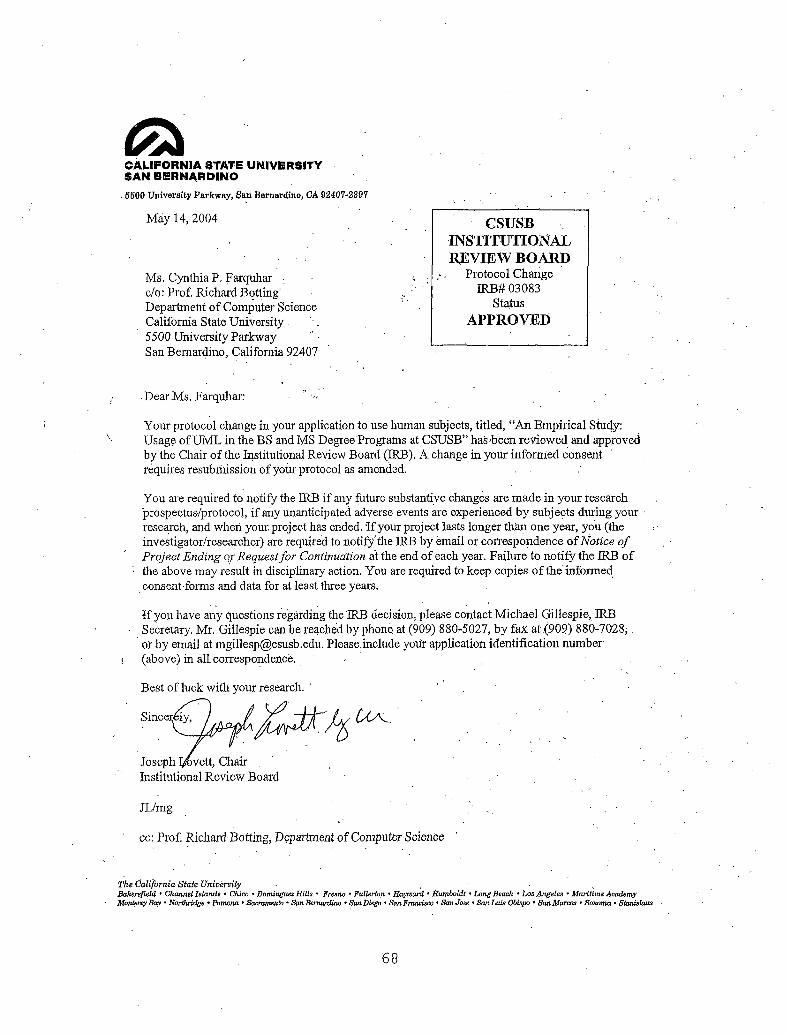
approved on May 14, 20004 (Appendix H). The final
questionnaire was subsequently distributed to three
undergraduate classes (CSCI 330, CSCI 401, and CSCI 460)
and three graduate classes (CSCI 620, CSCI 630, and CSCI
660). Once again, the classes that were chosen to
participate with the survey followed the appearance of the
UML in the curriculum for computer science. CSCI 330,
Data Structures, was chosen for a second time for the same
reason as stated previously. CSCI 401, Contemporary
Computer Architecture, is a core class that follows CSCI
310 and CSCI 313, Digital Logic and Machine Organization.
This class requires CSCI 201 and 202. Contemporary
Computer Architecture is a class dealing with "design
methodology; processor units and control units of von
Neumann computer architectures; RISC architectures,
15
including pipelining and parallel-processing." [7] CSCI
460, Operating Systems, follows CSCI 330 and CSCI 313.
The Operating Systems class is "an overview of operating
systems [that deals with] principles of resource
management and control. Multiprogramming, distributed
systems and multiprocessor systems [are] included." [7]
The graduate classes chosen were: CSCI 620, Programming
Languages, CSCI 630, Theory of Algorithms and Their
Analysis, and CSCI 660, Operating System Concepts and
Theory. As with previous selections, these classes were
chosen due to their standing in the requirements for a
Master's Degree in Computer Science. While both CSCI 630
and CSCI 660 are required classes, CSCI 620 is an elective
class. This combination of elective and required classes
gave good coverage of the whole student population.
3.2 Master's Projects
In order to determine the usage of the UML throughout
the last 7 years, past Master's projects were reviewed.
Sixty-three research papers were reviewed. This
represents all of the Master's projects that were found in
the Computer Science office at the time of the survey.
The goal was to document any reference or usage of the UML
16
over the last seven years. Theses that dealt with
research only were not included in this survey, only
projects that had programs.
3.3 Faculty
Seventeen questionnaires were distributed to the
faculty members that were noted on the Computer Science
web site at CSUSB. Responses to the questionnaire about
using the UML were documented. Of the 17 instructors that
were targeted, four of them were part-time lecturers, one
was a fall lecturer, and 12 were tenure-track computer
science faculty members. There was no differentiation
between the full time faculty members and the others
surveyed. The part-time lecturers typically teach classes
that fall under the umbrella of the Computer Science
Department, yet are not required classes for a bachelor's
degree in Computer Science. The fall lecturer was a
seasonal instructor, not a full time faculty member. The
twelve tenure-track faculty members teach the required
computer science classes for a degree in Computer Science.
17

CHAPTER FOUR
STATISTICAL RESULTS
4.1 Survey Results
The pilot questionnaire was the first part of the
study that was reviewed. The questionnaire was designed to
determine how many students had even heard of the UML.
The following Table 1 summarizes the findings:
Table 1. Pilot Questionnaire Results
CLASS DISTRIBUTED HEARD OF UML NOT HEARD OFUML
ComputerScience330
14 12 2
ComputerScience455
30 30 0
ComputerScience599
10 10 0
Out of the 54 questionnaires distributed, only two
students (or 3%) had not heard of the UML. This means that
97% had heard of the UML. The two students that had not
heard of the UML were in CSCI 330 Data Structures. The
following graph (Figure 1) shows the distribution.
18

35
Data Structures Foundations of Software CLASSES
Software Engineering
Figure 1. Pilot Questionnaire #2
After reviewing these results, how the students used the
UML was of interest. (Please note that four students did
not answer this question.) Clearly, in the undergraduate
classes, the UML was being used as a blueprint. However,
in CSCI 599, the UML was primarily being used for required
documentation. The following table summarizes the
findings:
19

Table 2. Pilot Questionnaire Usage Results
CLASS SKETCH BLUEPRINT PROGRAMLANGUAGE
REQUIREDDOCUMENTATION
ComputerScience330
3 5 2 0
ComputerScience455
7 14 1 8
ComputerScience599
' 2 3 1 4
The test for associations used the %2 formula:
%2= (Observed - Expected) 2Expected Equation (1)
"Chi square derives a representation of the null
hypothesis—that all things being equal scenario by the
following. The expected frequency in each cell is the
product of that cell's row total multiplied by that cell's
column total, divided by the sum total of all observations
[9]." A test for an association between the answer from
question #4 (I use the UML regularly for my software
development.) and #5 (I use the UML as: 1) a sketch, 2) a
blueprint, 3) a programming language, 4) required
documentation) was done. This was for the responses
20
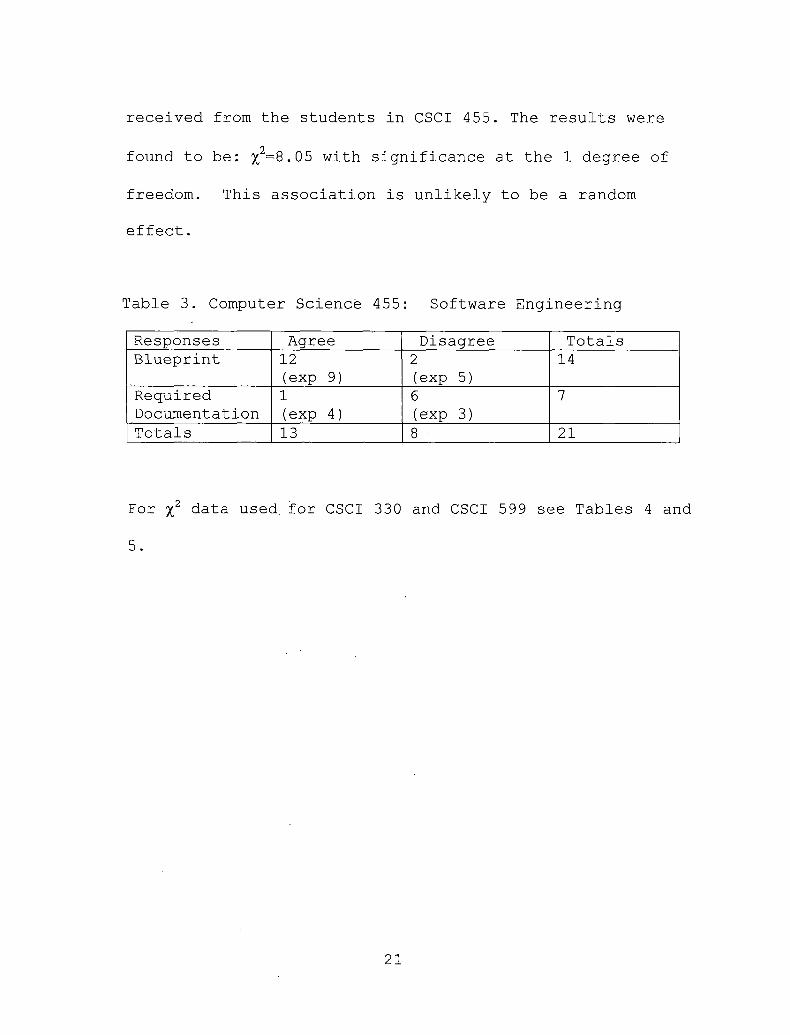
received from the students in CSCI 455. The results were2found to be: %=8.05 with significance at the 1 degree of
freedom. This association is unlikely to be a random
effect.
Table 3. Computer Science 455: Software Engineering
Responses Agree Disagree TotalsBlueprint 12
(exp 9)2(exp 5)
14
RequiredDocumentation
1(exp 4)
6(exp 3)
7
Totals 13 8 ■ 21
For %2 data used, for CSCI 330 and CSCI 599 see Tables 4 and
5.
21

Table 4. Computer Science 330: Data Structures
Responses Agree Disagree Totals
Blueprint 3(exp 4)
2(exp 1)
5
ProgrammingLanguage
■2(exp 1)
0(exp 1)
2
Totals 5 2 7
X2 for CSCI 599 was calculated to be 2.5 with 1 degree of
freedom. For CSCI 330, x2 was calculated to be
3.25 with one degree of freedom.
"Blueprint" and "a programming language" were used
for the summary of CSCI 330 because no answers reflected
required documentation.
Table 5. Computer Science 599: Foundations of Software Systems
Responses Agree Disagree Totals
A blueprint 2(exp 1)
1(exp 2)
3
RequiredDocumentation
1(exp 2)
3(exp 2)
4
Totals 3 4 7
22

The students in CSCI 599 were split on the issue. Five
students stated that they used the UML regularly. Five
students did not. Of the students that used UML
regularly, two used it as a blueprint, one as a
programming language, one as.a sketch and one for required
documentation. Three of the five students that did not
use the UML regularly use it- for required documentation.
Of the other two, one used it for a blueprint; one used it
as a sketch. See Table 6 below.’
Table 6. Computer Science 599: Foundations of Software Systems Usage Results
Blueprint ProgrammingLanguage
Sketch RequiredDocumentation
Used UML Regularly
2 1 1 1
Did NotUse UML Regularly
1 0 1 3
In CSCI 330, 12 responses were
claimed that they used the UML
not. The table below explains
recorded. Seven students
regularly, whereas five did
the distribution.
23
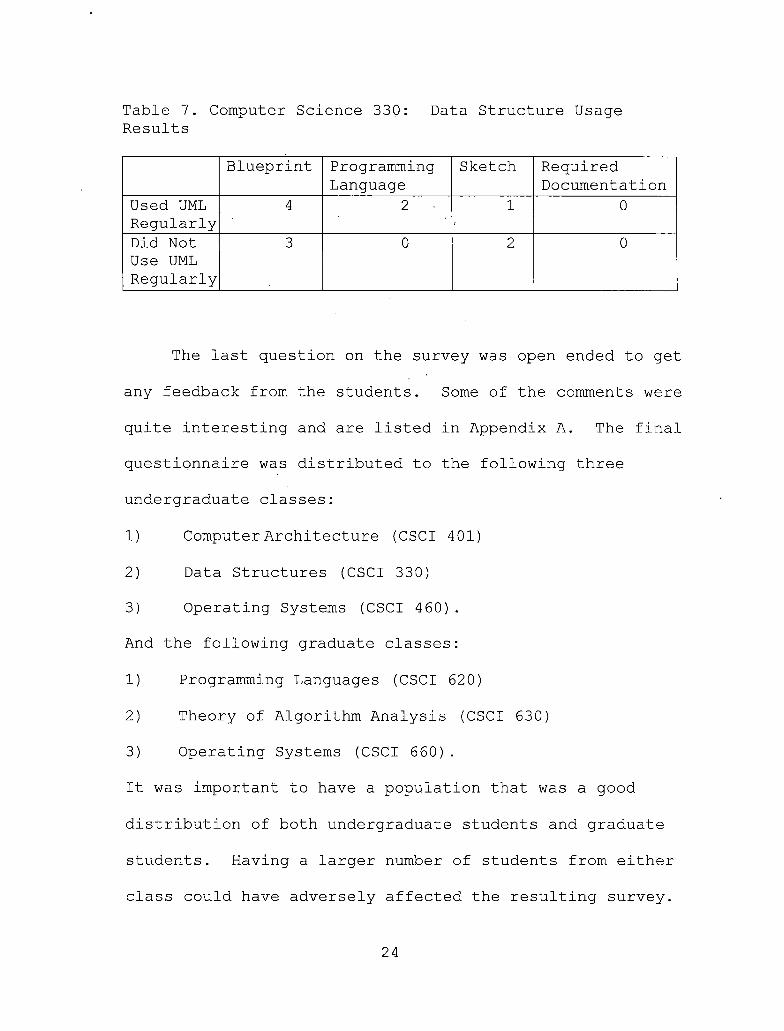
Table 7. Computer Science 330: Data Structure Usage Results
Blueprint ProgrammingLanguage
Sketch RequiredDocumentation
Used UML Regularly
4 2 ■ 1 0
Did Not Use UML Regularly
3 0 2 0
The last question on the survey was open ended to get
any feedback from the students. Some of the comments were
quite interesting and are listed in Appendix A. The final
questionnaire was distributed to the following three
undergraduate classes:
1) Computer Architecture (CSCI 401)
2) Data Structures (CSCI 330)
3) Operating Systems (CSCI 460).
And the following graduate classes:
1) Programming Languages (CSCI 620)
2) Theory of Algorithm Analysis (CSCI 630)
3) Operating Systems (CSCI 660).
It was important to have a population that was a good
distribution of both undergraduate students and graduate
students. Having a larger number of students from either
class could have adversely affected the resulting survey.
24

The following graph shows the mix of students that
returned surveys.
Figure 2. Total Population Surveyed
To prevent duplication of survey results, students were
asked to simply write, "Already taken" across the top of
the questionnaire if they had already completed on in any
other course. This indicated that the student's answers
were already taken into consideration and not that the
students declined to participate in the survey. This also
minimized the possibility of dual answers being submitted
and indicated when the population had been saturated.
25
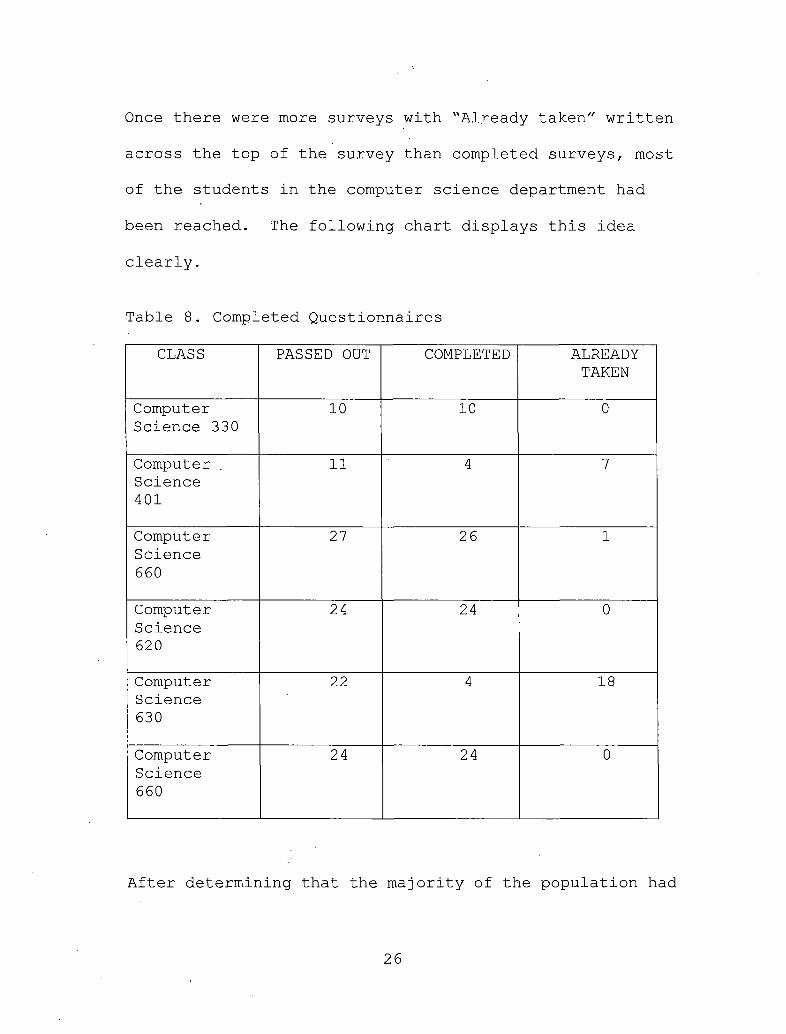
Once there were more surveys with "Already taken" written
across the top of the survey than completed surveys, most
of the students in the computer science department had
been reached. The following chart displays this idea
clearly.
Table 8. Completed Questionnaires
CLASS PASSED OUT COMPLETED ALREADYTAKEN
Computer Science 330
10 10 0
Computer . Science401
11 4 7
ComputerScience660
27 26 1
ComputerScience620
24 24 0
ComputerScience630
22 4 18
ComputerScience660'
24 24 0
After determining that the majority of the population had
26
been reached, and that the population was a good cross
section of undergraduate students and graduate students,
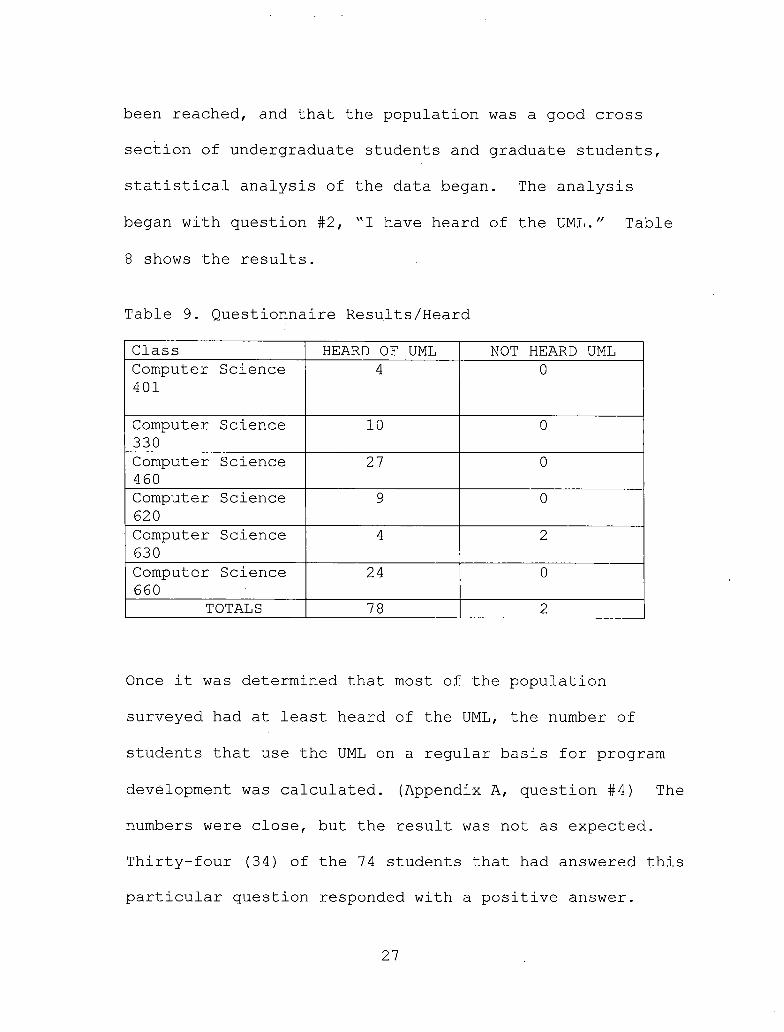
statistical analysis of the data began. The analysis
began with question #2, "I have heard of the UML." Table
8 shows the results.
Table 9. Questionnaire Results/Heard
Class HEARD OF UML NOT HEARD UMLComputer Science 401
4 0
Computer Science 330
10 0
Computer Science 460
27 0
Computer Science 620
9 0
Computer Science 630
4 2
Computer Science 660
24 0
TOTALS 78 2
Once it was determined that most of the population
surveyed had at least heard of the UML, the number of
students that use the UML on a regular basis for program
development was calculated. (Appendix A, question #4) The
numbers were close, but the result was not as expected.
Thirty-four (34) of the 74 students that had answered this
particular question responded with a positive answer.
27
That means that 46% used the UML regularly for software
development. So, 54% did not use the UML on a regular
basis. There was no apparent difference between the
percentage of graduates and undergraduates that use the
UML regularly. In other words, 46% of the undergraduate
and 46% of the graduate students used the UML regularly.
Conversely, 54% of both the undergraduate and graduate
students did not use the UML regularly. A comparison was
made for an association using Equation (1) between
question 4 and question 5. (Appendix A)
28
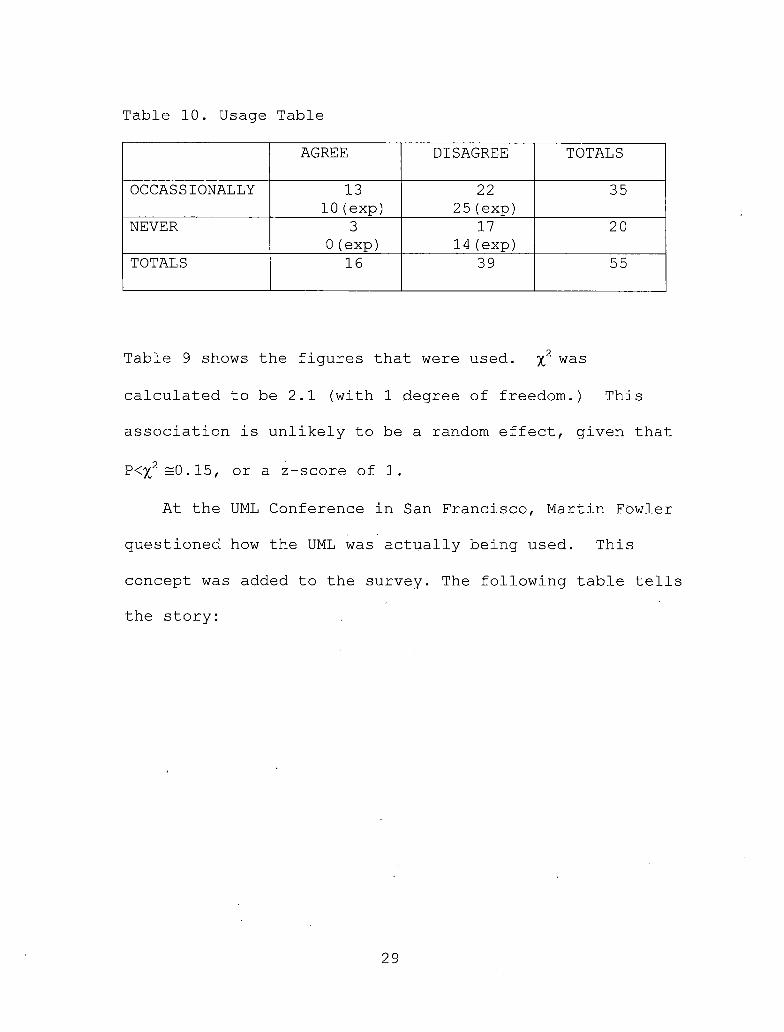
Table 10. Usage Table
AGREE DISAGREE TOTALS
OCCASSIONALLY 1310(exp)
2225(exp)
35
NEVER 30(exp)
1714(exp)
20
TOTALS 16 39 55
Table 9 shows the figures that were used. %2 was
calculated to be 2.1 (with 1 degree of freedom.) This
association is unlikely to be a random effect, given that
P<%2s0.15, or a z-score of 1.
At the UML Conference in San Francisco, Martin Fowler
questioned how the UML was actually being used. This
concept was added to the survey. The following table tells
the story:
29

Table 11. Total Usage Results
Always Often Occasionally Never Totals
Sketch 5(6%)
16(21%)
39(51%)
17(22%)
77
Blueprint 5 ' • (6%)
18(23%)
25(32%)
29(38%)
77
ProgrammingLanguage
3(4%)
10(13%)
16(21%)
47(62%)
76
RequiredDocumentation
9(12%)
25(33%)
29(38%)
13(17%)
76
Totals(responses)
22 69 109 106 306
This means that a sketch is used always about 6% of the
time, but combining "often" and "occasionally" it is used
72% of the time. The most startling result is the fact
that 62% of the time it is never used as a programming
language.
Appendix B shows the mean, mode and median of each
question on the final survey. "Strongly agree" was given
a value of 1. "Agree" was given a value of 2. "Disagree"
was given a value of 3. "Strongly disagree" was given a
value of 4. The chart shows that most of the time the
mean, average, was very close to the mode, or the answer
that was most often chosen. Question number 7 states:
"The UML is difficult to understand." The mean numerical
30
answer to this question was 2.9, meaning that is was
between agree (2) and disagree (3). Question number 9
states: "I find the UML to be confusing." The mean
numerical answer to this question was 2.8. This indicates
that most of the student's answers are more in
disagreement with the statement. Resulting numerical
values can be seen in Appendix E.
When comparing the number of undergraduate students
that use the UML regularly for software development to the
number of graduate students that use the UML, the numbers
were close. Sixteen of the 35 undergraduate students
surveyed use the UML on a regular basis for software
development. This number is slightly lower than the 19
graduate students that use the UML in the same manner.
4.2 Master's Thesis and Projects
Of the sixty-three documents that were reviewed,
forty-four had a mention of the UML or used UML notation.
One of the earliest projects that actually used the UML
was that of Alka Nand in 1997. In this paper class
diagrams were used several times. [16] Sumit Imsuksri also
used some UML in his paper. He even called it "Universal
Modeling Language."[13] His paper was written in 2002.
31
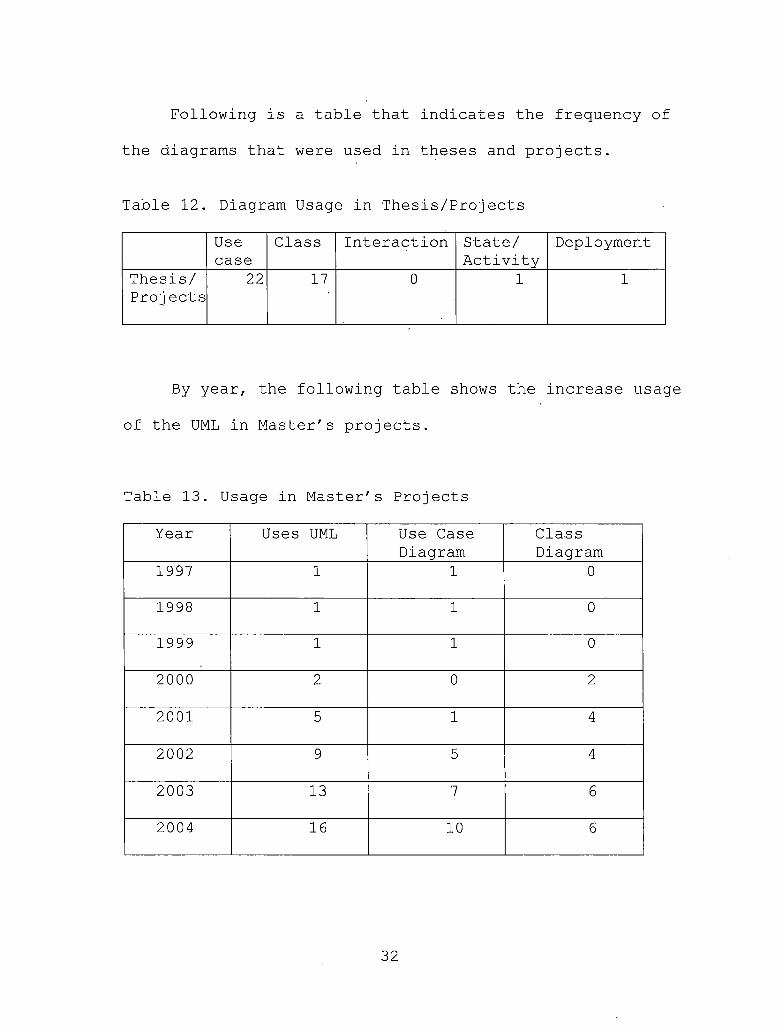
Following is a table that indicates the frequency of
the diagrams that were used in theses and projects.
Table 12. Diagram Usage in Thesis/Projects
Usecase
Class Interaction State/Activity
Deployment
Thesis/Projects
22 17 0 1 1
By year, the following table shows the increase usage
of the UML in Master's projects.
Table 13. Usage in Master's Projects
Year Uses UML Use Case Diagram
ClassDiagram
1997 1 1 0
1998 1 1 0
1999 1 1 0
2000 2 0 2
2001 5 1 4
2002 9 5 4
2003 13 7 6
2004 16 10 6
32

4.3 Faculty
The same questionnaire that was given to the students
was given to the faculty with a cover letter encouraging
any additional comments. Only five questionnaires from
faculty members were returned. Of the five that were
received, one had never heard of UML. From the four that
have heard of the UML, only one was able to correctly
identify that the UML was not a method for software
development and that it was, in fact, a language. Two
faculty members actually use the UML regularly for
software development. Regarding the question about using
the UML as a sketch, three members only use it
occasionally. One member uses it always. There were no
additional comments about the UML received despite an
encouragement to do so.
33
CHAPTER FIVE
CONCLUSION
"The survey was designed to find out how well
students at CSUSB were learning one small part of the
curriculum." [6] This is the first small step in the
direction of answering the larger question of UML's
future. Not all responses to all questions were noted.
Important items were discussed within the chapter
identified. Resulting data from the survey has been
reported and displayed in graphical form. The target was
narrow. It included only students enrolled in Computer
Science classes. There were 389 undergraduates and 154
graduates registered at the time the survey was conducted.
The procedure was simple. The results are limited only to
the use of the UML at CSUSB. The content of the surveys
asked pertinent questions to the usage of the UML. The
right group of people was asked. "The results may not
apply to experienced practitioners or students in other
programs, or to other notations, languages, and methods.
Further research is needed to establish how the UML is
being applied in practice and what it's future will be."
[6]
34

Kitchenham discusses data validation and policies for
handling incomplete questionnaires. [14] In her paper, she
states that even when some surveys are incomplete, sample
statistical analysis can be done as well as mean values
can be calculated. The number of incomplete
questionnaires was so insignificant that all papers were
accepted. In the pilot questionnaire, some questions were
found to possibly have two answers. To remedy this, the
final questionnaire removed any and all possibilities of
this happening.
The population that returned the surveys demonstrated
a mix of undergraduates and graduates. Based on the
number of surveys that were returned marked "Already
taken," the majority of the desired population of computer
science students was reached. Of this population, almost
all had heard of the UML.
The pilot questionnaire proved to be a valuable tool
and provided insight for the formulation of the final
questionnaire. In particular, the responses to question
#5 were somewhat mixed. [Appendix A] Some students marked
more than one response. Some students put numbers beside
the answers. The final questionnaire split the responses
into four different questions. As stated previously,
35

based on the responses (see Chart 8), 62% never use the
UML as a programming language. This is significant.
Between 50% and 72% of the responses stated that the use
of the UML as a sketch, blueprint, and for required
documentation was often and occasionally.
Fowler states in his book [12] that the UML is a
modeling language, not a method. Of the 85 questionnaires
that were returned, only five knew this fact. This opens
the door for future study on how students and faculty
define methods and languages.
Of the master's project reports that were reviewed,
over 74% had some mention of the UML. Most commonly used
diagrams were the use case diagram and the class diagram.
The information reported in Table 12, clearly shows that
the usage of the UML has increased since 1997.
The faculty allowed access to their classes for the
purpose of distributing the survey. Yet, at the same
time, there were not many questionnaires returned from the
faculty. The busy schedules and workload of faculty
members might have something to do with this. The number
of faculty members that returned the survey was 30%. Two
of the faculty surveyed actually uses the UML with any
regularity (40%). This could be an area of concern.
36
In closing, the usage of the UML has been increasing
in a positive direction. The knowledge of UML is
definitely rising. The usage, based on the answers of
survey, indicate that the UML is being used at CSUSB as a
sketch and for required documentation.
Based on the information already provided, the UML is
becoming more of an accepted "modeling language for
specifying, visualizing, constructing, and documenting the
artifacts of a system-intensive process." [4] These
results may not apply to experienced practitioners or
students in other programs, or to other notations,
languages, and methods. Further research is needed to
establish how the UML is being applied in practice and
what it's future will be. The Computer Science Department
should carry out a similar survey of its alumni.
In his speech at the UML conference in San
Francisco, Martin Fowler challenged the audience with the
question of finding out how the UML is being used. [8]
This particular study had already begun. Because so
little time has transpired since Fowler's challenge to
academia, no student-surveys similar to this one were
found. Comparable surveys on other university campuses
would be helpful. Since beginning this paper, UML 2.0 has
37
been developed and released. Further research in response
to the new version would certainly be appropriate. The
reference manual for UML 2.0 includes over 600 pages of
documentation. [11] The size of the manual could be a
deterrent to some students and developers. This
definitely leaves the door open for further research on
the subject.
38

APPENDIX A
DRAFT PILOT QUESTIONNAIRE
39
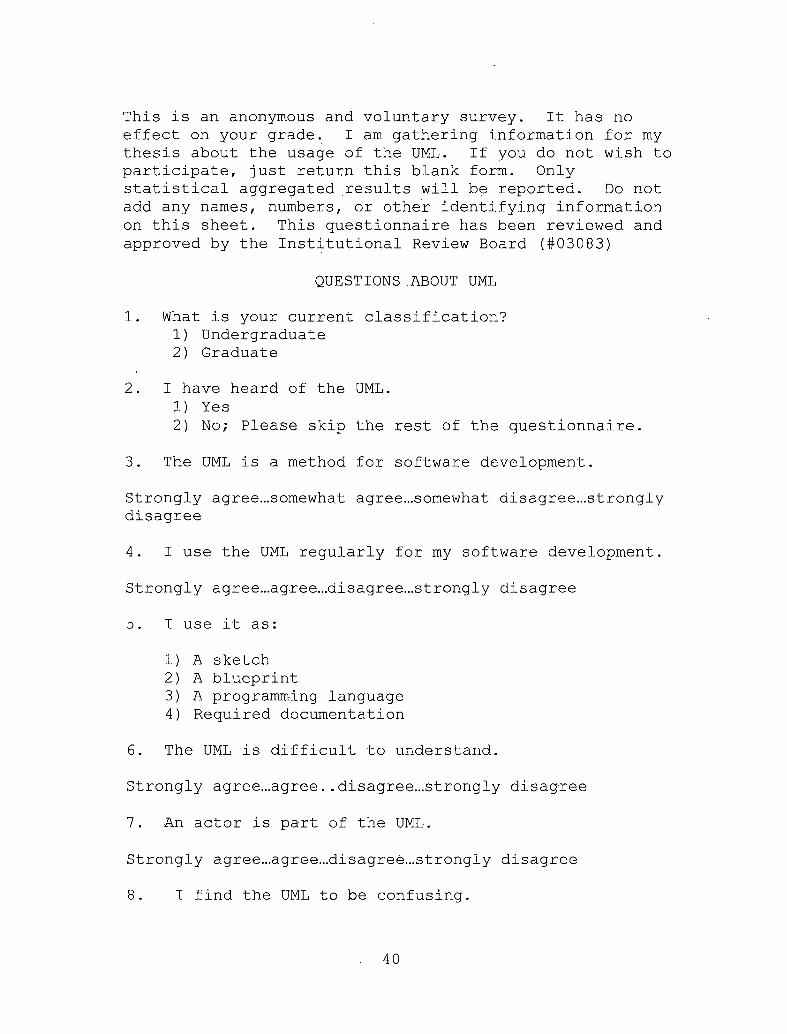
This is an anonymous and voluntary survey. It has no effect on your grade. I am gathering information for my thesis about the Usage of the UML. If you do not wish to participate, just return this blank form. Onlystatistical aggregated results will be reported. Do not add any names, numbers, or other identifying information on this sheet. This questionnaire has been reviewed and approved by the Institutional Review Board (#03083)
QUESTIONS.ABOUT UML
1. What is your current classification?1) Undergraduate2) Graduate
2. I have heard of the UML.1) Yes2) No; Please skip the rest of the questionnaire.
3. The UML is a method for software development.
Strongly agree...somewhat agree...somewhat disagree...strongly disagree
4. I use the UML regularly for my software development.
Strongly agree...agree...disagree...strongly disagree
5. I use it as:
1) A sketch2) A blueprint3) A programming language4) Required documentation
6. The UML is difficult to understand.
Strongly agree...agree. . disagree...strongly disagree
7. An actor is part of the UML.
Strongly agree...agree...disagree...strongly disagree
8. I find the UML to be confusing.
40
Strongly agree...agree...disagree...strongly disagree
9. Any other comments about the UML?
Thank you very much for your time and trouble with this survey.
41

APPENDIX B
QUESTIONNAIRE
42
I
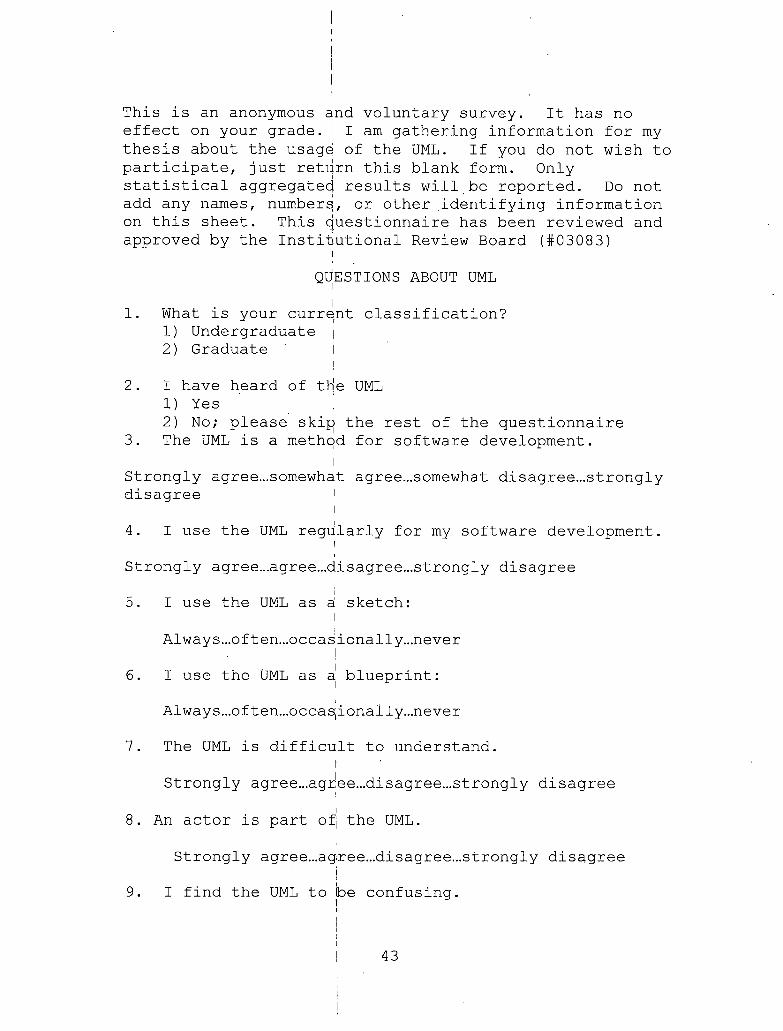
IThis is an anonymous and voluntary survey. It has no effect on your grade. ! I am gathering information for my thesis about the usage of the UML. If you do not wish to participate, just return this blank form. Onlystatistical aggregated results will be reported. Do not add any names, number^, or other .identifying information on this sheet. This questionnaire has been reviewed and approved by the Institutional Review Board (#03083)
QUESTIONS ABOUT UMLI1. What is your current classification?
1) Undergraduate |2) Graduate l
2. I have heard of trie UML1) Yes2) No; please skip> the rest of the questionnaire
3. The UML is a methqd for software development.I
Strongly agree...somewhat agree...somewhat disagree...strongly disagree 1
i4. I use the UML regularly for my software development.
Strongly agree...agree...disagree...strongly disagreel5. I use the UML as h sketch:I
Al way s...often...occasionally...never
6. I use the UML as a blueprint:
Always...often...occaslionally...never
7. The UML is difficult to understand.
Strongly agree...agr!ee...disagree...strongly disagreeI8. An actor is part of, the UML.
Strongly agree...agree...disagree...strongly disagreei
9. I find the UML to Ibe confusing.IIi
43
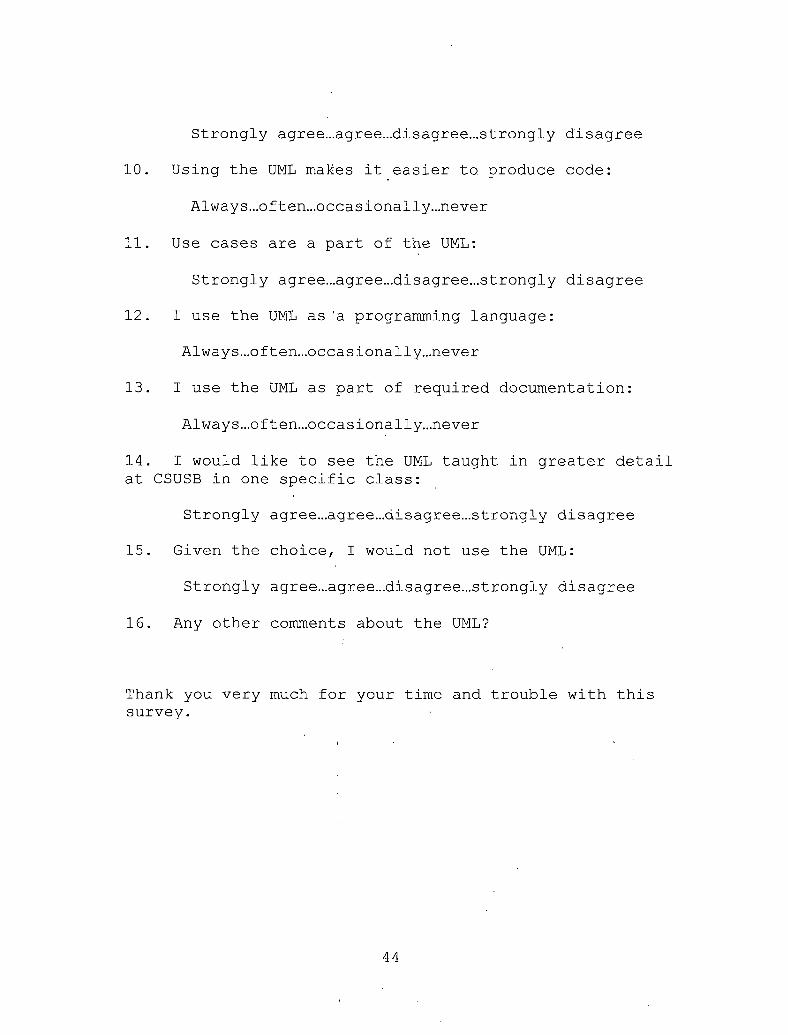
Strongly agree.,.agree...disagree...strongly disagree
10. Using the UML makes it easier to produce code:
Always...of ten...occasionally...never
11. Use cases are a part of the UML:
Strongly agree.,.agree...disagree...strongly disagree
12. I use the UML as 'a programming language:
Always...of ten... occas ionally... never
13. I use the UML as part of required documentation:
Always...often...occas ionally...never
14. I would like to see the UML taught in greater detail at CSUSB in one specific class:
Strongly agree...agree...disagree...strongly disagree
15. Given the choice, I would not use the UML:
Strongly agree...agree...disagree...strongly disagree
16. Any other comments about the UML?
Thank you very much for your time and trouble with this survey.
44
APPENDIX C
PILOT QUESTIONNAIRE COMMENTS BY CLASS
45
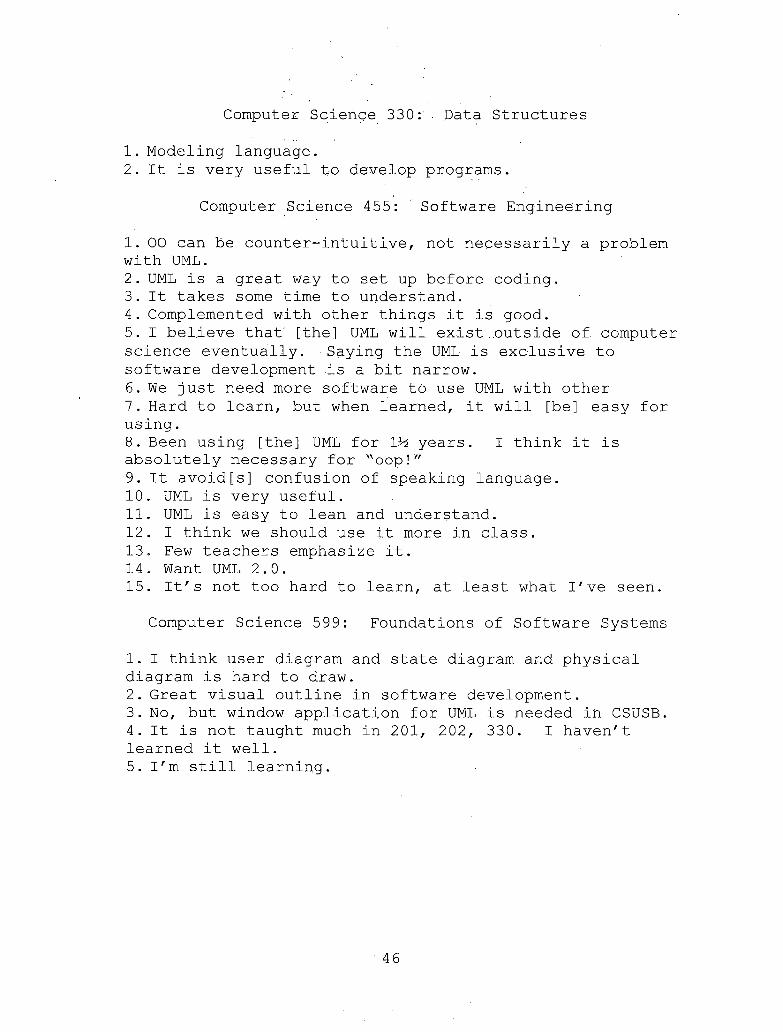
Computer Science 330:'. Data Structures
1. Modeling language.2. It is very useful to develop programs.
Computer Science 455: ’ Software Engineering
1. 00 can be counter-intuitive, not necessarily a problem with UML.2. UML is a great way to set up before coding.3. It takes some time to understand.4. Complemented with other things it is good.5. I believe that' [the] UML will exist .outside of. computer science eventually. Saying the UML is exclusive to software development is a bit narrow.6. We just need more software to use UML with other7. Hard to learn, but when learned, it will [be] easy for using.8. Been using [the] UML for 1^ years. I think it is absolutely necessary for "oop!"9. It avoid[s] confusion of speaking language.10. UML is very useful.11. UML is easy to lean and understand.12. I think we should use it more in class.13. Few teachers emphasize it.14. Want UML 2.0.15. It's not too hard to learn, at least what I've seen.
Computer Science 599: Foundations of Software Systems
1. I think user diagram and state diagram and physical diagram is hard to draw.2. Great visual outline in software development.3. No, but window application for UML is needed in CSUSB.4. It is not taught much in 201, 202, 330. I haven't learned it well.5. I'm still learning.
46
APPENDIX D
FINAL SURVEY COMMENTS
47

ComputerScience330
Not too familiar with it...sorryIt is a great way to program.'I don't have much learning about UML.I think if we include UML in some class as part of the lecture, it would be more understanding. I think the whole class of UML would be boring.
ComputerScience401
UML should not replace flow charts.I HATE IT.
ComputerScience460
Good tool for software management.The best way for communication among human.Start the UML with CS201.UML is a great too for software development. I would like to see a class for it.A good idea is to mix with a lot of classes. I look forward to seeing UML becoming more than just a software engineering tool.
ComputerScience620
UML is very useful but we could not learn efficiently.It must be offered as a graduate class. UML should be taught as clearly as C++.
ComputerScience630
It's useful.
Computer Science 660
Need more UML tools (Rational Rose).I'm still learning, so, I don't know.I've heard of UML, but never used it.You need a roadmap. This is one of the best.
48

APPENDIX E
MEAN/MODE/MEDIAN TOTAL POPULATION FINAL SURVEY
49
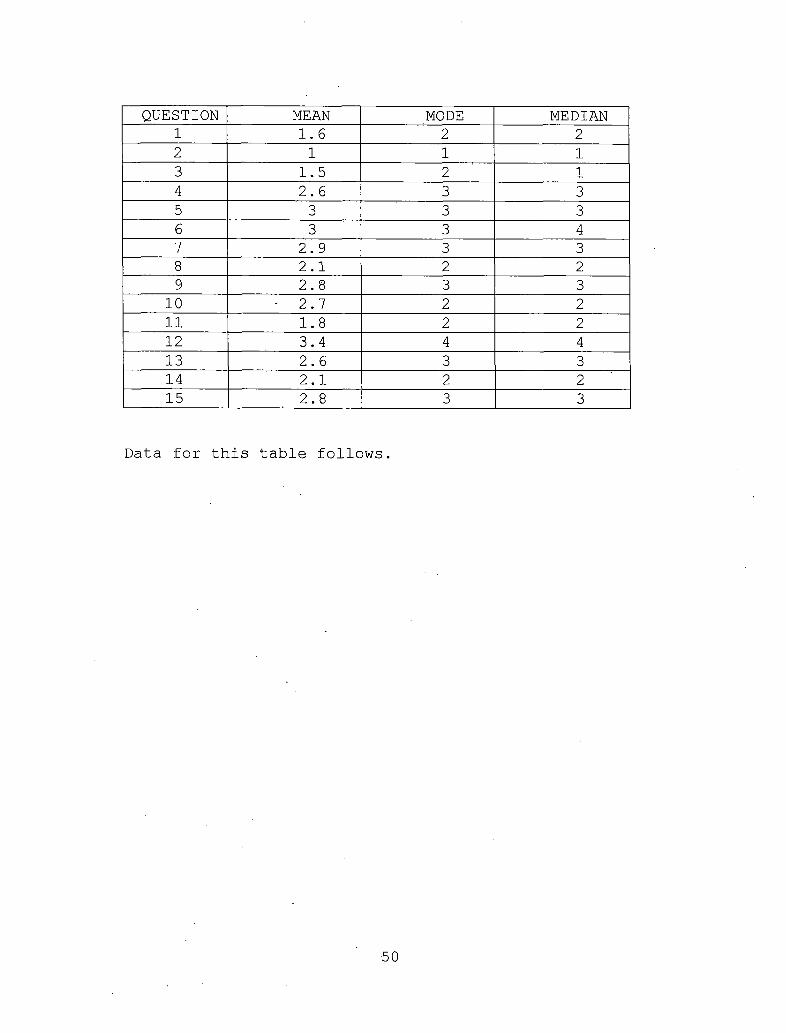
QUESTION MEAN MODE MEDIAN1 1.6 2 22 1 1 13 1.5 2 14 2.6 3 35 3 3 36 3 3 47 2.9 3 38 2.1 2 29 2.8 3 3
10 - 2.7 2 211 1.8 2 212 3.4 4 413 2.6 3 314 2.1 2 215 2.8 3 3
Data for this table follows.
50
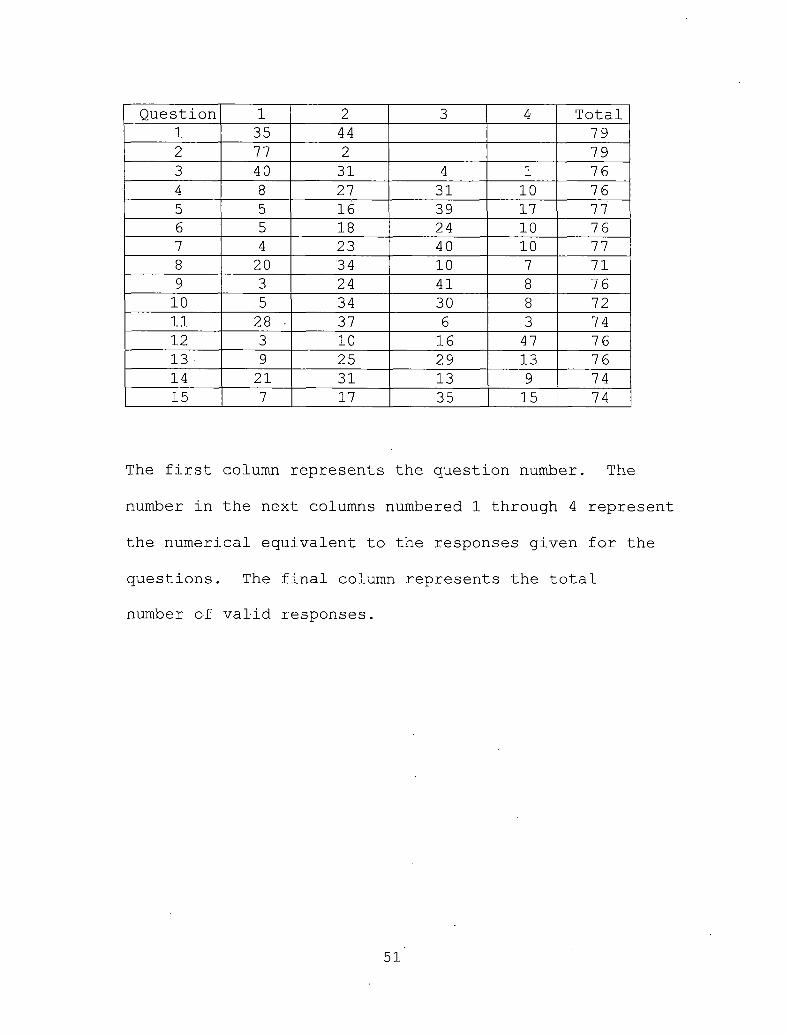
Question 1 2 3 4 Total1 35 44 792 77 2 793 40 31 4 1 764 8 27 31 10 765 5 16 39 17 776 5 18 24 10 767 4 23 40 10 778 20 34 10 7 719 3 24 41 8 7610 5 34 30 8 7211 28 ■ 37 6 3 7412 3 10 16 47 7613 ■ 9 25 29 13 7614 21 31 13 9 7415 7 17 35 15 74
The first column represents the question number. The
number in the next columns numbered 1 through 4 represent
the numerical equivalent to the responses given for the
questions. The final column represents the total
number of valid responses.
51
APPENDIX F
MEAN/MODE/MEDIAN TABLES BY CLASS
52
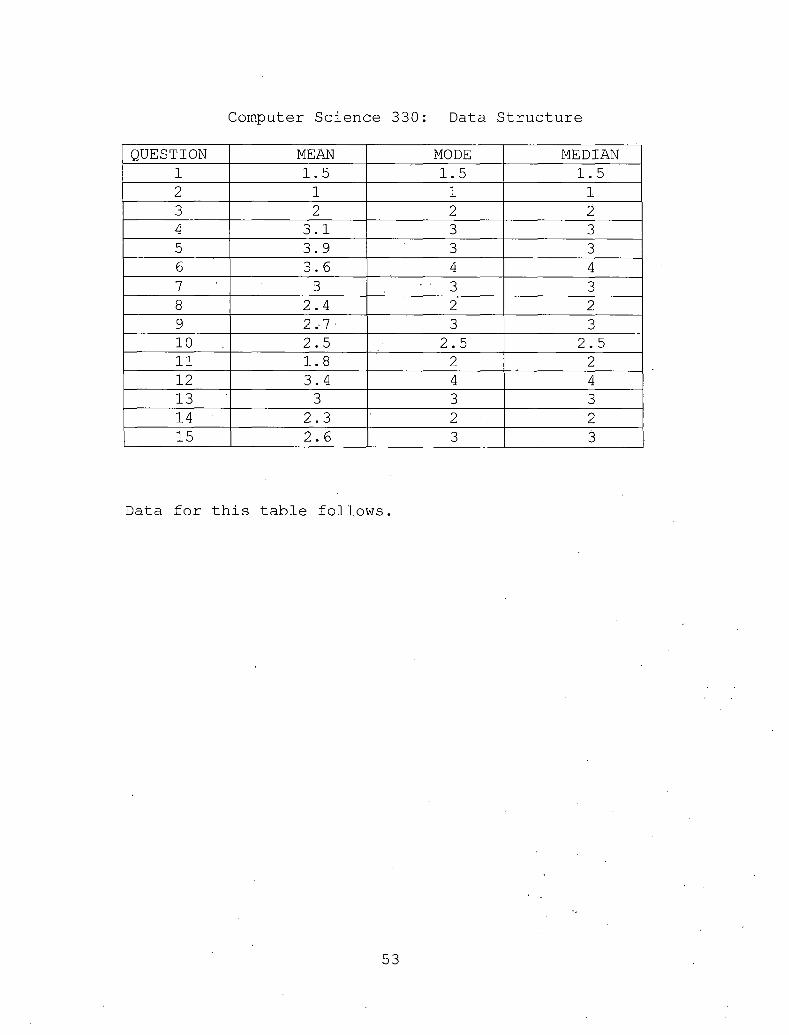
Computer Science 330: Data Structure
QUESTION MEAN MODE MEDIAN1 1.5 1.5 1.52 1 1 13 2 2 24 3.1 3 35 3.9 3 36 3.6 4 47 3 ' ' 3 38 2.4 2 29 2,7 ■ 3 310 2.5 2.5 2.511 1.8 2 212 3.4 4 413 3 3 314 ' 2.3 2 215 2.6 3 3
Data for this table follows.
53
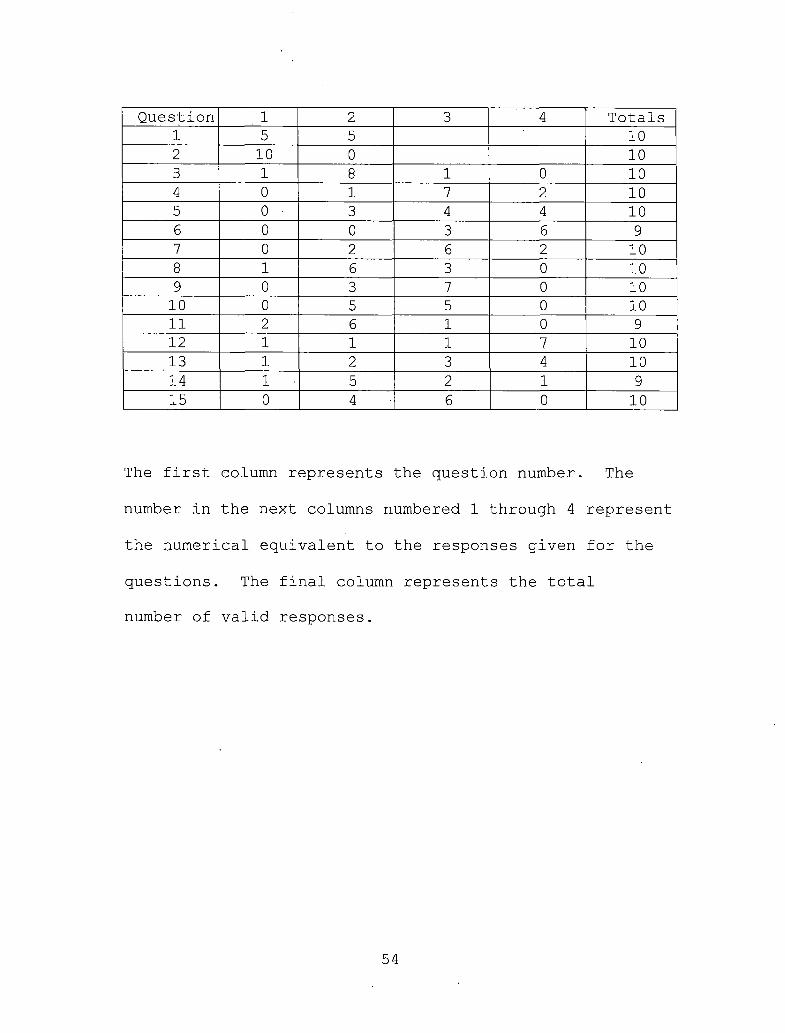
Question 1 2 3 4 Totals1 5 5 102 10 0 103 1 8 1 0 104 0 1 7 2 105 0 ■ 3 4 4 106 0 0 3 6 97 0 2 6 2 108 1 6 3 0 109 0 3 7 0 1010 0 5 5 0 1011 2 6 1 0 912 1 1 1 7 1013 1 2 3 4 1014 1 5 2 1 915 0 4 6 0 10
The first column represents the question number. The
number in the next columns numbered 1 through 4 represent
the numerical equivalent to the responses given for the
questions. The final column represents the total
number of valid responses.
54
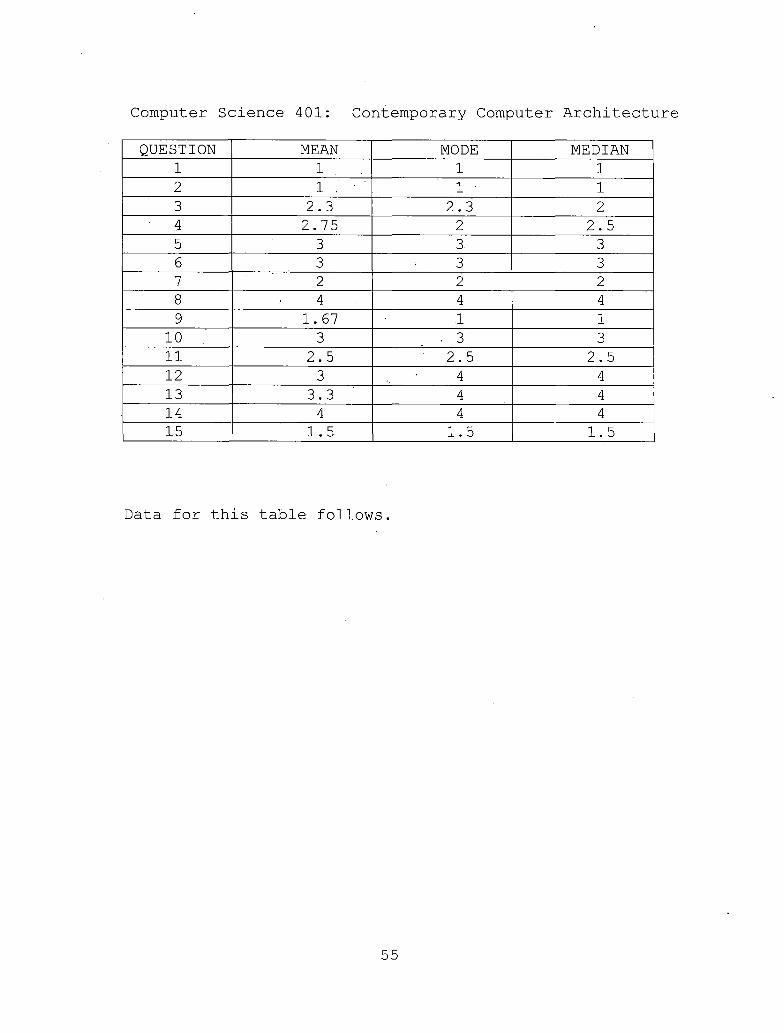
Computer Science 401: Contemporary Computer Architecture
QUESTION MEAN MODE MEDIAN- 1 1 1 12 1 , 1 ■ 13 2.3 2.3 24 2.75 2 2.55 3 3 36 3 3 37 2 2 28 4 4 49 1.67 I 1
10 3 . 3 ' 311 2.5 2.5 2.512 3 4 413 3.3 4 414 4 4 415 1.5 1.5 1.5
Data for this table follows.
55
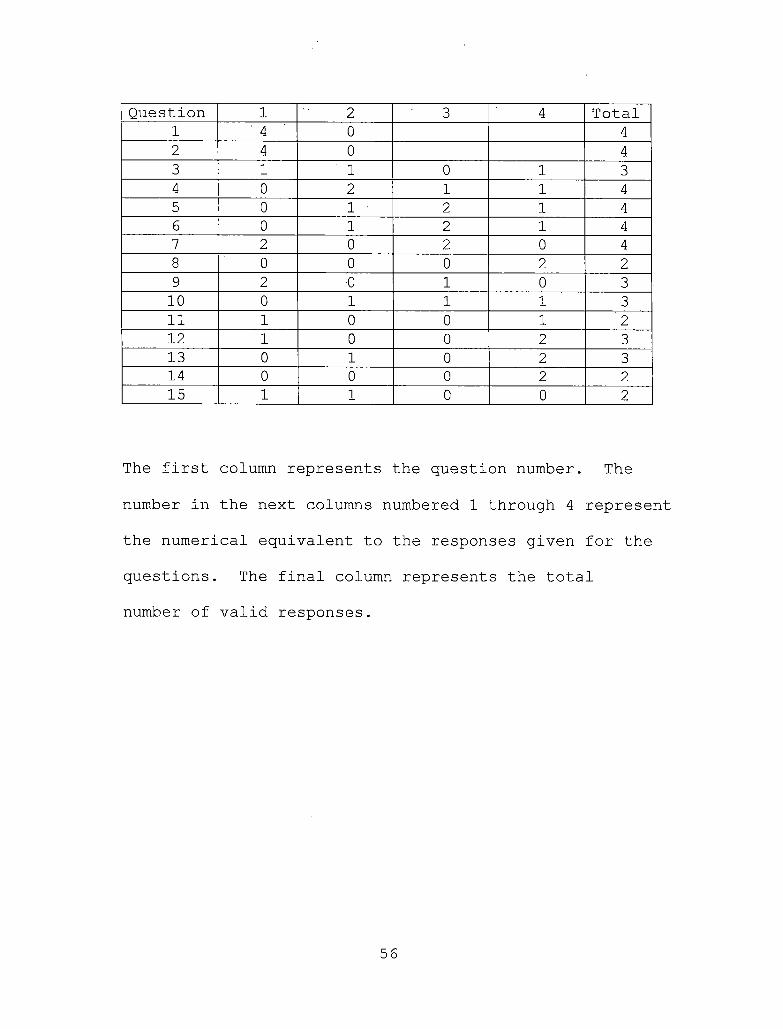
Question 1 2 3 4 Total1 ' 4 0 42 4 0 43 1 ' 1 0 1 34 0 2 1 1 45 0 1 2 1 46 0 1 2 1 47 2 0 2 0 48 0 0 0 2 29 2 0 1 0 310 0 1 1 1 311 1 0 0 1 212 1 0 0 2 313 0 1 0 2 314 0 0 0 2 215 1 1 0 0 2
The first column represents the question number. The
number in the next columns numbered 1 through 4 represent
the numerical equivalent to the responses given for the
questions. The final column represents the total
number of valid responses.
56
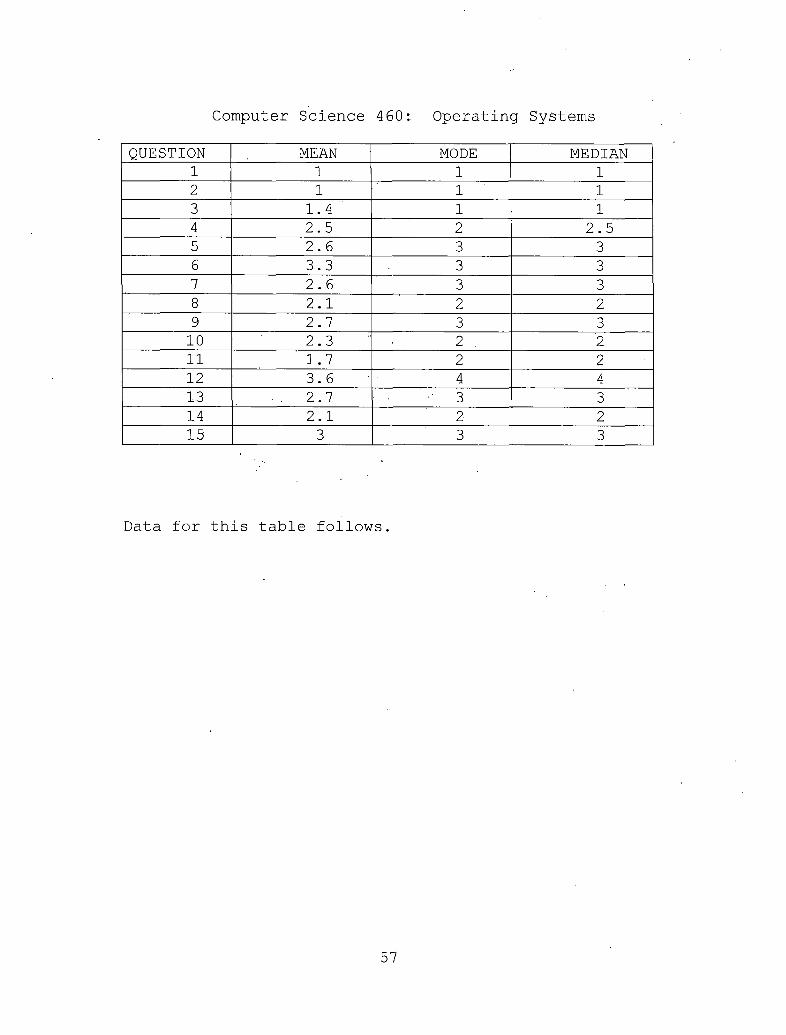
Computer Science 460: Operating Systems
QUESTION MEAN MODE MEDIAN1 1 1 12 1 1 13 1.4 1 14 2.5 2 2.55 2.6 3 3 .6 3.3 3 37 2.6 3 38 2.1 2 29 2.7 3 310 2.3 2 211 1.7 2 2
12 3.6 4 413 2.7 ■' 3 314 2.1 2 215 3 3 3
Data for this table follows.
57

Question 1 2 3 4 Totals1 26 0 262 26 0 ■ 263 15 11 0 0 264 3 10 9 4 26'5 2 6 13 5 266 2 6 19 8 267 2 8 14 2 268 8 11 2 4 259 1 8 14 3 2610 2 14 9 1 2611 11 12 2 1 2612 0 3 5 18 2613 3 7 11 5 2614 6 13 5 2 2615 1 5 12 8 26
The first column represents the question number. The
number in the next columns numbered 1 through 4 represent
the numerical equivalent to the responses given for the
questions. The final column represents the total
number of valid responses.
58

Computer Science 620: Programming Languages
QUESTION MEAN MODE MEDIAN1 2 2 22 1 1 13 1.7 1.5 24 2.5 3 35 3 3.5 36 2.9 2 37 2.5 3 38 1.9 2 29 2.5 2 2
10 2.7 2.5 311 1.8 2 212 3.1 3 413 2.3 2 214 2 2.5 215 2.3 2 2
Data for this table follows.
59
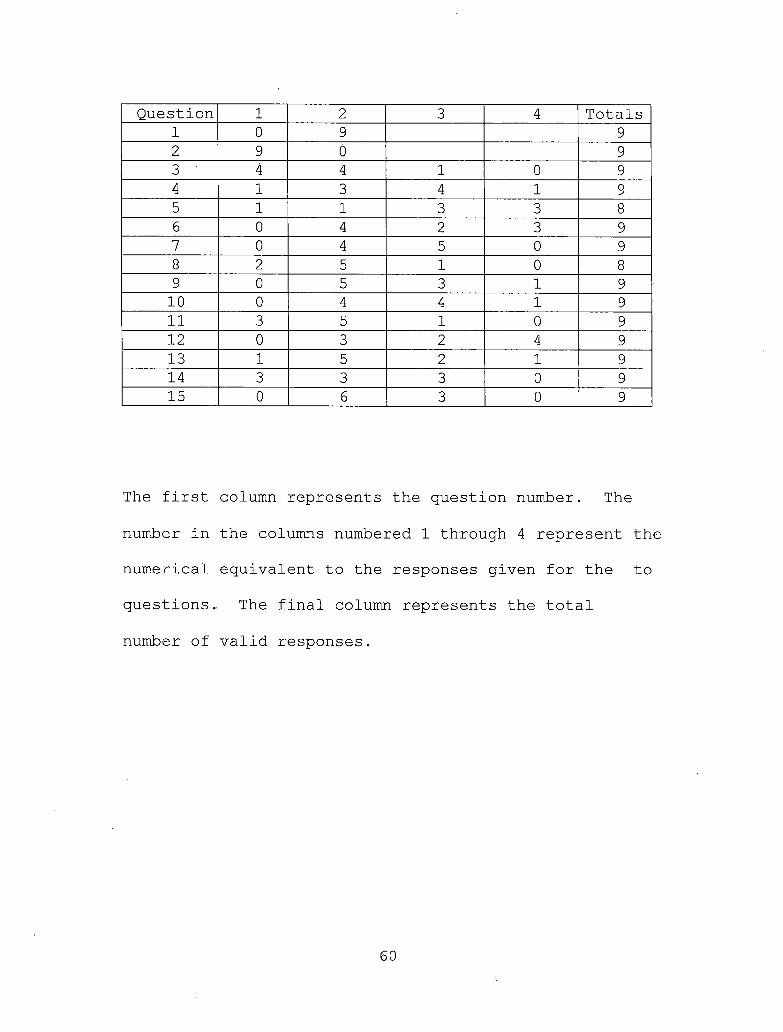
Question 1 2 3 4 Totals1 0 9 92 9 0 93 4 4 1 0 94 1 3 4 1 95 1 1 3 3 86 0 4 2 3 97 0 4 5 0 98 2 5 1 0 89 0 5 3 1 910 0 4 4 1 911 3 5 1 0 912 0 3 2 4 913 1 5 2 1 914 3 3 3 0 915 0 6 3 0 9
The first column represents the question number. The
number in the columns numbered 1 through 4 represent the
numerical equivalent to the responses given for the to
questions., The final column represents the total
number of valid responses.
60
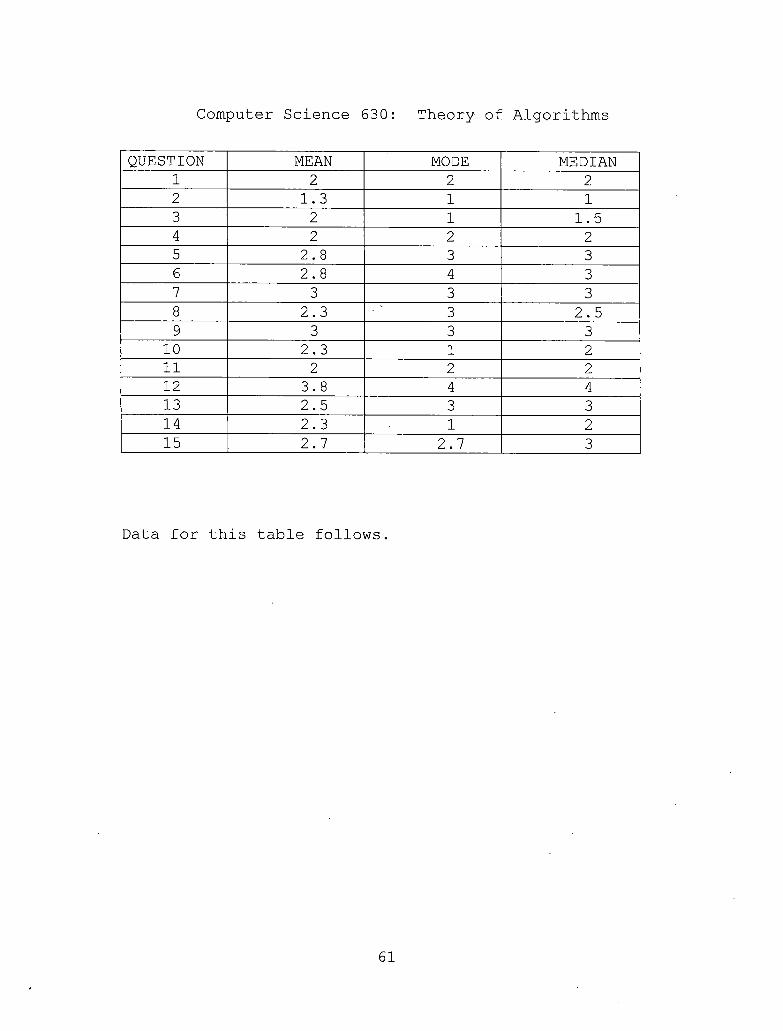
Computer Science 630: Theory of Algorithms
QUESTION MEAN MODE MEDIAN1 2 2 22 1.3 1 13 2 1 1.54 2 2 25 2.8 3 36 2.8 4 37 3 3 38 2.3 3 2.59 3 3 3
10 2.3 1 211 2 2 212 3.8 4 413 2.5 3 314 2.3 1 215 2.7 2.7 3
Data for this table follows.
61

Question 1 2 3 4 Totals1 6 0 62 4 2 63 2 1 0 1 44 1 2 1 0 45 0 1 3 0 46 1 1 0 2 47 0 1 2 1 48 1 1 2 0 49 0 1 2 1 410 2 0 1 1 411 1 2 1 0 412 0 0 1 3 413 1 0 3 0 414 2 0 1 1 415 1 0 1 1 3
The first column represents the question number. The
number in the next columns numbered 1 through 4 represent
the numerical equivalent to the responses given for the
questions. The final column represents the total
number of valid responses.
62
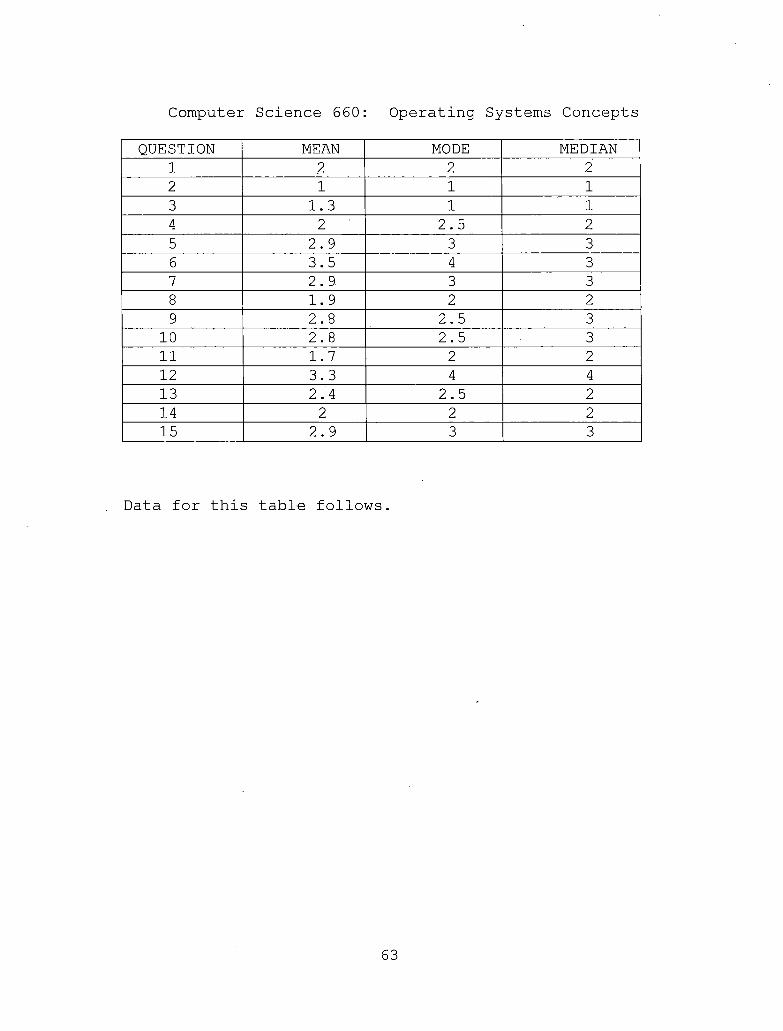
Computer Science 660: Operating Systems Concepts
QUESTION MEAN MODE MEDIAN1 2 2 22 1 1 13 1.3 1 14 2 2.5 25 2.9 3 36 3.5 4 37 2.9 3 38 1.9 2 29 2.8 2.5 3
10 2.8 2.5 311 1.7 2 212 3.3 4 413 2.4 2.5 214 2 2 215 2.9 3 3
Data for this table follows.
63
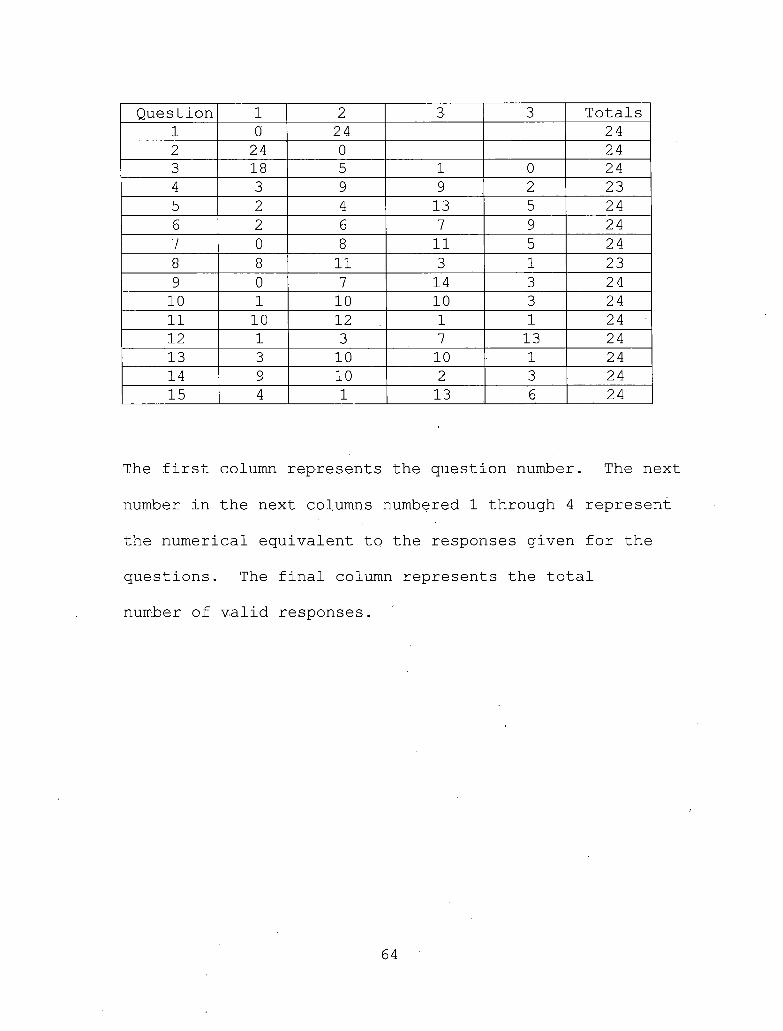
Question 1 2 3 3 Totals1 0 24 242 24 0 243 18 5 1 0 244 3 9 9 2 235 2 4 13 5 246 2 6 7 9 247 0 8 11 5 248 8 11 3 1 239 0 7 14 3 2410 1 10 10 3 2411 10 12 1 1 2412 1 3 7 13 2413 3 10 10 1 2414 9 10 2 3 2415 4 1 13 6 24
The first column represents the question number. The next
number in the next columns numbered 1 through 4 represent
the numerical equivalent to the responses given for the
questions. The final column represents the total
number of valid responses.
64

APPENDIX G
INITIAL APPROVAL LETTER
65

CALIFORNIA STATE UNIVERSITY SAN BERNARDINO5500 University Parkway, San Bernardino, CA 92407-2397
February 20,2004
Ms. Cynthia P. Farquhar c/o: Prof. Richard Botting Department of Computer Science California State University ' ’ - 5500 University ParkwaySan Bernardino, California 9.2407
CSUSBINSTITUTIONAL REVIEW BOARD
Exempt Review IRB#03083
StatusAPPROVED
Dear Ms. Farquhar:
Your application to use human subjects, titled, “An Empirical Study: Usage of UML in the BS and MS Degree Programs at CSUSB” has been reviewed and approved by the Institutional
... Review Board (IRB) of California State'University, San Bernardino.
• This protocol is approved as exempt if conducted exactly as described in the protocol. There is a discrepancy between the protocol (a survey instrument) and the methodology in the thesis proposal ("interviews with students," "interviews with faculty")-.
' You. are required to notify the IRB if any substantive changes are made in your research prospectus/protocol, if any unanticipated adverse events are experienced by subjects during your research, and when your project has ended. If your project lasts longer than one year, you (the
1 investigator/researcher) are required to notify the IRB by email or correspondence of Notice of ■ Project Ending or Request for Continuation at the end of each year. Failure to notify the IRB of
the above may result in disciplinary action. You are required to keep copies of the informed Consent forms and data for at least three years.
If you have any questions regarding the.IRB decision, please contact Michael Gillespie, IRB s Secretary. Mr. Gillespie can be reached by phone at (909) 880-5027, by fax at (909) 880-7028,
or by email at [email protected]. Please include your application identification number (above) in all correspondence. .
Best of luck with your research.
Sincere,
Joseph wvett, Chair Institutional Review Board
. JL/mg
66
APPENDIX H
PROTOCOL CHANGE APPROVAL
67
fibCALIFORNIA STATE UNIVERSITY SAN BERNARDINO5500 University Parkway, San Bernardino, CA 92407-2397
May 14, 2004
Ms. Cynthia P. Farquhar c/o: Prof. Richard Botting Department of Computer Science California State University 5500 University Parkway San Bernardino, California 92407
' CSUSB INSTITUTIONAL REVIEW BOARD
Protocol ChangeIRB# 03083
StatusAPPROVED
. Dear.Ms. Farquhar:
Your protocol change in your application to use human subjects, titled, “An Empirical Study: Usage of UML in the BS and MS Degree Programs at CSUSB” has-been reviewed and approved by the Chair of the Institutional Review Board (IRB). A change in your informed consent requires resubmission of your protocol as amended.
You are required to notify the ERB if any future substantive changes are made in your research prospectus/protocol, if any unanticipated adverse events are experienced by subjects during your • research, and when your, project has ended. 'If .your project lasts longer than one year, you (the investigator/researcher) are required to notify the IRB by email or correspondence of Notice of Project Ending or Request for Continuation at the end of each year. Failure to notify the IRB of
■ the above may result in disciplinary action. You are required to keep copies of the'informed consent forms and data for at least three years.
If you have any questions regarding the IRB decision, please contact Michael Gillespie, IRB Secretary. Mr. Gillespie can be reached by phone at (909) 880-5027, by fax at (909) 880-7028;. or by email at [email protected]. Please.include your application identification number
s (above) in all correspondence.
Best of luck with your research.
Sincerely,
Joseph T/ovett, ChairInstitutional Review Board
JL/mg
cc: Prof. Richard Botting, Department of Computer Science
The California State University , • .Bakersfield * Channel Islands • Chico * Dominguez Hills • Fresno * Fullerton • Hayward • tiwriboldt • Long Beach • Los Angeles • Maritime Academy Monterey Bay • Northridge • Pomona • Sacramento • Son Bernardino • San Diego • San Francisco * San Jose • San Luis Obispo • San Marcos • Sonoma • Stanislaus
68

APPENDIX I
BACHELOR OF SCIENCE DEGREE IN COMPUTER SCIENCE CURRICULUM FLOW CHART
69

BS Degree in Computer Science Curriculum Flowchart
Science Course w lab
CSC1125 I BIOL 100 . - I Topics,In Biol I MATH 211
Calculus I
Choose 4 Units from. CSCI 500, 511, 512, 515 or 546 Elective 2: Systems
Choose 4 Units from CSCI 540, 565, 570, 572, or 580 • .Elective 3: Hardware
Choose 4 Units from CSCI 510, 524, 525, 530, or 531 Elective 4: Free
Choose 8 Units from 400 - and above level courses in CSCI not previously counted as file'cfivo ahnvo
70

APPENDIX J
MASTER OF SCIENCE CURRICULUM FLOW CHART
71
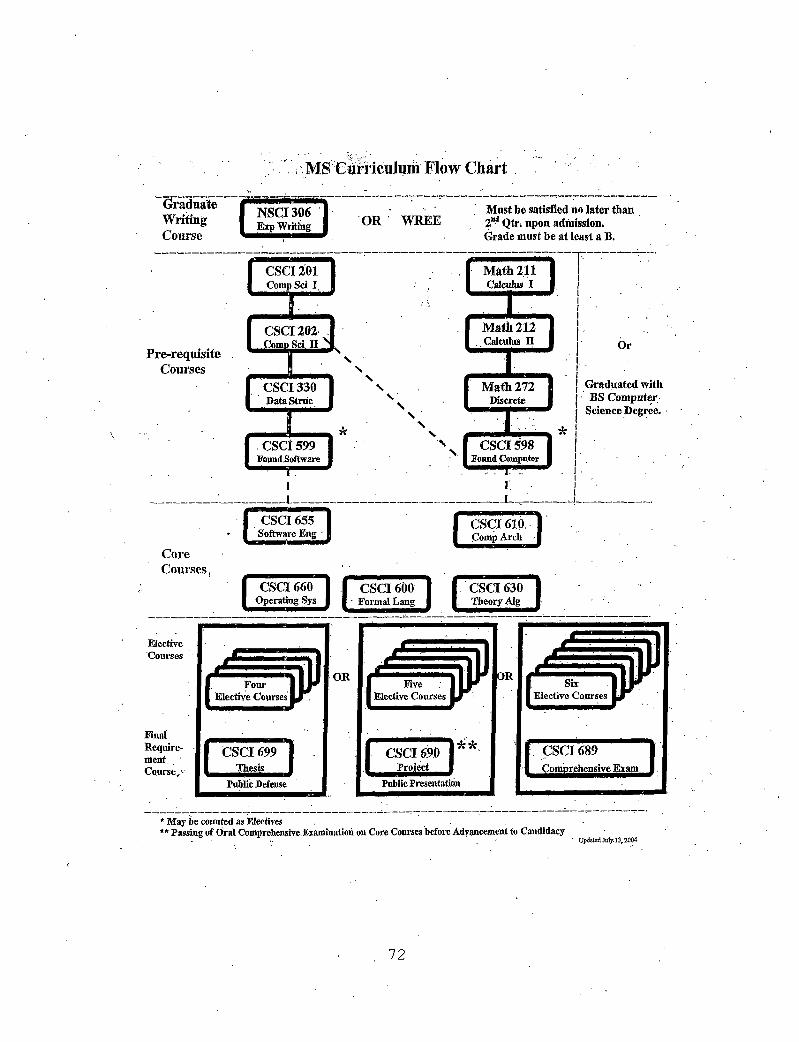
MS Curriculum Flow Chart
GraduateWritingCourse (NSCJ306 J
ISxpWritingl OR WREEMust be satisfied no later than 2ni Qtr. upon admission. Grade must be at least a B.
ElectiveCourses
FinalRequirement.Course,
Public Defense
* May be counted as Electives** Passing of Oral Comprehensive Examination on Core Courses before Advancement to Candidacy
.. - ' Updated July. 13,2004
72

REFERENCES
[1] Agarwal, 1R., and Sinha, A. P., "Object-Oriented Modeling with UML: A Study of Developer's Perceptions," Communications of the ACM, (September 2003), 248-256.
[2] Alhir, Sinan Si. "The True Value of the Unified Modeling Language (UML)," DistributedComputing.com.
[3] Alhir, Sinan Si 0'Reilly.California.
UML in a Nutshell. 1998 .
[4] Alhir, Sinan Si. "Understanding the Unified Modeling Language (UML)", Methods & Tools, (April, 1999).
[5] Babich, Wayne. Software Configuration Management. Addison-Wesley. Reading, Massachusetts, 1986.
[6] Botting, R.J. personal communication, 2003.
[7] California State University San Bernardino, 2004-2005Bulletin of Courses. Vol. 33, No. 1, June 2004.
[8] Concepcion, A. I., "Six Years of Integrating 00 in the Computer Science Curriculum".
[9] Concepcion, A. I., et al. "ROOT Project: AnIntegration of OOA/D Methodology in the Computer Science Curriculum."
[10] Connor-Linton, Jeff. "Chi-Square Tutorial."http://www.georgetown.edu/faculty/ballc/webtools/web chi tut.html.
[11] Fowler, Martin. "What is the Point of UML." UML Convention. San Francisco, CA., October 2003.
[12] Fowler, Martin, and Kendall Scott. UML Distilled. Addison-Wesley, Boston, 2000. pp.1-10.
[13] Imsuksri, Sumit. Mobile Order Entry System Based On The Wireless Technology. 2002.
73
[14] Kitchenham, Barbara. "Principles of Survey Research, Part 6: Data Analysis." Software Engineering Notes. Vol. 28, No. 2. March 2003. pp -24-27.
[15] Larman, Craig. Applying UML and Patterns, AnIntroduction to Object-Oriented Analysis and Design and Iterative Development. 3rd Edition. Pearson Education, Inc. 2005.
[16] Nand, Alka. Design and Implementation fo Internet Mail Servers With Embedded Data Compressions. 1997.
[17] Nichols, Kenneth. Inventing Software The Rise of "Computer Related" Patents. Quorum Books, Connecticut,1998 .
[18] Shamlin, Carolyn. A User's Guide for Defining Software Requirements. QED Information Sciences, Inc., Massachusetts. 1985.
[19] Shiller, Larry. Software Excellence. Yourdon Press. New Jersey. 1990.
7 4