an empirical investigation of the the environment
TRANSCRIPT

A Bumper!?
An Empirical Investigation of the Relationship between the Economy and
the Environment
Andreas Brekke
A dissertation submitted to BI Norwegian School of Management for the degree of Ph.D
Series of Dissertations 3/2009
BI Norwegian School of Management Department of Strategy and Logistics

II
Andreas Brekke A Bumper!? An Empirical Investigation of the Relationship between the Economy and the Environment
© Andreas Brekke
2009 Series of Dissertations 3/2009 ISBN: 978 82 7042 946 2 ISSN: 1502-2099 BI Norwegian School of Management N-0442 Oslo Phone: +47 4641 0000 www.bi.no Printing: Nordberg The dissertation may be ordered from our website www.bi.no (Research – Research Publications)

III
Abstract
This thesis is concerned with the relationship between the economy and the
environment. The relationship is often portrayed as a conflict in public
discourse, as if what is good for the economy is bad for the environment and
vice versa. The thesis tries to discern if there are common elements in the
economy and the environment and how these have eventually become
shared. The underlying model assumes that the economy and the
environment can be depicted as two separate networks and that elements
have to be shared for any relationship to exist.
Of course, in real life, the economy and the environment is interwoven,
inseparable and too large to be contained within the pages of a thesis. In
order to investigate the relationship, it has thus been necessary to delimit the
study to only parts of each network. One of the more important assumptions
is that industry is decisive for the production of the economy whereas
science is decisive for the production of the environment. Hence, the study
should focus on an object that is found in both industry and science. This is
done by focusing on aluminium bumpers as the empirical object. Both
aluminium and cars have been subject to environmental debates and they are
both industries involving large sums of money. In order to aid the production
of empirical descriptions, industrial network theory (IMP) and actor-network
theory (ANT) have been employed.
The part of the case concerned with the economy describes production of
aluminium bumpers for Volvo at Raufoss during the time period 1970 to
2006. The description includes important actors, resources and activities (in
IMP terminology) and their development over time. These are explicated as
important elements in the economy and presented in a way that facilitates
comparison with important elements from the environment.
The part of the case concerned with the environment describes the
stabilisation of environmental issues related to aluminium bumpers during
the time period from 1970 to 2006. Through a comprehensive study of
scientific texts, relations between aluminium bumpers and environmental
issues are uncovered. The description includes important actors (in ANT
terminology) and their development over time. These are explicated as
important elements in the environment and presented in a way that facilitates
comparison with important elements from the economy.
The two parts of the case are brought together and compared to reveal if they
share elements. A main conclusion is that there are few common elements in
the economy and the environment. There are, however, some elements
existing in both networks and these have been transferred either directly or

IV
indirectly from one network to the other. The route by which the elements
are transferred has consequences for their stabilisation and characteristics
upon final arrival. In addition, other elements are needed to aid the
transference – in this thesis referred to as vehicles for translation – and these
have different characteristics and properties.

V
Acknowledgements
The thesis and I would like to thank several people (and also many non-
humans) for stabilising our relationship. First and foremost I thank my
supervisors Marianne and Håkan for giving me the possibility to write a PhD
thesis and for giving me the freedom to pursue my own interests. You have a
perfect mix of capabilities. What a lovely example of resource combination!
All students and faculty involved in the Netlog, Newmark and D Net
projects: Thank you for interesting discussions as well as social happenings.
Special thanks go to Calle for fruitful (if not really timesaving) development
of arguments and to Thomas whom I owe a lot when it comes to believing in
my own work. Thank you, Frans, for valuable comments on late drafts of the
thesis (and to Lars for at least reading through a chapter). Debbie, you not
only deserve gratitude for commenting but for generally aiding in the
process (although I had probably finished a year ago if I didn‟t borrow that
book from you). Peter: thanks for your “language laundry” and to Nina for
correcting the remaining errors. If there are mistakes left, you cannot be
blamed.
(The thesis insists on giving thanks to databases, notebooks, chairs, desks,
pencils, trees, computer software, and a whole lot of other non-humans. I
hope this parentheses suffices to please the thesis)
All the people from the “real world” (i.e. interviewees and others who have
contributed to the case study) deserve standing ovations. I have to mention
(doctoral secretary) Bjørn-Anders Hilland in particular. You have been
extremely helpful in providing information and to work as a door opener!
Ostfold Research deserves a hand for providing me with the opportunity to
finish the thesis (and, of course, for giving me a job).
Arne, Michael and Per: Thank you for trying to understand the thesis and
giving feedback at times when the thesis was incomprehensible even to me.
Other friends and family, I hope to see you more in the near future, if you
still remember who I am.
Bjørg; what can I say? Thank you for always bringing me a good balance of
resistance and support! I am awfully sorry for all the times when the thesis
has made me unable to be the person I want to be for you. Ludvig and Isak,
there are still some years until you will understand this text but still thank
you for constantly reminding me of what I have been missing when writing
the thesis. Now, Let‟s play!

VI
Table of Contents
1 Introduction 1
1.1 The Conflict between the Economy and the Environment – and Attempts at Solving it 3
1.2 A Preliminary Research Question and its Delimitations 6
1.3 A First Refinement: From Domains to Networks 7
1.4 A Second Refinement: On why Choosing a Bumper Beam 11
1.5 A Third Refinement: From Economy to Economy* and from Environment to Environment* 11
1.6 More Specific Research Questions 12
1.7 Outline of the Thesis/Roadmap 13
2 Research Designing 15
2.1 Selecting Empirical Material 15
2.2 Searching for the Environment* and the Economy* 17
2.2.1 The IMP Network Approach 17
2.2.2 Actor-Network Theory 26
2.2.3 Why two theories? 37
2.3 The World and How to Gain Knowledge About it 40
2.3.1 The world as process and relationality 40
2.4 Method or How the Empirical is Captured 43
2.4.1 Case Study Design 44
2.4.2 Organisation of Empirical Data 50
2.4.3 Making the Empirical Textual 50
2.5 Explanation, Validity and Transferability 54
2.5.1 Scientific Explanation 54
2.5.2 Validating Findings – Relying on Others 56
3 Industrial Production of Bumpers and Bumper Beams 58
3.1 Setting the Stage: A Presentation of the Story Behind the Relationship and the Bumpers 59
3.1.1 Summary: Conditions for production of Aluminium Bumpers 65
3.2 From 1970 to 1985 66
3.2.1 Production of Bumpers in 1970 66
3.2.2 Production of Bumpers in 1985 69
3.2.3 Changes in Production of Bumpers from 1970 to 1985 71
3.2.4 Elements that Contributed to Changes between 1970 and 1985 73
3.2.5 Summary: Important Elements between 1970 and 1985 85
3.3 From 1985 to 2006 86
3.3.1 Production of Bumper Beams in 2006 86
3.3.2 Changes in Production of Bumper Beams from 1985 to 2006 90

VII
3.3.3 Elements that Contributed to Changes between 1985 and 2006 93
3.3.4 Summary: Important Elements between 1985 and 2006 118
3.4 Elements that Have Stayed the Same – Investing in Stability 119
3.4.1 Summary: Important Elements to Keep Elements in Place from 1970 to 2006 124
3.5 Summary and Timeline 124
3.5.1 Important Actors, Resources and Activities 125
3.5.2 Timeline of the Economy* 128
3.5.3 An Adjusted Image of the Economy 128
4 Scientific Production of Bumpers and Bumper Beams 132
4.1 A Reference Point for the Environment* 135
4.1.1 First Round: Environmental Issues From the Thiel-Article and its References 135
4.1.2 The Actor-Network After the First Round 154
4.2 The Environment* Behind the Equations 156
4.2.1 Second Round: Digging Deeper into the Environmental Issues 156
4.2.2 The Actor-Network After the Second Round 183
4.3 Resources and Local Pollution: Connecting to the 1970s 185
4.3.1 Third Round: Other Environmental Issues Before the Thiel-Article 185
4.3.2 The Actor-Network After the Third Round 195
4.4 Fuzzy Boundaries of the Environment*: 2000-2006 196
4.4.1 Fourth Round: The Environmental Issues After the Thiel-Article 196
4.4.2 The Actor-Network After the Fourth Round 200
4.5 Summary and Timeline 201
4.5.1 Summary 201
4.5.2 Timeline of the Environment* 206
4.5.3 An adjusted image of the environment 207
5 Connecting the Economy and the Environment 210
5.1 Common Elements in the Economy and the Environment 210
5.1.1 A Recollection of the Timelines 211
5.1.2 A Short Description of Shared Elements 214
5.2 Direct Routes of Connecting the Economy and the Environment 216
5.2.1 The first route: Directly from the Environment to the Economy 216
5.2.2 The Second Route: Directly from the Economy to the Environment 220
5.3 Indirect Routes of Connecting the Environment and the Economy 223
5.3.1 The third route: From Environment through Other Network(s) to Economy 223
5.3.2 The Fourth route: From Economy through Other Network(s) to Environment 227
5.3.3 A summary of travel routes 229
5.4 Vehicles for Translation 231

VIII
5.4.1 Ideas are More or Less Substantial 232
5.4.2 Mediators Between the Economy and the Environment 234
5.4.3 A summary of vehicles for translation 254
6 And Finally 258
6.1 Summary of Main Findings 258
6.1.1 The relationship between the economy and the environment 259
6.1.2 The content and the development of the economy 264
6.1.3 The content and the development of the environment 265
6.2 The Thesis' Implications for Theories 266
6.3 The Thesis' Implications for Practices 270
6.4 Suggestions for Further Research 271
6.4.1 Some Possible Empirical Avenues 271
6.4.2 A First Sketch of Interlation: a suggestion for a theoretical concept 272
7 References 275

For it is only as an aesthetic phenomenon that
existence and the world are eternally justified
Friedrich Nietzsche


1
1. Introduction
When I left my position as a research assistant in a field connected to
environmental science to write a PhD thesis at a management school, some
of my earlier companions asked me how I could go off and sleep with my
enemy. At times I even asked myself the same question. And more.
Do I care about the environment? Do I care about the economy? Do I care
about both? Is it possible to care about both simultaneously?
The answer to all four questions is: "Yes, of course." End of story. This
thesis ends even before it starts.
Ever since the very early human settlements, the issues of securing a
resource base, getting rid of waste and avoiding hazards to human health
have been of vital importance for survival and prosperity. These issues are
both environmental and economical. The entanglement of the environment
and the economy is thus "proven", as is the need to care about both
simultaneously… If only the story was that simple.
This thesis is concerned with the relations between the economy and the
environment. When it was still in its infancy, such an interest in the
connection between the economy and the environment was only prevalent
amongst those with a special interest. However, as I write this introductory
text now - towards the end of the project – it seems that everybody is
concerned about the weather and possible connections between human
activities and the deterioration of the natural environment. The need to
justify the theme of the thesis decreases proportionally with the dawn of
every new day, with newspaper covers screaming at us about melting ice
caps, abnormal weather patterns and rising sea levels.
According to the Cambridge dictionary (2005), the economy is: "the system
of trade and industry by which the wealth of a country is made and used."
The words trade, industry and wealth all have connections to what is referred
to as business. Thus, it is fair to say that the economy is intimately connected
to business. Business is an activity performed to earn money. Snehota (1990)
refers to Webster's dictionary, which states that "business, as a general term,
refers to the activities of people who are engaged in the purchase and sale of
goods and services for the purpose of making profit," and to Veblen (1904)
who states that "the motive of business is pecuniary gain, the method is
essentially purchase and sale, the aim and usual outcome is an accumulation
of wealth." Business life consists of actors creating wealth for companies

2
and societies by employing resources in internal activities and exchange. The
success of business in wealth creation is obvious in today's society.
The wealth produced by the economy is transformed into all sorts of benefits
to satisfy our needs. The economy helps to protect people against poverty,
starvation and disease, and is inextricably linked to the development of most
of the technologies surrounding us.
How could one not care about the economy?
While economy is clearly defined in encyclopaedias, the environment as a
term is rather more ambiguous. It may denote that which is exterior to
something we focus on, but it is commonly used to refer to the natural
environment. In that sense, the environment consists of plants, water bodies,
baboons, gases, thunderstorms, whales, rocks, solar rays, guinea pigs,
glaciers and thousands of other entities in animate and inanimate categories.
The purpose of the environment is open for discussion and probably better
suited for a thesis in philosophy or theology than here, but it is fair to say
that human life without the environment is pretty unthinkable.
In recent times, we have learnt that the environment is in a delicate balance.
The oceans, gases, solar rays – all those elements needed to sustain life –
may become threats if we are not careful. Scientists tell us that carbon
dioxide, the very gas coming out of our mouths or noses when breathing,
may cause serious damage to the heat balance. You can relax a little though:
your breathing is part of the natural balance. It is mostly when you burn
those fossil fuels created in physical processes over millions of years that
you contribute to the enhanced heating effect.
We cannot think the environmental problems away – they are not purely
social constructions. However, they are not entering human domains as
ready-made knowledge. Intense work is undertaken by an increasing number
of environmental scientists to make environmental problems "real" – to
translate signs from nature into understandable categories – linking
environmental effects to (for instance) the release of specific chemical
compounds and thus specific human activities.
How could one not care about the environment?

3
1.1 The conflict between the economy and the environment –
and attempts at solving it
The film "The Day After Tomorrow" presents the devastating effects of
global warming in an apocalyptic fashion. The Gulf Stream stops and the
world faces a new ice age. The trustworthiness and the quality of the film
can obviously be discussed. However, what puzzled me was a scene at the
beginning of the film. The hero of the day, the devoted scientist, is
presenting his figures about a more rapid change in the climate than had
been predicted earlier (although not as rapid as it eventually turns out to be
in the film) to a group of politicians, urging them to implement measures to
limit emissions of climate gases. His proposals fall on deaf ears, as the
politicians claim the economy is much too fragile to be tampered with just
because of one man's beliefs. And I did not react. I believed the scene could
actually have happened. I was completely puzzled by not being puzzled.
That the stereotype of the economist not caring enough about the
environment could be so taken-for-granted.
Almost every day, when listening to a politician or a scientist or a
businessman or reading a newspaper, the relationship between the economy
and the environment is presented as carrying an inherent conflict. As if what
is good for the economy is bad for the environment and vice versa.
Spokespersons from each side scream about the threats posed by the other:
the environment (or rather its spokespersons) accuses the economy of
ruining the environment, while the economy (or rather its spokespersons)
accuses the environment of being filled with doomsday prophets creating
unnecessary constraints on the economy.
Figure 1-1 provides a cartoon view of this divide, showing how the two sides
look upon each other.

4
Figure 1-1 A cartoon view of the conflict between the economy and the environment
Obviously, the division is not total for then the spokespersons would not care
about each other. Obviously, the environment is just as much a part of the
economy as the economy is of the environment. But how? That is the issue
of this thesis. Where are the connections between the environment and the
economy? And what might they look like?
From discussions in the public domain, it is easy to get the impression that
the environment is packed with doomsdays prophets, while the economy is
an assembly of headless hedonists. However, the latter have created
strategies to show us all how we could be better off. Why is the economy all
about a prosperous future, while the environment is about doomsday? There
is also anxiety in the economy – costs are getting too high, we could go
bankrupt next year; likewise, there is also joy in the environment itself – the
feeling of every individual as part of nature, the sound of birdsong one day
in early Spring. Some of the characteristics of the environment and the
economy are shown in Table 1-1.
Economy Envir-
onment
We, the Economy,
cannot take you, the
Environment, into
account because it
costs too much
We, the
Environment
cannot accept that
you, the Economy,
are ruining us just
for fun

5
Table 1-1 Stereotypical characteristics of the environment and the economy
Environment Economy
Aim Sustained human existence? Profit
Means Scientific proofs and activism Efficient production
Modus Operandi 'Hot' emotions 'Cold' rationality
Future Outlook Catastrophic Bright
Personality Naïve Cynical
The reason why an image of a conflict or divide between the environment
and the economy is sustained (and maybe increasing) is mainly connected to
the high level of exclusivity that has crept into society. Sciences, professions
and newspapers are more and more specialised (e.g. Grant 1996; Ravitch &
Viteritti 2001; Szulanski 1996).1 Communication between people in what
used to be the same, or at least adjacent, fields is hampered by the
introduction of 'tribal' languages, which makes it difficult to understand even
seemingly closely related subjects.
This is not to say that no attempts have been made to 'close the gap' between
the economy and the environment. The words 'green' and 'environmental' are
being attached to almost every scientific subject, including subsets of the
economic sciences. Examples include 'green marketing' (e.g. Grant 2008),
'green purchasing' (e.g. Min & Galle 1997), 'green logistics' (e.g. Rodrigue et
al 2001) and 'environmental economics' (e.g. Hanley et al 2001). None of the
specifics of any of these attempts are treated within this thesis, unless they
show up explicitly in the environment or the economy. In general, I would
claim that all these attempts fail to take both the economy and the
environment seriously at the same time. The environment is translated into
quasi-economic objects, without the power to convince the majority of
people in either domain that they are relevant or worthy of attention.
Even fewer attempts are made at introducing economic thinking into
environmental studies, for reasons that may become clearer during the
course of this thesis. However, industrial ecology might arguably be referred
to as an exception (see for instance Ehrenfeld 2000).
1 This may well be far from new, as I do remember having read a passage in Weber
from the beginning of the 20th
century stating something like “anyone trying to be an

6
1.2 A preliminary research question and its delimitations
This is all quite confusing and one of the aims of this thesis is to clarify
some of the relations between the economy and the environment. A first
general formulation of the research question guiding this study becomes:
How does the environment affect the economy and vice versa?
The word 'how' in the question points both to the process of affecting and
also the outcome(s) of the affecting process. The question itself is clearly too
"big" to be answered, at least by one thesis. It needs refinement, using
premises and assumptions for giving an answer.
First of all, a provisional delimitation of the economy and the environment
must be made. Such a boundary-setting activity could for instance take the
mass media as its starting point. The thesis could have compared images of
the economy and the environment as produced in newspapers and on TV.
However, although I believe the mass media to be important in creating and
sustaining some of the content of the two domains under scrutiny, there are
other domains more instrumental in the constant production and
reproduction of the environment and the economy, especially science and
industry. A crucial assumption underlying the thesis is that economy is
largely a product of industry and environment is largely a product of science.
Secondly, the focus is on the empirical relationship between the two
domains, that is, how the economy as produced in industry is related in
practice to the environment as produced in science. Even though a study of
theories concerned with connecting and disconnecting the domains could
have been interesting in itself, the focus here is on relations between the
economy and the environment in practice rather than in theory.
Thirdly, following on from the last point, the empirical material for the
thesis needs to be related to an empirical domain where traces of both the
economy and the environment can be found. That is, the object of study
should be found both in industry and in sciences related to the environment.
Hence, the point of departure is an aluminium bumper beam.
Wait a minute!
What is a bumper beam? And why study such an aluminium bumper beam?
A bumper beam is a car component, situated between the bumper and the
chassis on a car and shown in Figure 1-2.

7
Figure 1-2 The placement of the bumper beam in the car
Its main function is to protect the car in medium-speed impacts.2 However,
the definition of the bumper beam will be developed as it becomes clearer
how it relates to the environment and the economy.3 More important than its
functional characteristics (for this thesis, at least) is its presence in both the
economy and the environment. The bumper beam obviously has economic
properties, as it is an object of exchange between companies. Environmental
properties are also likely to be present, as it contains material extracted from
the earth and its production leads to the release of emissions.
1.3 A first refinement: from domains to networks
An important aspect related to the assumptions has to do with what is meant
by domains. Five domains have already been mentioned – economy,
environment, mass media, industry and science – and it has been claimed
that there are relationships between them.
Of course, the 'real' world has no clearly separated domains and the
distinction I have made between the economy and the environment is not
true per se. It is not given by an act of God. However, it is not entirely
created in my head either. People and technologies are constantly involved
in refining domains and in bringing domains together. For instance, the
"economy" label is often given to institutions, newspapers, professors,
2 The bumper beam is not designed to protect the people in the car specifically but
rather the engine and other functional parts. 3 We will also learn that what is now referred to as a bumper beam was formerly
called a bumper. These denotations will be used interchangeably according to the
time in history.

8
politicians and others to demarcate them from everything else. This means
that parts of the various domains (e.g. science or mass media) are more
involved in the economy domain than in "their own" domains.
The thesis is thus based on a model of the world as composed of different
domains as shown in Figure 1-3.
Figure 1-3 The world as a collection of domains
The representation in the diagram is of course false, as it tries to show a
range of connections in just two dimensions. All of the domains are probably
connected to each other, although the links between some may be rather
weak. At least one more dimension would be needed to capture all the
intricate connections, as there are several places where more than two meet
and the meetings may not happen instantaneously, that is, the connections
may be stretched out in time. A domain may be seen as having its own
operating procedures and a language created to distinguish them from others.
Such a definition may give the impression that the domains only consist of
Environment
Economy
Food
production
Politics
Science
Technology
Art
Religion

9
human beings and their activities. On the contrary, the theoretical model for
the thesis rests on the assumption that each domain is heavily influenced by
entities other than human beings (e.g. Håkansson & Snehota 1995; Latour
1999b).
Within a domain, there is constant work to reproduce, confine or expand the
content, although it does not mean that each domain is a system with a
central brain. For instance a written law has a different meaning depending
on which domain is used to explain it. The political domain is seen as the
place where the law is produced, although its final formulation and
execution often occur in the legal domain and its influence may be felt in the
economy domain, while the environment may be the domain that the law
protects.
Following on from this, domains must at least be three-dimensional and it is
questionable if allegories of a domain or a sphere are at all useful. The mere
act of considering the potential content of a domain reveals that they are so
interwoven that any specific element can belong to a number of domains.
Hence, both the label of a single element and the composition of the larger
'structure' are subject to fluctuation.
The topography of the domains can therefore hardly be shaped as circles,
spheres or any other simple geometric figure. They seem to have more of a
molecular structure, one of nodes connected by bonds. To escape the
chemical associations and rather link up with a word more frequently used in
a range of social sciences, networks can be a more fruitful allegory (e.g.
Håkansson & Snehota 1989; Latour 1997; 1999a; Law 1992). Thus, from
this point on I will refrain from the use of words like 'domain' or 'sphere',
and instead stick to the word 'network'. A representation of society as seen as
different overriding networks is shown below.

10
Figure 1-4 Society as networks. For the sake of illustration, I have let all the
networks share one element.
Recognising that most entities encountered in society consist of a
heterogeneous mix of elements from a variety of such overriding networks,
the whole idea of operating with such larger 'structures' may be contested.
However, as shown for the economy and the environment, a lot of work has
been done to refine each of them, to create separate languages and ways to
operate. Still, many of them rely heavily on other networks for their own
existence.
It is assumed that the production of the environment network is largely down
to science; hence, elements of the science network are granting credibility to
the environment network. Although this network is certainly composed of
other actors – NGOs, a beautiful waterfall or a newspaper column – its
expansion and legitimacy can largely be considered to be the result of
science.
The economy network, on the other hand, is mostly produced in the industry
network. It means that other actors – the finance professor, a retail outlet or
credit cards – are not granted the same importance in confining and defining
the economy network.4
4 Although such a statement might provoke economists, i.e. scientists within
economic sciences, I do not assume the existence of economics to be all that
important to the content of the economy, as economy is often produced before
economics and the latter is a result of the former rather than the opposite.
Legal NetworkEconomy Network
Environment Network

11
Understanding how industry operates thus increases knowledge of the
economy, as understanding the mechanisms of science increases the
understanding of why the environment looks like it does.
1.4 A second refinement: why choose a bumper beam?
Car manufacturing has been honoured for developing both mass production
and later lean production and has thereby showed awareness in relation to
production efficiency and economic issues (Womack et al 1990). On the
other hand, cars in general, and especially the automotive industry, have
been targets of criticism from environmental organisations for decades
(Carbusters 2003).
The bumper beam is not as clearly linked to the environment as, for instance,
the choice of fuels in cars, but knowing that it can be made of different
materials – with steel, aluminium and plastic composites being used most
often – makes potential environmental debates visible.
Thus, tracing the bumper beam's existence in the economy and the
environment, respectively, should provide knowledge about the relationship
between the two societal networks.
1.5 A third refinement: from economy to Economy* and from
environment to Environment*
I will now introduce two proxy variables, as it is hard to clearly define the
economy and environment networks and because whatever empirical area is
chosen, it can never capture the whole of what economy or environment is.
These are called Economy* and Environment* and will be filled with
content during the empirical parts of the thesis.
The proxy variables are related to set theory. In primary school, we were
taught that all fire engines are red vehicles (at least in Norway they are), but
not all red vehicles are fire engines. In this thesis, Environment* is to the
environment network what fire engines are to the category of red vehicles.
Environment* is thus the portion of the environment network created by
science that is related to aluminium bumper beams. Similarly, Economy* is
the part of the economy network produced by industry in relation to
aluminium bumper beams. This is not to say that the elements covered in the
thesis are only related to bumper beams. Rather the contrary, as I do not
believe bumper beams to be a driving force either for the economy or for the
environment, most elements covered within this book are probably produced
for other purposes. And that is a strength rather than a weakness. This thesis
12
is concerned with the relationship between the economy and the
environment, not the specifics of bumper beams, although such specifics are
used to shed light on the aforementioned relationship.
Neither the Environment* nor the Economy* will be predefined categories.
The assumption from the outset is, however, that the Environment* is
predominantly produced by scientists and the Economy* similarly by
industrial companies. This has consequences in terms of where to seek
information about the networks and what information to seek. I will not
decide whether the Environment* is about green trees, species at risk from
extinction, emissions of gases, noise or traffic injuries. Instead it is used as a
collective category for all verbal and material arguments related to life and
health. If I seem too preoccupied with the effects of nitrogen oxides or too
little interested in disposal of nuclear waste, it is because the pressing issues
are defined by the empirical study. In much the same way, the Economy*
will not be treated as an unambiguous category, but will be defined by the
case where such issues as growth or survival of companies are present. Thus
the Economy* can be just as much about securing local employment as
about share dividends and profit, about efficient logistics processes just as
much as about the marketing of products. Common to the descriptions of the
Environment* and the Economy* is that both will be based on relations:
relations between actions, materiality and human beings (Håkansson &
Snehota 1995; Håkansson & Waluszewski 2002; Latour 1987; Latour &
Woolgar 1979).
1.6 More specific research questions
From the first refinement, the preliminary research question stated in
Chapter 1.2 can be reformulated as follows:
How does the economy network affect the environment network, and vice
versa?
The transformation from domains to networks also influences the way to
understand what "affect" means and how effects can be achieved. In order
for two networks to affect each other, an element (node) must be shared so
that it exists in both networks simultaneously. Thus, the research question
can be divided into two more specific questions:
1. What elements are common in the economy network and the
environment network? and
2. How did these elements become common?

13
These questions require thorough knowledge of both the elements included
in both networks and the mechanisms with which each of the networks are
produced and reproduced. As doing this for the entire economy and the
entire environment would be a hopeless task, the last two refinements
narrow the areas that must be searched and researched. The first of the
questions posed above can thus be rephrased:
1. What elements are shared in the Economy* and the Environment*
and still
2. How did these elements become shared?
The thesis will thus map out the elements of the Economy* and the
Environment*, explain their production and provide descriptions of how
some elements have become shared. These findings can be used to increase
understanding of the relationship between the economy and the environment.
Such knowledge can be useful for business managers who want to be more
aligned with environmental issues, environmentalists who want to get a
grasp on why it may be difficult to integrate environmental issues into the
economy, politicians who wants to create a framework for industrial
production and development with a concern for the environment and, last but
not least, scientists who want to take the economy and/or the environment
into account.
1.7 Outline of the thesis / roadmap
Chapter 2 presents the underlying ideas about the collection, treatment and
presentation of empirical material to answer the research questions. The
"theories" 5
underlying the study are displayed and discussed and issues
pertaining to worldviews and the reliability of the study are addressed.
Chapter 3 contains a presentation of the Economy*, that is the part of the
aluminium bumper beam case confined to industry. The bumpers and
bumper beams produced in the relationship between the car manufacturer
Volvo and their supplier at Raufoss between 1970 and 2006 are used to
emphasise the production of Economy*. The elements that make up or have
made up the Economy* are presented. These will be used to discuss the
relationship between the economy and the environment.
Chapter 4 is a presentation of the Environment*, i.e. the part of the
aluminium bumper beam case confined to science. Environmental issues
5 The reason for the use of inverted commas will become clear during the
presentation.

14
related to bumpers and bumper beams are traced through scientific articles
between 1970 and 2006 to emphasise the production of Environment*. The
elements that make up or have made up the Environment* are presented.
These will be used to discuss the relationship between the economy and the
environment.
Chapter 5 presents elements that are common to the Economy* and the
Environment*, explaining how the elements travel from one network to the
other. The mediators – the vehicles of translation – that make it possible for
elements to travel from one network to the other are displayed and some of
their features discussed.
Chapter 6 concludes the thesis. The chapter includes a presentation of the
main findings from the study, a discussion of the case in relation to the
findings and intentions of the study, possible contributions to theories and
practices, and recommendations for further studies.

15
2. Research designing
This chapter will outline the empirical and analytical strategies for capturing
the relationship of the Economy* and the Environment* as they are sketched
in the introductory chapter of the thesis. I will focus particularly on how the
strategies are implemented, that is, how empirical material is collected and
organised. There is no natural order in which to present the research strategy,
as every written account will give a more ordered presentation of the process
than how it is undertaken in real life. The ideal presentation would perhaps
be to have the document as a web page where the reader could click back
and forth among hyperlinks, with the document itself having neither a
beginning nor an end. This chapter does, however, conceal the chaotic
process of iterations between 'methods', strategies, empirical sites and
conceptual thinking, as well as endless pondering on the true nature of
research and the world and if there is such a thing as a true nature. It starts
with a short presentation of the empirical domain before briefly presenting
the "theories" applied to structured data gathering and analysis and
discussing why there are two of them. Then follows a short presentation of
the basic worldview underpinning the study. Thereafter the specifics of how
data is gathered and organised is presented, and the chapter concludes with a
discussion of how explanations are made and how reliability can be
evaluated.
2.1 Selecting empirical material
With the relation between Environment* and Economy* as the starting
point, I was determined to find an empirical area where both networks
should be present, in line with what Eckstein (1975) calls a most likely case.
The automotive industry seemed like an obvious choice. However, the
aluminium bumper beam was not only chosen for its connection to the
automotive industry. In addition to a special interest in aluminium as a
material, I also knew of a Norwegian producer of such components, namely
Hydro, and I knew Volvo to be one of their important customers.
During my years of working with environmental analysis before entering a
PhD program, I learnt that both Volvo and Hydro have been instrumental in
using and even developing environmental assessment tools. A quick glance
at either Volvo's or Hydro's homepage will reveal that they are both
interested in incorporating environmental qualifications into their activities.
They seem more than happy to be able to present and document their
ongoing efforts relating to environmental performance and environmental
improvement of processes. Volvo was the first company in the automotive

16
industry to present an environmental policy back in 1972 (Volvo 2003).
They have been involved in numerous projects on business and
sustainability. I knew both Volvo and Hydro to be successful companies.
They have large revenues, a large number of employees and have stayed in
business for a long period of time. And finally, they feature some
characteristics that make them easier to trace, as indicated below.
Access and availability
Large industrial organisations are often hard to penetrate and gaining access
to the relevant people can be a cumbersome task. The possibility of finding
interviewees is one of the main reasons why I chose Hydro. In my former
job, I had participated in a project group with a Hydro employee from the
Environmental Research Department. He knew who to talk to and his name
worked as a "door-opener" for gaining access to other people in the
organisation. These people were able to help me with the specifics of the
case, provide information about the case and refer me to other people within
both Hydro and Volvo who were involved in the production or development
of bumper beams.
Geographical proximity
The premises for bumper beam production and car assembly are,
respectively, only a two-hour and a four-hour train ride away from my
office. Hydro Automotive has an office in Oslo, as well as one in Raufoss
(where production takes place). Volvo's office is located next to the
assembly plant in Torslanda just outside Gothenburg. This proximity made it
more convenient, both financially and time-wise, to visit these companies'
sites, rather than those of any other producers involved in the car industry.
Language
The interviews and many of the documents have been in Nordic languages,
i.e. Norwegian and Swedish. It would have been harder to understand or
even get hold of a lot of this information without knowledge of these
languages. Obviously, it creates a problem at the "other end", where case
information must be translated into English and where information may
disappear or get distorted. However, I believe this to be a lesser barrier than
having to rely only on those sources with an accessible language.
Social proximity
Together with a common language, the sharing of common cultural
references makes interviews easier to perform. The requirement of
understanding expressions, both technical and social, is thus made easier.
Several of the interviewees even attended the same university that I did,

17
which has contributed positively to the atmosphere of the interview on more
than one occasion.
2.2 Searching for the Economy* and the Environment*
(empirical and analytical theorising)
Having selected what to study and justified the reasons for the selection, the
task of identifying how to study it is next. The bumper beam is not
interesting per se, but is used to exemplify relations between the economy
and the environment.
Whatever the Economy* and the Environment* turn out to be, I do not
believe there are any theories that are currently able to capture any of them
fully, or at least not the relationship between them, particularly if we take
'theory' to mean a ready-made scientific explanation where data can be
inserted to check if the explanation holds or not. I do, however, believe that a
random approach without any guiding principles would be just as, or even
more, misleading. I have therefore chosen two scientific approaches, often
referred to as theories although both are resistant to be termed so, to
structure the empirical and analytical work. These two are the IMP network
approach (IMP) and the actor-network theory (ANT), both which are
presented below. The idea is to apply IMP to sort out the Economy* and
ANT to do the same job with the Environment*. Concepts from each
approach will be used to aid data gathering, organisation of empirical data
and analysis of data. It may be a stupid idea; one fit for raising questions
such as: "Why use two approaches?", "Wouldn't one be enough?" and "Are
they compatible for use in the same study?" I will try to answer these
questions, even though final judgement will have to wait until the study has
been conducted and evaluated. Let us first see what the approaches have to
say.
2.2.1 The IMP network approach
In order to carry out an empirical study of the Economy*, I needed to find an
approach to study economy that was positive towards and allowed for
empirical enquiries. The IMP network approach (IMP) has grown out of
empirical studies of business and should therefore provide a good starting
point.6 Such a view is in line with what McLoughlin and Horan (2002) write:
6 IMP is also referred to as the industrial network approach, industrial network
theory, or the Markets-as-Networks approach
18
"The mainstream view is that any gap between science and practice was
due to the irrationality of managers that must be curbed and brought into
line with the prevailing theory. For network researchers, on the other
hand, the relationship was the opposite. A gap between science and
practice meant a deficit of theoretical knowledge that must be met" (p.
540).
In 1976, a group of young enthusiastic researchers from several European
countries formed the Industrial Marketing and Purchasing (IMP) group.
According to Wilkinson (2001), "they were dissatisfied with the dominant
marketing paradigm of the time, which focused on consumer goods and
adopted a stimulus response, arms-length approach to the customer with
seller as the active party." Inspired by empirical findings of stable
relationships between companies, they started a study of such relationships
between purchasing and selling firms from France, Italy, Sweden, West
Germany and the UK. The results were published in the first IMP study
(Håkansson 1982), where an interaction model was developed. During the
1980s, the scope was widened to include companies outside the focal
relationships and the interaction model was supplemented with a network
model (Håkansson 1987). The research stream has developed towards an
alternative conceptualisation of the market. An alternative to the 'classical'
market model, that is:
"According to the markets-as-networks approach, not only is exchange
interactive but individual market transactions take place within dynamic
exchange relationships between parties who are not anonymous…[The]
market is considered as networks of multidimensional, dynamic
exchange relationships between economic actors, who control resources
and carry out activities. In these exchange relationships social relations
are developed, knowledge is exchanged and developed, technical
changes and adjustments, sometimes of an innovative nature, take place,
logistical activities are coordinated." (Mattson 2003:6-7, emphasis in
original)
We have already come to realise that IMP proposes an alternative approach
to understand business life. Ford and Håkansson (2006b) discuss two
challenges in linking IMP to prevailing ideas. The first is related to the view
"that the structure of the business world is comprised of companies that are
more or less independent of each other and which are each able to build and
execute their own strategy." The second to the view "that the process of
business consists of the independent actions of individual companies,
directed towards a generalised group of 'customers', 'suppliers' or
'competitors' and intended to have an effect on that group as a whole."

19
The way the challenges are phrased make them almost appear as
theoretically driven, but it is emphasised that interdependence and network
properties are evolving features of business life:
"Increasing technological intensity and the associated pressure of cost
have led companies to become more specialized and hence more inter-
dependent with each other. This increasing interdependence has led to
ever-more complex interactions, facilitated by improved
communications between companies with an ever wider variety of
resources and ways of operating" (Ibid:8).
These empirical observations are specified by Håkansson (2006):
"[An] indicator of a change in the business world is the use of new
managerial tools or sets of advice. There are a number of such tools
having network attributes. There are general methods such as JIT (just-
in-time) where companies are advised, through closer relationships, to
take out costly time in production chains and TBM (time-based
management) where not just production but also development schedules
involving several companies should be adapted. In addition, there is
TQC (total quality control) where the issue is to increase the total
quality by applying the same standard in all production stages, again
involving several companies producing a product. There is also the
development of much more specific managerial tools, especially within
marketing and purchasing, including customer relationship
management, supply chain models and key account management, which
all are examples of new and closer ways (thicker interaction) to relate to
counterparts" (pp. 146-147)
In order to make sense of these empirical observations, some of the most
important concepts and assumptions will now be presented. These are
relationships, interaction, heterogeneous resources and networks. Finally,
IMP's relation to the Economy* and to the practical accomplishment of the
thesis is outlined.
Relationships and Interaction
IMP was based on the existence of business relationships and was for a long
time devoted to exploring the content of relationships and the mechanisms
involved in their formation and continuation. The starting point is not that
relationships are intrinsically good. IMP is a descriptive rather than a
normative approach. In fact, emphasis is placed on how relationships
provide both possibilities and constraints for the involved parties.
"The interdependencies in an actor's existing relationships
simultaneously empower and constrain its ability to achieve change and

20
growth. Thus an actor's dependence on the resources and the problems
of others increases its freedom to invest its own resources in more
productive areas within that relationship or elsewhere and provide the
basis for it to develop in new directions. But at the same time, an actor's
existing relationships restrict its freedom to act in the directions of its
own choice and require it to invest resources in interaction within its
existing relationships. A key aspect of business interaction is the
building, managing and exploitation of interdependencies over time"
(Ford & Håkansson 2006a).
Håkansson (2006) gives more specific examples on what possible benefits
may be:
"…The stability in terms of counterparts can be used as a means of
framing and creating development in technical or other aspects.
Relationships become the framework for joint development of
technologies and other types of new solutions. The dynamic role is
significant, and important relationships often include product and
production process developments. One aim is to increase efficiency in
production, handling, or transporting the products or the design of the
product or production system" (p. 153)
Relationships are all-encompassing, in that they steer the directions of the
involved actors and not only those human individuals directly related from
the two organisations. This is also connected to the fact that any single actor
cannot choose how the relationship will evolve.
"Relationships aren't just an issue for marketing or purchasing. Those
areas of corporate activity that are traditionally viewed as "internal" to a
company and as solely its responsibility are not really internal. And they
are certainly not wholly controllable by the company itself. For
example, a company's human resources, operations, finance and
research and development are all affected by and affect the company's
relationships. In fact, it is equally valid to say that the nature of a
company is defined by its relationships, as it is to say that the company
itself defines its relationships" (Ford & Håkansson 2006b:9-10).
Instead, relationships evolve through interaction.
"Interaction emphasises that the processes that occur between
organisations are beyond the complete control of any individual actor.
Interaction is not the outcome of the factors that drive a single action by
a single actor. Instead, it is a process in which the effects of any action
are affected by how that action is perceived and reacted to by the
counterparts. This reaction then triggers re-reactions from the initiating
actor and so on" (Ford & Håkansson 2006b:4).

21
Which further means that:
"Putting interaction at the centre makes it impossible to make sense of
what happens between business companies by looking at just one of
them. The direction of a business relationship is outside the control of a
single company. Neither of the companies involved owns, directs or
manages it. A relationship has an "interactive existence" beyond that of
the participants" (Ford & Håkansson 2006a).
These citations show the relative (or relational character) of relationships.
But as yet, there has been no explanation of what interaction actually
consists of. Ford and Håkansson (2006a) state that:
"Interaction isn't just a set of conversations that lead to some abstract
agreement. Nor is it something that takes place alongside "real"
business. Interaction has a substantial and physical form. Interaction
does include interpersonal communication. But companies also interact
through delivery of physical products and services, information and
payments and also through more one-sided observations. All interaction
has specific meanings for those involved and for those affected by it.
All subsequent interaction will be based on these interpretations of that
meaning by all of those who are affected by it. All interaction is
concerned with the physical world. The economic effects of interaction
appear in the physical world and the outcomes of interaction are within
the constraints of that physical world. Interaction can be seen as the
interplay between different actors, but also as the interplay between the
abstract ideas of those actors and the physical constraints that surround
them. In this way, interaction provides the link between technology and
economy" (pp. 8-9).
Interaction is thus physical, but still connected to the interpretations of the
actors. An important point is the last one made in the citation, 'the link
between technology and economy'. For relationships to make sense, there
must be a chance of increased revenues or decreased costs being achieved as
the result of development through interaction. This brings us to one of the
important assumptions in IMP: unlike most mainstream economic
approaches, resources are viewed as heterogeneous.
Resources are heterogeneous
"One of the critical basic assumptions in market theory is the need to
assume that resources are homogeneous from an economic point of
view. As soon as the value of resources is not a given but can be
improved, for example, by finding a better way to combine them with
each other, then the market form cannot work properly… However,
homogeneity and heterogeneity can also be related to change. A

22
homogeneous resource is given – it is, from an economic point of view,
frozen and therefore cannot be developed. This is not the case for a
heterogeneous resource. Such a resource can always be improved by
finding new and better ways to combine it with other resources"
(Håkansson 2006:161-162).
This is one of the most important points in IMP and one that I find
appealing. The specifics of the technologies employed and the real content
of the exchange matters. IMP is not ignorant to whether the interaction
involves development of a car or exchange of bananas.
The definition of a resource, as given by Snehota (1990), is:
"A resource is an element, material or immaterial, that can be used for
some purpose. It is the purpose that makes an element become a
resource and no element, material or not, is a resource without a known
purpose" (p. 173).
The definition is similar to the one in mainstream economics; it is thus the
element of whether the resource has a set value that is under scrutiny. IMP
has been inspired by the resource approach laid out by Penrose (1959).
Returning to Snehota (1990), he emphasises how the resources are important
elements of the business interaction:
"The notion of costs is related to use of resources. The value of
resources reflects their contribution to the achievement of the purpose.
The relation between resources, costs and achievements of a purpose is
somewhat complex. The value of resources is given by the use of them,
they have no intrinsic value; it is the use, or capability to use resources
that confers resources their value. Resources become valuable as a
support to activities undertaken for a certain purpose, a mere possession
does not make them valuable" (188).
The resource layer has been emphasised by several researchers, especially in
the Nordic countries. Both the assumption of heterogeneity of resources and
the outcomes of resource heterogeneity have been scrutinised (e.g. Holmen
2001; Håkansson & Waluszewski 2002; Jahre et al 2006; Wedin 2001).
Emergent networks
"There is no single, objective network. There is no "correct" or
complete description of it. It is not the company's network. No company
owns it. No company manages it, although they all try to manage in it.
No company is the hub of the network. It has no "centre", although

23
many companies may believe that they are at the centre" (Ford et al
2004:4).
This rather harsh statement summarises IMP's industrial network approach.
Networks are neither something companies set up nor "a priori structures to
be imposed on organizations" (McLoughlin & Horan 2002:537). It follows
that the processes involved in developing and maintaining networks, or
'networking' in the words of Ford et al (2004):
"isn't something carried out by a single company that 'manages its
network' or something that is done 'to' some other companies. All
companies are networking by suggesting, requesting, requiring,
performing and adapting activities, simultaneously. The outcome is the
result of all those interactions!" (p. 7, emphasis in original).
Networks are complicated material and attempts at understanding them have
been developed and refined through the so-called network model (see for
instance Håkansson 1987; Håkansson & Snehota 1995). The network model
includes three layers of substance in business: activities, resources and actors
(hence, it is often referred to as the ARA model). Each of these layers is seen
as dependent on the other two.
"Actors are defined as those who perform activities and/or control
resources. In activities actors use certain resources to change other
resources in various ways. Resources are means used by actors when
they perform activities. Through these circular definitions a network of
actors, a network of activities and a network of resources are related to
each other" (Håkansson & Johanson 1993).
Figure 2-1 shows the interconnection between the three layers.

24
Figure 2-1 The Network Model. (Håkansson 1987)
1. A business relationship links activities. This layer is especially
related to productivity and efficiency.
2. A business relationship ties resources. This layer is especially
related to innovation and technological development.
3. A business relationship bonds actors. This layer is especially related
to identity and power structures.
One of the reasons to include all three layers was that each of them is a
typical feature of any economic model. The difference in IMP related to the
others is connected to the emphasis placed on each of the layers. Many
business models are preoccupied with actors (for instance, within strategy as
discussed in Baraldi et al 2006) or activities (for instance, within logistics as
discussed in Jahre et al 2006). The ARA model does not grant any of them a
special status; they are seen as equally important in the constitution of the
others and of the total network. This equality may, however, give the
impression that IMP 'favours' the resource layer only because the resource
layer is underdeveloped in many other economic theories.
To develop the model of the three layers, the researchers in IMP have
borrowed insights from or been influenced by several different theories, such
as history of technology (Freeman & Perez 1988; Hughes 1984), social
Actors perform activities.
Actors have certain knowledge
of activities
Actors
At different levels -
from individuals to
groups of
companies
Resources
Are heterogenous,
human and physical, and
mutually dependent
Activities
Include the transformation
act, the transaction act,
activity cycles and
transaction chains
NETWORK
Actors control resources;
some alone and others jointly.
Actors have certain knowledge
of resources
Activities link resources
to each other.
Activities change or exchange resources through use of
other resources
25
network theory (Dosi 1997; Granovetter 1973), social exchange theory
(Emerson 1976), sense making (Weick 1995) and transaction cost theory
(Williamson 1975).
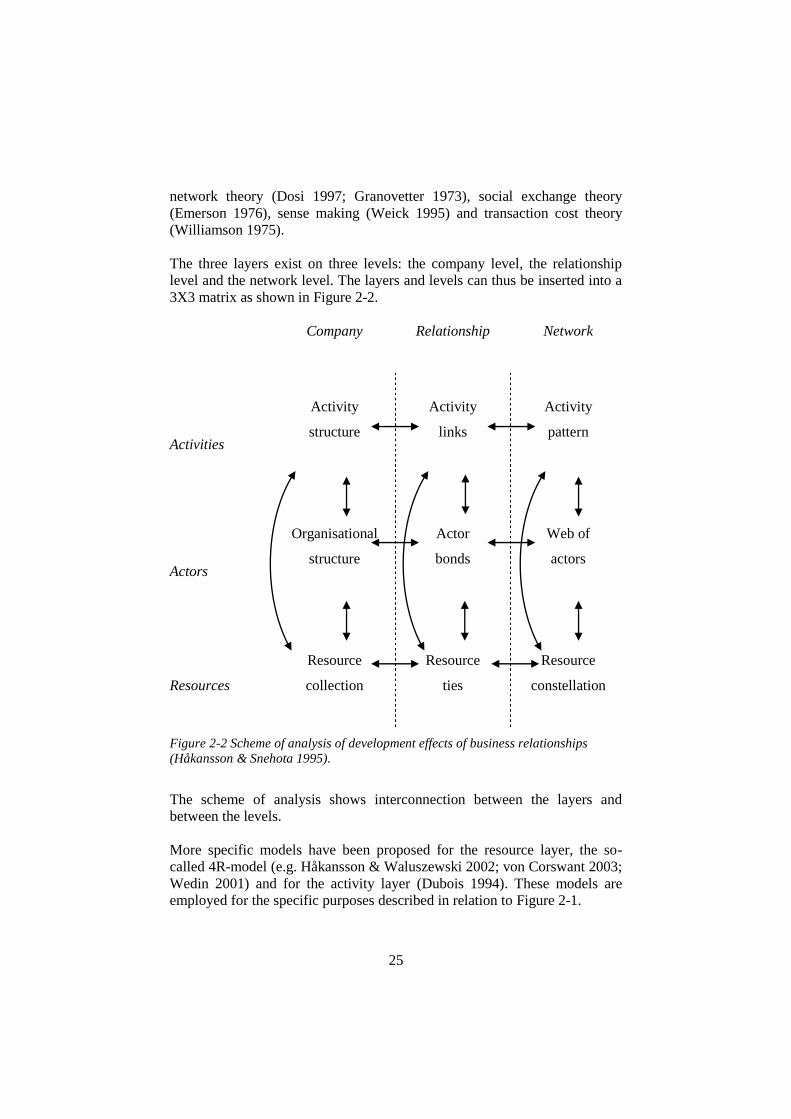
The three layers exist on three levels: the company level, the relationship
level and the network level. The layers and levels can thus be inserted into a
3X3 matrix as shown in Figure 2-2.
Company
Relationship
Network
Activities
Activity
structure
Activity
links
Activity
pattern
Actors
Organisational
structure
Actor
bonds
Web of
actors
Resources
Resource
collection
Resource
ties
Resource
constellation
Figure 2-2 Scheme of analysis of development effects of business relationships
(Håkansson & Snehota 1995).
The scheme of analysis shows interconnection between the layers and
between the levels.
More specific models have been proposed for the resource layer, the so-
called 4R-model (e.g. Håkansson & Waluszewski 2002; von Corswant 2003;
Wedin 2001) and for the activity layer (Dubois 1994). These models are
employed for the specific purposes described in relation to Figure 2-1.

26
IMP, industry and the Economy*
Although the model of an economy based on relationships is quite different
from a model based on atomistic exchange episodes, IMP does not oppose
the general view of the function of the economy for companies. In fact,
Snehota (1990) states a 'classical' view on how economy functions to
conclude that this presupposes the reality of relationships:
"Market exchange opportunities arise when there is a pair of market
participants who attribute different values to goods, to a bundle of
benefits, to a potential object of exchange (product or service). Market
exchange opportunities can be exploited and gain can be achieved
through market exchange transactions by which a redistribution of
property rights is achieved.
It then seems intuitively easy to accept the notion that opportunities for
gain in business are linked to privileged knowledge about the existence
and alternative use of resources and about the potential exchange
parties" (p. 36).
IMP thus does not question the profit-seeking nature of business, but claims
that profit-seeking goes through mechanisms other than faceless
transactions. This again means that the mode of increasing profit is changed,
making the output immeasurable in standard economic terms as it is related
to a network rather than a single actor.
The network model, together with several studies influenced by it, forms the
basis for collecting and writing the empirical material related to the
economic aspects of the bumper beam. All three layers are seen as important
in the formation of the Economy*.
2.2.2 Actor-Network Theory
First comes a warning, and it comes in the words of John Law (1999):
"The success of actor-network theory [ANT] has led to its dissolution.
From signal to noise. But this shift, its diasporic character, also reveals
its strength. For if it is now time to abandon stories that tell of straining
towards the centre then this is because doing so has helped to perform
alternative narrative strategies. Strategies that are not always narratives.
Narratives that are not necessarily strategic. Alternatives that are about
the making of objects and subjects. That are ontological. Alternatives
that have generated the possibility of an ontological politics where
object may be made and remade, remade in different images" (p.10).
The warning is not foremost that actor-network theory is dissolved and
therefore not applicable anymore, but rather that exploring the world of

27
actor-network theory, or the sociology of translation, can take you to places
where the words employed are quite different from those you normally
encounter in sciences. This immediately leads us back to the continuation of
the passage in Law's article:
"And this is why I would recommend actor-network theory. I would
recommend it because it is weak. Because it is in dissolution. Because it
has betrayed itself. Because it has turned itself from signal into noise.
Because it no longer exists. Because it has dissolved itself into other
ways of seeing, of writing, and of doing" (Law 1999:10).
ANT provide alternative ways of describing the world. In addition, as for
IMP with regard to the Economy*, ANT has an outspoken propensity for the
empirical. Most importantly, ANT is concerned with how anything becomes
stable in a world of change. "Universality or order are not the rules but the
exceptions that have to be accounted for," as stated by Latour (1997). It can
therefore aid in accounting for the production of scientific facts.
Since my thesis is concerned with how the Environment* is formed, the
scientific work necessary in order to connect the bumper beam to
environmental impacts is of particular importance. The ANT toolbox
consists of a number of concepts developed to trace the processes of such
stable actor-network formations. The concepts are, deliberately according to
Latour, meaningless in themselves to ensure that they should not be
confused with the empirical world. Three of the more important concepts are
actor-networks, translation and black box. Before digging into the specifics
of the theory, it can be wise to state what ANT is not:
"'Actor' in the Anglo-Saxon tradition is always a human intentional
individual actor and is most often contrasted with mere 'behaviour'. If
one adds this definition of actor to the social definition of a network
then the bottom of misunderstandings is reached: an individual human –
usually male – who wishes to grab power makes a network of allies and
extend his power – doing some 'networking' or 'liasing' as Americans
say… This is alas the way ANT is most often represented which is
about as accurate as saying that the night sky is black because the
astrophysicists 'have shown there is a big black hole in it'" (Latour
1997).
Instead, ANT can be viewed as a general method to investigate the formation
of any stable entity, be it an organisation, a concept or a technology. Latour
(1999a) stated that:
"Far from being a theory of the social or even worse an explanation of
what makes society exert pressure on actors, [ANT] always was, and

28
this from its very inception (Callon & Latour 1981), a very crude
method to learn from the actors without imposing on them an a priori
definition of their world- building capacities" (p. 20).
Latour's project has to a large extent been focusing on showing and
suggesting how to solve the artificial separation between the natural and the
social. It is a critique of sociology for using what should be explained, the
social that is, as the explanation. Nothing should be taken as an underlying
structure and size should not be treated as a cause but an effect.
Actors, Networks, and Actor-Networks
Callon (1987) explained the relation between the actor and the network as
follows:
"The actor-network is reducible neither to an actor alone nor to a
network. Like a network it is composed of a series of heterogeneous
elements, animate and inanimate, that have been linked to one another
for certain period of time. An actor-network is simultaneously an actor
whose activity is networking heterogeneous elements and a network that
is able to redefine and transform what it is made of" (p.93).
Even if the actor-network is non-reducible, there are certain traits of both
actors and networks that have led to the consciously chosen term 'actor-
networks'.
Let us start with the actor:
"An 'actor' in ANT is a semiotic definition – an actant – that is,
something that acts or to which activity is granted by others … [Actors]
are not conceived as fixed entities but as flows, as circulating objects,
undergoing trials, and their stability, continuity, isotopies has to be
obtained by other actions and other trails" (Latour 1997).
This definition of actors is vague and sharp at the same time. The vagueness
probably stems from the normal concept of viewing actors as human beings.
Instead ANT focuses on the ability for everything, be it a knife, a human
being, a bacteria, a pencil or anything else, to act or to make others act. The
sharpness is connected to the requirement that the actor must in fact make a
difference – it has to act – to be an actor. It is not just a placeholder taking up
space in a description.
The inclusion of non-humans as actors has been problematic to several social
scientists (e.g. Collins & Yearley 1992), but to erase the distinction between
the social and nature, no entity should be given a favoured ontological

29
position. Moreover, it is not only to ensure that no one is given a favoured
ontological position that non-humans are included:
"…[The] analytical question is this. Is an agent an agent primarily
because he or she inhabits a body that carries knowledges, skills, values,
and all the rest? Or is an agent an agent because he or she inhabits a set
of elements (including, of course, a body) that stretches out into the
network of materials, somatic and otherwise, that surround each
body…The argument is that thinking, acting, writing, loving, earning –
all the attributes we normally ascribe to human beings, are generated in
networks that pass through and ramify both within and beyond the body.
Hence the term, actor-network – an actor is also, always, a network"
(Law 1992: 381)
ANT seriously considers the idea that the boundaries of a human being are
blurry and Latour (1997) states this to be a 'law':
"As a rule, what is doing the moving and what is being moved have no
specific homogeneous morphism. They can be anthropo-morphic, but
also zoo-morphic, phusi-morphic, logo-morphic, techno-morphic, ideo-
morphic, that is '(x)-morphic'. It might happen that a generative path has
limited actants to a homogeneous repertoire of humans or of
mechanisms, or of sign, or of ideas, or of collective social entities, but
these are exceptions which should be accounted for" (p. 380).
The network metaphor is also consciously chosen, but also readily open for
misunderstandings as 'networks' are spreading like a disease in both
scientific and non-scientific texts. Latour (1997) stresses that the networks in
ANT have nothing to do with technical networks such as computer networks
(which are totally organised) or social networks (which leave the world out
of their analysis).
"ANT aims at accounting for the very essence of societies and natures.
It does not wish to add social networks to social theory but to rebuild
social theory out of networks. It is as much an ontology or a
metaphysics, as a sociology (Mol & Law 1994)"(Latour 1997).
This needs clarification:
"More precisely it is a change of topology. Instead of thinking in terms
of surfaces – two dimension – or spheres – three dimension – one is
asked to think in terms of nodes that have as many dimensions as they
have connections. As a first approximation, the ANT claims that
modern societies cannot be described without recognizing them as
having a fibrous, thread-like, wiry, string, ropy, capillary character that
is never captured by the notions of levels, layers, territories, spheres,

30
categories, structure, systems. It aims at explaining the effects
accounted for by those traditional words without having to buy the
ontology, topology and politics that goes with them. ANT has been
developed by students of science and technology and their claim is that
it is utterly impossible to understand what holds the society together
without reinjecting in its fabric the facts manufactured by natural and
social sciences and the artefacts designed by engineers. As a second
approximation, ANT is thus the claim that the only way to achieve this
reinjection of the things into our understanding of the social fabrics is
through a network-like ontology and social theory.
To remain at this very intuitive level, ANT is a simple material
resistance argument. Strength does not come from concentration, purity
and unity, but from dissemination, heterogeneity and the careful plaiting
of weak ties" (Latour 1997: 370).
Networks thus have the advantage of not being confined into small
categories with homogenous material, and it ends the speculation about all
overlaps and void spaces:
"Literally there is nothing but networks, there is nothing in between
them, or, to use a metaphor from the history of physics, there is no
aether in which the networks should be immersed…A network is all
boundary without inside or outside. The only question one may ask is
whether or not a connection is established between two elements. The
surface 'in between' networks is either connected – but then the network
is expanding – or non-existing." (Latour 1997: 370).
The real advantages come from escaping dominant views on space and size,
in other words the perceived importance of the proximity of actors and the
micro-macro-distinction. ANT contests that the closeness of actors is
necessary for their connectedness and that an actor of larger size is
necessarily more important than a smaller actor.
"The first advantage of thinking in terms of networks is that we get rid
of 'the tyranny of distance' or proximity; elements which are close when
disconnected may be infinitely remote if their connections are analyzed;
conversely, elements which would appear as infinitely distant may be
close when their connections are brought back into the picture. I can be
one metre away from someone in the next telephone booth, and be
nevertheless more closely connected to my mother 6000 miles away; an
Alaskan reindeer might be ten metres away from another one and they
might be nevertheless cut off by a pipeline of 800 miles that make their
mating for ever impossible…[The] notion of network helps us to lift the
tyranny of geographers in defining space and offers us a notion which is
neither social nor 'real' space, but associations" (p. 371).

31
The examples are obvious in print but it is easy to forget when one looks for
relations between elements. Perhaps more important than how relations in
ANT alter the view on distance is how they alter the view on size:
"A network notion implies a deeply different social theory: it has no a
priori order relation; it is not tied to the axiological myth of a top and of
a bottom of society; it makes absolutely no assumption whether a
specific locus is macro- or micro- and does not modify the tools to study
the element 'a' or the element 'b'; thus, it has no difficulty in following
the transformation of a poorly connected element into a highly
connected one and back. A network notion is ideally suited to follow the
change of scales since it does not require the analyst to partition her
world with any priori scale. The scale, that is, the type, number and
topography of connections is left to the actors themselves…[instead] of
opposing the individual level to the mass, or the agency to the structure,
we simply follow how a given element becomes strategic through the
number of connections it commands and how does it lose its importance
when losing its connections." (Latour 1997: 371)
It follows that:
"A network is never bigger than another one, it is simply longer or more
intensely connected."(Latour 1997: 371)
This alteration is necessary in order to avoid granting some actors extra
power because they look big at the outset. The point is to grant the empirical
world the right to make the explanations instead of relying on predefined
views of what is important and what is not.
Latour is, however, quick to emphasise that the alteration of views is not the
same as defining away distance and size and other "standard" variables in
science:
"This is not to say that there is nothing like 'macro' society, or 'outside'
nature as the ANT is often accused to, but that in order to obtain the
effects of distance, proximity, hierarchies, connectedness, outsiderness
and surfaces, an enormous supplementary work has to be done (Latour
1996a)." (Latour 1997: 372)
Thus, the change of views is rather connected to a different understanding of
the objects under study as well as a different way of making sense of them.
Entities are no longer either physical and real or socially constructed:
"The new hybrid status give to all entities both the action, variety and
circulating existence recognised in the study of textual characters and
also the reality, solidity, externality what was recognized in things 'out

32
of' our representations. What is lost is the absolute distinction between
representation and things – but such is exactly what ANT wishes to
redistribute through what I have called a counter-Copernican
revolution." (Latour 1997: 375)
Words and objects get mixed up as they do in everyday life and this dual
nature is used constructively rather than being defined away at the outset.
The result has consequences for understanding not only actors, but also
networks and actor-networks.
"…[ANT] is not about traced networks but about a network-tracing
activity…There is not a net and an actor laying down the net, but there
is an actor whose definition of the world outlines, traces, delineate,
limn, describe, shadow forth, inscroll, file, list, record, mark or tag a
trajectory that is called a network. No net exists independently of the
very act of tracing it, and no tracing is done by an actor exterior to the
net. A network is not a thing but the recorded movement of a thing. The
questions ANT addresses have now changed. It is not longer whether a
net is a representation or a thing, a part of society or a part of discourse
or a part of nature, but what moves and how this movement is
recorded." (Latour 1997: 378)
Much of the material here may seem overly specific and almost pretentious,
but there is a reason for it:
"ANT is not merely empiricist though, since in order to define such an
irreducible space in which to deploy entities, sturdy theoretical
commitments have to be made and a strong polemical stance has to be
taken so as to forbid the analyst to dictate actors what they should do.
Such a distribution of strong theory for the recording frame and no
middle range theory for the description is another source of many
misunderstandings since ANT is accused either of being dogmatic or of
only providing mere descriptions. For the same reason it is accused of
claiming that actors are 'really' infinitely pliable and free or, inversely,
of not telling what a human actor really is after…[It] does not say
anything about the shape of entities and actions, but only what the
recording device should be that would allow entities to be described in
all their details. ANT places the burden of theory on the recording not
on the specific shape that is recorded" (Latour 1997), p.375.
Thus, to tell a real empirical tale, the instruments for doing so must be well
specified. That is why time is spent here on sorting out what the concepts,
the mechanisms or the processes are that can be used to understand the
formation of stable entities, that is, actor-networks. This is particularly
important as scientific facts are both good examples of stable entities and
provide the foundation for the Environment*.

33
Translation
Translation is the building block of actor networks. It is the manifestation of
interaction between actors and may happen in many ways. Latour (1986)
describes it thus:
"…the spread in time and space of anything - claims, orders, artifacts,
goods - is in the hands of people; each of these people may act in many
different ways, letting the token drop, or modifying it, or deflecting it,
or betraying it, or adding to it, or appropriating it." (p. 267)
In order to align the interests of different actors, translation is needed and "is
more effective if it anticipates the responses and reactions of the materials to
be translated" (Law, 1992: 388). Translation is thus the act and outcome of
carrying an idea or a material object forward:
"Analysis of ordering struggle is central to actor-network theory. The
object is to explore and describe local processes of patterning, social
orchestration, ordering, and resistance. In short, it is to explore the
process that is often called translation which generates ordering effects
such as devices, agents, institutions, or organizations. So "translation" is
a verb which implies transformation and the possibility of equivalence,
the possibility that one thing (for example, an actor) may stand for
another (for instance a network).
This, then, is the core of the actor-network approach: a concern with
how actors and organizations mobilize, juxtapose, and hold together the
bits and pieces out of which they are composed: how they are
sometimes able to prevent those bits and pieces from following their
own inclinations and making off; and how they manage, as a result, to
conceal for a time the process of translation itself and so turn a network
from a heterogeneous set of bits and pieces each with its own
inclinations, into something that passes as a punctualized actor"7 (Law
1992:386).
The citation above may be difficult to understand. The consequences are
'easy', however, if we look at what ANT has achieved through their studies:
"The empirical conclusion is that translation is contingent, local, and
variable" (Law 1992:387).
Those things that are contingent, local and variable can certainly be
interesting, but scientific facts show the exact opposite characteristics. Thus,
there must be ways to make translations last, to make them into black boxes.
7 A punctualized actor is similar to an actor-network that is black-boxed.
34
Black box
A black box is what occurs whenever an actor-network is sealed in such a
fashion that it can act as a single actor. Latour (1987) states:
"I have used this term both too much and too loosely to mean either a
well-established fact of an unproblematic object…The only way for
new undisputed facts to be fed back, the only way for a whole stable
field of science to be mobilised in other fields, is for it to be turned into
an automation, a machine, one more piece of equipment in a lab,
another black box" (p. 121).
Most of science is based on black boxes, on previously established truths
that must be taken for granted. When carbon dioxide, measuring instruments,
laboratories, scientific journals, and solar rays all are made into one single
theory of climate change, we have a black box. This can serve as input for
other sciences and also for political processes such as the Kyoto protocol
negotiations.
Black boxes presuppose translations to be far from contingent, local and
variable. Instead they must be durable and mobile. Both these features have
to be inserted into the actors involved, the fabric of the actors cannot be
easily dissolved and they must be able to travel. Such are the characteristics
of many actors and actor-networks as shown in a number of ANT studies.
ANT, science and the environment
The first studies in ANT concerned the production of scientific facts (See for
instance Latour 1983; 1987; Latour & Woolgar 1979).
"They argued that knowledge is a social product rather than something
generated through the operation of a privileged scientific method. And,
in particular, they argued that "knowledge" (but they generalize from
knowledge to agents, social institutions, machines, and organization)
may be seen as a product or an effect of a network of heterogeneous
materials.
I put "knowledge" in inverted commas because it always takes material
forms. It comes as talk, or conference presentations. Or it appears in
papers, preprints, or patents. Or again, it appears in the form of skills
embodied in scientists and technicians (Latour & Woolgar 1979).
"Knowledge," then is embodied in a variety of material forms. But
where does it come from? The actor-network answer is that it is the end
product of a lot of hard work in which heterogeneous bits and pieces –
test tubes, reagents, organisms, skilled hands, scanning electron
microscopes, radiation monitors, other scientists, articles, computer
terminals, and all the rest – that would like to make off on their own are
juxtaposed into a patterned network which overcomes their resistance.

35
In short, it is a material matter but also a matter of organizing and
ordering those materials. So this is actor-network diagnosis of science:
that it is a process of "heterogeneous engineering" in which bits and
pieces from the social, the technical, the conceptual, and the textual are
fitted together, and so converted (or "translated") into a set of equally
heterogeneous scientific products" (Law 1992:381, emphasis in
original).
The output of science, the texts, travel easily through actors like books and
journals - and the texts are made credible, their actor-network status
stabilised, through alluding to still more resistant materials and the trails they
make materials undergo in the hands of scientists. Even the texts themselves
creates references to durability:8
"As I have shown elsewhere, it is possible to define scientific literature
stylistically by following how the authors, instead of alluding to
documents, mobilize them in the text as so many inscriptions (tables,
graphs, pictures, diagrams). It is even possible to decide if a narration
pertains to a harder or a softer field of science by looking at the type of
inscriptions and the way they are piled on top of one another so as to
create, for the reader, the impression of a harder or softer reality"
(Latour 1988:8).
ANT will be guiding the description of the environmental aspects of the
bumper beam. All the concepts treated here will be central to explain the
formation and texture of the Environment*. In addition, in the book Science
in Action, Latour lays down rules and principles to follow when studying
sciences. I have picked out four rules and two principles that are deemed
especially important for studying the Environment*. These rules and
principles are supposed to steer the way the empirical data is collected and
the empirical description is written to avoid a presentation where the
conclusions are given in advance.
8 Latour (1988) also describes the tedious efforts by Einstein in securing non-
deceitful translations to sort out the actor-network known as the relativity theory:
"Obviously, Einstein is both a latecomer in this long history [of centres of
calculation] and a significant contributor to it. His obsession with transporting
information through transformations without deformations; his passion for the
precise superimposition of readings; his panic at the idea that observers sent away
might betray, might retain privileges, and send reports that could not be used to
expand our knowledge; his desire to discipline the delegated observers and to turn
them into dependent pieces of apparatus that do nothing but watch the coincidence
of hands and notches; even his readiness to jettison what common sense cherishes
provided the equivalence of metrological chains be saved" (Latour 1988).

36
The rules are given in citations, while my reasons for employing the specific
rule are argued for in between.
"1. We study science in action and not ready made science or
technology; to do so, we either arrive before the facts or machines are
black boxed or we follow the controversies that reopen them” (Latour
1987:258).
It is not enough to describe environmental issues as they are presented in
science or in mass media in order to show what the environment really is. To
do so, the different elements making up an environmental problem must be
scrutinised and their history tracked in order to avoid taking the elements for
granted.
“2. To determine the objectivity or subjectivity of a claim, the efficiency
or perfection of a mechanism, we do not look for their intrinsic qualities
but all the transformations they undergo later in the hands of others”
(Latour 1987:258).
In other words: an idea, a theory or a machine is not right by definition
alone. They need usage to become right and are transformed in the process.
The quality of an element therefore cannot be described by looking at the
element itself. This rule is important to avoid a description where elements
are taken for granted because their extended presence makes them look to be
of better quality.
“3. Since the settlement of a controversy is the cause of Nature's
representation, not its consequence, we can never use this consequence,
Nature, to explain how and why a controversy is settled” (Latour
1987:258).
When the environment is described, the results from science cannot be taken
as the starting point. Facts from natural sciences are not present out there in
nature for researchers to reveal, so appeals to nature should be avoided when
presenting the elements that make up the environment. “4. Since the settlement of a controversy is the cause of Society's
stability, we cannot use Society to explain how and why a controversy
has been settled. We should consider symmetrically the efforts to enrol
human and non-human resources." (Latour 1987:258).
Society is just as unsuitable as Nature to be the root cause of everything, as
Society is also created. Thus, this fourth rule is necessary to complement the
third and to stick to a description where elements are not predetermined to
belong to either category.

37
The principles:
"1. The fate of facts and machines is in later users' hands; their qualities
are thus a consequence, not a cause, of a collective action.
This principle is similar to the second rule and tells me to avoid the use of
the elements themselves as an argument for how they are used. Rather the
elements usage should be tracked and described in order to understand why
they disappear or are enforced.
2. Scientists and engineers speak in the name of new allies that they
have shaped and enrolled; representatives among other representatives,
they add these unexpected resources to tip the balance of force in their
favour." (Latour 1987:259)
This last principle is guiding the understanding of how environmental
problems grant weight and become important. The elements in the
environment are not enough in themselves, neither are the researchers
describing them, but in combination they can make environmental issues
important and lasting.
2.2.3 Why two theories?
Why the two are used must be motivated by their potential to add to the
issues at stake. Do the theories produce credible descriptions of the
Economy* and the Environment* and is it then possible to compare the
descriptions? Conflicting theories with mutually exclusive assumptions
cannot be used. They must be similar enough to produce comparable
descriptions, yet different enough to produce complementary descriptions.
Thus, the important question becomes: What are the differences between
them and what are the similarities?
Their weaknesses and strengths are different: where IMP seeks to confine
itself to a world of business-to-business marketing (although alluding to
consequences for the view on markets and thus the economy), ANT focuses
on a more general theory of how to produce knowledge (or any other stable
entity).
The most striking difference between the two approaches is the boundaries
they have imposed on themselves with regard to which objects to study. IMP
has constrained itself to only deal with empirical phenomena within the
industrial sphere, while ANT seems borderless and applicable for studying
whatever phenomena where anything gets stabilised. This difference also
points to some of the strengths and weaknesses of the approaches. One of the
38
advantages of IMP is that it encompasses a body of research where a lot of
knowledge about the working of industry is gathered, though this has the
danger that the model is confused with the empirical. It also facilitates the
idea that all the actors, activities and resources are there to affect an
economic output. ANT does not encompass anything more than a
metaphysical language, a framework for capturing whatever aspect of the
social (which in the ANT meaning also encompasses nature). There is less
danger of believing in the framework, but it is also harder to spot why any of
the actors act at all.
Another difference is the view on stability and change. From the very
beginning, one of the propositions of IMP has been that stability is one of the
premises for change. In ANT, stability is the exception; the phenomena that
must be explained. This difference may be superficial and only relate to the
phenomena that these approaches have sought to explain. It may, however,
be a real and important difficulty and this issue will be taken up for
discussion in the last chapter.
Regarding the similarities, i.e. the conditions necessary for bringing
information from both together, I believe the presentations have shown that
there are more similarities than just the common term 'network' and a
reluctance to be seen as 'classical' theories. According to Mattson (2003),
when comparing ANT to four marketing theories:
"ANT's by far 'closest neighbour' is the markets-as-networks view.
Markets-as-networks also is specific about the need to consider both
social and technical interdependencies but is not at all explicit in how
human and non-human actors are methodologically related and not clear
about the performative aspects. As to the methodology for studying
dynamics ANT is more 'precise' than markets-as-networks. Markets-as-
networks studies focusing on technological innovation (e.g. Håkansson
1989; Lundgren 1995) demonstrate an explicit link between science and
practice." (p. 16).
McLoughlin and Horan (2002) state that two other IMP researchers rely on
ANT to describe the network metaphor:
"In support of their position against a more explicit definition [of
networks] they enlist Latour (1993, pp. 3-4) who has described the
network metaphor as '…more supple than the notion of system, more
historical than the notion of structure, more empirical than the notion of
complexity, the idea of network is the Ariadne's thread of these
interwoven stories…which remain more invisible than spiderwebs.'" (p.
538)
39
There are also other instances of IMP researcher taking up ideas from ANT
and applying them to industrial networks, for instance Håkansson and
Waluszewski (2002) using the term translation and Araujo (2007), Kjellberg
(2001) and Helgesson (1999) employing ideas from ANT to understand
marketing and market-making.
Using IMP concepts to understand the Environment* could possibly produce
an interesting picture, although earlier studies where the environment plays a
role let the environment be a backdrop against which other effects are
studied (see e.g. Harrison 1999; Harrison & Easton 2002; Håkansson &
Waluszewski 2002). Using IMP to describe (and thus explain) the
Economy* is much more natural, as most IMP studies are focusing more or
less explicitly on economic questions.
It is harder to rule out the use of ANT to produce descriptions (and thus
explanations) of the Economy*. According to Law, ANT is a general method
to capture the empirical:
"[science] isn't very special. Thus what is true for science is also said to
be true for other institutions. Accordingly, the family, the organization,
computing systems, the economy and technologies – all of social life –
may be similarly pictured. All of these are ordered networks of
heterogeneous materials whose resistance has been overcome. This,
then, is the crucial analytical move made by actor-network writers: the
suggestion that the social is nothing other than patterned networks of
heterogeneous materials." (Law 1992:380 italics in orginial)
However, this is not the only reason. There is also an explicit interest shown
by ANT researchers into economic issues where ANT's basic worldview is
employed in order to understand economy (see for instance Callon 1998a;
1998b).The reason for choosing IMP is thus that it, at the outset, seems
better equipped to describe the economy network.
It follows from both the presentation of the theories and the discussion here
that the main argument for applying both approaches is that they each carry a
history of earlier uses. The applications have coloured the way the
approaches are presented by different theorists and also my interpretation of
them (both the approaches and their presentations, if these can be separated
at all).
The most important similarity, the one concerning the underlying
assumptions about the working of the world, will be treated next. A more
thorough discussion of the usefulness of the approaches in the thesis will be
provided towards the end of the thesis.

40
2.3 The world and how to gain knowledge about it
Theses within many established sciences, or established paradigms to use the
words of Kuhn (1962), need not worry too much about the relation to reality
or the methods to uncover its secrets. This thesis, concerned with the relation
between nature (as entities we value and want to care for) and society (as
economics and possibilities for monetary gain and sustained production) and
employing two different "theories", must have a conscious relation to and
presentation of such issues. This presentation could have been carried out
using terms such as ontology (what the world is), epistemology (how we can
gain knowledge about the world) and axiology (what the researcher's values
are). However, imposing such terms already establishes a view of the world
as something disconnected from the human mind and the research process as
distinct from the values of the researcher. I believe such predefined
restrictions on what the world is and how it can be captured hamper the
possibility of understanding the empirical world. Other standpoints may
prove more valuable, for instance allowing for the empirical to be
"righteous" (i.e. not in need of a theory to be understood) and viewing the
world as process and relationality.
2.3.1 The world as process and relationality
Since I will bring IMP and ANT together in the analysis, one of the
requirements should be that they have compatible views on reality and ways
to know more about it. At the outset, it is hard to tell whether this is the case.
Researchers within IMP have not spent much space in articles and books on
clarifying the philosophical position.9 One clear exception is Easton (1992;
1995) who has clearly stated his position as a critical realist and also the
usefulness of this perspective when investigating industrial networks. Actor-
network theorists have been much (too?) occupied with the philosophical
underpinnings of their approach. In fact, the philosophical underpinnings and
the approach are almost inseparable, as the project is a new way of
describing the world, freed from the dichotomies proposed by modernity
(Latour 1993). In practice, this means that nature and society should not be
divided, they are indivisible parts of one another and every explanation of a
phenomenon should include both humans and non-humans, that is we should
not believe that society - or nature - in itself can explain anything. The
operational consequence of this is that the world is the actor-networks it
encompasses and that the empirical gives the best explanation of the world.
A similar argument can be found in Håkansson and Waluszewski (2002):
9 There are of course several examples of such clarifications in PhD theses produced
within IMP (e.g. Baraldi, Gressetvold and Holmén), but there are few articles or
books that cover such issues written by established researchers.

41
"Regardless of one's standpoint in this discussion [generate vs. verifying
theory], the main attention is still directed to the issue of if and how a
qualitative approach can contribute to theory. Seldom is the opposite
issue dealt with: if and how a qualitative approach can be used to
develop the view of the empirical world. However, even if this is a total
clash with what is brought forward in a positivistic context, this is
exactly what both researchers and companies struggle with every day"
(p. 16, emphasis in original).
Being interested in the empirical world means the researcher must pay
attention to what the empirical has to say about the subject rather than
depend on predefined categories. I have been involved in a constant process
of simultaneously coming to grips with the empirical world and the theories
employed to make sense of it. However, this does not mean reverting to
theories that are already fixed with what the empirical is:
"Categories and things may make it easier for us to grasp reality but
they also hide its underlying complexities…[they] suggest that thinking
is directed by a centrally focused perspective which fixes its forms and
thus loses any sense of the human world as a field of dynamic and
mutable relations" (Cooper 2005:1690, emphasis in original).
I want to get a grip on the 'dynamic and mutable relations' and using IMP
does not counteract such an approach. In fact, it may support the view that
relationships are as substantial as things:
"All business interaction is part of a process that involves resources
from far wider in the surrounding network of actors than from the small
number of actors that are apparently involved in it. Even more
importantly, the tangible characteristics of business such as companies
and their products, sales and purchases are no more substantial in an
interactive world than the apparently ephemeral relationships that exist
between those companies" (Ford & Håkansson 2006a).
There is a relationship between the existence of relationship and the space
that the relationships exist in:
"Space, any space, is much more than the container of things; it 'is not
the setting (real or logical) in which things are arranged, but the means
whereby the positing of things become possible' (Merleau-Ponty
1962:243). Things derive their character and thinghood from the space
through which they re-late to each other: 'This means that instead of
imagining (space) as a sort of ether in which all things float…we must
think of it as the universal power enabling them to be connected'
(Merleau-Ponty 1962:243). Connection and relationship are the vehicles
that human agency carves out of pre-objective space so that its latency

42
can be re-lated through the meaningful arrangements of the things and
objects that make up the human world." (Cooper 2005:1694)
The relationships and the effects they produce assume structural properties
that again deem the relationships to be a process:
"…Actor-network theory assumes that social structure is not a noun but
a verb. Structure is not free-standing, like scaffolding on a building-site,
but a site of struggle, a relational effect that recursively generates and
reproduces itself. The insistence on process has a number of
implications. It means, for instance, that no version of the social order,
no organization, and no agent, is ever complete, autonomous, and final"
(Law 1992: 385-386)
Latour's book "Pandora's Hope" (1999b) starts with the author being asked if
he believes in reality. He is astonished by the question and the rest of the
book is an attempt to describe how he views reality as a construction, but not
as a social construction only existing within a social sphere. The world is
thus a construction but not a social construction as proposed by Berger and
Luckmann (1966). It is a "real" construction made of heterogeneous
material. Every entity in the construction can only be understood by its
relation to other entities, i.e. no entity can ever be described without
describing its relation to one or more other entities. This is what I will refer
to as a relational view of the world. There is no sharp, if any, distinction
between relationality and relativity. I am using the former term to pinpoint
the relational nature of relativity so beautifully expressed by Deleuze (1993): "Relativism is not the relativity of truth but the truth of relation."
According to Cooper (2005), the empirical material I am studying, the
bumper beam and its place in the car (industry) is in itself coupled to an
illustration of relationality:
"The history of modern methods of production illustrates relationality as
an all-pervasive force in the development of the modern world.
Industrial production is increasingly focused on the production of parts
rather than whole, finished objects: the mass production method used in
the manufacture of the motor car conveniently illustrate production as
re-lating of parts." (p. 1706, emphasis in original)
The relationality, Cooper (2005) writes, must be understood:
"as an active condition of betweenness in which individual terms can
never exist or find themselves since they are always mediated by the
neutrality of the latent. Never a thing in itself, relationality tells us that
we are also parts in the 'movement of being' and what constitutes us is
the interactive re-lating that occurs between parts: the scientist exists in

43
the interior of the research activity and not outside it as an external and
independent observer; the motor vehicle drives me just as much as I
drive it. Relationality says that we are extension of our supports and
props just as much as they are extensions of us; it reminds us of the
essential reciprocity between ourselves and the world of objects." (p.
1704)
This specification of relationality tastes of déjà vu, similar statements about
the nature of relationships have been made in the presentations of both IMP
and ANT.
Another reason for claiming that the approaches have a similar worldview is
that researchers associated with them are producing similar texts (mainly
monographies) resembling what are often referred to as case studies. This
study will be no exception and the next chapter will present the case study
object(s).
2.4 Method or how the empirical is captured
ANT and the Industrial Network Approach seem to agree on the empirical
focus. Latour tells me to "Follow the actors!" while Håkansson says: "Let the
case speak!" As such, they are both empirical and analytical strategies.
However, what observations to capture and the way of capturing them and
writing them down are not evidently the same in the two approaches.
Therefore I must be cautious about where they are conflicting and where one
has a concern not shared by the other.10
Ultimately, I should have been two
different researchers doing two different studies, but besides being
impossible, it would also not have allowed me to capture the conflict I am
interested in. In addition, there will always be questions about who the actors
are and what the case is. I do, however, try to sort out two different cases, or
two different descriptions of the same case, as will be explained in the next
subchapters.
The easy way out would be to state that the thesis is based on a case study
design according to the principles laid out by Yin (1989). Many articles and
theses use this reference to justify the choice of a case study without
specifying further the advantages or disadvantages or even the way the study
has been conducted. There is, however, a reason for choosing a case study
design. One of them being that case research has been a key method (among
others) for researchers operating within the industrial network approach
(Dubois & Araujo 2004). Moreover, a case study does not seem to be
10
A more lengthy discussion on the advantages and disadvantages of applying both
approaches is provided towards the end of the thesis

44
disagreeable from an ANT point of view, although the word itself is rarely
used. What is presented here is a short discussion of the advantages and
disadvantages with case study research, followed by a description of how the
case study is undertaken.
2.4.1 Case study design
Case studies are widely recognised as being useful for producing scientific
knowledge (see e.g. Andersen 2003; Dubois & Araujo 2004; Eisenhardt
1989; Yin 1981; 1989).11
Even some positivists are in favour of the
hypothesis-building capacities of case studies. One does, however, easily get
the impression that case studies are ranked second to "proper" scientific
methods, that they can only be used as pre-studies before the real
investigation begins. The real investigation is then considered to be model
testing. I have the opposite belief: statistical surveys and testable methods
can be useful for generating problems that can be investigated more closely
with the aid of a case study. In other words, case studies are able to produce
more substantive knowledge than any survey. This is probably connected to
the belief in process being more important than structure and the empirical
being better to speak for itself than through the meta-language of any
researcher. Validity issues will then be treated differently than in a statistical
survey, but this issue is discussed in the next section, as this is the place for
describing how the case study is organised.
I was initially concerned with how I could find empirical instances of the
Environment* and the Economy*, and especially where the two meet. As
both the Environment* and the Economy* as the terms used in this thesis are
vague networks at the outset, part of the research process consists of
determining the boundaries of these analytical constructs. From the start,
bumper beams produced and developed in the relationship between Volvo
and Hydro was supposed to be the tool to focus the case description. These
bumper beams belong per definition to the economy network, so most of the
activities of which they are the objects must be of an economic nature. Thus,
processes that clearly seem to be contrary to the "normal" stream of
processes are probable instances where Environment* makes its way into the
Economy*. I still believe this description of bumper beams to be viable to
produce insights about the Economy*, but several questions popped to the
surface: What if investments are carried out to improve Economy* but fail?
What if investments are carried out to improve Environment* but improve
11
This is not to say that they are undisputed, as they are also recognised as being
misused, ill-devised and poorly conducted in many instances.

45
Economy* at the same time? What if investments are carried out to improve
Economy* but improve Environment* at the same time?
The revised approach has been to include two descriptions of bumper beams.
The first one is based on the line of thought whereby they are described
through the relationship between Hydro and Volvo. The focus is on the
activities, resources and actors involved in their production and how these
have changed or remained stable over time to capture the evolvement and
content of the Economy*. The second is a description of bumper beams as a
research report. Instead of seeing them as the physical outcome of an
industrial process, they are viewed as the outcome of scientific research
where I put special emphasis on the bumper beams' environmental
characteristics and thus research that is connected to environmental issues.
The environmental issues are traced through texts to capture the evolvement
and content of the Environment*. Figure 2-3 shows a model of the two
descriptions and the relationship to bumpers.
Figure 2-3 A model of the descriptions of the Economy* and the Environment* and
the relationship to bumpers.
The left side of Figure 2-3 shows the industrial network involved in
producing bumpers (and simultaneously the Economy*). On the right is the
scientific network involved in producing the environmental characteristics of
the bumpers (and thus the Environment*). The bumper is one element where
a connection between the Economy* and the Environment* exists, but there
may be connections also between other elements as this thesis will try to
scrutinise.
Bumper
Economy
Environment
Bumper
Economy
Environment

46
Industrial production of bumper beams is not disconnected from scientific
production of bumper beams. Both Hydro and Volvo make internal use of
research in relation to the bumper, both in making it material and in using it
in different texts such as annual reports and marketing material. Volvo and
Hydro are also directly involved in research, so that the physical bumper
beams also serves as input to research texts. The article used as a starting
point for describing the Environment* even looks at the environmental
properties of bumper beams produced at Raufoss. Ideally, I want to produce
two 'pure' descriptions, meaning that they do not show any connections
between research and the Volvo-Hydro relationship. However, in practice
this will be cumbersome and may add problems when information from the
two descriptions is brought together towards the end of the thesis. Whether I
have used two descriptions of a single case study or two different case
studies is not something I will discuss here, as it is deemed unimportant. I
have constantly reflected on issues such as the unit and level of analysis and
the choices will come through in the text, making a lengthy formal
discussion unnecessary.
To construct the descriptions, different sources are used to produce
information, to complement each other or to verify or clarify what one
source has stated. The most important sources for empirical data in the thesis
are interviews, documents, observations and physical artefacts.
Interviews
Much of the material for the thesis has been gathered through interviews and
the information from these is especially important for the first description,
the one about the Economy*. Not meaning that everything every interviewee
said has been of importance, but the human beings who are part of the
production and development of bumper beams within the relationship
between Hydro and Volvo have guided the first description. Their emphasis
on various issues has sent me in many directions and they have been one of
the important sources for documents. Interviews have not been as important
for the second description, although information from interviews has helped
in finding the research streams associated with bumper beams.
I have tried to keep the interviews open-ended in the sense that I have not
had a complete list of questions, but rather an interview guide with a few
central themes to be elaborated. These themes have varied according to the
positions of the interviewees and according to my knowledge of the case and
what information I have believed to be useful.
A few interviews have included more than one interviewee and I have found
these to be extremely useful. They have turned into a dialogue between the
industrial representatives where I have only raised the issues to be discussed.

47
However, the use of this format has only been used a few times and it is not
only associated with positive issues. In addition to being a hard interview
strategy to pursue due to the time constraints of possible interview subjects,
it also creates a risk that the interviewees will be afraid to give 'silly'
answers.
I do try to maintain an air of 'stupidity' in every interview, in the sense that I
will not pretend to understand issues I am not sure I have understood,
although I must admit that I have a propensity to appear rather more
intelligent, which creates some resistance in asking the really 'silly'
questions. Hence, I also believe it to be important to reflect on the
interviewees' motivation for giving the answers they do. Many of them have
expressed their concerns on the balancing act between economic issues and
other issues (such as environmental issues or family life) in their private and
working lives. These concerns, as well as how they affect their answers,
should be taken seriously. Although a general strategy on how to handle
such issues is hard to define, it probably boils down to treating the
interviewees with trust and respect while at the same time using several
sources for documentation.
Most of the interviews have been performed face to face, which allows for
other types of interaction than just verbal. Whenever an issue has been
unclear and where a figure could provide a clarification, I have asked for
such. The interviewees have also spontaneously used drawings and/or other
support material (such as a physical bumper beam) to make me understand
the issues. A smaller number of interviews have been undertaken on the
phone due to long distances or tight time schedules. E-mail has been used as
a tool to establish initial contact with interviewees and for answers to
'simple' questions with already established contacts.
Some of the early interviews were conducted using a tape recorder.
However, I discovered that the tape recorder was affecting the amount of
information the interviewees were willing to share, as my notes (which were
made in addition to the recording) revealed that more interesting information
occurred whenever the tape recorder was shut off. Its seemingly disturbing
presence made me abandon the use of it. Instead I have relied on writing
fast, using quotation marks wherever I have felt an important statement to be
made, one where there was a need to be true to the original formulation.
To further ensure the information to be correct, the interviewees have been
given the transcripts and thus the possibility to correct misunderstandings, to
tell me what they would not like me to cite and to add information they felt
was missing.

48
A list of the interviews conducted is presented in Appendix A.
Documents
Documents include a range of textual accounts from personal notes via
presentations, formal contracts and marketing leaflets to scientific articles, to
mention but a few. The use of documents is different for the two
descriptions. For the industrial description, texts have been instrumental in
providing understanding of the different processes involved in producing and
developing bumper beams both in a contemporary and historical setting.
Some of the material is of a presentational nature, such as annual reports,
environmental reports and PR brochures. The way these are used resembles
how Håkansson and Waluszewski (2002) use written material:
"As Atkinson and Coffey (1997: 61) emphasise, 'rather than ask whether an
account is true, or whether it can be used as "valid" evidence about a
research setting, it is more fruitful to ask ourselves questions about the form
and function of texts themselves'. The written material has certainly been
important. It helped to grasp the formal views of different actors on different
issues and, in particular, to understand technical aspects related to the
provision and use of LWC paper." (p. 21)
The importance of documents is greater for the second description, the
bumper beam research case. To trace research on and connected to bumper
beams involved finding scientific articles and following their citations. The
majority of the articles lead to sites where aspects of the material world are
translated into numbers, figures, graphs and text. To get inside automotive
research, I have become a member of the Society of Automotive Engineers
to access databases of conference information and journals connected to
research on cars. I performed an extensive literature search in journal and
library databases and the specifications of the databases and searches are
given in Appendix B.
Although the uses and sources for documents are different for the two
descriptions, the documents themselves have cross-fertilised the
descriptions. What I have learnt from industrial documents has aided in
understanding the research documents and vice versa.
Physical artefacts
Both the case about a physical artefact in itself and the processes involved in
making bumper beams (both industrially and scientifically) are packed with
physical artefacts. The economic description of the production and
development of bumper beams is strongly connected to the production
technologies used. Casting ovens, extrusion presses, die tools and forming

49
robots all play an important part in creating bumper beams, as well as the
economics connected to them. Many of the same physical artefacts are
important in creating the scientific/environmental bumper beams, albeit
more indirectly than in the industrial case. Other artefacts are instrumental in
producing knowledge about the production technologies, e.g. laboratory
equipment to measure strength or emissions and computers to translate the
physical artefacts into graphs, tables and texts. I too will have to translate all
the artefacts I encounter into text and try to refrain from only using already
established textual accounts of them. Nonetheless, existing texts are
important to make sense of the artefacts role in producing the Economy* and
the Environment*.
Observation
The use of direct observation has not been systematically undertaken in the
study. I have not had free access to any of the study sites, but have on a few
occasions, upon request, been allowed to watch the processes involved in
making physical or scientific bumper beams. The latter is unfortunately
mostly done in a site where research is connected to Hydro. Ideally, it should
have been disconnected from the industrial production of the bumper beams.
Nonetheless, what is more pressing is what I can get out of observations;
how can they be used to describe bumper beams and understand the
Environment* and the Economy* better? It is hard to pinpoint at what time
actors are acting economically or environmentally. This is recognised by
Håkansson and Waluszewski (2002) who write:
"As business and economic researchers, we usually focus on the
economic outcome of an industrial system as a whole, or on how the
economic outcome is distributed between subunits such as companies.
However, as we already have illustrated earlier, there is reason to
question whether a focus on economic considerations really is the most
fruitful way to grasp how an economic outcome is created. Thus, our
empirical interpretation is that company life very often is far from being
purely a matter of economic issues. Considering all the problems that
companies wrestle with daily, it is probably more fair to claim that our
research objects deal primarily with issues related to technical and
social elements. Certainly the activities of any such unit have economic
effects – but these are mainly consequences of expectations and actions
that are manifested in technical and/or social dimensions. Here we have
a first basic assumption: an excessively narrow focus on economic
dimensions alone will limit our understanding of how companies
function and therefore also how their economic outcome is created." (p.
17, Italics in original)
I believe one of the important insights from observations to be an increased
understanding of the tasks the actors perform. It is crucial to be able to

50
impart the atmospheres and the spaces (both physically and mentally) in
which the actors operate. I have to simplify and extract to construct a written
account of what happens, but I should not reduce the complexity the actors
are facing more than they do themselves.
The different sources cannot clearly be separated as documents and
interviews may be needed to make sense of observation and physical
artefacts and vice versa. Just looking at a machine like an extrusion press
(used in making aluminium profiles) and trying to explain how it affects
production is impossible. The way it operates is hidden behind the exterior
shell and it needs to be picked apart, not literally but through documents,
interviews and observation in order to make sense of the production setting.
2.4.2 Organisation of empirical data
During the PhD process, I have learnt that research is about systematics
without rigidity. The only way to ensure a trustworthy study is to keep a
good record of all data that is gathered and how it is translated into
information for the thesis. The record keeping must, however, allow for
restructuring when the material (or the researcher) points to new
combinations of the data.
When the thesis work started, I had too little of both experience and training
in collecting and storing data for a social science study. I had one single
notebook used for internal seminars, interviews, reflections and whatever
else I needed to write down. Interviews were transcribed and stored in an
Access database, while other documents were more randomly distributed in
folders on the computer and piles on the desk. As the focus of the study
became clearer, I gained experience in ordering and read useful tips. The
piles were reshuffled and categorised in ring binders, the folders on the
computer were systematised and two extra notebooks were acquired. One for
writing comments on interviews and reflections on how the interviews and
other material could be used in the thesis, while the other is used from the
"opposite" side, as it contains metaphysical and conceptual reflections on
how to develop the thesis with questions and suggestions (to myself) on
what empirical material that is needed. The folders on the computer were
organised according to a similar logic.
2.4.3 Making the empirical textual
The collection and organisation of empirical data are intertwined with the
process of creating the research text, more specifically this thesis. I have
constantly been concerned with the way to present the empirical material in

51
a text that actually renders the relations between the Environment* and the
Economy* visible. When expressing my concerns to my supervisors, I have
often been told to first write empirical material and then start worrying about
the problems of structuring the text. There is, however, a mutual dependency
between the structure and the substance that makes it into a highly iterative
process. Being faithful to the empirical material requires keeping my eyes
open for findings and directions I had not anticipated. This explorative
nature of the study calls for an approach to the writing and structuring of the
text that is both inductive and deductive in nature. Such an approach can be
found in Peirce's (1934) argument of abduction. Instead of going from rule
(all balls in the urn are red) to case (the sample is taken from the urn) to
result (all balls in the sample are red) as in deduction, or from case (the
sample is taken from the urn) to result (all balls in the sample are red) to rule
(all balls in the urn are red) as in induction, abduction is something in
between. In abduction, one goes from the rule (all balls in the urn are red) to
result (all balls in the sample are red) to case (the sample is taken from the
urn). Dubois and Gadde (2002) have built on Pierce's idea and proposed a
strategy called "systematic combining" for case research. The strategy
involves matching of an analytical framework, the empirical world, the case
and theory.
Having a strategy for the writing is important, but still the cumbersome and
painful effort of writing down all the words and sentences remains. Latour
(2005) stresses the importance of writing; claiming that it is only through
writing that we make social connections traceable. In his words:
"A good ANT account is a narrative or a description or a proposition
where all the actors do something and don't just sit there. Instead of
simply transporting effects without transforming them, each of the
points in the text may become a bifurcation, an event, or the origin of a
new translation. As soon as actors are treated not as intermediaries but
as mediators, they render the movement of the social visible to the
reader. Thus, through many textual inventions, the social may become
again a circulating entity that is no longer composed of the stale
assemblage of what passed earlier as being part of society. A text, in our
definition of social science, is thus a test on how many actors the writer
is able to treat as mediators and how far he or she is able to achieve the
social" (pp. 128-129).
I believe the abductive strategy to be useful also for the ANT description of
the Environment*, as I believe Latour's advice on writing to be useful also
for the IMP description of the Economy*. Hence, these are the tools aiding
me in writing.
In practice, writing a case where all dimensions are changing cannot create
anything but confusion. Some elements in the description need to be fixed in

52
order to capture the dynamics of the other elements. In the description of the
Economy*, this is ensured by creating three pictures of the structure of the
network involved in the development and production of bumpers and
bumper beams at three different points in time: 1970, 1985 and 2006. The
differences between the pictures provide a starting point for revealing the
elements in the activity layer, the resource layer and the actor layer crucial to
produce Economy*. The specific years were chosen due to information
available at an early stage of writing the thesis. 1970 was selected because
bumper production had "settled" at Raufoss that year while major changes
were just down the road. Thus, it provides a ground state for the bumpers
and the adjacent network. 2006 was the year most of the description of the
Economy* was written, hence it was a present state, making it relatively
easy to check numbers and if actors, resources and activities really were
present. Although 1985 is not situated as the exact midpoint between 1970
and 2006, it was picked both for availability of data and for being a year
preceding major changes in the network. Elements are presented in an
almost chronological order, even if some of the material has had to be sorted
according to themes.
There may be too great a reliance on the "big" events. Ford and Håkansson
(2006a) touch upon this problem:
"One way for researchers to deal with "lumpy" interaction is to identify
"significant events" or "critical incidents". This approach clearly
provides historical information, but has similar boundary problems to
those of "episodes". More importantly, the idea of critical incidents also
involves assumptions about the causality of outcomes that are likely to
be unwarranted in a situation of complex, multi-party interaction" (p.
11).
The case covers a period of almost 40 years and I have not found a way to
escape the seemingly causal relationships between what is labelled
'important' from the outset, such as a new machine or an acquisition, and the
resulting Economy*. A study of micro processes involved, with all the minor
changes and adjustments involved in the major changes, could give a better
actual picture of the creation of Economy*. It is, however, deemed
unfeasible for this study both in terms of its aim and its scope. The main
focus is to present those elements that have been instrumental in confining
the Economy* during the time span presented.
Another point taken up by Ford and Håkansson (2006a) is related to where
the story begins:

53
"One important consequence of the importance of time in interaction is
that it is difficult to suggest that there can be such a thing as a new
network. If we observe a network for the first time, then what we are
actually doing is isolating part of a pre-existing and wider
network...Each actor brings its own baggage from the past. This
phenomenon is familiar from technological studies where path-
dependence has been identified as a key issue, but here that path
dependence is within a wider context. Path dependence means that
researchers need always to look behind current patterns of interaction to
what has preceded them and framed their evolution" (p. 10).
As a consequence, information about the companies and their evolving
relationship prior to the "true" beginning of the case is provided.
In the description of the Environment*, the fixed portion of the case lies in
the theory guiding the empirical study and the choice of a starting point. As
we learnt in the description of ANT, every actor presented in the study must
have connections to other actors. By choosing a specific article to be the
'source' from which to capture the Environment*, no actor should be present
in the description that is not connected to this article. The article itself is
chosen for its explicit connecting of bumper beams at Raufoss to
environmental issues. Following from the nesting process that starts from
one specific article, the description of the Environment* is presented in an
almost opposite chronological order.
The most important point for the description of the Environment* is to
display the elements decisive for its constitution between 1970 and 2006.
Hence, the elements of the Economy* and of the Environment* can be
compared in the later chapters to see if connections exist. In order to make
the comparison easier, both the chapters on the Economy* and on the
Environment* end with a timeline showing the changes of elements. The
timelines also make it possible to investigate whether an element has been
transferred from the Economy* to the Environment* or vice versa. To ensure
symmetry between the two descriptions, the summary of the description of
the Environment* includes pictures of the structure of the scientific network
from 1970, 1985 and 2006.
The organisation of the material and the choice of what empirical material to
include and what to leave out is critical to how the thesis is understood. Still,
the only test of whether the right choices are made is whether the reader
deems the text valid.
I have strived to create a text that is accessible to people without detailed
knowledge of either industrial production or scientific production of
bumpers. The writing styles in the sections on the Economy* and the

54
Environment* are deliberately made different to reflect both the differences
in the theories utilised to produce the chapters and the actual differences
between the two production systems. One of the consequences has been that
the chapter describing the Environment* contains some rather long citations.
This is to show how the elements (i.e. the actors) in the Environment* are
described in the words of the researchers.12
At the same time, readability has
been a crucial issue. Still, the text is a PhD thesis and must be academic, that
is, in accordance with operating procedures within academia. This means
that parts of the text may be inaccessible for readers without a relationship to
scientific language.
2.5 Explanation, validity and transferability
Whereas the description is seen as the explanation in actor-network theory,
the normal way of writing a thesis within the industrial network approach is
to write a "pure" empirical case followed by an analysis. Still, the latter's
inclusion of an analysis seems more like a pragmatic approach to make the
writings "edible" for other scientists within economics. The view of science
by the two approaches will have consequences for how explanations are
made and how validity can be ensured, or if in fact such terms are useful to
discuss the "scientific-ness" of the text.13
2.5.1 Scientific explanation
The question of what an explanation really is is one of the more troublesome
within science and one of the reasons for scientific controversies. Latour
(2005) makes an effort to calm down those of us who believes in thick
descriptions and who are constantly afraid that our pretence to science will
be discovered:
"…We worry that by sticking to description there may be something
missing, since we have not 'added to it' something else that is often
12
It can be recognised that this chapter also contains some rather long citations.
Again, this is a deliberate move in order for me to show the original sources as well
as my translations of them (in the ANT sense of the word). 13
However, deep down inside of me, there is a positivist residing. He wants clear
answers, preferably quantified and even better if presented with an error margin. He
tells me that the research presented in this thesis is unscientific. It lacks the validity,
the accountability and the operationality that designates decent science. At times he
has had the upper hand and created a feeling of uncertainty about the value of this
contribution. He has shouted that I should instead focus on a statistical model if I
really want to go into this “social science mud” at all. Although at times he has
halted the process, I think I have managed to convince him that something useful
can come out of the approach employed in the thesis.

55
called an 'explanation'. And yet the opposition between description and
explanation is another of these false dichotomies that should be put to
rest – especially when it is 'social explanations' that are to be wheeled
out of their retirement home. Either the networks that make possible a
state of affairs are fully deployed – and then adding an explanation will
be superfluous – or we 'add an explanation' stating that some other actor
or factor should be taken into account, so that it is the description that
should be extended one step further. If a description remains in need of
an explanation, it means that it is a bad description" (p. 137).
Although comforting, it also means that every researcher involved in the
game of description needs to take descriptions seriously and abstain from
jumping to some grand theoretical reservoir to find the "true" explanations.
Care must be taken to make the description into an explanation in itself.
"Actor-networks do connect and by connecting with one another
provides an explanation of themselves, the only one there is for ANT.
What is an explanation? The attachment of a set of practices that control
or interfere on another. No explanation is stronger or more powerful
than providing connections among unrelated elements, or showing how
one element holds many others. This is not a property that is distinct
from networks but one of their essential properties (Latour 1988b).
They become more or less explainable as they go and depending on
what they do to one another. Actors are cleaning up their own mess, so
to speak. Once you grant them everything, they also give you back the
explanatory powers you have abandoned. The very divide between
description and explanation, hows and whys, blind empiricism and high
theorizing is as meaningless for ANT as the difference between
gravitation and space in relativity theory…By tying the explanation to
the network itself, ANT does not abandon the goal of science since it
shows that this goal has never been achieved, at least through the
epistemological myth of explanation. ANT cannot deprive itself of a
resource it shows how no one had ever had in the first place.
Explanation is ex-plicated, that is unfolded, like gravity in Einstein's
curved space, it is still there as an effect but it is now indistinguishable
from the description, the deployment of the net" (Latour 1997), pp. 375-
376.
I have nevertheless chosen to include an analytical chapter after the
empirical part, a chapter where the empirical material from both descriptions
is compared. However, this part is not about explaining the findings in the
case from some theoretical reservoir. Instead I propose some local
generalisations - in other words, concepts that can travel. This is similar to
the distinction between substantive and formal theories when following
Glaser and Strauss' (1967) notation. Substantive theory is developed for an
empirical area, while formal theory is concerned with conceptual areas.
Formal theories can be used to "discover substantive theory relevant to a

56
given substantive area, ...[while] substantive theory in turn help to generate
new grounded formal theories and to reformulate previously established
ones." (p. 34). Formal theory is thus on a higher level of generality and is
produced by developing concepts and theoretical constructs that are able to
'travel' (Andersen 2004), i.e. concepts and constructs applicable to a specific
situation are transferable to other situations. This should not be confused
with a ranking where the ultimate goal is to find universal laws.
"Generalisations are normally only valid for given classes of phenomena
under given assumptions, they are concepts and theories 'of the middle range'
(Merton 1967). It is a main goal for the social sciences to identify such
common features that bind together and give regularities across unique
variations." (Andersen 2003:10-11). Even if I find it troublesome to speak of
generalisations, I do believe we can find local truths, that is, propositions
that hold within defined areas.
2.5.2 Validating findings – relying on others
In their frequently quoted book, Brinberg and McGrath (1985) lay out a
framework for investigating validity issues. They distinguish between three
different domains in research, denoted as the substantial (the empirical
world), the conceptual (the theories) and the methodological (the methods).
Researchers have different interests and will focus more on one domain than
the others. Brinberg and McGrath's point is that this has consequences for
validity. The combination of different elements from the three domains
restricts what can be found. In earlier versions of their Validity Network
Schema (McGrath & Brinberg 1983), they identify a wide range of validity
measures. They do, however, abandon this in their book and instead focus on
the scope and limit of empirical findings related to the three domains. This
framework could have been useful for discussing the validity of the thesis.
However, validity is best ensured by following the study guidelines as laid
out in this chapter and transferring them into the text, while also taking into
account that validity is as relational as the rest of the world. Without an
interest from the reader, the descriptions will never be looked upon as valid.
Håkansson and Waluszewski (2002) formulate this excellently:
"The five conditions [for approaching business processes] can be
regarded both as basic assumptions and as main results of our study.
Even if the work did not start out with an explicit formulation of these
assumptions, during the process it has become more and more obvious
how these underlying ideas have coloured our way of approaching the
empirical world. This means that our picture of how development takes
place in an industrial setting has become more precise and detailed –
but also, that this understanding is clearly based on our research
concepts. If we had used other concepts we would certainly have

57
reached another picture. Thus, how valuable our picture is for others –
regardless of whether researchers or companies – depends on the
familiarity with or interest in using this or similar approaches. Again the
researcher is facing the same situation as a company struggling with
technological development – namely, the value of a certain solution
depends on the extent to which others can relate to it" (pp. 18-19).
The message from this citation is also in perfect harmony with ANT's view
on science as relying on the spread to others and is a perfect conclusion to
end the discussion of everything underlying the rest of the thesis. Now it's
time to get down to business.

58
3. Industrial production of bumpers and bumper
beams: creating the Economy*
I want to investigate the aluminium bumper as an industrial product involved
in order to answer the following questions 1) What is the economic status of
the bumpers? And 2) How has such an economic status come into being?
The answers to these questions will provide a picture of what the Economy*
is and how it has changed over the last few decades. In other words, the
answer will consist of the elements that the Economy* consists of and how
these elements have appeared, changed, disappeared or remained.
The bumpers and bumper beams that appear in this thesis are part of a
relationship between Volvo and Hydro, a relationship that has lasted almost
half a century. Well, that is not completely true, as Hydro was not the name
of the company that was the original participant in the relationship. The
relationship was first established between Volvo and the Norwegian
company Raufoss Ammunisjonsfabrikker, a manufacturer of military
equipment. However, as will be made clear in the chapters that follow, the
first product to be involved in the relationship was not a bumper beam and,
furthermore, the production processes have changed over the years.
First, a short presentation of the history of the involved companies is
presented. This is followed by pictures of the production network structures
in 1970 and 1985, including the important actors, resources and activities.
These pictures are contrasted to create a foundation for describing the
elements that were instrumental in the period between 1970 and 1985. Then
a picture of the network structure in 2006 is displayed and contrasted with
the picture from 1985. Again, important elements that have contributed to
changes in the actors, resources and activities are described. Thereafter, the
elements that have stayed the same throughout the entire period are
presented.
The chapter is concluded with a summary of the findings, a timeline
outlining some of the changes in activities, resources and actors and a
comparison of the economy displayed in this chapter compared to the
caricature of the economy presented in the introductory chapter.

59
3.1 Setting the stage: a presentation of the story behind the
relationship and the bumpers
The following short introduction to the "economy" part of the case is
provided in order to outline some of the elements that were present prior to
and at the start of aluminium bumper production at Raufoss. This includes
brief details of the companies concerned and how they were involved with
each other up until 1970.
From Rødfos Patronfabrik to Raufoss Automotive14
During the last period of the19th century and the beginning of the 20
th
century, much was happening in the Norwegian political sphere. Having
been part of a union with Denmark from 1348 to 1814, many parties were
struggling for national independence when Norway was "given" to Sweden.
Even though reigned by another nation, a national constitution for Norway
was written and signed on 17 May 181415
and a Parliamentary system was
introduced in 1884. Although Norway was given freedom to implement such
political measures, tension began to build up between Norway and Sweden
towards the end of the 19th century and, as Norway had no separate military
force, there was a concern that Sweden would use force to try to keep
Norway in check. It was against this backdrop that a decision was made to
set up an ammunition factory (called Rødfos Patronfabrik) at Raufoss. The
location was chosen for its strategic location, which was hard to access for
foreign military troops with Lake Mjøsa on one side and extensive grassland
on the other. The site chosen did in fact have a few industrial buildings,
including a matchstick factory that used the River Hunnelva (that runs
through Raufoss) to produce energy for its production. Fortunately, the
tension between the two parties never led to an open conflict and instead
Norway gained its independence in 1905 – nonetheless, Rødfos Patronfabrik
continued the production of ammunition after this date.
In 1917, recognising that World War I would eventually come to an end, the
then manager Halvdan Bødtker-Næss began to consider the options for the
factory once ammunition production reduced. Based on this initiative, a
commission was formed on 22 November 1918, designed to investigate to
what extent and in what areas civil production at Raufoss should take place.
One of the options was to make roll bearings and the commission started
negotiations with the Swedish roll bearing company Svenska
Kullagerfabriken (SKF). A deal was agreed whereby SKF committed itself
to purchase 500 roll bearings per day from the production site at Raufoss. In
14
Most of the early industrial history at Raufoss is taken from Wang (1996). 15
Although it was uncertain whether it was this document or the version signed on 4
November that was the actual one (Brekke 2005).

60
addition, a manager and ten experts from SKF were placed at Raufoss'
disposal in the start-up phase. However, it subsequently became clear that
the financial deal clearly benefited SKF most as, although production started
on 1 July 1921 and increased from 71,415 roll bearings in 1923 to 199,000
roll bearings in 1925, the factory made a loss. As a result, although the initial
contract period was set to end on 30 June 1926, it was cancelled in 1925.
In parallel, Raufoss Ammunisjonsfabrikker (RA) (as the company was called
from 1924) tried to make their own assortment of roll bearings,
independently of SKF, but only small batches were sold and when SKF
lowered the prices on the Norwegian market by 70%, RA soon ran into
financial trouble. As a result, the Norwegian government decided to stop
production of roll bearings, providing 1.25 million Norwegian kroner to
cover the loss in 1929. Overall, the roll bearing adventure almost put an end
to industry at Raufoss and, indeed, the whole period between WWI and
WWII was extremely difficult financially. However, during this period,
many production choices were made that have contributed to the future
direction – for example, the toolmakers were gathered in one tool
department in 1929 and casting of aluminium alloys started with low
volumes in 1935.16
Volvo and car production17
The first Volvo car rolled out of the Hisingen factory in Gothenburg on 14
April 1927. This date is recognised as the company's birthday, although
work on the car had started earlier with 10 test models having already been
built at the Galco factory in Stockholm the previous year. Assar Gabrielsson
and Gustaf Larson, the founders of Volvo, had both worked at SKF from
1917-1920, when Gustaf Larson left to work as a technical manager at
Galco. Gabrielsson, who worked as the sales manager at SKF, was an
economist with good connections in the banking industry and was aware of
how Swedish-made roll bearings could compete on an international market.18
Larson was the engineer, with excellent knowledge of the automotive
industry.
16
As an aside, it should be mentioned that two cars, or rather motorised sledges,
with an all-aluminium body were produced at Raufoss in 1924, developed by the
engineer H. Chr. Bjerring. They were actually some of the first cars ever produced
with an aluminium frame. The test models showed great characteristics on
Norwegian roads, but as Bjerring‟s company Autoslede A/S went bankrupt, the
production was put on a hold. 17
The information in this section is mostly found in Lindh (1990) and Olsson &
Moberger (1995) 18
SKF is the very same company for which Raufoss was producing roll bearings in
the 1920s

61
On 19 August 1926, Gabrielsson and Larson met with managers from SKF
and, as a result, AB Volvo was established with Gabrielsson as the
manager.19
SKF granted the new company a loan of 2 million SEK to start
production of a series of 1000 cars, 500 as convertibles (ÖV4) and 500 with
a complete body (PV4). They planned to produce and sell these during 1927,
with 400 cars earmarked for export. It was then planned that production
would increase to 4000 cars in 1928 and 8000 in 1929. The sales of
passenger cars were, however, lower than expected and Volvo made a loss
until November 1929, at which point they began to make a profit. This
improvement in the company's financial position from 1929 onwards was
mostly due to the profits from a series of lorries that they started to produce
in 1928. In fact, the production of ÖV4 and PV4 never extended beyond
1000 vehicles, although it came close with a total of 996 over the period
1927-1929. In the context of this thesis, it should be noted that a "special"
version of PV4 was released in 1928 and this version had bumpers as
standard equipment both in the front and the rear. After five years of
continuous profit, Volvo shares were launched on the Stockholm stock
exchange in 1935.
A sales handbook was given to every Volvo sales outlet in Sweden in 1936.
The authors were anonymous, but it is generally considered that the
handbook was written by Assar Gabrielsson, except for a technical chapter
probably written by Gustaf Larson. The technical chapter starts with the
paragraph:
"An automobile transports, and is driven by, people. Thus, the basic
principle for all construction work is and must be: safety." (Volvo 1936,
my translation)
This citation was largely employed when constructing safety as a core value
in the Volvo organisation and it is still to be found on the Swedish Volvo's
homepage, clearly demonstrating how dedicated Volvo has been to safety
since its early days.20
1949 was the first year (since 1927) when more cars than lorries were
produced, even though a few more years passed before the profit from
passenger cars exceeded the profit from lorries. One of the trickier sales
arguments was the "PV warranty" issued in 1954. The warranty, which was
included in the sales price, meant that every buyer of a PV 444 would be
compensated for all damage on the car exceeding 200 SEK for a five-year
19
The name Volvo was a registered trademark as early as 1915. It is the Latin word
for “I roll” and was initially used for a new series of roll bearings. 20
http://www.volvocars.se
62
period. Unsurprisingly, Swedish insurance companies reacted poorly and
issued a formal complaint against Assar Gabrielsson, who was accused of
breaking the insurance law and for conducting an insurance business without
a permit. The complaint made it all the way to the Supreme Court where the
"PV warranty" was finally declared legal in 1958. Advertisements were
being published where Volvo owners smilingly told their stories about how
they had wrecked their cars and later picked up a new one for only 200
Swedish Kronor. When the first warranties expired in 1959, Volvo was
granted a permit to set up an insurance company (Volvia) where Volvo
owners could sign up to continue their warranty (Olsson & Moberger 1995).
During most of the first 30 years of the company's life, most of Volvo's
exports were made to countries that had no car production; however, in
1955, the first attempts at entering the US market were undertaken and they
gradually managed to develop a market during the late 1950s. Initially,
selling Volvos in the US automobile market was likened to "selling
refrigerators to Eskimos",21
but by 1962 the US had become Volvo's second
largest market (after its home market) and Volvo ranked as number four on
the list of cars imported into the US.
Growing sales inside and outside Sweden resulted in the need for both more
production capacity and also a desire to get closer to the company's
customers. As a result, the Torslanda factory was opened in 1964 (enabling
Volvo to move out of the old locality of Hisingen), and a factory was opened
in Ghent, Belgium in 1965. Together, these plants helped to ensure that
Volvo had the capacity to meet future changes in demand.
The (first) Volvo deal
After the Second World War, the Norwegian Storting passed a law in 1947
with important changes in the regulations regarding the military industry in
Norway. This resulted in the transfer of military companies from state
control into autonomous industrial companies with state ownership. At the
same time, sales figures had increased steadily at Raufoss at the end of the
1940s and in the early 1950s, mainly due to the continued production of
defence products that were largely connected to the NATO agreement.
However, in early 1955 a committee was formed to investigate production
and sales possibilities because of an expected decrease in ammunition
production. The committee submitted a report in November of the same
year, proposing that RA should visit Volvo and other Swedish industrial
companies to further investigate the possibilities of manufacturing
21
The Volvo club: http://www.volvoclub.org.uk/history/history_50s.shtml

63
components for them. It was also suggested that RA should focus on the
production of aluminium profiles in a newly acquired extrusion press. In this
respect, the committee recommended producing the necessary die tools and
investing in a smelting oven and a casting machine. During the period the
committee was doing its work, Volvo approached Mekaniske Verksteders
Landsforbund (MVL), a Norwegian organisation for mechanical workshops,
to search for Norwegian suppliers. In MVL's response, it suggested that
Raufoss was a potential sub-contractor for car components. As a result,
Volvo got in direct contact with RA, who showed great interest – but it
transpired that RA was unable to compete on prices, partly due to the cost of
import tariffs imposed by Sweden.
During 1956 and the start of 1957, negotiations were underway between the
national governments of Norway and Sweden, Volvo and the defence
industry in Norway (including RA and Kongsberg Våpenfabrikk (KV)).
Nilsson (1998) concludes that it was the import restrictions on foreign cars
to Norway that made the deal interesting. Under the regulations existing in
1956, countries within Europe could export 4000 cars to Norway and people
in Norway had to apply for a permit to get a car. In addition to this European
quota system, it was possible to get cars from Eastern Europe through
bilateral agreements. As part of this process, Volvo managed to negotiate a
quota of 3000 cars in 1957, despite resistance from both the Financial and
Foreign Ministry in Norway. Other car-producing nations, particularly the
UK, protested against the benefits given to Volvo. However, whilst they
wanted higher quotas, none of the British car producers wanted to make an
offset agreement that resulted in the sourcing of components with
Norwegian companies. When the total Norwegian import quota was also
raised, the criticism of the Volvo deal became less and less visible. The
restrictions on imports were removed in 1960, but the deal to use Norwegian
car components had been clearly implemented as evidenced by a press
release from Volvo on 26 November 1956 that stated:
"the Volvo deal is a long-term cooperation contract. It will not end
because the Norwegian car import restrictions are repealed. The
cooperation will go on." (Volvo 1956, my translation)
The production of components for Volvo had actually started in 1957, but it
initially only consisted of a few components made from brass and steel, and
RA delivered only small volumes to Volvo throughout the 1950s and the
beginning of the 1960s. However, Bjarne Hurlen, former CEO of Kongsberg
Våpenfabrikk (KV), was appointed as the CEO of both KV and RA in
February 1961. He had been instrumental in negotiating the original Volvo
deal and followed Volvo's expansion and internationalisation closely in the
1960s, becoming friends with Volvo's CEO Gunnar Engellau.

64
The beginning of bumper production
RA acquired a new 1250-ton extrusion press in 1962 to strengthen its ability
to provide components for the building industry. In this respect, the company
was supported by Årdal og Sunndal Verk (ÅSV) which was, at the time, a
large Norwegian aluminium producer and responsible for delivering
extrusion billets in aluminium (i.e. aluminium alloys with the right
geometrical shape, in this case cylinders) for subsequent extrusion.
The focus on extrusion of aluminium had an impact on the relationship
between Volvo and RA in the mid-1960s and this resulted in the signature on
15 July 1965 of a contract for delivery of 500,000 aluminium bumpers. The
bumpers were to be produced over a period of five years starting from 1967.
Volvo had previously developed the bumpers in cooperation with Svenska
Metalverken (later called Gränges) and Volvo was one of the first companies
to use aluminium bumpers, with the decision to go for a new material being
largely connected to the aims of the designers at Volvo.22
The first bumpers left Raufoss late in 1966, but as the production factory
was not completely finished, the first batch had to be taken to the burnishing
equipment manufacturer in Germany. This was actually achieved by one of
the production engineers, Ola Ivar Moen, loading the semi-finished bumpers
into a VW Beetle and driving them to Neu Isenburg in Germany. There, the
bumpers were burnished before the batch was to taken to Moss (in Norway)
for anodising before it could head at last for its final destination, Torslanda,
Volvo's assembly factory outside Gothenburg (Beck et al 2006).
However, this was a significant moment as, firstly, the completion of the
first batch of bumpers marked the end of an almost two-year long hectic
period since the contract had been signed in 1965. Production equipment had
been ordered and installed, and an organisation was put in place to handle
the new business area. Secondly, it marked a shift in the relationship
between Raufoss Ammunition (RA) and Volvo. RA had become a supplier
to the car manufacturer in 1957 after intense negotiations involving not only
the companies, but also the governments in several nation states, including
Norway, Sweden, and the UK. Thirdly, it can be viewed in retrospect as the
start of a new era at Raufoss. The late 1950s and the beginning of the 1960s
had seen only small production volumes, but the contract for bumpers made
RA into a serious supplier to the automotive industry.
In 1968, the status of RA changed again to that of a state-owned limited
company with a share capital of NOK 60 million. The idea had been to
22
Interview with Gunnar Falck.

65
organise RA in a way similar to that of a private company and, as a result, to
give the board both greater freedom and also greater responsibility. In the
same year, RA, together with Årdal og Sunndal Verk and A.s. Nordisk
Aluminiumsindustri, established a common company called I/S
Aluminiumsprofiler. The company focused on extruded profiles and research
in this area. As a result, the company's board soon decided to acquire a new
2,000-ton extrusion press for Raufoss, as the extruded profiles for the
building industry were experiencing increasing demand and there were high
hopes for increased bumper production.
3.1.1 Summary: conditions for aluminium bumpers in the
relationship between Volvo and RA
The production of aluminium bumpers in 1970 was facilitated and made
possible through a series of more or less conscious decisions by the two
companies Volvo and RA, including the latter's decision to go for production
of aluminium extrusions and Volvo's decision to use aluminium bumpers.
These decisions, together with a number of others, led to the development of
actors, resources and activities. The most important actors still present in
1970 were Volvo, RA and ÅSV. A few other actors, such as SKF and the
Norwegian government had been instrumental in the earlier history of the
companies, but were not as visible in 1970. The companies performed
activities such as developing bumpers, producing ingots, forming bumpers,
anodising bumpers, negotiating contracts and creating strategies. To perform
these activities, they employed existing resources such as competence and
business relationships, facilities like ÅSV's cast house at Sunndalsøra, RA's
extrusion presses at Raufoss and Volvo's assembly line at Torslanda, and
products like ingots, aluminium bumpers and finished cars.
Some actors, resources and activities were only present during the
establishment of the relationship between Volvo and RA, such as MVL,
Norwegian import quotas and negotiations involving governments. Their
presence was no longer visible in 1970. Other actors, resources and activities
were present, but their presence was not part of the everyday life of the
companies. Still, the importance of some of them will rise to the surface as
time passes, for instance the state ownership of RA, Volvo's export of cars to
the US and Volvo's focus on safety.
Now it's time to look closer at the specifics of the development and
production of bumpers, starting with a description of how production was
undertaken in 1970.
66
3.2 From 1970 to 1985
The following section will try to explain how the Economy* has been
produced as an effect of the production of bumpers (later: bumper beams) in
the relationship between Volvo and RA/Hydro.23
The section starts with
descriptions and pictures of the production network in 1970 and 1985.
Thereafter, these are contrasted and elements that were altered (i.e. inserted,
removed or changed) in the network are presented.
3.2.1 Production of bumpers in 1970 24
Volvo had four car models in production in 1970, namely: the Volvo 122
(known as the Amazon in the Nordic countries), the Volvo 140, the Volvo
164 and the sports car Volvo 1800. The 140 series and the 164 were the only
ones with aluminium bumpers and the only vehicles for which RA supplied
front and rear bumpers. Svenska Metallverken and Volvo had developed the
bumper as a cooperative venture from 1963 until the start of production in
early 1967 and RA was producing the parts in accordance with the
specification contained in the resultant drawings.25
The front bumper for the Volvo 140 series weighed 2.8 kg and, in 1967, had
a price of NOK 43.00, but by 1970 this had risen to NOK 55.00 (which
corresponds to NOK 361.65 in 2006), although this price reflected the
outcome of annual meetings between Volvo and RA at which price increases
were negotiated.
The aluminium alloy billets (i.e. round cylinders of the specified alloy) were
delivered to RA by ÅSV in Sunndal at a cost of NOK 4.00 per kg, which
included the price of ingot and a premium for smelting and alloying. I/S
Aluminiumsprofiler (Alprofil), the company owned jointly by RA and ÅSV,
performed alloy extrusion at Raufoss. The extruded profiles were sold at cost
to the car part production division of RA. After a hardening process, the
extruded profiles were bent to shape through roll forming and stretch
bending. The process was cumbersome and required intimate knowledge of
the machine and the materials. The roll formers from Redman Tools Ltd.
23
Bumper beams are the metal rail behind the plastic bumpers in today‟s cars. The
shift of the name and position (and status?) of bumpers will be treated in a later
section in this chapter. 24
The information in this section is based on interviews with Ola Ivar Moen, Thor
Wang and Åge Larsstuen, plus the following literature: (Bakke 1970; Beck et al
2006; RA 1971; Wang 1996). 25
Gränges (now Sapa), acquired Svenska Metallverken in 1969. Interview with
Gunnar Falck.

67
were originally built for steel profiles and the operations were different when
used to shape aluminium. Bumpers were then cut and graded before being
polished mechanically and finally anodised electrochemically to achieve the
look of stainless steel. Throughout production, the bumpers were manually
transported between the different workstations. The total cost of the
processes involved was approximately NOK 37.00 per bumper, leading to a
cost of production per bumper of NOK 48.00 (compared to the sale price of
NOK 55.00).
The RA division that was responsible for producing car parts had Volvo as
its only customer and a turnover of NOK 19.5 million in 1970, which
contributed to about 5% of RA's total turnover. The rest of RA's turnover
was mainly based on defence products, together with a small portion from
the production of extruded profiles for building applications.
Meanwhile, RA and ÅSV were working intensively on researching and
developing new alloys for bumpers. Volvo had a huge success with the 140
series, and Gränges (the successor of Svenska Metalverken) and RA did not
have sufficient capacity to meet the demand. However, although there was
fierce competition for the additional capacity, RA was chosen and invested
NOK 4 million in a new production line, which was finished in Autumn
1970.
The bumpers produced by RA were packed in closed pallets with protective
insulation between each bumper and sent to Torslanda by train. Volvo paid
for the transport. At Torslanda, rubber strips produced by Forsheda
Gummifabrikk and Mjøndalen Gummivarefabrikk were fastened to the
bumpers and they were then manually mounted on the cars with eight
screws.
The sales price in Norway in 1970 for the cheapest car in the Volvo 140
series (Volvo 142 with four cylinders and two doors) was NOK 32,680,
rising to NOK 46,300 for the Volvo 164 with six cylinders and four doors.
The cost of the bumper for Volvo was therefore somewhere in the range
between 0.12 and 0.17 percent of the sales price in Norway. Figure 3-1
shows an overview of the actors, resources and activities involved in bumper
production in 1970.

68
Figure 3-1 Activities, resources and actors involved in producing bumpers for Volvo
from Raufoss in 1970
The above diagram is somewhat complex because of the organisational
structure, with RA and ÅSV sharing ownership in the company Alprofil, but
apart from this, the system for production was linear in approach and was as
shown above.
There are of course other actors (having additional resources and performing
additional activities) involved (for instance) in supplying components for
machinery. Changes in the network surrounding the companies directly
involved in producing the focal resource will most likely be captured when
the picture of the network from 1970 is compared to more recent ones (i.e.
1985 and 2006). If the changes are not captured, they are probably not
important for the production of the Economy*.
Now let us jump to 1985 and see what production looked like at that point in
time. This will give us a picture of the production network that can be
compared to that from 1970 and form a basis for describing the change of
elements (and thus the Economy*) during the time span from 1970 to 1985.
Al billet
Car
Other
components
Volvo
Extruded
Profile
RA car part divison
ÅSV
BumperSaw and
Grading
Polish
machine
Governments
Anodising
equipment
Alprofil
Extrusion
press
Extrusion
tools
RA
Laws and
Regulations
+
Actor
Activi ty
Resource
Roll
former
Al billet
Car
Other
components
Volvo
Extruded
Profile
RA car part divison
ÅSV
BumperSaw and
Grading
Polish
machine
Governments
Anodising
equipment
Alprofil
Extrusion
press
Extrusion
tools
RA
Laws and
Regulations
+
Actor
Activi ty
Resource+
Actor
Activi ty
Resource
Roll
former

69
3.2.2 Production of bumpers in 198526
In 1985, Volvo produced four series of car models: the Volvo 340, the Volvo
360, the Volvo 200 and the Volvo 700. The first two (340 and 360) were
small family cars produced at the Volvo factory in Holland that they had
acquired in 197327
. RA has never supplied bumpers for Volvo's series of
small cars, but they were the sole supplier for the Volvo 760.
RA delivered bumpers for the Volvo 700 and 200 series. The 700-series
bumpers were solid profiles covered by a painted plastic cap. The bumpers
for the 200 series were aluminium beams covered by an unpainted cap,
except for those still being produced for the 1975 edition of Volvo 240
which were still aluminium bumpers with a rubber strip. RA had been given
increased development responsibility by Volvo a few years earlier, but the
latter still undertook most of the specifications.
The price of the bumpers was NOK 175.00 for the newest Volvo 200
bumpers (those with aluminium and plastic, weighing 7.2 kg) and NOK
258.00 for the Volvo 700 bumpers (with aluminium and painted plastic,
weighing 7.7 kg).
Using either new material or the output from an internal recycling smelter
owned by ÅSV and RA in the joint company ALPROFIL, Årdal og Sunndal
Verk (ÅSV) supplied aluminium alloy billets to the extrusion plant. The
smelter at Raufoss had a larger capacity than just internal recycling and ÅSV
also supplied primary aluminium to the smelter. The extrusion plant was also
organised under ALPROFIL and delivered extruded profiles to RA's forming
lines at cost. The cost of the aluminium (including operations) was
approximately NOK 100.00 for both the bumpers, with material costs
representing 50% of this.
Production of plastic caps took place at the same time as production of the
aluminium beams. Statoil supplied the plastic material that was formed into
plastic caps in large (1300-ton) injection moulding equipment. The cost of
the plastic caps, including the production operations, was approximately
NOK 40.00 for both bumpers.
After 1982, the plastic caps for the Volvo 700 series were painted at Raufoss
in an automatic paint machine. The cost for painting was NOK 100.00 per
26
The information in this section is based on interviews with Åge Larsstuen,
Kolstein Asbøll, Thor Wang, and Per Harald Sørlien, plus the following literature:
(Elnæs 2005; RA 1986) 27
The car manufacturer previously known as DAF

70
bumper. The final step was assembling the aluminium bumper and the
plastic caps, costing NOK 10.00 per bumper.
The car parts division had a turnover of NOK 305.9 million and contributed
approximately 21% to RA's total turnover, approximately 55% of the car
part division's turnover originated from deliveries to Volvo.
The final bumper systems, including assembled aluminium bumpers and
plastic caps, were transported to Torslanda by trucks from Toten
Transportsentral A/L. Volvo paid for the transport, which was a delicate
matter especially for the painted plastic caps. At Torslanda, the bumpers
were mounted onto the assembled car.
The sales prices of the cars in Norway were from NOK 137,000 for the
Volvo 240 and from NOK 186,400 for the Volvo 740. The cost of the
bumpers for Volvo were thus between 0.13 and 0.14 percent of the sales
price in Norway. Figure 3-2 shows an overview of the actors, resources and
activities involved in bumper production in 1985.
Figure 3-2 Activities, resources, and actors involved in producing bumpers for
Volvo from Raufoss in 1985

71
Figure 3-2 shows RA having the responsibility for assembling bumper
systems (consisting of aluminium bumpers and painted plastic caps) for
Volvo. The material inputs to RA are provided by ÅSV (aluminium) and
Statoil (plastic). The diagram only displays actors, resources and activities
involved in the daily production of bumpers in 1985, not all actors, resources
and activities involved in development activities or providing machinery for
production activities.
3.2.3 Changes in the production of bumpers from 1970 to 1985
The short descriptions of the development and production of bumpers in the
relationship between RA and Volvo in 1970 and 1985 and the diagrams
displaying important activities, resources and actors from the same years are
used to highlight changes in the production structure. When comparing the
arrangement from 1985 (shown in Figure 3-2) with that from 1970 (shown in
Figure 3-1) as presented in Figure 3-3, it can be seen that the overall process
is similar with the exception of the plastic forming line, which represents a
significant new feature in 1985.
Figure 3-3 Comparison of the bumper production networks in 1970 and 1985.
Upon first glance, Figure 3-3 indicates that more resources and activities are
placed inside the box delimiting the actor RA and one more actor (Statoil) is
added. However, although the diagram quickly exposes any major
differences in the composition of the production network between 1970 and
1985, it does not provide easy access to the actual changes in the three
layers. Table 3-1 is included to unmask these changes. It shows an overview
Al billet
Car
Other
components
Volvo
Extruded Profile
RA car part divison
ÅSV
BumpersystemPlastic
pressPaint
machine
GovernmentsAlprofil
Extrusionpress
Extrusion tools
RA
Laws andRegulations
Actor
Activity
Resource
Formingline
Aluminumbumper
Al billet
Formingtools
PaintedPlastic
cap
PlasticPress
tools
PP
Statoil
1970 1985
+
Al billet
Car
Other
components
Volvo
Extruded
Profile
RA car part divison
ÅSV
BumperSaw and
Grading
Polish
mach ine
Governments
Anodising
equipment
Alprofil
Extrusion
press
Extrusion
tools
RA
Laws and
Regulations
+
Actor
Activi ty
Resource
Roll
former
Al billet
Car
Other
components
Volvo
Extruded
Profile
RA car part divison
ÅSV
BumperSaw and
Grading
Polish
mach ine
Governments
Anodising
equipment
Alprofil
Extrusion
press
Extrusion
tools
RA
Laws and
Regulations
+
Actor
Activi ty
Resource+
Actor
Activi ty
Resource
Roll
former
Al billet
Car
Other
components
Volvo
Extruded Profile
RA car part divison
ÅSV
BumpersystemPlastic
pressPaint
machine
GovernmentsAlprofil
Extrusionpress
Extrusion tools
RA
Laws andRegulations
Actor
Activity
Resource
Formingline
Aluminumbumper
Al billet
Formingtools
PaintedPlastic
cap
PlasticPress
tools
PP
Statoil
Al billet
Car
Other
components
Volvo
Extruded Profile
RA car part divison
ÅSV
BumpersystemPlastic
pressPaint
machine
GovernmentsAlprofil
Extrusionpress
Extrusion tools
RA
Laws andRegulations
Actor
Activity
Resource
Formingline
Aluminumbumper
Al billet
Formingtools
PaintedPlastic
cap
PlasticPress
tools
Al billet
Car
Other
components
Volvo
Extruded Profile
RA car part divison
ÅSV
BumpersystemPlastic
pressPaint
machine
GovernmentsAlprofil
Extrusionpress
Extrusion tools
RA
Laws andRegulations
Actor
Activity
Resource
Actor
Activity
Resource
Formingline
Aluminumbumper
Al billet
Formingtools
PaintedPlastic
cap
PlasticPress
tools
PP
Statoil
1970 1985
+
Al billet
Car
Other
components
Volvo
Extruded
Profile
RA car part divison
ÅSV
BumperSaw and
Grading
Polish
mach ine
Governments
Anodising
equipment
Alprofil
Extrusion
press
Extrusion
tools
RA
Laws and
Regulations
+
Actor
Activi ty
Resource
Roll
former
Al billet
Car
Other
components
Volvo
Extruded
Profile
RA car part divison
ÅSV
BumperSaw and
Grading
Polish
mach ine
Governments
Anodising
equipment
Alprofil
Extrusion
press
Extrusion
tools
RA
Laws and
Regulations
+
Actor
Activi ty
Resource+
Actor
Activi ty
Resource
Roll
former

72
of the actors, resources and activities in 1970 and in 1985. Changes between
the two years are marked in red.
Table 3-1 Actors, resources and activities present in the production network in 1970
and 1985
Layer 1970 1985
Actors RA
Alprofil
Volvo
ÅSV
Governments
RA (automotive)
RA (autoplastics)
Alprofil
Volvo
ÅSV
Statoil
Governments
NHTSA
Resources
Extrusion Press
Extrusion tools
Roll forming
Assembly line
Final car
Aluminium alloy billets
Laws and regulations
Taxes
Re-smelting plant
Extrusion press
Extrusion tools
Roll forming
Plastic forming
Plastic painting
Assembly line
Final car
Aluminium alloy billet
Aluminium
Plastics
Laws and regulations
Taxes
Activities Extrusion (profile prod.)
Forming
Assembly
Aluminium production
Law making
Development
Negotiations
Extrusion (profile prod.)
Forming
Assembly
Aluminium production
Law making and revising
Evaluating
The table shows that there was a clear expansion in the number of actors,
resources and activities from 1970 to 1985. Some but not all of the
expansions are related to the inclusion of production of plastic caps at
Raufoss. Those related to plastic production are activities connected to
making them (such as plastic forming and painting of plastic cap), the
resources needed to produce them (such as plastic forming tools and a paint
factory) and the actor Statoil that supplies the plastics. Those not related to
plastics include development activities at Raufoss, a re-smelting plant and
the separate divisions for automotive parts in RA and NHTSA.
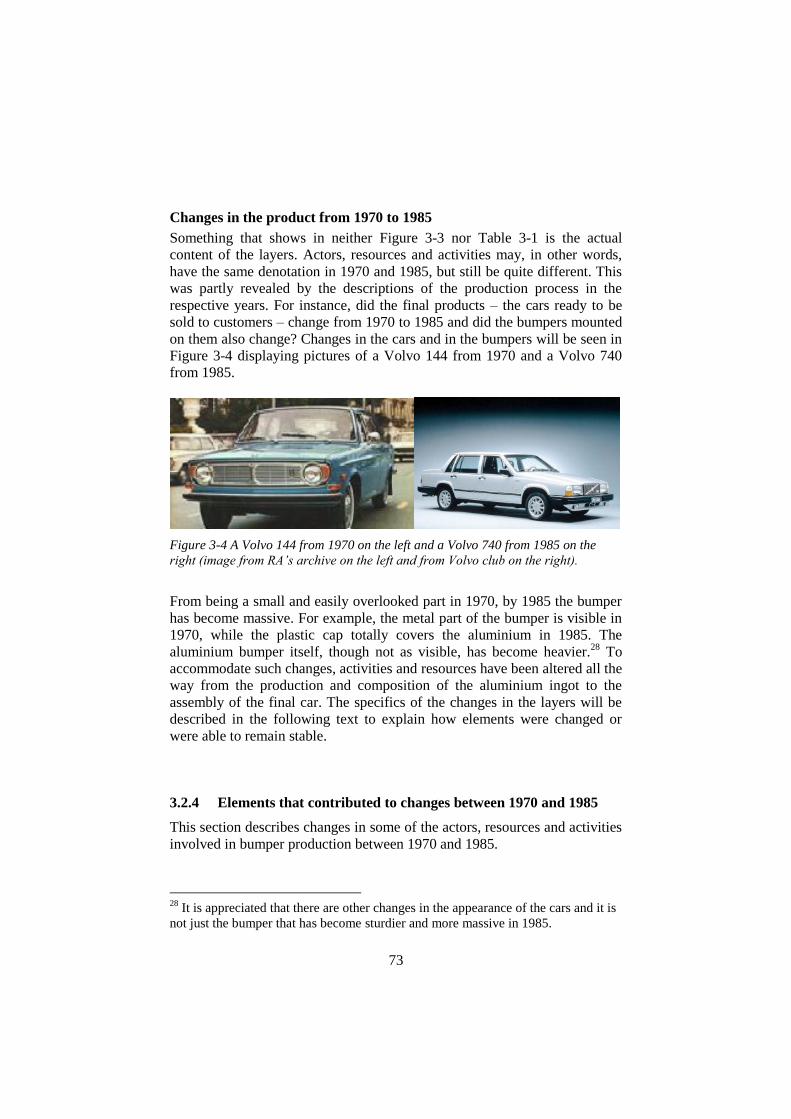
73
Changes in the product from 1970 to 1985
Something that shows in neither Figure 3-3 nor Table 3-1 is the actual
content of the layers. Actors, resources and activities may, in other words,
have the same denotation in 1970 and 1985, but still be quite different. This
was partly revealed by the descriptions of the production process in the
respective years. For instance, did the final products – the cars ready to be
sold to customers – change from 1970 to 1985 and did the bumpers mounted
on them also change? Changes in the cars and in the bumpers will be seen in
Figure 3-4 displaying pictures of a Volvo 144 from 1970 and a Volvo 740
from 1985.
Figure 3-4 A Volvo 144 from 1970 on the left and a Volvo 740 from 1985 on the
right (image from RA’s archive on the left and from Volvo club on the right).
From being a small and easily overlooked part in 1970, by 1985 the bumper
has become massive. For example, the metal part of the bumper is visible in
1970, while the plastic cap totally covers the aluminium in 1985. The
aluminium bumper itself, though not as visible, has become heavier.28
To
accommodate such changes, activities and resources have been altered all the
way from the production and composition of the aluminium ingot to the
assembly of the final car. The specifics of the changes in the layers will be
described in the following text to explain how elements were changed or
were able to remain stable.
3.2.4 Elements that contributed to changes between 1970 and 1985
This section describes changes in some of the actors, resources and activities
involved in bumper production between 1970 and 1985.
28
It is appreciated that there are other changes in the appearance of the cars and it is
not just the bumper that has become sturdier and more massive in 1985.

74
Safety bumpers: from reluctant materials to expanding business
The head of the RA car part factory, Bjørn Bakke (1970) stated that:
"The rapid increase in the sale of cars is well-known. The outlook for
the years ahead does not indicate any reductions in the sale – rather the
opposite. The car factories are making extensive use of subcontractors,
which opens up possibilities for production on a grand scale. Being able
to produce high numbers of a few products is obviously a dream come
true from a production point of view. Competition for winning such
orders is very fierce and highly rational production is necessary to
attract attention, which in turn requires significant investments."
And so they did: RA invested large sums in bumper production over the next
15 years and beyond, as will be demonstrated in the subchapters to come.
However, we turn first to one of the biggest changes in the history of
bumpers, which happened in 1972.
Legal requirements and test protocols
Up to 1972, there were no formal requirements guiding the design of
bumpers. Insurance companies and the carmakers themselves had performed
simple crash tests since the 1920s, but no standards were in place to
benchmark bumper performance. Although insurance companies had an
interest in bumpers, they were used more as styling elements than safety
devices. The "revolution" regarding car bumpers started with the US
National Highway Traffic Safety Administration (NHTSA), which issued
Federal Vehicle Safety Standard (FMVSS) 215 "Exterior Protection" on 9
April 1971 (NHTSA 1971). This became effective on 1st September 1972
and affected all 1973 car models. The standard contained requirements for
bumpers to withstand a 5 mph impact at the front end and 2.5 mph impact at
the rear end. All car manufacturers who wanted to sell cars in the US had to
comply with the standard and this led to hectic activity amongst the
European (as well as American) car manufacturers. Although the OEMs
were aware that such requirements would come, the long development times
meant that carmakers were almost always informed well in advance before
new legal requirements were enforced. About 25% of Volvo's car production
was exported to the US, which was the second largest market after the home
market, and the change in legislation thus had a great impact on the
development of Volvo models.29
However, RA was able to capitalise on its
relationship with ÅSV in order to develop an aluminium alloy that could
satisfy the requirements.30
29
Interview with Gunnar Falck 30
Interview with Thor Wang and Kolstein Asbøll

75
A short detour to discuss aluminium and aluminium alloys
Aluminium is the most abundant metal and the third most common element
in the earth's crust. Nevertheless, it is a fairly "young" metal both in relation
to the date of its discovery, and its subsequent commercial use. One of the
reasons for its late discovery is aluminium's propensity to create stable
compounds with other elements, especially oxygen. This propensity is a
drawback with regard to the production of primary aluminium, as a large
amount of energy is needed to purify the aluminium. However, in the
production of bumpers and bumper beams, the oxide layer that forms on the
surface provides resistance to corrosion.31
With a low density coupled with
high strength, it was used early on in the aviation industry. However, due to
its relatively high cost and the car manufacturers' close relationship with the
steel industry, aluminium had not managed to penetrate the automotive
industry.
Aluminium in its pure form is a soft material. The addition of other metals to
make alloys changes the properties and is necessary to create strength.
Alloys are classified according to an international system with four digits,
from 1xxx to 8xxx depending on the alloying elements. 6xxx alloys,
containing aluminium, magnesium and silicone, are the ones most frequently
used in the automotive industry today and are also widely used for building
applications. However, 7xxx-alloys with aluminium, zinc and magnesium
are stronger, but also more expensive to produce and apply in
manufacturing.
Cooperation between RA and ÅSV
The choice of aluminium alloy for the first bumpers produced at Raufoss
was already decided before RA signed the contract with Volvo in 1965. ÅSV
had some problems in delivering the right quality during start-up and the
alloy was initially supplied by the Swiss aluminium company Alusuisse (part
of Alcan, the world's second largest aluminium producer, since 2003).
ÅSV and RA were two of the largest companies in Norway. When RA
decided to pursue extrusion of aluminium profiles, ÅSV was a natural
partner for cooperation. ÅSV was a major producer of aluminium with a
clear focus on and a strong R&D department in material technology. The
company did not, however, produce much more than primary aluminium and
it saw the relationship with RA as a way to gain access to a market for
finished products.32
31
Interview with Sigurd Rystad 32
Interview with Thor Wang and Kolstein Asbøll

76
In 1968 RA and ÅSV created the joint company I/S Nordiske
Aluminiumsprofiler (Alprofil) to manage the aluminium extrusion business
at Raufoss. An extrusion press designed only for aluminium was purchased
at the cost of NOK 10 million and started operating in August 1969 (Beck et
al 2006).
Even before the FMVSS 215 was released, the companies anticipated
regulation. ÅSV and RA developed an alloy in the 7000 series, originally
called ÅSV 2054. Tests with the new alloy had already been performed in
1970 and this helped to ensure at the time the new regulation was
implemented that RA could start supplying bumpers to Volvo for the US
market with the right characteristics to meet the requirements of the
standard. This was, however, not achieved by the alloy alone, as it was also
necessary to almost double the wall thickness (and hence the weight) of the
bumpers. This had a significant impact on the efficiency of the production
process, as the stronger and heavier bumpers affected both extrusion and roll
forming adversely. As a result, a large number of bumpers had to be
scrapped and were piled up behind the factory33
. The bumper was actually
made in two different models; one for the US market and one with half the
wall thickness (and almost half the weight) for all other markets. Figure 3-5
shows the new bumper with the strong alloy. The parallel holes on the
bumper are for fastening the rubber strip. The holes at each end and in the
middle are for clamping the bumper to the car.
33
The locals called the pile “The Timber Hill” (Tømmeråsen), referring to the name
of the head engineer Nils Chr. Tømmeraas. Interview with Ola Ivar Moen

77
Figure 3-5 The bumper for the Volvo 140 series after the development of the
"strong" alloy (image from RA’s archive)
Even if the costs exceeded income for the first period of production, the
"safety bumper" was a success not only because it complied with the US
standard, but also because it attracted other customers to the company. The
oil crisis in 1973 was also convenient for the aluminium bumper beam
because, although car manufacturers experienced a decline in sales,
aluminium became a favoured material for bumpers on larger cars when
weight and fuel efficiency became key characteristics on which design
focussed.
One of the reasons why RA could not expand its business was the small
organisation. In the early 1970s, they had a process organised solely to fulfil
the contract with Volvo and the sales organisation was too small to handle
more customers or to market the bumpers to other car producers.34
Although Pehr G. Gyllenhammar; newly appointed CEO at Volvo, declared
Volvo's, and the automotive industry's first environmental policy at the UN
34
Interview with Thor Wang and the following literature: (Beck et al 2006)

78
Conference on the Human Environment in Stockholm in June 1972, the staff
at Raufoss were much more concerned with getting organisation and
equipment in place for large-scale bumper production. Audi, VW, Porsche
and Saab all wanted bumpers for cars being exported to the US. As a result,
following an investment in equipment of NOK 33.5 million and an increase
in the workforce, RA started producing 18 different variants of bumpers in
Spring 1973. Wang (1996) states:
"When manufacturing of safety bumpers started in Spring 1973, it was
problems, not bumpers, that were produced."
In 1973, Volvo also finalised the development of the cars that were taking
over for the 140 series, the even more popular 240 series. A lot of the cars'
features were taken from the Volvo Experimental Safety Car (VESC), built
in 1972 and unveiled at the Geneva Motor Show in 1972.35
This was
especially true of the front with its large crumple zones and rigid bumpers,
which were continued in the 240 series. Proof of its safety was provided
when NHTSA purchased a fleet of Volvo 240s to use as reference cars for
safety testing.
The second Volvo deal
Pehr Gyllenhammar had ideas about Volvo being a company with more
strings to its bow. He wanted both to secure Volvo's place in the automotive
industry and expand Volvo's business to include other areas, initiating
several projects in the late 1970s and early 1980s. An example of the first
was an attempt to merge with Saab in 1977, but Saab turned down the deal.
An example of the latter included talks with the Norwegian government, first
the Norwegian prime minister and then the Norwegian main negotiator Jens
Chr. Hauge (Borgström & Haag 1989).
Stortingsproposisjon 69, 1978-79, states:
"Discussions about closer cooperation between AB Volvo and
Norwegian authorities were initiated between Prime Minister Nordli and
Volvo's CEO Pehr G. Gyllenhammar at the start of 1978. After
approximately 12 weeks of confidential negotiations, the Norwegian
Government and AB Volvo Gøteborg entered into a principal agreement
on 22 May 1978 regarding converting AB Volvo into a Swedish-
Norwegian Group and Volvo Petroleum's participation in the upcoming
4th
licensing round." (Industridepartementet 1979)
35
http://www.volvocars.com/corporation/NewsEvents/News/news.htm?item=%7B1B
C6607D-0567-4C97-BC25-388B24E076F9%7D

79
The draft of the agreement proposed to make Volvo into a joint Swedish-
Norwegian company, whereby one Swedish and one Norwegian holding
company were to be established which together would own a joint company
with a respective ownership ratio of 60% / 40%. Jens Chr. Hauge had
proposed such a structure on the basis of a model employed for the airline
company Scandinavian Airline Systems (SAS) in 1951, where Hauge had
also been involved in the negotiations.
The agreement proposed that the new corporation should invest NOK 500-
700 million in Norway and set up a factory for car production. This was
supposed to create between 3000 and 5000 jobs in Norway. As a quid pro
quo, Norway would grant Volvo access to Norwegian petroleum reserves.
There were also commitments for Norway to secure the supply of oil to
Sweden, i.e. not to Volvo as a company but to Sweden as a nation.
However, there was opposition of both sides of the border. The leader of the
Norwegian conservative party, Kåre Willoch, was sceptical as to whether
Volvo had such a prosperous future as a car manufacturer. On the Swedish
side, the powerful industrialist Marcus Wallenberg personified the
opposition. He said of Gyllenhammar's initiative:
"He [Gyllenhammar] should only know what job we had with SAS.
Working over the border with the Norwegians, I don't think he knows
what he sets off to." (cited in Olsson 2000, my translation)
The main arguments were, however, connected to doubts about the value of
the Norwegian contribution to the agreement.
The Norwegian Council of State approved the final agreement on 15
December 1978, but we will never know whether the Norwegian Parliament
would have approved it because before it reached that stage, the Swedish
shareholders (including an organisation of small savers opposed the deal),
voted against it in the general meeting. This was probably due, at least in
part, to the fact that elements of the deal were directly between the Swedish
and the Norwegian government instead of providing direct advantage to
Volvo as a company.36
Even though the Swedish shareholders turned down the deal, it did not end
up totally without consequences. As a direct outcome, a project on new
materials in cars was started, with RA as one of the main contributors. The
project was sponsored by the Royal Norwegian Council for Scientific and
36
Gyllenhammar eventually got involved in the oil business by acquiring the
investment company Beijerinvest in 1981.
80
Industrial Research (NTNF) for Volvo and was carried out in 1978 and
1979. Several people at RA were involved in the study, which looked at
future trends for lightweight materials including aluminium, plastics and
magnesium in cars.
Introducing plastic: a new string to the bow or a complementary
material?
The material project discussed above may well have been the first
introduction to plastic for RA's car part division. Although some plastic
items were already manufactured within RA, this was at the other end of the
scale with small objects such as keys for typewriters, which had totally
different requirements and used different materials to the plastics needed for
the exterior of a car. More broadly, Renault had introduced the first plastic
caps in 1971 and several OEMs started using them during the 1970s.37
In 1977, Volvo decided to use a plastic cap covering the bumper on the new
version of the Volvo 242. The aluminium bumper systems between 1972 and
1980 had been strong and had performed well, but they were starting to
become heavy (for example, bumpers for the US market could weigh up to
10 kg), costly and with few opportunities to enhance the cars' styling. In
addition, the combination of the aluminium bumper and the rubber strip had
created some problems with galvanic corrosion.38
Three companies were evaluated as possible suppliers: Plastal, Viking
Mjøndalen and RA. Although RA had no technology and no organisational
competence, they were chosen as a supplier because of several reasons.
These included:
A good relationship to Volvo with personal relationships on several
levels in the organisations
Knowledge of cars and the automotive industry
A will to succeed and make necessary investments (e.g. as shown in
the build-up of developmental capabilities)
The close connection between the aluminium bumper and the plastic
cap, which created a greater need for production coordination than
with the bumper and the rubber strips
The possibility of creating lightweight solutions for other
components in the body and chassis using combinations of
aluminium and plastics
37
Interview with Per Harald Sørlien 38
Interview with Sigurd Rystad

81
RA's decision to expand into production of plastic caps was probably
connected to an expectation that it was an important move to keep a good
relationship with Volvo (Elnæs 2005). Of equal importance was the close
relation between RA and Statoil, the Norwegian state oil company, which
could supply plastic raw material. Jens Chr. Hauge was the first chairman of
Statoil and was a member of the board of RA. Statoil, RA and KV even
shared their main office in Oslo, and Statoil invested NOK 50 million in RA
to increase competence in plastics and aluminium in the 1980s (Elnæs 2005).
Between 1979 and 1980, NOK 30 million was invested in production
equipment and two people expert in the production of plastic components
were brought in from Skriver Industries. As a result, RA was ready to deliver
plastic caps from 1980. The facelift of the 240 series included the
introduction of an unpainted plastic cap, making the bumper a more
integrated and less conspicuous part of the car. The testing and start of
production went well, even if the process was cumbersome due to extensive
manual handling:
"Among other things, the removal of tools and machinery was all done
manually. Even if the 1300 ton machines were dwarfed by the
subsequent 3000 and 4000 ton machines, they were fairly awkward and
heavy when you had to reach in from the outside and remove the cap
without scratching or damaging the surface in any way. The tool was
more than 2 metres wide and the opening in the machine was not much
bigger . The surface was still warm and soft and extremely prone to
scratching – it basically could not be touched at all without leaving a
mark. The cap was carefully lifted out, placed on a trestle and the inlets
were cut off with a knife by hand. The cap was then placed on a trolley
in order to be transported to the assembly." (Elnæs, 2005)
Automation increased in later years, but not without problems and need for
manual intervention.
Although the bumper in 1980 had an unpainted plastic cap as shown in
Figure 3-6, the first painted plastic caps had been implemented by 1982 with
the introduction of the new Volvo 760 GLE.

82
Figure 3-6 Volvo 240 with unpainted plastic cap
In 1982, new investment had to be made and new problems occurred as a
result of the launching of the 700 series from Volvo with painted plastic
caps. Although Volvo was experienced in lacquering and had facilities that
could accommodate cap painting, it was convenient to have the bumpers
completely finished before direct delivery to the assembly factory. Another
significant factor was that Volvo was close to exceeding the emission permit
from their paint factory. Although production of plastic caps differs from the
production of aluminium bumpers, these two types of production are still
more similar to each other than either is to painting. While care was needed
in the handling of aluminium bumpers and plastic caps, it was nothing
compared to the taut requirements of the painting process. An environment
free from dust and oil is hard to maintain in a production site and, in addition
to new equipment and a specialised building with good ventilation, the most
important aspect was to change the attitude of the workers toward a perfectly
clean environment.39
Given the strict finish requirements, transportation of the painted caps was a
delicate matter. In a report from the board in 1984, the management at RA
explains that there is a need to situate production closer to the car assembler.
They even stated that this could be achieved by 1988-89 (RA 1984).
RA's investments in plastic cap production and gradually increasing
responsibility for development issues were instrumental in the negotiation of
a new long-term contract with Volvo, signed in 1981 and granting RA the
role as single supplier for all bumpers that were supplied to Volvo.40
Volvo
also wanted RA as a development partner, requiring RA to keep up to date
on trends in bumpers and materials.
39
Interview with Per Harald Sørlien and the following literature: (Elnæs 2005) 40
That is, of the larger Volvo makes. The small Volvo 343 built in the Netherlands
had steel bumpers.
83
One of the first results, which was also connected to the report on
lightweight materials in 1978, was the experimental vehicle Light
Component Project (LCP). The bumper, the plastic cap and the foam in
between were developed by RA and had great energy absorbing
characteristics, which made it possible to integrate the bumper into the body.
This bumper pointed towards the solution that would be used in the early
1990s for the Volvo 850 (Elnæs 2005).
The business was still mostly connected to aluminium
In October 1972, the US Congress enacted the Motor Vehicle Information
and Cost Saving Act (MVICS Act) that required manufacturers, amongst
other things, to ensure a bumper standard that incorporated the:
"maximum feasible reduction of costs to the public, taking into account
the cost and benefits of implementation, the standard's effect on
insurance costs and legal fees, savings in consumer time and
inconvenience, and health and safety considerations" (NHTSA 2004)
The MVICS act concluded in 1981 that the most beneficial limit was 2.5
mph for both front and rear bumpers and the change was incorporated in the
new legislation: 49 CFR, Part 581. Congress also specified the components
on the car that were supposed to work after a low-speed crash – for example,
the car should still be driveable and lighting should still work (NHTSA
2004). As a result, the staff at Raufoss was concerned that their customers
might choose other suppliers and possibly switch to steel bumpers because if
the required specification was reduced, the difference between the weight of
a steel bumper and an aluminium bumper would also be reduced. There was
therefore a sense of relief when some states upheld the 5 mph requirements
and this resulted in car producers having to supply parts of the US market
with the more rigid bumpers.
After the introduction of plastic caps, it may appear that the business at
Raufoss completely changed direction and that the production of bumpers
was ignored. Certainly, the Annual Report from 1982 gives hints that such
worries actually existed:
"A repositioning to other materials may force their way through in the
longer term, but changes in styling requirements where the bumper
reinforcement bar is placed closer to the body may still make aluminium
competitive as a reinforcement bar." (RA 1983)
However, plastic caps were only delivered to Volvo and were more
associated with costs than income; meanwhile, aluminium bumpers for other
car manufacturers remained a profitable business. During the 1970s,

84
important investments were made, e.g. in a cast house in 1974, in two new
extrusion presses in 1973 and 1978, and in more efficient forming lines in
1976.41
The first cast house was built in 1974 and started production in May 1975
with a yearly capacity of 8,000 tons per year. It was built to carry out re-
smelting and already had a large input of raw material from the
aforementioned "Tømmeråsen". After an upgrade in 1982 when the
induction oven was rebuilt to be gas fired, the cast house was able to produce
12,000 tons per year using 3 shifts per day. Even with a cast house situated
at Raufoss, ÅSV upheld production of aluminium billets in the 7000 series,
as RA was not self-sustained.42
The fact that the business was still focussing on aluminium can be
demonstrated by the plans and the work done to merge RA and ÅSV. They
had loosely talked about closer connections and, of course, ÅSV's CEO,
Håkon Sandvold, had a place on RA's board, whilst Bjarne Hurlen had a
place on ÅSV's board. The labour union at RA took the initiative and sent
the Minister of Industry, Finn Kristensen, a letter on 22 October 1980 in
which they expressed a desire to coordinate the Norwegian aluminium
industry. The letter took the board in both companies by surprise, but after
some discussion they agreed that it was in fact a good idea.43
Jens Chr.
Hauge (again) was responsible for drafting an agreement and after only six
months, on 24 April 1981, the Department of Industry issued
Stortingsproposisjon 131 for a merger between ÅSV and RA. The advice
was that "a merger between the two companies will make it easier to realise
both companies' goal to continue expansion of aluminium processing on a
profitable basis" (Justisdepartementet 1982). The parliament approved the
merger on 10 June 1981, to begin with effect from 2 January 1982. During
the autumn, a lot of management resources were spent on the necessary
preparations. However, the same autumn brought an election where the
Conservative party came into power to replace the Labour party. One of the
new Prime Minister Kåre Willoch's first acts was to abort the merger and
when a new vote was subsequently held, the majority in the parliament voted
against the proposal (Wang 1996).
Perhaps RA should be happy that the merger never took place, as the
aluminium industry faced a heavy recession in the early 1980s and ÅSV
incurred significant losses. To survive, ÅSV sought mergers with several
other aluminium companies and a solution was eventually reached in 1986,
41
Interview with Sigurd Rystad 42
Interview with Roger Kyseth 43
Interview with Thor Wang and Kolstein Asbøll

85
although this was a little painful for the company. However, before we look
at this solution, with its huge consequences for both RA and the bumpers, we
will consider how production of bumper beams was undertaken in 2006 in
order to compare pictures of the production network structures from 1985 to
2006. Let us first summarise the important elements at play between 1970
and 1985.
3.2.5 Summary: important elements connected to bumper production
between 1970 and 1985
There is little doubt that if one were looking for a pivotal moment in bumper
production at Raufoss, the introduction of the safety bumper in 1972 would
make the top of the list. This product (i.e. resource) tightened the
relationship between RA and Volvo and between RA and ÅSV, it paved the
way for several new customers for RA and it led to the introduction of
several changes in activities and new resources. The introduction of the
safety bumper would not, however, have been possible without actors,
resources and activities that were already present in 1972. These include the
relationship between RA and Volvo and the relationship between RA and
ÅSV, knowledge of aluminium alloys, an extrusion press, forming tools,
research and testing. Not to forget the Federal Motor Vehicle Safety
Standard (FMVSS) 215 and its content specifying the requirements for
bumpers and the issuer of the standard – the US National Highway Traffic
Safety Administration (NHTSA).
The next major change came with the introduction of the plastic cap, which
added new actors, resources and activities to the industrial network such as
Statoil, plastic forming tools and the activities needed to make a plastic raw
material into a plastic cap. Resources and activities needed to paint the
plastic caps were also included later at Raufoss. Although there were
additions to all layers, some resources and activities also disappeared, as the
bumpers no longer needed to be anodised.
In addition to the modification, addition or removal of activities, resources
and actors that were directly related to the safety bumper or the plastic cap,
other changes came into play in the various layers. A re-smelting plant was
set up at Raufoss and a new extrusion press was acquired. The negotiations
between Volvo and the Norwegian government concerning Volvo's
expansion into other business areas showed that the Economy* was not only
confined to the bumper-related activities at Raufoss.
To enable us to describe the element changes in the bumpers' industrial
network (i.e. the Economy*) from 1985 to 2006, let us first take a look at the
86
specifics of the development and production of bumper beams in 2006. This
description will be compared to the description of the network in 1985 to
highlight those changes that have taken place.
3.3 From 1985 to 2006
In the following section, the changes from 1985 to 2006 are described. As
for the period from 1970 to 1985, the presentation starts with a description of
how development and production was undertaken at the end of the period, in
2006. This is followed by a picture of the production network in the same
year. Thereafter the picture is compared with that of 1985 and actors,
resources and activities that are different between the two years are
highlighted. This is used as input for a description of how elements have
changed between 1985 and 2006.
3.3.1 Production of bumper beams in 200644
Volvo has constantly worked on making new car models or updating already
existing models through so-called "facelifts". Thus at the end of 2006, Volvo
was producing 9 different models, of which 5 were produced at Torslanda
outside Gothenburg, with their bumper beams being supplied from Hydro at
Raufoss.
It typically takes three years from the start of car model development to the
start of production (SOP) and a car model is usually produced for six years
with a "facelift" midway through its life. Whenever a new project is initiated
(be it a new car model or a facelift), the first tasks involve setting a timetable
for when different phases must be finished and inviting suppliers to submit
proposals for systems to deliver. The SOP is the ultimate yardstick and
reaching it is seen as the most important economic goal. Failing to reach
SOP is seen to have dramatic consequences, as the car must be presented at
industry fairs. All suppliers must be qualified by Volvo and this process
comprises technical / financial investigations and evaluation schemes similar
to those developed by Ford. Hydro Raufoss is one such qualified supplier
and is normally invited to propose a bumper beam for new car models. The
technical departments at Volvo, together with the purchasing department,
carry out supplier selection for the different components / systems.
44
The information in this section is based on interviews with Bjørn-Anders Hilland,
Tobias Svantesson Kåvik, Kolstein Asbøll, Grete Valheim, Peter Holmén, Tony
Wickström, Anita Lindberg, Roy Jakobsen and Martin Weiman.

87
When Hydro is selected as the supplier, the development of bumper beams is
performed in cooperation between a Hydro development department situated
in Oslo and the unit responsible for the front end of the body in Volvo. In
other words, Hydro is responsible for designing a bumper beam with the
right characteristics within a designated space; while draughtsmen at Volvo
provide details about where the bumper beam has interfaces with other
components, such as fastening brackets and holes for electric wires or air
inlet to the engine. Most of the development work is done on computers,
both for drawing and for simulating the bumper beams' crash behaviour. The
development is financed by Volvo, i.e. a lump sum is agreed to cover all the
work needed to get the drawings right and for making the tools.
The purchasing departments in Volvo and Hydro agree upon the final price
of the bumper beam. An assigned team in Volvo investigates the technical
processes and makes a cost evaluation. A small profit is added to the total
costs and a price reduction is often included in the contract, as production is
expected to become more efficient with experience. In 2006, bumper beams
to Volvo comprised about 10% of the total sales from HAST at Raufoss,
amounting to more than NOK 120 million.
In parallel with the development work, preparations are made for production
at Raufoss. Production is connected to three important facilities: the cast
house, the extrusion plant and the forming line. The facilities are organised
under three different organisations, here referred to as Hydro Aluminium
Metal Products (HAMP) for the cast house, Hydro Aluminium Profiles
(HAP) for the extrusion plant and Hydro Aluminium Structures (HAST) for
the forming line.45
HAST is also responsible for the development department
in Oslo and for creating an efficient supply chain between the activities at
Raufoss. However, the three units have to maintain their own accounts,
contributing to the gains or losses in different sub-units in the larger Hydro
Aluminium.
The cast house produces aluminium alloys in the 7000 series. The series
number designates the alloying elements that are mixed with aluminium. The
7000 series includes the addition of zinc and magnesium, with strong alloys
that are not used for a wide variety of applications. That means there is a
small market consisting of rather specialised products and subsequently only
a small amount of recycled material to buy. Metals are purchased at Raufoss
and, while all the alloying elements are bought from specified suppliers, the
45
The organisation map in Hydro is constantly revised and the names given here do
not exactly mirror the organisation at a given point in time. In fact, three of five
extrusion presses at Raufoss are owned by HAST, but the equipment and the
workforce are rented to HAP.

88
aluminium is bought on the London Metal Exchange (LME). One of the
most important points in the contract negotiations is to specify the price of
the aluminium, as this constitutes almost 40% of the total cost of each
bumper and is constantly changing. Different contracts can be made at LME,
and choosing the right one with the right amounts is an area of risk where
Hydro can earn or lose money.
The output from the cast house is billets for extrusion. HAST buys the billets
from HAMP and purchases extrusion services from HAP. Not all the billets
are used for extrusion at Raufoss. Some of them are transported to other
places where Hydro produces bumper beams, e.g. France and the USA. This
makes it possible to seek economies of scale in the casting process.
In the extrusion plant, three extrusion presses are used to squeeze the billets
through a small opening to produce hollow profiles. So-called "die tools" in
the opening are used to produce different shapes. The tools are manufactured
in hardened steel by specialist companies. Robust tools that do not need to
be changed all the time are a prerequisite for efficient and economic
production. Profiles are cut to the approximate length of the final product
and stored in an intermediate location before they reach the forming line.
The three presses differ in terms of their pressing power and the diameter of
the hollow profile, which means that some products must be made at a
specific press. However, the main focus of the production planner is to
ensure an even distribution on the presses. More than four shifts on one press
costs much more than having three shifts on each press. The extrusion
process represents slightly less than 20% of the final price of the bumper
beam.
The forming line is the facility where the bumper beams attain their final
shape, holes are drilled and add-ons (such as brackets) are mounted. The
aluminium alloy hardens over time, so it has to be heated in an oven to
remove internal tension before the profile is bent. Bumpers are bent two by
two and any additional operations to be carried out at the ends of the bumper
beams are completed in the forming line. If such operations are to be carried
out closer to the middle or if they cannot be done in the line, the bumper
beams must be moved manually to a CNC machine. When the bumper
beams are finished, they are placed on pallets, where the ageing process
ensures that they gain their needed strength. They are then transported to
Torslanda by truck. Although Hydro is responsible for requesting the lorries
from Toten Transport, Volvo pays for the transportation itself.
The bumper beams go into the body factory, which is the "first" factory at
Torslanda. The body factory is almost completely automated and equipped
with robots. One robot is used to fasten the bumper beam to the body and the

89
whole operation takes about 50 seconds. From the body factory, the body
with the bumper beam goes to the paint shop and from there to the assembly
factory. Unlike the body factory, the assembly factory has a lot of manual
workstations. Windows, doors and other components are added to the body
before the "marriage point", where the chassis and the body are united.
Thereafter, the bumper with foam is mounted to the front of the car and the
car is programmed before it is ready to be shipped to an end customer.
Figure 3-7 shows an overview of the actors, resources and activities involved
in the development, production and assembly of the bumper beam.
Figure 3-7 Activities, resources and actors involved in the production of bumper
beams in 2006.
The diagram gives the impression that there are two large actors involved in
the production of bumper beams, namely Hydro and Ford. These are,
however, not directly involved in either the development of or the

90
transactions relating to the bumper beams. Such activities take place within
smaller sub-units of the larger organisations. Changes that have taken place
up to 2006 are better identified when the network is compared to an earlier
stage, which is the subject of the next section.
3.3.2 Changes in the production of bumper beams from 1985 to 2006
A direct comparison between Figure 3-2 (for 1985) and Figure 3-7 (for
2006), as given in Figure 3-8, shows that much has changed in the bumper
production network between 1985 and 2006.
Figure 3-8 Comparison of the bumper production networks in 1985 and 2006.
The plastic has disappeared so the system encompasses fewer processes in
2006 than in 1985. However, the number of actors and resources seems to
have increased. Ownership has become even more confusing, even if
Alprofil with its split ownership is out of the picture.
To clarify the changes, Table 3-2 gives an overview of the activities,
resources and actors involved in bumper/bumper beam production in 1985
and in 2006. Changes from one year to the other are marked in red.
Bumper beam
Bumper
w foam
Al
Billett
(Al alloy)
Other
metals
CarCar body
Extruded
ProfileExtrusion
press
Extrusion
tools
Other
components
Foundry
Forming
line
Forming
tools
Volvo
HAMP
HAP
HAST
Russian
producers
FORD
LME
Test Institutions
+
Actor
Activity
Resource
Governments
Hydro
Other car
manufacurers in PAG
Platforms
Policies,
Standards,
Etc.
Test
protocols
Laws and
regulations
Al billet
Car
Other
components
Volvo
Extruded
Profile
RA car part divison
ÅSV
Bumper
systemPlastic
press
Paint
machine
GovernmentsAlprofil
Extrusion
press
Extrusion
tools
RA
Laws and
Regulations
Actor
Activity
Resource
Forming
line
Aluminum
bumper
Al billet
Forming
tools
Painted
Plastic
cap
Plastic
Press
tools
PP
Statoil
1985 2006
+
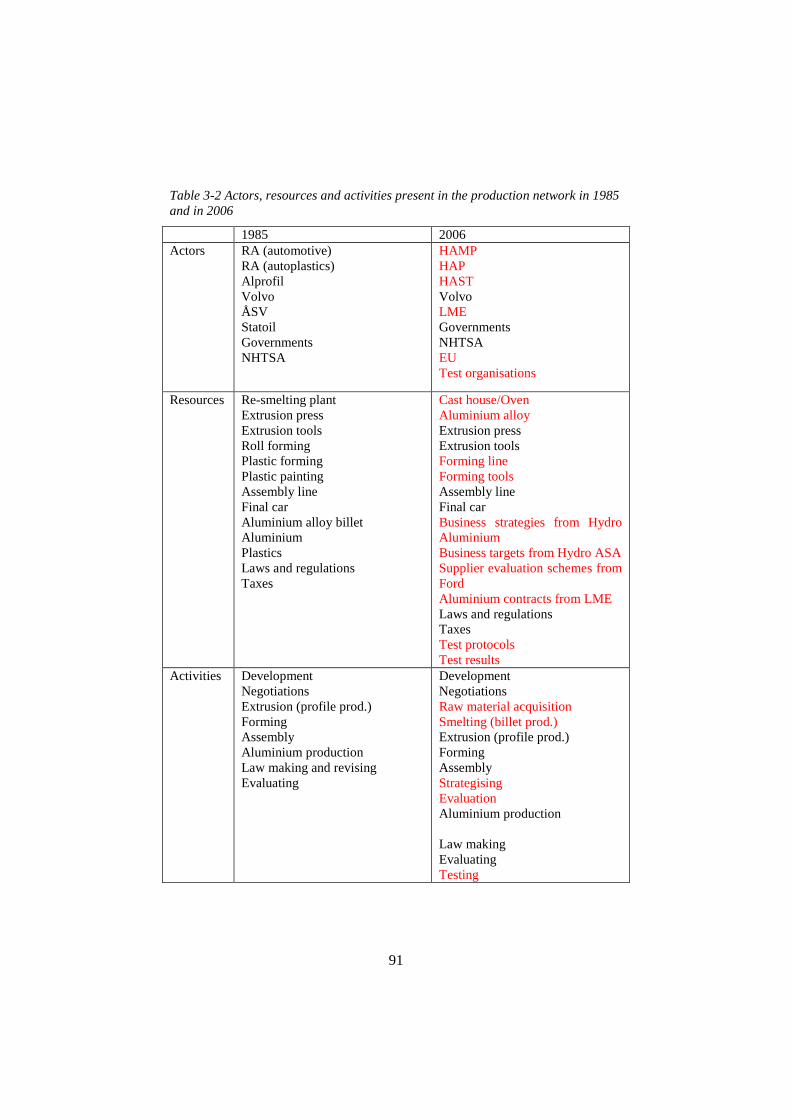
91
Table 3-2 Actors, resources and activities present in the production network in 1985
and in 2006
1985 2006
Actors RA (automotive)
RA (autoplastics)
Alprofil
Volvo
ÅSV
Statoil
Governments
NHTSA
HAMP
HAP
HAST
Volvo
LME
Governments
NHTSA
EU
Test organisations
Resources Re-smelting plant
Extrusion press
Extrusion tools
Roll forming
Plastic forming
Plastic painting
Assembly line
Final car
Aluminium alloy billet
Aluminium
Plastics
Laws and regulations
Taxes
Cast house/Oven
Aluminium alloy
Extrusion press
Extrusion tools
Forming line
Forming tools
Assembly line
Final car
Business strategies from Hydro
Aluminium
Business targets from Hydro ASA
Supplier evaluation schemes from
Ford
Aluminium contracts from LME
Laws and regulations
Taxes
Test protocols
Test results
Activities Development
Negotiations
Extrusion (profile prod.)
Forming
Assembly
Aluminium production
Law making and revising
Evaluating
Development
Negotiations
Raw material acquisition
Smelting (billet prod.)
Extrusion (profile prod.)
Forming
Assembly
Strategising
Evaluation
Aluminium production
Law making
Evaluating
Testing

92
The most striking difference is, perhaps, in the names of the actors; some
have changed, some have disappeared and new ones are added. The
resources and activities given in the table have also changed: they have
increased, as was indicated by Figure 3-8. Part of this expansion is related to
a change in the structure for acquiring the raw materials (the aluminium
ingots) for the bumper beams.
Changes in the product from 1970 to 1985
If the visual change from 1970 to 1985 was considered to be significant, the
change from 1985 to 2006 can be seen as even greater, as shown in Figure
3-9.
Figure 3-9 Volvo 740 from 1985 (left, image from Volvo club) and Volvo S80 from
2006 (right, image from Volvo cars)
The Volvos are no longer as "lumpy" as before. Although there are
exceptions in Volvo's history (such as the P1800), Volvo has not been
famous for its stylish design. Now the lines are smooth, which is probably
one of the reasons why Volvo includes 'design' as one of its core values
alongside 'safety' and 'the environment'.46
The appealing design of the front
of the car is made possible by the bumper, that is, the plastic cap has now
become the bumper and is no longer just covering the aluminium beam. In
fact it is fully integrated with the rest of the car, making a perfectly rounded
nose from the bonnet to the wheels. Nevertheless, the aluminium bumper
beam (now completely hidden) retains important structural functions for the
car. The appearance of the aluminium bumper beam, although invisible, has
changed quite a lot - it has become hollow and the geometry has been made
more complex to accommodate less packing space in the cars. To obtain
such changes, resources and activities have changed accordingly. The
reminder of the case will mainly follow the bumper beam, but will pay
attention to the "break-up" between the bumper and the bumper beam and
the Economy* involved.
46
The positive connotations attributed to Scandinavian design is another possible
reason.

93
3.3.3 Elements that contributed to changes between 1985 and 2006
The time that passed from 1985 to 2006 contained a number of mergers,
acquisitions and reorganisations in the actor layer and – before we forget
everything about ÅSV's economic troubles – let us return to the mid-1980s
to see what the solution to ÅSV's problems was.
A "merger" between ÅSV and Hydro
In 1985, ÅSV worked with the German aluminium company Vereignite
AluminiumWerke AG (VAW) to explore the possibilities for integration
between the companies. This initiative made Norwegian politicians force
Hydro and ÅSV to the negotiating table in order to secure a strong
Norwegian aluminium industry. Hydro was established in 1905 as a fertiliser
producer, a production process that was closely connected to hydropower
concessions. In the mid-1960s, Hydro found itself in possession of excess
power and went searching for applications. The choice fell to aluminium
production on Karmøy, which started in 1967. At the end of the 1960s,
Hydro became involved in the search for oil, with oil and gas soon becoming
the largest focus area of the company (Sagafos & Aasland 2005).
The first round of negotiations between ÅSV and Hydro did not achieve a
breakthrough, but in 1986 the ownership structure was finally agreed. ÅSV
was producing almost twice as much aluminium as Hydro, but Hydro's net
value was set twice as high as ÅSV's because of the latter's high debt
(Bergen Bank & Kreditkasse 1986). As a result of the large difference in
defined value, the integration between the companies never became a
merger. From the outside (as well as inside the organisations), the merger
instead looked like an acquisition by Hydro. This was highlighted by the fact
that the merged company was named Hydro Aluminium. It was evident that
the management from Hydro was responsible for deciding the business
strategy for the new aluminium company. This decision also probably
reflected not only Hydro's initially larger value, but also the fact that ÅSV
had twice been saved from bankruptcy by the Norwegian government in the
years prior to 1986.
The ownership change had immediate consequences at Raufoss, as Hydro
Aluminium did not want to continue the relationship with RA in
ALPROFIL. Although Hydro was seeking opportunities for downstream
operations, it did not believe in going into the automotive industry. After
long discussions, the re-smelting plant stayed with RA whilst the presses
were divided between the two companies. A wall was built inside the
extrusion plant to separate the two companies and Hydro took over most of
the profile production for the construction industry, while production of

94
bumper profiles stayed in RA. Unsurprisingly, the workers at the factory
called this divide "The Berlin Wall".47
Outside Raufoss, in another part of Europe, the real Berlin Wall fell in 1989.
Many welcomed this fall, but for the military production at RA it became a
problem. NATO's military strategies were changed and the ammunition
made at Raufoss was no longer as attractive as it had been previously. This,
together with the international economic recession in the late 1980s and
early 1990s, meant that RA had to seek different strategies in order to
survive. Volvo also suffered a drop in sales from 280,000 cars in 1987 to
190,000 in 1991 and this accentuated RA's financial problems, due to the
automotive unit's major dependency on Volvo (Bronken & Tranås 1994). On
29 January 1990, when the Minister of Industry (Petter Thomassen) visited
Raufoss, negotiations began for a change in RA's structure. Discussions
continued in several forums during the late winter and the spring. In a
parliamentary meeting on 15 of May, the decision was made to partly
privatise Raufoss AS. The Norwegian state was still the largest shareholder
with 53.5% of the shares. Raufoss AS became a holding company, with
Raufoss Automotive as one of three sub-units (Wang 1996).
Even if the period was marked by the first decline in deliveries of products
to Volvo, it was also a period where RA invested more than ever in the
relationship. In 1989, one facility was set up to produce plastic caps in
Uddevalla in Sweden, with another just outside Volvo's facilities in Ghent in
Belgium. Each of them had an investment cost of NOK 50 million. Two
years later, painting facilities were included in Belgium at a cost of NOK 90
million. The facilities ensured that RA could start "just in time" (JIT)
deliveries to Volvo, reducing stock and adjusting shorter response times to
the customers' needs. However, large investments coupled with low earnings
led to a desperate search for cooperation partners. In 1992, Plastal invested
in Uddevalla to create a joint venture with a 50/50 split; whilst production
facilities for finished products in aluminium, such as ladders, construction
materials and maritime products, were sold to Hydro between 1990 and 1994
(Bronken 2005).
The drop in Volvo's sales not only affected RA but also influenced Volvo
itself, which searched for cooperation partners to ensure that it maintained its
place in the automotive industry.
47
Interview with Thor Wang and Kolstein Asbøll

95
Volvo and Renault want to merge
Volvo and Renault had founded a strategic alliance in 1990 to economise on
both activities and resources. It was achieved "through a complicated
scheme of cross-shareholdings, joint production and R&D agreements, and
supervisory boards" (Bruner 1999).
However, as Raufoss was responsible for the development of bumpers for
Volvo and Volvo thus had little in-house expertise in this area, it was natural
to place responsibility for the bumpers with Renault. This decision had direct
consequences for the relationship between RA and Volvo – for example, all
of a sudden, the engineers in RA had to relate to new counterparts and in a
language in which few were fluent.48
A merger between Volvo and Renault was announced on 6 September 1993
by Pehr Gyllenhammar, chairman of Volvo's board of directors, and Louis
Schweitzer, chairman of Renault's supervisory board. Two new companies
were to be formed: a holding company called RVC and an operating
company called RVA. Joining Volvo and Renault together under a common
flag would make Renault – Volvo RVA the sixth largest car producer in the
world (Bruner, 1999).
But the merger never happened! Just as with the second Volvo deal, another
of Gyllenhammar's prestigious projects was turned down by small savers
organised through the Swedish shareholder's association (SSA). As a result,
as soon as the merger was called off, the formal alliance between the
companies was discontinued.49
However, this did not mean that the relationship between RA and Volvo
immediately reverted to the pre-1990 status. New people had started working
in the bumper department at Volvo and whilst the engineers at Raufoss had
probably expected that everything would return to normal without their
having to make an effort, it would appear that the relationship probably
should have been nurtured as, in 1994, RA lost their first tender to deliver
for a new Volvo.50
Hydro acquires RA
Meanwhile, at Raufoss there were other more pressing concerns than the loss
of a single contract. It was evident that there was a need for investments in
the automotive operations, but the holding company could not fulfil this
48
Interviews with Thor Wang and Sigurd Rystad 49
It also led to Gyllenhammar resigning his position 50
Interview with Sigurd Rystad

96
need due to the difficult market conditions and some costly failed projects.
The management of Raufoss Automotive had actually been on the lookout
for potential partners in the aluminium section of the car part division
throughout the first few years of the 1990s. Talks had been initiated with
VIAG (the owner of VAW), Alcoa, Elkem and Reynolds Aluminium. None
of the talks led anywhere and the last company contacted (in 1992) was
Hydro through the Hydro Extrusion Group in Lausanne (Bronken 2005).
The board at RA was sceptical and the process was stopped, but attitudes
changed only two years later, as RA realised that they had a significant need
for investment in machinery to pursue the potential for increased growth in
supply. Talks were initiated with Hydro Automotive Structures and its
leader, Arvid Moss, was more understanding than the management of the
extrusion group to RA's needs if it were to become a part of Hydro (Bronken
2005).
After a long round of negotiations, Hydro invested NOK 303 million in
1994, buying a 40% share in Raufoss Automotive, but the problems with
financing operations were not over. The machine park at Raufoss could not
accommodate the increasing production and it was soon evident that there
was a need to upgrade all parts of the production process, from the cast
house and extrusion presses to the forming lines. Investment was also
needed in facilities for just-in-time production of plastic caps both at
Torslanda and in Ghent. The capital requirement was estimated to be around
NOK 900 million (Anonymous 2000).
Discussions about a possible shift of ownership continued as the mother
company at Raufoss continued to struggle with its finances. It was evident
that something had to happen. Hydro's acquisition of 40% had probably
created a certain lock-in effect and it came as no surprise when Hydro and
Raufoss agreed to make Hydro the complete owner of bumper beam
production at Raufoss in 1997.
The need for investment made it absolutely necessary for RA to have a
financially sound owner. Hydro certainly had the capital, but was also of
such a size and with such diverse fields of interests (fertilisers, oil and gas in
addition to aluminium) that a certain anxiety was present at Raufoss. Would
Hydro be interested in keeping the jobs at Raufoss? Would other people be
employed? Would production be moved elsewhere?51
However, after Hydro's takeover of RA's automotive business in 1997, not
much changed immediately in the organisation. Signs were taken down and
51
Interviews with Thor Wang, Kolstein Asbøll and Sigurd Rystad

97
new signs with the name of the new company were placed on the buildings,
but most of the workforce stayed the same. The largest physical changes
came through investments in a new cast house and a new extrusion press.
Hydro as an owner was also stricter in controlling projects. Research without
contribution to the bottom line was stopped and reporting mechanisms for
better control of the economy were introduced.52
Ford acquires Volvo
At the beginning of January 1999, Volvo was the world's smallest
independent car manufacturer. Less than a month later, it was no longer!! On
28 January 1999, Ford agreed to buy the automobile division from Volvo for
SEK 50 billion. The deal involved a 50/50 split on the rights to the Volvo
trademark between Ford and AB Volvo. The reasons given were the high
development costs associated with making new car models and a desire from
AB Volvo to concentrate on manufacturing trucks and buses. Volkswagen
and Fiat were also reported to have bid for Volvo Cars, with Fiat offering a
higher price than Ford - but Fiat could not assure an autonomous position for
Volvo Cars after the acquisition (Burt 1999).
In a press release, Volvo said:
"Volvo Cars is a premium automotive brand and has both a strong
product program and above industry-average profitability. However,
over the longer term and within the context of its current position as a
relatively small niche player, Volvo Cars would benefit from the
economies of scale inherent in being part of a very large automotive
company. In particular these would apply to the significant investments
required in both the development of new car generations and in
distribution." (Anonymous 1999b)
Ford made similar remarks praising the benefits of acquiring Volvo, here in
the words of president Jaques Nasser:
"Volvo is a premium automotive brand with unique appeal that
represents a good opportunity to profitably extend our lineup and grow
the Ford business worldwide. Volvo is a perfect complement to the Ford
family of brands worldwide. Volvo has a world-class reputation for
safety, quality, durability and environmental responsibility, all of which
are attributes that are increasingly important to customers, and fit with
our 21st century vision for Ford." (Anonymous 1999b)
Volvo was in fact about to develop a completely new platform for small and
medium-sized cars, called P1. The capital required was estimated to be SEK
52
Interview with Thor Wang and Kolstein Asbøll

98
30 billion and it is unlikely that Volvo could have accommodated the
necessary investment. Although at the end of the 1990s Volvo presented
financial results that were relatively better than Ford, the latter still had an
enormous capital base through which it was in a position to finance activities
such as the development or acquisition of smaller car producers. Ford itself
is a conglomerate of a number of independent brands and each is given
responsibility for different issues in relation to research and development
within the group. Within this business model, Volvo was given
responsibility for safety - not just for its own cars, but as the "Center of
Excellence" for all car makes within Ford (Karlsson 2003).
As with Hydro's acquisition of RA Automotive, there were few immediate
changes in the work force at Torslanda, at least in relation to the work with
bumper beams. Some changes occurred in the administrative area. New
reporting routines were implemented, as well as new schemes and
documents for standardisation. The staff at Volvo mostly continued to
perform their job as before, but the change in organisational culture was
clearly revealed if there were any disagreements. For example, Ford has a
much more hierarchical decision structure, with company rules and policies
laid out in lengthy documents.53
The resultant new requirements for reporting to Ford headquarters (including
the creation of formal supplier assessments) affected the relationship
between Hydro and Volvo. Although the technical staff and the purchasing
department could not agree on who was actually in charge of the selection
process, new procedures and guidelines for the purchasing process had been
put in place to ensure that suppliers were not chosen on the basis of
"bribery". Ford's policy was not to accept anything from the selling
organisation, not even dinners or other such gifts. The social ties between
those involved at Torslanda and at Raufoss (both as RA and Hydro) had
generally been quite strong. Now they had to relate in new ways and every
step in the process had to be documented. Nevertheless, although outside the
rules, the development engineers continue to solve problems by phone if
necessary (Brekke 2006).
In addition to the change in the approach to routine work, Ford also certified
all companies who acted as suppliers to brands within the group. Such
certification was based both on self-evaluation by Hydro, as well as an
evaluation performed by accountants and technical experts at Ford.54
Access to raw material creates an industry shift?
53
Interview with head of strategy, Volvo and (Karlsson 2003) 54
Interview with Anita Lindberg

99
The supply of aluminium alloy billets in 1985 was based on a combination
of an internal recycling plant and a strong relationship with ÅSV, who
produced billets at Sunndalsøra. The internal plant increased its output
during the late 1980s and the beginning of the 1990s, but it was never able to
cover the full demand for billets even though, at the end of its lifetime, it had
a yearly capacity of 20,000 tons and was running with 5 shifts per day.55
As ÅSV was taken over by Hydro in 1986 and Raufoss experienced still
greater demand, a push was created to invest in a cast house to cover the
supply of aluminium alloy billets for the 7000 series. At Sunndalsøra, billets
were produced for both the 6000 and 7000 series, but this meant cleaning
charges had to be run in between. The extra time and cost made Hydro eager
to get rid of the 7000-series production. Still, the need for extra cast house
capacity was one of the reasons why Hydro invested in Raufoss. The
investment in the cast house was about NOK 150 million and Hydro's
financial contribution to Raufoss Automotive made it possible for the cast
house to be built. Hydro was already involved in producing aluminium alloy
billets - making Raufoss the production site for the 7000-series alloys freed
capacity at Sunndalsøra for making the more widely used 6000-series
alloys.56
The cast house now in use covers an area of 6000 m2 and was ready for
operation in early 1997. The capacity for the cast house is approximately
50,000 tons per year and the production rate in 2006 was approximately
40,000 tons. One batch from the oven is around 30 tons of finished billets.57
Casting technology has developed, especially in terms of the cleansing of
hydrogen. Billets are therefore of a much higher quality than a few decades
ago. During the early years of the new millennium, Hydro started production
of bumper beams in France and the USA. Billets from "local" producers
were tested but without satisfactory results. This may be the result of an
actual difference in quality, but is also likely to be related to the extrusion
technology (and the forming technology) in place at the production sites.
The production set-up is an imitation of the way production is set up at
Raufoss (with aid from experts at Raufoss), and may therefore be adjustable
to similar billets.58
If the alloys are studied under a microscope, it can be seen that they have
different metallurgical properties. Lower billet quality means lower
55
Interview with Roger Kyseth 56
Interview with Sigurd Rystad 57
Interview with Roger Kyseth 58
Interview with Sigurd Rystad

100
extrudability, which in turn means a need to run the machinery at a lower
speed.59
Initially, the new cast house made integration between the cast house and the
extrusion plant easier. If there were problems with extruding a billet, close
communication between the cast house and the extrusion plant helped to
ensure new casts were made without imposing too high costs, as there were
short distances between the units. This advantage also made it possible to
carry out test runs with small differences in alloys and/or in the set-up of
extrusion tools to find more efficient combinations.60
The late 1990s saw many attempts to achieve a proper integrated supply
chain at Raufoss, where HAST was in charge of setting the plan for billet
production as well as organising the extrusion plant. In 2005, the units were
again reorganised and the cast house became an economic unit under Hydro
Aluminium Metal Products. Staff in HAST have since complained that
integration is, once again, becoming a problem and that bumper beam
production is made more difficult as a result of a decreased focus on its
needs.61
Sourcing of aluminium
In 1985, aluminium alloys were supplied by ÅSV through the joint company
Alprofil. ÅSV was responsible for sourcing the aluminium and delivering
the billets. After Hydro's takeover of ÅSV, supplies still continued, but
Hydro wanted to get rid of the production of billets in the 7000 series. After
the building of the cast house at Raufoss, sourcing took place within HAST
and there have been attempts to obtain used material for recycling.62
Aluminium is often praised for its excellent recyclability. Although the
production of virgin aluminium63
is energy intensive, recycling only takes
5% of the initial energy demand. There is, however, no use of recycled
aluminium at Raufoss except for internal recycling. Approximately 5% zinc
and 1% magnesium are used in the bumper beams - compounds that do not
mix well with other applications of aluminium where silicon is most
frequently used. Unfortunately, mixing silicon and zinc is like mixing cats
and dogs (not a good combination!) and the resultant products are low
quality if the alloys are indeed mixed. However, the situation would be
59
Interview with Yngve Langsrud 60
Interview with Sigurd Rystad 61
Interviews with Roger Kystad 62
Interview with Grete Valheim 63
Virgin aluminium is aluminium produced from bauxite, not from recycled
material.
101
different if bumper beam recycling could be developed, according to the
former head of the HES section:
"Hydro would be happy to accept their own bumpers in return, but
require help from the customers' scrap dealer network. If something like
this could be arranged, Hydro would achieve a closer relationship with
the customer, while possibly including a price reduction in the contracts.
It costs NOK 15-16 to alloy one kilo, whereas a scrap dealer considers
zinc aluminium as "scrap" and sells it for NOK 5 per kilo. Hydro would
be happy to pay NOK 7-8 and it would therefore be easy to create
margins for such a project."64
For instance, Hydro has a shredder outside Dusseldorf that would be suitable
for shredding bumper beams before sending the aluminium to Raufoss. That
said, the production facility at Raufoss is not organised for using such scrap,
not least because the scrap contains contaminants such as asphalt dust and
oil that have the potential to disrupt the production process. There are much
higher tolerances for impurities in casting than extrusion. To build up a
system with re-use of bumper beams, one must approach customers (i.e. car
manufacturers), insurance companies and scrap dealers – Mercedes and
other expensive cars often end up in Eastern Europe where they are
disassembled for all useful parts. The important issue is to control the entire
chain and it must be a large-scale process, of the order of 10-20 tons per day,
which puts a significant demand on the overall logistics of the operation.65
At the beginning of the new millennium, HAST initiated talks with a large
Swedish scrap dealer to set up such a recycling system. The Swedish firm,
however, demanded too high a price for the aluminium, claiming that it had
German customers willing to pay such a price. HAST decided that they
could not pay more than 80-90% of the LME price for aluminium, as there is
often more handling and a greater loss during smelting of aluminium scrap
compared to virgin aluminium. The project thus went nowhere and HAST
had to rely on its normal way of acquiring material.66
The normal way is purchasing aluminium for the cast house on the LME. As
the parent company is one of the largest producers of aluminium in the
world, one would imagine that the aluminium would come from one of
Hydro's production sites. However, almost 100% of the primary aluminium
actually comes from Russian producers. There are several reasons for this.
One is that there is a duty on aluminium from EU member states. Hydro's
aluminium producing unit has negotiated a deal to be exempt from the duty,
64
Interview with Paal Brekke 65
Interview with Paal Brekke 66
Interview with Grete Valheim
102
which means that Hydro can sell aluminium to European countries at
"European prices", but it also means that Hydro at Raufoss would have to
pay such a duty to buy aluminium from Hydro via the LME. With both
Russia and Norway outside the EU, the aluminium from Russian producers
is cheaper. Physically, the aluminium is stored in Gothenburg where LME
has aluminium storage, allowing the aluminium to be transported to Raufoss
in trucks that have been used to deliver plastic caps (for after-market use)
from Plastal at Raufoss to Volvo.67
A second reason is that Hydro focuses on producing alloys, as the profit
margins are larger in areas such as the construction industry than in the
automotive industry. Indeed, rumour has it that Hydro have scrapped the
equipment for producing ingots of the shape and size used at Raufoss.68
Back to the future: plastic disappears for good
In 1985, a plastic cap was attached to the bumper. A little more than 20 years
later, the plastic cap has become the bumper and the aluminium, previously
known as the bumper, has become a bumper beam. The bumper has not only
lost its name, it has also been separated from the plastic, both
organisationally and physically, in the production process.69
However they -
the bumper and the bumper beam - are closely connected in the final car.
The separation of the plastic and the aluminium is connected to the bumpers'
move inwards "into" the car and a new facility layout at Torslanda related to
the introduction of the 850 series. In 1985, the RA board decided to invest in
new plastic cap production facilities in Gent and Torslanda, close to Volvo's
assembly plants. The idea of Just In Time had increased in Western
automotive production and both Volvo and RA realised the potential benefits
of a small geographical distance between production of plastic caps and the
final assembly line. As the caps were supposed to be painted in colours
defined by production, the need for storage would decrease when the caps
were finished close to the final assembly site. A warehouse was therefore
67
Interviews with Paal Brekke, Grete Valheim and Erik Bågarud 68
Interview with Grete Valheim 69
When I started my interviews in HAST, they all talked about their bumper
production. Thus, my first trip to Volvo brought me to the Bumper Division as I
thought that was the place I would find more information about the bumper beam.
However, as the bumper and the bumper beam became separate physical entities
they had also created an organisational divide. The Bumper Division was only
involved in the foam and plastic and had stronger connections to the Design
Division, while the bumper beam had moved to the Body Division and had stronger
connections to the more structural components of the car.

103
leased outside Torslanda to store readily assembled bumpers with plastic
caps.70
Ever since plastic cap production had started at Raufoss, this had run in
parallel with the production of aluminium beams and there was no need for
coordination other than checking that the plastic cap and the aluminium
beam fitted together.
In 1997, Hydro decided to invest in a new bumper plant with injection
moulding, painting and assembly just outside Volvo's Torslanda plant. The
plant for producing plastic caps had an investment cost of NOK 300 million
and was ready for production in 1998. Hydro did not intend to stay in the
plastic cap business and was happy to form a joint venture with Gränges in
1999. The press release from Hydro reads as follows:
"Gränges and Hydro are forming a new company, Autoplastics, where
Gränges will own 60% and Hydro the last 40%…[the] agreement
includes a unconditioned sales option and Gränges an unconditioned
buying option. The requirements for release are mainly based on
profits…[through] the merger we are realising a part of Hydro's long
term strategy of concentrating the automotive operations within
development and production of aluminium components and systems,
among them bumpers in aluminium." (Anonymous 1999a)
The following year, Sapa acquired both Gränges and Autoplastics. Hydro's
annual report from 2001 states:
"EBITDA for Automotive Structures demonstrated a marked
improvement in 2000 compared with the previous year. The
improvement was primarily due to the gain from the sale of Hydro's 40
percent interest in Autoplastics AB in the second half of 2000." (Norsk
Hydro 2002)
Thus, in hindsight, it looks like Hydro's involvement at Raufoss was, from
the start, aimed at splitting the plastic and the aluminium businesses.
Although the investments they made were higher for plastics operation than
for aluminium operations, this was probably designed to ensure that they
realised a good price for the plastics operations when sold.
70
Interview with Per Harald Sørlien

104
Small changes – big problems: the bumper beam becomes hollow
The bumper beam for the Volvo 740 introduced in 1987 is the first with a
hollow profile, as shown in Figure 3-10. With a hollow profile, movements
and damages in small crashes are minimised. RA also produced the foam
and the plastic cap covering the profile.
Figure 3-10 The first hollow bumper beam made for the Volvo 740 (image from
Bjørn-Anders Hilland)
The hollow bumper beams could be made with reduced wall thicknesses, but
retained better crash characteristics. As such, the solution had increased
performance with less weight. Technically, however, it is much more
difficult to produce a bumper beam with a hollow section than in one solid
piece. The developments during the late 1980s were mostly related to
production and the biggest change in the early 1990s was the creation of one
common beam for the US market and other markets.
One common bumper beam for Europe and the USA came as a consequence
of the bumper beam's move inwards towards the car body. When the bumper
beam was fastened directly to the body, it was no longer possible to ship
complete bumper assemblies with the metal beam, foam and plastic cap to be

105
assembled in the USA. Bodies are sent from Torslanda with the bumper
beam already attached. However, the thickness of the foam is different for
the European and US markets. As a consequence, the bumper beams in
Europe immediately became a little heavier to accommodate the US
regulations, but re-reading the regulations also made it possible to make
lighter beams for the US market. The regulation states that the car should be
drivable after a collision, but what "drivable" means in practice requires a
fair amount of individual judgement.
The conversion from solid profiles to hollow profiles does not sound like a
big step. Of course, it is impressive that open sections can be made and that
the aluminium can be welded as the metal is squeezed through the die tool.
The challenge was, however, connected to the survival of the tools. The wear
on the tools meant it was hard to earn money. During the initial attempts at
making hollow profiles, the tooling costs exceeded the margins for the
project. Tools were damaged after only a few billets and the relatively high
tooling costs lead to financial losses. As a result there was concentrated
activity during the 1990s to improve the operation. Cooperation was initiated
with a Japanese producer of bumper beams, which led to improvements in
productivity of several hundred percent, but this was still not enough.
However, with a rearrangement of the tool set-up coupled with increased
knowledge about optimal extrusion speed and temperature, the problems
were solved. As an example of the improved efficiency, when the production
unit in France was converted from the old to the new tool set-up, the lifetime
of the tools rose from 50-60 billets to more than 1000 billets. This obviously
led to a considerable improvement in the financial results.71
Assembly Technology
Volvo's assembly factory in Torslanda outside Gothenburg really consists of
three separate factories: a body factory, a paint shop and a final assembly
factory. During the first twenty years or so of the cooperation between RA
and Volvo, there was no need for much consideration about the assembly
technology in relation to the bumpers. Although there is always a problem in
mixing metals (for example when the aluminium bumper is fastened to a
steel body), the assembly process in itself was not very demanding. Most of
the assembly work was done manually and this decreased the need for
standardisation. However, as the bumper started to consist of more and more
parts during the 1980s, consideration had to be given to how to make
assembly as easy and efficient as possible. RA invested in a just-in-time
warehouse outside Gothenburg in 1990. At first, complete bumper systems
were sent from Raufoss, but after a while plastic covers, foam and bumper
71
Interview with Sigurd Rystad

106
beams were transported there and the bumper system was assembled before
being transported to the Volvo factory.72
During production of the Volvo 850 in the early 1990s, the factory was
reorganised. The bumper and the bumper beam were separated, with the
bumper beam moving from the final assembly line to the body factory. Thus,
instead of being attached to the almost finished car at the end of the line, it
left the body factory to go to the paint shop fastened directly to the body.
This was part of the reorganisation of the production set-up at Torslanda.
According to the Head of Strategy in the Bumper Division, it was absolutely
necessary to cut development and production costs.
"Until the 850, we had almost built a new factory for each project. Now
we cannot afford that anymore."73
As a consequence, the factory has been rearranged to accommodate more
standardised components. The final assembly still requires much manual
work, but robots have taken over the body factory. About 500 robots are in
place at the factory and two of these are assigned to the job of fastening the
bumper beam to the car body. In recent years, the placement of the fastening
holes in the bumper beam has been standardised so that the same robot with
a similar program can be used for every car model, as shown in Figure 3-11.
72
Interview with Per Harald Sørlien 73
Interview with Head of Strategy, Volvo Bumper Division

107
Figure 3-11 Robot for fastening bumper beams to the body (Image from Martin
Weiman)
The robot is programmed to screw six screws in the exact same position for
all models and the cycle time for the whole operation is 49 seconds per
bumper beam, which includes checking that the bumper beam is correctly
fastened.74
Better products
Figure 3-12 is an illustration of details on one of the newer bumper beams.
Compared to the previous bumper/bumper beam images, the level of
sophistication has increased dramatically. "For a long time, we used
complicated machinery and tools to produce pretty simple products," as one
of the development engineers said.75
Although the level of sophistication in
the bumper beam has increased, the production and set-up times have
decreased. The bumper beams' movement inwards into the car has led to
many more interfaces than when the bumpers were mounted on the outside.
Now, factors such as air control to the engine and electricity for the lamps
have to be considered in the design of the bumper beam.
74
Interview with Martin Weiman 75
Interview with development engineer in Hydro Automotive

108
The detailed design of the bumper beam includes elements that are made for
transporting the car body with the bumper beam on the assembly line, for
fastening the bumper beam to the body, for fastening the bumper to the
bumper beam and for accommodating components with an interface to the
bumper region, such as headlights.
Figure 3-12 Details on the S 80 bumper beam (before facelift, image from Tobias
Svantesson Kåvik)
Sources for the changes in the product include new regulations relating to
bumpers, new design requirements and new test organisations doing crash
tests on new vehicles. In the earlier discussion of the changes between 1970
and 1985, the US regulations for bumpers from 1972 and their update from
1982 were discussed. During the end of the 1980s and the following period,
further work has been carried out to create new international regulations and
standardise both the requirements and the set-up of crash tests. Unlike in the
USA, European legislative bodies have been more interested in how
bumpers can be made so that pedestrians are not injured if hit at low speeds.
The combination of the two requirements - protecting the vehicle at high
speeds and ensuring pedestrians do not sustain injuries at low speeds - is
contradictory. The solution to meet both the requirements lies in the foam
between the plastic cap and the metal beam. The metal beam itself does not
Front module (lamps, hood, etc)
Plastic cap (X)
Plastic cap (Y)
Plastic cap (X)
Air control
Plastic cap (Z)
Swop for welding to rammevange
Car body. transport
Screw for
ramme - vange
Front module (lamps, hood, etc)
Plastic cap (X)
Plastic cap (Y)
Plastic cap (X)
Air control
Plastic cap (Z)
Swop for welding to frame bed
Car body. transport
Screw for
frame bed

109
contribute to pedestrian safety and "could just as well have been made of
concrete."76
Test organisations such as the US New Car Assessment Program (NCAP)
and Euro NCAP are set up to provide customers with information about the
safety of new cars. They perform a multitude of different crash tests and
publish rankings in newsletters and on websites. These organisations have
both contributed to a standardisation of test methods and an increased focus
on safety in car companies.77
There are few examples of components that can be used for more than one
car model. Although different cars are often built on a similar platform, there
are almost always small differences in design that means components must
be changed.78
In the newest Volvo projects, they have succeeded in making
one common bumper beam for three car models, S80, V70 and XC70. The
beam is shown in Figure 3-13. Compared to the bumper beam for the S80
before the facelift, there has been a dramatic decrease in weight. The original
bumper beam weighed 5.37 kg, while the new bumper beam only weighs
3.74 kg. In one project they have managed to create a bumper beam for three
different models with less weight than the original bumper beams. Thus,
Economy* is created both in terms of economy of scale - as costs per unit
decrease when more units are produced - and also because less material
input is needed. When the major contribution of the aluminium price to the
cost of the bumper beam is taken into account, this has a significant impact.
76
Interview with Tobias Svantesson Kåvik 77
As passive safety is traditionally one of Volvo‟s competitive advantages, the
increased focus may actually be to their disadvantage. Although customers are more
aware and better informed about the safety features of a car, it also means that all car
companies feel the urge to fulfil the requirements, making every car more similar in
terms of safety features. 78
A project in GM showed that even small items such as screws are non-
standardised. Interview with Grete Valheim
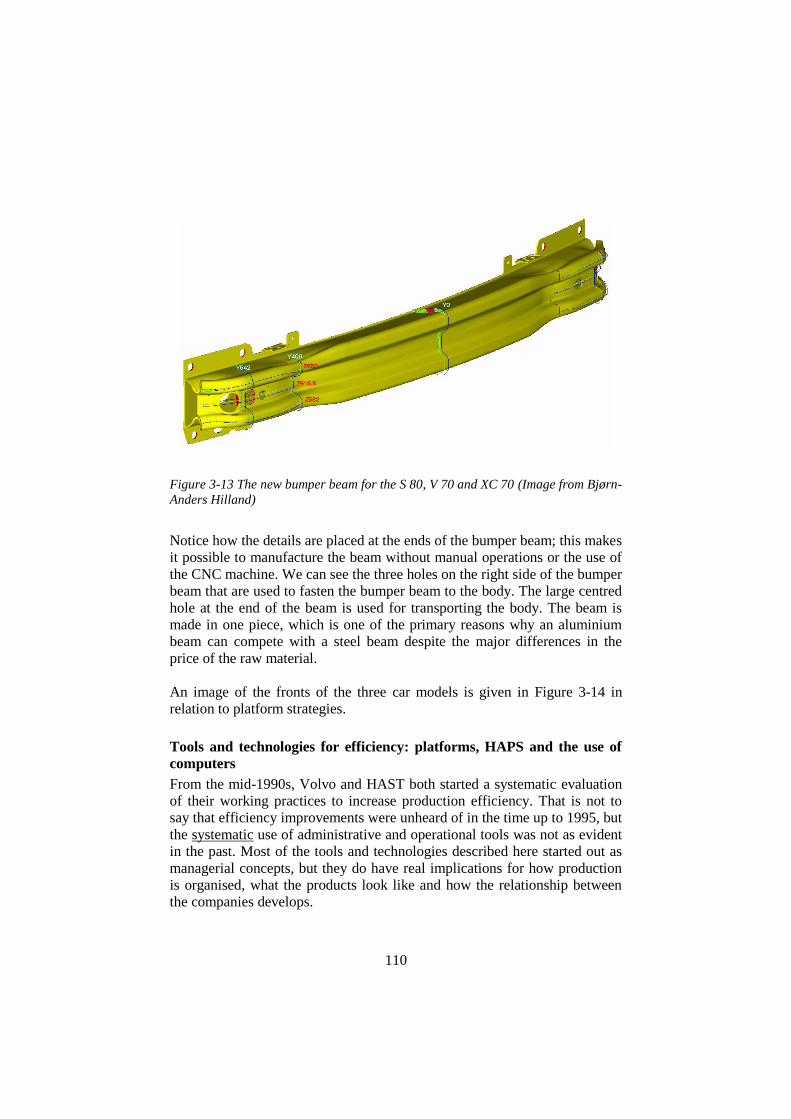
110
Figure 3-13 The new bumper beam for the S 80, V 70 and XC 70 (Image from Bjørn-
Anders Hilland)
Notice how the details are placed at the ends of the bumper beam; this makes
it possible to manufacture the beam without manual operations or the use of
the CNC machine. We can see the three holes on the right side of the bumper
beam that are used to fasten the bumper beam to the body. The large centred
hole at the end of the beam is used for transporting the body. The beam is
made in one piece, which is one of the primary reasons why an aluminium
beam can compete with a steel beam despite the major differences in the
price of the raw material.
An image of the fronts of the three car models is given in Figure 3-14 in
relation to platform strategies.
Tools and technologies for efficiency: platforms, HAPS and the use of
computers
From the mid-1990s, Volvo and HAST both started a systematic evaluation
of their working practices to increase production efficiency. That is not to
say that efficiency improvements were unheard of in the time up to 1995, but
the systematic use of administrative and operational tools was not as evident
in the past. Most of the tools and technologies described here started out as
managerial concepts, but they do have real implications for how production
is organised, what the products look like and how the relationship between
the companies develops.

111
When the 850 model was introduced in 1991, it had been subject to almost
ten years of development. These years were probably well spent, at least if
judged by the changes in production that happened during the lifetime of the
model. Development costs had started to rise so high that Volvo realised
they could not rearrange the factory for every new model they produced.79
As a result, at the time the 850 was ready for a facelift, Volvo introduced a
pilot project connected to a platform strategy.
Platforms at Volvo
The "Painted Body" project was aimed at making production more efficient.
It involved a reorganisation of the factory, but equally importantly it meant a
reorganisation of the development and production areas, both in terms of
their organisational structures as well as in new layouts for the office
environment. Engineers and operators were placed together in cross-
functional teams, new IT tools were introduced and the aim was to perform
simultaneous engineering.80
Between 1995 and 1998, Volvo worked on the
introduction of the P2 platform. The first car built on the platform was the
S80 in 1998 (von Corswant 2003). Later followed the V70, XC70, S60 and
XC90, which may contribute to explain why Volvo managed to have the
same bumper beam on three models (S80 after facelift, V70 and XC70) as
explained earlier in the section on "Better products". Indeed, looking at the
appearances of the cars as displayed in Figure 3-14, one can see that they are
clearly similar.
79
Interview with Stefan Johanson-Tingström 80
Interview with Mats Bengtsson

112
Figure 3-14 The fronts of the three models (from top): V70, S80 and XC70 (images
from Volvo cars).
The use of a platform strategy means that cars become more similar. The
basic shapes cannot differ too much if the same components are to be used in
more than one model.81
However, the development and use of platforms is
not only about using components for more than one model. The changes that
have been introduced in Volvo have been as much connected to the
processes of development and production as to the physical objects to which
these processes relate. The platform concept "encompasses a total offering
with vehicles that are built with the same modular structure using common
systems and components and manufactured by using common flexible
processes in cooperation with a group of long-term partners/suppliers and
using common working methods."82
81
Still, the number of models has increased. It is almost paradoxical how more and
more models are introduced, while the models themselves are getting more and
more similar. 82
Interview with Mats Bengtsson

113
In parallel and in connection with platform development, there has also been
a shift in the view of suppliers within Volvo. Although suppliers had some
development responsibility in 1985, they have been much more involved in
recent years. This has also led to a large reduction in the number of direct
suppliers to Volvo. Since the rationalisation program started in 1995, the
number of 1st tier suppliers has decreased from just above 375 to a little less
than 100. At the same time, the number of models offered has increased
from five to fifteen and the numbers of cars sold has risen from 350,000 to
600,000.83
HAPS
At the start of the new millennium, HAST introduced an improvement
program called the Hydro Automotive Production Systems (HAPS). The
program was an adjustment of what is known as Toyota Production Systems,
often referred to as a Japanese production philosophy. The content of HAPS
is a vision of how production should be undertaken in the future, with a
staircase showing how the company could get there, as shown in Figure
3-15.
Figure 3-15 The HAPS ladder (image from Tom Wasenden).
83
Interview with Mats Bengtsson
Just in time production Reduced costs Increased profit
Current state Need for change Motivation Alignment Vision
Continuous flow Flexibility
Team organisation Waste reduction Safe & healthy workplace Visual factory
Process stability Increased capacity Continuous improvements Company wide quality
- Team organisation - Coaching and Leadership - HSE - 5S and workplace organisation - Value stream mapping - Standardised work
- TPM - SMED - Mistake proofing - Continuous improvements
- Production Scheduling - Supplier development
- Just - in - time Production
- H2C - HAPS Roadmap
Self Assessment - Benchmarking
Just-in-time production
Reduced costs Increased profit
Current state Need for change Motivation Alignment Vision
Continuous flow Flexibility
Team organisation Waste reduction Safe & healthy workplace Visual factory
Process stability Increased capacity Continuous improvements Company wide quality
- Team organisation - Coaching and Leadership - HSE - 5S and workplace organisation - Value stream mapping - Standardised work
- TPM - SMED - Mistake proofing - Continuous improvements
- Production Scheduling - Supplier development
- Just - in - time Production
- H2C - HAPS Roadmap
Self Assessment - Benchmarking
Continuous flow Flexibility
Team organisation Waste reduction Safe & healthy workplace Visual factory
Process stability Increased capacity Continuous improvements Company wide quality
- Team organisation - Coaching and leadership - HSE - 5S and workplace organisation - Value stream mapping - Standardised work
- TPM - SMED - Mistake proofing - Continuous improvements
- Production scheduling - Supplier development
- Just - in - time production
- H2C - HAPS roadmap
Self-assessment - Benchmarking

114
At every step, both the workers and the management have clear and simple
tools and techniques to use to improve efficiency, reduce waste and thus
increase earnings. The tools include unambiguous key performance
indicators (KPIs) and a whiteboard with easy-to-read numbers and graphs.
Every shift reports on issues such as the maintenance tasks they have
performed, possible irregularities in machines, uptime and wreckage on the
blackboard. If production has been running in accordance with the KPIs, the
numbers are written with a green marker; if not, a red marker is used. This
makes any deviations easy to spot. The whiteboard is shown in Figure 3-16.
Figure 3-16 Whiteboard for production parameters (image from Tom Wasenden).
It is not only the organisation of whiteboards that is better arranged. One of
the tools employed is called 5S and is about the organisation of the
workplace, where the five S's stands for (with the Norwegian words in
parentheses): sort (sortere), systematise (systematisere), shine (skinne), see
to (se til) and standardise (standardisere). The different shifts are certified
according to whether or not they live up to the standards of operational
maintenance.84
Although the introduction of the system is driven by a desire to accumulate
reduced costs relative to revenues (as depicted at the top right position in the
staircase diagram in Figure 3-15), there is recognition of the workers' needs
and wants. The tools themselves may look a bit patronising – for example,
the machine operators are asked to keep their "room" tidy and to report
84
Interview with Morten Aass

115
everything they do. However, the goal is to create greater independence for
the workers. It is explicitly stated that the workers' acceptance and feeling of
ownership are key in achieving the durable effects of changes.85
As a
consequence, HAPS includes team organisation across hierarchical levels in
the company. Team meetings are held every morning for approx. 10-15
minutes to discuss production status and consequential problems. All the
workers have attended a course on teamwork and the appointed leader of
each team is given extensive training. One of the goals is to attain an
atmosphere where mistakes can be shared, with the recognition that covering
mistakes up may have devastating consequences (at best financial; at worst
related to injury and even death).86
Thus, HAPS is not only a set of tools and techniques, but also reflects a shift
in the philosophy underpinning the production of bumper beams at Raufoss.
It has had real consequences with regard to variables such as uptime,
conversion time from one product to another, consumption of oil, work-
related injuries, precision of deliveries, lead time and complaints from
customers. This has again led to improved financial results and also, of
course, positively affected the relationships with HAST's customers,
including Volvo.87
For example, in the 1980s and 1990s, Volvo reported
concerns with the relatively large number of errors in the deliveries from
Raufoss. Such complaints have decreased in later years as delivery precision
has increased.
Computers
One of the greatest differences between 1985 and 2006 is the way both
development and production is carried out. In 1985, all the drawings in the
development phase were made on paper, but by 2006, all the processes
within the companies were heavily influenced by the use of computer tools.
The transition to computer tools has made both the drawing process itself
and the handling of drawings easier. A drawing on a millimetre sheet may
create difficulties for the parties when tolerances are low. Now the drawing
program in the computer, CATIA, gives exact coordinates that can be fed
into the computers running the extrusion press and the forming line. Before
even reaching production, the product is heavily tested in LS-Dyna, a
simulation programme developed by the US army to simulate missile hits.
The programme allows the construction engineers to specify material
characteristics and the shape of the product. A range of alternative product
shapes and compositions can be tested without having to make a number of
85
Interview with Tom Wasenden 86
Interview with Tom Wasenden 87
HAST was awarded a prize from Toyota in 2003 in relation to their quality work.

116
prototypes. After simulation has been run by Hydro and accepted by Volvo,
but before production starts, computers are used in bidding on the LME to
obtain the most favourable prices for aluminium. Computers are also
instrumental in accounting, in storing information related to the other tools
and in transferring regulations and evaluation schemes.88
One of the effects of the introduction of computer tools is that the supplier
needs to adapt to the manufacturer's choice of tools. If the tools used in
development by the different parties are unable to communicate, the project
is stranded.
Although the computers make information transfer and storage easier, this
does not come without costs. The almost exponential increase in costs for
development is related to the more intensive use of computers.
What business is the business of bumper beams?
The heading for this section may seem like a question that is only of
academic interest, a question of how to categorise entities with few real-life
implications. In reality, it is the opposite. The question is key in numerous
decision-making situations in which one tries to understand how to create
Economy*. At the end of the 1990s, Hydro Aluminium was in charge of a
supply chain of bumpers consisting of a cast house, an extrusion plant, a
forming line and facilities for the production and painting of plastic caps.
What was the focus? Were the main products aluminium alloy billets or
extruded profiles or bumper beams or plastic caps? Were the business units
in the automotive industry? Or in the aluminium industry? Or in the plastics
industry?
To answer the last question first, the response is clearly "No!" The plastic
cap was obviously not included in Hydro's ideas about how to run
production at Raufoss. This also rules out the plastic caps as the main
product. The other questions are, however, more difficult to answer. In the
late 1990s, it was unclear whether the management in Hydro Aluminium
saw the unit at Raufoss as a bumper-producing or an aluminium-producing
operation.
"For a while [the management in Hydro Aluminium] wanted us to
report the amount of aluminium sold. We told them that our goal is to
sell as little aluminium as possible – per unit."89
88
Interviews with Tobias Svantesson Kåvik and Peter Holmén. 89
Interview with Bjørn-Anders Hilland

117
For an aluminium company it is normal to report the amount of aluminium
going through the system, as it is one of the parameters that can be used to
calculate which company is the largest aluminium company in the world.
For HAST, as exemplified by the citation, the high costs of aluminium had
made it paramount to keep the amounts as small as possible to be able to
compete with bumper beams in other materials.
This may be a minor example, but there is no doubt that there is tension
between the unit at Raufoss and the larger Hydro Aluminium organisation.
When Hydro announced its intention to divest itself of the automotive
operations on 13 November 2006, it was accompanied with the following
statement by Hydro's CEO, Eivind Reiten:
"When Hydro decides to sell a business it's because we believe the
operations and employees will have a better home with a company that
sees greater potential for value creation in that business than we do."
(Anonymous 2006)
He added that Hydro would focus on the area of primary aluminium
production and production of a variety of extruded products, including
building systems. The decision reveals a conflict that has been present at
Raufoss since bumpers first were produced there. The profit margins to be
gained in the automotive industry are much less than in, for example,
construction. The tension has been present since Hydro acquired ÅSV. A
tension that has led to Raufoss never really being part of Hydro and talk
remaining about "us and them" on both sides. Raufoss is different. It is the
only production site for 7000-series alloys and it has the largest extrusion
press in the entire Hydro Aluminium system, which has a total of around 100
presses.
HAST grew extremely fast during the late 1990s and the beginning of the
new millennium, increasing its production from about two million bumper
beams in 1995 to more than six million bumper beams in 2003. One of the
consequences being that the contribution of Volvo products to HAST's
turnover has been going down in relative but not absolute terms.
Nevertheless, the focus on Volvo has decreased as other projects have stolen
the attention. The deliberate decision not to continue as a system supplier in
the new supplier organisation at Volvo has also played a part. From being a
supplier of bumper systems with a high requirement for coordination with
Volvo, they became a second tier supplier with a lower level of
responsibility for development and sourcing.
At Hydro Aluminium, the central decision was made not to seek more bids
during 2002. HAST complained that it just showed that the parent

118
organisation did not understand the automotive industry and its focus on
long-term contracts. A car model is usually produced for about six years
with additional production for fifteen years for after-market sales. Every
contract thus means incomes for a long period of time.
During the 1980s and onwards, it has been a trend for international
aluminium companies to consolidate and integrate vertically. The major
companies are expanding, mainly by acquiring the smaller ones and leaving
only a few logos to be displayed on the map of the aluminium industry.
Spreading of risk, securing supply and material competence have been some
of the arguments behind the trend. These have probably been some of the
reasons for Hydro's involvement at Raufoss (and later in VAW). The
automotive industry may have seemed tempting in the mid 1990s when the
arrow for car manufacturers was again pointing in the right direction after a
drop in sales (and therefore earnings) at the beginning of the 1990s –
particularly as the prices for primary aluminium were low. Afterwards the
image has blurred: the automotive industry did not grow as fast, whilst the
price of primary aluminium grew even faster.90
In every annual report from Hydro since Raufoss entered the publication in
1995, there have been complaints about the financial position of the
automotive part of the aluminium business. Every report has stated a need
for rationalisation and better handling of costs. Unfortunately for Raufoss, or
at least so it seemed at the end of 2006 (and given that they really wanted
Hydro as the owner), the financial struggles with automotive operations
made Hydro finally announce their desire to get rid of the whole automotive
division.91
3.3.4 Summary: important elements connected to bumper production
between 1985 and 2006
The time that passed from 1985 to 2006 included several changes in all three
layers that form the bumpers' industrial network (actors, resources and
activities). The plastic cap took over the role as the bumper and the
aluminium beam was pushed inwards towards the engine. No longer was the
producer of the aluminium beam the same as the producer of the plastic cap.
Furthermore, the beam became hollow, which required totally new forming
90
It is rather ironic that high aluminium prices are good for Hydro Aluminium in
total, while at the same time bad for HAST 91
As this part of the thesis is written in 2007, I can now reveal that the automotive
operations at Raufoss were not sold. As the oil and gas operations in Hydro merged
with Statoil, Hydro is no focusing solely on aluminium production and aluminium
products.

119
tools. The billets began to be produced at Raufoss with aluminium from the
London Metal Exchange (in practice: Russia) instead of billets produced at
Sunndalsøra, with aluminium from the same place. In 2006, the parties in the
relationships were no longer RA and Volvo, after Hydro had acquired RA in
the mid-1990s. It can also be contested whether Volvo was sitting at the
other end of the table after Ford's acquisition of Volvo in 1999.
Actors that were added between 1985 and 2006 include Ford, Hydro, Plastal,
LME and vehicle test organisations. ÅSV and the two divisions belonging to
automotive production within RA disappeared. The production at Raufoss
was instead split between three different units - HAMP (Hydro Aluminium
Metal Production), HAP (Hydro Aluminium Profiles) and HAST (Hydro
Automotive Structures) - under the common umbrella HARA (Hydro
Automotive Raufoss). The bumper was shifted from the Bumper Division to
the Body Division within Volvo.
There were also changes in the resource layer as plastic forming tools
disappeared while many new resources were introduced. A new cast house,
new extrusion presses and new forming lines were acquired at Raufoss and
new assembly technology introduced at Torslanda. Standards related to
impacts on pedestrians and new car designs created less packing space for
bumpers, leading to hollow bumpers with more complex geometrical shapes.
Hollow bumper beams required new extrusion tools. Supplier evaluation
schemes, supplier policies and management tools such as Volvo's platform
strategy and Hydro's HAPS were introduced to implement changes in
production as well as requirements from new actors. Different types of
computer software have been instrumental in steering changes in both
production and organisation.
The actors and the resources has been involved in several changes of
activities, such as simulations, drawing, new forms of cooperating, new
ways of assembling, better integration of casting, extruding and forming,
changes in logistics activities and new ways of sourcing raw materials.
Together, all these changes have altered the content of the Economy*, but it
is not only changes in the three layers that affect this content. Keeping
elements stable may have consequences that are just as significant.
3.4 Elements that have stayed the same – investing in stability
The text so far has focused on actors, resources and activities that have
changed and important elements that have contributed to these changes.

120
There are, however, a few characteristics that are holding this case together,
that make it into being about one issue although activities, resources and
actors constantly change (as we have seen). These characteristics are
aluminium beams in 7000-series alloys from extruded profiles delivered
from Raufoss to Torslanda. Keeping these constant has not meant that they
have been neglected or not debated. On the contrary, an enormous amount of
work is often needed to keep things stable. In the following section, the
different elements of stability will be scrutinised to show the economic
consequences of and economic reasons for this investment in the
maintenance of stability.
Extrusion presses and profiles
The first bumper contract between Volvo and RA was more or less a
coincidence, a series of more or less deliberate moves that suddenly pulled in
the same direction, e.g. RA's decision to start production of aluminium
profiles, Volvo's decision to use aluminium profiles for their bumpers and
Volvo's decision to have more than one supplier to spread the risk.
This basis for the continued relationship in relation to bumpers may have
created a lock-in effect, but the results of the US safety regulations and the
oil crisis in 1973 should not be underrated as arguments for why Volvo made
the decision to continue to use aluminium bumpers.
The continued use of bumpers would not, however, have made sense if the
development of the processes connected to the aluminium bumpers and the
output, that is the bumpers themselves, did not match the development of the
cars at Volvo. Looking at the products, for instance in Figure 3-5 and Figure
3-13, reveals that a lot has happened in relation to the shape of and
accessories on the bumper beams, but examination of the production process
does not reveal the same degree of development. That said, one of the
earliest extrusion presses from the late 1960s is used in the production of
more and more advanced products. There are two possible reasons for this:
One is given by an extrusion expert at HAST, who says:
"Presses are like aeroplanes, they look the same on the outside, but the
details keep changing so they never get too old."92
Although the extrusion press looks similar in a photograph taken in 1970 and
one taken in 2006, the insides have been completely renewed and the
computer programs used to run the presses have been regularly updated.
92
Interview with Sigurd Rystad

121
Thus, even if the production process looks similar at the outside, the
elements inside have changed. This also hints at a relationship between the
manufacturer of the extrusion press and the manufacturer of the bumper
beam. Every summer, a team from the press manufacturing company comes
to Raufoss to perform maintenance and to do test runs.93
The other reason why the press can look the same and yet still meet new
requirements is given by one of the development engineers:
"It is only in the last few years that we have started to produce products
that are as refined as the production process."94
This can also be an argument for a disconnection between the complexity of
the tool and of the product. He states that the bumper beams of 2006 could
also have been made at an earlier point in time. However, there was probably
no pressure for complex geometrical shapes when the bumpers were
mounted on the outside of the car, with less requirements to fit inside a tight
packing volume.
The 7000-series alloys
RA's development of 7000-series alloys together with ÅSV was one of the
main reasons for RA establishing itself as a bumper producer. The 7108-
series alloy (the one that was denoted 2054 by ÅSV and RA) fulfilled the
demand that was created by the introduction of FMVSS and the almost
simultaneous oil crisis. It combined strength with low weight to such a
degree that RA suddenly became a preferred supplier for several European
carmakers exporting to the USA.
In more recent years, it has become clear that the strength of the alloy is not
the most important feature, as the requirements from legislation are not as
tough as imagined by the automotive industry during the 1970s and 1980s.
As a result, the advantages of the 7000-series alloy have turned into
disadvantages. The stronger alloy used in bumpers meant that the wall
thickness could be thinner and thus the bumper could be lighter. So,
although there are potential weights savings by employing a 7000-series
alloy, the absolute weight of the product is going down and the relative
advantage of 7000-series alloys compared to 6000-series alloys is shrinking.
Taking into consideration the fact that the 6000-series alloys are much more
common and easier to recycle, the price of the billets could be lowered by
converting to the 6000-series alloys. 6000-series alloys also have an
93
Interview with Sigurd Rystad 94
Interview with Tobias Svantesson Kåvik

122
advantage because they allow faster extrusion and forming, plus shorter
hardening periods.95
Nevertheless, HAST has decided to stick to 7000-series alloys, although they
make bumpers with 6000-series alloys if asked by their customers. Part of
the reason for this "stubbornness" is connected with the argument they have
employed for almost 40 years – that the 7000-series alloys actually perform
better. Another (and possibly more important), part of the reason is
connected to the production process. All developments and adjustments over
the years have been made according to 7000-series alloys, which means that
the process is optimised for such materials. A switch to 6000-series alloys
would therefore not give immediate production advantages, as the whole
process would have to be re-optimised for the new alloys.96
Raufoss
The deal that was negotiated between Volvo and RA had a small ironic
touch to it. Originally, when the ammunition producer RA was established in
1896, its location was picked for its inaccessibility for the Swedes. At the
end of the 19th century, Norway and Sweden were on the edge of war and the
Norwegians were afraid that Sweden would use force to destroy Norway's
dream of independence. To obtain ammunition for a possible war, the
Norwegian government decided to start production at Raufoss, as its location
inland "behind" Norway's largest lake, Mjøsa, made it hard to access for the
Swedes. This would, perhaps, have been an advantage in any war with the
Swedes, but in a business relationship it is clearly a disadvantage. Although
the transport infrastructure was better developed in 2006 than it was in 1896,
logistics have been a continual issue in the relationship between RA/Hydro
and Volvo.
The interlude with plastic cap production at Raufoss shows that the
placement of a factory is not decided forever. Plastics operations were
moved from Raufoss and closer to production localities in Sweden and
Belgium to obtain better conditions for just-in-time production. So one is
bound to ask why the production of the aluminium bumper beams has stayed
in place.
Raufoss is not located close to the aluminium production site, so access to
raw materials should not be the issue. The aluminium is even (again with a
touch of irony) shipped from Gothenburg to Raufoss. One could argue that
this makes transport more efficient, as trucks can also be loaded on return
95
Interview with Torgeir Welo 96
Interview with Torgeir Welo

123
trips to Raufoss,97
but the logical conclusion of such an argument would be
to place production of bumper beams in Gothenburg to stay close both to the
supply of aluminium and to the customer of the bumper beams.
The machinery already present at Raufoss may be one of the actual reasons
for not moving production. Cast houses, extrusion presses and forming lines
are capital-intensive, heavy machines that are not easily moved. However,
new pieces of all of these items of equipment were purchased during the
1990s and they could have been placed in Gothenburg or Belgium instead.
Then there is the access to human resources. The long tradition of
mechanical workshops at Raufoss has been used as an argument for why
industry is still present and growing. Although the mechanical workshop
does not develop or produce extrusion tools, it does produce forming tools of
a high standard. Coupling the industrial equipment with the human
knowledge has probably created a lock-in effect (i.e. the necessary stability)
to ensure continued production at Raufoss.
Torslanda
When Torslanda was established in 1964, it was probably an obvious choice.
Except for those countries without car production, the automotive industry
was mainly a national affair. Export sales were treated as a bonus in addition
to national sales, but the automotive industry has become rather more global
since then. So the same question applies for Torslanda as for Raufoss: why is
there still car production at Torslanda?
As for Raufoss, Torslanda is situated far from both markets and natural
resources. Again, all the heavy machinery may be one factor but probably of
greater importance are all the connections that have been established with
Torslanda. Without reverting to cultural arguments, the long tradition of
machine industry in Sweden has been vital to enforce the connections in
Torslanda. Since the beginning, Volvo has relied heavily on suppliers in
order to produce cars. The ability to manage the assembly of parts from the
outside is therefore one of the most significant assets for the Torslanda site.
97
Aluminium billets are transported from Gothenburg to Raufoss on trucks that have
transported plastic bumpers produced by Plastal at Raufoss from Raufoss to
Gothenburg. Interview with Roy Jakobsen

124
3.4.1 Summary: important factors in keeping elements in place from
1970 to 2006
The most important resources and activities in this section were those given
in the headings, namely extrusion presses, aluminium profiles and connected
activities, as well as 7000-series alloys and the activities needed to develop,
produce and process them into bumpers at Raufoss and mount them on cars
at Torslanda. In addition, there are all those actors, resources and activities
that made these resources and activities stable over time. These latter are,
however, not required to be stable themselves. Rather there is a need to
change elements adjacent to those that are kept stable, such as the inside of
the extrusion presses, the knowledge of the different alloys and the
competence of the workforce.
3.5 Summary and timeline
The chapter has shown the content of and the changes in the Economy* over
a period of almost 40 years. Actors, resources and activities involved in
bumper transactions between a bumper producer at Raufoss and a car
manufacturer at Torslanda have been presented. New theories on what
constitutes Economy* have constantly been produced, based both on the
available resources and activities, and the more or less conscious altering of
adjacent resources and activities. The word 'theories' does not here refer to
formal science based theories, but rather to scripts or processes that are used
to undertake the transformations from natural resources scattered over many
places into a specific bumper beam in a specific place. Such new theories
have been more or less explicit, with the changes that resulted from the
introduction of the plastic cap as an example of the latter and the
introduction of HAPS or the platform strategy in Volvo as examples of the
former. These elements (and others) have altered the content of the
Economy* through a change in the composition of elements. New theories
have confronted the ones already in existence and the outcome (not in
monetary terms, but in the resulting processes) has both been affected by and
affected the relationship itself, adjacent relationships and the activities,
resources and actors these encompass.
More theoretical words like consolidation and specialisation could of course
be used to make sense of the described changes in the Economy*. However,
these words are only elements that take part in the story as far as they make
their way into discussions and decisions in the industrial network. There
have been instances where such words – or rather the concepts they allude to
– have clearly dictated decisions made by the companies. No attempt has
been made, however, to establish links to theoretical models that perhaps
have contributed to the actors' understanding of activities and resources.

125
Furthermore, it is important to remember that this chapter is not mainly
directed towards explaining why changes in the Economy* have occurred
(although the description implies explanations). Rather, the aim has been to
display the elements of the Economy* and how these have appeared and/or
changed and/or disappeared during the time span covered, so that these
elements can be compared with elements from the Environment*.
3.5.1 Important actors, resources and activities
To keep track of the elements that have been part of the Economy* between
1970 and 2006, they can be sorted according to the ARA model.
Actors
In 1970 there were few actors involved in the Economy*. RA supplied
bumpers to Volvo. The aluminium input came from ÅSV and extrusion was
performed in the joint company Alprofil. Rubber strips were supplied by
Mjøndalen Gummivarefabrikk.
In 1985, after the introduction of the plastic cap, the metal part of the
bumper was no longer visible. This change was facilitated by a
reorganisation at Raufoss into two divisions for bumper production: RA
Automotive and RA Autoplastics. Plastic for the plastic caps was supplied
by Statoil and competence in plastic forming acquired by hiring two
employees from Skriver Industrier. The metal part had also changed and was
heavier and stronger due to a bumper standard introduced in the US in 1972
by NHTSA. The bumper standard increased the demand by European car
manufacturers exporting to the US for strong bumpers that were lighter than
steel bumpers. RA being one of the few producers of such, this led to an
expansion of RA's customer base. It also led to RA being the sole supplier of
bumpers to Volvo models manufactured in Sweden, because Gränges could
not present the same development capabilities as RA in cooperation with
ÅSV.
In the late 1970s, Volvo's CEO Pehr Gyllenhammar tried to negotiate a deal
with the Norwegian Government (with Jens Chr. Hauge as their negotiator)
to get Volvo licenses to drill for oil in Norwegian waters, thus also becoming
an oil company. Volvo would have had to invest large sums in Norway and
set up a car factory. Although the negotiations failed because Swedish
shareholders opposed the deal, it led to at least one research project
involving RA.
In 2006, neither RA nor ÅSV existed anymore. ÅSV had merged with Norsk
Hydro in 1986 and the company took the latter actor's name. Norsk Hydro

126
acquired the automotive operations in RA in two steps in 1993 and 1995.
The bumper customer, Volvo, had been acquired by Ford. Between 1990 and
1993 Volvo cooperated with Renault and this almost ended with a merger.98
In fact, bumpers were no longer what were transacted between the
companies, as the plastic caps had "stolen" that name. The shift in product
specification also led to an emphasis on two different divisions in Volvo,
namely the Bumper Division and the Body Division. Plastic operations were
sold out by Hydro - first by forming a joint company with Gränges and
thereafter with the transfer of the whole of the company to Sapa (later known
as Plastal). At Raufoss, the organisation was split into three sub-units: Hydro
Aluminium Metal Products (HAMP), Hydro Aluminium Profiler (HAP) and
Hydro Automotive Structures (HAST). These units were to be coordinated
by Hydro Automotive Raufoss (HARA), although they were also supposed
to have their own individual business targets and accounts. Aluminium was
no longer supplied internally, but instead purchased from the London Metal
Exchange (LME), which in practice meant Russian aluminium producers.
In addition to all these actors, there were plenty more present in the network
from 1970 to 2006. These include transporters, suppliers of extrusion
presses, suppliers of extrusion tools, suppliers of robots for bumper forming,
suppliers of robots for assembly, vehicle test organisations, other sub-units
within the larger organisations and numerous decision-makers and workers
that have been invisible in the text, but that clearly must have been
responsible for putting resources into use, combining them and placing value
on them, as well as conducting and changing activities.
Resources
Many of the important resources have already been encountered in the
summary of the actors, such as bumpers, bumper beams, plastic caps,
extrusion presses, extrusion tools, forming tools, robots and factories for the
painting of plastic caps and assembly.
From the start, aluminium billets were supplied by ÅSV to RA. In the early
1970s, a re-smelting plant was set up at Raufoss that mostly handled internal
recycling. In the 1990s, a new cast house was built, with aluminium ingots
and other metals being purchased at Raufoss to make their own aluminium
billets.
Throughout the entire time period, the billets have been extruded at Raufoss,
although there was a major shift in the set-up of extrusion tools with the
introduction of hollow bumpers at the end of the 1980s. The hollow bumpers
98
Again Swedish shareholders opposed the deal and it led to Pehr Gyllenhammar
resigning from his position.

127
allowed for thinner wall thickness and more complex geometries, both
decreasing the weight of the product and making it suitable for less packing
volume (the space available for the beam between the plastic cap and the
engine of the car).
The introduction of a standard for bumpers in the USA in 1972, the Federal
Motor Vehicle Safety Standard (FMVSS) 215, paved the way for the safety
bumper. The inclusion of the plastic cap in the late 1970s required facilities
for production and painting of plastic caps.
All these technical resources have been facilitated by organisational
resources such as the organisation of organisational units and management
tools such as Volvo's production platform and the Hydro Automotive
Production System (HAPS).
Computer tools have been instrumental in the latter stages of the time period
in the development of both technical and organisational resources, including
specialised software for bumper drawings and simulations, software for
running extrusion presses and forming / assembly robots, purchasing
software, databases for supplier evaluations and more. The input and output
of the different software units have been important resources in themselves,
e.g. drawings, requirements for bumpers from standards and supplier
evaluation schemes.
Throughout the entire period, the finances of the companies and the
competence they have contained have been important factors, as well as the
location of production and storage of products.
Activities
Having presented both actors and resources, the important activities involved
in the Economy* from 1970 to 2006 are almost given. The production of
bumpers/bumper beams has always required the production of aluminium,
aluminium alloys and aluminium billets, which have provided the input for
extruding aluminium profiles. These profiles have needed forming to attain
the right shape. In the early years, the bumpers were anodised before a
rubber strip was attached and they were transported to Torslanda and
mounted on cars. Both the anodising step and the rubber strip disappeared
with the introduction of the plastic cap, but other activities were undertaken
instead, such as plastic forming and plastic painting.
Even before production starts, other activities need to be performed, ranging
from negotiating, developing facilities and searching for suppliers to
designing cars, drawing bumpers and purchasing materials.

128
3.5.2 Timeline of the Economy*
The actors, resources and activities presented in this chapter can be
organised according to the time of their introduction or alteration as shown
in Figure 3-17.
Activities Resources Actors
197099
Bumper making Cast house, extrusion press, roll
forming equipment, manual
assembly
ÅSV, RA, Volvo
1971
1972 Legal requirements, safety
bumpers
NHTSA
1973 Oil crisis 1974 Cast house Several new customers
1975
1976
1977
1978
1979 Plastic forming technology Statoil
1980 Plastic forming 1981 Painting Paint factory
1982 Roll forming ends
1983
1984
1985
1986 Hydro acquires ÅSV,
ALPROFIL is dissolved
1987 First hollow bumper beams 1988
1989
1990 Volvo and Renault form
strategic alliance
1991
1992
1993 Introduction of LS-Dyna at
Raufoss
Volvo and Renault want to
merge, but fail 1994 Bumper and bumper beam
divide
Hydro acquires 40%
ownership of RA
1995 New cast house, introduction of
platform strategy
1996 Casting increased
1997 Hydro acquires rest of RA
1998 Plastics production is moved Introduction of HAPS 1999 New extrusion press
Several new documents introduced
Ford acquires Volvo
2000 Hydro sells "plastics"
2001
2002
2003 New supplier policies from Ford
2004
2005 2006
Figure 3-17 Timeline of the Economy* (the introduction or change of activities,
resources or actors).
99
The elements (actors, resources and activities) displayed in 1970 were already in
place and were not introduced or changed that specific year.

129
3.5.3 An adjusted image of the economy
The Economy* encountered in this chapter does not at all look like the
stereotypical view of the economy presented in the introductory chapter. The
cynical rationale we could have expected to meet has been absent.
Instead, from 1970 to 2006, we met actors who have struggled to make
resources fit each other and external demands. They have really made an
effort to create the best possible Economy*. This is not to say that the
Economy* has been optimal at every point in time. Rather, the Economy*
has been the end point that the companies are striving to reach, a position
somewhere in the future where costs are lower and income is higher. At least
three different industries have made their presence felt: the automotive
industry, the aluminium industry and the plastics industry. In addition,
reference has been made to the influence of the steel industry, the oil
industry and the insurance industry. These have different modes of
operation, different organisational methods for creating Economy*, both
between each other and internally. The activities undertaken and the
resources employed in development and production have shown
significantly different characteristics, with consequences for the actors'
attempts at organising them.
The actors have strived to come to grips with what resources to hold on to
and what resources to let go. This is easy to understand, given that both the
actual resources and the perceptions of them have changed constantly. The
changes in the object of exchange, the bumper/bumper beam, have been
massive. Its dimensions, its shape and its material composition are
significantly different in 2006 compared to 1970. Changes in resources or in
the structure of activities or the interdependencies between pairs of activities
often created change in other activities. Anodising disappeared when the
plastic cap was introduced, whilst at the same time activities related to the
production of plastic caps had to be put in place; this introduction eventually
led to the creation of a warehouse closer to Torslanda, resulting in a change
to the logistical structure and thus the activities needed to transport the
product to Volvo. Plastic activities were again separated from the bumper
beam when Volvo rearranged assembly and Hydro decided to focus on its
core activities.
Such changes have not been confined to tangible resources only. In an
advertisement from 1974, Volvo wrote:
"Buying a Volvo is an investment. It's been built carefully and slowly to
give you years of trouble-free driving, few repairs and little
servicing…Most cars are built fast and they fall apart fast. A Volvo is

130
built very, very slowly. It takes nine hours just to get through final
assembly." 100
Compared to the systematic attention to cut down on the time spent in
production during the later decades, the advertisement seems odd. However,
it shows a shift in the conception of time from being a sign of quality to a
sign of waste. Many resources (including the resource of "time") are spent
on reducing the time in production. We have encountered methods such as
HAPS and the Volvo platform, as well as schemes for evaluating and
qualifying suppliers. The latter is an example of a resource demanding time
to ensure that the production process itself runs smoothly.
The actors have pursued growth opportunities, but also invested in security.
This applies to both the major organisations and the individuals. For the
organisations, relationships have played an instrumental role in this respect.
Close relationships such as the ones between RA and ÅSV and between RA
and Volvo have provided stability for development and for testing new
technical and organisational solutions. At the same time, this closeness led to
increased harmonisation between the parties and less flexibility to alter
resources and activities. When RA expanded its customer base in the mid-
1970s, it was granted access to other technologies and other ways of
producing. This access has inspired innovations and reorganisations at
Raufoss. Thus, both close relationships and multiple relationships are
platforms for technical development and gaining economy. However, both
close relationships and multiple relationships are consuming resources.
History shows that the relationship between RA and Volvo was at its closest
when RA had few other close relationships. When RA increased the number
of customers and thus relationships, its relationship with Volvo became
weaker.
Changes in the actor layer have mostly taken place as a consequence of an
actor having financial trouble, an actor wanting to gain more economy or a
combination of both. Hydro and ÅSV merging, Volvo and Renault
attempting to merge, Hydro's acquisition of RA, Hydro's sale of plastic
activities and Ford's acquisition of Volvo are all examples on this. They tell
a story of the need to achieve economy now in order to be able to create
greater economy in the future. The trust and commitment between the parties
are increased with the knowledge that the opposite party has the finances to
bear a loss.
We have only dealt with those activities where the companies producing a
specific car are directly involved, yet many activities that take place
100
Volvo, 1974, ”The Volvo Fact Kit: ‟74 Model Year Edition”

131
elsewhere are just as important for the car, such as politicians issuing laws
and regulations for products and processes and other car-makers inventing
new designs.
Economy may not be any less political than only a few decades ago, but it
seems as if business companies have broken their bonds to politicians to a
large degree. Politicians were less visible in the later stages of the history
and it leaves the impression that Economists* (here used as a term
describing people that perform the Economy*) were left more on their own –
at least in the actor dimension. However, politics (represented as rules and
regulations) did seem to be ever-present. The framework for the bumper
beam became more rigid in terms of specifying its characteristics.
Even if the Economy* was different from the stereotypical view of the
economy, there were few, if any, elements that resembled the stereotypical
view of the environment.101
It remains to be seen whether the Economy* has
any resemblance or connections to the Environment* - at least until the
content and the development of the Environment* from 1970 to 2006 have
been revealed in the next chapter.
101
Except, maybe, for the emotions involved when a company has been acquired by
another.

132
4. Scientific production of bumpers and bumper
beams: creating the Environment*
I want to investigate the aluminium bumper as a research report with a focus
on the environment to answer two questions, namely 1) What is the
environmental status of the bumpers? and 2) How has such an
environmental status come into being? The answers to these questions will
provide a picture of what the Environment* is and how it has changed over
the last few decades. This will provide an overview of the Environment*
comparable to that of the Economy* as scrutinised in the previous chapter.
The purpose is thus to describe the Environment* and how it is produced
over the same time period as that for the Economy*, i.e. from 1970 to 2006.
Just as production of the physical bumper beam requires materials to be
produced and transported all over the world so they can be refined into the
product, the production of the bumper beam as a research report requires
knowledge production from diverse fields to be transported, amalgamated
and refined. Most of the travel to unpack the relations between the bumper
beam and the environment takes place in journals. Articles are linked
through references to establish connections between different topics and to
confirm viewpoints so that truths can be established. We shall see how
physical properties are translated into graphs, figures and words. However,
not much of this journey will be spent actually investigating the equipment
used for translations, i.e. the technologies used to discover and measure
environmental impacts, other than through the descriptions of the equipment
offered by the articles.
Bumpers and bumper beams are quite specialised equipment with a low level
of direct interest from researchers outside the automotive industry, although
there are aspects about the bumpers that are interesting to environmental
scientists. However, it is important to bear in mind that bumper beams do not
constitute a science in themselves - rather, different sciences can be used to
advance knowledge of them.
Naturally, scientific contributions on bumpers do not stretch far back in time,
as, arguably, the first car was only built by Benz in 1885 (Stein 1961). This
is at least portrayed as the first vehicle built with the intention of including a
combustion engine from the start. The first bumpers did not appear until
after the turn of the century, the turn from the 19th to the 20
th century that is,
and the first article about bumpers I have managed to locate across was
published in 1924 (Reyburn 1924). Although the article refers to other work
on bumpers, it contains no references. The main message from the article is a

133
plea to car manufacturers to make the attachment of bumpers easier;
remember this was written before bumpers became standard equipment on
cars:
"A bumper is a bar attached transversely in front of or behind a car body
to prevent contact between an obstruction and the car body or to cushion
the shock of collision between vehicles […] In recent years few other
accessories have been so unsatisfactorily attached to automobiles as
have bumpers. However, provision for their application has been
neglected by car manufacturers. One or two additional holes would
greatly simplify the labor of attaching them and would also reduce the
cost to the car-owner. Bumpers at the same elevation on colliding cars
are twice as effective as those of different elevations. Although
specifications cover this height, many bumpers fail to conform to them.
An appreciation of the protective power of bumpers and closer
cooperation between car and bumper manufacturers would result in a
reduction of the growing list of automobile casualties" (p. 379)
The silence around bumpers continued for decades, broken only by
occasional articles, until around 1970, when the enforcement of regulations
seems to have stimulated more widespread publication on the issue.
Although Reyburn's (1924) plea for better attachment of bumpers to cars
seems to have been heard since the customers no longer had to attach them
themselves, the issue of bumpers at different elevations was still a major
concern and the subject of occasional research articles (e.g. Happer et al
2003; Nielsen et al 1997).
That said, most articles on bumpers in general, and aluminium bumpers in
particular, are of a different nature. They focus on technical issues with the
materials used or the performance of bumpers (e.g. Brusethaug & Langsrud
2000; Dons et al 1999; Fjeldly et al 2001; e.g. Hansen et al 2004; Skjerpe et
al 1987; Syvertsen 2006), where concerns such as "isotropic elasticity, an
anisotropic yield criterion, associated flow rule, combined non-linear
isotropic and kinematic strain hardening, and strain-rate hardening" (Reyes
et al 2006) are discussed.
Three different scientific representations of aluminium bumpers are given in
Figure 4-1 below.

134
Figure 4-1 Three scientific representations of bumpers.
The image shows a) the crash impact of an aluminium bumper as
acceleration vs. time (Eskandarian et al 1997), b) the surface of an
aluminium bumper through an electron microscope (Miller et al 2000) and c)
a stress vs. strain curve for an extruded aluminium bumper profile (Clausen
et al 2000). Although these representations do not immediately show signs
of having any connection to the environment, they do show the same
mechanism of chains of translations necessary to capture materials on paper
as will be shown for the Environment*. In other words, they show how
physical properties of an object are displayed by creating connections
between the object itself and already established scientific categories. This
makes it possible to quantify the characteristics of the bumpers through the
aid of measuring equipment. The images thus become true features of the
bumpers.
The word 'environment' in the context of natural surroundings is connected
to the work done by Jakob Johann von Uexküll, an Estonian biologist who
invented the term 'umwelt' when studying the life of ticks (Von Uexküll
1934). However, the history of environmental studies, by which I mean
studies related to the deterioration of natural surroundings, goes far back in
history with a book by James Hutton (1788), reckoned to be one of the
classic early texts on this subject. Environmental studies are not just based
on environmental studies, meaning that several sciences are needed in order
to look at environmental problems. The contribution to understanding a
specific environmental problem may have been created for a wholly
different purpose but later enrolled into an actor-network stabilising the idea
of that environmental problem. Such connections between different scientific
findings will be explored in this chapter. The environment as it is perceived
is dependent on what perception categories it may contain, i.e. what we take
135
to be nature is partly determined by how it is described by others, and to an
increasing degree these others are scientists.
The remainder of the chapter concerns research where these two areas -
bumper research and environmental research - are brought together.
However, to understand the Environment*, emphasis will be placed on
research into environmental issues. Trails will be followed to understand the
connection between the Environment* as depicted in articles from science
related to bumpers and in sciences related to the environment.
4.1 A reference point for the Environment*
I could have tried to construct a research report myself that considered the
connections between an aluminium bumper beam and the environment in
2006. Fortunately, an attempt to capture such connections had already been
published in 2000 when Christian Thiel from Adam Opel (the car
manufacturer Opel) and Georg B. Jenssen from Hydro Raufoss Automotive
presented a paper called "Comparative Life Cycle Assessment of Aluminium
and Steel Bumper Carriers" at the Total Life Cycle Conference and
Exposition in Detroit, Michigan on 27 April (Thiel & Jenssen 2000). This
article, hereafter referred to as the Thiel article, will form the basis for an
investigation of what the Environment* is with regard to the bumpers and/or
bumper beams and how the Environment* has been created, transformed and
stabilised throughout the years. To complete such an investigation, the Thiel
article is viewed as an actor-network in itself: a textual presentation of
connections between established truths about the environment, materials for
bumper production, emissions, weight savings, policy-makers etc. However,
to avoid anticipating the course of events, the search will start with a
summary of what the article states, some keywords (i.e. actors) and the
references (also actors) to guide the search for how the network has been
constructed and stabilised. The stability, and hence the truth, of the actor-
network will depend on the strength of the different elements and how they
are made to fit together.
4.1.1 First round: environmental issues from the Thiel article and its
references
The aim of the Thiel article is to analyse the environmental aspects of two
alternative materials for bumper carriers.102
Steel and aluminium were
chosen and "the presentation of the results focuses on air emissions as CO2,
CO, NOx, and SO2 for the LCI and on the impact categories global warming
102
Bumper carriers are the same as bumper beams and bumper reinforcement bars.

136
potential, eutrophication potential and acidification potential for the LCIA"
(p.1).
There is no justification for why the three impact categories were chosen or
what they refer to in terms of environmental harm, nor are we told whether
there are other impact categories that have been excluded from the study.
The word 'potential' for each of the categories hints that these are not
observable environmental impacts, but rather impacts that may occur.
Perhaps the air emissions chosen by the authors are especially coupled to
driving and/or aluminium production and/or steel production?
The first section of the article continues:
"The achieved weight reduction by the use of light weight material and
the replacement of primary metal by secondary metal resulting from
recycling of ELV scraps were identified as the two parameters which
have the biggest impact on the LCA results. They have been studied in
two sensitivity analysis" (p.1).
Light weighting and recycling are emphasised as important features for the
environmental status of the bumper carriers. The abbreviation ELV is not
explained and leaves an uninformed reader still uninformed. A few pages
later we are indeed given information on what can be saved from a reduction
in weight:
"According to the EUCAR-LCA report [a weight reduction] of 10%
leads to a fuel consumption and consequently CO2-emission reduction
of 6%. The other air emissions like NOx, CO and HC undergo
transformation through the catalytic converter and can not be allocated
to the part's weight."
The carbon dioxide emissions are thus directly related to the weight of the
material of the bumper. We do not know how the weight affects emissions of
SO2, but NOx and CO are now tied to the production of the bumper rather
than the use of the car.
As the name ("Comparative Life Cycle Assessment of Aluminium and Steel
Bumper Carriers) implies, the article is based on a life cycle assessment
(LCA). The authors state that LCA is an "accurate and widely used approach
to achieve an analysis of the entire life cycle of vehicles and components in
regard of raw materials use and emissions" (p. 1). However, LCA is not
defined in much greater detail, although we are told: "the LCA-study has
been conducted according to the requirements of the ISO 14040 and ISO
14041" (p.1). It would appear that someone has thus already defined how an
LCA study should be conducted and probably also what an LCA study is.
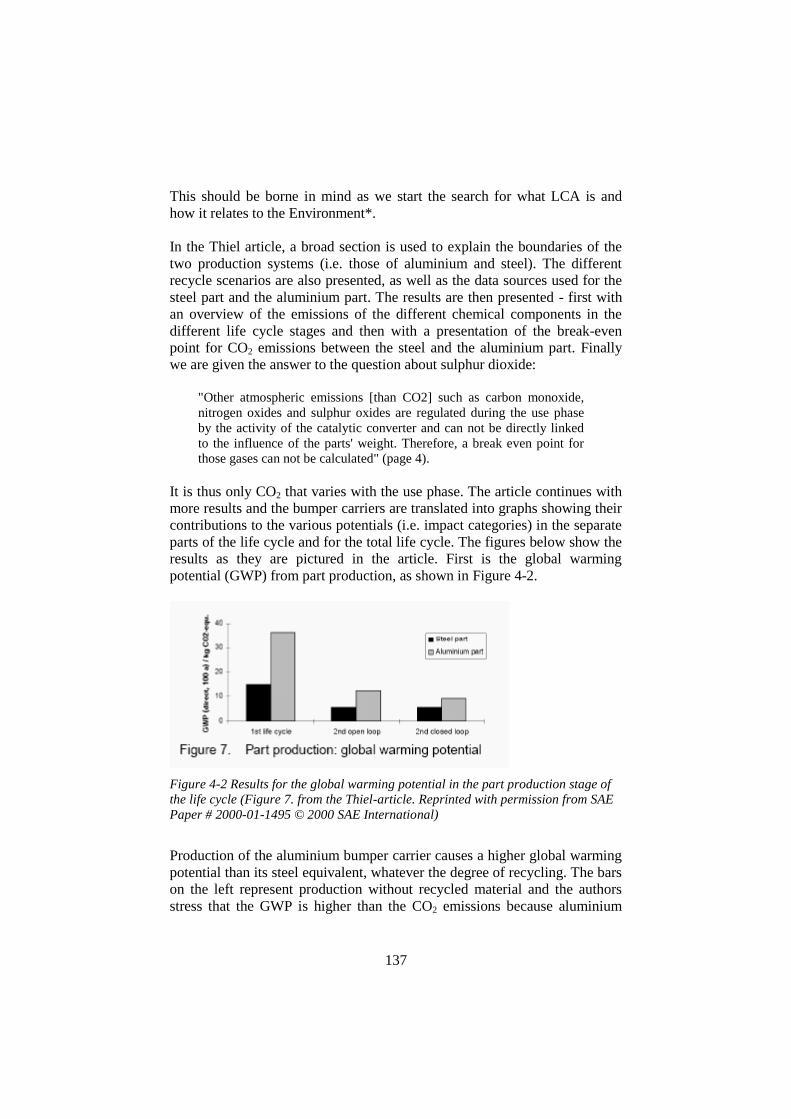
137
This should be borne in mind as we start the search for what LCA is and
how it relates to the Environment*.
In the Thiel article, a broad section is used to explain the boundaries of the
two production systems (i.e. those of aluminium and steel). The different
recycle scenarios are also presented, as well as the data sources used for the
steel part and the aluminium part. The results are then presented - first with
an overview of the emissions of the different chemical components in the
different life cycle stages and then with a presentation of the break-even
point for CO2 emissions between the steel and the aluminium part. Finally
we are given the answer to the question about sulphur dioxide:
"Other atmospheric emissions [than CO2] such as carbon monoxide,
nitrogen oxides and sulphur oxides are regulated during the use phase
by the activity of the catalytic converter and can not be directly linked
to the influence of the parts' weight. Therefore, a break even point for
those gases can not be calculated" (page 4).
It is thus only CO2 that varies with the use phase. The article continues with
more results and the bumper carriers are translated into graphs showing their
contributions to the various potentials (i.e. impact categories) in the separate
parts of the life cycle and for the total life cycle. The figures below show the
results as they are pictured in the article. First is the global warming
potential (GWP) from part production, as shown in Figure 4-2.
Figure 4-2 Results for the global warming potential in the part production stage of
the life cycle (Figure 7. from the Thiel-article. Reprinted with permission from SAE
Paper # 2000-01-1495 © 2000 SAE International)
Production of the aluminium bumper carrier causes a higher global warming
potential than its steel equivalent, whatever the degree of recycling. The bars
on the left represent production without recycled material and the authors
stress that the GWP is higher than the CO2 emissions because aluminium
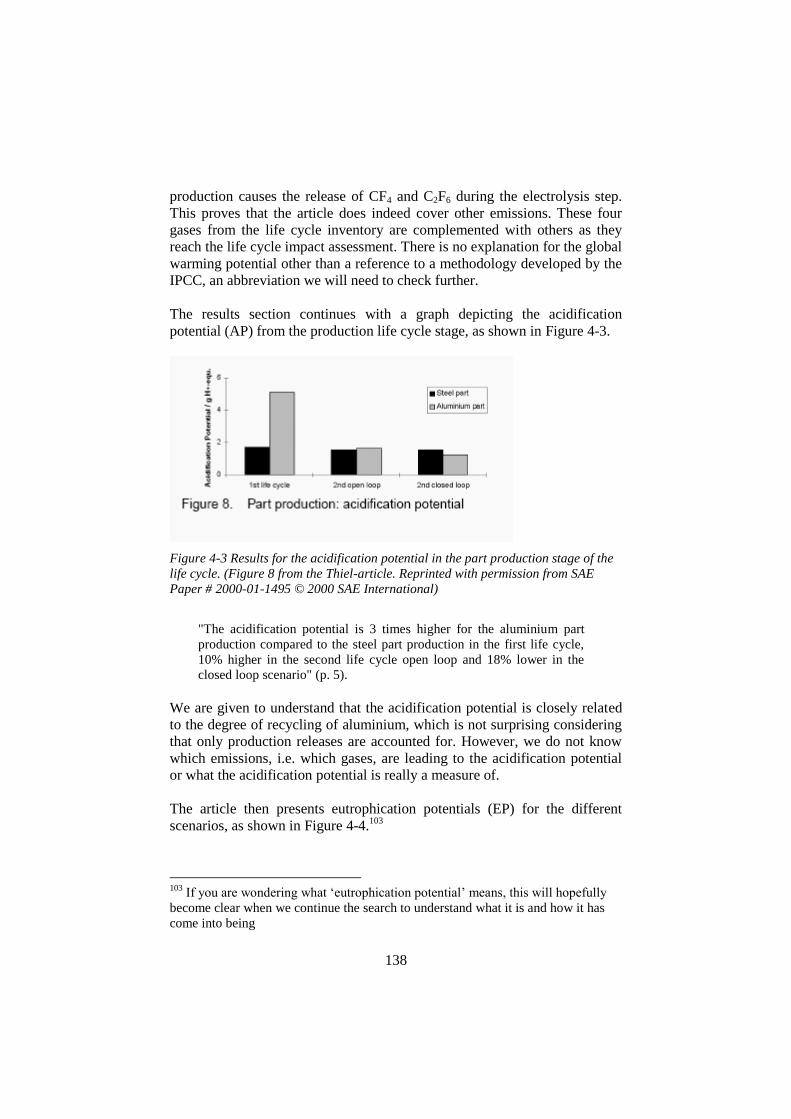
138
production causes the release of CF4 and C2F6 during the electrolysis step.
This proves that the article does indeed cover other emissions. These four
gases from the life cycle inventory are complemented with others as they
reach the life cycle impact assessment. There is no explanation for the global
warming potential other than a reference to a methodology developed by the
IPCC, an abbreviation we will need to check further.
The results section continues with a graph depicting the acidification
potential (AP) from the production life cycle stage, as shown in Figure 4-3.
Figure 4-3 Results for the acidification potential in the part production stage of the
life cycle. (Figure 8 from the Thiel-article. Reprinted with permission from SAE
Paper # 2000-01-1495 © 2000 SAE International)
"The acidification potential is 3 times higher for the aluminium part
production compared to the steel part production in the first life cycle,
10% higher in the second life cycle open loop and 18% lower in the
closed loop scenario" (p. 5).
We are given to understand that the acidification potential is closely related
to the degree of recycling of aluminium, which is not surprising considering
that only production releases are accounted for. However, we do not know
which emissions, i.e. which gases, are leading to the acidification potential
or what the acidification potential is really a measure of.
The article then presents eutrophication potentials (EP) for the different
scenarios, as shown in Figure 4-4.103
103
If you are wondering what „eutrophication potential‟ means, this will hopefully
become clear when we continue the search to understand what it is and how it has
come into being

139
Figure 4-4 Results for the eutrophication potential in the part production stage of
the life cycle (Reprinted with permission from SAE Paper # 2000-01-1495 © 2000
SAE International).
"The eutrophication potential is 1.9 times higher for the aluminium
compared to the steel part production in the first life cycle, 16% lower
in the second life cycle open loop and 30% lower in the closed loop
scenario" (p. 5).
The conclusion is the same as for the acidification potential but, as before,
the gases are not mentioned. What the eutrophication potential actually
measures is not revealed.
After the results for the production phase, the article continues with its "real"
interest, namely the impact potentials for the entire life cycle of the bumper
carriers. Figure 4-5 shows the results for the entire life cycle within the
scenario where none of the materials are recycled.
Figure 4-5 Results of GWP for aluminium and steel for the entire life cycle but
without recycling (Figure 10 from the Thiel-article. Reprinted with permission from
SAE Paper # 2000-01-1495 © 2000 SAE International)
Without recycling, "the break even point for the GWP for the aluminium in
comparison to the steel part is at about 93000 km" (p. 5). It therefore takes
quite a significant number of miles to reach the stage where the GWP is the

140
same for aluminium and steel. However, the conclusion is altered quickly
when recycling is taking into account, as shown in Figure 4-6.
Figure 4-6 Results of GWP for aluminium and steel for the entire life cycle but with
recycling - 2 different scenarios (Figure 11 from the Thiel-article. Reprinted with
permission from SAE Paper # 2000-01-1495 © 2000 SAE International)
"The break even point for the GWP for the aluminium in comparison to
the steel part is at about 29000 km in the second life cycle open loop
and 17000 km in the closed loop scenario" (p. 5).
Here the larger GWP from the production of the aluminium part is soon
exceeded by the larger GWP during the use phase of the steel part. Thus, the
conclusion of the article is that the aluminium part is better than the steel
part with regard to GWP. However, no conclusions are offered in relation to
AP and EP, both because they are too dependent on the level of recycling
and because the catalytic converter makes it hard to be certain if the
reduction of CO, SO2 and NOx emissions is caused by a reduction in weight.
Several concepts mentioned in the summary will be subjected to further
scrutiny, including:
Global warming potential, eutrophication potential and acidification
potential
LCA
Life cycle phases, i.e. production, use and disposal
Lightweight materials in cars
Recycling and ELV
Aluminium production
The Thiel article has provided some information on these issues, but we still
know little about what the environmental impacts are and how the other
issues are connected to them. Let us therefore take a look at the references to
see if they can aid us in understanding the role of these actors in constructing
the Environment*. Figure 4-7 displays the references as given in the article.

141
Figure 4-7 The references in the article (The references from the Thiel-article.
Reprinted with permission from SAE Paper # 2000-01-1495 © 2000 SAE
International)
Numbers 1 and 2 are ISO standards specifying the LCA methodology (ISO
1997; 1998). Numbers 3 to 6 are material databases (for steel, energy,
aluminium and plastics, respectively). Number 7 is a report by EUCAR and
gives an argument for the decrease in fuel consumption and, hence,
emissions with a decrease in weight. Number 8 is an explanation of the
calculation for global warming potential by IPCC and number 9 is an
explanation of the calculations of acidification potential and eutrophication
potential from a report written by the Centre for Environmental Science at

142
the University of Leiden. The last two references should be directly linked to
the Environment*, as they explain the three impact categories. Global
warming potential, acidification potential and eutrophication potential will
therefore be examined first.
Global Warming Potential
The reference for global warming potential in the Thiel article brings us to
an IPCC report published in 1994, called "Climate Change 1994: Radiative
Forcing of Climate Change." Chapter Five of this report is dedicated to so-
called "Trace Gas Radiative Forcing Indices", which, with careful reading,
corresponds to Global Warming Potential (GWP). However, we are not
directly introduced to the GWP concept. First, the authors have to express
what the radiative forcing indices are based on.
"Radiative forcing indices have been developed as a relative measure of
the potential globally averaged warming effect on the surface-
troposphere system arising from emission of a set amount (e.g. 1
kilogram) of a variety of trace gases. These gases can exert a radiative
forcing of the climate system both directly and indirectly. Direct forcing
occurs when the emitted gas is itself a greenhouse gas. Indirect forcing
occurs when chemical transformation of the original gas produces or
destroys a gas or gases that themselves are greenhouse gases. The
indices reflect the cumulative radiative forcing over some chosen time
period of interest" (Houghton et al 1994, p. 209).
Although the language is likely to be strange for most readers, at least some
understanding can be gained from the paragraph. We can see that radiative
forcing indices, which soon will be equal to GWP, are relative measures of
the potentials different gases have to affect the global temperature in both
direct and indirect ways. However, as the reading continues, it becomes clear
that these are not just potentials that can be discovered out in nature.
"A relative radiative forcing index is not purely a geophysical quantity,
such as is a change of temperature. Rather, these indices are user-
oriented constructs whose calculation involves not only an
understanding of a few relevant Earth-system processes (e.g. radiation
transfer and chemical removal), but also some policy-oriented choices
(e.g. a selection of the time span of interest). Hence, such indices per se
are not subject to observation and testing in the sense of many climate-
system predictions, but are best judged by (i) their representativeness of
the overall radiative forcing role of the specified trace gas and (ii) their
overall usefulness to those who formulate and establish policies
regarding the greenhouse gases…[The focus] in the formulation of
radiative forcing indices is on the effect of anthropogenic emissions of
greenhouse gases" (Ibid, p. 212, italics in original).

143
The radiative forcing indices are thus not only a translation of nature; they
also include the political decision-maker, or at least a potential political
decision-maker. They are therefore hybrids of physical, chemical and
political processes as further elaborated below:
"Common to all greenhouse gases are three major factors – two
technical and one user-oriented – that determine the relative
contribution of addition of 1 kilogram of a greenhouse gas to radiative
forcing and hence are the primary input in the formulation, calculation,
and use of relative radiative forcing indices…Factor 1: the strength with
which a given species absorbs long wave radiation and the spectral
location of its absorbing wavelengths…Factor 2: The lifetime or
response time of the given species in the atmosphere…[and] Factor 3:
The time period over which the radiative effects of the species are to be
considered" (ibid, pp. 212-213).
The technical factors in the article are thus those directly related to processes
in nature and the characteristics of gases, the atmosphere and solar rays. We
now know that different gases vary when it comes to their ability to heat up
the atmosphere - both because they absorb long wave radiation to a different
degree and also because they have different lifetimes in the atmosphere. This
is shown in Figure 4-8.

144
Figure 4-8 Strength of absorption and length of lifetime for several different
greenhouse gases (Houghton et al 1994, p. 213)
It is worth noting the long lifetime of C2F6, which was one of the gases
mentioned in the article as producing a higher GWP for aluminium part
production. Furthermore, the graphical representation of the different
chemicals almost produces a feeling of how they drop out of the atmosphere
and down to earth after a given time.
The third factor, the time period to be considered, is not a feature of physical
or chemical processes, but a feature of political processes, that is for what
reason the radiative forcing indices are being used. An imaginary policy-
maker is included in the text as three time-spans are displayed; 20 years, 50
years and 100 years. Finally, on page 215, we reach the Global Warming
Potential:
"[The relative] potential of a specified emission of a greenhouse gas to
contribute to a change in future radiative forcing, i.e., its Global
Warming Potential (GWP), has been expressed as the time-integrated

145
radiative forcing from the instantaneous release of 1 kg of a trace gas
expressed relative to that of 1 kg of a reference gas (IPCC 1990):
dttxa
dttxaxGWP
TH
r
TH
x
)(
)()(
0
0
where TH is the time horizon over which the calculation is considered;
ax is the climate-related, radiative forcing due to a unit increase in
atmospheric concentration of the gas in question; [x(t)] is the time-
decaying abundance of a pulse of injected gas; and the corresponding
quantities for the reference gas are in the denominator. The adjusted
radiative forcings per kilogram, a, are derived from infrared radiative
transfer models… [The] trace gas amounts, [x(t)] and [r(t)], remaining
after time t are based upon the atmospheric lifetime or response time of
the gas in question and the reference gas, respectively" (p. 215).
Simple as that!! Although there is an obvious misspelling in the equation, as
an r is substituted with an x in the time-decaying abundance in the
denominator. However, the point is rather to see how the atmosphere and the
heat balance on the Earth are translated into a mathematical equation - how
the ability to absorb energy and warm the globe fits in one line (or two if you
consider the bar between the numerator and denominator to be a line space).
However, the equation still lacks information about the reference gas - but
this is provided soon after:
"The reference gas has been taken generally to be CO2, since this
allows a comparison of the radiative forcing role of the emission of the
gas in question to that of the dominant greenhouse gas that is emitted as
a result of human activities, hence the broadest interest to policy
considerations…[Unfortunately] from the perspective of its selection as
the reference gas, the atmospheric response time of CO2 has the largest
scientific uncertainty of the major greenhouse gases. As described in
chapter 1, the uptake of CO2 is a complex process involving the
biosphere, ocean, ocean-atmosphere exchange rates, deep ocean
sediments, etc. furthermore, CO2 is also re-circulated among these
reservoirs at an exchange rate that is poorly known at present, and it
appears that the budget of CO2 is difficult to balance with current
information. As a result, when CO2 is used as the reference, the
numerical values of the GWPs of all greenhouse gases are likely to
change, perhaps substantially, in the future simply because research will
improve the understanding of the removal processes of CO2" (p. 215).
More of what the environment entails is introduced here. All of a sudden, the
atmosphere is coupled to the biosphere, the ocean and deep ocean sediments

146
- and we get a link back to the article. We get a little understanding of why
CO2 is so important. Further exploration of this issue will have to wait until
later, until other references can give us the scientific information.
Acidification potential
The article by Thiel and Jenssen (2000) gives no explanation for the
acidification potential. They do not explain what it is, rather they refer to a
report published by Heijungs et al in 1992. The chapter on acidification
potential (AP) begins by stating:
"Potential acid deposition onto the soil and in water is the end point of
the classification for acidification. Potential acid deposition can be
expressed as potential H+ equivalents. Potentially acidifying emissions
of SOx, NOx and NHx can be aggregated on the basis of their potential
to form H+. In the calculations of H+ equivalents it is assumed that one
mol of SO2 will produce two mols H+, that one mol nitrogen oxide
compounds (NOx) will produce one mol H+ and that one mol reduced
nitrogen compound (NHx) will produce one mol H+ equivalent.
Potential H+ equivalents provide an example of an exposure factor"
(Heijungs et al. 1992, p. 75).
Immediately we are thrown into soil and water considerations. Some of the
potentially acidifying emissions are to be found in the Thiel article, namely
SO2 and NOx. We are now told that these can produce H+. However, the
consequences of having this H+ in soil or water are not clear and may
require additional reading:
"As proposed by Vermeire et al (1992) an acidification potential (AP)
can be developed by analogy with GWP, ODP and POCP. In this way
the AP is defined as the ratio between the number of potential H+
equivalents (νi) per mass unit substance i (Mi) and the number of
potential H+ equivalents (νref) per mass unit of a reference substance
(Mref). Sulphur dioxide (SO2) is proposed as the reference substance.
Expressed as a formula:
22/
/
SOSO
iii
M
MAP
" (p. 75)
Not much clearer… but we are at least given a formula relating the
acidification potential to production of H+ and references are made to GWP,
ODP and POCP, noting that we have already encountered the first. The fact
that there are other abbreviations ending with a 'P' hints that there may be
other impact categories and therefore other descriptions of environmental
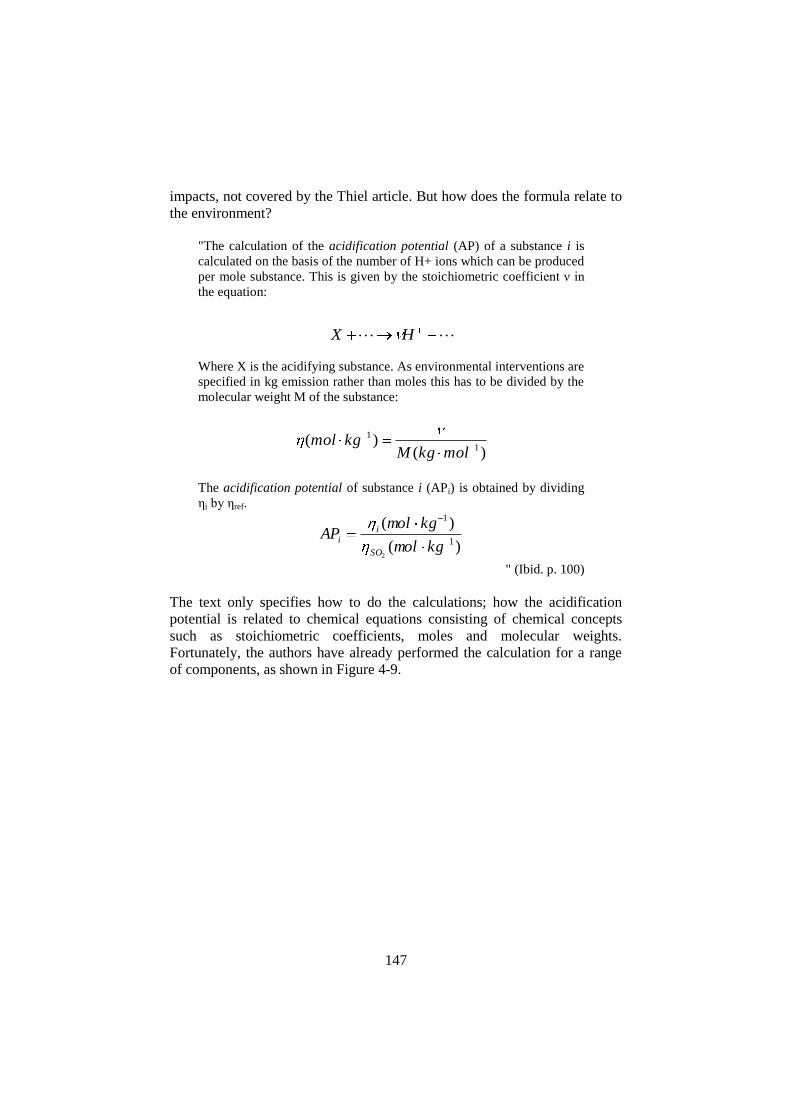
147
impacts, not covered by the Thiel article. But how does the formula relate to
the environment?
"The calculation of the acidification potential (AP) of a substance i is
calculated on the basis of the number of H+ ions which can be produced
per mole substance. This is given by the stoichiometric coefficient ν in
the equation:
HX
Where X is the acidifying substance. As environmental interventions are
specified in kg emission rather than moles this has to be divided by the
molecular weight M of the substance:
)()(
1
1
molkgMkgmol
The acidification potential of substance i (APi) is obtained by dividing
ηi by ηref.
)(
)(1
1
2kgmol
kgmolAP
SO
ii
" (Ibid. p. 100)
The text only specifies how to do the calculations; how the acidification
potential is related to chemical equations consisting of chemical concepts
such as stoichiometric coefficients, moles and molecular weights.
Fortunately, the authors have already performed the calculation for a range
of components, as shown in Figure 4-9.

148
Figure 4-9 Table showing acidification potentials for different substances (Heijungs
et al 1992).
In this table, we are given both the numbers for the different variables that
can be inserted into the equations to produce final values for the AP and the
actual final values for the AP.
We have seen how different chemical compounds are translated into a single
function - one of producing acid – but the impacts and detrimental
consequences of acid deposition are not explained. For this category, we are
not even given any connection to nature except for the chemical compounds.
No species are mentioned and the words 'water' and 'soil' are the only link to
nature.
Eutrophication potential
When opening the report by Heijungs et al (1992), I was puzzled that the
word eutrophication was not included in the contents. With closer reading,
however, I located a footnote in the chapter on nutrification that reads: "Here
nutrification is used as synonymous with eutrophication. In this report this
includes over-fertilisation of water as well as soil" (p. 75). Thus, the term
eutrophication is explained. It is taken to be the same as nutrification and it
affects water and soil. Now we just need to find out what nutrification is and
this amplifies the hint that was given at the beginning of this chapter by
Heijungs:
"Nutrification is the addition of mineral nutrients to the soil or water
which increase production (van Straalen & Verkleij 1991). This
definition implies that nutrifying substances could always be a
constraint on biomass production…Nitrogen (N) and Phosphorous (P)
are the most nutrificating elements" (p. 75).

149
This makes it clear that nutrification is related to the production of biomass
and that the two chemical compounds nitrogen and phosphorous are
involved. It sounds like something farmers do to obtain a good crop.
However, another footnote tells us that this is not the case: "The saturation of
agricultural land with phosphorous due to excessive use of fertilizer in
agriculture, which reduces the fertility of the soil and promotes nitrate
leaching to the groundwater, does not fit into this definition of nutrification.
Nitrate leaching could be classified under the problem type human toxicity"
(p. 75). Further reading is perhaps required, in order to really understand
what nutrification is about.104
"The effects of nutrification must be distinguished between soil
nutrification and nutrification in surface waters. In both media
nutrification will result in generally undesirable shifts in the numbers of
species in ecosystems and a reduction in the ecological diversity. The
reduction in diversity is due to the fact that increased N and P levels
make species which grow rapidly and at an early stage more
competitive. Hence these species will displace those which grow slowly
and later. This results in a reduction in diversity and the dominance of
one or a few species which grow rapidly and early. In surface waters the
shift in the range of species is generally shown by rapid algal growth. In
some seasons when the algae die and at night when the algae consume
rather than produce oxygen, this increased algal growth may lead to a
lack of oxygen. This can have serious effects on the flora and fauna in
the affected body of water" (p. 76)
The detrimental effect of nutrification is thus connected to diversity, to
upholding an environment with rapid- and slow-growing species side by
side. However, the only species introduced are algae and we can only guess
that the effects are also felt by fish, seaweed and other flora/fauna living in
waters.
"A reference substance could be used to express nutrification…[In] this
way a nutrification potential (NP) can be derived for all potentially
nutrifying substances. Here the NP is defined as the ratio between the
potential biomass in N equivalents per emitted quantity of substance i
(Mi) and the potential biomass in N equivalents per emitted quantity of
a reference substance (Mref) such as PO3
4 . Expressed as a formula:
104
It should also be recognised that we are introduced to yet another category of
environmental impacts, i.e. human toxicity.

150
34
34
/
/
POPO
iii
M
MNP
" (p. 76. Italics in orginal).
Nutrification is made calculable by referring to phosphate. However, this is
not enough. We need to go one step further
"The calculation of the nutrification potential (NP) of a substance i is
based on the average composition of algae: C106H263O110N16P
(Eijsackers et al 1985), which is assumed to be representative of the
average composition of biomass. For each nutrient X it is determined to
what extent it contributes to the formation of biomass, assuming that the
supply of other nutrifying substances is unlimited:
)( 16110263106 PNOHCX
…The stoichiometric coefficient ν has to be divided by the molecular
weight M of the substance concerned [as emissions are normally
reported in kg, not moles]:
)()(
1
1
molkgMkgmol
The nutrification potential of substance i (NPi) is obtained by dividing
ηi by ηref.
)(
)(1
1
34
kgmol
kgmolNP
PO
i
i
The table shows the nutrification potential of various nutrifying
substances.
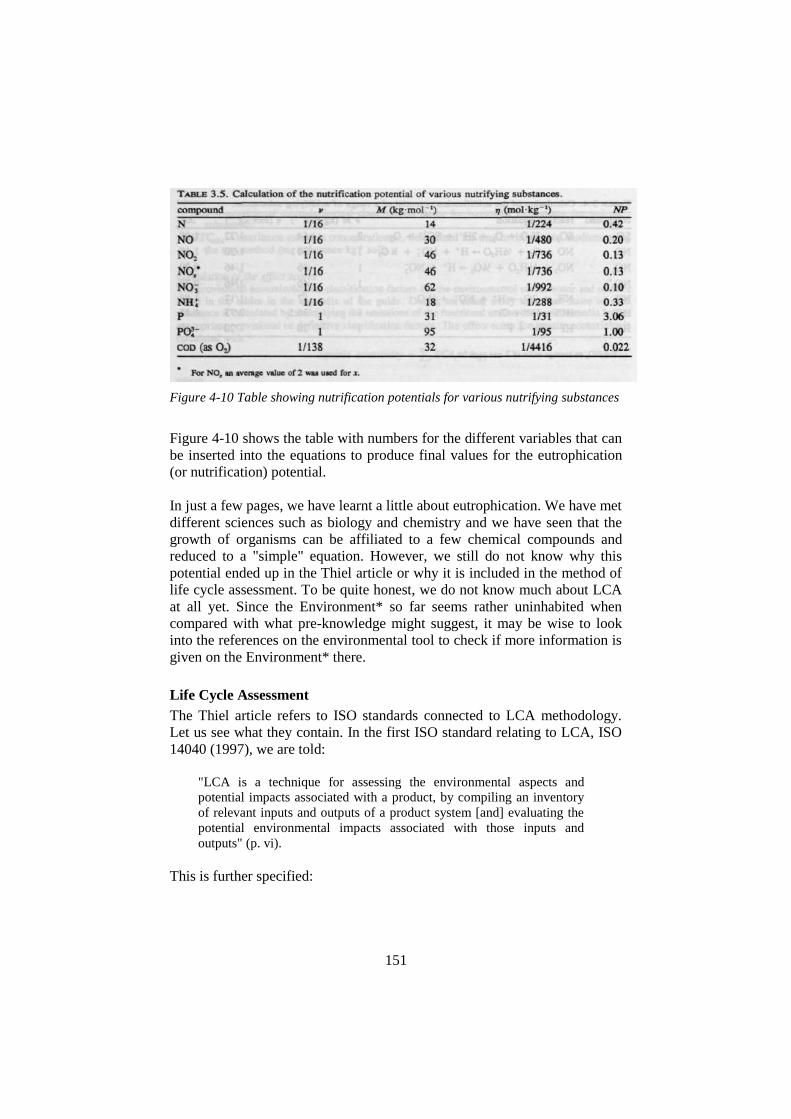
151
Figure 4-10 Table showing nutrification potentials for various nutrifying substances
Figure 4-10 shows the table with numbers for the different variables that can
be inserted into the equations to produce final values for the eutrophication
(or nutrification) potential.
In just a few pages, we have learnt a little about eutrophication. We have met
different sciences such as biology and chemistry and we have seen that the
growth of organisms can be affiliated to a few chemical compounds and
reduced to a "simple" equation. However, we still do not know why this
potential ended up in the Thiel article or why it is included in the method of
life cycle assessment. To be quite honest, we do not know much about LCA
at all yet. Since the Environment* so far seems rather uninhabited when
compared with what pre-knowledge might suggest, it may be wise to look
into the references on the environmental tool to check if more information is
given on the Environment* there.
Life Cycle Assessment
The Thiel article refers to ISO standards connected to LCA methodology.
Let us see what they contain. In the first ISO standard relating to LCA, ISO
14040 (1997), we are told:
"LCA is a technique for assessing the environmental aspects and
potential impacts associated with a product, by compiling an inventory
of relevant inputs and outputs of a product system [and] evaluating the
potential environmental impacts associated with those inputs and
outputs" (p. vi).
This is further specified:

152
"LCA studies the environmental aspects and potential impacts
throughout a product's life (i.e. cradle-to-grave) from raw material
acquisition through production, use and disposal. The general categories
of environmental impacts needing consideration include resource use,
human health, and ecological consequences" (p. vi).
We now know that the term 'life cycle' is referring to 'all the steps a product
is involved in' and we also know that there are general environmental
categories, but no information is given in the standard about what these
general categories specifically encompass or how they can be measured.
There is reason to believe that the three impact categories we met in the
Thiel article are part of the "ecological consequences" category, but a
warning is given a few lines below in the standard:
"Results of LCA studies focused on global and regional issues may not
be appropriate for local applications, i.e. local conditions might not be
adequately represented by regional or global conditions" (p. viii).
Whether this is the case for the impact potentials we met in the Thiel article
is not specified, but the authors did not specify any localities, so it might be
reasonable to assume that the categories represent a regional or global
dimension. Nevertheless, we would appear to need more information about
global warming, acidification and eutrophication in order to make any
certain statements in this respect.
"LCA studies should systematically and adequately address the
environmental aspects of product systems, from raw material
acquisition to final disposal" (p.2)
Since the Thiel article is based on a study carried out in accordance with ISO
14040, we must presume that the categories given in the article are adequate
for capturing the important environmental impacts. Figure 4-11 below shows
the different phases of an LCA. Arrows going in both directions are
illustrating that the method is iterative and the researcher (the one compiling
the LCA study) is expected to go back and forth between the different steps.

153
Figure 4-11 phases of an LCA (adapted from ISO 1998)
The diagram also makes it clearer why the Thiel article has been structured
in its particular format with, for example, the names of the phases being used
as headings in the article. The standard continues with descriptions of the
specifics of the different phases and the word "environment" is included
when you reach the chapter on impact assessment:
"The methodological and scientific framework for impact assessment is
still being developed. Models for impact categories are in different
stages of development. There are no generally accepted methodologies
for consistently and accurately associating inventory data with specific
potential environmental impacts." (p. 5).
The standard explicitly states that the science is not "finished", and that we
still need to wait for more accurate models of how the environment is
affected by products' life cycles.
Perhaps more information about the environmental categories will be given
in the other ISO reference, namely the ISO 14041 standard (ISO 1998).
However, our expectations are lowered as soon as we start reading:
"This International Standard [ISO14041] in addition to ISO 14040
specifies the requirements and the procedures necessary for the
compilation and preparation of the definition of goal and scope for a
Life Cycle Assessment (LCA), and for performing, interpreting and
reporting a Life Cycle Inventory analysis (LCI)" (p.1).

154
The standard goes on to specify the steps necessary for creating an inventory
– how to collect data, allocation procedures (i.e. how to share impacts
between different outputs of a process), examples of data sheets etc. ISO
14041 gives no more information on environmental impacts. It does not tell
us what data to collect, what substances to follow. However, the detailed
specification of how to compile data adds credibility to the methodology.
The standard itself, the procedures it contains and the examples it gives on
datasheets are important actors in stabilising the "LCA actor-network."
4.1.2 The actor-network after the first round
After a search through the first tier of references (i.e. those directly linked to
the article), our understanding of the Environment* and how it has come into
being has not improved significantly. In fact, the environment appears to
mostly be made up of equations, procedures and a few chemicals. Still, we
have begun to appreciate that several sciences are involved and probably
other spheres of activities as well, such as standardisation bodies and
politics. Whether or not these are a part of science is open for debate, but in
depicting the actor-network creating the Environment*, all the actors
participating in stabilising truths count.
Apologies if this has bored you, either because you found the wording and
the equations from the articles unnecessarily cumbersome or because you are
all too familiar with the issues and regard it as trivial basic knowledge.
Whatever the case may be, the quotes serve two main functions. The first is
to show the outcomes of strings of translations, e.g. how the Greenhouse
Warming Potential has been created by transforming nature and political
decision-making into a single equation. The second function is presenting
the technical language to display how a scientific language has been created
to capture processes in nature. The number of words unfamiliar to an
average reader indicates that there is a lot of work behind the creation of the
Environment*.
What actors does the Thiel article depict so far? From the beginning (i.e. the
Thiel article itself), we had emissions of CO2, CO, NOx and SO2, we had
Global Warming Potential, acidification potential and eutrophication
potential, we had ISO and LCA, we had aluminium production, lightweight
structures and recycling. Several new actors have been added after the first
round: infrared radiation, IPCC, atmospheric lifetimes of chemical
components, absorption capacities of chemicals, political decision-makers,
chemical equations, an average algae, the atmosphere, water, soil, data
collection procedures and a framework for conducting LCAs.

155
Figure 4-12 below is an initial drawing of what might be considered the
actor-network of the Thiel article with its references.
Figure 4-12 The actor-network, including the article and its references
The relative size of the boxes in the diagram is of no importance, all the
boxes were just made small enough to fit in the diagram, but large enough to
provide meaningful text. The circle indicates the jump between the actors
appearing in the article and actors that have been included through the
references. Boxes with dotted lines include actors that appear in the article,
but which have yet to be explored. The whole diagram appears a little
complex, but the Environment* seems to be missing. There are no or at least
very few references to nature as we normally think of it, with its biological
and physical resources. Nevertheless, there are already a substantial number
of actors and links between them, indicating that there are connections to
stabilise the actor-network and hence the truth of the claims in the Thiel
article. We could have returned to the Thiel article to create solid lines in the
dotted lined boxes, that is to capture information on those concepts that are
introduced in the diagram but not yet discussed in the text. However, I want
Thiel
article
Chemical
equations
Political decision-
makers
Atmospheric
lifetimes
IPCC
repor
t
IR
Recy-
cling Light-
weight
Al
prod.
LCA ISO
14040
EP
AP
GWP
SO2
NOx
CO
CO2
Average
algae The
atmosphere
Water
Soil
Absorption
capacity IPCC
Heijungs
report
ISO
ISO
14041
Data collection
procedures
Framework for
conducting LCA

156
to check if the content of the impact categories can produce a picture of the
Environment*. In other words, there is a need to move outside the first tier
of references to see if we can find out what global warming, acidification
and eutrophication really are and why they are deemed important enough to
feature in the Thiel article.
4.2 The Environment* behind the equations
How can I even claim that the Thiel article has anything to do with the
Environment* in the first place? The word "environment" is not mentioned
in the title and the fact that the authors take the connection between life
cycle assessment and the environment for granted does not make it a truth. I
had prior knowledge of the LCA method and I knew it to be a widely
accepted environmental assessment tool - thus I reacted to the title of the
article. So here, in the second round, I will provide evidence for LCA being
connected to the environment and for being connected to the automotive
industry. The content of the three impact categories from the Thiel article
will be scrutinised, as they should consist of the environment coupled to
bumpers (i.e. the Environment*).
4.2.1 Second round: digging deeper into the environmental issues
It may seem rather confusing that I appear to be omniscient in this second
round, given my ignorance in the preceding chapter. The reason is simply
that, at first, I wanted to give you the feeling of the "black boxes", to show
that the articles on environmental issues are packed with taken-for-granted
truths. To reveal what the boxes actually contain demands a lot of work and
extensive knowledge on a range of different subjects. If, however, this whole
chapter is to be able to give a description of the Environment* at different
times, I will have to speed up and jump from source to source without a
thorough account of every connection that exists between them.105
Publications printed after the year 2000 are only used if pointing to texts
before the year 2000, as climate change will eventually come back into play
towards the end of the chapter and because publications after the Thiel
article cannot possibly have led to its initial stabilisation.
105
However, I can assure the reader that all the articles presented in this round are
somehow connected, either by referencing or being referenced by the Thiel article,
one of its references or one of its references‟ references.

157
Global warming (or rather climate change) extended
The book employed in the previous round (Houghton et al 1994) has 339
pages with numerous references, tables, graphs, equations, maps and words
describing the scientific working of the climate system and the relation
between the climate system and atmospheric gases. However, it does not
contain information on other aspects of nature or the consequences that may
arise from changes in the composition of the atmosphere (i.e. the predicted
direct effect of increased temperature). Fortunately, the passage in the IPCC
book from 1994 on Global Warming Potential refers to another IPCC book
from 1990 (IPCC 1990) with a broader scope. There we learn that the
climate of the earth is determined by both natural and human factors. The
most significant natural factor is the greenhouse effect. This refers to the
mechanism whereby short-wave solar radiation passes through the
atmosphere and heats the earth. The warm surface of the earth emits long-
wave radiation and this is partially absorbed and re-emitted by gases in the
atmosphere. There is no reason to doubt this, as the report clearly states:
"The greenhouse effect is real; it is a well understood effect, based on
established scientific principles" (ibid. p. xiv). Figure 4-13 below shows an
energy balance for the incoming solar radiation and the radiation emitted
from earth.
Figure 4-13 The greenhouse effect and the energy balance (Trenberth et al 1996)
The earth is a greenhouse, although the walls and the roof are made of gases,
not glass. Gases that let the solar rays in, but do not allow heat to escape.
Repeatedly we are told that without this effect, life on earth could not be

158
sustained. What should worry us is the enhanced greenhouse effect, the
building of stronger walls and roof from anthropogenic sources, that traps
more and more heat inside.
It seems that the greenhouse effect has been there since time immemorial,
but for how long has the enhanced greenhouse effect, the global warming
caused by anthropogenic sources, existed? There are good reasons for stating
that global warming became fact in 1988. In that year, Jim Hansen stated
before the US government that: "It's time to stop waffling, and say that the
evidence is pretty strong that the greenhouse effect is here" (Hansen 1988).
It was also the year that the Intergovernmental Panel on Climate Change
(IPCC) was established in a joint effort by the World Meteorological
Organization (WMO) and the United Nations Environment Programme
(UNEP). Lastly, it is the year that Spencer Weart uses to separate the more
random approaches from the systematic building of a scientific project in the
history of climate change.106
This is not to make you believe that climate change due to human activities
is entirely attributable to one individual and a large organisation. There are
also other contributory factors, with actual temperature, actual emissions and
computer models being among the most important.
"Attention has focused throughout the world on projected climatic
change because of fears of potentially far-reaching consequences of a
drastic warming and associated sea level rise. This threat has been
associated primarily with the developed countries' heavy use of fossil
fuels whose burning releases carbon dioxide, a greenhouse gas which
spreads quite evenly in the global atmosphere. The 1980s were for
whatever reasons an unusually warm decade, following a cooler period
that had culminated in the early 1970s, stimulating many assertions that
anthropogenic global warming was now evident.
From 1970 to the early 1990s, world fossil fuel-related emissions of
CO2 grew by 50 percent, about as much as population, so that per capita
emissions have remained level. Meticulous measurements document a
worldwide rise in atmospheric CO2 of about 10 percent in the same
period, and concentrations will continue to rise even if emissions flatten,
because of the time required for the land and sea to absorb carbon."
(Ausubel et al 1995).
Although much of the science had already been produced prior to 1980, it
had not created a stable actor-network with the single idea that human beings
affect the weather and the temperature of the globe through emissions of
106
The work by Weart (2007) has been useful for finding references and obtaining
an overview of climate change science.

159
CO2. Weart (2007) states that there was no great momentum behind the idea
up to and even during the 1970s:
"Few scientists [were] centrally concerned with CO2 as an agent of
future global warming. They addressed the gas as simply one
component in their study of biological, oceanographic or meteorological
systems (Hart & Victor 1993). Most stuck with the old assumption that
the Earth's geochemistry was dominated by stable mineral processes,
operation on a planetary scale over millions of years. People did not
easily grasp how sensitive the Earth's atmosphere was to biological
forces – the totality of the planet's living activity – to say nothing of the
small fraction of that activity affected by humanity"
That several scientists involved in climatic research doubted human
influence in the 1970s is accentuated by the writings of several
commentators:
"To date on the hemispheric and global scales, a "signal" of man-made
climatic change has not yet been separated from the "noise" of natural
climatic variations"(Landsberg 1970).
With a graph showing temperatures compared to one showing annual
precipitation for Philadelphia in the years between 1738 and 1967,
Landsberg claimed that randomness was the case. Two years later, Lowry
(1972) expanded Landsberg's arguments while leaving room for humans to
affect the climate in the longer term:
"These [climate] models and discussion, though incomplete, provide
grounds for three important conclusions: (1) Single-factor reasoning
about global effects of air pollution on climate is usually misleading. (2)
Natural variations in basic climatic parameters and natural
concentrations of certain air pollutants are distinctly greater than those
attributed to man's activities (Bryson & Wendland 1970; Landsberg
1970; Mitchell 1970; Robinson 1970). (3) Important changes in global
climate may be related to effects of air pollutants on mid-latitude
storminess. These changes are not related to such measures as the mean
temperature of the earth's surface. At present it appears that our
knowledge of the complex earth-atmosphere system and of the values of
critical parameters is so scant as to make any definitive statements about
the climatic effects of air pollution impossible for at least a decade
hence. None the less, we should not overlook the strong possibility that
man's less-than-global, but more importantly non-random activities,
such as urbanization and concentrated industrialization, may have
greater longterm effects-because of their non-randomness-than do
nature's larger, but random, variations"

160
Finally, Mason (1976) stated:
"The climatic system is so robust… that man has still a long way to go
before his influence becomes great enough to cause serious disruption."
Of course, such statements were not made in a vacuum. They would never
have been made if there were not already a concern that the climate was
indeed changing and that man was involved. Svante Arrhenius (1896) first
proposed the idea that an increase in carbon dioxide in the atmosphere could
lead to global warming, but more from an interest in what was causing ice
ages than a concern that human beings could seriously alter the environment.
The idea was not taken up again before Callendar (1938) published an article
containing a graph that showed how the earth had become warmer between
1880 and 1930 – a period in which the CO2 level in the atmosphere was also
increasing. The graph is shown in Figure 4-14. Although Callendar's work
was acknowledged, most scientists believed that natural variations were the
issue and that nature's ability to handle increased levels of CO2 in the
atmosphere was great enough to cancel out any human-induced temperature
rise (Weart 2007).
Figure 4-14 Callendar's graph of increasing temperatures and CO2 levels
Callendar's work did not lead to a great revival for Arrhenius' theory, but
during the decades between 1940 and the late 1990s, several discoveries
were made, measuring equipment was manufactured, sciences were coupled
and hypotheses tested. For instance, laboratory studies showed that the
absorption spectra of water and carbon dioxide were not overlapping in the
atmosphere, although they are on the ground. Then there were drilling
techniques, the use of the isotope Carbon 14 to track CO2 in the atmosphere,

161
expeditions to remote places and measurement techniques for temperature at
earlier ages. These elements were brought together in a graph presented by
Barnola et al (1987) as shown in Figure 4-15.
Figure 4-15 Relationship between CO2 concentrations and temperature (Barnola et
al 1987)
The upper curve shows CO2 concentrations in parts per million, while the
lower curve is a reconstruction of atmospheric temperature from
measurements of the isotope deuterium. The X-axis is Age given in
thousands of years before the present day (BP) (with the present day at the
far left). This graph was also important in establishing climate change as a
real issue in 1988, as its visual effect makes the connection between
temperature and CO2 levels so apparent. The time scale and the "hard"
science behind the graph reinforced the "real" nature of the issue.
Thus, it all began with rather simple measurements with simple
technologies. Such measurements and technologies were still important in

162
the IPCC publication (1990) and gathering them in a disciplined way was
still proving challenging:
"Changes in [weather] station environment can seriously affect
temperature records (Salinger 1981). Over the years, stations often have
minor (usually under 10 km) relocations and some stations have been
moved from rooftop to ground level. Even today, international practice
allows for a variation of thermometer heights above ground from 1.25 to
2 metres. Because large vertical temperature gradients exist near the
ground, such changes could seriously affect thermometer records…[A
bias] on the large scan can emerge when the character of the changes is
not random. An example is the systematic relocations of some
observing stations from inside cities in many countries to more rural
airport locations that occurred several decades ago. Because of the heat
island effect within cities, such moves tend to introduce artificial
cooling into the climate record. Jones et al.(1986) attempt in some detail
to adjust for station relocations when these appear to have introduced a
significant bias in the data but Hansen and Lebedeff (1987) do
not…[All] depend on denser network of stations than are usually
available except in the USA, Europe, the Western Soviet Union and a
few other areas" (Folland et al 1990).
It is vital to get the techniques under control, for example having the
thermometers at the right elevation without systematic flaws, as the global
warming effect cannot be seen in one single place. I am not speaking of the
effect of global warming but global warming as an effect itself. Whilst every
single weather station in the world may show random results, it is when the
results of all these weather stations are put together (i.e. temperature
measurements from all the weather stations) that a global temperature
increase can be observed. However, such simple technologies and
measurements have also been coupled with complex computer models that
try to capture different processes on earth (and their interactions) in order to
predict future climate changes. Figure 4-16 shows an example of variables
included in such a simple model.

163
Figure 4-16 Parameters in a simple model of the climate (Houghton 1984)
Some of the different processes involved in determining the climate and the
interactions between them are depicted here. The thickness of the arrows
indicates the strength of the interactions. Even this simple diagram reveals
many of the interconnections between different entities on Earth and in the
atmosphere, and the environment seems much closer. When we understand
that these processes are also connected to grid maps of the actual Earth (or at
least representations of it), the environment comes even closer:
"General circulation models are based on the physical conservation laws
which describe the redistribution of momentum, heat and water vapour
by atmospheric motions. All of these processes are formulated in
"primitive" equations, which describe the behaviour of a fluid (air or
water) on a rotating body (the Earth) under the influence of a
differential heating (the temperature contrast between equator and pole)

164
caused by an external heat source (the Sun). These governing equations
are non-linear partial differential equations, whose solution cannot be
obtained except by numerical methods. These numerical methods
subdivide the atmosphere vertically into discrete layers, wherein the
variables are "carried" and computed. For each layer the horizontal
variations of the predicted quantities are determined either at discrete
grid points over the Earth, as in grid point (finite difference models), or
by a finite number of prescribed mathematical functions as in spectral
models. The horizontal resolution of a typical atmospheric model used
for climate studies is illustrated by its representation of land and sea
shown in Figure 3.4." (Cubasch & Cess 1990, p. 84)
Here, nature really becomes visible. The rotating Earth with its cold pole and
hot equator and the Sun are described, although merely in order to be
translated into equations suitable for modelling. Figure 3.4 from the book is
reproduced below in Figure 4-17.
Figure 4-17 This is Figure 3.4. from (Cubasch & Cess 1990: 84): the model land-
sea mask for a typical climate model.
The diagram looks familiar. It immediately creates associations with world
maps and gives the impression that the modellers can actually tell us
something about the Earth. However, as with the issue of achieving scientific
discipline in temperature measurements, there are a few problems with the
computer models:
"Unfortunately, even though this is crucial for climate change
prediction, only a few models linking all the main components of the

165
climate system in a comprehensive way have been developed. This is
mainly due to a lack of computer resources, since a coupled system has
to take the different timescales of the sub-system into account, but also
the task requires interdisciplinary cooperation.
An atmospheric circulation model on its own can be integrated on
currently available computers for several model decades to give
estimates of the variability about its equilibrium response; when
coupled to a global ocean model (which needs millennia to reach an
equilibrium) the demands on computer time are increased by several
orders of magnitude. The inclusion of additional sub-systems and a
refinement of resolution needed to make regional predictions demands
computer speeds several orders of magnitude faster than is available on
current machines" (Cubasch & Cess 1990: 89).
The computer models are used to predict future temperature changes, as well
as other changes on Earth (depending on which variables are held constant).
However, even though the IPCC report (1990) is broader in scope than the
publication from 1994 (Houghton et al, 1994), the emphasis is on
geophysical changes such as temperature rise, sea level rise and the melting
of ice and snow. The same picture is drawn in an LCA related publication
from 2005:
"The possible consequences of the greenhouse effect include an increase
of the temperature level leading to increased temperatures in the oceans
and melting of the polar ice caps and glaciers in mountain areas,
resulting in elevated sea levels. The increasing temperature level may
also result in regional climate changes". (Stranddorf et al 2005)
The same question as posed in the 1970s is worth repeating: "Does this give
any reason for concern?" There is a short text devoted to effects on
ecosystems in the IPCC report from 1990, but the conclusions are vague,
with wording that indicates a high degree of uncertainty. It gives no clear-cut
answers as to whether climate change would affect ecosystems positively or
negatively (Melillo et al 1990). In the updated reports from 1995, we meet
the same uncertainties regarding effects on ecosystems, but we are also faced
with other direct and indirect consequences for human beings due to
increases in CO2, temperature and sea level (Watson et al 1995):
"A number of studies have evaluated sensitivity to a 1m sea level rise.
This increase is at the top of the range of IPCC Working Group I
estimates for 2100; it should be noted, however, that sea level is actually
projected to continue to rise beyond 2100. Studies using this 1m
projection show a particular risk for small islands and deltas. Estimated
land losses range from 0.05% for Uruguay, 1% for Egypt, 6% for the
Netherlands and 17.5% for Bangladesh to about 80% for the Majuro
Atoll in the Marshall Islands, given the present state of protection

166
systems. Large numbers of people also are affected; for example, about
70 million each in China and Bangladesh. Many nations face lost capital
value in excess of 10% of their gross domestic product (GDP).
Although annual protection costs for many nations are relatively modest
(about 0.1% of GDP), the average annual costs to many small island
states total several percent of GDP. For some island nations, the high
cost of providing storm surge protection would make it essentially
infeasible, especially given the limited availability of capital for
investment" (Watson et al 1995, p. viii)
If the prospect of a rising sea does not scare you, there are other health-
related effects that may:
"Climate change is likely to have wide-ranging and mostly adverse
impacts on human health, with significant loss of life. These impacts
would arise by both direct and indirect pathways (Figure 3) and it is
likely that the indirect impacts would, in the longer term, predominate.
Direct health effects include increases in (predominantly cardio
respiratory) mortality and illness due to an anticipated increase in the
intensity and duration of heat waves. Temperature increases in colder
regions should result in fewer cold related deaths. An increase in
extreme weather would cause a higher incidence of death, injury,
psychological disorders and exposure to contaminated water supplies.
Indirect effects of climate change include increases in the potential
transmission of vector borne infectious diseases (e.g., malaria, dengue,
yellow fever and some viral encephalitis) resulting from extensions of
the geographical range and season for vector organisms. Projections by
models (that entail necessary simplifying assumptions) indicate that the
geographical zone of potential malaria transmission in response to
world temperature increases at the upper part of the IPCC projected
range (3-5°C by 2100) would increase from approximately 45% of the
world population to approximately 60% by the latter half of the next
century. This could lead to potential increases in malaria incidence (on
the order of 50-80 million additional annual cases, relative to an
assumed global background total of 500 million cases), primarily in
tropical, subtropical and less well protected temperate zone populations.
Some increases in non-vector borne infectious diseases - such as
salmonellosis, cholera and giardiasis - also could occur as a result of
elevated temperatures and increased flooding.
Additional indirect effects include respiratory and allergic disorders due
to climate enhanced increases in some air pollutants, pollens and mold
spores. Exposure to air pollution and stressful weather events combine
to increase the likelihood of morbidity and mortality. Some regions
could experience a decline in nutritional status as a result of adverse

167
impacts on food and fisheries productivity. Limitations on freshwater
supplies also will have human health consequences" (Watson et al 1995,
p. 10).
Finally we see good reasons for caring about climate change and why it is
included in the Thiel article. With such devastating consequences and with
CO2 as a main contributor, cars should really be made lighter.
We have now encountered the entire Earth, made up of numerous locations
for temperature measurements, and can see that it is a place that gets
warmer. We have met ocean currents, glaciers, snowcaps, several large
organisations with thousands of scientists, plant species, diseases, deaths
from heat waves and decreases in cold-related deaths
Acidification
In the first round, we learnt that acidification could be translated and reduced
into a single equation, explaining the potential of different chemical
compounds to create a lower pH in deposits into water and soil, measured in
the amount of protons (H+). The only reference found in Heijungs et al.
(1992) was to a Dutch text book by Vermeire (1992), a text book that I was
unable to get hold of and that would probably have told me very little,
considering my rather limited knowledge of the Dutch language. We must
move elsewhere to see if we can find out what acidification really is.
An article by Gorham (1998) gives an overview of research on acidification
and guides the search for the actors that make up the acidification actor-
network. He writes:
"Research on acid deposition can be traced to the mid-19
th century, but
has expanded greatly in the last 50 yr, focussing in particular upon the
effects on ecosystems of acid deposition caused by the combustion of
fossil fuels. Observational studies first associated such acidification
with its chemical and biological effects. They were supplemented in
1976 by experimental acidification of a whole lake. By 1980,
paleological techniques were employed to investigate past histories of
acidification. In the 1980s, critical loads were calculated to measure
how much acid deposition could be tolerated by aquatic ecosystems.
Reductions in emissions of sulphur dioxide, as well as experimental
studies in the mid-1980s, allowed investigations of recovery from
acidification…in the mid-1990s, it has become apparent that acid
deposition interacts with other environmental stresses such as climate
warming and ozone depletion." (p. 153)
This provides us with a short history of development of acidification through
science, but it does not state what effects acid deposition may have. Let us
168
see if we can understand more about acidification by looking at what an
LCA reference tells us about the problem:
"Acidification is a local and regional effect…[In] the terrestrial
ecosystem the effects are seen in softwood forests (e.g. spruce) but also
in hardwood forests (e.g. beech) as inefficient growth and as a final
consequence dieback of the forest. These effects are mainly seen in
Scandinavia and in the middle/eastern part of Europe. In the aquatic
ecosystem the effects are seen as clear acid lakes without any wildlife.
These effects are mainly seen in Scandinavia. Buildings, constructions,
sculptures and other objects worthy of preservation are also damaged by
e.g. acid rain" (Stranddorf et al 2005).
Different trees are mentioned in this reference, together with lakes and
buildings. Moving to another reference, the geography becomes even more
specific (Colvile et al 2001, p. 1542):
"In the 1970s, it was suddenly noticed that trees were apparently dying
en masse in the highly polluted "Black Triangle" of East Germany, the
Czech Republic and Poland (Bach 1985; Kandler & Innes 1995; Ulrich
1990) and number of dead fish floated to the surface of Swedish rivers
and lakes (Borg 1986) as well as in similar North American
environments (Driscoll et al 1980)". (Colvile et al. p. 1542)
Countries are specified and the presence of a number of dead fish makes
acidification more frightening and more real than just "a clear acid lake
without any wildlife". During the 1970s and early 1980s, a range of articles
by Scandinavian researchers (e.g Bell 1981; Nicholson 1978; Nordo 1976;
Wright & Henriksen 1978) were devoted to the detrimental effects of
acidification on water bodies, especially the death of fish - with trout and
salmon being among the researched species . Linthurst et al (1986) state that
statistically reliable estimates of the regional effects of acidification on
ecosystems have been gathered for lakes in the United States. Although
some of these researchers also studied effects on forest vegetation (e.g.
Abrahamsen et al 1977), it was hard to find evidence of effects on terrestrial
ecosystems, i.e. effects from deposits on soil. This is emphasised by Evans
(1982):
"No general conclusions can be drawn about the effects of current levels
of precipitation acidity on plant pathogen-host interactions under field
conditions. Few experiments have been aimed at determining the
impacts of acidic precipitation on crop and forest yields. Most of these
studies are inadequate because they are not conducted in nature with
adequate randomization of treatments coupled with vigorous statistical
analyses. From the above information, it must be concluded that
research on the effects of acidity in precipitation on terrestrial

169
vegetation is too meager to draw definitive conclusions about the effects
of ambient and/or anticipated levels of acidity"
The way to find out if water or soil is acid is through various techniques for
measuring pH (Marinenko & Koch 1984). Such studies range far back in
time - for example, in 1920, Wherry discusses how acidity in the soil can be
measured and lays out several methods for establishing the pH of soil
(Wherry 1920). Figure 4-18 shows the indicators he found useful.
Figure 4-18 Chart showing different indicators for measuring pH in soil
By using chemical substances that react and change colour according to the
amount of H+ ions, it is possible to translate the condition of the soil first
into a colour and then into a single number. Such techniques are still
employed, although automatic monitoring of pH was introduced in the late
1960s (Henriksen & Selmerol 1970).
From the late 1970s, computer modelling became more and more
widespread in relation to acidification, used to predict future scenarios and to
keep track of the data that had been gathered. Henriksen (1980) made an
empirical titration model based on regional water-chemistry data for more
than 700 lakes in Norway, followed by the Birkenes model (Christophersen
& Wright 1981) that included both hydrology and chemistry. During the
1980s, models also began to track the emissions of acidifying substances,
170
with the RAINS model being one of the more important (Alcamo et al 1987;
Alcamo et al 1990; Galperin et al 1995).107
The first editions of the model
emphasised "the transboundary aspects of the acidification
problem…[Linked] submodels are available for SO2 emission, costs of
control strategies, atmospheric transport of sulphur, forest soil and
groundwater acidity, lake acidification, and the direct impact of SO2 on
forests" (Alcamo et al 1987). As the citation shows, the model also included
the costs of control strategies. Thus, acidification is also included in other
activities and, according to Alm (1997), scientists were also leading the
political agenda:
"Scientists were the first to define acid rain as an environmental
problem, and they set the context in which the debate took place
(Cowling 1982, 115A). In fact, the acid rain issue came into prominence
only because scientists and researchers kept telling the world of the
potential devastating effects of acid rain (Schmandt & Roderick 1985)"
One of the inventions of scientists involved in deposition of sulphur and
nitrogen oxides was the definition of a "critical load." According to Lidskog
and Sundquist "Canadian scientists introduced the concept of critical loads
in 1974 and subsequently this was developed further by Scandinavian
scientists." The most widely cited definition comes from Nilsson and
Grennfelt (1988), which says that critical load is "[a] quantitative estimate of
exposure to one or more pollutant below which significant harmful effects
on specified sensitive element of the environment do not occur according to
present knowledge"(Nilsson & Grennfelt 1988). Critical loads became a tool
for scientists studying different regions, as well as for politicians trying to
enforce regulation. Combining these efforts with the previously mentioned
models leads to the production of critical load maps of different regions, as
shown in Figure 4-19.
107
RAINS is an abbreviation for ‟Regional Air Pollution INformation and
Simulation‟

171
Figure 4-19 Map of exceedance of critical loads in Europe (from Slanina 2006)
The map shows how the environment is almost captured in terms of both the
totality and the specific sites. However, the grid size is too large for the
actual rivers, trees and fish to make their presence felt.
Several articles (Ausubel et al 1995; Colvile et al 2001; Heinen & Low
1992; Likens et al 1972) mention emissions from automobiles as a source of
NOx leading to acidification. That may explain why acidification ended up in
the Thiel article in the first place.
Finally, acidification can also be linked with other environmental issues:
"It has recently become apparent that acid deposition interacts with
other environmental stresses to damage ecosystems. One interesting
example is the penetration of biologically harmful ultraviolet radiation
into lakes and streams. Two research groups have shown such
penetration to be enhanced not only by depletion of stratospheric ozone
but also through reducing concentrations of dissolved organic matter

172
that absorbs such radiation, by acid deposition and the climatic warming
observed in Ontario in recent decades" (Gorham 1998, p. 160). 108
Acidification is suddenly connected to climate change, not only through
LCA but also even more directly as they "work" together to increase the
damage from ozone depletion. We meet climate change again and we also
meet water bodies, a number of fish, trees, pH measurements, critical loads
and even automobiles.
Eutrophication
When starting to nest backwards to find the actors in the eutrophication
actor-network, it soon became evident that the world is not organised
according to the LCA impact categories. In fact, researchers often treat
acidification and eutrophication simultaneously, which is not really all that
strange, considering that they are both coupled to local and regional impacts,
both affect soil and water, and both have NOx as an active gas (Bouwman et
al 2002; Kuylenstierna et al 1998; Posch et al 2001; Zak & Beven 1999).
Hence, many of the actors acting to stabilise the acidification actor-network
are also acting on behalf of eutrophication, such as critical loads (Nilsson &
Grennfelt 1988), the RAINS model (Alcamo et al 1987) and NOx itself.
However, acidification and eutrophication part company when it comes to
impacts. Whereas the former creates clear water bodies, the latter creates
excess growth and fish struggle as the oxygen level in the water becomes too
low. These effects have been recognised and observed for a long time
(Hasler 1947; Lindeman 1942). The terrestrial effects (i.e. on soil and not in
water) of eutrophication are harder to measure, after all few deaths are
observed. Instead there is a problem of loss of diversity, as some plants are
given better conditions for growth.109
To capture differences between plants and between ecosystems, Grennfelt
and Thörnlöf (1992) use the concept of "limiting nutrient". A concept that
goes far back in time and is often referred to as Liebig's Law of the
108
Gorham (1998) also makes a comforting remark for anyone who is struggling to
trace the actor-networks of environmental problems: "Another lesson to be learned
is that scientists (including this author) often do not take the time to search
adequately the earlier research literature, so that they „discover‟, time and again,
what is already known. Exponential increase in the number of scientific articles
published each year makes such a search ever more difficult, despite the availability
of computerized techniques." 109
The LCA guide from Leiden (Heijungs et al, 1992) also has a category for
biodiversity and, if eutrophication is also to be associated with the species that
survive, it becomes hard to keep the categories separated.

173
Minimum (Liebig 1840). It says that the total of resources available does not
control growth, but rather it is the scarcest resource that will do so. The
concept of limiting nutrient makes sense; it is almost intuitive. If I am dying
from thirst, more biscuits or a new car won't help me. However, there may
be problems associated with this concept. In the words of Finnveden and
Potting (1999):
"The concept of "the limiting nutrient", however, is a simplification and
can be misleading. Examples of complications are that the limiting
nutrient may change over seasons. The limiting nutrient may also
change over the years, for example as an effect of earlier loadings. The
balance between different nutrients is also of importance. Since
different species have different nutrient requirements, different species
may be limited by different nutrients. A change in the balance between
nutrients may therefore lead to a shift in species composition. Another
important aspect is the possibility of the transportation of nutrients from
one ecosystem to another one. Thus, even if a nutrient is emitted to an
ecosystem where it has no impact, it may be transported to another
ecosystem where it can have an impact. It might therefore be that the
contribution for an emission to eutrophication is always larger than
zero" (pp. 311-312).
Just when the world had been made simple and understandable, we are told
that there are complicating factors. We can no longer be sure whether
emissions associated with eutrophication will have an impact or, if they do,
where or when this impact will take place.
Such aspects make it difficult to understand what eutrophication really
means, a difficulty that is emphasised by Finnveden and Potting (1999):
"Eutrophication is a difficult impact category for several reasons.
Substances that may cause the impact can be emitted to both air and
water. Impacts can occur in many different types of terrestrial and
aquatic systems. The fate processes are site dependent as are the
impacts. The fate processes depend on different characteristics of the
emitting source, environmental media, and receiving environments. The
impacts depend on background loads and different sensitivities of
different ecosystems. As discussed below, different nutrients may limit
the growth in different ecosystems. Another complicating factor is that
some impacts, e.g. increased growth, in some cases may be regarded as
a positive impact rather than a negative one." (p. 311).
Perhaps the transition from speaking of acidification and eutrophication to
focussing solely on NOx emissions would make this simpler. We no longer
need to worry about the actual end points and eventual effects; instead, we
can concentrate on the source of emissions.

174
LCA
Before examining the details of LCA, it's time for a short detour to
demonstrate that the use of LCA on car parts is actually performed and
presented by authors other than Thiel and Jenssen. In the same year (i.e.
2000), Saur et al. published an article on LCA for different materials for
fenders. By looking at this article, we may perhaps also be able to see
whether or not the conclusions in the Thiel article are only based on biased
researchers, that is, on the fact that these researchers want to promote the use
of aluminium. Examining the article by Saur et al. (2000) reveals that this
may indeed be the case. In the latter article, the authors examine 5 different
materials for fenders - three injection-moulded polymer blends, as well as
steel and aluminium. The article looks at 12 different environmental impact
categories:
1. Energy use [MJ]
2. Resource use [scarcity units]
3. Water use [m3]
4. Global Warming Potential (GWP, [GHG-eq])
5. Ozone Depletion Potential (ODP, [CFC-eq])
6. Acidification Potential (AP, [SO2-eq])
7. Eutrophication Potential (EP, [phosphate-eq])
8. Photochemical Ozone Creation Potential (POCP, [ethene-eq])
9. Human toxicity, air (Htox air, [Htx-eq])
10. Human toxicity, water (Htox water, [Htx-eq])
11. Ecological toxicity (Eco tox, [ETX-eq])
12. Waste [t]
Suddenly potential impacts to the environment are multiplied. We are no
longer faced with only three categories (although the word 'only' may be an
understatement, as we have seen that these three are fairly complex
categories) – now we have four times as many. Even though the article by
Saur et al (2000) makes connections to a "total" environment - to all possible
environmental effects inflicted by the different material choices and the
production, use and end-of-life stages - it is still the climate change category
that is emphasised. The other categories seem to be included just to show
that they have been calculated.
What about the results? Aluminium is worse than steel in all but four
categories. That even includes the global warming potential. We may have
experienced a fraud. The Thiel article seemed to have stabilised the idea of
the aluminium bumper carrier as being more environmentally friendly, but
how can it be if aluminium is in fact the more environmentally unfriendly
material for fenders? Might it be due to different data sources? Perhaps.

175
However, we are comforted when we reach the end of the article. While
discussing the limitations, we are told that "life cycle studies depends on
spatial differences, which need to be carefully analyzed (i.e. if spatial models
that omit non-acidifying emissions over sea were used for modelling
acidification contributions, aluminium would show a much better
performance." This is a relief and further comfort is soon given: "System
boundaries and assumptions influence the results of life cycle considerations.
They have to be set carefully (e.g. if recycled material had been a
consideration, aluminium would have been the favourable design!)" Phew!
Aluminium is still the better material, at least if recycled. We must therefore
explore the recycling path (i.e. information that tells us how recycling makes
for better environmental performance). Before going there, however, we
must take a closer look at the LCA method itself and what it tells us about
the Environment*.
Both the Thiel article and the Saur article refer to ISO standard 14040, but
the Saur article also introduces another ISO standard, namely ISO 14042
(ISO 2000), which brings us closer to the environment. The standard
describes the model for assessing environmental impacts and begins with:
"Life cycle impact assessment, LCIA, is the third phase of life cycle
assessment described in ISO 14040. The purpose of LCIA is to assess a
product system's life cycle inventory analysis (LCI) results to better
understand their environmental significance. The LCIA phase models
selected environmental categories, called impact categories, and uses
category indicators to condense and explain the LCI results. Category
indicators are intended to reflect the aggregate emissions or resource use
for each impact category. These category indicators represent the
"potential environmental impacts" discussed in ISO 14040" (ISO 1998,
p. v).
The LCIA is based on some concepts that need to be defined, as indeed they
are later in the same document (ISO 1998, p.2). One such is an impact
category, defined as a "class representing environmental issues of concern to
which LCI results may be assigned," the second is a category endpoint,
defined as an "attribute or aspect of natural environment, human health or
resources, identifying an environmental issue of concern," and the third is an
environmental mechanism, defined as a "system of physical, chemical and
biological processes for a given impact category, linking the LCI results to
category indicators and to category endpoints". These concepts are essential
detrimental for calculating the environmental impacts for products as shown
in Figure 4-20 with acidification as an example.

176
Figure 4-20 The concept of impact categories and category indicators
The results from the inventory are connected to an environmental issue of
concern through the impact category. We have to be cautious, however,
because the category indicators neither depict the actual concerns nor do
they take the specificities of the environment into concern:
"LCIA typically excludes spatial, temporal, threshold and dose-response
information, and combines emissions or activities over space and/or
time. This may diminish the environmental relevance of the indicator
result…LCIA results do not predict impacts on category endpoints,
exceeding of thresholds, safety margins or risks" (ibid. p. 10).
As we have seen for acidification and eutrophication, much research effort
has been put into the spatial, threshold and dose-response issues. The
concept of critical loads was important in establishing measures to manage
emissions related to the categories and also to understand how the
environment varies in different places. This is, as we now are told, not taken
into account in an LCA. Although acidification and climate change (with
references to IPCC) are mentioned, the standard does not explicitly offer a
list of impact categories, nor does it give anything other than a few examples
of chemical components that may be assigned to various categories.
Referring to the ISO standards was therefore a dead end, in the sense that
there are no roads leading from the ISO standards and they have no
references except to other ISO standards in the 14040 series. They are almost
perfect black boxes, as all the information is condensed and presented in an
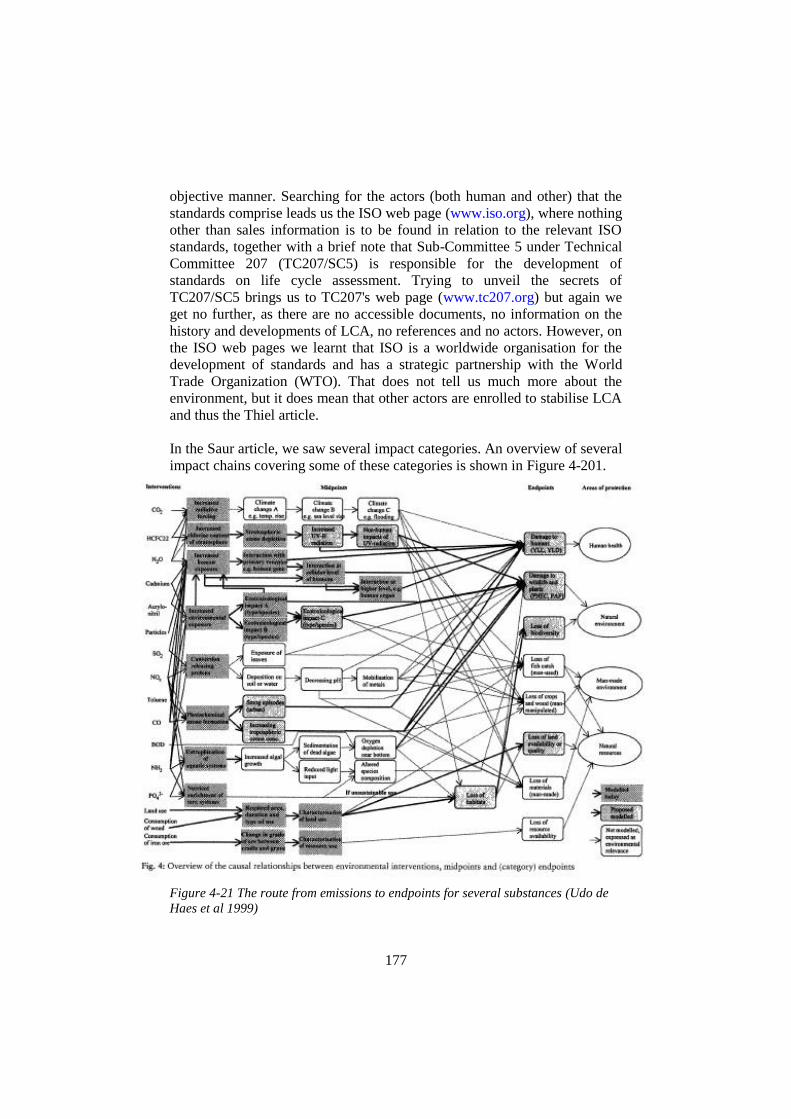
177
objective manner. Searching for the actors (both human and other) that the
standards comprise leads us the ISO web page (www.iso.org), where nothing
other than sales information is to be found in relation to the relevant ISO
standards, together with a brief note that Sub-Committee 5 under Technical
Committee 207 (TC207/SC5) is responsible for the development of
standards on life cycle assessment. Trying to unveil the secrets of
TC207/SC5 brings us to TC207's web page (www.tc207.org) but again we
get no further, as there are no accessible documents, no information on the
history and developments of LCA, no references and no actors. However, on
the ISO web pages we learnt that ISO is a worldwide organisation for the
development of standards and has a strategic partnership with the World
Trade Organization (WTO). That does not tell us much more about the
environment, but it does mean that other actors are enrolled to stabilise LCA
and thus the Thiel article.
In the Saur article, we saw several impact categories. An overview of several
impact chains covering some of these categories is shown in Figure 4-201.
Figure 4-21 The route from emissions to endpoints for several substances (Udo de
Haes et al 1999)

178
The diagram may be hard to read, but this merely serves to emphasise the
complexity of the subject. At the far left, a list of possible environmental
interventions (i.e. chemical components and other potentially harmful
factors) is given. At the far right, different "Areas of protection" are exposed.
These are 'Human health', 'Natural environment', 'Man-made environment'
and 'Natural resources'. In between are the paths that the environmental
interventions move along to create detrimental environmental impacts;
referred to as midpoints and endpoints. The extent to which the lines cross
each other shows how different emissions can lead to more than one impact
and how more than one emission can lead to the same impact. When we also
know that there may be interactions between the different endpoints, for
instance the impact categories labelled "climate change" and "acidification",
the picture becomes even more complex.
To understand the link between emissions of chemical substances, things we
value and the impact categories, or what is referred to as an environmental
mechanism in ISO 14042 (2000), the concept of an impact chain may help.
Figure 4-22 shows such a chain for climate change.
Figure 4-22 The effect and impact chain shown for global climate change (Hertwich
& Pease 1999; Holdren 1980)
As we can see, the chain only gives a few examples of emissions that can
create climate change (CO2 and CH4) and, similarly, only a few examples of
unwanted outcomes (crop loss and storm damage). What is worth noticing,
Stressor
Insult
Stress
Consequence
Value lost
CO2, CH4 emissions
↑ CO2, CH4 concentration
↑ IR radiation
↑ Temperature, storms
Crop loss, storm damage
Effect chain Global climate change
Impact chain

179
however, is how LCA (and thus the Thiel article) captures environmental
impacts somewhere between the emissions and the loss of value. The GWP
is connected to IR radiation and is therefore placed in the middle of the chain
as an environmental stress, while the value for the GWP is the total sum of
the absorption of the different emissions related to climate change. When
moving down the impact chain, relevance for human beings increases - but
so too does scientific uncertainty. The measure is thus a compromise
between capturing the "real" environment (i.e. the true causal relation
between emissions and impacts) and something we care for. Now we are
better equipped to understand a sentence in ISO 14042 stating: "The
category indicator can be chosen anywhere along the environmental
mechanism between the LCI results and the category endpoint(s)" (ISO
2000, p. 9).
In relation to climate change, and remembering that ISO 14042 explicitly
refers to the IPCC model, here is what Heijungs et al (1992) have to say:
"Rapid developments are still taking place in the area of the greenhouse
effect. It is clear, therefore, that these will have to be closely followed
and that GWPs should be modified in accordance with the latest
developments. To avoid the need to change the GWPs after every
publication in this area we propose that the GWP should only be revised
further to new IPCC reports".
This statement effectively ties the method of LCA and the scientific
development within IPCC together, thus confirming IPCC's status as an
actor in the LCA actor-network for an undefined future.
The links between LCA and the environment have become clearer, but the
assumption that there is widespread use of LCA has not been proven just
because there was one other article (the Saur article) in addition to the Thiel
article. Nor are the actors necessary for creating an LCA actor-network or
the connections to bumper carriers (or any of their other names) or the
automotive industry explored to any degree. The time has come to reveal the
history and development of LCA. Fortunately, there are plenty of articles
discussing these issues, as well as plenty of articles that make LCA visible
within the automotive industry.
Although not all articles discussing the history of LCA agree on the exact
starting point, they all trace the roots of LCA back to the 1960s. Some refer
to Harold Smith as the inventor because of an energy calculation for the
production of chemical intermediaries presented at the World Energy
Conference in 1963 (Buchinger 1993; Tsilingiridis et al 2004). Others
attribute the tool to Harry Teasley, who sponsored a comparison of different
beverage containers in 1969 (Hunt & Franklin 1996). "The analysis was

180
conducted by the Midwest Research Institute and the concept became known
as REPA (Resource and Environmental Profile Analysis). It was the basis of
the Life Cycle Inventory methodology development within the existing LCA
idea (Hunt et al 1992)" (Lee et al 1995).
About 15 REPAs were conducted between 1970 and 1975. They
"emphasized raw material demands, energy demands, and waste generation
flows; attempts on more sophisticated analysis through environmental
impact classification would come later in the evolution of LCA
methodology" (Hunt & Franklin 1996)
Then there was silence.
This may be due to the fact that the US Environmental Protection Agency
thought it impossible to carry out REPAs for every product, especially since
their regulatory control was directed towards companies and sites, rather
than products (Hunt & Franklin 1996). The LCA method, however, suddenly
reappears more than a decade later. Fava (2005) writes:
"In the late 1980s a number of "duelling" life cycle assessment studies
attempted to illustrate the superiority of one product over another. As
these studies gained visibility, issues associated with boundary
conditions, sources of data, and functional unit were revealed. In
response to these issues, as well as to concerns by industry, government,
and the public about the proliferation of local and national
environmental standards, ISO – the International Organization for
Standardization, based in Geneva – established a technical committee
(TC-207) to develop environmental management tools (including LCA)
that would be applicable worldwide…[In] 1990, the Society of
Environmental Toxicology and Chemistry (SETAC) sponsored an
international workshop which resulted in "A Technical Framework for
Life Cycle Assessments."…[SETAC] established the terminology and
framework for LCA development worldwide. In North America and
Europe, SETAC set up LCA advisory groups whose mission has
remained to advance the science, practice, and application of LCA.
SETAC has partnered with the United Nations Environmental
Programme (UNEP) to establish the UNEP/SETAC Life Cycle
Initiative to develop practical tools for evaluating products and services
over their entire life cycle to achieve sustainable development" (p. 17)
Here, LCA is coupled with yet more organisations: SETAC and UNEP. The
latter we have already met as one of the establishing organisations of IPCC.
The former, SETAC, was established in 1979 because, according to the
organisation itself (SETAC 2007):

181
"In the 1970's, no forum existed for interdisciplinary communication
among environmental scientists – biologists, chemists, toxicologists –
and others interested in environmental issues such as managers and
engineers."
Such a connection increases credibility and makes the road from science
relating to various species and the specifics of problems in nature to LCA
shorter.
During the 1990s, LCA gained momentum and several industries embraced
the tool as a method for capturing environmental impacts. LCAs were also
increasingly discussed in articles and reports within automotive research,
although many were performed by car companies and not available to the
public. There are at least three different approaches that connect LCA and
cars, where 1) are those authors who combine LCA and automobiles to say
something about both, 2) are those who use cars as cases in LCA and 3) are
those studying other aspects of cars, but referring to the usability of LCA.
Examples of the first are Gaines and Stodolsky (1997b) and Ha et al (1998),
who simultaneously expand knowledge about LCA and knowledge about the
environmental impact of different aspects of cars. An example of the second
approach is Fitch and Cooper (2004), where a case from the automotive
industry is used to expand LCA methodology. Finally, examples of the third
approach are MacLean and Lave (2003), who discuss the use of LCA related
to different fuel options, but also go through a range of studies performed;
and Colvile et al (2001), who emphasise how LCA might be used to find out
about atmospheric emissions from transportation.
The International Journal of Life Cycle Assessment was established in 1996
as yet another actor with the potential of increasing interest in and the
credibility of LCA, but more importance should probably be attributed to the
development of easy-to-use software tools (as for other aspects of the
Environment*). Hunt and Franklin (1996) have provided a personal
reflection on the difficulties of performing LCA (REPA, that is) in the early
1970s:
"One of the interesting aspects of the early studies was performing the
calculations without the aid of electronic computing equipment. The
many hundreds of calculations were done on a mechanical calculator
that did not even have a paper tape print-out. It consisted of electric
motors and rotating wheels. Whenever an error was found and values
had to be recalculated, it was a very time-consuming task. In 1973, the
first LCA computer program was funded by an MRI client. The data
filled several boxes containing many hundreds of punched cards. The
information on the cards had to be loaded into the computer with a
mechanical feeder any time we wanted to do calculations. Often the

182
feeder would not read one or two cards correctly, and we had to start all
over. The computer would often just tell us there was an error
"somewhere", which meant we would have to hand sort through the
boxes of cards and try to find the card error" (p. 5).
In the 1990s, numerous data tools were developed to keep track of
inventories, to store databases for impact factors, to calculate the final
category indicators and to present results in an attractive fashion. The ability
of easy storage and retrieval of vast amount of data has increased the
potential to actually perform analyses.
But how does LCA relate to the impact categories examined earlier - global
warming, acidification and eutrophication? Comparing the impact potentials
from the first round and the content of the categories specified in this round
gives the impression that LCA is not up to date on the environmental
problems. There are, however, vast discussions on how to capture category
indicators in the LCA community and it may well be that the Thiel article
could have chosen a different, more sophisticated approach by drawing on
the LCA literature. In fact, even Heijungs et al. (1992) recognised that there
were developments in modelling of issues such as acidification to make it
more accurate and more site specific and these authors even explained why it
was not employed:
"It might be desirable to include an effect factor in classifications at a
lower level of scale. Such an effect factor could be based on the critical
loads for H* which have recently been developed (Hettelingh et al
1991)…[When] an effect factor is added the potential H+ equivalents
have to be converted to more appropriate equivalents for a given area by
using dispersal and deposition models (which should include
degradation processes, etc.). These equivalents can then be compared
with the critical load for the area concerned. Such models have been
developed for Europe (Alcamo et al 1987) and should also be developed
for other Continents. A future spatial differentiation of the acidification
classification could be implemented in this way. However, the inclusion
of an effect factor would not be useful for the generic classification at
global level developed in this study. A global average critical load
would not provide any differentiation" (p. 75).
Such articles that try to incorporate new findings in study on eutrophication
(Finnveden & Potting 1999; Huijbregts & Seppala 2001) and combinations
of acidification and eutrophication (Krewitt et al 2001; Seppala et al 2006)
have increased in number after the publication of the Thiel article (although I
am not claiming that they have increased as a consequence of the Thiel
article). The actor-network shown in
183
Figure 4-12 is not just used by Thiel and Jensen, but is also the result of
numerous scientists, articles and other actors striving to connect the entities
together. Here we have met yet more articles on LCA, we have met other
environmental impacts, impact chains, SETAC, UNEP (again), computers,
the International Journal of LCA and other actors stabilising the
Environment*.
4.2.2 The actor-network after the second round
The Environment* is all the more visible now. It has become inhabited by
many different species, measuring technologies, scientific bodies, data
models, journals, maps, numerous lakes, rivers, trees, data models and
organisations.
LCA has made connections to a large number of environmental effects.
However, we have also seen how LCA has disconnected itself from the
endpoints when establishing indicators, hence the specifics of nature are not
taken into account. The environment thus consists of an average soil, of
average air and of average water to the extent that the environment consists
of such entities at all. After all, the endpoints of concern (e.g. human health)
have mostly been indicated. The scientific certainty is much higher for a
casual relationship between emissions and their impact on some physical
entity (e.g. increased absorbed IR radiation from increased CO2 emissions)
than for the relationship between such a change in nature and a value that we
care for. The impact potentials are therefore hybrids – quasi-natural
measures somewhere between the release of a substance and its impact on
something that is valued. All chemical components bringing a similar effect
are translated into one, thus making the whole lot manageable.
As a consequence, the environment described by researchers interested in
specific environmental issues is much more detailed than the environment
described in LCA. This does not, however, alter the fact that the more
established and comprehensive impact categories can be described "outside"
LCA, the more this stabilises the LCA concept. From all the articles in the
International Journal of Life Cycle Assessment devoted to impact categories
and which models to use, it can be deduced that there is a desire to ensure
the specifics are included.
Although articles and standards stress that LCA can be used to improve
environmental aspects of products at various points in their life cycle or to
enhance decision-making, the method is also defining what the environment
is. If it is not a part of LCA, it probably has no negative impacts on the
environment. Thus, LCA provides a means of both confirming what the

184
environment is and enhancing the image of the environment as a vulnerable
sphere in need of protection from (and also for) human activities.
Figure 4-23 shows the Environment* actor-network after the second round.
Not all the actors mentioned in the second round are included, but the
diagram indicates several new actors that have joined the actor-network.
Figure 4-23 The Environment* actor-network after the second round
The three impact categories we have followed most intensely seem to have
been well established during the 1980s. They are connected to research
stretching far back in time, as some examples show, but the stability of the
actor-networks was not achieved before enough elements to keep them in
place were present. Even if some elements such as the basic technologies
(e.g. equipment for temperature or pH measurement) were black boxed long
Thiel-
article
Chemical
equations
Political decision
makers
Atmospheric
lifetimes
IPCC
report
IR
Recy-
cling Light-
weight
Al
prod.
LCA ISO
14040
EP
AP
GWP
SO2
NOx
CO
CO2
Average
algae The
atmosphere
Water
Soil
Absorption
capacity IPCC
Heijungs
report
ISO
ISO
14041
Data collection
procedures
Framework for
conducting LCA
Fish
pH
measurements
SETAC
Computers
Climate
models
Snow
Ice
Sea level
Temperature
UNEP
Trees
RAINS
Critical
loads
Limiting
nutrients
Cars
Ice
drilling
Carbon14
WTO
Earth
Sun
Scandinavia

185
ago, the definitions of the environmental problems had to wait until enough
stability granted them reality.110
It soon became apparent that it is impossible to follow all the links, all the
small details that have been translated, emphasised, forgotten, black-boxed
and otherwise transformed into what constitutes the Environment*. As the
three impact categories that were the focus of the Thiel article vanish as we
move backwards to the beginning of the 1980s, we must search elsewhere to
find out what the Environment* was like in the 1970s. Remember that we
want a description of the Environment* in the entire period from 1970 to
2006.
The boxes with dotted lines from Figure 4-12 in the summary of the first
round are still dotted after the second round (although it is almost impossible
to see). Thus, there are still actors holding the Thiel article together that we
have not touched upon and these may shed light on what the Environment*
was like in the 1970s.
4.3 Resources and local pollution: connecting to the 1970s
The Environment* captured in the Thiel article (2000) is built on elements
that fade out at different points in time as we move backwards and follow
the actors in the actor-network. Few of them have any momentum or stable
connections, when we reach the end of the 1970s. Although all three impact
categories in the article have connections to even earlier research, there are
other environmental issues that were more pressing in the 1970s. As we will
see, some of them are closely connected to other as-yet unexamined
concepts introduced in the Thiel article.
4.3.1 Third round: other environmental issues before the Thiel article
– reconnecting to the bumpers
Have we lost sight of the bumper? The second round gave us a better picture
of the environmental issues connected to the Thiel article, or the
Environment* as denoted here. However, whilst describing the materials
used for stabilising global warming, acidification and eutrophication, we did
not meet any bumpers or bumper beams. Even references to emissions from
automobiles have been few. Aluminium has made its presence felt, but as a
negative contribution to acidification, not as industrially produced
110
Although different temperature scales such as Celsius, Fahrenheit and Kelvin can
still cause problems to most people who encounter a temperature reading in a scale
they are unfamiliar with.

186
aluminium for economical use. It is not strange that the bumper disappeared
from view. The environmental issues of the 1980s were connected to
pollution sources other than cars and aluminium, such as coal-fired power
plants, nuclear power plants and refrigerants. In this round, it is time to
reconnect to bumpers, to find the bumpers and the aluminium again and to
trace the Environment* from there. In other words, to see how the
environmental actor-network coupled to aluminium bumpers has been
created and developed.
Lightweight cars and fuel consumption
The Thiel article referred explicitly to the connections between weight, fuel
use and emissions. As such, the Thiel article is one of a number of articles
between 1990 and 2000 that looked at weight savings and better fuel
economy from the application of aluminium in cars (Kirchain et al 2000;
Martchek et al 2000; Peterson 2000; Schukert et al 1995; Stodolsky et al
1995). The conclusions are largely the same for most of the articles and can
be summarised in the words of Allen et al (1994):
"The automobile industry has made significant progress in recent years
in reducing fuel consumption and emissions while striving to provide
the high level of performance, safety and comfort that consumers
demand. Light weighting has been used increasingly as a means of
reducing fuel consumption and emissions" (p. 3).
Many of the articles were connected to research projects on reducing the
weight of cars, with the Partnership of a New Generation of Vehicles
(PNGV) being one of the largest. Hadley et al (2000) wrote:
"[With] higher efficiencies and lower emissions among the goals of the
automotive industry and federal government, programs have been
established to conduct research on using more aluminium in vehicles.
The Partnership for a New Generation of Vehicles (PNGV) provides the
opportunity for manufacturers and the government to conduct joint
research projects in creating aluminium-intensive vehicles that can
achieve three times the mileage of current models" (p. 1).
With the increase in the use of aluminium in cars as an explicit goal, articles
spanning from infrastructure for increased production to technical
characteristics of cars were published.111
Enhanced fuel efficiency is partly
111
Gaines and Cuenca (2002) write: "The Al body stood up well and had no rust,
rattles, or failures. It was unfortunate in a way that the vehicle was not involved in
any significant accidents, so no information was obtained on either repairability or
behaviour of the vehicle‟s body under stressed conditions." Only in a research report
can car accidents not happening be unfortunate.

187
argued for as a means of avoiding dependency on fuel imports in the USA,
but many also make the connection to environmental issues. Miller et al
(2000) argue for more use of aluminium in the automotive industry
"triggered by concerns about global warming and energy usage." They
provide usage statistics that are positive for all proponents of aluminium, as
shown in Figure 4-24.
Figure 4-24 The change in material consumption in the average car (Miller et al
2000).
The diagram shows that there has been a gradual decrease in the relative use
of steel in automobiles, whilst aluminium use begins to increase in the early
1970s. Knowing that the average weight of a car has been increasing at the
same time, this means that the absolute amount of aluminium used in an
average car has increased further. The increase in aluminium use was partly
connected to the issues of lightweight cars and fuel efficiency that really
started to make their presence felt in the 1970s and also started to show up in
articles. A number of articles were published on the advantages of using
aluminium in automotive applications. However, the rationale for focusing
on fuel efficiency was not exactly the same as twenty years later. None of

188
the articles from the 1970s explicitly focus on the word environment, but
links are made to fuel efficiency and resource conservation
George et al (1976) write:
"There are many factors that affect fuel economy such as vehicle size,
weight, engine size, emission controls, aerodynamic shape, and
accessories used. An improvement in fuel economy is possible by
varying any or all of the above factors. An important factor in fuel
economy is vehicle weight because it interacts with other aspects of the
automobile such as road performance, emissions, and structural
requirements. Since decreasing weight has become more important,
interest in aluminium applications in automotive design is rising."
They continue:
"The use of aluminium in automobiles can represent significant weight
reduction. On an equal volume basis aluminium weighs 1/3 as much as
steel. There are instances where aluminium has other technical
advantages, but by far its main advantage is its weight reduction
potential and its influence on fuel economy. …[When] automotive
engineers are looking for a weight reduction, one of the first places
examined is the bumper system. This is because bumpers are a
relatively heavy structure having a well defined technical function
(determined by federal regulation)"
Thus we learn that the aluminium bumpers are in fact special, as they are
especially viable for weight reductions. The article even provides links to the
political and legal systems. Another good example is Hatch (1977) who
argues:
"Emphasis put on vehicle weight reduction by the automobile industry
to increase fuel efficiency is one of the reasons for aluminum's growth
in bumper system applications. Aluminum's high strength to weight
ratio makes it a candidate material for bumper systems that must
comply with FMVSS 215, part 581."
Hatch specifies the reason why aluminium is especially viable for weight
reductions and also the specific element in the legal system to which the
bumpers are connected. In his conclusions, he relates the weight savings to
the environment:
"In the selection of materials and systems, one must consider not only
cost-effectiveness of a particular design, but the effect on conserving
our natural resources."

189
Here, "conserving our natural resources" is providing a connection to the
Environment*. The most observant readers may remember that "Resource
Use" measured in scarcity units was one of the impact categories included by
Saur et al (2000) in their study of aluminium fenders. Starting to use a new
material (or rather an old material for new applications) also required testing
of its behaviour under real conditions:
"New alloys of aluminium have been developed, together with thermal
treatments and fabrication techniques, to meet special requirements in
the automotive field. While the corrosion behaviour of these materials
can generally be anticipated from a knowledge of the corrosion
characteristics of related alloys, new and extensive testing is needed to
verity their performances. Therefore, in 1974 we planned a
comprehensive atmospheric exposure test program. Consultation with a
major automobile manufacturer confirmed the desirability for field
testing in three important areas: (1) conventional plated steel bumpers
versus aluminium bumpers having several finishes (bare alloy, anodized
coating, organic coated, and chrome plated metal)…[The] article shows
that empirical testing of bumpers and bumper materials are needed to
gain insights that cannot be deduced from theory. (Ailor Jr. &
Wilkinson 1977)
The citation hints at the trials aluminium must undergo in the hands of
scientists to be translated into a material good enough for the automotive
industry. However, trials and testing were not confined to aluminium only.
Weight reduction also became a threat to steel producers, who responded by
developing new types of steel using the same argument of the need for
weight reduction (Kary 1976).
Resource scarcity
In the early 1970s, the view that the world would run out of resources was
widespread in research. The report "Limit to Growth" and the article "A
Blueprint for Survival" were leading a debate, which was also heavily
influenced by the 1973 oil embargo and the first picture ever of the whole
Earth from the Apollo 17 space shuttle.112
These different contributions were
involved in the establishment of institutions such as the World Resources
Institute (WRI) and US legislation such as the 1974 National Commission on
Supplies and Shortages Act.
The idea that resources might run out was not a novel idea. Not in practice,
where human settlements have always been dependent on securing a supply
112
The picture is often stated to be the most widely published picture in the world –
it made the definite limits of the Earth and the vastness of space visible. (Maher,
2004)

190
base, and not in theory, where the infamous work by Malthus must be
considered to be one of the earlier contributions.
Since "Limits to Growth" was instrumental in setting up the debate in the
1970s, a whole range of issues connected to the usability of dynamic
modelling, parameters for equations and economic assumptions were
brought to the table. Unlike the environmental issues we have encountered
so far in this chapter (i.e. the "newer" environmental problems), economists
became widely involved early on with defining resource depletion (almost to
the point of defining it away). Natural scientists seemed furious about
economists' participation in the debate, or at least their writings show signs
of this, here in the words of Georgescu-Roegen (1975):
"The favourite thesis of standard and Marxist economists alike,
however, is that the power of technology is without limits (Barnett &
Morse 1963; Beckerman 1972; Bray 1972; Johnson 1973; Kaysen 1972;
Report on Limits to Growth 1972; Solow 1973). We will always be able
not only to find a substitute for a resource which has become scarce, but
also to increase the productivity of any kind of energy and material.
Should we run out of some resources, we will always think up
something, just as we have continuously done since the time of Pericles
(Beckerman 1972). Nothing, therefore could ever stand in way the way
of an increasingly happier existence of the human species. One can
hardly think of a more blunt form of linear thinking."
He continues in the same fashion:
"In Solow's hands, substitution becomes the key factor that supports
technological progress even as resources become increasingly scarce.
There will be, first, a substitution within the spectrum of consumer
goods. With prices reacting to increasing scarcity, consumers will buy
"fewer resource-intensive goods and more of other things" (Solow
1973). More recently, he extended the same idea to production, too. We
may, he argues, substitute "other factors for natural resources" (Solow
1974). One must have very erroneous view of the economic process as a
whole not to see that there are no other material factors than natural
resources. To maintain further that "the world can, in effect, get along
without natural resources" is to ignore the difference between the actual
world and the Garden of Eden"
The citations not only show his contempt for the view of economists, they
also expose his underlying belief in the world as a closed system. A belief
earlier explicated by Boulding (1966), where he shows what the image of a
closed system has to wrestle with:

191
"We are now in the middle of a long process of transition in the nature
of the image which man has of himself and his environment. Primitive
men, and to a large extent also men of the early civilizations, imagined
themselves to be living on a virtually illimitable plane. There was
almost always somewhere beyond the known limits of human
habitation, and over a very large part of the time that man has been on
earth, there has been something like a frontier. That is, there was always
some place else to go when things got too difficult, either by reason of
the deterioration of the natural environment or a deterioration of the
social structure in places where people happened to live. The image of
the frontier is probably one of the oldest images of mankind, and it is
not surprising that we find it hard to get rid of."
Boulding also refutes the view of economists and describes them as
especially sluggish in realising what the earth really is.
"Economists in particular, for the most part, have failed to come to grips
with the ultimate consequences of the transition from the open to the
closed earth".
Another natural scientist, Cook (1976), does not employ such general
insults; rather he couples the insights from geology with those from an
economic perspective:
"Despite the fact that strongly positive geochemical anomalies are
relatively small and rare and appear to be restricted to the outermost part
of continental crusts, the history of economic exploitation of non-
renewable resources over the past 200 years is, in general, one of
decreasing and increasing reserves. However, the direct energy or work
costs of recovery have been rising, slowly for a long while, then more
rapidly as the number of tons of ore required to produce a ton of refined
metal has started to rise more steeply with decreasing ore grade…Now
that energy resources themselves are beginning to cost more in work,
now that the efficiencies of energy conversion appear to be nearing
limits dictated by the strength of materials and the laws of
thermodynamics, and now that the work costs of recovery, at least for
some resources, are moving up the steeper parts of exponential curves,
the nature of the limits to exploitation of non-renewable resources is
beginning to be recognized".
Despite these examples of instructive texts by natural scientist, the
economists and the world at large were never really convinced. When Simon
(1980) broke the false myths about the present bad state of the world, about
population and resources, it was almost too late. The false myths had already
been brushed aside as myths by both researchers and the wider audience.
That the concern for resource conservation diminished rather than grew
192
stronger was connected to both updated estimations of the resource base and
an increase in concerns over other environmental issues. According to
Ausubel et al. (1995):
"While energy use [since 1970] has increased, so have estimates of the
energy available, in the form of resources that might eventually be
tapped. Contrary to expectations that the world would begin to exhaust
its supply of so-called fossil fuels, proven reserves of oil have increased
from 600 billion barrels in 1970 to 1,000 billion today, even though
over 500 billion barrels have been pumped from the ground in that time.
Proven reserves of natural gas have tripled over the last twenty-five
years."
These authors even go so far as to state that:
"The possibility that environmental concerns such as the build-up of
atmospheric greenhouse gases would diminish because of the depletion
of exhaustible resources has thus become more remote."
They are thus asserting a claim as to why climate change has increased in
importance as an issue, a claim that is also found in a work by Randers
(2000).113
"[A lesson] from history since 1970 relates to parameterisation. It now
appears that the tightest constraint on physical growth is not resource
scarcity, or vulgar shortage of raw materials. Rather the most pressing
limit seems to be on the emissions side. To be concrete, the world
appears to have much more fossil fuel than was assumed, indeed more
than man can burn without causing serious climate change.
This is of course, in our language, nothing but a question of
parameterisation. No serious system dynamicist would insist on the
validity of the individual parameters chosen for the early models
World2 and World3. For us the main message is the overshoot and
decline mode, which resides in the basic structure of global economic
and population growth. For us it does not matter what triggers this
mode. For us, what matters is that growth in face of limits, and
governed by delayed decisions, will produce overshoot" (p. 215)
However, returning to the LCA guide by Heijungs (1992), we find that
resource depletion was still an issue in the early 1990s:
“The depletion of resources is at the heart of the discussion about
sustainability and is a problem in its own right. Depletion may lead to a
113
Randers was also one of the authors of "Limits to Growth".
193
loss of functions and potential functions of certain material applications.
Furthermore the continued use of resources may lead to a shift to poorer
or less favourably sited reserves thus resulting in greater emissions,
damage, desiccation, etc. For these reasons it is useful to include the
aspect of depletion in the classification of an LCA.”
Although resource scarcity on a global scale was largely refuted at the
beginning of the 1980s, institutions and tools connected to the idea have still
remained.
Production and recycling of aluminium
Two other boxes with dotted lines in Figure 4-12 represent the production of
aluminium as an actor, and recycling. For aluminium to be part of the idea of
a more environmentally friendly bumper carrier, its production cannot have
too severe an environmental impact. However, the production of aluminium
has a history of a poor environmental reputation. Asdal (2004) writes that:
"[The aluminium production sites] Årdal and Sunndal were after a while
just as renowned for the detrimental effects from the production of
aluminium as the aluminium production itself. Aluminium changed
character. The product could no longer be separated from the effects it
created."
Since then, aluminium has gone through a transformation due to decreases in
the emissions of pollutants and a focus on recyclability:
"As worldwide concerns about the Environment increase, the ability to
recycle automotive components and materials is becoming an important
consideration in the design of a vehicle. The amount of energy required
to remelt aluminium scrap is only 5% of that needed to produce molten
metal from ore [1 = Recyclability and Design 1992 Automotive Design
and Fabrication Seminar, Detroit, MI, November 4, 1992]. From an
Environmental perspective, it clearly pays to maximize the reuse of
aluminium components whenever possible. The economic and
technological enablers to recycle exist. Therefore, when a component is
designed with aluminium, the entire cycle of material from use through
reuse is put in motion" (Allen et al 1994)
Gaines and Stodolsky (1997a) criticise studies which claim that "use of
lightweight materials results in only minimal lifetime energy savings, and
therefore should not be given high priority". They argue that:
"[These] studies make several errors. The first error is failing to
recognize that, even if lifecycle energy use is not reduced by
substitution of lightweight materials, dependence on petroleum is
194
definitely reduced, and this may be a key cost and national security
concern (imprecise criterion definition). The second error is simply
neglecting the secondary weight savings enabled by using lighter
components. Secondary weight savings accrue as a result of redesigning
other components to take advantage of the lighter vehicle body. These
savings reduce production energy and further reduce gasoline
consumption (technical detail not covered in standard methodology).
Correction of this error results in reduction of break-even mileage. The
third error is the use of virgin aluminium in the energy calculation
(incomplete set of systems analyzed). Some of the aluminium currently
used in cars is cast and some is wrought (sheet and extrusions). The cast
aluminium is already largely recycled, but the wrought aluminium is
generally virgin, because all the aluminium currently recovered from
cars goes into cast products. No credit is given for energy recovered
from recycling the recovered wrought products to cast products (or in
some cases, even from recovered cast products) in the faulty studies,
and no thought is given to the obvious solution. In the future, if large
quantities of wrought aluminium are used in cars, the material will be
recycled, drastically reducing the energy requirements for aluminium
auto parts."
How could anyone speak against aluminium? If one were to take all of the
positive effects mentioned above into account, it must be environmentally
friendly. Not just that, there is even work going on to make it even more
environmentally friendly:
"Development of advanced anodes and cathodes and processing and
recycling of aluminium wastes are some of the areas that currently are
being funded to reduce energy consumption, pollution, and production
costs of aluminium." (Hadley et al 2000:17)
You may be puzzled that there is little mention of the detrimental effects of
fluoride emissions from aluminium smelters in the text - and so am I. The
Norwegian aluminium industry was haunted for years by the effects on
vegetation and animals around the major aluminium production sites. These
effects led to controversies, to scientific publications and even to the
establishment of Røykskaderådet – the predecessor to SFT (the Norwegian
pollution agency). However, the controversies were as good as settled by the
1970s. Most articles connected to the emissions and impacts had been
published and already forgotten (e.g. Bohne 1970; Braanaas 1970; Danielsen
1960; Nestaas 1970) and only a few exceptions were published later (e.g.
Arnesen et al 1995; Horntvedt 1995; Thrane 1987).

195
Local air pollution
For those of you with a superhuman memory, carbon monoxide (CO) was
the last actor in Figure 4-12 that remains to be explained. Actually, so far we
have seen very few connections to CO until it suddenly shows up here, in an
attempt to "finish" the actor-network I started to capture. I must, however,
disappoint you (and me as well). Carbon monoxide is just not a subject of
major interest. There are references to carbon monoxide in health journals
and writers in environmental sciences seem to agree that CO emissions are
bad for you, but I have not managed to come across any substantial writings
on CO since 1970. Perhaps I should have searched more diligently or earlier,
perhaps it suffices to say that carbon monoxide and other local pollutants
with direct effects on plants, animals and humans were already well
established, black-boxed and unnecessary to speak of after 1970. However,
this is contrary to the views of Selin and Eckley (2003):
"The first public warnings about possible dangers came in relation to
local environmental effects in the early 1960s, and grew stronger in the
1970s (Anonymous 1966; Carson 1962; Jensen 1972). As such, the
chemicals problem was first seen as a local problem" (p. 22)
This does not contradict the idea of first seeing environmental problems as
local problems. The claim that public warnings grew stronger in the 1970s
does not have to be related to a strong scientific focus in the same period.
Hints that this may be the case are provided by Colvile et al (2001):
"Ellison and Waller (1978) reviewed the evidence on the health effects
of urban air pollution (principally sulphur dioxide and suspended
particles), with particular reference to the UK. They concluded that
urban air pollution until around 1968 caused increased mortality and
morbidity, with exacerbation of pre-existing chronic respiratory disease,
but felt these effects were not longer occurring. The sooty smogs of the
1950s had also been highly visible and tangible, so the improvement in
air quality could be seen, smelt and even tasted by the general public as
well as monitored by scientists, adding to the general impression that
the problem had been solved." (p. 1542).
As surprising as the small number of articles related to cars and the
environment in the 1980s is the lack of articles on local air pollution in the
1970s.
4.3.2 The actor-network after the third round
The third round was even messier than the two previous rounds. There has
been a larger movement in time and issues jumping from the 1970s to the

196
1990s and back again, from a focus on one environmental issue to another.
The red thread is missing.
It becomes evident why the Thiel article could not have been written 20 or
30 years earlier. The focus was elsewhere. Data had not been gathered. The
Environment* had yet to be effectively translated into graphs and numbers.
EPA had turned down the idea of assessing all products. Hence, the
alignment of all the elements – databases, simple equations for complex
environmental relationships, shifts from a production to a product focus –
made LCA and the Thiel article possible.
Connections from the issues high on the agenda in the 1970s are still present
in the year 2000, even for actors that were refuted and discarded, such as
resource scarcity. The connections are, however, more difficult to trace, as is
the degree to which they provide stability to the Environment* (i.e. the
actor-network consisting of environmental issues related to bumpers)
4.4 Fuzzy boundaries of the Environment*: 2000-2006
The concepts from the Thiel article have been examined and I have
presented the content and the way the concepts have been stabilised.
However, the time period from 2000 to 2006 has not yet been covered and
needs attention, in order to create a parallel description of the Economy* and
the Environment* and thus provide the symmetry necessary for comparing
the descriptions.114
If the third round was messy and confusing, the fourth round will probably
be much riskier. I am moving away from my fixed point, the Thiel article,
and into open spaces to capture historic processes of an extremely temporary
nature.
4.4.1 Fourth round: environmental issues after the Thiel article
It is difficult to predict what will be deemed the most important
environmental issues between 2000 and 2006. Only history will decide
which articles and directions continue and which are forgotten. There are,
however, some issues that are begging for attention and that certainly can be
treated here. Ideally, I should probably have treated those articles that refer
to the Thiel article to investigate where the article "spreads", but the
publications in the SAE database are both difficult to access and mostly
114
For the same reason, pictures of the scientific actor-network in 1970, 1985 and
2006 are provided in the summary of this chapter.

197
attract researchers with special interests. Thus, given that the spread is
hampered and the material limited, I have elevated myself to the position of
choosing which issues to include and perhaps more importantly which to
exclude. The elements presented here are therefore those that any scientists
involved in the environmental characteristics of aluminium bumper beams
would be interested in between 2000 and 2006.
Industrial ecology and sustainable development
Although the concepts of industrial ecology (IE) and sustainable
development (SD) were introduced prior to the Thiel article, they have
further grown and stabilised in the years after the turn of the millennium.115
According to Randers (2000), sustainable development is one of the biggest
concepts to have arisen in recent years. Commenting on progress since he
contributed to "Limits to Growth", he observes:
"But is there nothing new [since "Limits to Growth"]? Luckily there
is… [There] is the new name: "sustainable development". It took some
time to find, but in 1986 the Brundtland commission (World
Commission on Environment and Development 1987) succeeded in
coining a phrase that made Jay's "equilibrium" into 'sustainable
development'. There was no change in the concept, but the new label
was much more acceptable from a political point of view. It could be
supported by the world's poor. Unfortunately, the new label was also
much more confusing. It took nearly ten years for global society to
remove some of the fog and concretise sustainable development into its
three elements: financial sustainability, environmental sustainability,
and social sustainability" (p. 215).
So SD is both politically acceptable and connects to both economical and
social issues. There is a natural connection between LCA, IE and SD. As Eik
(2005)notes:
"According to Lifseth (1997), IE can be seen as the operational part of
sustainable development, which is defined to be a "development which
meets the needs of the present generations without compromising future
generations to meet their own needs." (WCED). However, where
sustainable development is concerned questions related to
environmental, societal and economical issues in a global perspective,
the concept of IE seems to be restricted to understanding and
improvement of environmental and economical issues in industrial
societies" (Eik 2005, p. 20)
115
Which may explain why they were not part of the Thiel article or its immediate
references.

198
LCA is again seen as a tool to accomplish industrial ecology (Ehrenfeld
2003), where IE means to create an industry that mimics nature and
introduces the concept of "industrial metabolism" (Graedel & Allenby 1995).
By using nature as a metaphor, the hope is to achieve what nature does (i.e.
getting rid of all waste) in an industrial setting.
What makes these two concepts interesting with regard to the
Environment*? First of all, the focus is broadened. The Environment* comes
closer to the economic and social issues, as they are all placed under the
umbrella of sustainable development. We are also introduced to something
like a metaphysical hierarchy. Sustainable development is placed on top as
the ultimate goal to be achieved. Industrial ecology is introduced as the mind
set, or paradigm, to achieve the goal (Ehrenfeld 1997). Life cycle assessment
is on the lowest level as a practical tool to be used within industrial ecology.
SD and IE thus introduce an element that has not been explicitly present
earlier, namely an overriding framework for environmental issues - almost
like a new ontology.
Safety as environment
As a follow up of sustainable development connecting the Environment* to
social and economical issues, the scope of environmental issues has
increased. In the updated guide from the University of Leiden (Guinée et al
2001), casualties (i.e. damages to human health from accidents) are proposed
as a new impact category. There are also working groups trying to establish
work hazards as a separate impact category within LCA. This conforms to
how sustainable development (and all UN-initiated environmental work
since the conference in Stockholm in 1972) has made the boundaries
between social factors and environmental factors more blurred.
The connections between environmental issues and human health have, in
fact, made the environment as a category less obvious. It is no longer limited
to encompassing resource restrictions or polluting substances, but can also
include actors previously viewed as social. A potentially positive
consequence is that some human activities may actually be environmentally
friendly, instead of all activities bearing an environmental burden. An
example from Colville et al (2001) illustrates this:
"Even in the absence of tighter air quality standards, there are
arguments for environmental improvement by road traffic reduction.
This is in recognition that the effects of air pollution emissions from
road transport are far from being the largest road transport related
impacts on population health. In addition to road injury risk, large but
very poorly quantified health benefits of road traffic reduction include

199
increased physical exercise associated with most modes of transport
other than the private car" (p. 1557).
It should not come as a surprise that Health* and Environment* are joining
forces. 116
After all, we have seen that the Environment* is connected to what
humans hold sacred and there is probably nothing as sacred to an individual
as the individual's physical health.
Climate change – no room for others?
Although the Environment* has increased in width by encompassing still
newer impacts and by renewing old issues through more sophisticated
measurement techniques and technologies, there is also a trend towards
'reducing' the Environment* to only one impact, namely that of climate
change.
During the late 1990s and the beginning of the new millennium, climate
change started to overshadow all other potential environmental hazards.
Although the idea that carbon dioxide emissions could affect the World's
climate was introduced more than a century earlier, it took decades of work
within various disciplines and increasing emissions from anthropogenic
sources to establish climate change as a category for a broader range of
research fields.
According to MacLean and Lave (2003): "As recently as a decade ago,
climate change was a relatively obscure concept. It is now a key
environmental policy issue." Reasons for the previous obscurity are given by
Colvile et al. (2001):
"Emissions of greenhouse gases came under global control somewhat
less rapidly [than acidifying and/or ozone depleting substances] as a
result of genuine scientific uncertainty concerning the magnitude of the
problem combined with powerful lobbying by the fossil fuel industry."
Part of the reason for this transformation into a "key environmental policy
issue" can be found in the temperature graphs for the time period between
1990 and 2006. Another factor is the vast research effort invested in the
subject. Remarkable weather patterns and new world records for mean
annual global temperatures have concerned the public as well as scientists.
116
Health* is equivalent to Environment* and Economy*, that is the issues related
to the domain labelled Health connected to bumpers and bumper beams. If this
domain had been included from the start, there would have been a greater focus on
damage and injuries from crashes, and also the links to bumpers as a safety feature
of cars.

200
Not only are the models for climate change being refined, significant
resources have also been put into investigating the potential effects of
climate change. Scenarios with rising sea levels, deaths caused directly by
heat or indirectly by draughts or diseases, flooding and storms are being
calculated with high confidence levels (Weart 2007).
The wording of the researchers within IPCC has gradually become stronger,
from stating that there is a possible connection between man-made emissions
and a change in climate to stating a certainty about the connection. Research
institutions have changed their scope as a result. For instance, the Centre for
International Climate and Environmental Research (CICERO) at the
University of Oslo has changed its focus from measures to avoid climate
change into measures aimed at coping with climate change.117
This increase in focus on climate change has also been shown in "bumper
science". Instead of taking up a number of potential environmental impacts,
both Yamaguchi et al (2005) and Suzuki (2006) use LCA - but focus entirely
on CO2.
4.4.2 The actor-network after the fourth round
The Environment* between 2000 and 2006 has been subject to both
increased hybridisation and increased specialisation. Hybridisation has
occurred as a consequence of a broadening of scope, as demonstrated by the
concept of 'sustainable development' and in the link with the health domain.
Specialisation has occurred as a consequence of the increased focus on
climate change. Climate change has almost managed to establish itself as the
only relevant environmental impact category. These two movements are
partly conflicting and yet they also feed off each other.
This short description of the altering of elements between 2000 and 2006 has
not tried to explain what happened to all those actors present in the Thiel
article. Instead, the intention has been to show the development of some of
the more important actors. Thus, several of the elements included in the
Thiel article not covered in this section are still part of the Environment* A
picture of the actor-network constituting the scientific production of
environmental issues with regard to bumpers (i.e. the Environment*) is
provided in the summary to be presented next.
117
Interview with Pål Prestrud

201
4.5 Summary and timeline
Much has happened between the "resource scarcity" of 1970 and the
"climate change" of 2006. Journals and books where environmental issues
are displayed have been produced in increasing numbers. These texts contain
numerous figures, graphs and equations that are representations of how it is
anticipated that the environment will respond to different human
interventions, e.g. the emission of chemical compounds. Such
representations relate physical entities 'out there' to ways of understanding
them through a text so that, for instance, carbon dioxide is characterised by a
certain lifetime in the atmosphere or a certain potential to absorb infrared
radiation and warm the earth. These mechanisms – assemblies of texts and
the material world they hint at – are used to define environmental problems.
We have seen several examples of such assemblies in this chapter and the
following section summarises the actors (i.e. the elements) that the
Environment* has consisted of in the studied time period.
In order to provide symmetry between the descriptions of the Economy* and
the Environment*, the scientific production network (i.e. the Environment*)
in 1970, 1985 and 2006 is illustrated in the text where appropriate.
4.5.1 Summary of actors
Let us first see what the Environment* looked like in 1970. This is displayed
in Figure 4-25.

202
Figure 4-25 The possible Environment* in 1970
Many of the elements of the Environment* are displayed in Figure 4-25.
Environmental problems existed in the form of local air pollution, consisting
of emissions of fluorides, CO, NOx and SOx. The first of these chemical
compounds was connected to aluminium production, while the three others
were linked to fuel consumption and therefore car use. Articles existed that
displayed relations between the weight of cars, fuel consumption and the use
of aluminium, but no links existed between aluminium and bumpers in
scientific texts.
In fact, the diagram shows that there was no Environment* in 1970.
Bumpers were only loosely coupled to aluminium and no scientific articles
had constructed the link between environmental problems and bumpers.
Thus, what is displayed is a potential actor-network that would exist if
anyone had asked for the bumpers' environmental characteristics.
The Environment probably came into existence in 1976 – or at least that is
the year when the first article bringing bumpers, aluminium and the
environment together is found. A focus on resource scarcity was established
by the report "Limits to Growth" and the article "A Blueprint for Survival".
Thereafter, the relative low weight of aluminium bumpers were praised in
several articles for decreasing fuel consumption and saving natural
resources. These texts also referenced the connection between aluminium
bumpers and reducing local emissions of pollutants. Such local emissions
were not an important part of science production in the 1970s, but were
CO
NOx
Local air pollution
Fluorides
SOx
Aluminium production
Car useFuel consumption
Aluminium
Weight of cars
Aluminium bumpers
Bumpers
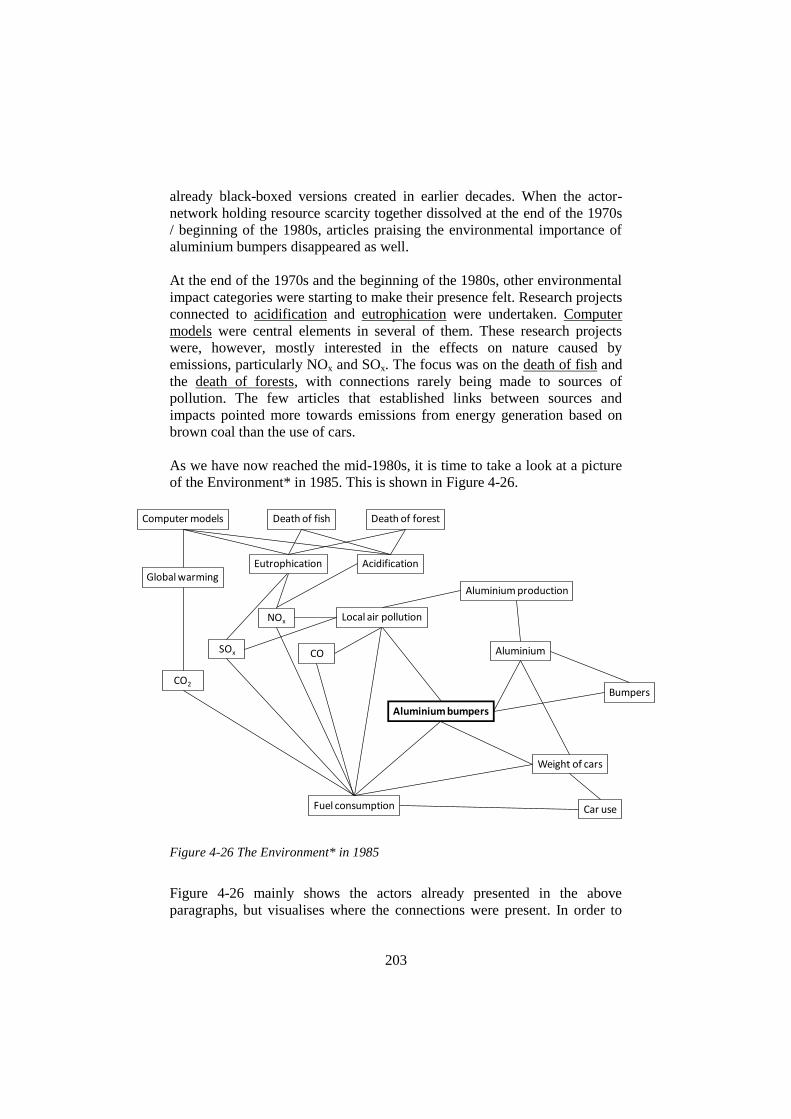
203
already black-boxed versions created in earlier decades. When the actor-
network holding resource scarcity together dissolved at the end of the 1970s
/ beginning of the 1980s, articles praising the environmental importance of
aluminium bumpers disappeared as well.
At the end of the 1970s and the beginning of the 1980s, other environmental
impact categories were starting to make their presence felt. Research projects
connected to acidification and eutrophication were undertaken. Computer
models were central elements in several of them. These research projects
were, however, mostly interested in the effects on nature caused by
emissions, particularly NOx and SOx. The focus was on the death of fish and
the death of forests, with connections rarely being made to sources of
pollution. The few articles that established links between sources and
impacts pointed more towards emissions from energy generation based on
brown coal than the use of cars.
As we have now reached the mid-1980s, it is time to take a look at a picture
of the Environment* in 1985. This is shown in Figure 4-26.
Figure 4-26 The Environment* in 1985
Figure 4-26 mainly shows the actors already presented in the above
paragraphs, but visualises where the connections were present. In order to
CO
NOx Local air pollution
SOx
Aluminium production
Car useFuel consumption
Aluminium
Weight of cars
Aluminium bumpers
Bumpers
AcidificationEutrophicationGlobal warming
Death of fish Death of forestComputer models
CO2

204
keep the Environment* stable, the connections were neither strong nor
many. Thus, although it is possible to draw a picture of the network in 1985,
the mid-1980s almost failed to contain the Environment* at all. The
environmental issues in focus were found elsewhere, mostly connected to
polluting electricity-generating sources (coal and nuclear power) or to
refrigerants (CFCs). Nevertheless, important work was carried out in relation
to impact categories that really made their presence felt during the end of the
1980s and the beginning of the 1990s, especially acidification,
eutrophication and climate change. All three of these were really starting to
form stable actor-networks during the 1970s and the 1980s.
From the mid-1980s onwards, the Environment* really started to grow both
in size and stability. The end of the 1980s saw the emergence of a tool to
capture the Environment*, namely life cycle assessment (LCA). All impact
categories are gathered to form a single measuring instrument for the
potential environmental hazards connected to any product. During the 1990s,
the tool became widespread and aided the various impact categories in
expanding as they were applied to still more products. Many studies were
also performed within the automotive industry.
At the same time, work was performed to refine the impact categories of
acidification and eutrophication and to control the emissions associated with
them. A mixture of political and scientific processes led to the introduction
of terms such as critical loads and limiting nutrient and other actors such as
grid maps and oxygen levels in water. Emission quotas and emissions
trading were also introduced as part of one of these hybrid processes. As
acidification and eutrophication share some basic components (for instance,
NOx contributes to both effects), the impact categories became intermingled.
Global warming had been lurking in the background as a potentially
important environmental impact category during the 1970s and the
beginning of the 1980s, but it became real in 1988. It changed its name to
'climate change' at some point during the 1990s. This change of name is
associated with a change in focus, from only looking at warming effects such
as increased temperatures, ice smelting and rising sea levels to the inclusion
of other climatic effects such as effects on ocean currents and changed
weather patterns. Moving from the emission of greenhouse gases such as
H2O, CO2, CH4 and N2O, to the absorption of infrared radiation in the
atmosphere and changes in temperature, the impact chain had been
recognised since the late 19th century. However, it took almost 100 years for
the enhanced greenhouse effect to become a well-established scientific fact
(although not undisputed). It required the connecting of numerous sciences
(such as glaciology, meteorology, oceanography, chemistry, physics,
computer sciences and mathematics), scientific articles in hundreds of
journals, temperature measurements, scientific bodies such as IPCC, political

205
processes such as the one connected to the Kyoto Protocol (where emission
quotas and emission trading became enrolled) and a range of other actors to
grant it stability.
After the turn of the millennium, the connections to climate change have
continued to increase in numbers and even other impact categories like
acidification have been intimately linked to climate change. In fact, the
climate change network had in itself grown so large in 2006 that the other
previously mentioned impact categories were almost invisible.
However, more and more concepts have been created, including sustainable
development and industrial ecology, which have filled research with new
hybrids consisting of the environment, the social and the economic. While
these concepts are indeed involved in continuing the expansion of the
climate change actor-network, they also lead to the inclusion of new impact
categories – new elements in the Environment* – such as the category
related to injuries, harm and safety.
Figure 4-27 below shows the Environment* as of 2006.
Figure 4-27 The Environment* in 2006.
CO
NOx Local air pollution
SOx
Aluminium production
Car use
Fuel consumption
Aluminium
Weight of cars
Aluminium bumpers
Bumpers
AcidificationEutrophication
Climate change
Death of fish Death of forestComputer models
CO2
Critical loadsLimiting nutrient
Grid maps
Oxygen levels in water
Emission quotas Emissions trading
Safety
Sea level rise
Ice smelting
Malaria
Yellow fever

206
The actors presented in Figure 4-27 obviously do not represent an exhaustive
list of all the actors connected to the Environment* in 2006. They should,
however, provide a large enough number of actors to make comparison with
the actors, resources and activities from the Economy*. In order to structure
the actors into a more accessible format, they are presented on a timeline in
the next section.
4.5.2 Timeline of the Environment*
The actors, resources and activities presented in this chapter can be
organised according to the time of their introduction or alteration as shown
in Figure 4-28.

207
Actor in the Environment*
1970118
Black-boxed versions of local air pollution
1971
1972 Resource scarcity (re)appears and gets immediate attention
1973 Resource conservation in bumper texts
1974 Resource scarcity grows but is disputed
1975
1976
1977
1978
1979
1980 Resource scarcity fades away
1981 Acidification and eutrophication make their appearance, but without
major impact
1982
1983
1984 The bumper (or even the automobile) has almost disappeared from the
environment
1985
1986
1987 Sustainable development introduced
1988 Global warming is "confirmed", critical loads are introduced
1989 LCA connects to SETAC, emission trading in acidification
1990 The first IPCC report
1991
1992 The Leiden guide
1993
1994 The second IPCC report
1995 Industrial ecology
1996 International Journal of LCA
1997 Kyoto meeting
1998
1999
2000 Global warming starts stealing all the attention, other categories
fading, Thiel-article
2001
2002 New Leiden guide, safety is included as impact category
2003
2004
2005
2006 Global warming established as fact
Figure 4-28 Timeline of the Environment*(the introduction or change of actors).
118
The elements (actors) displayed in 1970 were already in place and were not
introduced or changed that specific year.

208
4.5.3 An adjusted image of the environment
The Environment* did not look at all like the stereotypical view of the
environment encountered in the introductory chapter. The emotional human
actors we could have expected to meet have been completely absent.
Instead, we have met actors – often in the form of texts, graphs and figures –
that have faithfully and thoroughly tried to unveil connections between
actors in nature: the links between the emissions of numerous chemical
compounds and real impacts on plants, water bodies, animals, ice, human
beings etc. The texts could never have been produced without measurement
technologies, laboratory equipment, rigid testing or computer models.
However, we must remember that other factors – such as journals, scientific
communities, political interests, pencils, transport means, maps, notebooks,
universities, money and a lot of other actors - have been instrumental in the
creation of such texts.
In order for anything to become an environmental problem, it is not enough
for one article to have exposed a relationship between a potential stressor
and a potential impact. For any element in the environment to last, it needs
to be connected to others. From the text, we can see that it was the elements
that were able to create many connections that seemed to last longer.
Furthermore, the degree of heterogeneity of the actors to which the element
is connected seemed to be important. The impact categories that have lasted
the longest are all connected to a wide variety of other actors. This applies to
both acidification and eutrophication. However, there is no doubt that no
other impact category mentioned in the text has managed to develop as many
relations with such heterogeneous actors as climate change. Over the last
decade described here, it appeared to be more of a black hole swallowing all
other actors than just a black box. Climate change started to become the only
environmental problem worthy of attention after 2000. No other impacts can
compare to it when it comes to the size or severity of potential effects. No
other impacts are as intensively connected to most human endeavours. The
co-production of environment and politics, as can be seen in much of IPCC's
work, is also an important aspect of the climate change actor-network
expansion. Generally, there has been a move towards more and more
connection between politics and environment - as seen for all three impact
categories included in the Thiel article.
Resource scarcity appears to be at the other end of the "importance scale". It
never created enough connections to expand and get a strong foothold. In
fact, economics as a science participated in defining resource scarcity
(almost defining it away entirely). It may be claimed that this environmental
problem was more closely connected to human perception and intervention

209
than the others examined in this chapter, i.e. that later environmental
problems have been more "natural" and outside human communities than
resource scarcity. It is impossible to say whether it has been a deliberate
strategy for scientists involved in environmental issues to turn away from
environmental problems where economists may have definition power, or
whether it is just associated with the problems that nature has to offer.
However, a specific feature of resource scarcity as an impact category is that
its formation was based on a general computer model. When 'reality'
produced results deviating from the model, the impact category lost its
impact. Nevertheless, resource scarcity is still lurking in the background in
the later stages of the descriptions, as indicated (for example) by the
inclusion of the impact category in an LCA article on car fenders.
In summary, the Environment* has expanded both in space and time.
Although resource scarcity refers to global effects, the trend has shifted from
the already black-boxed local impacts of emissions of the early 1970s to the
regional impacts of acidification and eutrophication in the late 1980s to the
all-encompassing impacts of climate change from the late 1990s. In relation
to time, the local impacts were mostly acute, the regional with a certain
longer time-span, while the global impacts have also incorporated an almost
infinite view of time. The concern is not only here and now, but also how
our grandchildren or their grandchildren will be affected by today's
emissions.
Even if the Environment* has proved to be different from the stereotypical
view of the environment, there are few, if any, elements that resembled the
stereotypical view of the economy.119
Whether the Environment has any
resemblance or connections to the Economy* will be the issue for the next
chapter, as will the mechanisms for establishing such connections.
119
Except, maybe, for the rationality involved in the scientific endeavours.

210
5. Connecting the economy and the environment
You may have noticed that the asterisks connected to the words "economy"
and "environment" have disappeared in the heading of this chapter. The
capital letters and asterisks have been used to denote the part of the economy
and the part of the environment that are involved in the life of bumper
beams. In this chapter we are moving outside the Economy* and the
Environment* into the larger (still undefined) networks of the economy and
the environment. This is also being undertaken because I firmly believe that
the descriptions of the Economy* and the Environment* (i.e. the elements
they consist of) actually represent images of how the economy and the
environment work.
The working of the Economy* and the Environment* was presented in the
two previous chapters, including the important elements for each. Some of
the fundamental questions about the working of the two networks have been
answered in this text. The aim of the thesis was, however, not merely to
produce two separate descriptions of the economy and the environment in
isolation - the aim was to explore the space where the two networks meet.
We thus need more insight into the connections between the Economy* and
the Environment* to say something meaningful about the relations between
the economy and the environment (e.g. what the relations consist of and how
they came about).
Elements that are common to both networks provide connections between
them and must be found and understood in order to understand the inter-
relationship. The chapter starts with an attempt at finding such common
elements, first by placing the timelines of the Economy* and the
Environment* (as presented at the end of the two previous chapters) in the
same diagram to see if any elements are part of both and then by including
supplementary information from the empirical chapters. Some of the
common elements are briefly presented. How these elements have become
shared is the next issue and I will discuss the direct and indirect routes that
the elements use to travel from one network to the other. Elements do not
normally travel by themselves. They are helped by mediators – vehicles for
translation – that accommodate the transfer between networks. The chapter
ends with a description of such vehicles for translation.
5.1 Common elements in the economy and the environment
To understand the relationship between the economy and the environment, it
is necessary to expose elements that are shared in both networks. Although

211
the networks themselves are theoretical constructions, the empirical chapters
showed that there are indeed differences in how the economy and
environment are produced and sustained. Hence, the compositions of their
elements are different. This means that most of the elements contained in the
economy have no direct connections to elements in the environment (and
vice-versa). Nevertheless, there are some elements that are present in both
networks.
No network in society is able to live completely on its own. Every network's
success is dependent to an extent on how it manages to connect to other
networks and to establish itself as the carrier of the right idea. This is
achieved in a process where important elements (or 'ideas') from one
network are allowed or even forced to travel to another. The element may
change character somewhat during the journey, but it should still be
recognisable when considered from the perspective of the original network.
It is almost like going in a supermarket in a country other than your home
country. The items on the shelves appear slightly different, although still
similar to those you find at home, but the names on the items are all
different120
. Translated to this thesis, this means that if an element travels
from the economy to the environment, an economist should be able to tell
that the element comes from the economy when it has become part of the
environment (and vice-versa).
In order to pinpoint such elements present in both the descriptions of the
Economy* and of the Environment*, it is useful to turn first to the timelines
to see if any of the important actors, resources and activities (in IMP
language) in the Economy* are similar to any of the important actors (in
ANT language) in the Environment*.
5.1.1 A recollection of the timelines
In Figure 5-1, the timelines for the economy and the environment are placed
alongside each other to see if there are any evident connections between
important elements in the Environment* and in the Economy*.
120
Of course not all brand names are different. It is highly unlikely that you will find
a supermarket anywhere in the world without, for example, Coca Cola.

212
Actors in the Environment* Year Activities, Resources or Actors in the Economy*
Black-boxed versions of local air pollution 1970121 Bumper making, cast house, extrusion press, roll
forming equipment, manual assembly, ÅSV, RA, Volvo
1971
Resource scarcity (re)appears and gets immediate attention
1972 Legal requirements, safety bumpers NHTSA
Resource conservation in bumper texts 1973 Oil crisis
Resource scarcity grows but is disputed 1974 Cast house, several new customers 1975
1976
1977 1978
1979 Plastic forming technology, Statoil
Resource scarcity fades away 1980 Plastic forming Acidification and eutrophication make their
appearance, but without major impact
1981 Paint factory established at Raufoss
1982 Roll forming ends 1983
The bumper (or even the automobile) has
almost disappeared from the environment
1984
1985
1986 Hydro acquires ÅSV, ALPROFIL is dissolved
Sustainable development introduced 1987 First hollow bumper beams Global warming is "confirmed", critical loads
are introduced
1988
LCA connects to SETAC, Emissions trading in acidification
1989
The first IPCC report 1990 Volvo and Renault form strategic alliance
1991 The Leiden guide 1992
1993 Introduction of LS-Dyna at Raufoss
Volvo and Renault want to merge, but fail The second IPCC report 1994 Bumper and bumper beam departs
Hydro acquires 40% ownership of RA
Industrial ecology 1995 New cast house, introduction of platform strategy International Journal of LCA 1996 Casting increased
Kyoto meeting 1997 Hydro acquires rest of RA
1998 Plastics production is moved, introduction of HAPS 1999 New extrusion press, several new documents
introduced, Ford acquires Volvo Global warming starts stealing all the attention,
other categories fading
2000 Hydro sells "plastics"
2001 New Leiden guide, safety is included as impact
category
2002
2003 New supplier policies from Ford 2004
2005
Global warming established as fact 2006
Figure 5-1 The timelines of the Environment* and the Economy* placed together
121
The elements (actors, resources and activities in the Economy* and actors in the
Environment*) displayed for 1970 were already present and were not introduced or
changed that specific year.

213
The first thing you notice about Figure 5-1 is the almost complete lack of
similar elements in the two networks. Although spotting similar elements
requires knowledge about what the short descriptions in the figure contains,
few obvious common elements are present. In fact, it looks like one story of
elements that have contributed to creating the economic properties of
bumper beams and a completely different story of elements that have
participated in the creation of the environmental characteristics of bumper
beams. One reason may be that the timelines were produced to highlight the
most influential changes in the Economy* and the Environment*
respectively, and thus minor events in each of the networks were left out.
There may still be common elements between the two networks that have
not been instrumental in any of the economic or environmental changes of
the properties of bumper beams. In other words, some parts of the
Economy* may be part of the wider environment without being part of the
Environment*, whilst some parts of the Environment* may be part of the
wider economy without being part of the Economy*.122
The finding (or perhaps non-finding) of few common elements reminds us
how little the two networks influence each other, which again may be one of
the reasons for the perceived conflict between the economy and the
environment as described in the introductory chapter of the thesis. The
content of each of the networks was, however, different from the stereotypes
given in the introduction.
In fact, the only elements with a resemblance in the two networks are the
pairs "resource conservation" – "oil crisis" and "local emissions" – "paint
factory at Raufoss". They may not seem similar at first glance, but once you
understand what the terms imply, they become entangled and almost equal.
This point is further elaborated in the next section.
In theory, it looked like it would be easy to make connections between the
environment and the economy, just by transferring elements from one to the
other. However, the text from the previous chapters shows that, in practice, it
is hard work to make elements count. The next section gives a brief
overview of some elements that have managed the task and are shared
between the two networks.
122
A practical consequence for the remainder of this chapter is that other
information from the empirical chapters has been included (in addition to what was
included in the timelines).

214
5.1.2 A short description of shared elements
The first element found in the case descriptions of both networks is
aluminium use. The idea of light weight connected to aluminium use has
been connected to elements in both the economy and the environment
throughout the entire time span covered in the empirical material. This idea
was further reinforced by the introduction of the concept of resource
scarcity. It shows up as a highly relevant environmental category in the early
1970s and, a few years later, as an important argument for choosing
aluminium bumpers in the economy. The concept refers to the possibility of
running out of natural resources and much of the underlying scientific
material was coupled to oil consumption. Meanwhile, oil consumption in
itself is also an element shared between the two networks and an element
that later shows up connected to other environmental elements. In both
periods where oil consumption has been the focus, it has also been connected
to the issues of light weight and fuel consumption in the economy. In the
environment, it was first connected to the danger of losing a resource
(although partly coupled to local emissions that were shared between the
economy and the environment from before 1970) and later coupled to
climate change.
Aluminium use has been connected to aluminium production in both
networks. The production of aluminium alloys of the right quality created
difficulties in the economy in the early 1970s, while the emissions
(especially fluorides) have been an important element in the environment.
Towards the end of the 1970s, however, aluminium production created fewer
difficulties for the networks. With an increased focus on recycling in the
environment during the 1980s, aluminium production and use started to be
viewed as more environmentally friendly. However, recycling did not make
much impact on the economy connected to the bumper beams, as the
companies never managed to create an efficient recycling system.
Test vehicles were found to have an impact on both the economy and the
environment. They are used for finding new designs, processes and materials
in the economy; when these have a lower impact on the economy, they are
taken up by the environment as examples of possible future directions.
Local emissions of harmful substances became a factor in the economy in
the early 1980s due to tighter Swedish legislation. There are traces of this
element being connected between the networks earlier on, but it is invisible
until the legal network becomes involved. The setting up of the paint factory
at Raufoss was one of the physical and visible consequences.
215
The two companies started using LCA in the late 1980s. This method was
instrumental in assembling various environmental impact categories in the
environment and creating an environment that focused on more than one
possible problem from one possible source. In the economy, it also
introduced new environmental concerns (e.g. acidification, eutrophication
and global warming) and wider boundaries for the environmental elements
in the economy (i.e. introduction of responsibility for phases other than just
the companies' production phases, e.g. raw material acquisition or the end of
the useful life of the products).
Trade came in as an element in the early 1990s. Being one of the building
blocks always present in the economy, it suddenly showed up in the
environment as one way of tackling emissions of medium- and long-range
pollutants (i.e. pollutants that have an impact on places other than where
they were emitted, e.g. NOx and SOx). This element was further reinforced as
being a natural part of the environment when it was introduced as part of the
science dealing with climate change, e.g. where CO2 quotas have
materialised.
Models for climate change have even imported imaginative decision-makers,
in order to make them agree on the valid time frame for analysing different
scenarios. The companies (in the economy) and the environment are thus
given an opportunity to create a relative environment, depending on
perspectives for the future.
Towards the end of the 1980s, sustainability became an important word in
the environment and its influence has grown over the years. Around the start
of the new millennium, sustainability really made its mark in the economy as
well, at least in the part of the economy busy creating printed material, as
sustainability reports became something companies (at least Volvo and
Hydro) should do. That the concept is shared between the networks should
be no surprise, considering that it encompasses both economic and
environmental issues in addition to social issues.
Safety has always been an important point in the economy connected to
bumpers, particularly after the introduction of the 1972 Safety Act in the
USA. Since the year 2000, the concept of safety has also started to become
an integrated part of the environment. The boundaries between safety from
environmental harm and from accidents are slowly fading away as both
issues are now included in environmental analysis.
Timeframe is an important factor when looking at the elements that are
shared. Sometimes elements may transfer more or less immediately between

216
the networks, while in other cases it may take years. It is useful to bear this
in mind when examining the transference of elements between the networks.
5.2 Direct routes that connect the economy and the environment
This section intends to give examples of the ways in which one of the
networks connects to the other and of the direction of flows. It shows two
different examples of direct travel routes between the networks and touches
on the consequences of the specific travel routes for each of the networks.
5.2.1 The first route: directly from the environment to the economy
The first route investigated is the one where properties from the environment
are transferred directly to the economy. The most obvious example of this
route is the everyday practice of industry where natural resources are
employed to create economic outputs (which can then be employed in other
networks). However, these transfers of natural resources and money are
partly disconnected from a discussion of the networks, because they are so
well black-boxed that they are almost never an explicit issue. What the
empirical material has focused on is those issues that have questioned what
the networks really consist of, or that have tried to expand or alter the
networks' compositions. Even though natural resources and money are
intriguing and difficult concepts when one starts to think about them, they
are so well integrated into most human activities that they are taken for
granted. How could anything be produced without input of natural
resources? And how could the economy be sustained without the means of
money? These questions could form the basis for numerous theses, but are
not treated extensively here. Rather, the following section will discuss
examples where controversies exist, such as where new entities in the
environment are transferred to the economy.
The method of life cycle assessment (LCA) could have been an example of
an indirect route, where something from the environment was translated to
the economy through the political and/or legal network(s). The US
Environmental Protection Agency, however, turned down the idea in the
beginning of the 1970s that REPA (the historical predecessor of LCA) could
be used to control impacts on the environment caused by industry.
Nevertheless, many companies started using the method and it represents the
possibility of direct introduction from science to industry, hence its inclusion
in this discussion of the first route.
Volvo was a relatively early adopter of LCA and even contributed to the
development of weighting tools for LCA through its involvement in

217
developing the Environmental Priority Strategy EPS system from 1989
onwards. According to Resetar et al (1998):
"Two important factors that contributed to the success of the EPS
project were the support of experienced, senior management on the
industrial side (e.g., the Volvo Group Vice President) and
knowledgeable scientific researchers. Generally, industry members
worked with the scientists to build consensus on the model ground rules
and system boundaries. The scientific details were left to the scientists"
(p. 110)
A weighting tool like EPS is a ranking scheme for various environmental
impacts to support a simpler comparison of the environmental consequences
of a product. LCA and EPS were thus accompanied by the involvement of
numerous environmental categories and even consideration of what to save
the environment for and from. Volvo was also made more aware of the
entire life cycle. No longer was it enough just to control the company's own
processes; even the product itself had to ensure environmental "savings",
including the cars' use phase and after the end of its useful life.
Information from LCAs began to be published along with more technical
information for consumers. Today, customers can go to the Volvo homepage
and compare the environmental performance of different Volvo models.
Volvo also tried to employ LCA as a design tool to make environmentally
informed decisions in the development of new models, but this has stopped
as, according to an environmental manager at Volvo: "We always know
what the result will be. Emissions of CO2 will overshadow everything else."
Instead, they use simple checklists to ensure that the issues of chemicals use,
pollutants and weight reductions are included in the development of products
and processes.
Hydro was also an early user of LCA, but apart from a study of the bumpers,
there was little cooperation in this field between the two companies. The use
of LCA did, however, mean that the two companies could communicate
about environmental issues with a common language connected to life cycle
thinking.
If we follow the trails to those who commission LCA studies in industry, we
normally end up in an environmental department. Such departments
themselves often contain examples of the first route. The environmental
department is set up to communicate environmental issues inwards in the
business organisation by translating elements from the environment into
elements that are understandable in industry. For instance, when there is a
change in the environment that may affect business, the environmental

218
department is responsible for tackling this.123
To be able to perform such a
role, the department must be equipped with environmental competence.
Thus, there are theories or theoretical elements travelling directly from the
environment to the economy. If you visit the environmental departments in
either Volvo or Hydro, you will find that several of the people have been
educated in environmental studies. The people themselves (or perhaps rather
the competence they bring) are transferred from the environment to the
economy. However, there is a danger that they may lose their connections to
the environment if they do not succeed in continuing with links to scientists
involved in producing the environment.
Another example where the environment is transported directly into the
economy is in the form of test vehicles. Not all test vehicles come into this
category, simply those that are specifically developed to pollute less. Few
ordinary cars demand the use of extensive research.124
To keep costs down,
known methods, machinery and materials are employed. Alternative
materials, designs, propulsion systems and ways of manufacturing are tested
in so-called test vehicles. We encountered a few examples both in the
description of the Economy* and of the Environment*. In addition to being a
test of what cars can be produced in the future, surveys are performed both
in literature and in industries to see what technologies exist. The Light
Component Project car discussed in the Economy* case was one such test
vehicle, accompanied by research by Volvo and the suppliers.
A simple sketch of direct travel from the environment to the economy is
given in Figure 5-2.
123
"A change in the environment" refers to new elements (actors) being emphasised;
for instance an increased focus on one environmental impact category on the
expense of others. 124
Although there are certainly high development costs, these are mostly related to
known processes and materials.

219
Figure 5-2 Elements travelling directly from the environment to the economy.
The diagram shows how an element is made ready to travel from the
environment at t1, while at t2 the connection is made to other entities within
the economy. The element that moves has to retain connections to nodes
within the environment in order to be a true connection point. A more
thorough description of the way elements move is given under the discussion
of vehicles of translation in Chapter 5.4.
To an ethicist, this route may be comforting. The possible betrayal of the
'pure' environment is short-circuited by introducing the environment directly
into the economy. A further plus is this route's ability to create a positive
attitude towards the environment amongst company employees. The
environment that is brought into the organisation may make it easier for the
employees to defend their working in an industry that is attacked for being
polluting. Another positive element, connected to that covered above, is that
companies can control the costs for environmental measures better, as they
choose the level of commitment themselves.
Still, it means less force is put behind the environment. No control
mechanisms are in place to check that there is compliance between the
companies' voluntary environmental claims and their actual resources and
activities. Hence, this route may give business actors an environmental
identity without being connected to an alteration of activities and resources
in a more environmentally friendly direction.
t1t2
Economy
Environment
t1t2
Economy
Environment

220
In summary, this route has a positive flavour due to its high degree of
voluntarism. The danger is that companies may decide to do nothing other
than employing an "environmental" language.
5.2.2 The second route: directly from the economy to the environment
As for the first route, there is also an obvious route for transporting elements
from the economy directly into the environment, i.e. the use of financial
resources to create scientific outcomes. New descriptions, re-descriptions or
confirmation of old descriptions of the environment are dependent on the
economy. Financial resources are needed to carry out environmental
research and industry is responsible for developing and manufacturing
artefacts needed for producing science (from pencils, notebooks and printing
presses to complicated machinery for running experiments). Although there
may be instances with heroic truth-seeking researchers who devote their
lives to wrestling with nature and all its secrets, the spreading of such
knowledge is intimately connected to organisations, journals, book printing
and other capital-intensive technologies, as described in the chapter on the
Environment*. The economics of research are seldom discussed in
environmental articles, yet there is an inevitable link between the research
performed and the money ready to support research. However, as for the first
route, travel directly from the economy to the environment is more
concerned with the ideas that travel than the physical resources - although
these are often entangled.
The environmental research performed in industry is an obvious example of
this route. Thus, the Thiel article, i.e. the starting article for capturing the
Environment*, is yet another example of one element (or more) travelling
from the economy to the environment. The content transferred into the
environment was an empirical matter - the emissions related to aluminium
bumper beam production. It gave an example of how industry creates
environmental properties. In addition, by focusing on three specific impact
categories (acidification, eutrophication and climate change), the article
contributed to stabilising the contents of the environment. The strength of
environmental categories lies in their employment and the Thiel article is
participating in the definition of what constitutes an important category.
More generally, articles produced in industry for the environment contribute
to defining what materials and production processes are actually used and
should therefore be the objects of study for the environment. The
environment is seldom absolute and the viable industrial alternatives usually
define what good environmental practice is.

221
Another example of an economic practice participating in defining the
environment was shown in the construction of the 'resource scarcity' impact
category. The impact category lost its momentum as the result of industrial
improvements in processes (as well as better estimation techniques).125
Even
if, perhaps, it contained a true description of a serious problem, the economy
responded and dissolved the whole actor-network termed 'resource scarcity'.
The consequence was not just that resource scarcity vanished as an impact
category; it also paved the way for focusing on other issues - other
environmental problems - thus indirectly affecting the course of the
environment.
Although the thesis has not looked in great detail at the models underlying
the way activities, resources and actors are organised in business, references
have been made to how production philosophies from Japan spread in the
1980s and thereafter. These production philosophies contain ideas about
production with zero waste and have influenced the way environment is
depicted, e.g. in industrial ecology. Common terms have been used to
describe industrial and natural life, and environmental scientists have
developed terms describing resource efficiency that were not present earlier.
The environment has become all the more calculable, partly as a
consequence of being included in accounting (Asdal 2005). Although it did
not show up in the Economy*, both Volvo and Hydro have included
environmental figures in their annual reports. The way the environment is
described in terms of balances of inputs and outputs is made to resemble the
way accounts are recorded in business. This way of presenting
environmental figures has contributed to make the environment even more
numerical and disconnected from nature.
Both companies have been and continue to be involved in sponsoring
universities, professors and specific university programs. For example, the
initiation of the Industrial Ecology programme at the Norwegian University
of Science and Technology was very much due to Rolf Marstrander in
Hydro Aluminium. He had heard about the theoretical concept and initiated
a project group and financing. This is, again, a direct link from the economy
to the production of environment. Yet, despite close connections between
industrial ecology and the company Hydro in general, and Hydro Aluminium
in particular, the production site at Raufoss has not been able to close the
loop. The project initiated to recycle the bumpers and later bumper beams
125
This is not referring to the economists involved in the scientific debate on the
"resource scarcity" issue. On the contrary, these economists probably kept the
category alive even longer by creating engagement amongst environmental
scientists.

222
from Raufoss was abandoned, as the material collector in Sweden demanded
too high a price for the end-of-life aluminium. The rhetoric may be in place,
but ideas about industrial metabolism have not materialised due to financial
constraints. The refrain is "we have to stay in business in order to implement
environmental measures." – implying that the finances must be handled first.
Even if travel from the economy to the environment has been smooth, the
journey back again (according to the first route) has failed. This is perhaps
no surprise, as the commitment has only been to provide economy for the
environment, not the other way around.
A simple sketch of the route directly from the economy to the environment is
shown in Figure 5-3.
.
Figure 5-3 Elements travelling directly from the economy to the environment.
The environment has become affected by elements introduced from the
environment and it is clear that that economy influences what the
environment is by 1) altering the ways the environment is defined, 2) giving
support to some environmental issues but not others, 3) providing ideas
about resource efficiency and 4) providing finances for specific
environmental programs. Therefore, the economy both introduces new actors
to the environment and alters those already present.
There is a danger for business activities if the transfer has not been
completed to the degree where laymen understand the economic elements as
belonging to the environment. Companies are easily given the blame when
t1 t2Economy
Environment
t1 t2Economy
Environment
223
the environmental label is put on practices that the outside world understands
as economic. The danger of this direct route from the economy to the
environment is that if it fails to make its way into legislation, the public may
see this action as a false attempt at creating an environmental image, instead
of environmentally sound practice. Thus, even if both the costs for the
company and the environmental impacts are reduced, there may be adverse
effects on the revenue side. Neither Volvo nor Hydro has experienced this
phenomenon to a degree where it has been publicly discussed (or taken up
by any of the interviewees). There has been no investigation of whether
failed attempts by the companies to communicate environmental friendliness
have had any impact on individual purchase decisions. There are, however,
examples from the automotive industry of companies who have been
punished for arguing too loudly about their outstanding environmental
performance when the public have disagreed with the way it has been
presented. You may say that there are few automobile purchases that are
made on the basis of environmental criteria, meaning that the monetary
punishment, i.e. the decrease in revenues, is relatively minor. However, the
niche market that actually finds environmental criteria important does not
accept false claims about environmental friendliness. Advertising standards
agencies in several countries have received complaints about misleading ads
- for example, Lexus had to withdraw a campaign in the UK (Anonymous
2007).
5.3 Indirect routes that connect the environment and the
economy
There is no reason to believe that elements from any of the two networks can
only be transferred directly between them. The descriptions of both the
Economy* and the Environment* contain examples of connections to other
networks that are involved in the transferring of elements. This section gives
examples of indirect routes along which elements can travel between the
economy and the environment.
5.3.1 The third route: from environment through other network(s) to
economy
When thinking about how the environment and the economy are linked, one
of the most obvious routes to imagine is that environmental issues are
produced by science, translated into legislation and transported into the
economy as constraints on production. The environment is thus often part of
the unseen restrictions imposed on industry by governments and of the
management tools that ensure compliance with such restrictions. In other
words, the environment is inserted into business in the shape of rules and
regulations affecting choice of technologies and materials that can be
224
employed. This means that the environment only comes to the fore in
economic life when it poses constraints or opportunities, and these are often
already translated into economy, frequently in the form of a cost. Of course
the environment is also present in the shape of the reservoir where inputs to
production are collected and where emissions from production are disposed
of. There are several examples of this third route connected to the bumpers
produced in the relation between Volvo and RA/Hydro.
In the chapter on the Environment*, we saw that impacts from local
emissions of pollutants were already black-boxed in 1970.126
In fact, they
had already made their way into legislation. Organic solvents from paints are
examples of such local emissions. Although regulations were already in
place during the 1970s, it was only when legislation was strengthened at the
beginning of the 1980s that Volvo had to cut down on emissions from their
paint factory.127
The solvent emissions limit had direct consequences for the
development of the plastic cap. First, Volvo chose an unpainted version to
avoid the need for extra painting. This was connected both to environmental
arguments and to avoiding extra costs. When the legislation was further
strengthened in 1980 at the same time that Volvo decided to use painted
bumper caps, RA had to set up facilities for painting at Raufoss, otherwise
Volvo would have exceeded its emissions limit at Torslanda.
The example shows how scientific knowledge translated into legislation (e.g.
emission limits on pollutants) has had a direct effect on the actors, resources
and activities involved in producing bumpers. We understand that two other
networks were involved in the travel from the environment to the economy
even without following the trails, namely the political network and the legal
network.
You may say that the example involves a paradox, as the total emissions of
pollutants probably increased rather than decreased - RA had to build a
whole new facility and probably had less ability to control emissions because
of smaller volumes. The important point here though is that the environment
was still local at the beginning of the 1980s. The idea of relating
environmental policy to products and chains of producers to ensure that
emissions are lowered per product was still more than a decade away.128
126
Local emissions denote the pollutants that are transported only over short
distances and hence only create local impacts. 127
I have not managed to find a scientific rationale for the strengthening of the
environmental law, as it does not contain references to any scientific articles and my
study did not take me outside the networks of the economy and the environment. 128
This later development may also involve a paradox, as it does not consider
whether there is an increase in output.

225
The other prominent legislation in the case was the bumper standard
included in Federal Motor Vehicle Safety Standard 215 in the USA.
Although the standard focused on safety, which was not part of the
environment at the time it was enforced, it demanded that stronger bumpers
should be mounted on cars. To avoid excessive weight increases on cars, the
carmakers were pushed to find materials other than steel. Aluminium was
the strongest candidate. The environment was involved indirectly, as the
connection between the car's weight and its emissions was a part of the
environment. This instance of the environment travelling to the economy via
legislation is, however, not as clear-cut as the example with limits on
emissions of organic pollutants from the paint factory.
Over the last two decades of the period covered in the case, the scientifically
produced environment has had an even greater impact on legislation, with
the focus being placed on the contribution of pollutants such as NOx, SOx
and CO2 to acidification, eutrophication and climate change. Scientists have
been instrumental in determining the acceptable emissions levels. At the
same time, legislation has become more and more product-orientated. There
has been a shift from focusing on point sources for emissions, i.e. the
production facilities, to the entire life cycle of products. This has led to so-
called "extended producer responsibility", where the manufacturer of the
final product is responsible for the environmental impacts all the way from
the acquisition of raw materials to the disassembly of the product and the
recycling or disposal of materials. This change has also put pressure on the
carmakers to increase their knowledge of environmental impacts, as they
must be able to handle environmental impacts other than those directly
related to their own production sites or the use phase of their products.
A simple sketch of the general route of elements travelling from the
environment to the economy through mediator(s) is shown in Figure 5-4.

226
Figure 5-4 Element travelling from environment to economy through mediator(s).
The diagram shows how an element from the environment is brought into
another network at t1, (usually the legal network), where it is connected to
other elements (usually legislation). The element then travels to the economy
at t2, together with some of its newly established connections.
To some occupied with ethics, this route may be troublesome. The route
involves translating the environment into entities that are more pressing in
the daily life of the companies. Thus, one may claim that the environment is
taken into account (almost literally) for the wrong reasons, not to save the
environment but to avoid some kind of punishment such as a fine or a forced
stop of continued production (i.e. for economic reasons only). This means
that companies are then likely to refuse to take a proactive stance and
emissions will only be reduced to the legally acceptable level. Furthermore,
by being introduced via the legal network with threats of fines, it is
unsurprising that companies see the environment as being a burden.
The environment then continues to view the economy as a network that only
thinks about sustaining itself and does not consider wider consequences for
the planet.
t1t2
Economy
Environment
Other network
t1t2
Economy
Environment
Other network

227
This indirect route presents a real possibility of inducing changes in the
economy, where activities and resources must be aligned to the demands
posed by legislation. It may therefore be a viable route for making changes
happen. There is, however, a danger that the detour through other networks
makes the element transform into something with too much flavour from the
legal network and too little from the environment. For instance, it may be
that many compounds become nothing more than a legal level, rather than
reflecting all the information about the potential consequences of releasing it
into nature. This may also create adverse effects on elements in nature, when
legislation forces measures such as recycling systems instead of encouraging
and supporting decreases in the use of natural resources in the first place (in
the design phase).
5.3.2 The fourth route: from economy through other Network(s) to
environment
While the third route may have seemed obvious, the fourth one, involving
the transfer of elements from the economy to the environment via one or
more other networks, is less so. This may stem from the image of the
environment as something in need of protection from the ruthless economy,
while the economy has been so busy with its own development that it has
had no interest in trying to influence what the environment is through
alliances with other networks. There are, however, examples of industrial
practice that have been taken into the environment through a third network.
When regarding the environment as consisting of all natural resources
creating input to industry, this route perhaps appears as normal as the
previous ones. There are numerous examples of the problems faced by the
economy that have been regulated before they have become part of the
environment, the scientifically produced environment that is. Such examples
include waste handling issues and work-related hazards.
As explained in the methods chapter and in the chapter on the economy, the
basic working of the economy is exchange and constant attempts are made to
lower the costs for both parties involved in the exchange. In order for
exchange to take place, the object of exchange has to be specified, or
commodified, so that property rights can change hands. The environment has
resisted commodification for a long time, but during the work on
acidification legislation in the USA, trading schemes were developed by
economists and mixed with elements from the environment to produce a
market for trading emissions. In the Kyoto process, when submitting
proposal about what the Kyoto protocol should contain, the US delegates

228
suggested the inclusion of emission quotas. As we know, CO2 quotas and the
trading of emissions became a reality in the Kyoto protocol and it also
affected the research process on climate change afterwards. CO2 emissions
became calculable, tradable entities suitable for exchange. However,
although the transport industry is covered by the Kyoto protocol, the
aluminium industry is not. Thus, business opportunities may be created for
aluminium bumper beams as a consequence of the protocol. Car
manufacturers have used the development of engine technology as the main
instrument in order to decrease fuel consumption and improve emission
standards over the last few decades. However, the development still cannot
pass the theoretical limits, which makes aluminium (or other lightweight
materials) ideal for reducing weight and hence fuel consumption and
emissions.129
As a result, the inclusion of this element from the economy in
the environment has provided aluminium bumpers with a competitive
advantage in the economy.
A simple sketch of this route is given in Figure 5-5.
Figure 5-5 Elements from economy travelling to the environment via other
network(s).
129
The Volvo series of smaller cars have therefore always had steel bumpers
(obviously not produced by RA or Hydro), as most cheaper cars do.
Economy
Environment
Other network
t1 t2Economy
Environment
Other network
Economy
Environment
Economy
Environment
Other network
t1 t2
229
The diagram shows how an element from the economy is brought into
another network at t1 where it is connected to other elements. The element
then travels to the economy at t2, together with some of its newly established
connections.
A similar opposition may exist in relation to the fourth route as to the third
route, namely that the economy is translated into an entity not reflecting the
true content of the economy. Instead of transporting all the processes and
details necessary to produce efficient exchange in the economy, only a
schematic image of the economy enters the environment. Thus, in addition to
affecting the environment, the travel also reinforces the opinion of other
involved networks that the economy-network is only occupied with a naïve
form of buying and selling.
There are also many voices arguing against setting a price on nature, which
is often said to be priceless. Although emission quotas put a price on
emissions, they indirectly value the potential impacts stemming from the
emissions. Where the environment has often stopped at a stage between the
emission and the real impact (the stage of increased temperature in the case
of CO2 emissions), the inclusion of economy makes the environment stop
even earlier – at the emissions stage. All the knowledge connected to the
pathway of emissions becomes hidden and the level of emissions becomes
connected not to the tolerable levels in nature but to a (some would argue
artificial) market, as it is derived from political targets. The fourth route thus
encourages actors in the environment to focus more on politics and the
economy than science.
5.3.3 A summary of travel routes
The economy and the environment are connected by transferring elements
from one to the other. This can be done either directly between the networks
or indirectly through another network in a total of four different ways, as
summarised in Table 5.1 below.

230
Table 5-1 Characteristics of the different travel routes.
Example Consequence
Direct
Environment –
Economy
LCA imported into the
economy directly from research
institutions.
Elements are transferred in
original state, retaining
connections in the
environment while being
present in the economy. Small
incentives for creating strong
bonds to nodes in the
economy.
Economy –
Environment
Materials, production
technologies and philosophies
imported into the environment
from articles or reports.
Defines what elements the
elements in the environment
are related to (e.g. what
industrial processes need to be
assessed). Accusation of false
claims if connections to
elements in the environment
are too weak.
Indirect
Environment –
Economy
Environmental element brought
into legislation. Legislation
enforced in economy.
Binds elements from the
environment to elements
already present in the
economy. Elements from the
environment are connected to
elements from other networks
and may change character.
Increased pressure in
connecting.
Economy –
Environment
Emissions trading included in
climate change after
commodifying CO2
The original element from the
economy may be distorted,
creating a stereotypical view
of economy in other networks.
May hamper the connections
from stressors to consequences
in the environment.
Table 5-1 shows examples of the four different routes and what
consequences travelling the routes may bring. Travelling a direct or an
indirect route creates different consequences for how the elements are
perceived upon arrival and also for what connections the elements carry.
Networks are therefore affected by the way in which the transfer occurs.
Indirect routes lead to a greater risk of altering the original element as it
becomes connected to elements in the network(s) it travels through. There is
also a greater chance of the element actually becoming connected at the final
destination, because the extra nodes connected to the element lend it more
weight.

231
The words 'direct' and 'indirect' may imply that one is simpler and/or faster
than the other. There is, however, no reason to suspect that going directly
from one network to the other is easier than travelling an indirect route. The
important factor is how easily the element can be assimilated into the
network it is travelling to. A detour to another network may therefore make
the transfer both faster and easier. The legal network, for instance, contains
elements to control actors, resources and activities in the economy, but it
does not in itself produce the desired direction of control. This means that
elements from the environment, e.g. the specific polluting substances and
threshold values for emissions, are inserted into legislation almost without
alteration. The resulting laws and regulations are transferred to the economy
in a known format and although the actors in the economy may lack the
knowledge on how to act technically on the environmental measures that
must be carried out, they normally have enough know-how to understand
and relate to the specific legal texts, as legal texts are also used to control
elements from the economy in the economy itself.130
The statement that elements from the environment travel in this way to the
economy without alteration is only partly true. Although the names of the
compounds and their dangerous levels of emissions are carried from one to
the other, they do change character, as they are disconnected from many
elements that are present in the environment. In other words, the concept of
'carbon dioxide' in environmental text is different from 'carbon dioxide' in
legal text within the context of the economy – but the basic element can still
be identified as the same in both.
Elements do not often travel between the networks by themselves. They
need other elements to facilitate such travel. The other elements – the
mediators – are designated vehicles for translation and covered in the next
section.
5.4 Vehicles for translation
The different examples of travel routes between the economy and the
environment have shown that there are a range of different mediators (also
referred to as 'transporters' or 'vehicles for translation') between the economy
and the environment. Vehicles for translation are routines, reports,
organisations, human beings or other actors (using ANT terminology) that
transport an element from the environment to the economy or vice-versa.
The following is an attempt to lift these mediators out of the analysis to look
130
Legal texts have been instrumental in defining and developing fundamental
elements in the economy, such as property rights (see for instance Polanyi (?))

232
at their characteristics. First, however, we need a more detailed definition of
the premises that allow the content of one of the networks to travel to
another. This will be followed by a description of some of the different
mediators.
5.4.1 Ideas are more or less substantial
An idea within somebody's head can be the foundation of creating new
business practices or producing scientific findings.131
However, in order to
become more than an idea in the head of a single individual, it has to be
rendered material in some form. A direct consequence of following this line
of thought is that ideas have to be situated in actors (to use ANT
terminology) or in either actors or resources (to use IMP terminology). This
is confirmed by Welch and Wilkinson (2002), who write: "Idea logics are
confounded with actors and resources in the current AAR model…"132
However they continue the sentence by: "but [idea logics] have their own
character and structure which impacts on network structure and operations,
and interacts with the other three dimensions."
Håkansson and Waluszewski (2002) also differentiate between an image
level (where ideas reside) and an activity level (where actual actors,
resources and activities reside):
"The idea structure is important in relation to the activated structure in
at least two ways. First, it is an interpretation of the activated structure,
providing an analysis of why it works as it does, including an
interpretation of the technology involved. Second, the idea structure can
also be seen as a source for making conscious changes in the activated
structure" (p. 74).
This divide between an idea structure and an activated structure is introduced
to explain that industrial systems consisting of heavy (both in terms of
finances and weight) machinery may be difficult to change. That is, the
activated structure imposes constraints on what ideas can be pursued so that
even clearly good ideas become hard to implement. Examples of this were
seen when the 'safety bumper' was introduced, when plastic caps were
introduced and when the bumper beam became hollow. For the latter, the
idea was to make a lighter bumper beam with crash characteristics that were
as good or even better. Although the idea in itself should mean less cost as
131
According to ANT thinking, it is perfectly possible that non-humans may also
carry ideas, but understandably they are hard to explore. 132
The AAR model is identical to the ARA model - they have just switched the
letters round.

233
less material has to be employed, the resultant difficulties with adjusting the
activated structure created losses for RA and later Hydro.
Such an argument for stability may appear to conflict with ANT's basic
assumption about a world in flux in which stability requires explanation.
However, it can be argued that any sustaining production network consists of
a number of black boxes – technologies that are so well established and so
interwoven with each other that they are taken for granted. Existing
production technologies fit well with the idea of such black boxes - and
black boxes are, by definition, stable. Furthermore, there is no separation
between ideas and actors in ANT. Ideas can be actors, as well as the
common denominator of an actor-network. The stability of ideas is also
connected to the material degree of their composition. We saw in the
Environment* chapter that the credibility of scientific texts is assured
through the material composition (or 'heaviness') behind the results. In other
words, for an idea to be deemed trustworthy, it needs to establish
connections to a number of physical entities.
In light of this, my claim is that ideas are more or less substantial. This may
have consequences both for their ability to travel and for the impact they can
produce on the economy or the environment. To say that ideas are
substantial is not to say that they are things if, by things, one understands a
separate entity with physical presence. A substantial idea is also an idea put
into words and made ready to travel through texts. This form of ideas is the
one most largely employed in science, where the use of referencing and
journals has cemented its position. Such a concept of 'ideas-as-text' (as
shown in the chapter on the Environment*) is also frequently connected to a
wider network of physical entities, including thermometers, laboratories,
computers etc.
The description of the routes for connecting the economy and the
environment may have given the impression that something, in other words a
clearly delimited entity, is carried from one network to the other, meaning
that the entity completely leaves the first network to become part of the
other. However, this is not what I am suggesting, because then the entity
would not be able to provide a common ground between the two networks.
Instead, the element, be it an idea or a more physical entity, is connected to
both the environment-network and the economy-network, thus providing a
common node in the two networks. The node does not necessarily look the
same when viewed in the economy-network as when viewed in the
environment-network. For instance, will the understanding of emission
quotas be different depending on whether the economic or the environmental
characteristics are emphasised?

234
Staying with emission quotas, they also provide an example of how a less
substantial idea can be used to avoid too great a change in production
structures. Instead of trying to influence a lot of individual resources
(facilities and products), emission quotas are used to reshuffle the production
structure and thus focus on creating fewer emissions in total. From the
perspective of the economy, it could therefore have been a good idea to
introduce emission quotas for organic pollutants at an earlier stage. Instead
of having to build and invest in a paint factory at Raufoss, Volvo could have
bought emission quotas from RA and expanded their own facilities.
However, the environment would have refused such a solution, as organic
pollutants are coupled to local environmental impacts. This means that the
specific site where emissions occur is of importance.
One of the basic ideas behind economising in business is cutting costs by
employing fewer materials and/or less energy in production. This idea is
clearly connected to the basic idea behind "environmentising", where less
material and energy use aligns with less environmental impact. The hollow
bumper beam is a good example of this, as all parties were pleased with the
outcome in comparison to the earlier solid bumper beams. RA/Hydro
achieved better margins as the price of the product decreased, Volvo could
pay less, the owner of the car benefited from better fuel economy and the
environment experienced fewer impacts.
5.4.2 Mediators between the economy and the environment
After having established that ideas must be partially material to be able to
travel, it is time to look at the means employed to make them travel. In order
to travel the routes between economy and environment shown in the
previous sub-chapter, ideas from each of the network need vehicles
(mediators).
The following text goes through a list of such mediators present in the case.
The list is probably not exhaustive, but it lays the foundation for a better
understanding of how different networks communicate. Whether the
environment travels directly to the economy or via other network(s), the idea
is that travel needs help to accomplish the transportation. Other networks are
not seen as mediators themselves - an actor (in the ANT sense of the word)
is always needed to do the logistical work. The vehicles must be part of
networks themselves, but they are not necessarily the common nodes that are
established through their mediation.

235
Test vehicles133
The importance of test vehicles in attracting new customers is unclear, but
their importance as production experiments is undisputed. When introducing
new models in the automotive industry, only small changes are made in the
way they are produced when compared to previous models. The trend has
been to change less and less in terms of materials, components and
production technologies from one model to the next, as was shown in
relation to platform development within Volvo. To explore different
materials, components and production technologies, a small series of so-
called test vehicles is produced. These vehicles are also used to highlight
possible future avenues for a car producer in motor shows.
The development of bumpers in Volvo test vehicles has included the
deliberate connection of industry and science. Although at first glance the
causal direction has been to create industrial output from scientific input
rather than to create scientific output from industrial input, the latter
direction has also appeared as a consequence of the first. Industrial elements
such as materials and processes are used as input in environmental science
and test vehicles have provided analyses with new materials and processes
whose environmental impacts can be compared with those already in use.
The realisation of the Light Component Project car showed possibilities both
with regard to what was economically feasible and more environmentally
friendly. Thus, test vehicles are special in being an arena in which elements
suitable both for the economy and the environment are made, often
simultaneously. One could say they function as guidance for future versions
of both the economy and the environment.
Figure 5-6 below shows the transfer between the economy and the
environment as mediated by a test vehicle with an environmental focus, such
as the Light Component Project.
133
It is only a funny coincidence that a vehicle is treated as a vehicle for translation.

236
Figure 5-6 Test vehicles as vehicles for translation between the economy and the
environment.
Figure 5-6 shows the test vehicle as an element produced and present in the
economy and how it works to translate elements between the economy and
the environment. In the initial phase of developing the test vehicle, it is
nothing but an idea, a vision of something that can be driven. The first
period (t1) involves collecting information from the environment. This
information is compared with what is possible in the economy and translated
into materials and processes during the second period (t2). One can say that
the industrial processes, including not only activities but also actors and
resources, are partially aligned to the environment. The third period (t3) is
the actual production and testing of the test vehicle, where the industrial
capability of testing the environmental ideas is put on trial. The fourth and
last period (t4) concerns the transportation of information back to the
environment. Here, materials and processes are once again translated into
wording to fit articles, books and databases. The information may lead to
additions, subtractions or substitutions in the actor-network that constitutes
the environment. The test vehicles may therefore perform two simultaneous
roles in relation to both networks. One is a "reality check", where industrial
processes are compared to scientific descriptions. This happens in both
directions. The second is the potential expansion of each network due to the
importation of elements from the outside (i.e. the other network). The two
initial stages of importing elements from the environment into the economy
are quite limited in time and last for a short portion of the project period. The
last stage of importing elements from the economy back to the environment
Test vehicle
t1t2
t3 t4Economy
Environment

237
is much less certain – indeed, there is no guarantee that this stage will ever
take place.134
Test vehicles create the opportunity to translate knowledge from the
environment into the economy and vice-versa. There is, however, a risk that
the level of commitment may become lower in both networks. Although
possibilities are displayed in each network, the actual connection between
nodes may be too weak to bind the economy and the environment firmly
together.
Legislation
Legislation provides a means to act at a distance. Actors in the economy are
well aware of the legal framework in which they operate and although they
may try to cheat, legislation always carry a risk of punishment. The text
containing the legislation and the apparatus put in place to enforce this
legislation ensure that elements are transferred from one network to another.
However, the fact that legislation resides within a legal network also carries
the threat that the environment will be distorted on the way, so that the
environment will be coloured by the legal network to the extent that the
environment is no longer visible. 135
There are two instances in the case where legislation explicitly plays a part
in connecting the economy and the environment. The first instance is the
issuing of the bumper standard in the USA. Although the standard was not
directly connected to the environment, it became important to introduce
environmental arguments for the use of aluminium bumpers. This was
because the standard forced manufacturers to increase the weight of bumpers
in order to comply with legislative demands and car weight was already
coupled with the environment through the issue of fuel consumption and
associated emissions. As aluminium could be used to meet the standard
without an excessive bumper weight increase, aluminium suddenly became
environmentally friendly. More specifically, it led to a closer relationship
between Volvo and RA and it expanded RA's customer base.
The second instance was the reduction in the limits of organic pollutants in
Sweden. These limits were introduced in the discussion of the decision to set
134
Just as a test vehicle built for aims other than testing more environmentally
friendly materials or technologies will only bring elements from the environment to
the economy by pure luck. 135
Only the route from environment to the economy is discussed, as this is the most
often employed route. To the author‟s knowledge, and as explained earlier, there are
few examples of the economy entering legislation that leads to an impact on the
environment.

238
up a paint factory at Raufoss, rather than expanding facilities at Torslanda.
Elements in the economy were changed, reflecting how legislation forced
elements from the environment to make an impact. Furthermore, the
harmonisation between Volvo and RA increased as a consequence of change
in legislation.
The examples show the strength of legislation. It makes things happen to a
greater degree than events that result simply from a knowledge of the
environment. No new knowledge was introduced in any of the cases, that is
to say that the environment was not changed, but the changes in legislation
still led to actual restructuring in the economy. It is, however, disputable
whether the changes were actually in a more environmentally friendly
direction.
Figure 5-7 shows how legislation participates in the process of transferring
elements from the environment to the economy.
Figure 5-7 Legislation working as a vehicle for translation for transferring elements
from the environment to the economy.
At t1, elements from the environment are disconnected from several of the
nodes in which they are in contact with in the environment, and they are
brought into a legislative text. New connections are established with
elements in the legal network, such as threats of fines and a control
apparatus to check legal compliance. At t2, the elements from the
t1t2
Economy
Environment
Legislation
Legal network
t1t2
Economy
Environment
Legislation
Legal network

239
environment, together with the legal elements, are brought into the economy
to establish connections between elements in the economy, the legal network
and the environment.
Neither the economy nor the environment is in control of which elements are
transferred and/or the time at which the transfer occurs. The prioritising of
elements to be included in environmental laws is not in the hands of the
scientists producing the environment (although some are participating in
defining acceptable levels of emissions, for example), but rather in a
combination of other networks such as the media network or the public
network (including e.g. NGOs).
The consequences of using legislation as a vehicle for translation may be
that neither the environment nor the economy ends up feeling that their
needs are heard. In fact the case is the opposite: the economy may develop
an image of a troublesome environment that forces the economy to
reorganise without any gains, whilst the environment does not establish
sufficient or sufficiently strong bonds to nodes in the economy to get an
impression of a real impact. In other words, the economy appears to only
answer to legislation and not to real environmental needs.
Non-governmental organisations (NGOs)
NGOs are interest organisations that work to further a cause in a basically
idealistic fashion. At least that is how they appeared a few decades ago.
Since then, the larger NGOs, such as Greenpeace, have become more and
more professionalised. The focus here is on NGOs involved with the
environment.
Just as in Håkansson and Waluszewski (2002) where the Swedish furniture
producer IKEA uses a relationship with the environmental NGO Greenpeace
to make a recognised standard for recycled paper, Volvo invited Greenpeace
to its production facilities at the beginning of the 1980s. In both examples,
Greenpeace is seen as a carrier of the environment and is allowed to directly
influence business practices, although the ideas Greenpeace bring to the
company may be altered or never actually materialise in the production. Pehr
Gyllenhammar explained his and Volvo's involvement with Greenpeace like
this:
"I saw engagement between business and NGOs as a vital step in
furthering understanding between both parties and in plotting a more
responsible path for Volvo itself…[This] engagement was repeated in
the later 1970s, when we were subject to a challenge from Greenpeace.
The story provides a useful example of how things can go well, of how
the energies of confrontation can be harnessed to produce a positive

240
outcome for all parties. On the one hand, Greenpeace had identified the
automotive industry as a primary source of environmental degradation.
It did not know, but it suspected that our production processes violated
the environment. In Volvo, we were concerned to deliver a first class
product, which met the vital societal need for personal travel. We were
concerned that all aspects of our business should be conducted to the
highest standards. We already had an environmental policy, which was
in full operation. It targeted us to seek to avoid waste, to avoid pollution
and to promote the highest levels of safety both in our factories and in
our products…[It] seemed to me to be wholly sensible to invite
Greenpeace into our business, for them to take a good look around and
for us both to have an exchange of views. I saw that we could learn
from their concerns in our quest for ever better production and products
with reduced impacts on the environment and they could learn from us
about the practicalities of the automotive industry in the hands of a
concerned producer…[It] was a fruitful exchange. We did not trade
insults from entrenched positions. We listened to one another and
profited from one another. This successful example of engagement has
now subsequently been replicated many times over in subsequent
relations between NGOs and business."136
Gyllenhammar actually explains the transfer that may occur. The statement
"Greenpeace could learn from us about the practicalities of the automotive
industry in the hands of a concerned producer" carries the implicit meaning
that Greenpeace would carry such information back to the environment.
Greenpeace was also instrumental when revealing the different views of
Ford and Volvo in relation to the Kyoto protocol in 2001 (Anonymous
2001). Volvo had explicitly supported the Kyoto protocol during the 1990s,
whereas Ford was reluctant to accept the protocol, apparently on the grounds
that developing countries did not have to take their share of emission
reductions. This difference in stance did not pose a problem until Ford
acquired Volvo in 1999. However, when a Greenpeace journalist made a
Volvo spokesperson reveal that their position was the same in 2001 as in the
1990s, hectic activity took place in the two organisations to achieve a
consistent position. It could have been a risky game, one in which Volvo
would have had to adjust their proactive role in terms of the environment
but, instead, Ford adjusted its position and came closer to Volvo's.
Although it may be questionable whether NGOs are actually part of the
environment when the environment is characterised as scientifically driven,
the assumption here is that NGOs are carriers of the environment as
produced by science. Most NGOs use the environment produced by science
to further the issues that they are championing. That said, they rarely
136
Excerpt from Pehr Gyllenhammar‟s Gothenburg speech

241
participate in producing scientific outputs and use other channels – or
networks if you like – such as mass media for the purpose. This does not
mean, however, that their output is irrelevant to environmental science.
Public opinion and engagement are important in establishing which scientific
projects are granted funds and attract scientists (whatever comes first).
Another point connected to this is that NGOs carry the threat, much like
legislation, of another network acting upon the economy. The companies
may feel a real threat through the NGOs connecting the company (an
element in the economy) to an element from the environment such as a
harmful substance and leading the media network to create negative
publicity for the company. Once again, this may lead to a decrease in sales
or negative attention from authorities.
Figure 5-8 shows how the NGO functions as a vehicle for translation
between the networks.
Figure 5-8 Displaying how an NGO works as a vehicle for translation for
transferring elements between the economy and the environment.
NGOs pick elements from the environment at t1, which are transferred to the
economy at t2. The delay between these two stages may be substantial, as the
latter requires the NGO to approach or be approached by a company (if the
NGO does not include the extra step of going through a newspaper or
t1t2
Economy
Environment
NGO
Public network
t3 t4
t1t2
Economy
Environment
NGO
Public network
t3 t4
242
another media channel to push the element into the economy). If the
company actually involves itself in a dialogue with the NGO (as Volvo did),
knowledge about industrial processes is transferred to the NGO at t3. This
knowledge (i.e. these elements from the economy) may again find its way to
the environment at t4, given that the NGO communicates with the scientific
community involved in producing the environment. In a similar way to the
test vehicle example, NGOs appear to be much more efficient in getting
elements from the environment into the economy than getting elements from
the economy in the opposite direction.
The above quote from Gyllenhammar also shows that engaged individuals
have an important role in mediation – remembering that NGOs normally
consist of a number of engaged individuals. Without Pehr Gyllenhammar
inviting an NGO inside the gates of the factory, the economy and the
environment would still be in opposition.
Engaged individuals
Both the economy and the environment are inhabited by numerous
individuals that participate in defining what the networks are and are not.
Some of these individuals may be instrumental in creating connections
between different networks and it is this engagement that is emphasised
here.
The first engaged individual we met was Pehr Gyllenhammar, who stated
Volvo's environmental policy at the UN meeting in Stockholm in 1972. By
so doing, he committed the company to including environment in its
operations and provided the possibility of including environment as one of
Volvo's core values. He is recognised as being the key figure in establishing
a concern for nature in Volvo. Even his ideas about organisation of the work
environment are now starting to be translated into environment, as damages
to human health from the work environment are making their way into LCA
and environmental assessments. One of the physical imprints left by
Gyllenhammar was the Kalmar factory, where Volvo has tried to reverse the
belief in the conveyor belt and instead create workstations where the same
people are responsible for assembling almost an entire car. Parallel to his
commitment to the environment, he has been the brain behind several of
Volvo's investment projects during his time as CEO of the company.
We have also met Rolf Marstrander in Hydro Aluminium, who participated
in the set-up of the industrial ecology programme at NTNU. He has brought
the concept of industrial ecology into Hydro, as well as financial resources
into environmental science.

243
In addition, there are numerous nameless individuals who, through their
engagement, have participated in bringing elements from the environment to
the economy. This does not exclude elements going in the other direction.
Contact between individuals in business organisations and scientists leads to
information from the economy being included in the environment. Baumann
(1998) studied the use of LCA in industry and emphasised the role of the
"LCA entrepreneur" in introducing and spreading such a tool in companies.
Employees in the environmental department in Volvo were instrumental in
starting to employ LCA as a tool in the company and also encouraging
participation in research about the EPS system.
Although the thesis itself has downplayed the role of the individual actors, as
both underlying theories (IMP and ANT) have emphasised the importance of
other actors (in ANT terminology) or activities and resources (in IMP
terminology), this does not discount the potential for human beings to create
bonds between nodes. IMP and ANT are reacting to theories that locate all
the abilities to create stability or change in human actors while disregarding
other matter. In fact, the theories and this thesis recognise that human
individuals are often necessary agents to direct elements and therefore
connect nodes.
One of the dangers to companies and perhaps to the environment is that
engaged individuals may leave the organisation. Much of the environmental
knowledge is often associated with a single person and it disappears when
that person disappears, making individuals volatile vehicles of translation.
Thus, although individuals may be good at making elements from the
environment travel to the economy, companies must use other means to tie
the elements to other existing elements in the economy in order to make the
connections last.
Figure 5-9 shows how engaged individuals participate in transferring
elements between the networks.
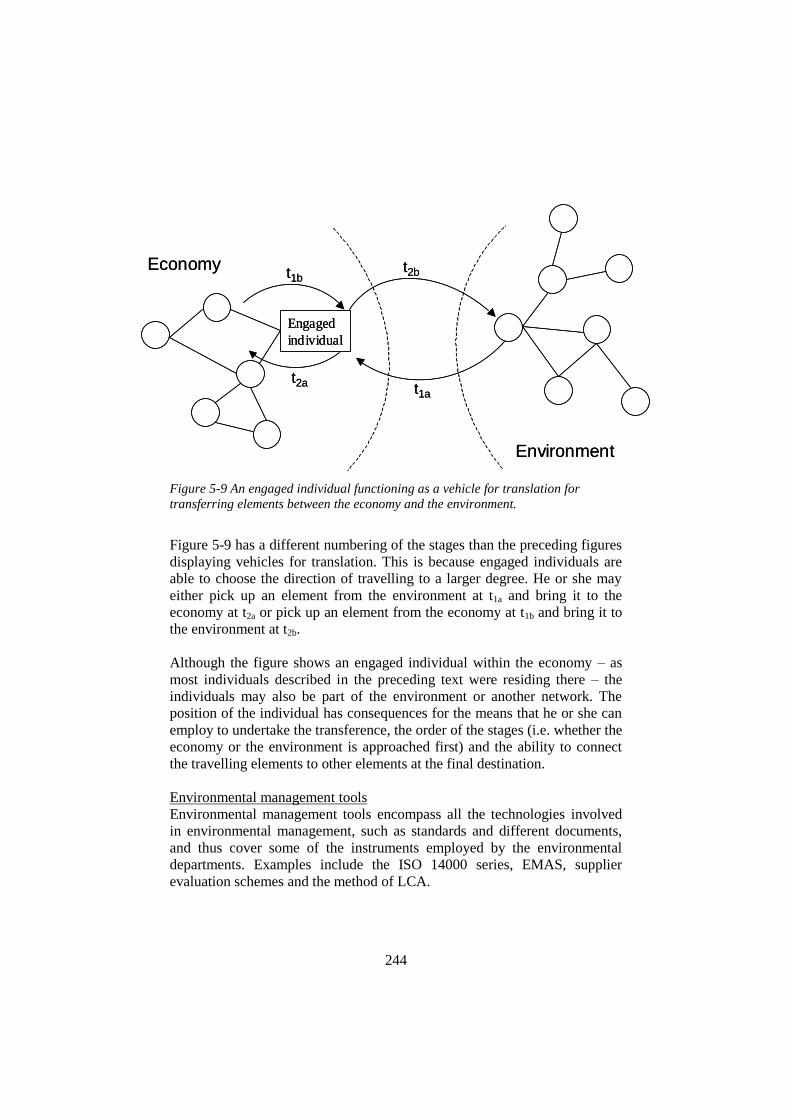
244
Figure 5-9 An engaged individual functioning as a vehicle for translation for
transferring elements between the economy and the environment.
Figure 5-9 has a different numbering of the stages than the preceding figures
displaying vehicles for translation. This is because engaged individuals are
able to choose the direction of travelling to a larger degree. He or she may
either pick up an element from the environment at t1a and bring it to the
economy at t2a or pick up an element from the economy at t1b and bring it to
the environment at t2b.
Although the figure shows an engaged individual within the economy – as
most individuals described in the preceding text were residing there – the
individuals may also be part of the environment or another network. The
position of the individual has consequences for the means that he or she can
employ to undertake the transference, the order of the stages (i.e. whether the
economy or the environment is approached first) and the ability to connect
the travelling elements to other elements at the final destination.
Environmental management tools
Environmental management tools encompass all the technologies involved
in environmental management, such as standards and different documents,
and thus cover some of the instruments employed by the environmental
departments. Examples include the ISO 14000 series, EMAS, supplier
evaluation schemes and the method of LCA.
Engaged
individual
t1a
t2a
t1bt2b
Economy
Environment
Engaged
individual
t1a
t2a
t1bt2b
Economy
Environment

245
The management tools are constructed with the aid of vehicles of translation,
for instance the International Standards Organisation (ISO). This process of
creation was briefly touched upon in the description of the Environment*, as
science is an important contributor of input. Here, however, the emphasis is
on how the ready-made environmental management tools residing in the
economy function as vehicles themselves.
ISO 14001 and EMAS are environmental management systems that provide
a framework for companies to document environmental figures such as
resource use, waste generation and emissions. In the process of documenting
the figures, the elements from the environment become connected to the
industrial process and thus become elements from the economy. In a similar
way to legislation, this means that the tools have an ability to bring elements
from the environment with a certain force behind them. The force is less
than for legislation, as the regime connected to document compliance carries
a lesser threat of negative consequences than the legal network. However,
the positive effect of this is that the introduced elements may be viewed as
something the company wants to work with rather than something it has to
comply with.
Provided that they include similar environmental elements to the
aforementioned management systems, supplier evaluation schemes have a
similar effect in forcing suppliers to incorporate those elements in their
operations.
There is a danger associated with both standards and evaluation schemes that
the elements from the environment may become disconnected in the process,
losing their links to the environment and becoming merely figures reported
from production.
LCA is a different story, with the method's close association to the
environment as produced by science. While companies have a tendency to
declare: "Yes, we are certified" when it comes to ISO 14001 and EMAS
without any further specification, LCA is used to produce and communicate
actual environmental figures. LCA has the ability to bring a large number of
elements from the environment to the economy and simultaneously to ensure
that the links to the environment are in place. Close links back to the
environment even make it possible to bring elements from the economy (e.g.
specific production processes and products) back to the environment. LCA
may therefore seem like a perfect vehicle for translation, but the complexity
of the method (i.e. the large number of elements and the inherent need for
specific knowledge of both the environment and the economy) means that it
is not easily accessible for most actors. This complexity can reach absurd
levels when the output from the tool always ends up with the single

246
conclusion – due to the almost sole focus on climate change – that the
emission of climate gases must be reduced. The last point has led Volvo to
reduce its use of LCA because of this issue.
Figure 5-10 shows the stages involved when environmental management
tools are employed as vehicles for translation for transferring elements from
the environment to the economy.
Figure 5-10 An environmental management tool working as a vehicle for translation
for transferring elements from the environment to the economy.
The diagram shows how environmental management tools include elements
from the environment at t1. When employed in a company at t2, the elements
are connected to the daily operations of the company and therefore to the
economy. In the earlier text, references were made to how the application of
LCA may make it possible to bring elements from the economy back to the
environment. However, this route is not shown in the diagram, as it demands
other vehicles of translation for travel. Performing an LCA internally in a
company does not lead to expansion or specification of the environment if
the results are not transferred to the environment in forms such as numbers
in a database or journal articles.
Reports
The reports referred to here are reports published by business organisations,
e.g. annual reports, environmental reports and sales brochures. This means
that the vehicles of translation examined here mostly work as mediators from
the environment to the economy, as textual output from business
organisations is mainly directed towards the economy.
Environmental
managment. tool
t1t2
Economy
Environment

247
Starting in the mid-1990s, both Volvo and Hydro included environmental
figures alongside the economic figures in their annual reports. Hydro
introduced the concept of eco-efficiency in 1998 and started reporting it in
1999, based on emissions or resource use divided by the economic value of
product. The reporting changed again in 2001, using product volume as the
volume indicator. The report includes graphs that are measures of
environmental elements mixed with measures of elements from the
economy. Eco-efficiency measures such as greenhouse gas emissions per ton
of product place environmental data on top of economic data. The fraction
line provides an interface between the elements from the two networks and
the resulting figure is actually connecting one or more nodes in the
environment with one or more nodes in the economy. The question that this
poses is whether and how these connected nodes manage to remain
connected to other nodes in the networks. The resulting hybrids of the
economy and the environment may be too unfamiliar to be approved by any
of the networks.
In 2003, Hydro's environmental figures were put into a separate
environmental report, allegedly to promote greater attention. However, the
risk with an environmental report is that it might not seem connected to the
economy - so whilst the aim is to give the environment enhanced status, it
may instead be ignored.
On the way from environmental reports to sales brochures, elements from
the environment become more and more stereotyped, and thus more and
more likely to be removed from the original connections in the environment.
At the same time, sales brochures may be closer to the "pure" economy – to
the original focus on exchange – and thus better connected to elements
present in the economy than an environmental report. There seems to be a
trade-off between keeping connections to elements in the environment and
ensuring that connections to elements in the economy are made.
An environmental product declaration (EPD) is a mixture of an
environmental report and a sales brochure. Based on data from LCA and a
standard format for presentation, the EPD is supposed to give objective
environmental information about a product to a potential purchaser. Volvo
first employed EPDs as early as 1995. Although the EPD does not contain
commercial information, the standard format for simple presentations of
environmental figures makes it possible to include elements from the
environment in purchasing decisions. The requirement of an LCA
underlying the presented results ensures that links to the environment are
kept intact.

248
Figure 5-11 shows how reports functions as vehicles for translation between
the networks.
Figure 5-11 A report works as a vehicle for translation for elements between the
economy and the environment
The diagram shows that elements from the environment (as well as elements
from the economy) are included in a report at the first stage (t1). At the next
stage (t2), the elements from the environment are allowed to impact on other
elements in the economy. However, there is no guarantee that this will
happen. Reports are lasting and the connections that are made between
elements will be in print for years, but reports may bring less commitment
and can easily be left on the shelf. It is also possible that the report will be
taken up by scientists producing the environment (shown as the dotted line
happening at stage t3), and that the elements from the economy therein will
be connected to other elements in the environment.
Environmental departments
This category of vehicles for translation may immediately look like an
expansion of former categories. Isn't an environmental department just a
larger group of engaged individuals? Such a suspicion is further emphasised
by the inclusion of people from environmental departments in the former
category. However, an argument can be made for considering environmental
departments as being a different creature – a different vehicle for translation
– from the engaged individuals. Part of the reason for this is that the
instruments with which the environmental department is equipped (such as
environmental management tools) represent a place in the organisational
Report
t1t2
t1t3Economy
Environment

249
hierarchy and channels for reports. Environmental departments can thus be
viewed as an assembly of other vehicles of translation or a vehicle-network,
where the combination of elements creates something different from what
can be created by the individual vehicles within the department.
Environmental departments are more or less deliberately set up to be
mediators between the environment and the economy. Related closely to
industrial production, they are instrumental in providing necessary
information for making environmental decisions. They also work to translate
industrial production into environmental figures for outward communication.
They are therefore expected to bring elements from the environment into the
economy in relation to production and products and to bring elements from
the economy to the environment via conferences and journal articles (often
in cooperation with scientists at universities).137
Volvo has reorganised and decentralised environmental responsibilities on
several occasions. For example, they have used internally focused
environmental departments to take care of elements from the environment
connected to factories and processes, while using externally focused
environmental departments to handle elements from the environment
associated with products. Attempts at decentralising can be looked upon as
attempts to ensure that every employee is an engaged individual, making the
company fully equipped with human vehicles for translation. However, the
ability to function effectively as vehicles for translation may be severed if
connections to the environment are missing due to individuals not having
access to appropriate technologies (i.e. environmental management tools) or
nodes in the environment. The strength of the central environmental
department lies exactly in the combination of elements that produces
trustworthiness in both networks.
The position of the environmental department within the economy, but with
responsibility for elements from the environment, creates both possibilities
and hindrances: possibilities because it is clearly allowed and even expected
to bring elements from the environment into the economy and because when
bringing elements to the environment, they will almost certainly retain
connections to elements in the economy; hindrances, because the
environmental mandate may lead to it being overlooked by elements in the
economy and the placement in the economy may lead elements in the
environment not to acknowledge the elements it brings.
137
The environmental department is also expected to be the contact point in
communication with environmental authorities, thus keeping connections to nodes in
other networks that are also linked to the environment.

250
Figure 5-12 shows how an environmental department contributes as a
vehicle for translation for transferring elements between the economy and
the environment.
Figure 5-12 An environmental department functioning as a vehicle for translation
for transferring elements between the economy and the environment.
Figure 5-12 resembles Figure 5-9, as it shows the role of engaged individuals
as vehicles for translation, in that environmental departments can also
choose which direction they will support in transferring elements. Either an
element from the economy can be taken up by the environmental department
(at t1b) and transferred to the environment (at t2b), or the environmental
department can pick up an element from the environment (at t1a) and transfer
it to the economy (at t2a). One of the reasons why both engaged individuals
and environmental departments are free to choose their direction is their
continuing presence as vehicles for translation. This contrast with elements
such as test vehicles or NGOs, which are only physically present in
conjunction with the economy for short time periods (although the elements
they have transferred may make a continuous impact).
Thanks to their "heavier" connections to other physical entities,
environmental departments are less volatile vehicles of translation than
individuals, but their actual ability to mediate the transfer of elements is
dependent on the structure and routines provided for contact between the
environmental department and nodes inside and outside the economy.
Environmental
department
t1a
t2a
t1bt2b
Economy
Environment
Environmental
department
t1a
t2a
t1bt2b
Economy
Environment

251
Research institutions
Volvo and Hydro (and earlier RA) have always had close contact with
research institutions, especially in order to advance production technologies.
Typically in the Nordic countries, research is often carried out in universities
and research institutions with sponsorship from companies, rather than being
performed in the companies themselves. In terms of environmental matter,
we have already encountered scientists from Chalmers University involved
in developing the EPS system. We have also seen the close links between
Hydro and the industrial ecology programme at the Norwegian University of
Science and Technology (NTNU).
Research institutions function in almost the same way as legislation,
providing the economy with elements from the environment. The advantage
compared to legislation is that the elements may travel in a more "pure"
form, without connecting elements from any other network to those from the
environment. That is also the main disadvantage. The elements travel to the
economy without much commitment in connecting them to elements already
present in the economy. The transferred elements may end up unused,
isolated and forgotten. Thus, research institutions are efficient in transporting
elements from one network to another, but perhaps not as efficient in
ensuring that the elements remain held in place.
However, unlike legislation, research institutions are also capable of carrying
elements from the economy to the environment. Real production
technologies and processes are carried back to the environment and
connected to relevant elements. However, research institutions are not
necessarily the ones initiating this transfer. For example, engaged individuals
or environmental departments in the economy may employ research
institutions as writing partners in transferring elements from the economy to
the environment.
Figure 5-13 shows how a research institution works as a vehicle for
translation for transferring elements between the economy and the
environment.

252
Figure 5-13 A research institution working as a vehicle for translation between the
economy and the environment.
The diagram demonstrates how a research institution resembles an NGO in
terms of the stages involved in transferring elements between the economy
and the environment. Elements from the environment are taken up at t1 and
introduced to the economy at t2. When in contact with companies, research
institutions pick up elements from the economy at t3, which are transferred to
the environment at t4. In contrast to Figure 5-8 showing NGOs, the line
denoting the stage at t4 is not dotted, as research institutions with scientists
involved in the production of the environment are expected to transfer
elements to the environment.
There may be several examples where the stage at t2 is bypassed, where
research institutions approach business organisations to collect elements
from the economy and insert these into the environment without leaving any
elements from the environment behind in the economy.
Computer software
As shown in the descriptions of both the Economy* and the Environment*,
computers and computer software have played an instrumental role in
developments during the last decades. The ability to store and combine large
amounts of information has had a great impact on automotive design,
supplier handling, climate models and LCA, to name but a few examples.
t1t2
Economy
Environment
Science network
t3 t4
Research
institutions
t1t2
Economy
Environment
Science network
t3 t4
Research
institutions

253
Each of these fields has developed as the result of simpler access to
historical information compared to that of a printed archive, greater accuracy
when performing drawings or calculation compared to a piece of paper and
the ability to perform a larger amount of calculations simultaneously. In
addition to software participation in the development of specific fields, it
also makes it possible to put elements from the economy and the
environment together and make them influence each other, e.g. using design
tools or in Internet publishing.
A wide variety of different computer software is involved in the construction
of a car. Simulations of the different characteristics (e.g. weight, costs,
resource input and crash characteristics) of the different components of the
car are all communicated to a software programme, ensuring that the desired
design of the car remains possible. Elements from the environment are thus
introduced alongside other elements in the making of a car. There is,
however, no guarantee that the environmental elements are actually given
any weight in the decision between different alternatives for components. In
fact, there is a larger propensity for focusing on the elements more closely
connected to the economy, such as costs and functional characteristics. If a
decision based on these characteristics also carries more and/or heavier
connection to elements from the environment, it is often pure luck.138
Internet publication of elements from the economy and the environment
offers the chance of an increased spread, but it is perhaps more questionable
how strongly it ties Volvo and Hydro to any environmental obligations. The
user of the web page is granted access to environmental information and it is
placed on the same level in the hierarchy as financial data, a company
presentation etc. Thus, on one hand, the Internet publication does not
discriminate between elements from the economy and from the environment.
On the other hand, there is no commitment and no obligations that force any
user to actually look at them. This means that connections to other nodes in
either the economy or the environment may be weak.
Figure 5-14 displays the process of transferring elements between the
economy and the environment with computer software acting as a vehicle for
translation.
138
This assumes that more entanglement between the economy and the environment
is for the good (this being the underlying premise of this thesis).

254
Figure 5-14 Computer software working as a vehicle for translation for transferring
elements between the economy and the environment.
The diagram shows how computer software is able to pick up elements from
the environment at t1a and transfer them to the economy at t2a; or to pick up
elements from the economy at t1b and transfer them to the environment at t2b
in the same way as engaged individuals and environmental departments.
Computer software can also reside in all networks, in the same way as
engaged individuals. Placement within the economy in Figure 5-14 is shown
in this way because the computer software described in the preceding text is
placed there.
5.4.3 A summary of vehicles for translation
The transfer of elements between the economy and the environment (in
either direction) is accommodated by mediators referred to as 'vehicles for
translation'. Some of their important characteristics are summarised in Table
5-2.
Computer
software
t1a
t2a
t1bt2b
Economy
Environment

255
Table 5-2 Characteristics of different vehicles of translation
Vehicles for
translation
Residing
in
network
Travel routes
employed
Strengths Weaknesses
Test vehicles Economy Directly from
environment to
economy, and
directly from
economy to
environment
Creates
opportunities to
explore the
economy of
environmental
improvements
Does not carry
much commitment,
the information is
partly sealed
Laws and
regulations
Legal To economy from
environment via
other network and
possibly the
opposite route
Has the potential to
put pressure behind
the transfer
May alter the entity
into a legal form
and miss important
actors from the
environment
NGOs Public Directly from
environment to
economy
Can quickly
respond to changes
in the environment
or economy
because of loose
couplings
Carries less weight
because of loose
couplings.
Engaged
individuals
All* All Large potential in
connecting nodes
Connections leave
if individual leaves
Environmental
management
tools
Economy From environment
to economy and
possibly the
opposite
Great amount of
connections and
suitable for the
economy
Can lose sight of
the environment
Environmental
departments
Economy All Great amount of
connections and
suitable for the
economy
Can lose sight of
the environment
Research
institutions
Science
(and
Economy)
From environment
to economy and
from economy to
environment
Efficient in
transferring
elements
No commitments
involved
Reports Economy From economy to
environment and
possibly the
opposite
Creates lasting
connections
between elements
Can easily be
overlooked and left
on the shelf
Computer
software
All All Makes connection
between elements
easily
No commitments
involved
* Although we have only met people from industry, i.e. the economy, here
From Table 5-2 it becomes evident that none of the presented vehicles for
translation represents only advantages (or disadvantages for that matter).

256
Those that are most efficient in transferring elements seem to carry the risk
of disconnecting the elements from the original network, while those that are
most efficient in securing connections to nodes in the two networks seem to
be slow-moving and inefficient in the transfer process.
All the vehicles presented here seem much more directed towards and
efficient in transferring elements from the environment to the economy than
along the reverse route. This may stem from having used an industrial
product as the tool to produce knowledge about the two networks. The focal
element is residing in the economy and much more connected to what
happens in the economy-network than in the environment-network. Thus,
important vehicles for translation for travelling the opposite route may have
been overlooked. It is also possible that existing vehicles for translation are
more interested in transferring elements from the environment to the
economy than vice versa.
There are few elements acting as a direct response to the environment, i.e.
nodes (or actors) in the environment forcing themselves or other elements in
the environment to travel. Efficient vehicles for translation – those that
manage to bring elements across to the economy and make them stay – carry
with them the threat of another network acting on the economy, such as the
legal network or the media network. Perhaps nature itself is too far away for
any company to see the value in acting on its behalf. Perhaps the
environment has been too effective in translating nature into graphs and
numbers for anyone to smell the stench of pollution or sense the water rise.
Thus, the vehicles such as legislation and NGOs that are most efficient in
mediating travel for elements from the environment to the economy are also
those with the highest risk of disconnecting the elements they carry from the
environment itself.
The different vehicles for translation have different longevity in the
networks. Some (e.g. engaged individuals and environmental departments)
are physically present and ready to transfer elements for long time periods,
while other (e.g. test vehicles) are only present for shorter periods of time.
This does not mean that the elements the test vehicles transport are short-
lived - they may stay in the networks for much longer than any individual or
department. However, the test vehicle after completion cannot adapt to
accommodate changes in the networks as individuals or departments can.
Although the vehicles have been presented one after the other, it will also be
obvious that often more than one appears simultaneously. In fact, in
accordance with the basic networking mode in ANT, there is probably a
need for more than one vehicle to make an impact. For instance, a test
vehicle needs engaged individuals in order to be created with a concern for

257
the environment. Furthermore, it needs reports to document the relevant
environmental issues and these reports may require an environmental
department or a research institution in order to be written.
The list of mediators and the connection to the ideas they carry underline the
fact that it may be difficult to differentiate between the ideas themselves and
the means used to transport them. Rather than being a problem of separation,
this can be understood as an opportunity for the involved ideas and
mediators to mutually influence each other. The substantial ideas and the
mediators that let them travel become mixed to such an extent that it can be
hard to sort one from the other.
The vehicles of translation may be seen as hybrid constructions consisting of
material from both the economy and the environment. To be effective in the
logistics involved in getting ideas from one to another, they must be able to
communicate in both networks. The word 'logistics' encompasses more than
just transport when used in a business process sense, i.e. the inclusion of
activities involved in facilitating transport and storage. In a similar way in
this example, the mediators cannot only be involved in transporting
substantial ideas from one to the other. They must also be effective in
enabling the usage of that which is transported in the respective network. As
an example, consider boat transport: it is not sufficient just to have a boat to
make transport by ship effective. Many physical installations – such as
quays, cranes and containers - and organisational "installations" such as
schemes and operating procedures are necessary accompaniments. The same
goes for the mediators; they must be like a ship, but also include the
surrounding infrastructure (cranes, quays etc.) that makes the substantial
ideas able to travel from within one network to within another.
This means that the vehicles for translation must be flexible in order to move
between the two (and perhaps other adjacent) networks, yet the flexibility
must not be so extensive that the vehicle is no longer fit to connect to nodes
in the networks.

258
6. Conclusion
The main aim of this thesis was to find out about the relationship between
the economy and the environment. The starting point was the apparent
conflict between these two networks in public discourse. In order to create a
manageable study, descriptions of the two networks were produced by
focusing on aluminium bumpers delivered to Volvo from Raufoss.
One important assumption for describing the economy was that its
production is closely connected to industry. The industrial network approach
(IMP) was applied to sort out important elements in the economy network
connected to bumpers (referred to as the Economy* within the thesis) from
1970 to 2006.
A similarly important assumption concerning the environment is that its
production is closely connected to science and thus that the images we have
of nature are to a large degree produced by natural sciences. The actor-
network theory (ANT) was applied to sort out important elements in the
environment network connected to aluminium bumpers (referred to as the
Environment* within the thesis) from 1970 to 2006.
The elements from each of the descriptions were placed together in an
analysis in order to find shared elements that could provide real interfaces
between the economy and the environment. I then specified the four
different routes that the elements can travel along and described the means to
make them travel.
6.1 Summary of main findings
In order to summarise the main findings, it would be useful to return to the
research questions posed at the beginning of the thesis. These are:
What elements are common in the Economy* and the
Environment*?
How did these elements become common?
Answering the questions requires insights into the elements of each of the
networks and how they have evolved. The process of capturing these has
resulted in knowledge of each of the networks as well, but before presenting
these, let us see what the thesis tells us about the relationship between the
economy and the environment.
259
6.1.1 The relationship between the economy and the environment
The descriptions of the economy and the environment revealed that the
emphasis of each coincides only to a very small degree, thus it can stated
that:
There are few common elements in the economy and the environment.
This finding may have been both trivial and expected. However, it may
explain why the relationship between the economy and the environment is
often portrayed as a conflict in public discourse.
Some basic elements are shared. Elements from nature are used as raw
materials in the economy and simultaneously constitute the elements that the
environment is to protect. Usage of the elements is thus frequently connected
to different – often opposite – ideas in the economy and the environment.
There are, however, elements to be found with similar characteristics in both
networks, such as ideas about trading and quotas. A connection between the
economy and the environment requires the sharing of elements, as it is only
through common nodes that networks can be connected. These elements
become shared by travelling from one network to the other and connecting to
nodes in the latter without losing connections to nodes in the former. The
next section will describe such travel routes.
Travel routes
In order to understand how elements are transferred from one network to the
other, four possible travel routes between the economy and the environment
were examined, showing that:
Elements can be transferred from one network to the other through both
direct and indirect routes.
The routes and some of their important characteristics are presented in Table
6.1.

260
Table 6-1 Travel routes for elements being transferred between the economy and the
environment
Example Consequence
Direct
Environment –
Economy
LCA imported into the
economy directly from research
institutions.
Elements are transferred in
original state, retains
connections in the environment
while being present in the
economy. Small incentives for
creating strong bonds to nodes
in the economy.
Economy –
Environment
Materials, production
technologies and philosophies
imported into the environment
from articles or reports.
Defines what elements the
elements in the environment are
related to (e.g. what industrial
processes that needs to be
assessed). Accusation of false
claims if the connections to
elements in the environment are
too weak.
Indirect
Environment –
Economy
Environmental element brought
into legislation. Legislation
enforced in economy.
Binds elements from the
environment to elements
already present in the economy.
Elements from the environment
are connected to elements from
other networks and may change
character. Increased pressure in
connecting.
Economy –
Environment
Emissions trading included in
climate change after
commodifying CO2
The original element from the
economy may be distorted,
creating a stereotypical view of
economy in other networks.
May hamper the connections
from stressors to consequences
in the environment.
As seen in Table 6.1, the presented routes were direct and indirect routes
from the economy to the environment and from the environment to the
economy. Travelling along a direct or an indirect route creates different
consequences for how the elements are perceived upon arrival and also for
what connections the elements carry. The networks are therefore affected by
how the transfer occurs. Indirect routes lead to a greater risk of altering the
original element as it becomes connected to elements in the network(s) it
travels through. However, it is also more likely that the element will actually
connect at the final destination because the extra nodes connected to the
element give more weight.

261
The words 'direct' and 'indirect' may bring connotations of one being simpler
and faster than the other. However, there is no reason to suspect that going
directly from one network to the other is easier than travelling along an
indirect route. The important factor is how easily the element can be
assimilated in the network to which it is travelling. A detour to another
network may therefore make the transfer both faster and easier.
Elements do not normally travel by themselves, but often require the aid of
mediators – vehicles for translation – to be transferred from one network to
the other. Examples of such vehicles for translation are presented in the next
section.
Vehicles for translation
When travelling both direct and indirect routes, the elements that are
transferred from one network to the other are assisted through being
connected to other elements - vehicles for translation – that are able to travel.
These vehicles for translation exist in a number of different shapes, thus:
Those elements that accommodate transferring between networks (i.e.
vehicles of translation) are heterogeneous.
To better understand what this means and what consequences it has, a list of
the vehicles for translation examined in the thesis and some of their
important characteristics are provided in Table 6-2.

262
Table 6-2 Vehicles for translation for transferring elements between the economy
and the environment.
Vehicles for
translation
Residing
in
network
Travel routes
employed
Strengths Weaknesses
Test vehicles Economy Directly from
environment to
economy, and
directly from
economy to
environment
Creates
opportunities to
explore the
economy of
environmental
improvements
Does not carry
much commitment,
the information is
partly sealed
Laws and
regulations
Legal To economy from
environment via
other network and
possibly the
opposite route
Has the potential to
put pressure behind
the transferring
May alter the entity
into a legal form
and miss important
actors from the
environment
NGOs Public Directly from
environment to
economy
Can quickly
respond to changes
in the environment
or economy
because of loose
couplings
Carry less weight
because of loose
couplings.
Engaged
individuals
All* All Large potential in
connecting nodes
Connections leave
if individual leaves
Environmental
management
tools
Economy From environment
to economy and
possibly the
opposite
Great amount of
connections and
suitable for the
economy
Can lose sight of
the environment
Environmental
departments
Economy All Great amount of
connections and
suitable for the
economy
Can lose sight of
the environment
Research
institutions
Science
(and
Economy)
From environment
to economy and
from economy to
environment
Efficient in
transferring
elements
No commitments
involved
Reports Economy From economy to
environment and
possibly the
opposite
Creates lasting
connections
between elements
Can easily be
overlooked and left
on the shelf
Computer
software
All All Makes connection
between elements
easily
No commitments
involved

263
Table 6-2 shows the vehicles for translation examined in the thesis and their
advantages and disadvantages. Those that are most efficient in transferring
elements seems to carry the risk of disconnecting the elements from the
original network, while those that are most efficient in securing connections
to nodes in the two networks seems to be slow-moving and inefficient in the
transferring process.
The different vehicles for translation have different longevity in the
networks. Some (such as engaged individuals and environmental
departments) are physically present and ready to transfer elements for long
time periods, while others (such as test vehicles) are only present for shorter
periods of time. This does not mean that the elements the test vehicles
transport are short-lived - they may stay in the networks for much longer
than any individual or department. However, the test vehicle after
completion cannot adapt to accommodate changes in the networks as
individuals or departments can.
Often more than one vehicle for translation appears simultaneously. In fact,
in accordance with the basic networking mode in ANT, there is probably a
need for more than one vehicle to make an impact. For instance, a test
vehicle needs engaged individuals in order to be created with a concern for
the environment; it also needs reports to document the relevant
environmental issues and this in turn may require an environmental
department or a research institution in order to be written.
The list of mediators and the connection to the ideas they carry highlights
that it may be difficult to differentiate between the ideas themselves and the
means to transport them. Rather than being a problem of separation, this can
be understood as an opportunity for the involved ideas and mediators to
mutually influence each other. The substantial ideas and the mediators that
let them travel become coloured to such an extent that it can be hard to sort
one from the other.
The vehicles of translation may be seen as hybrid constructions consisting of
material from both the economy and the environment. To be effective in the
logistics involved in getting ideas from one to another, they must be able to
communicate in both networks.
Although the primary goal of the thesis was to reveal properties of the
relationship between the economy and the environment and these constitute
the main findings, knowledge was also created during the descriptions of
each of the separate networks. This is the issue of the next two sections.

264
6.1.2 The content and the development of the economy
In the chapter on the Economy*, we could see how actors, resources and
activities changed as continuous actions, reactions, re-reactions etc. took
place. It was not just the interactions between the two actors in the
relationship containing the focal resource that determined future directions -
influences from relationships they had with other actors were also of great
importance. Through a series of interactions, Volvo and Hydro (RA) moved
relatively similarly to each other while the bumper changed character and
economic properties.
The development of bumpers during the period from 1970 to 2006 has
accentuated how actors, resources and activities interplay to affect what is
looked upon as economy.
The companies developed a strong relationship, starting from the date when
RA started producing bumpers for Volvo in the 1960s and continuing long
into the 1980s. During that period, RA became the sole supplier of bumpers
to Volvo and made heavy investments in plastic cap production and painting
facilities. It was shown that:
A relationship with close links provides stability and room for
development. Elements are adjusted towards greater harmonisation.
The technical elements (comprising actors, resources and activities)
generating revenues and costs are measured and understood with the aid of
organisational elements (also comprising actors, resources and activities).
There is thus an interaction between the technical and organisational
elements making up the economy.
The technical solutions developed by RA and ÅSV to build an aluminium
bumper that could accommodate US legislation at the beginning of the 1970s
created several new customers for RA. The company had shown that it was
indeed possible to create a strong bumper without having to increase weight
too much and several European car manufacturers exporting to the USA
became customers of RA in the first half of the 1970s. Volvo was the biggest
customer for RA throughout the period and as RA learnt (both in relation to
technology and to organisation) from other relationships, the bumpers in the
relationship between Volvo and RA improved as a result. Thus, one
conclusion is:
Having many relationships ensures access to various technologies and
opens the possibility for innovation.

265
In the early 1990s, the volumes going from RA to other customers than
Volvo increased and consequently the share of the total volume produced at
Raufoss for Volvo decreased; a trend that was enforced after Hydro's
takeover at Raufoss. Although substantial investments were made in plastic
cap production (for Volvo), this looked more like an investment to be able to
sell the whole plastics department rather than a specific investment for
Volvo. In fact, the intensity of the relationship decreased and contracts
became less obvious than in earlier decades as the year 2000 approached.
This showed that:
Maintaining a focus on a relationship consumes resources. There are
therefore difficulties involved in having many close relationships at the
same time.
RA's struggles in the early 1990s and Hydro's subsequent takeover of RA,
Volvo and Renault's attempt at merging in the same period and Ford's
acquisition of Volvo in the late 1990s all pointed at the need for a large
capital base in order to make investments. Such investments were necessary
to ensure technological development and future profit. Thus:
The ability to innovate and make profit is connected to financial
resources already present.
Resources, activities and actors normally develop in small, almost invisible,
steps from day to day. Only a few elements are able to affect the entire
network to such an extent that changes can be spotted immediately. The US
legislation connected to bumpers was an example of this.
6.1.3 The content and the development of the environment
In the chapter on the Environment*, we saw how series of translations have
turned nature into calculable entities – into graphs and figures – describing
potential environmental problems. During the period from 1970 to 2006,
many environmental issues have been at the top of the agenda. Some have
been refuted, some have been partly solved by technological measures and
some never managed to hold on the weight they had gained initially. The
bumpers' environmental properties thus changed several times during the
time period from 1970 to 2006, not so much because of actual changes in the
production or the composition or the weight of the bumpers themselves, but
more because the environment itself changed. A continuing focus on an
environmental issue requires a strong scientific base connected to potentially
severe consequences, or in more general terms:

266
The number of connected actors and their ability to become black-boxed
are determining the strength of environmental elements.
In order for an element to be connected to many others, it needs to be able to
be translated without losing direction. In other words, it must be flexible
enough to be contained in the network of other elements, yet strong enough
to also dictate the other networks' direction. This means:
An element in the environment attains stability by the ability to enrol
and align other elements
However, it seems that a large quantity of connections is not enough.
Looking at the elements in the Environment* that have managed to create
attention and to last from 1970 to 2006, it appears that elements with many
relations to similar actors appear to vanish faster than those involved in
networks with larger heterogeneity. Thus:
The stability of elements is encouraged by being connected within a
heterogeneous network.
These conclusions may lead to the belief that environmental issues grow
stronger and stronger for every connection they make to other elements.
There is, however, always a "danger" for an environmental issue when a new
connection is made. There is a real possibility that a connection to another
environmental issue may lead to the first one being dissolved into the
second. Such appeared to be the case for environmental impact categories
such as acidification and eutrophication, which almost disappeared when
climate change received increased focus. In more general terms:
New connections may deceive the "original" network, changing its
content in a new direction.
Just like the problem of concentrating on several relationships in the
economy, there is a problem in focusing on several environmental issues in
the environment. LCA is an attempt to capture many environmental issues
simultaneously, but when one category receives a lot of attention (such as in
the case of climate change), other categories are silenced.
6.2 The thesis' implications for theories
This thesis has deliberately applied two theories – IMP and ANT – on the
grounds that the issues to be investigated were spanning two networks with
different content. It was deemed necessary that the theories employed were
well connected to the networks to ensure that the instruments for capturing

267
each of the networks were suitable for the task. The thesis thus did not intend
to fill a gap in theory, but started out from a sense of puzzlement – a
hesitation – connected to the relationship between the economy and the
environment. Still, as with all theories, IMP and ANT may be confirmed
and/or expanded through use. One of the more important implications for the
employed theories is thus their usage to create the thesis. The successful
production of descriptions of the Economy* and the Environment* shows
that they are both useful theories for ordering empirical processes.
The findings presented earlier are strongly connected to the theories and thus
emphasise their usefulness and their abilities to create insights. The findings
may also be viewed as implications for theories themselves, as they are
supporting and expanding the empirical base of IMP and ANT. Furthermore,
combining the knowledge produced by employing them shows that they
allow for communication, meaning that their basic assumptions about how
the world works do not collide to the extent where communication is
rendered impossible.
Placing the two theories together in a thesis also facilitates a comparison (at
least implicitly) of their strengths and weaknesses and possibilities for cross-
nurturing.
IMP's inclusion of the ARA model is smart because there is a defined
purpose within the economy. Applying the ARA model to the environment
could be an intriguing game, but the actual value of such an undertaking is
more uncertain because the entities in the environment are not legal entities
such as those appearing in the economy. They are not expected to employ
resources to perform specific activities. The ever-present economic exchange
underlying the structures and the processes (mutually defining each other) in
the economy gives it specific characteristics. These characteristics make the
ARA model useful for capturing the evolving economy as shown in this
thesis.
The placeholders referred to as 'actors, resources and activities' therefore
contribute to understanding the economy even before any empirical data is
gathered. This gives IMP a certain edge over ANT in producing descriptions
about or from the economy. The drawback is the risk that only elements
already present in the economy may be used to develop the description,
leaving the researcher blind to influences from elements outside the defined
economy. Håkansson and Waluszewski (2002) escape this problem by
extending the category of actors from business organisations to also include
organisations such as Greenpeace. By focusing on the connections between
the economy and another network, this thesis opens up considerations to
268
understand more of how the economy influences and is influenced by other
networks.
The paragraphs above contain references to some of ANT's strengths and
weaknesses as employed in this thesis. The basic worldview ANT poses as a
foundation for understanding the stability and development of networks is
general and thorough enough for the theory to be applied to any entity.
However, the interests and motivations for actors (both human and non-
human) to form networks are absent or at least hard to keep an eye on (which
may become particularly pressing in descriptions of the economy, one of the
only networks with an unambiguous common currency: money). Its
advantage of being a useful instrument for producing descriptions of all kind
of elements is thus also a disadvantage, as it may miss the specifics of a
certain network. This thesis has focused on the role of science in producing
the environment and has shown ANT's ability to capture how nature is
translated into writing and expose important elements in granting stability to
environmental issues.
From the insights above, it becomes evident that IMP could learn from ANT
how to expand their analyses, how to open up for non-industrial elements.
For its part, ANT could learn some specifics of the economy from IMP.
There are, however, good reasons for questioning whether a melange of the
two theories would be a more useful tool for any study. Perhaps an important
implication of the thesis is that you may need more than one theory when
investigating complex problems that reside in more than one (theoretical)
network.
The application of both IMP and ANT in the same thesis has actually made
me more faithful to each of the theories when producing the descriptions of
the Economy* and the Environment*. ANT's exhortation to stick to the
empirical without reverting to a theoretical reservoir has influenced the
rigorousness of the description of the Economy* in a positive manner. It has
led to more thorough investigation of what elements that have been present
and a stronger belief that the descriptions of relevant actors, resources and
activities really cover what the Economy* is. At the same time, IMP's
cleverness in creating analytical tools has influenced the way ANT has been
employed to describe the Environment*. The exercise with IMP has
increased the ability to visualise and present the Environment*.
During the argument for why two theories were employed in Chapter 2, a
promise was made to include a discussion of why IMP and ANT have (or at

269
least seem to have) different views on stability and change.139
From the
descriptions of the Economy* and the Environment*, it was not obvious that
the difference is real, although the Economy* contained more stability than
the Environment*. When reflecting upon the reasons for this, the importance
of the choice of study object is highlighted. Since the bumper beam is an
industrial product manufactured with the use of heavy machinery, it requires
some dimensions to be stable. The bumper beam is not a scientific product to
the same degree, and less is probably invested to keep the bumper beam and
its environmental characteristics stable. When searching through the
references on IMP and ANT, this trait seems to be quite general. In other
words, IMP studies investigate products, relationships or other entities that at
the outset are (more or less explicitly) chosen because they have had a
certain degree of stability. ANT studies, on the other hand, most often
choose to examine objects that are disputed and, if they are stable instead,
the aim becomes to search for the controversies involved in making them so.
Thus the difference seems to be related to choice of study objects and the
choices regarding what to focus on. This did not pose any major problems
for this study, but consideration needs to be given to what the theories are
applied to and for.
The research design employed may also have implications for theories, as
there is quite a strong link between theories and how to undertake studies.
The empirical material is based on a longitudinal study spanning almost 40
years. Such a relatively long time perspective was chosen to ensure that there
were actual changes in both the economy and the environment. This laid the
foundation for tracking elements involved in their development. The study
showed the design to be useful for such a purpose. There is, however, a
danger in placing too much emphasis on single events or single elements
when describing evolution and missing the details of daily activities.
Furthermore, there may be important contributions to theories other than
those employed in this thesis. Many approaches where the economy and the
environment are treated simultaneously have a propensity to treat one of
them as constant. Hence, the boundaries of one of the objects are well
confined, while the other is allowed to change. For instance many articles on
various environmental economics such as "green logistics" and
"environmental marketing" contain a static version of the environment, while
the economy is allowed to change in order to accommodate the environment
that is brought in. This thesis has shown that there is also a reason to
maintain open boundaries for the environment.
139
IMP focuses on how stability facilitates change, while ANT sees stability as the
exception that has to be explained.

270
There are fewer examples of approaches to environmental science where the
economy is explicitly treated. Elements from the economy such as specific
production processes or production materials are often brought in to point at
environmental problems they potentially cause, but there seems to be little
consciousness to the processes and how elements are combined in the
economy.
One exception to the approaches described above is industrial ecology,
concerned with producing insights both about industry and about the
environment and combinations of these. This does not mean that industrial
ecology would have no use for this thesis. To the contrary, the content of this
document should be also be of interest when it comes to understanding the
grounds for production of the economy and the environment within
industrial ecology.
6.3 The thesis' implications for practices
The purpose of this section is to highlight how the thesis findings could be
used by people in any of the networks included in the thesis, e.g. business
managers, scientists, environmentalists or politicians. Whether you are a
business manager wanting to make your business more 'green', a scientist
exploring the nature of nature, an environmentalist trying to understand why
changes happen so slowly or a politician searching for the right measures to
connect the economy and the environment, the findings can give an
enhanced understanding of:
What vehicles of translation to employ in order to transfer elements
between networks
Why attempts at transferring elements between networks are
successful or why they fail
How elements may change upon transfer
Although the information contained in the thesis is specific for the case of
bumpers, it should be possible to transfer the findings to other practices.
Specific vehicles for translation will vary depending on the characteristics of
the matter they are involved in, but they will probably share similarities with
those displayed here. Understanding how vehicles for translation operate can
provide useful input for strategies when connecting the economy and the
environment. Such understanding can of course also be used negatively. If
you want a company to have an environmental image without having to
impose changes, this thesis almost provides you with the perfect recipe.

271
The worldview presented in this thesis is probably just as important as the
more instrumental implications.140
The emphasis on networks – on the
relational character of the world – and the downplayed role of human actors
may imply that managers or politicians should focus more on combining
elements and less on steering and control. However, the opposite argument
can of course be valid: if everybody is only working on combining elements
instead of taking control, no direction will ever be imposed on any elements.
It is exactly this duality that is one of the thesis' main implications.
Resources and activities in the economy and non-human actors in the
environment need human actors to be aligned. However, without resources
and activities or non-human actors, human actors are not granted the ability
to move. There is thus a mutual dependency between these entities that
defines how networks appear at a specific point in time and how they evolve.
Even if you disagree with the ontology presented here it may enhance your
understanding of the world. Knowledge is explained and refined when
opinions clash and spokespersons must defend their positions. This process
may also take place inside the reader when reflecting upon the text. Thus, if
you disagree with the assumptions underlying the thesis or the descriptions
or findings it contains and have still continued to read through it, I hope your
reasons for refuting the thesis (or parts of it) have become better defined.
6.4 Suggestions for further research
There are many possible avenues for extending what is done in this thesis:
the issues at hand can be investigated with other empirical material, the
empirical material from this thesis can be used for other issues and new
empirical material can be used for new issues connected to the issues here. A
few examples of pursuing these possibilities are provided in this section.
6.4.1 Possible empirical avenues
The basic premises of this thesis were that industry is instrumental in
creating the economy and science is equally instrumental in creating the
environment. However, there have been several examples of other networks
that have included elements from the economy or the environment or both;
most noticeably the legal network, the political network and the media
network. It could be interesting to examine all these networks in order to
better understand the relationship between the economy and the
environment.
140
This is based on a fundamental belief in research providing descriptions that may
enhance the understanding of the world.

272
This is not to say that all industrial networks or scientific networks are
exhausted through this thesis. The automotive industry may be special and
other industrial sectors may thus show other characteristics relevant to both
travel routes and vehicles for translation, which again may give additional
insights into the relationship between the economy and the environment. For
instance, could interesting knowledge be provided by a study of the industry
responsible for manufacturing instruments for scientific explorations of
nature? In this thesis, where the artefact studied was clearly connected to the
economy, most of the elements investigated travelled from the environment
to the economy. Perhaps a study where the industrial product is more closely
associated with the production of environment would provide more insight
into the transfer from the economy to the environment
A different research design could be followed to expand the knowledge of
how elements are transferred between the networks. Instead of a longitudinal
study of a technical artefact where many elements transferred are described
(as in this thesis), a specific study of one or a few elements can increase
understanding of how different networks participate in the process and how
vehicles for translation operate. Such a design is connected to exploring
networks other than the industrial and the scientific networks.
The common feature of all these possible empirical avenues is that they will
not only produce knowledge of the relationship between the economy and
the environment, but will also contribute to the understanding of each of the
networks respectively.
6.4.2 A first sketch of interlation: a suggestion for a theoretical
concept
At a conference a few years back, I was reflecting on the shift from focusing
on transaction to focusing on interaction associated with IMP's new
formulation of economic structures. At the same time, I was working on the
translation concept, i.e. on the transferring of something from one entity into
something similar in another entity. I played a little with the pair of words,
and started thinking about what an interlation could possibly be. It struck me
that a shift of words from "translation" to "interlation" could have
consequences for actor-network theory and for the understanding of what
remains constant when an actor-network changes over time. This does not
mean the concept is only interesting from an actor-network perspective. Just
as Håkansson and Waluszewski (2002) refer to the concept of translation as
also being important in an industrial setting, the concept of interlation should
be able to be translated (or maybe interlated) to several settings.

273
To examine what an interlation might be, let's look at the word itself in
relation to the words 'transaction', 'interaction' and 'translation'. The prefix
'trans-' can mean across, beyond, on or to the other side of, or into another
state or place (Britannica Online Dictionary 2007). The prefix 'inter-' means
between, among, mutually, reciprocally, shared by, or involving or derived
from two or more. The ending '-lation' comes from the Latin word latus, the
past particle of the verb ferre which means to carry or to bring. Thus, from
the etymology of the words, interlation could mean to carry something in
between. The relationships between the words are indicated in Table 6-3.
Table 6-3 The meaning of transaction, interaction, translation and interlation
-action -lation
Trans- An act from one party to
another
A "cargo" from one party to
another
Inter- An act between two parties A "cargo" between two parties
From the table, we can see that going from trans- to inter- means going from
a uni-directional to a bi-directional situation, thus making direction less
obvious. This may also have implications for how time is perceived.
Transactions and translation appear to be more instantaneous than
interactions and interlations, as the latter two require two parties to react.
Interaction and interlation make it harder to pinpoint just where the action or
the "cargo" is residing, but being more difficult can also mean a better
representation of how the process actually happens.
One of the important features of going from transaction to interaction in IMP
was the inclusion of historicity. Economic exchange can no longer be
viewed separately from past events. Interaction denotes a whole series of
actions between actors and includes past actions as well as expectations of
future actions.
This hints at an interlation including past "cargos" and possibly also
expectations of future ones. An interlation may well be equal to an actor-
network, or rather the common denominator that determines the boundaries
of the actor-network both in space and time, for the interlation will by
definition not be residing in any actor - it is that which exists in between.
However, how useful can the concept of interlation be if it is just another
word for an actor-network? The actor-network does not implicitly contain
the time element, but is rather a picture of the process or structure creating
stability for an element at a given point in time. The interlation would be the
condensed actor-network containing all the various elements that have made
up the idea at several points in time.

274
As such, it may provide a word for a "solution" to the conflict between
economy and environment. A description of the "economent" or
"environomy" that is acceptable to both the economy and the environment.
An emission quota is one such concept, one interlation, which has the
potential of pleasing both parties. One counter-argument may be that
emission quotas are on a lower level than the environment or the economy,
but remember ANT's refusal of any distinction between macro and micro.
An emission quota, as an idea, can contain the entire economy-network and
the entire environment-network (or at least their interlations). Of course,
there is an inherent danger in stating that everything is connected to
everything. Although true, such a statement is not particularly fruitful in
guiding our understanding of the world. The important point here is the
analytical potential, or how we manage to sort our images of how elements
make up the world we are part of.
It might be worthwhile to explore the concept of interlation further...in
another thesis.

275
7. References
Abrahamsen G, Horntvedt R, Tveite B. 1977. Impacts of Acid Precipitation on
Coniferous Forest Ecosystems. Water Air and Soil Pollution 8:57-73
Ailor Jr. WH, Wilkinson J, T.L. 1977. Field Testing of Aluminum Automotive
Alloys. Rep. SAE Technical Paper 770270, SAE, Washington
Alcamo J, Amann M, Hettelingh JP, Holmberg M, Hordijk L, et al. 1987.
Acidification in Europe - a Simulation-Model for Evaluating Control
Strategies. Ambio 16:232-45
Alcamo J, Shaw R, Hordijk L, eds. 1990. The RAINS Model of Acidification.
Science and Strategies in Europe. Dordrecht: Kluwer Academic Publishers
Allen PA, McCullough DW, Tan SA. 1994. Extruded Aluminum Bumper System.
Rep. SAE Technical paper 940159, SAE, Washington
Alm LR. 1997. Scientists and the acid rain policy in Canada and the United States.
Science Technology & Human Values 22:349-68
Andersen S. 2003. Case-studier og generalisering: Forskningsstrategi og design.
Oslo: Fagbokforlaget
Andersen S. 2004. DRE 1006 Introduction to Organisation Science: Lecture Notes.
Sandvika
Anonymous. 1966. Report of a New Chemical Hazard. New Scientist 32:612
Anonymous. 1999a. Hydro and Gränges forming a new company, Oslo
Anonymous. 1999b. Volvo enters into agreement with Ford to sell Volvo Cars for
SEK 50 billion and concentrates on commercial products. Press relase from
Volvo cars
Anonymous. 2000. Nytt liv for Raufoss. Teknisk Ukeblad
Anonymous. 2001. Ford, Volvo differ on global warming treaty. Business
Anonymous. 2006. Norsk Hydro divests automotive components business to
concentrate on primary aluminium production, Oslo
Anonymous. 2007. Car buyers mislead by "green" Lexus adverts. MediaWeek
Araujo L. 2007. Markets, market-making and marketing. Marketing Theory 7:211-
26
Arnesen AKM, Abrahamsen G, Sandvik G, Krogstad T. 1995. Aluminium-smelters
and fluoride pollution of soil and soil solution in Norway. The Science of
the Total Environment:39-53
Arrhenius S. 1896. On the Influence of Carbonic Acid in the Air Upon the
Temperature of the Ground. Philosophical Magazine 41:237-76
Asdal K. 2004. Politikkens teknologier: Produksjoner av regjerlig natur. PhD
dissertation. University of Oslo, OsloAsdal K. 2005. Enacting things
through numbers: Taking Nature into account/ing.
Atkinson P, Coffey A. 1997. Analysing Documentary Realities. In Qualitative
Research - Theory, Method and Practice, ed. D Silverman. Thousand Oaks,
CA: Sage Publications
Ausubel JH, Victor DG, Wernick IK. 1995. The Environment Since 1970.
Consequences: The Nature & Implications of Environmental Change 1
Bach W. 1985. Waldsterben - Our Dying Forests .3. Forest Dieback - Extent of
Damages and Control Strategies. Experientia 41:1095-104
Bakke B. 1970. Bildelfabrikken. Maskin

276
Baraldi E, Brennan R, Harrison D, Tunisini A, Zolkiewski J. 2006. Strategic
Thinking and the IMP Approach: A comparative Analysis. In The 22nd
IMP Conference. Milan, Italy
Barnett HJ, Morse C. 1963. Scarcity and Growth. Baltimore: John Hopkins
University Press
Barnola JM, Raynaud D, Korotkevich YS, Lorius C. 1987. Vostok Ice Core
Provides 160,000-Year Record of Atmospheric Co2. Nature 329:408-14
Baumann H. 1998. Life-Cycle Assessment and Decision Making—theories and
practises. Chalmers University, Gothenburg
Beck E, Hansen H, Moen OI. 2006. Bilhistorisk forum: Perioden 1965-1972:
Støtfangere og dørbuer til Volvo 140-serien.
Beckerman W. 1972. Economists, Scientists, and Environmental Catastrophe.
Oxford Economic Papers:327-44
Bell JNB. 1981. Acid Precipitation - a New Study from Norway. Nature 292:199-
200
Bergen Bank, Kreditkasse CBo. 1986. Verdsettelse av NORSK HYDRO a.s‟
ALUMINIUMDIVISJON og ÅRDAL OG SUNNDAL VERK a.s.,
Christiania Bank og Kreditkasse, Oslo
Berger PL, Luckmann T. 1966. The Social Construction of Reality: A Treatise in the
Sociology of Knowledge. Garden City, NY: Anchor Books
Bohne H. 1970. Fluorides and Sulfur Dioxides as Causes of Plant damage. Fluoride:
Journal of the International Society for Fluoride Research 3:137-42
Borg H. 1986. Metal Speciation in Acidified Mountain Streams in Central Sweden.
Water Air and Soil Pollution 30:1007-14
Borgström H, Haag M. 1989. Gyllenhammar. Oslo: Dagens næringsliv
Boulding KE. 1966. The Economics of the Coming Spaceship Earth. In
Environmental Quality in a Growing Economy, ed. H Jarrett. Baltimore,
MD: John Hopkins University Press
Bouwman AF, Van Vuuren DP, Derwent RG, Posch M. 2002. A global analysis of
acidification and eutrophication of terrestrial ecosystems. Water Air and
Soil Pollution 141:349-82
Bray J. 1972. The Politics of the Environment. London: Fabian Society
Brekke A. 2006. How Should you Act? To be published in Journal of Business
Research
Brekke M. 2005. Grunnloven som unionstraktat?: Norsk og svensk syn på
grunnloven 1814-1900. MSc dissertation. University of Bergen, Bergen
Bringberg D, McGrath JE. 1985. Validity and the Research Process. Newbury Park,
California: Sage Publications
Britannica Online Dictionary. 2007. Encyclopaedia Britannica Online Dictionary.
http://www.eb.com
Bronken L. 2005. Raufoss Automotive: Raufoss ASA sells out its Automotive
Division 1995/1997: Some "facts" on the Raufoss Automotive history and
on the background and reasons for sale of RAA to HYDRO 1995/1997.
Bronken L, Tranås J. 1994. Relasjonsbygging i bilindustrien: Case Raufoss
Automotive (Relationship formation in the automotive industry: Case
Raufoss Automotive). Praktisk økonomi og ledelse:73-9

277
Bruner RF. 1999. Case 43: AB Volvo/Régie Nationale des Usines Renault S.A. -
Critically Evaluating a Merger Proposal. In Case Studies in Finance:
Managing for Corporate Value Creation: Irwin/McGraw-Hill
Brusethaug S, Langsrud Y. 2000. Aluminum properties, a model for calculating
mechanical properties in AlSiMgFe-foundry alloys. Metallurgical Science
and Technology 18:3-7
Bryson R, Wendland W. 1970. Climatic effects of atmospheric pollution. New York:
Springer Verlag
Braanaas T. 1970. Fluorskader på furuskog i Vettismorki (Fluoride damage of pine
forest in Vettimorki). Skogbruk 78:379-401
Buchinger E. 1993. Life Cycle Analysis - Method and Practice. Discussion Paper.
Forschungszentrum Seibersdorf
Burt T. 1999. Leif Accused of Selling Country's Crown Jewels. Financial Times
Callendar GS. 1938. The Artificial Production of Carbon Dioxide and Its Influence
on Climate. Quarterly J. Royal Meteorological Society 64:223-40
Callon M. 1987. Sociology in the Making: The Study of Technology as a Tool for
Sociological Analysis. In The Social Construction of Technological
Systems. New Directions in the Sociology and History of Technology, ed.
WE Bijker, TP Hughes, TJ Pinch. Cambridge, MA: MIT Press
Callon M. 1998a. An essay on framing and overflowing: economic externalities
revisited by sociology. In The Laws of the Markets, ed. M Callon. Oxford:
Blackwell
Callon M. 1998b. The Laws of the Markets. Oxford: Blackwell Publishers
Callon M, Latour B. 1981. Unscrewing the Big Leviathan: How Actors Macro-
Structure Reality and How Sociologists Help Them To Do So. In Advances
in Social Theory and Methodology: Towards an Integration of Micro and
Macro-Sociology, ed. K Knorr-Cetina, AV Cicouvel. Boston, Ma:
Routledge
Cambridge Dictionary. 2005. Cambridge Dictionary. Cambridge: Cambridge
University Press
Carbusters. 2003. Carbusters. http://www.carbusters.org
Carson R. 1962. Silent Spring. Cambridge: The Riverside Press
Christophersen N, Wright RF. 1981. Sulfate Budget and a Model for Sulfate
Concentrations in Stream Water at Birkenes, a Small Forested Catchment in
Southernmost Norway. Water Resources Research 17:377-89
Clausen AH, Hopperstad OS, Langseth M. 2000. Stretch bending of aluminium
extrusions for car bumpers. Journal of Materials Processing Technology
102:241-8
Collins H, Yearley S. 1992. Epistemological Chicken. In Science as Practice and
Culture, ed. A Pickering. Chicago: Chicago University Press
Colvile RN, Hutchinson EJ, Mindell JS, Warren RF. 2001. The transport sector as a
source of air pollution. Atmospheric Environment 35:1537-65
Cook E. 1976. Limits to Exploitation of Nonrenewable resources Science 191:676 –
82
Cooper R. 2005. Relationality. Organization Studies 26:1689-710
Cowling EB. 1982. Acid Precipitation in Historical-Perspective. Environmental
Science & Technology 16:A110-A23

278
Cubasch U, Cess RD. 1990. Processes and Modelling. In Climate Change: The
IPCC Scientific Assessment, ed. JT Houghton, GJ Jenkins, JJ Ephraums.
Cambridge: Cambridge University Press
Danielsen EF. 1960. Fluorine contents of plants, water and soil profiles in Western
Norway. In Årbok University of Bergen. Bergen: University of Bergen
Deleuze G. 1993. The Fold: Leibnitz and the Baroque. Minneapolis: University of
Minnesota Press
Dons AL, Jensen EK, Langsrud Y, Tromborg E, Brusethaug S. 1999. The Alstruc
microstructure solidification model for industrial aluminum alloys.
Metallurgical and Materials Transactions a-Physical Metallurgy and
Materials Science 30:2135-46
Dosi G. 1997. Opprotunities, Incentives and the Collective Patterns of
Technological Change. The Economic Journal 107:1530-47
Driscoll CT, Baker JP, Bisogni JJ, Schofield CL. 1980. Effect of Aluminum
Speciation on Fish in Dilute Acidified Waters. Nature 284:161-4
Dubois A. 1994. Organising industrial activities : an analytical framework.
Göteborg: Chalmers tekniska högsk. [7], 160, [8] ; pp.
Dubois A, Araujo L. 2004. Research Methods in Industrial Marketing Studies. ed. H
Håkansson, D Harrison
Dubois A, Gadde L-E. 2002. Systematic combining: an abductive approach to case
research. Journal of Business Research 55:553
Easton G. 1992. Industrial Networks: A Review. In A New View of Reality, ed. B
Axelsson, G Easton, pp. 1-27. London: Routledge
Easton G. 1995. Methodology and Industrial Networks. In Business Marketing: An
Interaction and Network Perspective, ed. K Möller, D Wilson, pp. 411-93.
Boston: Kluwer Academic Publishers
Eckstein H. 1975. Case Study and Theory in Political Science. In Strategies of
Inquiry, ed. FI Greenstein, NW Polsby. Reading, Massachusetts: Addison-
Wesley Publishing Company
Ehrenfeld JR. 2000. Industrial ecology: paradigm shift or normal science? American
Behavioral Scientist 44:229-45
Ehrenfeld JR. 2003. Industrial Ecology and LCM: Chicken and Egg? International
Journal of Life Cycle Assessment 8:59-60
Eijsackers HJP, Duinker JC, Cappenberg TE. 1985. Oecologische effecten van
milieuverontreiniging, de negatieve zijde van ons menselijk handelen. ed. K
Bakker
Eik A. 2005. Eco-efficiency of waste management: A case study of the Norwegian
deposit and recycling system for PET bottles. PhD dissertation. Norwegian
University of Science and Technology, Trondheim
Eisenhardt KM. 1989. Builiding Theories from Case Study Research. Academy of
Management Review 14:532-50
Ellison JM, Waller RE. 1978. A review of sulphur oxides and particulate matter as
air pollutants with particular reference to effects on health in the United
Kingdom. Environmental Research 16:302-25
Elnæs KR. 2005. Utvikling av plaststøtfangere på Raufoss: En overgang fra
aluminium til plast. Raufoss
Emerson RM. 1976. Social Exchange Theory. Annual Review of Sociology 2:335-62
279
Eskandarian A, Marzougui D, Bedewi NE. 1997. Finite Element model and
validation of a surrogate crash test vehicle for impacts with roadside
objects. International Journal of Crashworthiness Research 2:239-57
Evans LS. 1982. Biological effects of acidity in precipitation on vegetation: A
review. Environmental and Experimental Botany 22:155-69
Fava JA. 2005. Can ISO Life Cycle Assessment Standards Provide Cerdibility for
LCA. Building Design & construction:17-20
Finnveden G, Potting J. 1999. Eutrophication as an Impact Category. International
Journal of Life Cycle Assessment 4:311-4
Fitch PE, Cooper JS. 2004. Life cycle energy analysis as a method for material
selection. Journal of Mechanical Design 126:798-804
Fjeldly A, Soreng A, Roven HJ. 2001. Strain localisation in solution heat treated Al-
Zn-Mg alloys. Materials Science and Engineering a-Structural Materials
Properties Microstructure and Processing 300:165-70
Folland CK, Karl TR, Vinnikov KYA. 1990. Observed Climate Variations and
Change. In Climate Change: The IPCC Scientific Assessment, ed. JT
Houghton, GJ Jenkins, JJ Ephraums. Cambridge: Cambridge University
Press
Ford D, Gadde L-E, Hakansson H, Snehota I. 2004. Managing networks. In IMP.
Lugano, Switzerland
Ford D, Håkansson H. 2006a. The idea of interaction. . IMP Journal Vol 1:pp 4-27
Ford D, Håkansson H. 2006b. IMP – some things achieved: much more to do.
European Journal of Marketing Vol. 40:pp. 248-58
Freeman C, Perez C. 1988. Structural crises of adjustment, business cycles and
investment behaviour. In Technical Change and Economic Theory, ed. De
al. London: Pinters
Gaines L, Stodolsky F. 1997a. Lifecycle analysis for automobiles: Uses and
limitations. 7 p. ; PL: pp.
Gaines L, Stodolsky F. 1997b. Lifecycle analysis: Uses and pitfalls. 9 p. ; PL: pp.
Galperin M, Sofiev M, Afinogenova O. 1995. Long-term modelling of airborne
pollution within the Northern Hemisphere. Water Air and Soil Pollution
85:2051-6
George RA, Swenson WE, Adams DG. 1976. Aluminium in Automobiles: Why and
How It‟s Used. In Automotive Engineering Congress and Exposition: SAE
Georgescu-Roegen N. 1975. Energy and Economic Myths. Southern Economic
Journal 41
Glaser BG, Strauss A. 1967. The Discovery of Grounded Theory. New York: Aldine
de Gruyter
Gorham E. 1998. Acid deposition and its ecological effects: a brief history of
research. Environmental Science & Policy 1:153-66
Graedel T, Allenby B. 1995. Industrial Ecology. Englewood Cliffs, NJ: Prentice
Hall
Granovetter MS. 1973. The strength of weak ties. American Journal of Sociology
78:1360-80
Grant J. 2008. Green marketing. Strategic Direction 24:25-7
Grant RM. 1996. Prospering in Dynamically-Competitive Environments:
Organizational Capability as Knowledge Integration Organization Science
7:375-87

280
Grennfelt P, Thörnelöf Ee. 1992. Critical Loads for Nitrogen - a workshop report.
Rep. NORD 1992:41, Nordic Council of Ministers, Copenhagen
Guinée JBfe, Gorée M, Heijungs R, Huppes G, Klein R, de Konig A. 2001. Life
cycle assessment. An operational guide to the ISO standards. Part 3:
Scientific background. Leiden: University of Leiden
Ha J, Kim Y, Cho H, Kim J, Hur T, Lee K. 1998. Life Cycle Assessment Study of a
Bumper. Total Life Cycle Conference and Exposition. Graz, Austria: SAE
Hadley SW, Das S, Miller JW. 2000. Aluminum R&aD for Automotive Uses and
the Department of Energy's Role.
Hanley N, Shogren J, White B. 2001. Introduction to Environmental Economics.
Oxford: Oxford University Press
Hansen J, Lebedeff S. 1987. Global trends of measured surface air temperature.
Journal of Geophysical Research 15:13345-72
Hansen JE. 1988. The Greenhouse Effect: Impacts on Current Global Temperature
and Regional Heat Waves. In U.S. Senate, Committee on Energy and
Natural Resources. Washington, DC.
Hansen V, Karlsen OB, Langsrud Y, Gjonnes J. 2004. Precipitates, zones and
transitions during aging of Al-Zn-Mg-Zr7000series alloy. Materials
Science and Technology 20:185-93
Happer AJ, Hughes MC, Peck MD, Boehme S. 2003. Practical Analysis
Methodology for Low-Speed Vehicle Collisions Involving Vehicles With
Modern Bumper Systems. In SAE 2003 World Congress & Exhibition,
USA. Detroit, MI: SAE
Harrison D. 1999. Strategic Responses to Predicted Events - The case of the banning
of CFCs. PhD dissertation. University of Lancaster, Lancaster
Harrison D, Easton G. 2002. Patterns of actor response to environmental change.
Journal of Business Research 55:545-52
Hart DM, Victor DG. 1993. Scientific Elites and the Making of US Policy for
Climate Change Research, 1957-74. Social Studies of Science 23:643-80
Hasler AD. 1947. Eutrophication of Lakes by Domestic Drainage. Ecology 28:383-
95
Hatch DE. 1977. Aluminum in Automobile Bumper System. Rep. SAE Technical
paper 770268, SAE, Washington
Heijungs Rfe, Guinée JB, Huppes G, Lankreijer RM, Udo de Haes HA, Wegener
Sleeswijk A. 1992. Environmental Life Cycle Assessment of Products:
Guide and Backgrounds. Leiden: Centrum voor Milieukunde
Heinen JT, Low RS. 1992. Human Behavioral Ecology and Environmental
Conservation. Environmental Conservation 19:105-16
Helgesson C-F. 1999. Making a Natural Monopoly: The Configuration of a Techno-
Economic Order in Swedish Telecommunications. PhD dissertation.
Stockholm School of Economics, Stockholm
Henriksen A. 1980. Acidification of freshwaters: a large-scale titration. Rep. SNSF
Project, Oslo
Henriksen A, Selmerol A. 1970. Automatic Methods for Determining Nitrate and
Nitrite in Water and Soil Extracts. Analyst 95:514-&
Hertwich EG, Pease WS. 1999. Rebuttal to Marsmann et al. on ISO 14042: Value
Judgements and the Public Right-to-Know. The LCA Global Village,
http://www.ecomed.de/journals/lca/village/
281
Hettelingh JP, Downing RJ, de Smet PAM. 1991. Mapping critical loads for Europe.
Rep. RIVM report nr. 259101001, National Institute of Public Health and
Environmental Protection (RIVM), Bilthoven
Holdren JP. 1980. Integrated Assessment for Energy-Related Environmental
Standards: A Summary of Issues and Findings. Rep. 12799, Lawrence
Berkeley Laboratory., Berkeley, California
Holmen EAKS. 2001. Notes on a Conceptualisation of Resource-related
Embeddedness of Interorganisational Product Development". PhD Thesis.
University of Southern Denmark, Odense
Horntvedt R. 1995. Fluoride uptake in conifers related to emissions from aluminium
smelters in Norway. The Science of the Total Environment:35-7
Houghton JT, Meira Filho LG, Bruce J, Hoesung L, Callander BA, et al. 1994.
Climate Change 1994: Radiative Focing of Climate Change and An
Evaluation of the IPCC Emission Scenarios. Cambridge: Cambridge
Unviersity Press
Houghton JTe. 1984. The Global Climate. Cambridge: Cambridge University Press
Hughes TP. 1984. Technological Monument. In Does Technology Drive History, ed.
MR Smith, L Marx. Cambridge Mass.: The MIT Press
Huijbregts MAJ, Seppala J. 2001. Life cycle impact assessment of pollutants
causing aquatic eutrophication. International Journal of Life Cycle
Assessment 6:339-43
Hunt RG, Franklin WE. 1996. LCA - How it Came About. Personal Reflections on
the Origin and Development of LCA in the USA. International Journal of
Life Cycle Assessment 1:4-7
Hunt RG, Sellers JD, Franklin WE. 1992. Resource and environmental profile
analysis: A life cycle environmental assessment for products and
procedures. Environmental Impact Assessment Review 12:245-69
Hutton J. 1788. Theory of the Earth. Edinburgh: Transactions of the Royal Society
of Edinburgh, vol.1
Håkansson H, ed. 1982. International Marketing and Purchasing of Industrial
Goods: An Interaction Approach. Chichester: Wiley. 10-27 pp.
Håkansson H. 1987. Industrial technological development : a network approach.
London: Croom Helm. 234 pp.
Håkansson H. 1989. Corporate technological behaviour: co-operation and
networks. London: Routledge
Håkansson H. 2006. Business relationships and networks: consequences for
economic policy. The Antitrust Bulletin 51:143-63
Håkansson H, Johanson J. 1993. The network as a governance structure. [Uppsala]:
Företagsekonomiska Institutionen. S. 35-51 pp.
Håkansson H, Snehota I. 1989. No Business is an Island: The Network Concept of
Business Strategy. Scandinavian Journal of Management 5:187-200
Håkansson H, Snehota I. 1995. Developing relationships in business networks.
London: Routledge. XIV, 418 s. pp.
Håkansson H, Waluszewski A. 2002. Managing technological development : IKEA,
the environment and technology. London: Routledge. XII, 274 s. pp.
Industridepartementet. 1979. St.prp. nr. 69 (1978-1979): Etablering av Volvo
(Svenskt-Norskt) AB m.m., ed. Industridepartementet: Det Norske Storting

282
IPCC. 1990. Climate Change: The IPCC Scientific Assessment. Cambridge:
Cambridge University Press
ISO. 1997. ISO 14040: Environmental management - Life cycle assessment -
Principles and framework. Brussels: the International Organization for
Standardization
ISO. 1998. ISO 14041: Environmental management - Life cycle assessment - Goal
and scope definition and inventory analysis. Brussels: the International
Organization for Standardization
ISO. 2000. ISO 14042: Environmental management - Life cycle assessment - Life
cycle impact assessment. Brussels: the International Organization for
Standardization
Jahre M, Gadde L-E, Håkansson H, Harrison D, Persson G. 2006. Resourcing in
Business Logistics. The art of systematic combining. Copenhagen:
Liber&Copenhagen Business School Press
Jensen S. 1972. The PCB Story. Ambio 1:123-31
Johnson HG. 1973. Man and His Environment. London: The British-North
American Committee
Jones PD, Raper SCB, Bradley RS, Diaz HF, Kelly PM, Wigley TML. 1986.
Norther Hemisphere surface air temperature variations, 1851-1984. Journal
of Applied Meteorology 25:161-79
Justisdepartementet. 1982. St.prp. nr. 131 (1981). ed. Justisdepartementet:
Justisdepartementet
Kandler O, Innes JL. 1995. Air-Pollution and Forest Decline in Central-Europe.
Environmental Pollution 90:171-80
Karlsson C. 2003. Finns svensk bilindustri? Stockholm: BIL Sweden
Kary JJ. 1976. Weight Reduction of Automobile Bumper Systems. Rep. SAE
Technical paper 760012, SAE, Washington
Kaysen C. 1972. The Computer That Printed Out W*O*L*F. Foreign Affairs:660-8
Kirchain R, Hong M, Field F, Clark J. 2000. Methods for Comparing Product Life
Cycles Under Temporally Distributed Production Scenarios. In Total Life
Cycle Conference and Exposition. Detroit, MI
Kjellberg H. 2001. Organising Distribution: Hakonbolaget and the Efforts to
Rationalise Food Distribution, 1940-1960. PhD dissertation. Stockholm
School of Economics, Stockholm
Krewitt W, Trukenmuller A, Bachmann TM, Heck T. 2001. Country-specific
damage factors for air pollutants - A step towards site dependent life cycle
impact assessment. International Journal of Life Cycle Assessment 6:199-
210
Kuhn T. 1962. The Structure of Scientific Revolutions. Chicago: University of
Chicago Press
Kuylenstierna JCI, Hicks WK, Cinderby S, Cambridge H. 1998. Critical loads for
nitrogen deposition and their exceedance at European scale. Environmental
Pollution 102:591-8
Landsberg H. 1970. Man-Made Climatic Changes. Science 170:1265-&
Latour B. 1983. Give Me a Laboratory and I will Raise the World. In Science
Observed: New Perspectives on the Social Study of Science, ed. K Knorr-
Cerina, M Mulkay. Beverly Hills: Sage

283
Latour B. 1986. The Powers of Association. In Power, Action and Belief: A New
Sociology of Knowledge, ed. J Law. London: Routledge
Latour B. 1987. Science in action. Cambridge, MA: Harvard University Press
Latour B. 1988. A Relativistic Account of Einstein's relativity. Social Studies of
Science 18:3-44
Latour B. 1988b. The Politics of Explanation: an Alternative. In Knowledge and
Reflexivity: New Frontiers in the Sociology of Knowledge, ed. S Woolgar,
pp. 155-77. London: Sage Publications
Latour B. 1993. We Have Never Been Modern. New York: Harvester Wheatsheaf
Latour B. 1996a. Flat-Earthers and Social Theory. In Accounting and Science:
Natural Inquiry and Commercial Reason, ed. M Power. Cambridge:
Cambridge University Press
Latour B. 1997. On Actor-Network Theory: A few clarifications. Soziale Welt
47:369-81
Latour B. 1999a. On recalling ANT. In Actor Network Theory and After, ed. J Law,
J Hassard. Oxford: Blackwell Publishers
Latour B. 1999b. Pandora’s hope: Essays on the Reality of Science Studies. London:
Harvard University Press
Latour B. 2005. Reassembling the Social: An Introduction to Actor-Network Theory.
New York: Oxford University Press
Latour B, Woolgar S. 1979. Laboratory Life: the Social Construction of Scientific
Facts. Beverly Hills: Sage
Law J. 1992. Notes on the Theory of the Actor-Network: Ordering, Strategy, and
Heterogeneity. Systems Practice 5:379-93
Law J. 1999. Traduction/Trahison. In Published by the Centre for Science Studies,
Lancaster University, Lancaster LA1 4YN
Lee JJ, Callaghan PO, Allen D. 1995. Critical Review of Life Cycle Analysis and
Assessment Techniques and their Application to Commercial Activities.
Resources, Conservation and Recycling 13:37-56
Liebig Jv. 1840. Chemistry in its application to agriculture and physiology
Lifseth R. 1997. A Metaphor, a Field, and a Journal. Jounal of Industrial Ecology 1
Likens GE, Bormann FH, Johnson NM. 1972. Acid Rain. Environment 14:33-&
Lindeman RL. 1942. The Trophic-Dynamic Aspect of Ecology. Ecology 23:399-417
Lindh B-E. 1990. Volvo: personvagnarna - från 20-tal till 90-tal. Malmö:
Förlagshuset Norden
Linthurst RA, Landers DH, Eilers JM, Kellar PE, Brakke DF, et al. 1986. Regional
Chemical Characteristics of Lakes in North-America .2. Eastern United-
States. Water Air and Soil Pollution 31:577-91
Lowry WP. 1972. Atmospheric Pollution and Global Climatic Change. Ecology
53:908-14
Lundgren A. 1995. Technological innovation and network evolution. London:
Routledge
MacLean HL, Lave LB. 2003. Evaluating automobile fuel/propulsion system
technologies. Progress in Energy and Combustion Science 29:1-69
Marinenko G, Koch WF. 1984. A critical review of measurement practices for the
determination of pH and acidity of atmospheric precipitation. Environment
International 10:315-9

284
Martchek K, Pomper S, Green J. 2000. Credible Life Cycle Inventory Data for
Studies of Automotive Aluminium. Total Life Cycle Conference and
Exposition. Detroit, MI: SAE
Mason BJ. 1976. Towards Understanding and Prediction of Climatic Variations.
Quarterly Journal of the Royal Meteorological Society 102:473-98
Mattson L-G. 2003. Understanding market dynamics - potential contributions to
market(ing) studies from actor-network theory. In IMP Lugano,
Switzerland
McGrath JE, Brinberg D. 1983. External validity and the research process: A third-
party comment on the Calder/Lynch dialogue. Journal of Consumer
Research 10:115-24
McLoughlin D, Horan C. 2002. Markets-as-networks: notes on a unique
understanding. Journal of Business Research 55:535-43
Melillo JM, Callaghan TV, Woodward FK, Salati E, Sinha SK. 1990. Effects on
Ecosystem. In Climate Change: The IPCC Scientific Assessment, ed. JT
Houghton, GJ Jenkins, JJ Ephraums. Cambridge: Cambridge University
Press
Merleau-Ponty M. 1962. The phenomenology of perception. London: Routledge &
Kegan Paul
Merton RK. 1967. On Theoretical Sociology: Five Essays, Old and New. New York:
Free Press
Miller WS, Zhuang L, Bottema J, Wittebrood A, De Smet P, et al. 2000. Recent
development in aluminium alloys for the automotive industry. Materials
Science and Engineering a-Structural Materials Properties Microstructure
and Processing 280:37-49
Min H, Galle WP. 1997. Green Purchasing Strategies: Trends and Implications. The
Journal of Supply Chain Management 33:10-7
Mitchell J. 1970. A preliminary evaluation of atmospheric pollution as a cause of
the global temperature fluctuation of the past century. New York: Springer
Verlag
Mol A, Law J. 1994. Regions, Networks, and Fluids: Anaemia and Social Topology.
Social Studies of Science 24:641-72
Nestaas I. 1970. Luftforurensing, fluorider og aluminiumsverk (Atmospheric
pollution, fluoride and aluminium smelters). Oslo: Røyskaderådet
NHTSA. 1971. Federal Vehicle Safety Standard (FMVSS). NHTSA
NHTSA. 2004. Bumper Q&A's.
http://www.nhtsa.dot.gov/cars/problems/studies/Bumper/index.htm
Nicholson IA. 1978. Impact of Acid Precipitation on Forest and Freshwater
Ecosystems in Norway - Braekke,Fh. Journal of Environmental
Management 6:198-9
Nielsen GP, Gough JP, Little DM, West DH, Baker VT. 1997. Human Subject
Responses to Repeated Low-Speed Impacts Using Utility Vehicles. Rep.
970394, SAE, Washington D.C.
Nilsson C. 1998. Volvo-avtalen 1957-1960: et norsk-svensk industrisamarbeid. MSc
thesis. University of Oslo, Oslo
Nilsson J, Grennfelt Pe. 1988. Critical loads for sulphur and nitrogen. Report from a
workshop at Skokloser, Sweden, 19-24 March 1988. Rep. Miljørapport
88:15, Nordic Council of Ministers, Copenhagen

285
Nordo J. 1976. Long-Range Transport of Air-Pollutants in Europe and Acid
Precipitation in Norway. Water Air and Soil Pollution 6:199-217
Norsk Hydro. 2002. Norsk Hydro: Annual Report 2001, Norsk Hydro, Oslo
Olsson C, Moberger H. 1995. Volvo: Gøteborg Sverige. St Gallen: Norden
publishing house
Olsson U. 2000. Att förvalta sitt pund. Marcus Wallenberg 1899-1982. Stockholm:
Ekerlids Förlag
Peirce CS. 1934. Collected Papers of Charles Sanders Peirce, 5: Pragmatism and
pragamticism. Cambridge, Mass.: Harvard University Press
Penrose E. 1959. The Theory of the Growth of the Firm. Oxford: Basil Blackwell
Peterson P. 2000. Increased Use of Aluminum in Vehicles: The Environmental
Truth. In Total Life Cycle Conference and Exposition. Detroit, MI
Posch M, Hettelingh JP, De Smet PAM. 2001. Characterization of critical load
exceedances in Europe. Water Air and Soil Pollution 130:1139-44
RA. 1971. RA: Annual Report 1970, Raufoss
RA. 1983. RA: Annual Report 1982, Raufoss
RA. 1984. Untitled strategy report, Raufoss
RA. 1986. RA: Annual Report 1985, Raufoss
Randers J. 2000. From limits to growth to sustainable development or SD
(sustainable development) in a SD (system dynamics) perspective. System
Dynamics Review 16:213-24
Ravitch D, Viteritti JP. 2001. Making good citizens: Education and Civil Society:
Yale University Press
Report on Limits to Growth. 1972. Report on the Limits to Growth. A Study of the
Staff of the International Bank for Reconstruction and Development,
Washington, D.C.
Resetar S, Camm F, Drezner. 1998. Volvo Case Study: Driving Toward Green. In
Environmental Management in Design: Lessons from Volvo and Hewlett-
Packard for the Department of Defense. Santa Monica, CA: RAND
Reyburn JR. 1924. Motor-Car Bumper. SAE Technical Paper No. 240044: SAE
Reyes A, Hopperstad OS, Lademo OG, Langseth M. 2006. Modeling of textured
aluminum alloys used in a bumper system: Material tests and
characterization. Computational Materials Science 37:246-68
Robinson G. 1970. Long-term effects of air pollution - a survey. . Rep. Publication
CEM 4029-400, The Center for the Environment and Man, Inc., Hartford,
Connecticut
Rodrigue J-P, Slack B, Comtois C. 2001. Green Logistics. In The Handbook of
Logistics and Supply-Chain Management, ed. AM Brewer:
Pergamon/Elsevier
Sagafos OJ, Aasland T. 2005. Livskraft. På norsk: Hydro 1905-2005. Oslo: Pax
Salinger MJ. 1981. New Zealand climate: The instrumental record. Wellington:
Victoria Univeristy of Wellington
Saur K, Fava JA, Spatari S. 2000. Life cycle engineering case study: Automobile
fender designs. Environmental Progress 19:72-82
Schmandt J, Roderick H. 1985. Acid raind and friendly neighbors: The policy
dispute between Canada and teh United States. Durham, NC: Duke
University Press
286
Schukert M, Saur K, Florin H, Eyerer P. 1995. Life Cycle Analysis of Cars -
Experience and Results. In Total Life Cycle Conference and Exposition.
Vienna, Austria
Selin H, Eckley N. 2003. Science, Politics, and Persistent Organic Pollutants: The
Role of Scientific Assessments in International Environmental Co-
operation. International Environmental Agreements 3:17-42
Seppala J, Posch M, Johansson M, Hettelingh JP. 2006. Country-dependent
characterisation factors for acidification and terrestrial eutrophication based
on accumulated exceedance as an impact category indicator. International
Journal of Life Cycle Assessment 11:403-16
SETAC. 2007. SETAC: Who we are.
Simon JL. 1980. Resources, Population, Environment: an Oversupply of False Bad
News. Science 208:1431-7
Skjerpe P, Gjonnes J, Langsrud Y. 1987. Solidification Structure and Primary Al-
Fe-Si Particles in Direct-Chilled-Cast Aluminum-Alloys. Ultramicroscopy
22:239-49
Slanina S. 2006. Impact and abatement of acid deposition and eutrophication. In
Encyclopedia of Earth, ed. CJ Cleveland. Washington, D.C.:
Environmental Information Coalition, National Council for Science and the
Environment
Smith A. 1776. An inquiry into the nature and causes of the wealth of nations.
Dublin: Whitestone. 3 v. pp.
Snehota I. 1990. Notes on a Theory of a Business Enterprise. Uppsala University,
Uppsala
Solow RM. 1973. Is the End of the World at Hand. Challenge:39-50
Solow RM. 1974. The Economics of Resources or the Resources of Economics.
American Economic Review:1-14
Stein R. 1961. The Automobile Book London: Paul Hamlyn Ltd
Stodolsky F, Vyas A, Cuenca R, Gaines L. 1995. Life-cycle energy savings potential
from aluminum-intensive vehicles. 13 p. ; PL: pp.
Stranddorf HK, Hoffmann L, Schmidt A. 2005. Update on Impact Categories,
Normalisation and Weighting in LCA
- Selected EDIP97-data. Rep. Environmental Project Nr. 995, the Danish
Environmental Protection Agency, Copenhagen
Suzuki M. 2006. A Japanese perspective on the use of aluminum alloys in the
automotive sector. In Aluminium Alloys 2006, Pts 1 and 2, pp. 11-4
Syvertsen M. 2006. Oxide skin strength on molten aluminum. Metallurgical and
Materials Transactions B-Process Metallurgy and Materials Processing
Science 37:495-504
Szulanski G. 1996. Exploring Internal Stickiness: Impediments to the Transfer of
Best Practice with the Firm. Strategic Management Journal. 17: Winter
Special issue:27-43
Thiel C, Jenssen GB. 2000. Comparative Life Cycle Assessment of Aluminium and
Steel Bumper Carriers. Total Life Cycle Conference and Exposition.
Detroit, Michigan: SAE International
Thrane KE. 1987. Ambient air concentrations of polycyclic aromatic hydrocarbons,
fluoride, suspended particles and particulate carbon in areas near
aluminium production plants. Atmospheric Environment 21:617-28

287
Trenberth KE, Houghton JT, Meira Filho LG. 1996. The climate system: an
overview In Climate change 1995 - The science of climate change, ed. JT
Houghton, LG Meira Filho, BA Callander, N Harris, A Kattenberg, K
Maskell. Cambridge: Cambridge University
Tsilingiridis G, Martinopoulos G, Kyriakis N. 2004. Life cycle environmental
impact of a thermosyphonic domestic solar hot water system in comparison
with electrical and gas water heating. Renewable Energy 29:1277-88
Udo de Haes HA, Jolliet O, Finnveden G, Hauschild M, Krewitt W, Mueller-Wenk
R. 1999. Best available practice regarding impact categories and category
indicators in life cycle impact assessment: Part 1. International Journal of
Life Cycle Assessment 4:66-74
Ulrich B. 1990. Waldsterben - Forest Decline in West-Germany. Environmental
Science & Technology 24:436-41
van Straalen NM, Verkleij JACe. 1991. Leerboek oecotoxicologie. Amsterdam: vu
uitgeverij
Veblen T. 1904. The Theory Of Business Enterprise. London: Scribner & Son
Vermeire TG, van lersel AAJ, de Leeuw FAAM, Peijnenburg WJGM, van der Poel
P, et al. 1992. Initial assessment of the hazards and risks of new chemicals
to man and the environment. Rep. report nr. 679102006, National Institute
of Public Health and Environmental Protection (RIVM), Bilthoven
Volvo. 1936. Sales manual (for Volvo retailers). Volvo, Gothenburg
Volvo. 1956. Volvo och RA. Volvo, Gothenburg
Volvo. 2003. http://www.volvocars.com/environment
von Corswant F. 2003. Organizing Interactive Product Development. Doctoral.
Chalmers University of Technology, Gothenburg
Von Uexküll J. 1934. A Stroll Through the Worlds of Animals and Men. In
Instinctive Behavior, ed. K Lashley. New York: International Press
Wang T. 1996. RA i skuddlinja: Industriutvikling og strategiske veivalg gjennom
100 år Raufoss: Raufoss AS
Watson RT, Zinyowera MC, Moss RH, eds. 1995. Climate Change 1995: Impacts,
Adaptations and Mitigation of Climate Change: Scientific-Technical
Analyses Contribution of Working Group II to the Second Assessment of the
Intergovernmental Panel on Climate Change. Cambridge: Cambridge
University Press
Weart S. 2007. The Carbon Dioxide Greenhouse Effect. In The Discovery of Global
Warming, ed. S Weart
Wedin T. 2001. Networks and Demand: The Use of Electricity in an Industrial
Process. PhD Thesis. Uppsala University, Uppsala
Weick K. 1995. Sensemaking in Organizations. Thousand Oaks, CA: Sage
Publications
Welch C, Wilkinson I. 2002. Idea Logics and Network Theory in Business
Marketing. Journal of Business to Business Marketing 9
Wherry ET. 1920. Soil Acidity and a Field Method for Its Measurement. Ecology
1:160-73
Wilkinson I. 2001. A History of Network and Channels Thinking in Marketing in
the 20th Century. Australasian Journal of Marketing 9:23-53
Williamson OE. 1975. Markets and hierarchies. New York: Free Press. xvii,286p
pp.

288
Womack JP, Jones DT, Roos D. 1990. The Machine that Changed the World. New
York: Rawson Associates
World Commission on Environment and Development. 1987. Our Common Future.
Oxford: Oxford University Press
Wright RF, Henriksen A. 1978. Chemistry of Small Norwegian Lakes, with Special
Reference to Acid Precipitation. Limnology and Oceanography 23:487-98
Yamaguchi M, Onoye T, Yagita H, Inaba A, Ootani M, et al. 2005. Life Cycle
Inventory of Aluminium Hoods and Bumper Reinforcements for
Automobiles, Japan Aluminium Association, Tokyo
Yin RK. 1981. The Case Study as a Serious Research Strategy. Knowledge:
Creation, Diffusion, Utilization 3:97-114
Yin RK. 1989. Case Study Research. London: Sage
Zak SK, Beven KJ. 1999. Equifinality, sensitivity and predictive uncertainty in the
estimation of critical loads. Science of the Total Environment 236:191-214

289
Appendix A: List of interviews
Name Organisation ”Mode” Date
Jan Inge Skar Hydro Telephone 27.05.2004
Johanna M. Øster Hydro Telephone 08.06.2004
Arne Skoland Hydro Telephone 24.06.2004
Ola I. Moen Hydro Face to face 29.06.2004
Kolstein Asbøll Hydro Several 06.07.2004
and onwards
Tobias S. Kåvik Hydro Several 26.10.2004
and onwards
Pål Brekke Hydro Several 16.11.2004
and onwards
Jostein Søreide Hydro Telephone 05.12.2004
Eeva Liisa Book Volvo Telephone 06.12.2004
Mats Bengtsson Volvo Several 06.12.2004
and onwards
Jørund Buen Point Carbon Face to face 12.12.2004
Anders Kärlberg Volvo Telephone 08.09.2005
Mats Williander Volvo E-mail 12.09.2005
and onwards
Lisbeth Persson Volvo Telephone 23.09.2005
Mihkel Laks Volvo Face to face 06.10.2005
Mats Hildell Volvo Face to face 06.10.2005
Stefan J. Tingström Volvo Face to face 06.10.2005
Anna Paulsson Volvo E-mail 14.10.2005
Thomas Rozman Volvo E-mail 17.10.2005
Peter Holmén Volvo Face to face 24.11.2005
Tony Wickström Volvo Face to face 09.01.2006
Jørn Helge Dahl Hydro Several 14.03.2006
and onwards
Bjørn-Anders Hilland Hydro Several 15.03.2006
and onwards
Grete Valheim Hydro Face to face 15.03.2006
and onwards
Morten Aass Hydro Face to face 15.03.2006

290
Aage Larsstuen Hydro E-mail 20.03.2006
and onwards
Malin Persson Volvo E-mail 27.04.2006
Ørnulf Myhre Hydro Face to face 15.05.2006
Erik Bågarud Hydro Face to face 15.05.2006
Anita Lindberg Volvo Face to face 31.05.2006
Torgeir Welo Hydro Telephone 15.06.2006
Claes Rydholm Volvo E-mail 20.06.2006
Martin Weiman Volvo E-mail 26.06.2006
and onwards
Roy Jakobsen Hydro E-mail 14.08.2006
Sigurd Rystad Hydro Face to face 25.08.2006
and onwards
Thor Wang Hydro Face to face 25.09.2006
Per Harald Sørlien Plastal Face to face 09.10.2006
Roger Kyseth Hydro Face to face 09.10.2006
Yngve Langsrud Hydro Face to face 10.10.2006
and onwards
Tom Wasenden Hydro Face to face 10.10.2006
Pål Prestrud Cicero Face to face 13.10.2006
Kristin Dahl Volvo E-mail 13.04.2007
Jan P Røssevold Norwegian Road Federation E-mail 16.04.2007
Elisabeth Dahlquist Volvo E-mail 24.05.2007
Gunnar Falck Volvo Telephone 14.06.2007

291
Appendix B: Search procedure for the
environment
Literature databases and search engines employed to gather information
about the Environment* (and also about the Economy*):
Bibsys: http://www.bibsys.no
ISI web of science: http://isiknowledge.com
Society of Automotive
Engineers:
http://www.sae.org
Science Direct http://www.sciencedirect.com
JSTOR http://www.jstor.com
Ebrary http://site.ebrary.com
EBSCOhost http://search.ebscohost.com
Google scholar: http://scholar.google.com
Google http://www.google.com
Wikipedia http://wikipedia.org
It might seem unnecessary to include such a large number of literature
databases, but it was soon discovered that the content varied largely between
them both regarding the scope of different sciences and also their abilities to
deal with chains of citations.
The starting point for the Environment* was found by performing searches
in all databases including combinations of one of the following keywords:
*bumper*,
*bumper beam*,
*reinforcement bar*,
with one of the following keywords:
*aluminium*,
*aluminum*, (because of the different spelling in British English and
American English),
and one or more of the following keywords:
*environment*,
*pollution*,
*emission*,
*climate change*,

292
*global warming*,
*acidification*,
*eutrophication*,
*ozone*,
*ozone depletion*,
*smog*,
*sustainable development*,
*biodiversity*,
*toxic*,
*toxicity*,
*carbon dioxide*,
*carbon monoxide*,
*nitrogen*, and
*sulphur*.
The search was also performed with Norwegian and Swedish keywords.
After finding the Thiel-article, the search switched to tracking references to
and from that particular article but supplementing with other articles and
additional information on organisations and journals. The reason for the
extensive search was both because the Thiel-article took time to find and it
was not an obvious choice in earlier drafts of the thesis. Several rounds were
performed in order to connect technical articles on aluminium bumper beams
to environmental issues.