an empirical investigation of e-government adoption …
TRANSCRIPT
137
Revyakin S.A., da Rocha A. An Empirical Investigation of E-Government Adoption in Russia: Access, Rights, Trust and Citizens’ Experience
AN EMPIRICAL INVESTIGATION OF E-GOVERNMENT ADOPTION IN RUSSIA: ACCESS, RIGHTS, TRUST AND CITIZENS’ EXPERIENCESergey A. RevyakinPh.D. (in Public Administration), Research Associate, Center for Civil Society and Nonprofi t Sector Studies, National Research University Higher School of EconomicsAddress: 20 Myasnitskaya Str., 101000 Moscow, Russian Federation.E-mail: [email protected] da RochaPh.D. (in Information Systems and Technologies), Professor, University of Coimbra (Portugal) and University of Lisbon; Honorary Professor, Amity University (India); President of AISTI; Chair of IEEE SMC Portuguese Chapter.Address: University of Coimbra, 3004-531 Paço das Escolas, Coimbra, Portugal.E-mail: [email protected]
AbstractTh e problem of low usage of e-government solutions is common in many emerging
countries. Is Russia experiencing the same issue? Are there suffi cient conditions to grow the usage of e-government solutions (internet penetration rate, rights for the citizens to approach the government remotely, trust in government, computer skills and usage perception, etc.)? Do the use rates for public e-services portals and e-participation plat-forms equal one another? Based on scholarly articles, analytical reports, laws, regulations, and the results of citizens’ surveys, the research considers some factors that infl uence e-government implementation in Russia. Th e fi ndings highlighted that the penetration of the Internet in Russia is high and that citizens have the right to approach the gov-ernment remotely and trust the government. Th e survey demonstrated that the users believe they have enough knowledge and skills for using public e-services portals and e-participation platforms. At the same time, within the same institutional framework, the level of use of public e-services was still low in 2018 (29% of the respondents), and it was even lower for e-participation platforms (17% of the respondents). Th is observa-tion suggests that the nature of e-government solutions (whether it is a public e-service portal or e-participation platform) should be considered when governments are devel-oping roll-out programs.
Keywords: Internet penetration; e-government; public e-services; e-participation; trust; technology adoption.
138
Public Administration Issues. 2021. Special Issue I
Citation: Revyakin, S. A. & da Rocha, A. (2021). An Empirical Investigation of E-Government Adoption in Russia: Access, Rights, Trust and Citizens’ Experience. Public Administration Issues, no 5 (Special Issue I, electronic edition), pp. 137–160 (in English).DOI: 10.17323/1999-5431-2021-0-5-137-160
1. Introduction
E-Government is a complex phenomenon (Scholl, 2002) and its imple-mentation is usually associated with a more effi cient and cost-eff ective delivery of public services, an increase in the transparency and accountability of govern-ment, better collaboration between the government, citizens and the business-es, etc. (see, for example, Dwivedi et al., (2017); Pedersen & Tjørnehøj, (2018)). Initially, the simple defi nition of e-Government referred to the use of informa-tion and communication technologies (ICT) in government services to provide a better service for society (Sipior & Ward, 2009; Yildiz, 2007). But over time, the concept of e-government has been developed toward citizens inclusion into government decision-making and it is also associated with three main opportu-nities for citizens: to get information from the government, to engage in elec-tronic transactions to receive public services, and to participate in government decision-making (Bélanger & Carter, 2008; Th ompson et al., 2005).
All the developments in e-government are aimed at more effi cient organiza-tion of government processes for citizens’ convenience rather than the conve-nience of government agencies (Layne & Lee, 2001), making public institutions more transparent and accountable (Pérez-Morote et al., 2020). It was made for the citizens to use it and to switch from traditional ways of contacting the govern-ment. However, the intensity of use of e-government solutions (platforms, portals) by citizens depends on many variables such as trust in the government (Bélanger & Carter, 2008), psychological predispositions, civic-mindedness, information channels, and others (Dimitrova & Chen, 2006). And despite the eff orts, not all e-government projects are successful – some of them failed on adoption for diff er-ent reasons (B. Q. J. Al Nidawy et al., 2018). And “despite the signifi cant amounts of public investment devoted to enhancing e-government over the last ten years, citizens’ use of this service is still limited, posing a challenge to national govern-ments” (Pérez-Morote et al., 2020). Sipior and Ward (2009) defi ned three possible reasons: access to the Internet, computer skills, and e-government inclusion.
Th e study empirically investigates the context of the Russian Federation in recent years. In this article, we analyze some of the key factors that infl uence e-government adoption in Russia. Following Janssen, Sipior, and Th ompson (Janssen & Estevez, 2013; Sipior & Ward, 2009; Th ompson et al., 2005), we ex-plore whether or not Internet penetration rate is high, whether citizens have the right to approach the government remotely. At the same time, we explore citi-zens’ experiences with e-government tools by exploring the level of trust in gov-ernment, the level of usage of public e-services portals and e-participation plat-forms, level of computer skills, and overall satisfaction. With this background, the current paper reviews scholarly articles, analytical reports, laws, and regu-

139
Revyakin S.A., da Rocha A. An Empirical Investigation of E-Government Adoption in Russia: Access, Rights, Trust and Citizens’ Experience
lations to assess the development of public e-services and e-participation plat-forms and, based on surveys, to analyze citizens’ experiences with e-government initiatives to answer the following research questions: What is the current level of use of e-government solutions in Russia (public e-services portals and e-partic-ipation platforms)? And is the use and satisfaction rate for public e-services por-tals and e-participation platforms equal within the same institutional framework within a country?
Th e remainder of the paper is organized as follows. Th e second section con-tinues exploring the literature on the subject that shapes the model of further re-search and supports the research hypotheses. Th e latter is described in the third section. Th e fourth section describes the methodology of our research. And the fi ft h and sixth sections represent the results of the analysis. Th e ensuing discus-sion considers the theoretical and practical implications of this research. It also considers some directions for future research.
2. Literature review
Th e concept of e-government is broad and complicated. Janssen and Es-tevez (2013) discuss three main waves of the evolution of the implementation of information and communication technologies (ICT) into the public sec-tor: e-Government, t-Government, and l-Government. During the fi rst wave (e-Government) the technologies were implemented into public administration to improve public service delivery, to make it faster and easier. Online services were representing a web interface of the existing procedures in citizen-centric service provisioning with no radical changes to it (Front-end approach). Later, the technologies were used to increase the effi ciency of public service provi-sion (to transform bureaucracy) with radical organizational changes in the pro-cedures at the same time (t-Government). Th e next wave (l-Government) was characterized by a reduction in government control and an increase in collabo-ration with citizens (delegation of power) aimed at doing more with less. Janssen and Estevez (ibid.) discuss that three waves are overlapping in time. Th erefore, there are three main approaches to the implementation of ICT in public ad-ministration: Front-end approach (e-Government), Front-end + Back-end ap-proach (t-Government), and Network manage & orchestrate (l-Government). And each specifi c electronic service, portal, or platform could be set up using one of the above-mentioned approaches. Whatever it is, governments hope that their citizens will like it and use it.
Th e use of e-government solutions (platforms, portals) depends on many variables that could be divided into two groups. Th e fi rst group of factors is under the governments’ control. Th ese are access to the Internet and e-government in-clusion (Sipior & Ward, 2009), security and privacy (Al-adawi et al., 2000; Carter & Belanger, 2004b; Gil-garcia & Pardo, 2006; Stephen H. et al., 2003), ICT infra-structure (wireless internet connections, computer centers, and kiosks) (Ref-fat, 2006), training support for citizens who find difficulty in using technology (ibid.), promotional events to improve people’s awareness of the e-services provided and events to check progress (Al Bastaki, 2004; Missingham, 2013),

140
Public Administration Issues. 2021. Special Issue I
and the right to access information, engage in electronic transactions with the government and to participate in government decision-making (Thompson et al., 2005), etc.
Th e second group of factors depends on the citizens. Th is group contains the variables such as appropriate level of computer skills and knowledge (Khalil et al., 2010; Sipior & Ward, 2009), trust in the government (Bélanger & Carter, 2008), perceived usefulness (PU), and perceived ease of use (PEOU) (Carter & Belanger, 2004a; Lin et al., 2011; Warkentin et al., 2002), output quality and performance expectancy (Dwivedi et al., 2017), psychological predispositions, civic-minded-ness, and information channels (Nam, 2014).
As we see from the literature review, many factors could potentially aff ect the usage. And its combination stipulates the actual level of adoption and usage in each specifi c country. In our article, we will choose the factors that we could assess within available sources of information and methodology. We will explore the level of internet penetration in Russia (to measure whether there is access), check the existence of citizens’ rights to approach the government remotely, the level of trust in government, level of usage of public e-services portals and e-par-ticipation platforms, level of computer skills, and overall satisfaction.
3. Hypothesis development
Access to the internet is one of the key factors that aff ect the usage of e-gov-ernment solutions (Sipior & Ward, 2009). Th e countries that demonstrate high usage of e-government solutions have better access to the Internet (Al-adawi et al., 2000). Th erefore, the fi rst hypothesis in our research is derived from this statement:
H1: Th e penetration of the Internet in Russia is high (more than 70%).H1 acceptance criteria: if the penetration rate is any higher than 70%.To use e-government solutions, citizens have to get the rights to access infor-
mation, engage in electronic transactions with the government, and participate in government decision-making (Th ompson et al., 2005). Th us, the second hy-pothesis of our research is derived from this statement:
H2: Citizens’ have the right to approach government authorities remotely. H2 acceptance criteria: Th e rights of the citizens to approach government
authorities remotely are regulated by law.As was mentioned earlier, the usage of e-government tools (the demand for
them) highly correlates with trust in the government (Bélanger & Carter, 2008). Th e third hypothesis in our research is derived from this question:
H3: Citizens trust the Government of the Russian Federation H3 acceptance criteria: positive response rate is higher than 50%.“Th e success of the e-government requires the usage of these electronic ser-
vices by citizens” (B. Q. Al Nidawy et al., 2020). The fourth hypothesis in our research is derived from this statement:
H4: Citizens are ready to apply for public services online. Th is broad-based hypothesis will be divided into more specifi c sub-hypoth-
eses. To use e-portals, citizens should have the required knowledge and skills.
141
Revyakin S.A., da Rocha A. An Empirical Investigation of E-Government Adoption in Russia: Access, Rights, Trust and Citizens’ Experience
And they shall believe in success in solving the issue when applying for public services online. Th erefore, our H5.a and H5.b hypotheses are as follows:
H4.a. Citizens have enough knowledge and skills to use e-services portals.H4.b. Usually, citizens fi nd the application through e-services portals to be
eff ective in solving their issues. Having invested in e-government initiatives, governments hope their citi-
zens will like the portals and be satisfi ed with them. Th erefore, our H4.c hypoth-esis is as follows:
H4.c. Users like public-services portals and are satisfi ed with them; they are easy to use, work correctly and stably, and citizens have no worries when using them.
H4 acceptance criteria: all sub-hypotheses have been accepted. We will ac-cept sub-hypotheses if the positive response rate is more than 50%.
When testing this hypothesis, we will also explore the share of citizens who apply for public service online.
Along with public e-service delivery, e-participation is another dimension of the modern concept of e-government (Bélanger & Carter, 2008; Th ompson et al., 2005). Arranging the platforms for citizens to discuss and decide is quite a new and more complicated (advanced) form of e-government (Janowski et al., 2012; Janssen & Estevez, 2013). Russia is one of the leading countries in the world in e-government development and e-participation (see section 5.2). But if the level of use for these two types of e-government solution is comparable in Russia – this is the focus of our fi ft h hypothesis.
H5: Th e level of use of public e-services portals and e-participation plat-forms is equal
H5 acceptance criteria: Th e use rate for public e-services portals and e-par-ticipation platforms is equal.
4. Research approach
Th is section highlights the data selected for the study, the methods, and the analytical approach adopted. Th is paper is a part of a more extensive research project1 that focuses on the analysis of changes in public administration driven by digital technologies.
4.1. Data selectionWe have chosen three types of data in line with our research question. We re-
view scholarly articles, laws and regulations, surveys, and research reports (in-cluding reports from the analytical companies, European Commission, and the United Nations) to address our research question.
4.2. MethodsTo fi nd scho larly articles about the e-government concept, we ran a search
in Scopus and ScienceDirect with search phrases such as (TITLE-ABS-KEY
1 Under the Basic Research Program at the National Research University Higher School of Economics

142
Public Administration Issues. 2021. Special Issue I
(e-government)) AND (barrier) OR (challenge*) AND (legislation) or (TITLE-ABS-KEY (e-government AND adoption)) AND (rights). Th e search was made between September 2018 and June 2020. Aft er that, we analyzed the results, nar-rowed them, and then ran a search among the results.
To explore Internet penetration (H1), we were looking for existing surveys and research reports. Th e search was conducted in Google and Yandex between September 2018 and June 2020 and was limited to trusted sources.
To defi ne whether citizens have the right to approach the government re-motely we analyzed laws and regulations in Russia. We ran a search on Govern-ment portals and regulatory databases which were adopted in 2002 when the fed-eral target program ‘Electronic Russia’ was launched (see section 5.2). Th e search was made between September 2018 and June 2020.
To test hypotheses #3-5, we used the survey data that the Center for Civil Society and Nonprofi t Sector Studies of the National Research University Higher School of Economics collected in fall 2018.
4.3. AnalysisIn line with our research question and the hypotheses, we performed desk
research and the survey. At fi rst, we carried out the desk research to learn about Internet penetration in Russia (H1) and the rights of the citizens (H2). We used the data from GFK survey reports exploring Internet penetration rates in 2008–2018, considering the structure in age groups and the main reasons why it is not used in Russia. We analyzed the regulation in Russia to defi ne the extended rights of citizens to contact the government electronically. Existing public e-services portals and e-participation platforms were explored as part of the e-government landscape.
In the fall of 2018, we conducted an All-Russian population survey of adults (age 18+) on a representative sample (gender, age, education, type of settlement) to test hypotheses #3-7. A total of 2049 respondents participated in a face-to-face survey with a fl exible, conversational interview format in 48 regions of the Rus-sian Federation. Th e average age of the respondents is 44, the asymmetry is posi-tive (0,197) and it is within the ranges (-1 to 1), therefore, the distribution over this variable can be considered as normal, and we have bimodal age distribution (Fig. 1). Th e excess is negative but does not exceed 1 in absolute value, which proves the normality of the distribution.
Women prevail in survey gender structure (Fig. 2). Th e respondents with higher education have roughly 23% of the share, while
respondents with secondary education (general and specialized) have the biggest share among the respondents (57.5%) (Fig. 3).
Th e questionnaire contained 29 questions on citizens’ experiences with both offl ine and online interactions with government authorities, although only a por-tion of the questions relates to the topic of this article2.
2 Th is paper is a part of a more extensive research project that focuses on the analysis of changes in public administration driven by digital technologies (under the Basic Research Program at the National Research University Higher School of Economics).

143
Revyakin S.A., da Rocha A. An Empirical Investigation of E-Government Adoption in Russia: Access, Rights, Trust and Citizens’ Experience
Figure 1: Age Distribution of Survey Respondents (HSE All-Russian population survey 18+, 2018).
Parameter Value
Mean 44,0776
Median 44,0000
Mode 55,00
standard deviation 15,44886
Dispersion 238.667
Asymmetry 0,197
standard asymmetrical error 0,054
Excess -0,839
standard excess error 0,108
Figure 2: Gender Distribution of Survey Respondents (HSE All-Russian population survey 18+, 2018).
Age
Fr
eque
ncy

144
Public Administration Issues. 2021. Special Issue I
Figure 3: Education structure of the survey (HSE All-Russian population survey 18+, 2018).
5. E-government in Russia: access to the Internet and citizens’ rights 5.1. Internet penetration in RussiaTh e penetration of the Internet was increasing all over Russia between 2014–
2018. In 2018, 75.4% of citizens in Russia had access (76%3–79.8%4 in 2019 – which is comparable to Latin America/Caribbean countries (70.5%), but lower than in Europe (87.2%) and North America (94.6%))5 (Fig. 4).
F igure 4: Penetration of the Internet in Russia (2008–2018) (Omnibus GFK-Rus, the whole of Russia, population 16+)6
3 URL: https://mediascope.net/news/1035826 (last access: 29.04.2021).https://mediascope.net/news/1035826/4 URL: https://www.gfk .com/ru/press/issledovanie-kazhdyi-pjatyi-vzroslyi-rossijanin-ne-polzuetsja-internetom?hsLang=ru / (last access: 29.04.2021).5 URL: https://www.internetworldstats.com/stats.htm (last access: 29.04.2021).6 URL: https://www.gfk .com/fi leadmin/user_upload/dyna_content/RU/Documents/Press_Releases/2019/GfK_Rus_Internet_Audience_in_Russia_2018.pdf (last access: 29.04.2021).

145
Revyakin S.A., da Rocha A. An Empirical Investigation of E-Government Adoption in Russia: Access, Rights, Trust and Citizens’ Experience
Aft er a dramatic increase in 2013, the growth rate is slowly decreasing. Fur-ther growth is mostly expected from involving elderly people to use the Internet, while among young and middle-aged people Internet penetration is close to the limit (Fig. 5). In addition, 61% of the population is using mobile Internet, and smartphones are preferable to tablets7.
Figure 5: Internet penetration in age groups (Omnibus GFK-Rus, the whole of Russia, population 16+)8.
Of the total Russian population, 20.2%9 (more than 24 million people) do not use the Internet. Th e main reasons are the following: there is no need (55% in 2018 and 48.4% in 201910), lack of skills (29.1% in 2018, 35.7% in 2019), and absence of a device – computer, laptop or smartphone (Fig. 6).
Figure 6: Why 24 mln citizens do not use the Internet (GfK All-Russian Representative Survey, 16+, 2019)11.
7 URL: https://www.gfk .com/fi leadmin/user_upload/dyna_content/RU/Documents/Press_Releases/2019/GfK_Rus_Internet_Audience_in_Russia_2018.pdf (last access: 29.04.2021).8 URL: ibid.9 URL: https://www.gfk .com/ru/press/issledovanie-kazhdyi-pjatyi-vzroslyi-rossijanin-ne-polzuetsja-internetom?hsLang=ru / (last access: 29.04.2021).10 Of all who does not use Internet.11 URL: https://www.gfk .com/ru/press/issledovanie-kazhdyi-pjatyi-vzroslyi-rossijanin-ne-polzuetsja-internetom?hsLang=ru / (last access: 29.04.2021).
– –

146
Public Administration Issues. 2021. Special Issue I
As we can see from the dynamics (Fig.6), the share of people who “do not need” the Internet is decreasing. It seems that they acknowledge the need and have found that they do not have proper devices and skills (both “no device” and “lack of skills” shares are increasing).
As per the concept of our study and the results described in section 4.1 (Fig. 4), we shall accept the fi rst hypothesis (H1: Th e penetration of the Internet in Russia is high (more than 70%)).
5.2. E-government in Russia: the rights of the citizens Th e Russian Federation is one of the leading countries in e-government de-
velopment and e-participation (32nd place in the list of the top-ranking countries, 23rd place in the E-Participation Index (EPI) according to the United Nations 2018 Survey) (United Nations, 2018). Th e importance of the e-government con-cept has been offi cially recognized in Russia since 2002.
Th e institutional foundations for the penetration of electronic technologies in public administration in Russia were laid in 2002–2010 by implementing the federal target program (Electronic Russia).
Th e goal of the program was to improve the quality of interactions between the government and society by providing citizens with the right to access informa-tion about the activities of public authorities by increasing the effi ciency of public e-services delivery, including the introduction of uniform standards for serving citizens12.
Since 2006 citizens have been eligible to contact government authorities elec-tronically (Article 2 of the Federal Law of 27.07.2006 №149-FZ “On Information, Information Technologies and the Protection of Information”13).
In 2009, the Russian Government launched the Federal public e-services portal “Gosuslugi”14. In Janssen’s classifi cation,15 it is a T-government model aimed at increasing the effi ciency of public e-service delivery by implementing innovative IT solutions along with radical organizational changes. Before the service was implemented, citizens had to approach a government body in per-son (with a few exceptions).
Since its launch, many government services have been available online through the one-window portal which should decrease the transactional cost for citizens per service obtained. In Multifunctional Centers that the govern-ment has established throughout cities, citizens are involved in changing the way they communicate with the government. Along with the Federal public e-services portal “Gosuslugi,” there are Regional portals of state and municipal services.
Besides public e-services portals, there is an additional type of portal focused on the collection of citizens’ complaints on the quality of public services and/or
12 URL: https://digital.gov.ru/ru/activity/programs/6/ (last access: 29.04.2021).13 URL: http://www.consultant.ru/document/cons_doc_LAW_61798/ (last access: 29.04.2021).14 URL: https://www.gosuslugi.ru/ (last access: 29.04.2021).15 We will not consider the earlier stage of implementation of e-services – when government authorities launched their websites.
147
Revyakin S.A., da Rocha A. An Empirical Investigation of E-Government Adoption in Russia: Access, Rights, Trust and Citizens’ Experience
ideas on their improvement. For instance, the portal of the Government of Mos-cow “Our City”16 allows any issue on Housing and Utilities to be submitted, and the “Russian public initiative”17 allows the publication of public petitions to be considered by the government if they collect enough public votes.
In recent years there has been an increase in the number of e-participation portals that allow citizens to participate in the government decision-making pro-cess. For example, one of the most advanced e-participation platforms in Rus-sia is “Activny grazhdanin” (Active citizen) launched by the Moscow authorities. Th is platform is the winner of awards such as the Smart Cities Awards-201518. Established in 2014, the platform was aimed at obtaining the opinion of Mus-covites on pressing issues related to the development of Moscow. Th is platform showed reliability, the integrity of voting results, and the lack of the ability to ma-nipulate the vote (PWC19).
Th erefore, along with the implementation of e-government initiatives in Rus-sia, citizens gained the right to approach government authorities remotely (elec-tronically).
As per the concept of our study and the results of section 5.2, we shall accept the second hypothesis (H2: Citizens’ have the right to approach government au-thorities remotely.
5.3. Trust in Government institutionsTo explore the output of Government eff orts we performed the survey using
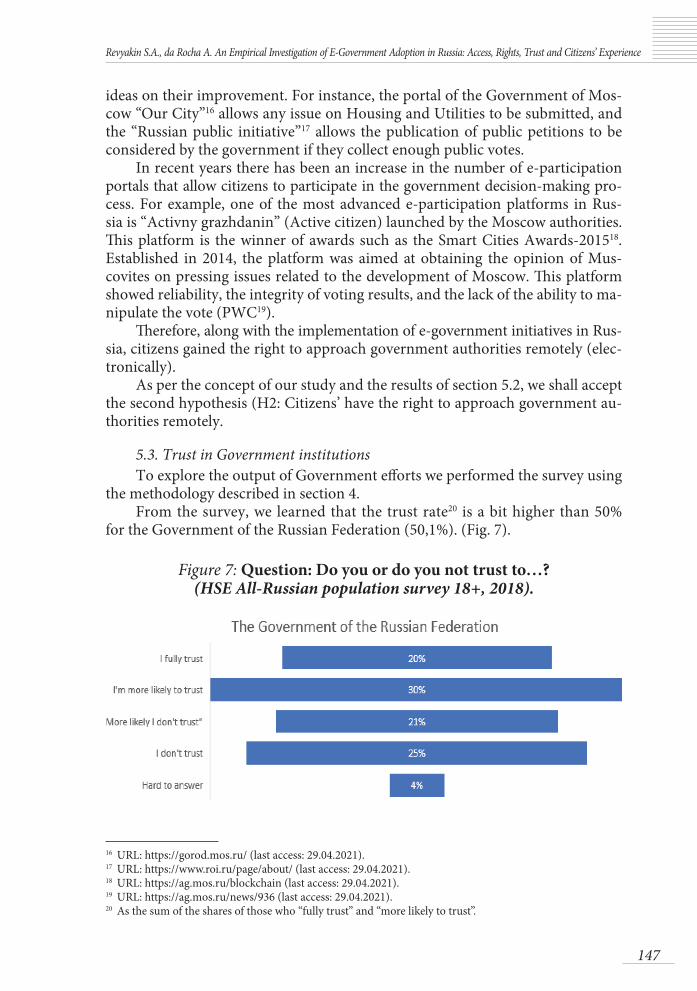
the methodology described in section 4.From the survey, we learned that the trust rate20 is a bit higher than 50%
for the Government of the Russian Federation (50,1%). (Fig. 7).
Figure 7: Question: Do you or do you not trust to…? (HSE All-Russian population survey 18+, 2018).
16 URL: https://gorod.mos.ru/ (last access: 29.04.2021).17 URL: https://www.roi.ru/page/about/ (last access: 29.04.2021).18 URL: https://ag.mos.ru/blockchain (last access: 29.04.2021).19 URL: https://ag.mos.ru/news/936 (last access: 29.04.2021).20 As the sum of the shares of those who “fully trust” and “more likely to trust”.
148
Public Administration Issues. 2021. Special Issue I
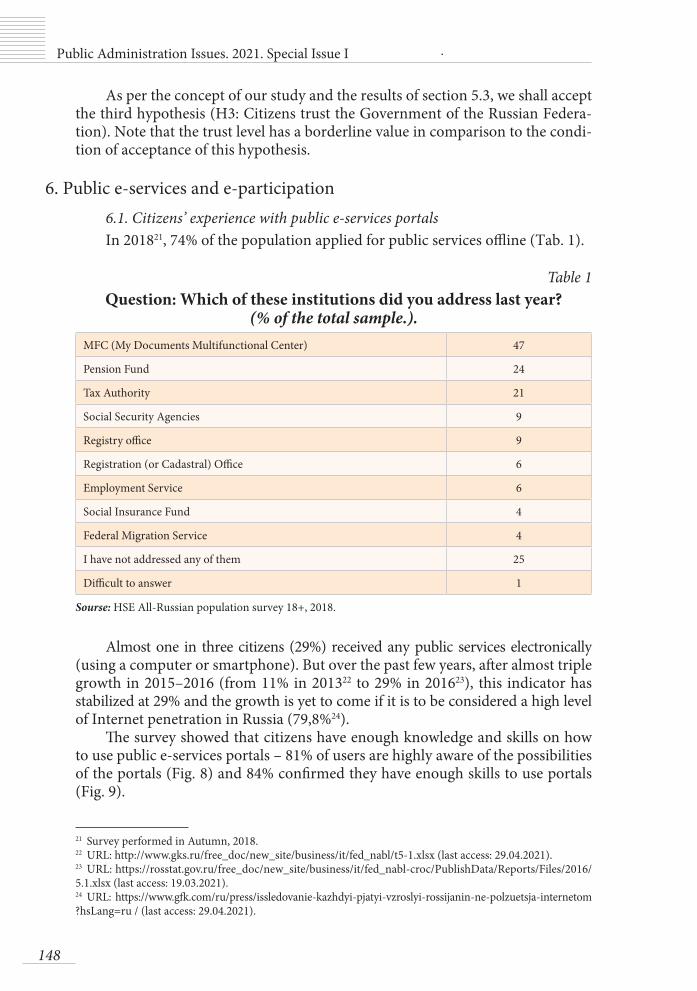
As per the concept of our study and the results of section 5.3, we shall accept the third hypothesis (H3: Citizens trust the Government of the Russian Federa-tion). Note that the trust level has a borderline value in comparison to the condi-tion of acceptance of this hypothesis.
6. Public e-services and e-participation6.1. Citizens’ experience with public e-services portalsIn 201821, 74% of the population applied for public services offl ine (Tab. 1).
Table 1Question: Which of these institutions did you address last year?
(% of the total sample.).MFС (My Documents Multifunctional Center) 47
Pension Fund 24
Tax Authority 21
Social Security Agencies 9
Registry offi ce 9
Registration (or Cadastral) Offi ce 6
Employment Service 6
Social Insurance Fund 4
Federal Migration Service 4
I have not addressed any of them 25
Diffi cult to answer 1
Sourse: HSE All-Russian population survey 18+, 2018.
Almost one in three citizens (29%) received any public services electronically (using a computer or smartphone). But over the past few years, aft er almost triple growth in 2015–2016 (from 11% in 201322 to 29% in 201623), this indicator has stabilized at 29% and the growth is yet to come if it is to be considered a high level of Internet penetration in Russia (79,8%24).
Th e survey showed that citizens have enough knowledge and skills on how to use public e-services portals – 81% of users are highly aware of the possibilities of the portals (Fig. 8) and 84% confi rmed they have enough skills to use portals (Fig. 9).
21 Survey performed in Autumn, 2018.22 URL: http://www.gks.ru/free_doc/new_site/business/it/fed_nabl/t5-1.xlsx (last access: 29.04.2021).23 URL: https://rosstat.gov.ru/free_doc/new_site/business/it/fed_nabl-croc/PublishData/Reports/Files/2016/5.1.xlsx (last access: 19.03.2021). 24 URL: https://www.gfk .com/ru/press/issledovanie-kazhdyi-pjatyi-vzroslyi-rossijanin-ne-polzuetsja-internetom?hsLang=ru / (last access: 29.04.2021).

149
Revyakin S.A., da Rocha A. An Empirical Investigation of E-Government Adoption in Russia: Access, Rights, Trust and Citizens’ Experience
Figure 8: Question: How would you rate your knowledge about the possibilities of using public e-services portals of state and municipal
services? (HSE All-Russian population survey 18+, 2018).
Figure 9: Question: How would you rate your level as a user of public e-services portals of state and municipal services?
(HSE All-Russian population survey 18+, 2018).
At least half of all users of public e-services (53%) found it to be eff ective in solving their issues (Fig. 10).
Figure 10: Question: How oft en have you managed to resolve your issues when using the portals of state and municipal services?
(HSE All-Russian population survey 18+, 2018).
Th e overall satisfaction rate of users of public e-services portals (at federal and municipal level) is very high (88%) (Fig. 10) and is similar to the satisfaction rate with public services obtained offl ine (84%).
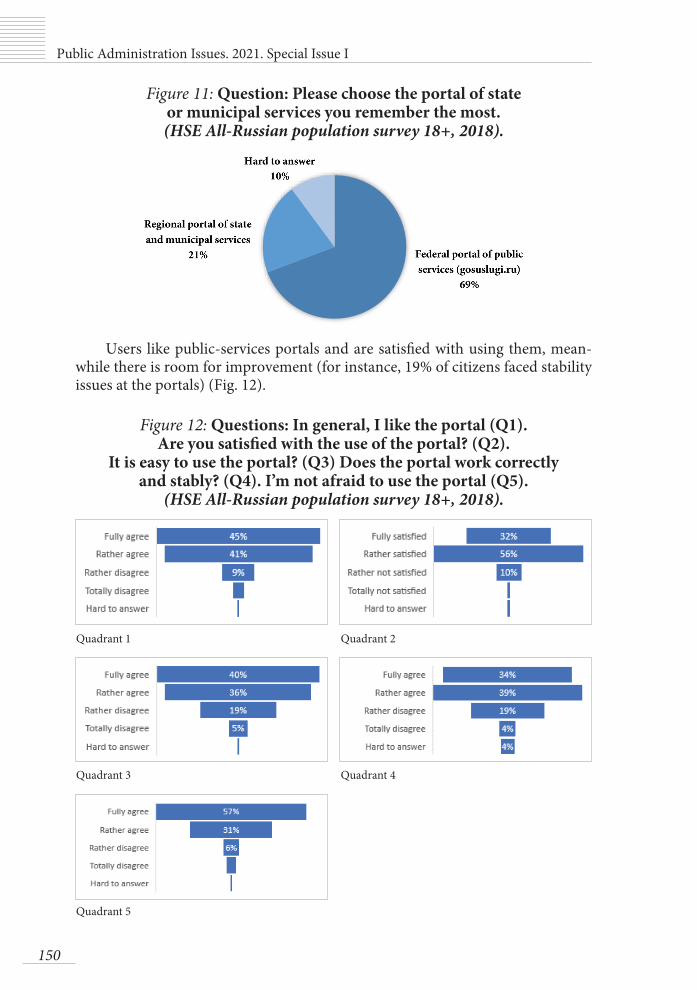
The most popular e-service platform in Russia is the federal portal Gos-uslugi.ru – at least two-thirds of users of public e-services (69%) used it when apply-ing for the service (Fig. 11). Every fi ft h user turned to the regional portal of state and municipal services (21%). Despite this, the satisfaction rate does not diff er signifi -cantly among the portals (federal or municipal) and did not fall below 67% (Fig. 11).
150
Public Administration Issues. 2021. Special Issue I
Figure 11: Question: Please choose the portal of state or municipal services you remember the most. (HSE All-Russian population survey 18+, 2018).
Users like public-services portals and are satisfi ed with using them, mean-while there is room for improvement (for instance, 19% of citizens faced stability issues at the portals) (Fig. 12).
Figure 12: Questions: In general, I like the portal (Q1). Are you satisfi ed with the use of the portal? (Q2).
It is easy to use the portal? (Q3) Does the portal work correctly and stably? (Q4). I’m not afraid to use the portal (Q5).
(HSE All-Russian population survey 18+, 2018).
Quadrant 5
Quadrant 1 Quadrant 2
Quadrant 3 Quadrant 4

151
Revyakin S.A., da Rocha A. An Empirical Investigation of E-Government Adoption in Russia: Access, Rights, Trust and Citizens’ Experience
Th ese rates are higher for the federal portal in comparison to regional portals (for example, on reliability and safety).
In section 6.1 we learned that 29% of the population in Russia applies for public services electronically. Current users believe they have enough knowledge and skills to apply for public e-services. But only half of them found the use of portals to be eff ective in solving the issue. Nevertheless, the satisfaction rate of the portals is high and people like the portals but emphasize that they could be improved, for instance in terms of stability of operations. Th us, citizens were satisfi ed and able to obtain the desired result when applying for public services online – although the share of citi-zens remains low and most of the people are used to applying for public services traditionally.
As per the concept of our study and the results of section 6.1, we shall accept the fourth hypothesis (H4: Citizens are ready to apply for public services online) as soon as we have accepted all sub-hypotheses.
6.2 Citizens’ experience with e-participation platforms25
33% of the citizens in Russia believe in the value of using the platforms, while 23% of citizens could not estimate the value (Fig. 13).
Figure 13: Question: Are various interactive and electronic portals eff ective tools for infl uencing environmental changes, observing
citizens’ rights, and developing socially signifi cant projects in various fi elds? (HSE All-Russian population survey 18+, 2018).
It seems that this 23% are potential active users if provided with additional information and the incentives to participate are demonstrated.
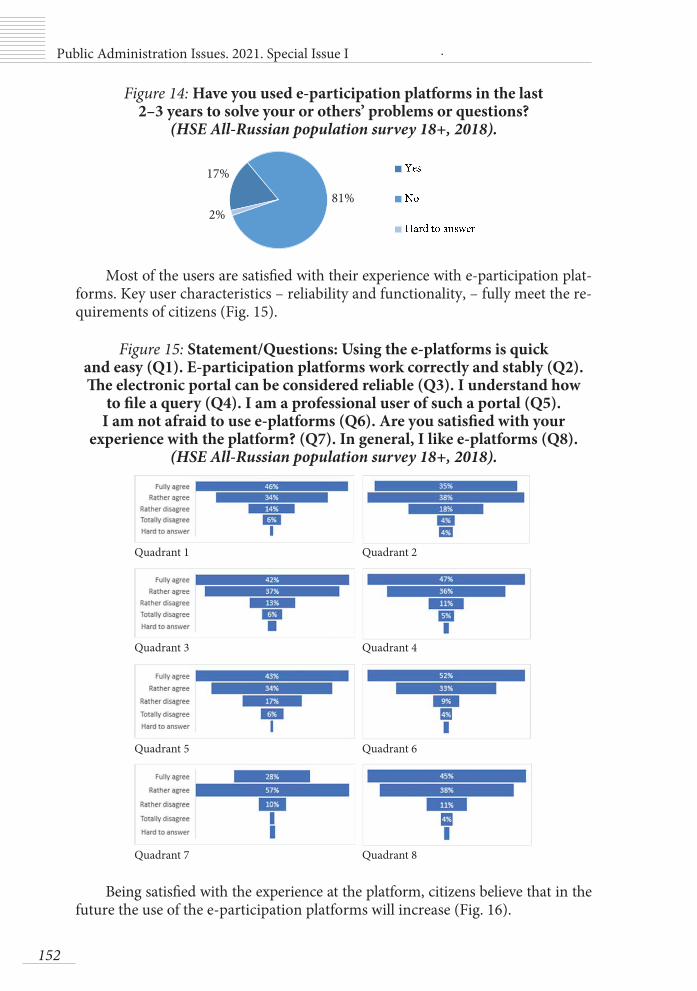
At the same time, only 17% of citizens have tried e-participation platforms. Most citizens (81%) do not use this type of interaction with the government (Fig. 14).
25 We will use separate terms for e-participation websites in order to separate it from public e-service portals. Saying a platform, we will mean communication capabilities inside.
152
Public Administration Issues. 2021. Special Issue I
2%81%
17%
Figure 14: Have you used e-participation platforms in the last 2–3 years to solve your or others’ problems or questions?
(HSE All-Russian population survey 18+, 2018).
Most of the users are satisfi ed with their experience with e-participation plat-forms. Key user characteristics – reliability and functionality, – fully meet the re-quirements of citizens (Fig. 15).
Figure 15: Statement/Questions: Using the e-platforms is quick and easy (Q1). E-participation platforms work correctly and stably (Q2). Th e electronic portal can be considered reliable (Q3). I understand how
to fi le a query (Q4). I am a professional user of such a portal (Q5). I am not afraid to use e-platforms (Q6). Are you satisfi ed with your
experience with the platform? (Q7). In general, I like e-platforms (Q8). (HSE All-Russian population survey 18+, 2018).
Being satisfi ed with the experience at the platform, citizens believe that in the future the use of the e-participation platforms will increase (Fig. 16).
Quadrant 1
Quadrant 3
Quadrant 5
Quadrant 7
Quadrant 2
Quadrant 4
Quadrant 6
Quadrant 8
153
Revyakin S.A., da Rocha A. An Empirical Investigation of E-Government Adoption in Russia: Access, Rights, Trust and Citizens’ Experience
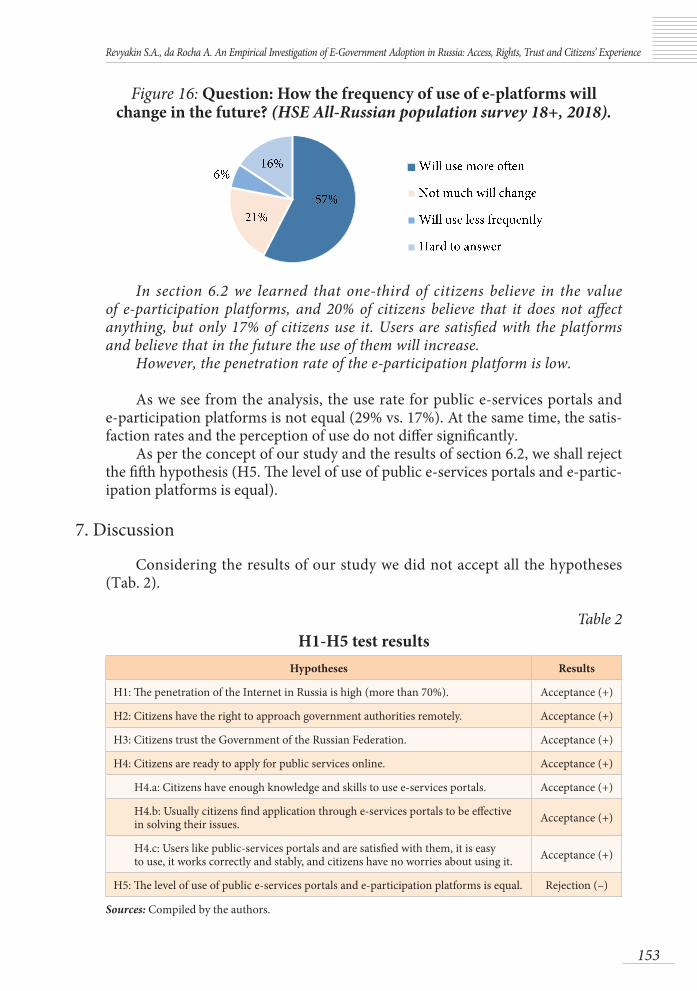
Figure 16: Question: How the frequency of use of e-platforms will change in the future? (HSE All-Russian population survey 18+, 2018).
In section 6.2 we learned that one-third of citizens believe in the value of e-participation platforms, and 20% of citizens believe that it does not aff ect anything, but only 17% of citizens use it. Users are satisfi ed with the platforms and believe that in the future the use of them will increase.
However, the penetration rate of the e-participation platform is low.
As we see from the analysis, the use rate for public e-services portals and e-participation platforms is not equal (29% vs. 17%). At the same time, the satis-faction rates and the perception of use do not diff er signifi cantly.
As per the concept of our study and the results of section 6.2, we shall reject the fi ft h hypothesis (H5. Th e level of use of public e-services portals and e-partic-ipation platforms is equal).
7. Discussion
Considering the results of our study we did not accept all the hypotheses (Tab. 2).
Table 2H1-H5 test results
Hypotheses Results
H1: Th e penetration of the Internet in Russia is high (more than 70%). Acceptance (+)
H2: Citizens have the right to approach government authorities remotely. Acceptance (+)
H3: Citizens trust the Government of the Russian Federation. Acceptance (+)
H4: Citizens are ready to apply for public services online. Acceptance (+)
H4.a: Citizens have enough knowledge and skills to use e-services portals. Acceptance (+)
H4.b: Usually citizens fi nd application through e-services portals to be eff ective in solving their issues. Acceptance (+)
H4.c: Users like public-services portals and are satisfi ed with them, it is easy to use, it works correctly and stably, and citizens have no worries about using it. Acceptance (+)
H5: Th e level of use of public e-services portals and e-participation platforms is equal. Rejection (–)
Sources: Compiled by the authors.

154
Public Administration Issues. 2021. Special Issue I
As we learned from section 5.1, the penetration rate of the Internet is rath-er high (79,8%26 in 2019). We accepted H1 (Tab. 2) and confi rmed that 79.8% of citizens have access to the Internet, which is one of the key conditions for the high usage of e-government solutions (Sipior & Ward, 2009). But the growth rate has been decreasing since 2013, which means that the growth potential is close to its limit within the current institutional framework. Along with further insti-tutional developments, the growth might be sourced from encouraging the el-derly (the penetration rate is 36%) and middle-aged people (the penetration rate is 88%) to use the Internet.
As we learned from section 5.2, the Russian government is developing pub-lic e-services portals and e-participation platforms along with extending citizens’ rights (H2). Along with high Internet penetration, this is another factor that shall stipulate high usage of e-government tools.
However, we revealed a usage gap between public e-services portals and e-participation platforms. In our research, only 29% of citizens reported using the Internet for obtaining public services, and 17% of such citizens used pub-lic participation platforms (Fig. 17). Th is gap in Russia is not unique and other governments all around the world have experienced the same. When Bélanger was describing the experience of the US Government in implementing e-govern-ment initiatives he mentioned that “despite the governments’ growing investment in electronic services, citizens are still more likely to use traditional methods, e.g., phone calls or in-person visits, than the Web to interact with the government” (Bélanger & Carter, 2008).
Figure 17. Th e demand chain (the level of penetration, penetration rate, 2018) (HSE All-Russian population survey 18+, 2018).
Taking into consideration the high demand for public services and the high Internet penetration rate (Fig. 17), the current level of adoption of e-government initiatives in Russia seems to be low in comparison to other countries. For in-stance, in European countries, 57% of individuals aged 16 to 74 reported using the Internet for interaction with public authorities in 2018 (European Commission, 2018) which is also considered to be low (Pérez-Morote et al., 2020). At the same
26 URL: https://www.gfk .com/ru/press/issledovanie-kazhdyi-pjatyi-vzroslyi-rossijanin-ne-polzuetsja-internetom?hsLang=ru / (last access: 29.04.2021).
155
Revyakin S.A., da Rocha A. An Empirical Investigation of E-Government Adoption in Russia: Access, Rights, Trust and Citizens’ Experience
time, usage phenomena shall be explored additionally soon; “measuring usage is challenging and obtaining pertinent data is much more diffi cult than measuring the supply side of e-government functions” (Nam, 2014).
Th e absence of need, a lack of skills, and the absence of devices were named as the main reasons why citizens did not use the Internet in 2018–2019. It might also be the reason why the high demand for public services is not converting into high demand for public e-services (which is associated with ease and effi ciency) when the penetration of the Internet is high. But this statement needs to be fur-ther explored and proved. If it is proved to increase Internet and public e-services penetration rate further, we might suggest focusing on the advertising of success stories in using public e-services, on education support for the elderly and oth-ers, on special discount programs to purchase (or rent) a device, or on increasing the awareness about public computer rooms that are available at Multifunctional Centers for public services.
Another reason for the low usage that is mentioned in the literature is a lack of trust in the government (B. Q. J. Al Nidawy et al., 2018). As we learned from section 5.3, we accepted H3, but the value of the indicator is close to the one that has to be rejected.
The current level of trust in the government is quite moderate (50,1%). As soon as we know from the literature that a low level of trust negatively aff ects the usage, the current level in Russia could also negatively aff ect the usage of e-government tools and explain why there is a signifi cant gap between the usage rate of the public services obtained traditionally (74%) and online (29%).
“Many citizens may be reluctant to adopt e-government services due to a lack of trust in the security of online transactions and concerns regard-ing the use of information submited electronically” (Bélanger & Carter, 2008), and both trust in the Internet and trust in the government matters when consid-ering the intensity of use of e-government tools. But the high penetration rate of the Internet in Russia could be interpreted as a trust in technology. Perhaps one of the reasons for the low level of demand for e-government tools is the lack of trust in this specifi c technology (not trust in the Internet but trust in privacy, accuracy, the security of personal data transfer when submitting the application and the unknown price of the error). And as we learned from Figure 13, citi-zens who tried public e-services portals believe that it works accurately, stable, and secures privacy, and ranged their experience to be positive and success-ful. Th erefore, the fi rst experience matters and one of the further government eff orts towards usage increase could be the development of the measures for citizens to make the fi rst attempt with public e-services and make sure it is suc-cessful. Sipior et al. advised: “to secure Internet access, coordinate education and training, and sustain Internet use to initiate e-Government participation among the techno-disadvantaged” (Sipior & Ward, 2009). To motivate citizens to have their fi rst attempt the government could use social advertising (sharing successful experiences) through interpersonal channels (e.g., from friends, fam-ily, coworkers) and mass media channels (Dimitrova & Chen, 2006), provide extended online and offline support for users, and launch of educational pro-grams, etc.
156
Public Administration Issues. 2021. Special Issue I
We revealed that demand for public e-services in Russia is not so high, but it is even lower for public participation platforms (Fig. 17). It seems that some additional factors aff ect usage in comparison to those which negatively aff ect the use of public e-service. Th ese factors might not work for public e-services, as soon as there is an obvious need to get something (sometimes it is a must to register at the portals to get public services offl ine, or an offl ine service is not available anymore), while there is no need or obligations to participate, hence there should be some other motivation to get involved. And that could be the explanation of why the penetration of public e-services is almost two times higher than for e-participation. Th erefore, our hypothesis for further research is the following:
A lack of trust, skills, needs, devices and fi rst successful experience negatively af-fect the demand (usage) for public e-services, but it aff ects e-participation to a high-er extent within the same institutional framework. Th erefore, from a theoretical and practical perspective, the nature of e-government solutions should be consid-ered when governments are developing roll-out programs. To grow usage of e-par-ticipation, there should be a growth in usage of public e-services (to be involved by e-government technology), having obtained a positive fi rst-time experience that was broadly shared via two main informational channels (interpersonal channels and mass media channels).
Th e research undertaken produced three practical recommendations to ac-celerate the usage of e-government solutions:1. To increase the Internet penetration rate in Russia in the 30–54 and 55+ age
groups, and to develop measures to increase trust in the government.2. Empower the fi rst successful experience of the citizens (who currently do not use
it) by sharing success stories (“no-need” issue, “trust in e-government technol-ogy” issue), educational arrangements (incl. for elderly people), and increasing the awareness about public computer rooms that are available at Multifunc-tional Centers for public services (“no-skills” issue) and special discount pro-grams (subsidies) to purchase (rent) a device (“no-device” issue).
3. Analyze the factors that aff ect the usage of e-participation in Russia (as soon as the level of usage of it diff ers from the same level for public e-services por-tals). Develop separate strategies for growth in usage of public e-services and e-participation platforms.
Today e-government can be considered as one of the multiple options that citizens can select for their interactions with the government (Nam, 2014). And as soon as this is a relatively new option, maybe the government shall not worry about the lower usage (in comparison to traditional channels of interac-tion) and consider it to be evolutional? “Th e increase in citizens’ use of e-gov-ernment, nevertheless, becomes a discernible long-term trend because a growing number of people have recognized and experienced greater effi ciency, eff ective-ness, and convenience in using various government functions via e-government and digital connections with conventional channels” (Nam, 2014). It seems that the process of the implementation of technology into public administration takes time and the progress depends on many factors that may diff er signifi cantly be-
157
Revyakin S.A., da Rocha A. An Empirical Investigation of E-Government Adoption in Russia: Access, Rights, Trust and Citizens’ Experience
tween the countries that need to be analyzed and managed in each specifi c gov-ernment to increase the usage.
7. Conclusion
Th is paper explored what the current level of use of e-government solutions in Russia is and whether or not the use and satisfaction rate for public e-services portals and e-participation platforms is equal within the same institutional frame-work within a country.
To answer the research questions, the authors conducted desk research and a survey. Th e paper explored whether or not the Internet penetration rate is high, whether citizens have the right to approach the government remotely, what the level of trust in the government is, the level of usage of public e-services portals and e-participation platforms, the level of computer skills, and overall satis-faction. Th e fi ndings show that Internet penetration as an opportunity to use e-government tools is rather high (75,4%), but the actual level of use of public e-services is low (29%) and even lower for e-participation (17%). Th e use gap between traditional and online channels of interaction with the government is making Russia comparable to other countries. A high Internet penetration rate, extended rights of the citizens to apply to government authorities remotely, and a moderate level of trust in the government belong to the group of factors that positively aff ect the usage. At the same time, the absence of skills, devices, and needs within some socio-economic groups, plus the lack of a fi rst successful attempt (experience) (for diff erent reasons, including fear of technology, trust in it, psychological factors, etc.) belongs to the group of factors that negatively aff ect the usage of e-government solutions.
Th e study confi rmed the results of existing literature that also emphasized that “despite the signifi cant amounts of public investment devoted to enhancing e-government over the last ten years, citizens’ use of this service is still limited, posing a challenge to national governments” (Pérez-Morote et al., 2020). And the problem of the low usage of e-government solutions is common for many emerging countries, including Russia. The contribution of this study could be measured by:– the assessment of the current level of use of e-government solutions in Russia
(for public e-services portals and e-participation platforms) and the explora-tion of some of the key factors that infl uence the use (Internet penetration rate, citizens’ rights to approach the government remotely, the level of trust in government, the level of usage of public e-services portals and e-participa-tion platforms, the level of computer skills, and overall satisfaction);
– proving the statement: within the same institutional framework the use and satisfaction rate for public e-services portals and e-participation platforms could differ; the nature of e-government solutions (whether it is a public e-service portal or an e-participation platform) should be considered when governments are developing roll-out programs;
– suggesting three practical recommendations to accelerate the usage of e-gov-ernment solutions.
158
Public Administration Issues. 2021. Special Issue I
Th e research has some limitations. As we mentioned in section 3, multiple variables aff ect the level of use of e-government solutions. Th is paper considers only some of these, based on the data available. Th e article represents the fi rst layer of the analysis and does not share some of the more in-depth results of the analysis. For example, the relationship between citizens’ experience with “off -line public services” and their use of e-government solutions, which will be the subject of the next article.
Declaration of Competing Interest
Th is arti cle is an output of a research project implemented as part of the Ba-sic Research Program at the National Research University Higher School of Eco-nomics (HSE University). Th e research has been executed independently by the authors.
CRediT author statement
Sergey A. Revyakin: Conceptualization, Methodology, Validation, Formal Analysis, Investigation, Data Curation, Writing – Original Draft ; Álvaro da Rocha: Writing – Review & Editing.
AcknowledgmentsWe would like to thank Dr. Irina Mersyanova for arranging the survey and sharing the data. We would like to thank the review team for their
encouragement and guidance throughout the review process.
REFERENCES
1. Al-Adawi, Z., Yousafzai, S. & Pallister, J. (2000). E-Government. Getting IT Right at the Start. Th e Health Service Journal, vol. 110, no 5728, pp. 1–10.
2. Al Bastaki, M. (2004). Dubai eGovernment Achievements & Upcoming Challenges. Available at: https://www.oecd.org/mena/governance/36279733.pdf (accessed: 09 April 2021).
3. Al Nidawy, B.Q.J., Sidek, S. & Al-Shami, S.A. (2018). Systematic Review of Critical Factors and Th eir Dimensions Infl uencing Trust in e-Government for Usage or Willingness to Use by Citizens: Taxonomy, Open Challenges, Motivation and Recommendations. Opcion, vol. 34, no 85, pp. 2748–2794.
4. Al Nidawy, B.Q., Sidek, S., Al-Shami, S. A. & Elzamly, A. (2020). E-Government Trust Model (Egov-Trust) that Enhances the Usage of E-Government Services among Users in Iraq. Journal of Th eoretical and Applied Information Technology, vol. 98 no 3, pp. 402–418.
159
Revyakin S.A., da Rocha A. An Empirical Investigation of E-Government Adoption in Russia: Access, Rights, Trust and Citizens’ Experience
5. Bélanger, F. & Carter, L. (2008). Trust and Risk in e-Government Adoption. Journal of Stra-tegic Information Systems, vol. 17, no 2, pp. 165–176. Available at: https://doi.org/10.1016/j.jsis.2007.12.002 (accessed: 09 April 2021).
6. Carter, L. & Belanger, F. (2004a). Citizen Adoption of Electronic Government Initiatives. Proceedings of the Hawaii International Conference on System Sciences, vol 37(C), pp. 1895–1904. Available at: https://doi.org/10.1109/hicss.2004.1265306 (accessed: 09 April 2021).
7. Carter, L. & Belanger, F. (2004b). Th e Infl uence of Perceived Characteristics of Innovating on e-Government Adoption. Electronic Journal of E-Government, vol 2, no 1, pp. 11–20. Available at: https://doi.org/10.1504/IJMC.2011.040606 (accessed: 09 April 2021).
8. Dimitrova, D.V.D.V. & Chen, Y.C.Y.-C. (2006). Profi ling the Adopters of E-Government Information and Services: Th e Infl uence of Psychological Characteristics, Civic Minded-ness, and Information Channels. Social Science Computer Review, vol. 24, no 2, pp. 172–188. Available at: https://doi.org/10.1177/0894439305281517 (accessed: 09 April 2021).
9. Dwivedi, Y.K., Rana, N.P., Janssen, M., Lal, B., Williams, M.D. & Clement, M. (2017). An Empirical Validation of a Unifi ed Model of Electronic Government Adoption (UMEGA). Vol. 34, pp. 211–230. Available at: https://doi.org/10.1016/j.giq.2017.03.001 (accessed: 09 April 2021).
10. European Commission. (2018). E-Government Activities of Individuals Via Websites. A vail-able at: https://appsso.eurostat.ec.europa.eu/nui/show.do?dataset=isoc_ciegi_ac&lang=en (accessed: 09 April 2021).
11. Gil-garcia, J.R. & Pardo, T.A. (2006). Multi-Method Approaches to Digital Government Re-search: Value Lessons and Implementation Challenges Multi-Method Approaches to Digital Government Research: Value Lessons and Implementation Challenges. May 2014. Available at: https://doi.org/10.1109/HICSS.2006.356 (accessed: 09 April 2021).
12. Janowski, T., Pardo, T.A. & Davies, J. (2012). Government Information Networks – Map-ping Electronic Governance Cases through Public Administration Concepts. Government Information Quarterly, no 29, S1–S10. Available at: https://doi.org/https://doi.org/10.1016/j.giq.2011.11.003 (accessed: 09 April 2021).
13. Janssen, M. & Estevez, E. (2013). Lean Government and Platform-Based Governance-Doing More with Less. Government Information Quarterly, no 30 (SUPPL. 1), S1–S8. Ava ilable at: https://doi.org/10.1016/j.giq.2012.11.003 (accessed: 09 April 2021).
14. Khalil, I., Nadi, A. & Woods, P. (2010). Success Factors Contributing to eGovernment Adoption in Saudi Arabia 2 . EGovernment Adoption Success Factors.
15. Layne, K. & Lee, J. (2001). Developing Fully Functional e-Government: A Four Stage Model. Government Information Quarterly, vol. 18, no 2, pp. 122–136. Available at: https://doi.org/https://doi.org/10.1016/S0740-624X(01)00066-1 (accessed: 09 April 2021).
16. Lin, F., Fofanah, S.S. & Liang, D. (2011). Assessing Citizen Adoption of e-Government Initia-tives in Gambia: A Validation of the Technology Acceptance Model in Information Systems Success. Government Information Quarterly, vol. 28, no 2, pp. 271–279. Available at: https://doi.org/10.1016/j.giq.2010.09.004 (accessed: 09 April 2021).
17. Missingham, R. (2013). Australian Government Publishing Online a Decade on: Has the Promise Been Delivered? 8623. Available at: https://doi.org/10.1080/00048623.2007.10721310 (accessed: 09 April 2021).
160
Public Administration Issues. 2021. Special Issue I
18. Nam, T. (2014). Determining the Type of e-Government Use. Government Information Quarterly, vol. 31, no 2, pp. 211–220. Available at: https://doi.org/10.1016/j.giq.2013.09.006 (accessed: 09 April 2021).
19. Pedersen, K. & Tjørnehøj, G. (2018). Successful e-Government Transformation: Pressure, Support, Capabilities and the Freedom to Use Th em. Electronic Journal of Electronic Govern-ment, vol.16, no 2, pp. 168–184.
20. Pérez-Morote, R., Pontones-Rosa, C. & Núñez-Chicharro, M. (2020). Th e Eff ects of e-Gov-ernment Evaluation, Trust and the Digital Divide in the Levels of e-Government Use in Eu-ropean Countries. Technological Forecasting & Social Change, no 154(March), 119973. Avail-able at: https://doi.org/10.1016/j.techfore.2020.119973 (accesse d: 09 April 2021).
21. Reff at, R.M. (2006). Developing a Successful E-Government. In Proceedings of the Sympo-sium on eGovernment Opportunities and Challenge, IEEE, pp. 1–13.
22. Scholl, H.J. (2002). E-government: A Special Case of ICT-Enabled Business Process Change. Th e 36th Hawaii International Conference on System Sciences, pp. 1–12.
23. Sipior, J. & Ward, B. (2009). Bridging the Digital Divide for e-Government Inclusion: A United States Case Study. Asymptotic and Computational Methods in Spatial Statistics, vol. 167, no 3, pp. 137–146.
24. Stephen, H., Norris, D.F. & Fletcher, P.D. (2003). Electronic Government at the Local Level. Public Performance & Management Review, vol. 26, no 4, pp. 325–344. Available at: https://doi.org/10.1177/1530957603252580 (accessed: 09 April 2021).
25. Th ompson, D.V., Rust, R.T. & Rhoda, J. (2005). Th e Business Value of e-Government for Small Firms. International Journal of Service Industry Management, vol. 16, no 4, pp. 385–407. Available at: https://doi.org/10.1108/09564230510614022 (accesse d: 09 April 2021).
26. United Nations. (2018). 2018 E-Government Survey. Available at: https://publicadministra-tion.un.org/Portals/1/Images/E-Government Survey 2018_FINAL for web.pdf (accessed: 09 April 2021).
27. Warkentin, M., Gefen, D., Pavlou, P.A. & Rose, G.M. (2002). Encouraging Citizen Adoption of e-Government by Building Trust. Electronic Markets, vol. 12, no 3, pp. 157–162. Available at: https://doi.org/10.1080/101967802320245929 (accessed: 09 April 2021).
28. Yildiz, M. (2007). E-Government Research: Reviewing the Literature, Limitations, and Ways Forward. Government Information Quarterly, vol. 24, no 3, pp. 646–665. Available at: https://doi.org/https://doi.org/10.1016/j.giq.2007.01.002 (accessed: 09 April 2021).