an empirical comparison of machine learning …ceur-ws.org/vol-2546/paper03.pdfexpectation...
TRANSCRIPT

58
___________________ Copyright © 2019 for this paper by its authors. Use permitted under Creative Commons License Attribution 4.0 International (CC BY 4.0).
An empirical comparison of machine learning clustering methods in the study of Internet addiction among
students majoring in Computer Sciences
Oksana Klochko[0000-0002-6505-9455]
Vinnytsia Mykhailo Kotsiubynskyi State Pedagogical University, 32, Ostrozhskogo Str., Vinnytsia, 21100, Ukraine
Vasyl Fedorets[0000-0001-9936-3458]
Institute of Higher Education of the NAES of Ukraine, 9, Bastionna Str., Kyiv, 01014, Ukraine
Abstract. One of the relevant current vectors of study in machine learning is the analysis of the application peculiarities for methods of solving a specific problem. We will study this issue on the example of methods of solving the clustering problem. Currently, we have a considerable number of learning algorithms which can be used for clustering. However, not all methods can be used for solving a specific task. The article describes the technology of empirical comparison of methods of clustering problem solving using WEKA free software for machine learning. Empirical comparison of data clustering methods was based on the results of a survey conducted among students majoring in Computer Sciences and dedicated to detecting signs of Internet addiction (IA) as behavioural disorder that occurs due to Internet misuse. Empirical comparison of Expectation Maximization, Farthest First and K-Means clustering algorithms together with the application of the WEKA machine learning system had the following results. It described the peculiarities of application of these methods in feature clustering. The authors developed data instances’ clustering models to detect signs of Internet addiction among students majoring in Computer Sciences. The study concludes that these methods may be applicable to development of models detecting respondent groups with signs of IA related disorders.
Keywords: Empirical Comparison, Machine Learning, Clustering, Internet addiction (IA), IA detection, Internet disorders, Expectation Maximization, Farthest First, K-Means.
1 Introduction
One of research directions in machine learning is the empirical analysis of methods of solving a specific problem. Let us study this issue on the example of methods of solving

59
the clustering problem. Clustering methods are statistic methods of data analysis that enable people to group the given selection of data samples into clusters, classes, taxons depending on the value of their attributes; each of these groups has certain characteristics. The main idea is to use several clustering methods in order to carry out an empirical comparison study and determine which methods ensure the most optimal data grouping while solving a specific problem.
Machine learning classifies clustering problems as problems for unsupervised learning. Currently, there is a considerable number of machine learning algorithms that can be used for clustering, for instance, Expectation Maximization, K-Means, Hierarchical Clustering etc. But not all of them are suitable for solving a specific problem. Data clustering algorithms differ by the cluster model type, the algorithm model type, the nesting hierarchy of clusters, the way of implementation depending on the data set etc. Because of this, there are also certain requirements to the data set parameters.
Popular software products used in machine learning include TensorFlow, WEKA, MATLAB, MXNet, Torch, PyTorch, Microsoft Azure Machine Learning Studio and others.
In this article, we use the WEKA (Waikato Environment for Knowledge Analysis) free machine learning software [19]. The free WEKA machine learning system gives direct access to the library of implemented algorithms written in Java.
Analysis of contemporary studies and publications shows that the issue of analysis and selection of the machine learning method, which would be optimal for processing a concrete data set, is popular in the scientific circles. A considerable number of these studies is dedicated to the application of machine learning methods in the fields of healthcare and life safety.
In their article A Performance Comparison of Machine Learning Classification Approaches for Robust Activity of Daily Living Recognition scientists Rida Ghafoor Hussain, Mustansar Ali Ghazanfar, Muhammad Awais Azam, Usman Naeem and Shafiq Ur Rehman studied the application of the machine learning classification methods to find ways to ensure independent daily living of people who have Alzheimer’s disease [7]. The idea of the study is to analyze the data registered by different equipment in order to determine the changes in a person’s behavior that are relevant for the daily life and social interaction. The paper gives a comparison of the efficiency levels of five machine learning classification techniques used for the recognition of a person’s activity (and his/her psychological status). Experimental findings show that compared to traditional methodologies, these approaches give better results in determining the activity of the person and his/her psychological and behavioral peculiarities.
Jonas Krämer, Jonas Schreyögg and Reinhard Busse studied the speed and efficiency of medical aid provision using the databases of the Hospital ER [13]. Applying the Random forest algorithm, the authors developed the model based on the data about the patient’s provisional diagnosis. The use of the controlled machine learning method and model training based on the opinion of a specialized doctor allowed them to achieve high forecasting accuracy (96%) as well as the area under the receiver operating curve (>0.99).
60
Abdulhamit Subasi, Jasmin Kevric and M. Abdullah Canbaz developed a hybrid model of detecting epileptic fits using the Genetic Algorithm (GA) and Particle Swarm Optimization (PSO) to determine the optimal parameters of application of the Support Vector Machine (SVM) algorithm [17]. The hybrid algorithm that they suggested can demonstrate data set classification accuracy of up to 99.38%.
A considerable number of papers appeared, which are dedicated to diagnosing Internet addiction (IA) and studying the mechanisms of this disorder among various social groups. The appearance and use of the Internet has many benefits. However, at the same time, disorders related to pathological use of the Internet are becoming a social as well as a psychological problem. Currently, we face an important psychological, sociocultural and educational issue of detection and prevention of certain pathologies and steady premorbid conditions (state before the disease) caused by inadequate Internet use. Cases of IA were first mentioned in 1995 and attracted considerable attention. Issues related to this one became the research subject of many scientists, including Lyudmyla Yuryeva and Tatyana Bolbot [10], Marharyta Derhach [4] and others. Internet Addiction Disorder (IAD) is also called Pathological Internet Use (PIU). The term “Internet Addiction” was first suggested by Ivan K. Goldberg in 1995. He describes net addiction as a specific pathology characterized by a wide spectrum of behavioral and impulse control disorders (lack of control, absence of voluntary regulation) [1]. In 1996 Goldberg made the first attempt to determine groups of behavioural and psychological signs and symptoms of IA [18], namely: tolerance; abstinence syndrome; difficulties in voluntary regulation of Internet-behaviour; increase of time and financial investments in things related to Internet or computer use; a shift of a person’s interests towards Internet-related activities; extensive Internet use that leads to maladjustment. In 1998 Kimberly S. Young defined IAD as an impulsive-compulsive disorder, which has specific signs or addictions [20; 21]: cyber-sexual addiction, cyber-relationship addiction, net compulsions, information overload and computer addiction. IAD is not officially included into ICD-11 for Mortality and Morbidity Statistics (Version: 04/2019), however, in section 6C51 Gaming disorder the “Gaming disorder” is described as a “pattern of persistent or recurrent gaming behaviour (‘digital gaming’ or ‘video-gaming’), which may be online (i.e., over the Internet)” [8].
Even though the problem of IA is becoming more and more relevant, there are not enough scientific papers dedicated to the study of this issue with the help of machine learning methods. Let us look at some of them. On the basis of the Support Vector Machine algorithm, including the C-SVM and ν-SVM, and applying the Student’s t-test to the data set of the survey conducted among 2,397 Chinese students, scientists Zonglin Di, Xiaoliang Gong, Jingyu Shi, Hosameldin O. A. Ahmed and Asoke K. Nandic proved the utility of using machine learning methods for detecting and forecasting the risk of IA [5]. Wen-Huai Hsieh, Dong-Her Shih, Po-Yuan Shih and Shih-Bin Lin suggested using the EMBAR protected system of web-services based on the ensemble classification methods and case-based reasoning to study the IA of the users and prevent the development of this disorder at the initial stages [6]. Hong-Ming Ji, Liang-Yu Chen and Tzu-Chien Hsiao are currently continuing their research, which aims to create an IA detector that would work in a real-time mode [9]. The authors
61
suggest studying this issue using an adapted system of continuous real-coded variables (XCSR), which determines the level of Internet addiction (high-risk and low-risk) on the basis of the information about the Internet users using the Chen Internet addiction scale (CIAS) or respiratory instantaneous frequency (IF) [9].
Thus, based on the above presented statement of the problem as well as taking into consideration the insufficient amount of research on the application of machine learning methods to IA diagnosing, we determine the aim of our research, which is to conduct an empirical comparison of clustering methods within the WEKA machine learning system in the course of studying the IA disorder among students majoring in Computer Sciences.
2 Selection of methods and diagnostics
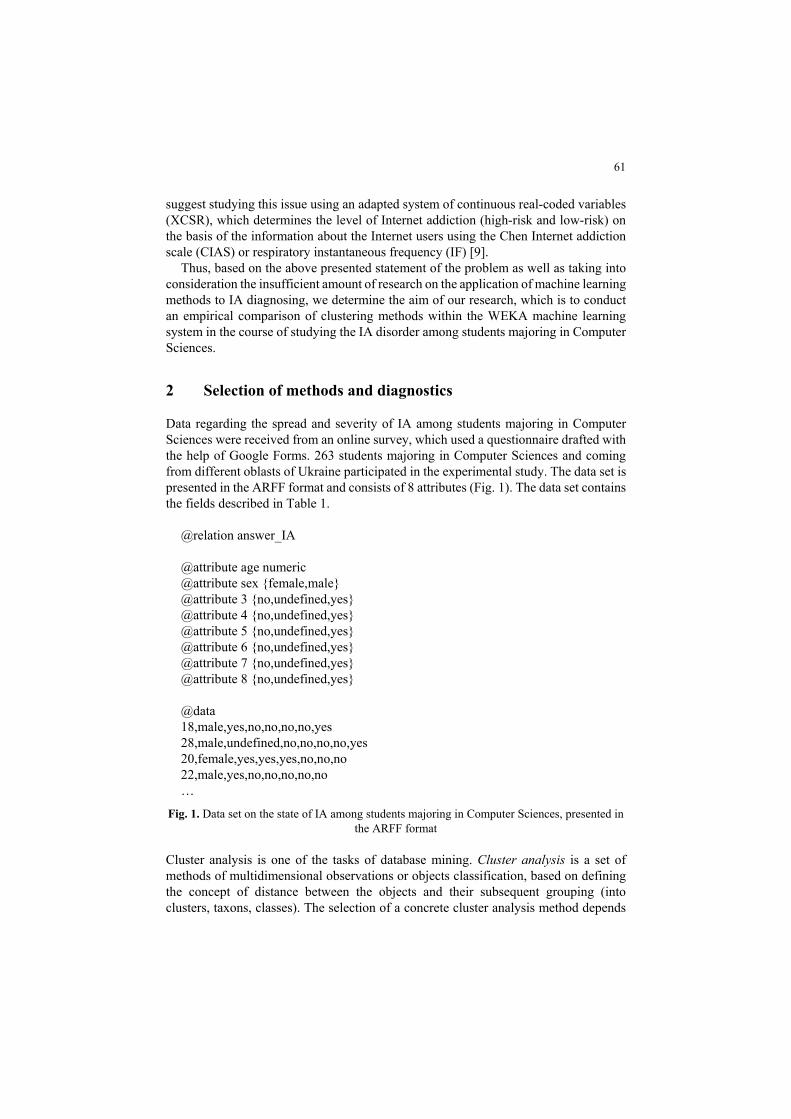
Data regarding the spread and severity of IA among students majoring in Computer Sciences were received from an online survey, which used a questionnaire drafted with the help of Google Forms. 263 students majoring in Computer Sciences and coming from different oblasts of Ukraine participated in the experimental study. The data set is presented in the ARFF format and consists of 8 attributes (Fig. 1). The data set contains the fields described in Table 1.
@relation answer_IA @attribute age numeric @attribute sex {female,male} @attribute 3 {no,undefined,yes} @attribute 4 {no,undefined,yes} @attribute 5 {no,undefined,yes} @attribute 6 {no,undefined,yes} @attribute 7 {no,undefined,yes} @attribute 8 {no,undefined,yes} @data 18,male,yes,no,no,no,no,yes 28,male,undefined,no,no,no,no,yes 20,female,yes,yes,yes,no,no,no 22,male,yes,no,no,no,no,no …
Fig. 1. Data set on the state of IA among students majoring in Computer Sciences, presented in the ARFF format
Cluster analysis is one of the tasks of database mining. Cluster analysis is a set of methods of multidimensional observations or objects classification, based on defining the concept of distance between the objects and their subsequent grouping (into clusters, taxons, classes). The selection of a concrete cluster analysis method depends

62
on the purpose of classification [12]. At the same time, one does not need a priori information about the population distribution. This approach is based on the following presuppositions: objects that have a certain number of similar (different) features group in one segment (cluster). The level of similarity (difference) between the objects that belong to one segment (cluster) must be higher than the level of their similarity with the objects that belong to other segments [12].
Table 1. Data structure on the state of IA among students majoring in Computer Sciences.
Attributes Сontents/Questions Type Statistics age Age of the student Numeric Minimum 16
Maximum 59 Mean 19.756 StdDev 6.806
sex Student’s sex Nominal Female 199 Male 63
3 Can’t imagine my life without the Internet
Nominal yes 184 undefined 39 no 39
4 When I cannot use the Internet I fell anxiety, irritation
Nominal yes 81 undefined 134 no 47
5 I like “surfing” the Net without a clearly defined purpose
Nominal yes 121 undefined 112 no 29
6 I can abstain from food, sleep, going to classes, if a have a chance to use the Internet for free
Nominal yes 248 undefined 7 no 7
7 I prefer meeting new people over the Internet rather than in real life
Nominal yes 185 undefined 37 no 40
8 I often feel that I’ve spent not enough time playing computer games over the Internet, I constantly wish to play longer
Nominal yes 178 undefined 61 no 23
Let us look at one of cluster analysis algorithms [12]. Output matrix:
X =x ⋯ x⋮ ⋱ ⋮
x ⋯ x.
Let us move to the matrix of standardized Z values with elements:
z = ;
where j = 1, 2, …, n – index number, і = 1, 2, ... , m – observation number;

63
x = ∑ x ;
s = ∑ (x − x ) = x − (x ) .
There are several ways to define the distance between two observations zi and zv:
1. weighted Euclidean distance, which is determined by the formula
ρ (z , z ) = ∑ w (z − z ) ;
where wl is the “weight” of index; 0<wl≤1; if wl=1 for all l = 1, 2, …, n, then we get the usual Euclidean distance
ρ (z , z ) = ∑ (z − z ) ;
2. Hamming distance:
ρBH(zi,zv) = ∑ |zi -zv |;
in most cases this way of distance measuring gives the same result as the usual Euclidean distance, but in this case the influence of non-systemic large differences (runouts) decreases;
3. Chebyshev distance:
ρBCH(zi,zv) = max|zi -zv |;
it is best to apply this distance in order to determine the differences existing between the two objects using only one dimension;
4. Mahalanobis distance:
ρBМ(zi,zv) = (푧 − 푧 ) 푆 (푧 − 푧 ),
where S is covariance matrix; this distance measurement gives good results when applied to a concrete data group, but it does not work very well, if the covariance matrix is calculated for the whole data set;
5. Distance between peaks:
ρBL(zi,zv) = ∑ |zi -zv |zi +zv
;
presupposes independence of random variables, which indicates the distance in the orthogonal space.
It is best to choose from the above described distance measures after the consideration of the structure and characteristics of the data sample.
Let us present the received measurements in the form of distance matrix:

64
R =
⎝
⎜⎛
0 ρ ρ … ρρ 0 ρ … ρ…ρ…ρ
…ρ…ρ
…ρ…ρ
…………
…ρ…0 ⎠
⎟⎞
.
As the R matrix is symmetric, i.e. ρiv=ρvi, we may confine ourselves to off-diagonal matrix elements.
Using the distance matrix, we can implement the agglomerative hierarchic procedure of cluster analysis. Distances between clusters are determined as the closest or the farthest ones. In the first case, the distance between the clusters is the one between the closest elements of these clusters, in the second case, it is the one between the two farthermost located. The principle of the work of agglomerative hierarchic procedures lies in a consequent grouping of elements, starting from the ones closest to each other and those that are farther and farther apart. During the first step of the algorithm, every observation zі (i = 1, 2, ..., m) is viewed as a separate cluster. Then, during every next step of the work of the algorithm, two closest located clusters are grouped together and then once again the distance matrix is built, but its dimension decreases by one. The algorithm stops its work when all the observations are grouped into clusters.
Let us look at the algorithms we used while clustering the data set regarding the state of IA disorder among students majoring in Computer Sciences:
1. EM (Expectation Maximization)
Determines the probability distribution for every object, which indicated its belongingness to each cluster. EM methods [11]: Maximum Likelihood Estimation (MLE) or Maximum a Posteriori (MAP). Description of the algorithm is shown in Fig. 2 [11]: at the E-stage (expectation) we calculate the estimated likelihood; at the M-stage (Maximization) we calculate the maximum likelihood estimation, increasing the expected likelihood, calculated at the E-stage; its value is used for the E-stage at the next iteration. The algorithm is repeated until its convergence.
Fig. 2. Description of how the algorithm ЕМ works from 10,000 feet [11].
2. K-Means algorithm
65
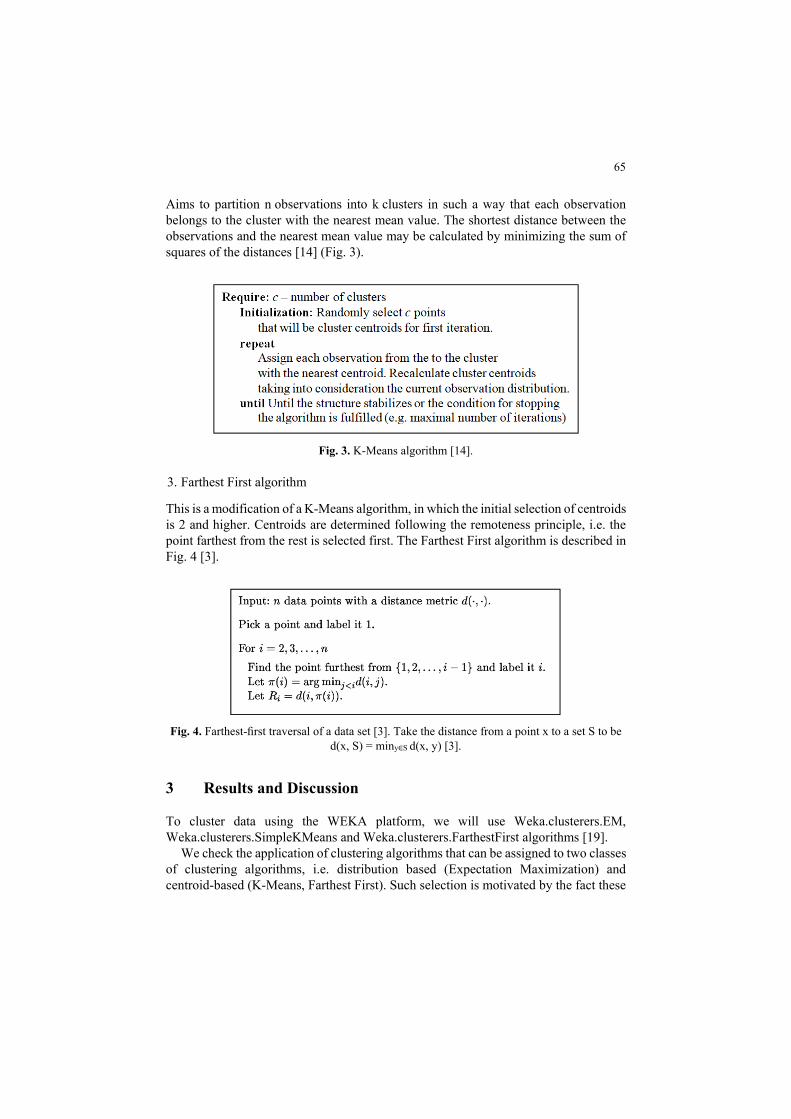
Aims to partition n observations into k clusters in such a way that each observation belongs to the cluster with the nearest mean value. The shortest distance between the observations and the nearest mean value may be calculated by minimizing the sum of squares of the distances [14] (Fig. 3).
Fig. 3. K-Means algorithm [14].
3. Farthest First algorithm
This is a modification of a K-Means algorithm, in which the initial selection of centroids is 2 and higher. Centroids are determined following the remoteness principle, i.e. the point farthest from the rest is selected first. The Farthest First algorithm is described in Fig. 4 [3].
Fig. 4. Farthest-first traversal of a data set [3]. Take the distance from a point x to a set S to be
d(x, S) = miny∈S d(x, y) [3].
3 Results and Discussion
To cluster data using the WEKA platform, we will use Weka.clusterers.EM, Weka.clusterers.SimpleKMeans and Weka.clusterers.FarthestFirst algorithms [19].
We check the application of clustering algorithms that can be assigned to two classes of clustering algorithms, i.e. distribution based (Expectation Maximization) and centroid-based (K-Means, Farthest First). Such selection is motivated by the fact these

66
algorithms have long been used to cluster different types of data in many fields and are considered to be effective.
Dunn, DB, SD, СDbw and S_Dbw were selected as validity indices for testing [2; 15; 16] (Table 2). In the CDbw index the distance from the point to multitude set in the course of selecting cluster element can be calculated in different ways. In this study, we use the sum of distances of already existing “representatives” of the cluster to each cluster element to calculate this distance. The element, on which the maximum was reached, was selected as the next “representative” of the cluster.
Table 2. Optimal number of clusters, calculated with the help of quality indices.
Index Algorithms
Expectation Maximization k-Means Farthest First Dunn 3 6 6 DB 3 6 4 SD 3 3 3 СDbw 3 3 3 S_Dbw 3 5 4
If the data set has no cluster structure, then such situation is not determined with the
help of validity metrics. While using K-Means and Farthest First (Table 2) the numbers of clusters for the two algorithms that were selected as optimal by the majority of indices, can only nominally be defined as cluster structure. As the work of Expectation Maximization algorithm is based on determining the probability of evaluating maximum similarity, the indices calculated for this algorithm are more homogenous. The structure, which is characterized by a small number of clusters that also have to be compact and separable, is determined to be the best one. Judging by the results of evaluation of clustering using the validity indices, we may consider that k-Means and Farthest First algorithms are most likely to give worse clustering results than the Expectation Maximization algorithms.
To cluster the data, we select training/testing using the percentage split option. As a data set for training (model building) we select 66% of data from the set. As a data set for testing we select 34% of data from the set. In addition, we select number of clusters “3” in algorithm settings.
We received the following results:
1. In the course of application of the EM clustering algorithm, according to the built clustering model based on the training data set, three clusters were determined, their characteristics are given in Table 3.
Cluster 0 (63% of respondents): The average age of respondents in this cluster is 17. The group consists predominantly of women. The characteristic feature of the representatives of this group is that they are unable to imagine their life without the Internet. There are variations in the levels of anxiety and irritation, if there is no possibility to use the Internet. There are also varying opinions regarding the aimless use of the Internet. As for other attributes, disorders related to IA may be observed in
67
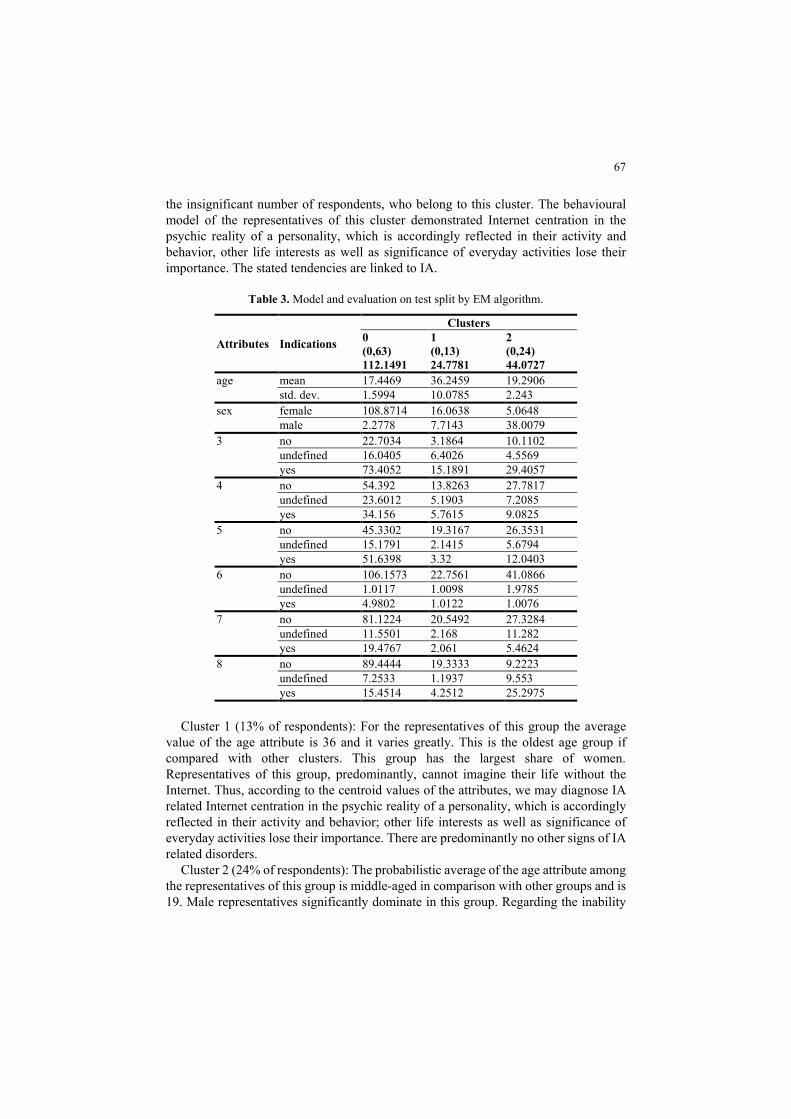
the insignificant number of respondents, who belong to this cluster. The behavioural model of the representatives of this cluster demonstrated Internet centration in the psychic reality of a personality, which is accordingly reflected in their activity and behavior, other life interests as well as significance of everyday activities lose their importance. The stated tendencies are linked to IA.
Table 3. Model and evaluation on test split by EM algorithm.
Attributes Indications
Clusters 0 (0,63) 112.1491
1 (0,13) 24.7781
2 (0,24) 44.0727
age mean 17.4469 36.2459 19.2906 std. dev. 1.5994 10.0785 2.243
sex
female 108.8714 16.0638 5.0648 male 2.2778 7.7143 38.0079
3 no 22.7034 3.1864 10.1102 undefined 16.0405 6.4026 4.5569 yes 73.4052 15.1891 29.4057
4 no 54.392 13.8263 27.7817 undefined 23.6012 5.1903 7.2085 yes 34.156 5.7615 9.0825
5 no 45.3302 19.3167 26.3531 undefined 15.1791 2.1415 5.6794 yes 51.6398 3.32 12.0403
6 no 106.1573 22.7561 41.0866 undefined 1.0117 1.0098 1.9785 yes 4.9802 1.0122 1.0076
7 no 81.1224 20.5492 27.3284 undefined 11.5501 2.168 11.282 yes 19.4767 2.061 5.4624
8 no 89.4444 19.3333 9.2223 undefined 7.2533 1.1937 9.553 yes 15.4514 4.2512 25.2975
Cluster 1 (13% of respondents): For the representatives of this group the average
value of the age attribute is 36 and it varies greatly. This is the oldest age group if compared with other clusters. This group has the largest share of women. Representatives of this group, predominantly, cannot imagine their life without the Internet. Thus, according to the centroid values of the attributes, we may diagnose IA related Internet centration in the psychic reality of a personality, which is accordingly reflected in their activity and behavior; other life interests as well as significance of everyday activities lose their importance. There are predominantly no other signs of IA related disorders.
Cluster 2 (24% of respondents): The probabilistic average of the age attribute among the representatives of this group is middle-aged in comparison with other groups and is 19. Male representatives significantly dominate in this group. Regarding the inability
68
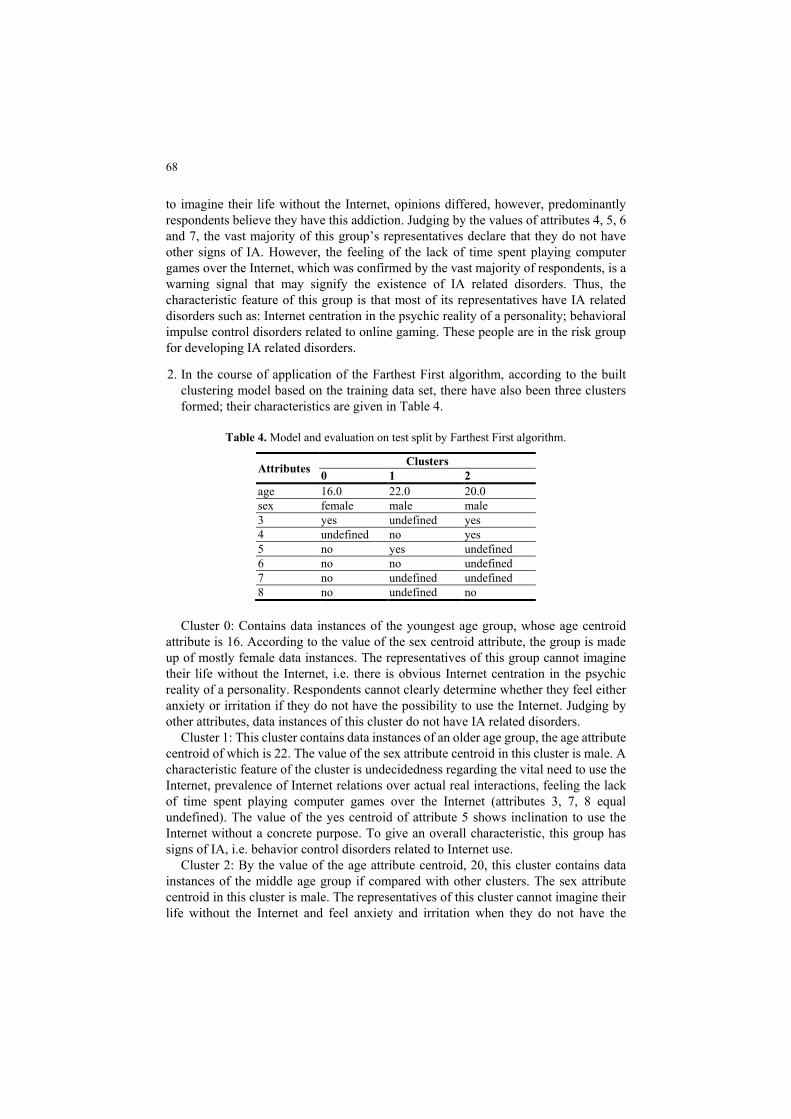
to imagine their life without the Internet, opinions differed, however, predominantly respondents believe they have this addiction. Judging by the values of attributes 4, 5, 6 and 7, the vast majority of this group’s representatives declare that they do not have other signs of IA. However, the feeling of the lack of time spent playing computer games over the Internet, which was confirmed by the vast majority of respondents, is a warning signal that may signify the existence of IA related disorders. Thus, the characteristic feature of this group is that most of its representatives have IA related disorders such as: Internet centration in the psychic reality of a personality; behavioral impulse control disorders related to online gaming. These people are in the risk group for developing IA related disorders.
2. In the course of application of the Farthest First algorithm, according to the built clustering model based on the training data set, there have also been three clusters formed; their characteristics are given in Table 4.
Table 4. Model and evaluation on test split by Farthest First algorithm.
Attributes Clusters 0 1 2
age 16.0 22.0 20.0 sex female male male 3 yes undefined yes 4 undefined no yes 5 no yes undefined 6 no no undefined 7 no undefined undefined 8 no undefined no
Cluster 0: Contains data instances of the youngest age group, whose age centroid
attribute is 16. According to the value of the sex centroid attribute, the group is made up of mostly female data instances. The representatives of this group cannot imagine their life without the Internet, i.e. there is obvious Internet centration in the psychic reality of a personality. Respondents cannot clearly determine whether they feel either anxiety or irritation if they do not have the possibility to use the Internet. Judging by other attributes, data instances of this cluster do not have IA related disorders.
Cluster 1: This cluster contains data instances of an older age group, the age attribute centroid of which is 22. The value of the sex attribute centroid in this cluster is male. A characteristic feature of the cluster is undecidedness regarding the vital need to use the Internet, prevalence of Internet relations over actual real interactions, feeling the lack of time spent playing computer games over the Internet (attributes 3, 7, 8 equal undefined). The value of the yes centroid of attribute 5 shows inclination to use the Internet without a concrete purpose. To give an overall characteristic, this group has signs of IA, i.e. behavior control disorders related to Internet use.
Cluster 2: By the value of the age attribute centroid, 20, this cluster contains data instances of the middle age group if compared with other clusters. The sex attribute centroid in this cluster is male. The representatives of this cluster cannot imagine their life without the Internet and feel anxiety and irritation when they do not have the

69
possibility to use the Internet. They are characterized by their undecidedness regarding the vital need to use the Internet; giving up other life interests and everyday activities for the sake of free Internet use; prevalence of online relations of real-life interactions (value of attributes 5, 6, 7 is undefined). Thus, the representatives of this cluster have signs of IA, the priority significance of the Internet and behavior control disorders, related to Internet use. Compared to other groups, they are in the risk group for developing IA related disorders.
3. In the course of application of the K-Means algorithm to the clustering model built on the basis of the training data set three clusters have also been formed, their characteristics are presented in Table 5.
Table 5. Model and evaluation on test split by K-Means algorithm.
Attribute Cluster 0 1 2
age 18.4194 21.8605 20.9552 sex female male female 3 undefined yes yes 4 no no no 5 no no no 6 no no no 7 no no no 8 no yes no
Cluster 0: Contains data instances of the youngest age group, whose age attribute
centroid is about 18. According to the sex attribute centroid, mostly female data instances are present in the groups. The representatives of this group cannot clearly determine whether they have a vital need to use the Internet. As for other indices, respondents state absence of signs of IA related disorders.
Cluster 1: This cluster contains data instances of the older age group, whose age attribute centroid is about 22. The value of the sex attribute centroid in this cluster is male. Characteristic features of data instances that belong to this cluster include the vital need to use the Internet, feeling the lack of time spent playing online computer games as well as the systemic need to play longer. The overall characteristic of this cluster is the presence of signs of IA, i.e. behavior control issues related to Internet use, namely, gaming Internet addiction. If compared with other cluster, they belong to the risk group that may develop IA related disorders.
Cluster 2: By the value of age attribute centroid, which is about 21 years, compared to other clusters, this cluster contains data instances of medium age group. The sex attribute centroid is female. The representatives of this cluster cannot imagine their life without the Internet. Judging by centroids of other characteristics, respondents of this cluster do not have Internet-related disorders. Thus, the representatives of this cluster have only IA signs associated with the utmost significance of the Internet.
The cluster distribution of test data in the course of application of the three algorithms – the Expectation Maximization, Farthest First and K-Means – using the built training models is presented in Table 6. Thus, as it can be seen from the table, the

70
algorithms have determined three data groups. Clusters were formed, which included 71:12:7, 67:4:19 and 33:15:42 data instances respectively. There is a cluster that has the largest number of data instances; a group, which has the least data instances (exceptions); a group that includes several times more data instances than the smallest group.
Table 6. Clustered Instances determined using Expectation Maximization, K-Means and Farthest First algorithms.
Clusters Expectation Maximization Farthest First algorithm K-Means Instances % Instances % Instances %
0 67 74 71 79 33 37 1 4 4 12 13 15 17 2 19 21 7 8 42 47
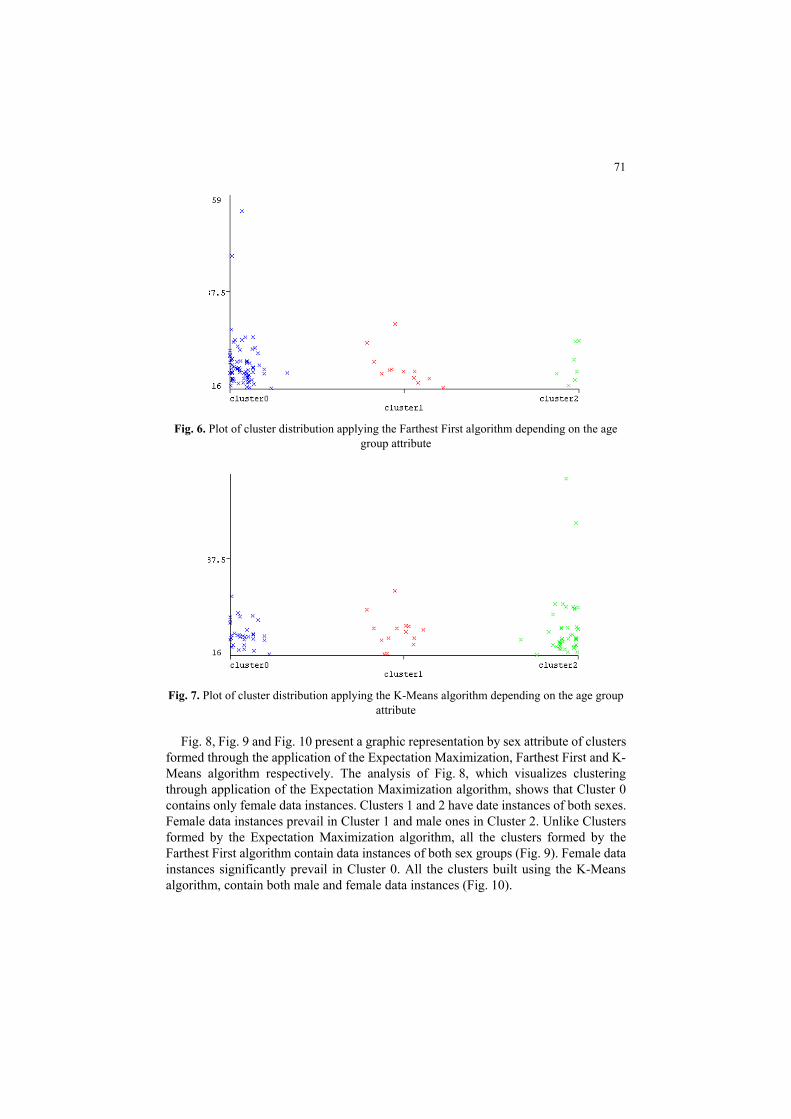
Fig. 5, Fig. 6 and Fig. 7 present a graphic representation of clusters by age
characteristic of data instances, which are built using the training data set and received in the course of implementation of the Expectation Maximization, the Farthest First and the K-Means algorithm respectively. As we can see, the formed clusters differ from each other by the age attribute. For instance, Cluster 0, which contains most data instances, contains instances of respondents of a younger age, if formed through the application of the Expectation Maximization algorithm (Fig. 5). On the other hand, the same cluster received through the implementation of the Farthest First algorithm, contains data instance of various age groups (Fig. 6). Also, a small number of data instances of various age groups is present in Cluster 2, received in the course of implementation of the K-Means algorithm (Fig. 7). Cluster 0 and Cluster 2 formed with the Expectation Maximization algorithm as well as Cluster 1 and Cluster 2 formed with the Farthest First algorithm contain homogeneous age groups, and Cluster 0 та Cluster 1, formed with K-Means algorithm.
Fig. 5. Plot of cluster distribution applying the Expectation Maximization algorithm depending
on the age group attribute
71
Fig. 6. Plot of cluster distribution applying the Farthest First algorithm depending on the age
group attribute
Fig. 7. Plot of cluster distribution applying the K-Means algorithm depending on the age group
attribute
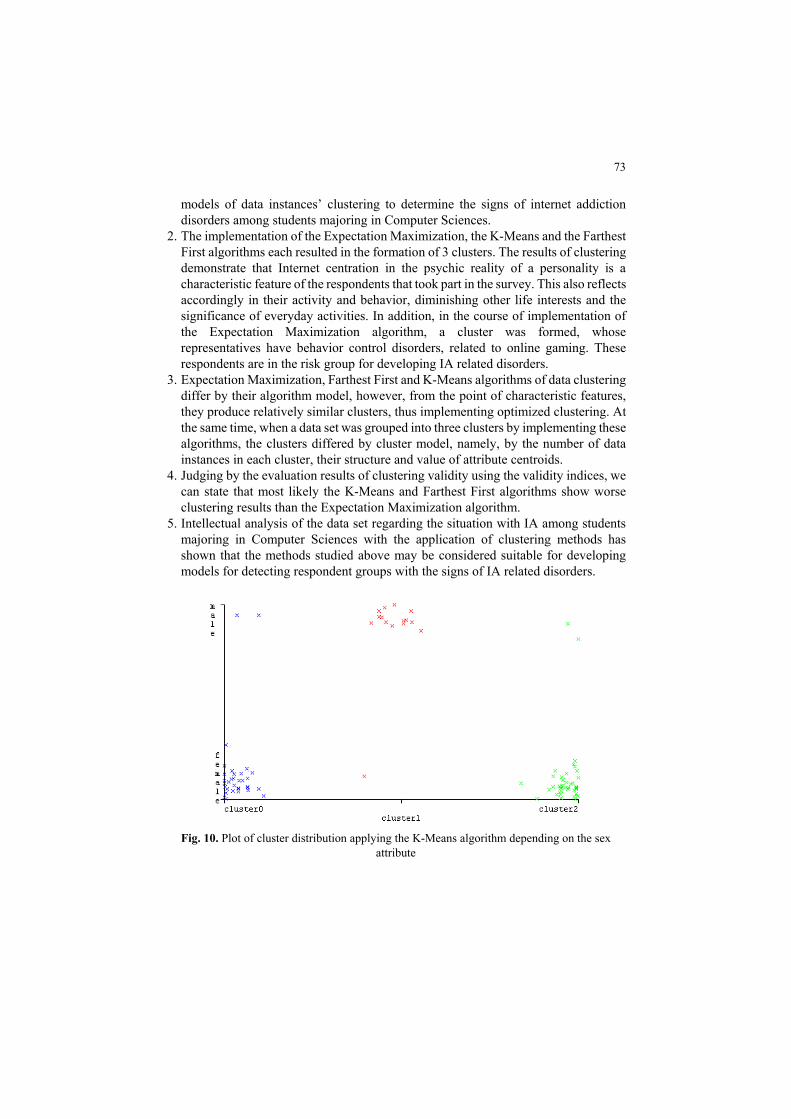
Fig. 8, Fig. 9 and Fig. 10 present a graphic representation by sex attribute of clusters formed through the application of the Expectation Maximization, Farthest First and K-Means algorithm respectively. The analysis of Fig. 8, which visualizes clustering through application of the Expectation Maximization algorithm, shows that Cluster 0 contains only female data instances. Clusters 1 and 2 have date instances of both sexes. Female data instances prevail in Cluster 1 and male ones in Cluster 2. Unlike Clusters formed by the Expectation Maximization algorithm, all the clusters formed by the Farthest First algorithm contain data instances of both sex groups (Fig. 9). Female data instances significantly prevail in Cluster 0. All the clusters built using the K-Means algorithm, contain both male and female data instances (Fig. 10).

72
Fig. 8. Plot of cluster distribution applying the Expectation Maximization algorithm depending
on the sex attribute
Fig. 9. Plot of cluster distribution applying the Farthest First algorithm depending on the sex
attribute
4 Conclusion
In the course of empirical comparison of Expectation Maximization, Farthest First and K-Means algorithms using the WEKA machine learning system to study the signs of IA related disorders among the students majoring in Computer Sciences, the following conclusions have been made:
1. As a result of empirical comparison of Expectation Maximization, Farthest First and K-Means algorithms using the WEKA machine learning system, we developed
73
models of data instances’ clustering to determine the signs of internet addiction disorders among students majoring in Computer Sciences.
2. The implementation of the Expectation Maximization, the K-Means and the Farthest First algorithms each resulted in the formation of 3 clusters. The results of clustering demonstrate that Internet centration in the psychic reality of a personality is a characteristic feature of the respondents that took part in the survey. This also reflects accordingly in their activity and behavior, diminishing other life interests and the significance of everyday activities. In addition, in the course of implementation of the Expectation Maximization algorithm, a cluster was formed, whose representatives have behavior control disorders, related to online gaming. These respondents are in the risk group for developing IA related disorders.
3. Expectation Maximization, Farthest First and K-Means algorithms of data clustering differ by their algorithm model, however, from the point of characteristic features, they produce relatively similar clusters, thus implementing optimized clustering. At the same time, when a data set was grouped into three clusters by implementing these algorithms, the clusters differed by cluster model, namely, by the number of data instances in each cluster, their structure and value of attribute centroids.
4. Judging by the evaluation results of clustering validity using the validity indices, we can state that most likely the K-Means and Farthest First algorithms show worse clustering results than the Expectation Maximization algorithm.
5. Intellectual analysis of the data set regarding the situation with IA among students majoring in Computer Sciences with the application of clustering methods has shown that the methods studied above may be considered suitable for developing models for detecting respondent groups with the signs of IA related disorders.
Fig. 10. Plot of cluster distribution applying the K-Means algorithm depending on the sex
attribute
74
Our conclusions may help to determine the signs of IA related disorders among students majoring in Computer Sciences, forecasting the risk of IA and development of services aimed at IA prevention.
References
1. Abbott, D.A., Cramer, S.L., Sherrets, S.D.: Pathological Gambling and the Family: Practice Implications. Families in Society: the Journal of Contemporary Social Services 76(4), 213‒219 (1995). doi:10.1177/104438949507600402
2. da Silva, L.E.B., Melton, N.M., Wunsch II, D.C.: Incremental Cluster Validity Indices for Hard Partitions: Extensions and Comparative Study. arXiv:1902.06711 [cs.LG]. https://arxiv.org/pdf/1902.06711.pdf (2019). Accessed 25 Oct 2019
3. Dasgupta, S., Long, P.M.: Performance guarantees for hierarchical clustering. Journal of Computer and System Sciences 70(4), 555‒569 (2005). doi:10.1016/j.jcss.2004.10.006
4. Derhach, M.: Cyber-Addiction of Students Majoring in Computer Science. Science and Education 7, 92‒98 (2016). doi:10.24195/2414-4665-2016-7-16
5. Di, Z., Gong, X., Shi, J., Ahmed, H.O.A., Nandi, A.K.: Internet addiction disorder detection of Chinese college students using several personality questionnaire data and support vectormachine. Addictive Behaviors Reports 10, 100200 (2019). doi:10.1016/j.abrep.2019.100200
6. Hsieh, W.-H., Shih, D.-H., Shih, P.-Y., Lin, S.-B.: An Ensemble Classifier with Case-Based Reasoning System for Identifying Internet Addiction. International Journal of Environmental Research and Public Health 16(7), 1233 (2019). doi:10.3390/ijerph16071233
7. Hussain, R.G., Ghazanfar, M.A., Azam, M.A., Naeem, U., Rehman, S.U.: A performance comparison of machine learning classification approaches for robust activity of daily living recognition. Artificial Intelligence Review 52(1), 357‒379 (2019). doi:10.1007/s10462-018-9623-5
8. ICD-11 for Mortality and Morbidity Statistics (Version: 04/2019): 6C51 Gaming disorder.https://icd.who.int/browse11/l-m/en#/http://id.who.int/icd/entity/1448597234 (2019). Accessed 29 Aug 2019
9. Ji, H.-M., Chen, L.-Y., Hsiao, T.-C.: Real-time detection of internet addiction using reinforcement learning system. GECCO’19: Proceedings of the Genetic and Evolutionary Computation Conference Companion, рр. 1280‒1288. ACM (2019). doi:10.1145/3319619.3326882
10. Jur'eva L.N., Bol'bot T.Ju.: Komp'juternaja zavisimost': formirovanie, diagnostika, korrekcija i profilaktika (Computer addiction: formation, diagnosis, correction and prevention). Porogi, Dnepropetrovsk (2006)
11. Keng, B.: The Expectation-Maximization Algorithm. http://bjlkeng.github.io/posts/the-expectation-maximization-algorithm (2016). Accessed 25 Aug 2019
12. Klochko, O.V.: Matematychne modeliuvannia system i protsesiv v osviti/pedahohitsi (Mathematical modeling of systems and processes in education/pedagogy). Vinnytsia(2019)
13. Krämer, J., Schreyögg, J., Busse, R.: Classification of hospital admissions into emergency and elective care: a machine learning approach. Health care management science 22(1), 85‒105 (2019). doi:10.1007/s10729-017-9423-5
14. Linoff, G.S., Berry, M.J.A.: Data Mining Techniques: For Marketing, Sales, and Customer Relationship Management, 3rd edn. John Wiley & Sons, New York (2011)

75
15. Moshtaghi, M., Bezdek, J.C., Erfani, S.M., Leckie, C., Bailey, J.: Online Cluster Validity Indices for Streaming Data. arXiv:1801.02937 [stat.ML]. https://arxiv.org/pdf/1801.02937.pdf (2018). Accessed 25 Oct 2019
16. Moshtaghi, M., Bezdek, J.C., Erfani, S.M., Leckie, C., Bailey, J.: Online cluster validity indices for performance monitoring of streaming data clustering. International Journal of Intelligent Systems 34(4), 541‒563 (2019). doi:10.1002/int.22064
17. Subasi, A., Kevric, J., Canbaz, M.A.: Epileptic seizure detection using hybrid machine learning methods. Neural Computing and Applications 31(1), 317‒325 (2019). doi:10.1007/s00521-017-3003-y
18. Wallis, D.: Just Click No: Talk Story about Dr. Ivan K. Goldberg and the Internet Addiction Disorder. New Yorker Magazine. http://www.newyorker.com/magazine/1997/01/13/just-click-no (1997). Accessed 25 Oct 2019
19. Weka 3 - Data Mining with Open Source Machine Learning Software in Java. https://www.cs.waikato.ac.nz/~ml/weka (2019). Accessed 17 Aug 2019
20. Young, K.S.: Caught in the Net: How to Recognize the Signs of Internet Addiction ‒ and a Winning Strategy for Recovery. John Wiley & Sons, New York (1998)
21. Young, K.S.: Internet addiction: The emergence of a new clinical disorder.CyberPsychology & Behavior 1(3), 237‒244 (1998). doi:10.1089/cpb.1998.1.237