an emerging asset class: the case for emerging … › documents › 2013_em...peru bbb bbb+ index...
TRANSCRIPT
ARI POLYCHRONOPOULOS, JAY BINSTOCK
WHITE PAPER | July 2013
An Emerging Asset Class: The Case for Emerging Markets Local Currency Debt

WHITE PAPER | July 2013 1
About the Authors
ARI POLYCHRONOPOULOS, CfAVice President, Affiliate Relations
Ari Polychronopoulos is a relationship manager/product specialist. In this role, Ari leads the Affiliate Service Team providing partner service and support and coordinating marketing and research efforts related to Fundamental Index strategies.
Previously, Ari worked as a senior analyst for IndyMac Bank responsible for portfolio hedging and risk management. He also has served as a corporate retirement plan consultant for Precept, an employee benefits firm.
Ari earned a MS in financial engineering from Claremont Graduate University and a BS in mathemat-ical economics from Pitzer College. Ari is a member of CFA Institute and the CFA Society of Orange County.
JAY BINSTOCK, CfA, fRMResearcher
Jay Binstock supports the Fixed Income Research Team, providing research and analytics related to fixed income asset classes, as well as the RAFI Bonds strategies. Jay also supports the implementa-tion of the firm’s global tactical asset allocation strategy.
Jay graduated Cum Laude with a BA in Business Administration with a concentration in Finance from the USC Marshall School of Business. Jay is a member of the CFA Institute and the CFA Society of Orange County. He also is a Certified Financial Risk Manager.

WHITE PAPER | July 20132
Twenty years ago, few investors would have considered emerging market sovereign debt as a viable investment option. Political instability, social unrest, and economic turmoil were status quo for many emerging market countries. With upgraded infrastructure, stronger property rights laws, and in-creased political and economic stability, emerging market countries have grown tremendously over the last two decades. They currently account for 2 of the top 5, 4 of the top 10, and 8 of the top 20 countries by GDP.1
As emerging market economies have evolved, so have their credit markets. During a time of distress and negative real yields for many developed economies, this evolution has prompted investors to consider emerging market debt as an investment option that is not only viable but attractive. How-ever, the first question facing an investor in emerging market sovereign debt is whether to invest in U.S. dollar denominated debt or local currency denominated debt. In this paper, we explore the differ-ences between the two and describe the benefits that come with local currency emerging market sovereign debt. We will refer to emerging market sovereign local currency debt as “local currency debt” and emerging market sovereign U.S. dollar denominated debt as “USD debt”.
LOCAL CURRENCY DEBT VS. USD DEBT ISSUANCE
International borrowers generally prefer to issue debt in their local currency rather than in U.S. dol-lars. Having a liability denominated in another currency can be disastrous if the issuer’s domestic economy suffers from inflation or undergoes currency devaluation, as Argentina did in the economic crisis of 1999–2002. Historically, issuing debt in U.S. dollars was the only option available to emerg-ing market countries, because few investors were willing to bear the risks associated with investing in local currency debt. Now that their economies have become more stable, emerging market currency risk—which can, of course, be hedged—is somewhat less concerning. Indeed, given central banks’ efforts to significantly increase money supply in developed economies during the current economic cycle, the monetary discipline of central bankers in emerging markets challenge our previously held views regarding the relative risk of emerging market currency vs. developed markets.
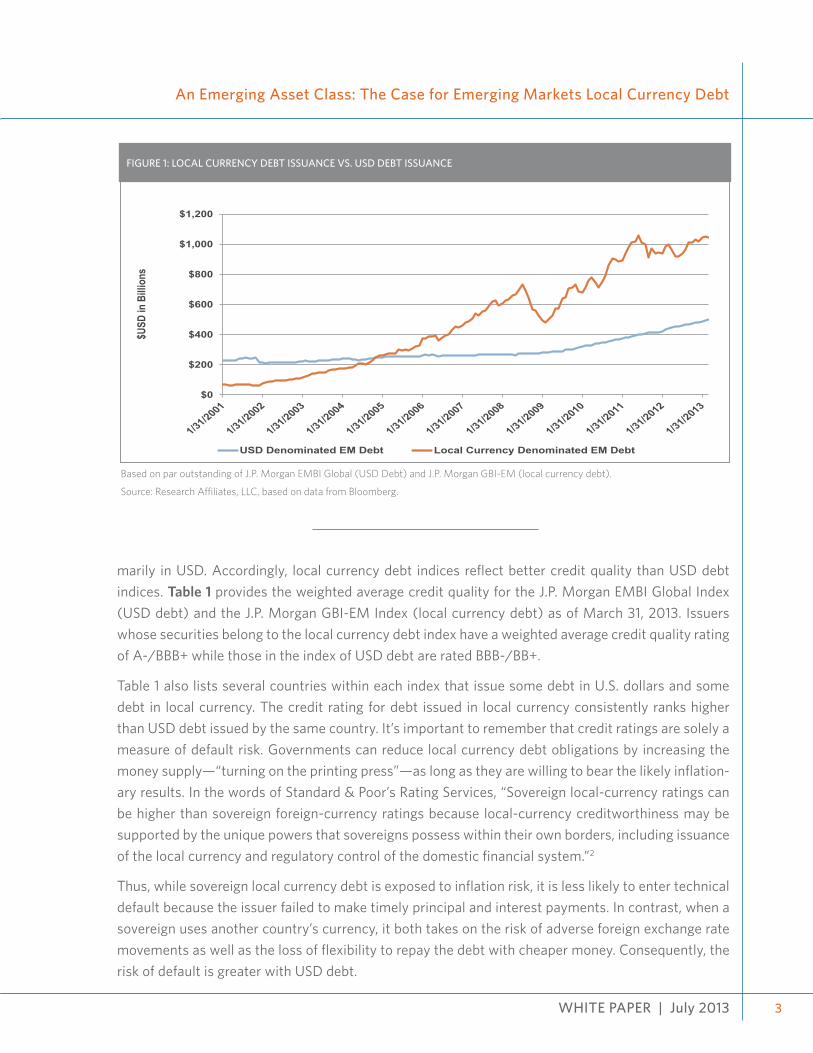
Figure 1 displays the amount of outstanding emerging market debt in U.S. dollars and local currency since 2001. The amount of outstanding debt issued in local currency has increased dramatically over that time, surpassing USD debt in 2005 and totaling over a trillion dollars as of March 31, 2013. The local currency debt market is now over twice the size of the USD debt market, with correspondingly greater liquidity and higher investment capacity.
CREDIT QUALITY
A second characteristic of local currency debt is the issuers’ perceived creditworthiness. Given that most countries naturally prefer issuing debt in local currency, the improving economic conditions in many emerging markets have created a self-selection process in which the more stable countries in-creasingly issue debt in local currency, while the less stable continue to issue debt denominated pri-
3
An Emerging Asset Class: The Case for Emerging Markets Local Currency Debt
WHITE PAPER | July 2013
Based on par outstanding of J.P. Morgan EMBI Global (USD Debt) and J.P. Morgan GBI-EM (local currency debt).
Source: Research Affiliates, LLC, based on data from Bloomberg.
$0
$200
$400
$600
$800
$1,000
$1,200
$USD
in B
illio
ns
USD Denominated EM Debt Local Currency Denominated EM Debt
fIGURE 1: LOCAL CURRENCY DEBT ISSUANCE VS. USD DEBT ISSUANCE
marily in USD. Accordingly, local currency debt indices reflect better credit quality than USD debt indices. Table 1 provides the weighted average credit quality for the J.P. Morgan EMBI Global Index (USD debt) and the J.P. Morgan GBI-EM Index (local currency debt) as of March 31, 2013. Issuers whose securities belong to the local currency debt index have a weighted average credit quality rating of A-/BBB+ while those in the index of USD debt are rated BBB-/BB+.
Table 1 also lists several countries within each index that issue some debt in U.S. dollars and some debt in local currency. The credit rating for debt issued in local currency consistently ranks higher than USD debt issued by the same country. It’s important to remember that credit ratings are solely a measure of default risk. Governments can reduce local currency debt obligations by increasing the money supply—“turning on the printing press”—as long as they are willing to bear the likely inflation-ary results. In the words of Standard & Poor’s Rating Services, “Sovereign local-currency ratings can be higher than sovereign foreign-currency ratings because local-currency creditworthiness may be supported by the unique powers that sovereigns possess within their own borders, including issuance of the local currency and regulatory control of the domestic financial system.”2
Thus, while sovereign local currency debt is exposed to inflation risk, it is less likely to enter technical default because the issuer failed to make timely principal and interest payments. In contrast, when a sovereign uses another country’s currency, it both takes on the risk of adverse foreign exchange rate movements as well as the loss of flexibility to repay the debt with cheaper money. Consequently, the risk of default is greater with USD debt.

WHITE PAPER | July 20134
LOCAL CURRENCY DEBT VS. USD DEBT RETURNS
Since its inception in 2002, the J.P. Morgan GBI EM Bond Index has outperformed the J.P. Morgan EMBI Global Index by approximately 1.5% per year in U.S. dollar terms (see Table 2). However, this higher performance comes with higher volatility. The higher volatility is a result of the fact that, for a U.S. investor, there are two sources of return for the local currency index: a return on the bonds in the index and a currency return. The USD debt index is composed of a bond return only.
If emerging market currencies collectively appreciate against the U.S. dollar, investors holding local currency debt stand to benefit from both sources of return. Although it is beyond the scope of this paper to explore the outlook in any detail, there are reasons to believe that emerging market curren-cies will appreciate over the coming decade. The United States currently has a debt-to-GDP ratio
TABLE 2. PERfORMANCE COMPARISON AS Of MARCH 31, 2013
1-YEAR 3-YEAR 5-YEAR 10-YEAR SINCE 2002
Annualized Return
J.P. Morgan EMBI Global (USD Debt) 10.44% 10.55% 9.81% 10.59% 11.20%
J.P. Morgan GBI-EM (Local Currency Debt) 6.85% 7.69% 7.16% 11.08% 12.68%
Annualized Standard Deviation
J.P. Morgan EMBI Global (USD Debt) 6.69% 6.72% 10.72% 8.87% 9.25%
J.P. Morgan GBI-EM (Local Currency Debt) 11.98% 13.01% 14.80% 12.38% 11.98%
Source: Research Affiliates, LLC, based on data from Bloomberg.
TABLE 1. CREDIT QUALITY Of LOCAL CURRENCY DEBT VS. USD DEBT
J.P. Morgan EMBI gLoBaL (usd dEBT)
J.P. Morgan gBI-EM (LocaL currEncy dEBT)
Brazil BBB A-
Mexico BBB A-
Poland A- A
South Africa BBB A-
Malaysia A- A
Russia BBB BBB+
Turkey BB+ BBB
Indonesia BB+ BB+
Thailand BBB+ A-
Hungary BB BB
Colombia BBB BBB+
Peru BBB BBB+
Index Weighted Avg. Credit Rating BBB-/BB+ A-/BBB+
Source: Research Affiliates, LLC, based on data from Bloomberg.

WHITE PAPER | July 2013
An Emerging Asset Class: The Case for Emerging Markets Local Currency Debt
5
greater than 100%,3 and it has been shown that large debt burdens lead to slower GDP growth.4 Many developed countries are actively engaged in keeping nominal interest rates low and real yields negative as a mechanism to decrease the real value of debt (with inflation and currency depreciation as poten-tial side effects).5 Additionally, Arnott and Chaves have explained the effect of demographic trends on GDP growth.6 Their research describes how the emerging markets are collectively entering a demo-graphic sweet spot in the coming decades. In their analysis, the United States and other developed economies face strong, sustained demographic headwinds in the years ahead.
CORRELATION WITH INfLATION
From the perspective of a U.S. investor, one of the most important benefits of holding local currency debt is its potential to act as an inflation hedge. It is intuitively sensible to expect emerging market currencies to appreciate when the U.S. economy experiences higher relative inflation. Evidence sup-ports this rational expectation. Table 3 illustrates the correlation of annual returns on local currency debt and USD debt with annual inflation surprises. (We are measuring unexpected inflation—or infla-tion shocks, which we define as year-over-year inflation minus year-over-year inflation from one year prior—because bond yields should already incorporate expected inflation.) Compared to the USD debt index, the local currency index has twice the correlation with inflation shocks. Additionally, the local currency index has almost triple the beta with respect to inflation shocks. In other words, for a given inflationary shock, the local index has historically experienced almost three times the return effect registered by the USD index.
Table 4 shows the impact of this relationship between inflation and U.S. dollar denominated returns on local currency debt: the local currency index has historically performed better during periods of high unexpected inflation. Although the measurement period only includes 96 monthly data points, U.S. inflation shocks appear to be associated with outperformance by the local currency debt index relative to the USD debt index. When unexpected inflation was greater than 2%, the average annualized out-performance was 4.3%, and when unexpected inflation fell between 1.0% and 2.0%, the average an-nualized outperformance was 8.3%. Conversely, during periods of unexpected deflation, the local debt index underperformed.
TABLE 3: INfLATION CORRELATION
J.P. MORGAN EMBI GLOBAL (USD DEBT)
J.P. MORGAN GBI-EM
(LC DEBT)
Correlation w/ inflation shocks 25% 55%
Beta w/ inflation shocks 1.07 2.90
Source: Research Affiliates, LLC, based on data from Bloomberg.

WHITE PAPER | July 20136
CONCLUSION
Over the last 20 years, numerous emerging market countries—Mexico, Poland, South Africa, and others—have grown economically while establishing greater stability, improving the infrastructure, and strengthening laws to protect property rights. They have also developed substantial credit mar-kets. Although there are still risks to consider, these propitious long term changes support sensible investments in emerging market sovereign debt.
We maintain that local currency debt has decisive advantages over debt that is denominated in U.S. dollars.
• More than twice the size of the USD market, the local currency debt market has correspond-ingly greater liquidity and higher investment capacity.
• Local currency debt indices reflect better credit quality than USD debt indices.
• There are two potential sources of return for local currency debt indices: a return on the con-stituent bonds and a currency return.
• For U.S. investors, local currency debt has the potential to serve as a hedge against unexpected inflation.
Although it is a relatively new asset class, emerging market sovereign local currency debt may be a profitable addition to an investor’s portfolio.
TABLE 4: VALUE ADDED DURING PERIODS Of INfLATION SHOCKS
INfLATION SHOCK
J.P. MORGAN EMBI GLOBAL (USD DEBT)
J.P. MORGAN GBI-EM
(LC DEBT)VALUE ADDED
(LC-USD)
Above or equal to 2.0% 12.7% 17.0% 4.3%
Between 1.0% and 0.0% 10.6% 18.9% 8.3%
Between 0.0% and -1.0% 15.1% 16.0% 0.9%
Between -1.0% and -2.0% 16.9% 13.3% -3.6%
Equal or below -2.0% 14.6% 8.9% -5.7%
Average annual returns for the period 1/1/2001-3/31/2013.
Source: Research Affiliates, LLC, based on data from Bloomberg.

WHITE PAPER | July 2013
An Emerging Asset Class: The Case for Emerging Markets Local Currency Debt
7
ENDNOTES
1. GDP figures as of 2012, based on data from Factset.
2. Standard & Poor’s Rating Services, “Sovereign Government Rating Methodology and Assumptions,” updated June 24, 2013.
3. Factset. U.S. Debt/GDP ratio as of 12/31/2012 was 103%.
4. Two examples are Cristina Checherita and Philipp Rother, “The Impact of High and Growing Government Debt on Eco-nomic Growth: An Empirical Investigation for the Euro Area,” European Central Bank Working Paper Series no. 1237 (Au-gust 2010); and Carmen M. Reinhart, Vincent R. Reinhart, and Kenneth S. Rogoff, “Debt Overhangs: Past and Present,” NBER Working Paper No. 18015 (April 2012).
5. See Shane Shepherd, “Financial Repression: Why It Matters,” Simply Stated, April 2013.
6. Robert D. Arnott and Denis B. Chaves, “Demographic Changes, Financial Markets, and the Economy.” Financial Analysts Journal, vol. 68, no. 1 (January/February 2012), 23-46.
WHITE PAPER | July 20138

WHITE PAPER | July 2013
An Emerging Asset Class: The Case for Emerging Markets Local Currency Debt
9
By accepting this document you agree to keep its contents confidential. You also agree not to disclose the contents of this document to third parties (including potential co-investors) without the prior permission of Research Affiliates, LLC (Research Affiliates, including its related entities).
The material contained in this document is for information purposes only. This material is not intended as an offer or solicitation for the purchase or sale of any security or financial instrument, nor is it advice or a recommendation to enter into any transaction. Any offer to sell or a solicitation of an offer to buy or sell shall be made solely to qualified investors through a private placement memorandum for pooled investment vehicles, or investment management agreement for separately managed accounts. This information is intended to supplement information contained in the respective disclosure documents. The information contained herein should not be construed as financial or in-vestment advice on any subject matter. Research Affiliates, LLC and its related entities do not warrant the accuracy of the information pro-vided herein, either expressed or implied, for any particular purpose.
The index data published herein are simulated, no allowance has been made for trading costs, management fees, or other costs, are not in-dicative of any specific investment, are unmanaged and cannot be invested in directly. Past simulated performance is no guarantee of future performance and actual investment results may differ. Any information and data pertaining to an index contained in this document relate only to the index itself and not to any asset management product based on the index. With the exception of the data on Research Affiliates Fundamental Index, all other information and data are based on information and data from third party sources.
Investors should be aware of the risks associated with data sources and quantitative processes used in our investment management process. Errors may exist in data acquired from third party vendors, the construction of model portfolios, and in coding related to the index and port-folio construction process. While Research Affiliates takes steps to identify data and process errors so as to minimize the potential impact of such errors on index and portfolio performance, we cannot guarantee that such errors will not occur.
Russell Investments is the source and owner of the Russell Index data contained or reflected in this material and copyrights related thereto. Russell Investments and Research Affiliates, LLC have entered into a strategic alliance with respect to the Russell Fundamental Indexes. Subject to Research Affiliates, LLC’s intellectual property rights in certain content, Russell Investments is the owner of all copyrights related to the Russell Fundamental Indexes. Russell Investments and Research Affiliates, LLC jointly own all trademark and service mark rights in and to the Russell Fundamental Indexes. Research Affiliates, LLC is the owner of the trademarks, service marks, patents and copyrights related to the Fundamental Index and the Fundamental Index methodology. The presentation may contain confidential information and unauthorized use, disclosure, copying, dissemination, or redistribution is strictly prohibited. This is a presentation of Research Affiliates, LLC. Russell In-vestments is not responsible for the formatting or configuration of this material or for any inaccuracy in Research Affiliates’ presentation thereof.
Copyright MSCI. All Rights Reserved. Without prior written permission of MSCI, this information and any other MSCI intellectual property may only be used for your internal use, may not be reproduced or redisseminated in any form and may not be used to create any financial instruments or products or any indices. This information is provided on an “as is” basis, and the user of this information assumes the entire risk of any use made of this information. Neither MSCI nor any third party involved in or related to the computing or compiling of the data makes any express or implied warranties, representations or guarantees concerning the MSCI index-related data, and in no event will MSCI or any third party have any liability for any direct, indirect, special, punitive, consequential or any other damages (including lost profits) relat-ing to any use of this information.
The FTSE Research Affiliates Fundamental Indexes are calculated by FTSE International Limited (“FTSE”) in conjunction with Research Af-filiates LLC (“RA”). All rights and interests in the FTSE Research Affiliates Fundamental Indexes vest in FTSE. All rights in and to the RA fun-damental weighting methodology used in the calculation of the FTSE Research Affiliates Fundamental Indexes vest in RA. All rights in the FTSE indices and / or FTSE ratings (together the “FTSE Data”) vest in FTSE and/or its licensors. Except to the extent disallowed by applicable law, neither FTSE nor RA nor their licensors shall be liable (including in negligence) for any loss arising out of use of the FTSE Research Af-filiates Fundamental Indexes, the FTSE Data or underlying data by any person. “FTSE™” is a trademark of the London Stock Exchange Plc and is used by FTSE under license. “Research Affiliates” and “Fundamental Index” are trademarks of RA. FTSE is not an investment adviser and makes no representation regarding the advisability of investing in any security. Inclusion of a security in an index is not a recommendation to buy, sell or hold such security. No further distribution of FTSE Data is permitted without FTSE’s express written consent.
Research Affiliates is the owner of the trademarks, service marks, patents and copyrights related to the Fundamental Index methodology. The trade names Fundamental Index®, RAFI®, the RAFI logo, and the Research Affiliates corporate name and logo are registered trademarks and are the exclusive intellectual property of Research Affiliates, LLC. Any use of these trade names and logos without the prior written permis-sion of Research Affiliates, LLC is expressly prohibited. Research Affiliates, LLC reserves the right to take any and all necessary action to preserve all of its rights, title and interest in and to these marks.
The Fundamental Index® concept, the non-capitalization method for creating and weighting of an index of securities, is patented and patent-pending proprietary intellectual property of Research Affiliates, LLC (US Patent No. 7,620,577; 7,747,502; 7,792,719; 7,778,905; and 8,005,740; Patent Pending Publ. Nos. US-2007-0055598-A1, US-2008-0288416-A1, US-2010-0191628, US-2010-0262563, WO 2005/076812, WO 2007/078399 A2, WO 2008/118372, EPN 1733352, and HK1099110). Intellectual property protected by one, or more, of the foregoing may be used in the material presented herein.
© Research Affiliates, LLC. All rights reserved. Duplication or dissemination prohibited without prior written permission.

620 Newport Center Drive, Suite 900 Newport Beach, CA 92660 Main: +1 949.325.8700 www.researchaffiliates.com