an elastic phase field model for thermal oxidation of metals: application to zirconia
TRANSCRIPT

Computational Materials Science 89 (2014) 122–129
Contents lists available at ScienceDirect
Computational Materials Science
journal homepage: www.elsevier .com/locate /commatsci
An elastic phase field model for thermal oxidation of metals: Applicationto zirconia
http://dx.doi.org/10.1016/j.commatsci.2014.03.0420927-0256/� 2014 Elsevier B.V. All rights reserved.
⇑ Corresponding author. Tel.: +1 573 341 7184.E-mail address: [email protected] (M. Asle Zaeem).
Mohsen Asle Zaeem a,⇑, Haitham El Kadiri b
a Department of Materials Science and Engineering, Missouri University of Science and Technology, Rolla, MO 65409-0340, USAb Mechanical Engineering Department, Mississippi State University, Starkville, MS 39762, USA
a r t i c l e i n f o a b s t r a c t
Article history:Received 26 November 2013Received in revised form 17 March 2014Accepted 21 March 2014
Keywords:OxidationZirconiumPhase field modelFinite element methodGrowth stress
A multi-phase field model was developed for non-selective oxidation of metals which captures both theoxidation kinetics and stress generation. Phase field formulation involved a non-conserved phase fieldvariable as the marker for the metallic substrate, oxide scale, and a fluid phase containing oxygen, anda conserved phase field variable representing the concentration of oxygen. The evolution equations ofthe phase field variables were coupled to the mechanical equilibrium equations to investigate the evolu-tion of stress generation in both the oxide scale and the underlying metal. The governing equations weresolved in a finite element framework. This phase field model predicts the oxygen composition depth andstress profiles in the oxide layer and at the metal–oxide interface. The model was proven successful inpredicting the observed evolution of oxide thickness and growth stresses for Zircaloy-4 oxidized at900 �C. The results of phase field simulations showed that the generation of stresses upon oxidation tendsto slow down the oxidation kinetics, and this substantially improved the model predictability of exper-imental data.
� 2014 Elsevier B.V. All rights reserved.
1. Introduction
Metals and alloys exposed to high temperatures during serviceand operating in aggressive environments usually suffer from oxi-dation at their free surfaces. Oxidation is considered as one of themost important lifetime limiting factors for metallic componentsused in high temperature applications [1–8]. Oxidation resistancecan be obtained if metals form a protective oxide layer called thethermally grown oxide (TGO). The TGO must be able to grow uni-formly and continuously on the substrate while maintaining agood adherence and structural health. Alumina is the most com-mon TGO found in engineering applications requiring long thermalexposures. Alumina layers grown on alumina-forming alloys havea particularly low diffusivity of oxygen, an excellent creep resis-tance, and are able to remain adherent and compact at tempera-tures exceeding 1300 �C. Alumina-forming alloys are exemplifiedby nickel aluminides used as bond coats in thermal barrier coating(TBC) systems, and by iron–chromium–aluminum (FeCrAl) alloyswhich find use in TBCs and in catalytic converters [9] and heatexchangers [10]. Chromia can also form a stable TGO in chro-mium-containing ferritic steels. However, chromia is much more
unstable than alumina and as such not often utilized in structuralcomponents undergoing oxidation above 600 �C, unless the elec-tronic conductivity of the oxide is a major concern, as in intercon-nects in semiconductor devices.
A particular high temperature application disqualifying bothalumina and chromia as TGO layers is the fuel-rod cladding fornuclear reactors. The cladding material must be transparent toneutrons with high thermal creep resistance, and this fact rendersonly low-alloy zirconium alloys, namely Zircaloy grades [11–14],usable. Thus, the oxidation resistance of Zircaloy relies on thegrowth of zirconia (ZrO2), usually at temperatures between320 �C and 600 �C, or, at much higher temperatures, in the caseof undesirable power ramps. Zirconia, however, is substantiallymore prone to cracking and spalling than thin alumina and chro-mia layers [15]. Cracking has actually emerged in the last decadeas a major factor reducing the durability of Zr cladding [16–21].In fact, the oxidizing environment in most nuclear reactors iswater, and upon its reduction by the zirconium oxidation, it pro-duces hydrogen. Hydrogen diffuses faster through cracks and otherfast diffusion paths leading to an increase in the hydrogen uptake(HU) by the zirconium substrate. HU leads to a variety of embrittle-ment phenomena such as formation of hydride blisters and rims aswell as an acceleration of the oxidation kinetics. Because of theremarkable susceptibility of zirconia to develop cracks upon oxida-tion, HU is considered as the most critical source of environmental
M. Asle Zaeem, H. El Kadiri / Computational Materials Science 89 (2014) 122–129 123
degradation of zirconium cladding. Regardless of whether the TGOlayer is alumina, zirconia or chromia, stresses induced in the metaland in the TGO by an isothermal oxidation process plays a majorrole in TGO cracking and spallation mechanisms. Internal stressescan be of two natures:
1. Growth stresses [22–27] develop due to either dislocation climb-glide return at the interface [28–36] or interdiffusion [34,36,37].While interdiffusion occurs only in alloys where selective oxida-tion is substantial, interfacial misfit dislocation activities contrib-ute to stress generation for any oxidizing metal within both themetal and the oxide scale. Growth stresses in the oxide and metalcan be in the order of tens of GPa [1] and have been involved inseveral forms of damage in the oxide scale and in the metal rush-ing breakaway oxidation [36,38–42]. In addition to these effects,growths stresses induce mass transport and mismatch strains atthe metal–oxide interface, which cause the interface to corru-gate, and thus the oxide scale to wrinkle and pattern stressesand cracks [35,43–51]. For example, the present authors recentlyshowed that mismatch elastic stresses due to the lattice dilata-tion and interdiffusion at the solid–fluid interfaces can causeinterface corrugation without any contribution from an externalforce [51].
2. Transformation stresses develop due to phase transformationwithin the oxide or within the metal upon oxidation. Phasetransformation in the oxide scale was observed to occur in bothof alumina and zirconia. In alumina, metastable polymorphs ofcubic (c-phase) and/or monoclinic (h-phase) structures trans-form to the stable a-phase, thereby generating high stressesunder the large difference of the atomic volumes between theseallotropic phases [40,52–54]. Tetragonal to monoclinic transfor-mation has also been observed to occur in thin zirconia layersgrown over Zircaloy-2 and Zircaloy-4 [55–61]. Based on therecent observations by Park et al. [62] and the scaling mecha-nisms put forward by Martin et al. [63], transformation stressesmay play a tacit and significant role in the generation and pat-terning of cracks observed in oxide scales developed over Zirca-loy [15,64–66].
Modeling, via the sharp interface approach, of growth stressesdue to misfit dislocation activities upon the thickening process ofthe TGO is a convoluted problem. In fact, such models must countthe dislocations leaving the interface to accommodate metal reces-sion and those returning to the interface to maintain epitaxiality.Although Suo et al. [34] attempted to formulate governing equa-tions incorporating the dislocation-based mechanisms identifiedby Pieraggi et al. [29,33], their models were essentially phenome-nological as they did not introduce any type of dislocation densi-ties. There is in fact no physical model in the literature thatincorporated the mechanisms put forward by Pieraggi et al. [33].Moreover, the numerical implementation and investigation ofSuo’s [34] and El Kadiri’s [36] models beyond a one-dimensionalcase are extremely difficult as the necessity to track the interfaceis computationally impractical. Accordingly, all current oxidationmodels are essentially continuum models that rely on the Pil-ling–Bedworth ratio (PB ratio or PBR) and calculate growth stressesthereupon. Moreover, continuum models for growth stresses didnot take into account the effect of growth stress gradient on thediffusion according to Stephenson’s Law [37]. Krishnamurthy andSrolovitz [67,68] presented a continuum model to study stress dis-tribution in growing oxide films. Using the mass balance of thechemical reaction, these authors derived the reaction–diffusiongoverning equations, then followed Larch and Cahn’s theory [25]to relate the chemical (or diffusion) potential to the stress; thechemical potential is the sum of the stress-free chemical potentialand a function which linearly depends on the dilatational stress.
Similar approach was used by Zhou et al. [69,70] to study stress–oxidation interaction for Fe–Cr alloys exposed at hightemperatures.
The phase field method (also known as the diffusive-interfacemethod) may constitute a suitable alternative to the sharp-inter-face approach for the highly coupled problem of oxidation andgrowth stresses. Furthermore, once a phase field model for oxida-tion and stress is built, simulation of crack patterning in the oxidescale can be feasible provided that a coupling with another phasefield model incorporating constitutive equations for damage isintegrated. Only a few phase models of oxidation can be found inthe literature, which were only developed during the last decade.For instance, Ammar et al. [71] developed a phase field model tostudy the oxidation kinetics of zirconium exposed to high temper-atures. However, these authors presented simplified models thatthat did not consider the generation of stresses.
In this paper, we developed a phase field model capable of com-puting the thickening rate of the TGO grown over metals under theeffect of growth stresses generated in both the metal and TGO. Thisinitial framework had to first couple oxidation and stresses under asimplified approach relying on the PB ratio. The model can, how-ever, be easily modified to incorporate more robust mechanismsfor stress generation. The phase field model assumes that stressis only generated by the compositional deviation from the equilib-rium values across the interfaces and inside the metal and oxidephases. The governing evolution equations of phase field variablesare derived by minimizing the total free energy of the system con-sidering diffusion of species. These governing equations are cou-pled to mechanical equilibrium equations to determine theinduced stresses and their effects on composition depth profile ofthe oxygen in the oxide layer and in the metallic substrate. To solvethe governing equations of the problem a finite element modelwhich was initially developed by Asle Zaeem and Mesarovic[72,73] and applied for studying phase transformation in binaryalloy systems [74–77], is used to compute the thickening rates ofthe oxide scale and the stress profiles developed upon the oxida-tion of Zircaloy-4.
2. Phase field model of oxidation
For deriving the governing equations of the phase field model,one conserved and one non-conserved phase field variables areused. The conserved phase field variable, c(x, t), is considered forthe concentration of oxygen in spatial (x) and time domains (t).A non-conserved phase field variable, so called order parameter,/(x, t), is considered as the marker of different phases, which takesvalues /m = 0 in the metal, /o = 1/2 in the oxide, and /f = 1 in thefluid.
The inclusion of the fluid phase enables capturing the case ofcationic mechanism of oxidation, which would cause an outwardgrowth of the oxide scale. Generally, oxidation proceeds underboth cationic and anionic mechanisms, the latter promotinginward growth of the scale. However, in practice, either case pre-dominates. In Zircaloy for instance, the diffusion of zirconium ismuch slower than that of oxygen in the oxide layer, so oxidationis essentially anionic as the new oxide molecule predominantlyforms at the metal/oxide interface. Some existing models, such asthe one developed by Ammar et al. [71], do not consider a fluidphase therefore are not capable of capturing the outward growthof the oxide scale. Thus, they may overlook the effect of the kineticsand thermodynamics related to oxygen generation and absorptionat oxide–fluid interface. This is known to be the case in nuclearreactors where the corrosive environment is water vapor, whichalso generates hydrogen. The total free energy of a system includ-ing a metal phase (m), an oxide phase (o) and a fluid phase (f) canbe written as:

124 M. Asle Zaeem, H. El Kadiri / Computational Materials Science 89 (2014) 122–129
Fðc;/; eEijÞ ¼
ZV
hðc;/Þ þ U c;/; eEij
� �þ 1
2r/ � jð/Þ � r/
� �dV : ð1Þ
h(c, /) is the bulk free energy density plus an interface penalty term,which can be evaluated by h(c, /) = W(/)g(/) + f(c, /), where f(c, /)is representing the energy density of metal, oxide and fluid phases:
f ðc;/Þ ¼ Cm/ fmðcÞ þ Co
/foðcÞ þ Cf/f f ðcÞ: ð2Þ
Cm/ ;C
o/, and Cf
/ are the interpolation coefficients:
Cm/ ¼
ð/� /oÞ2ð/� /f Þ
2
ð/m � /oÞ2ð/m � /f Þ
2 ; Co/ ¼
ð/� /mÞ2ð/� /f Þ
2
ð/o � /mÞ2ð/o � /f Þ
2 ;
Cf/ ¼
ð/� /mÞ2ð/� /oÞ
2
ð/f � /mÞ2ð/f � /oÞ
2 : ð3Þ
fmðcÞ; f oðcÞ and ff(c) are the free energy densities of metal, oxide,and fluid phases, respectively. Following the work by Echebarriaet al. [78] for solidification of binary alloys, we can define freeenergy densities for different phases using simple quadratic func-tions of the concentration, c. These free energy densities areassumed to take the following expressions:
fmðcÞ ¼12
kmc ðc � cm
0 Þ2; ð4Þ
foðcÞ ¼12
kocðc � co
0Þ2; ð5Þ
ff ðcÞ ¼12
kfcðc � cf
0Þ2; ð6Þ
where cm0 is the equilibrium concentration (atomic%) of oxygen in
the metal (�0.291), co0 is the equilibrium concentration of oxygen
at the oxide phase (�0.67), and cf0 is the equilibrium concentration
of oxygen at the fluid side of the oxide–fluid interface. cm0 and co
0
define the two-phase region in the Zr–O phase diagram [79]. kmc ,
koc and kf
c are the curvatures of the free energies with respect tothe concentration of oxygen at the metal, oxide, and fluid phases,respectively.
g(/) is considered to be a triple-well potential accounting forthe free energy penalty of interfaces (metal–oxide and oxide–fluidinterfaces):
gð/Þ ¼ð/� /mÞ
4ð/� /oÞ2ð/� /f Þ
4
ð/mo � /mÞ4ð/mo � /oÞ
2ð/mo � /f Þ4
¼ð/� /mÞ
4ð/� /oÞ2ð/� /f Þ
4
ð/of � /mÞ4ð/of � /oÞ
2ð/of � /f Þ4 ; ð7Þ
/mo ffi 0.25 and /of ffi 0.75 are the values of the order parameter atthe metal–oxide and oxide–fluid interfaces, respectively. g(/) ffi 0at the metal, oxide and fluid phases and unity at the metal–oxideand oxide–fluid interfaces. W(/) shows the strength of the freeenergy penalty of interfaces:
Wð/Þ ¼ð/� /of Þ
2
ð/mo � /of Þ2 Wmo þ
ð/� /moÞ2
ð/of � /moÞ2 Wof ; ð8Þ
where Wmo and Wof are the free energy penalties at the metal–oxideand oxide–fluid interfaces, respectively, which are calculated inAppendix A.
In this work for simplicity, we have assumed an elastic regimefor growth stresses; however, a more complete model needs toconsider creep effects due to migration of vacancies and disloca-
tions [36]. U c;/; eEij
� �is the elastic strain energy:
U c;/; eEij
� �¼ 1
2CijkleE
ijeEkl: ð9Þ
The elastic coefficient tensor, Cijkl can be calculated through:
Cijklð/Þ ¼ Cm/ Cm
ijkl þ Co/Co
ijkl þ Cf/Cf
ijkl; ð10Þ
where Cmijkl;C
oijkl and Cf
ijklðffi 0Þ are the elastic coefficient tensor ofmetal, oxide, and fluid, respectively. In Eq. (9), elastic strain tensor,eE
ij is:
eEij ¼ eT
ij � eCij ; ð11Þ
where total strain tensor, eTij is:
eTij ¼
12
@ui
@xjþ @uj
@xi
� �; ð12Þ
and ui is the displacement vector. eCij is the compositional strain. In a
model for solid-state diffusional phase transformation, Larche andCahn [80] proposed a method to include stresses induced by diffu-sion of species in which the stress–free strains are purely dilata-tional for an isotopic system and depend on composition ofphases only. In this paper, the stress–free strains are called compo-sitional mismatch strains, which take the following forms in themetal and oxide phases, respectively:
ðeCijÞm ¼ emdij ¼ gm
c ðc � cm0 Þdij; ð13Þ
ðeCijÞo ¼ eodij ¼ go
c ðc � co0Þdij; ð14Þ
ðeCijÞ
m!o ¼ em!odij ¼ gm!oc ðc � cm
0 Þdij; ð15Þ
Eqs. (13) and (14) determine the compositional mismatchstrains due to deviation from the equilibrium concentration of oxy-gen at the metal and oxide phases. Eq. (15) determines the dilata-tional strain induced by structural transformation from metal tooxide (inward oxidation), through the PB ratio; PBR ¼ gm!o
c .According to the Vegard’s law [81]: gc
m ¼ @em=@c;gco ¼ @eo=@c and
gm!oc ¼ @em!o=@c, and they are assumed to be constants in this
work. This way to include mismatch compositional strains waspreviously used by Asle Zaeem and Mesarovic in precipitationmorphology [72,76] and multilayer thin films [73,74], and byKrishnamurthy and Srolovitz in oxidation of metals [67,68]. Weuse the following function for compositional mismatch strain inthe phase field formulations:
eCijðc;/Þ¼ edij ¼ Cm
/ gmc ðc� cm
0 ÞþCo/g
oc ðc�co
0ÞþCo/jigm!o
c ðc�cm0 Þ
� �dij: ð16Þ
The initial position of the oxide layer is known in the simulations,and Co
/
���i
takes value 1 where the new inward oxide molecule formsand 0 elsewhere. The above equation grantees zero production ofcompositional mismatch strain in the external oxide scale and fluidphase.
The last term in Eq. (1) shows the energy from interfaces. j(/) isthe gradient energy coefficient tensor and for an isotropic casebecomes j ¼ jðuÞ I, where I is the unit tensor. Similar to Eq. (8),j(/) has different values at the metal–oxide and oxide–fluidinterfaces:
jð/Þ ¼ð/� /of Þ
2
ð/mo � /of Þ2 jmo þ
ð/� /omÞ2
ð/of � /omÞ2 jof ; ð17Þ
where jmo and jof are the gradient energy coefficients at the metal–oxide and oxide–fluid interfaces, respectively, which are calculatedin Appendix A. The last term in Eq. (1) which includes gradient of/(x, t) vanishes in the areas that are far enough from the interfaces,because r/ is only non-zero at interfaces.
At diffusion, and based on the second Fick’s law, the local valuesof c change according to the divergence of its flux, qc:
qc _c ¼ �r � qc; ð18Þ
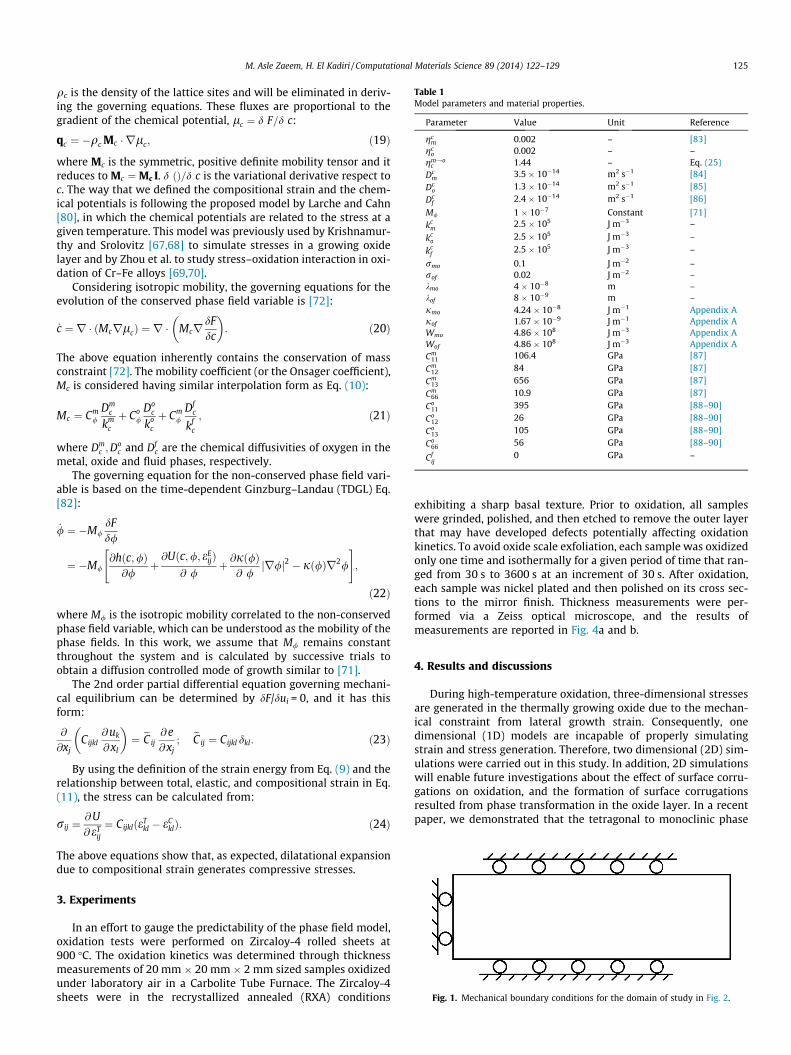
Table 1Model parameters and material properties.
Parameter Value Unit Reference
gcm 0.002 – [83]
gco 0.002 – –
gm!oc 1.44 – Eq. (25)
Dcm 3.5 � 10�14 m2 s�1 [84]
Dco 1.3 � 10�14 m2 s�1 [85]
Dcf 2.4 � 10�14 m2 s�1 [86]
M/ 1 � 10�7 Constant [71]kc
m 2.5 � 105 J m�3 –
kco 2.5 � 105 J m�3 –
kcf 2.5 � 105 J m�3 –
rmo 0.1 J m�2 –rof 0.02 J m�2 –kmo 4 � 10�8 m –kof 8 � 10�9 m –jmo 4.24 � 10�8 J m�1 Appendix Ajof 1.67 � 10�9 J m�1 Appendix AWmo 4.86 � 108 J m�3 Appendix AWof 4.86 � 108 J m�3 Appendix ACm
11 106.4 GPa [87]
Cm12 84 GPa [87]
Cm13 656 GPa [87]
Cm66 10.9 GPa [87]
Co11 395 GPa [88–90]
Co12 26 GPa [88–90]
Co13 105 GPa [88–90]
Co66 56 GPa [88–90]
Cfij
0 GPa –
Fig. 1. Mechanical boundary conditions for the domain of study in Fig. 2.
M. Asle Zaeem, H. El Kadiri / Computational Materials Science 89 (2014) 122–129 125
qc is the density of the lattice sites and will be eliminated in deriv-ing the governing equations. These fluxes are proportional to thegradient of the chemical potential, lc ¼ d F=d c:
qc ¼ �qc Mc � rlc; ð19Þ
where Mc is the symmetric, positive definite mobility tensor and itreduces to Mc ¼Mc I. d ðÞ=d c is the variational derivative respect toc. The way that we defined the compositional strain and the chem-ical potentials is following the proposed model by Larche and Cahn[80], in which the chemical potentials are related to the stress at agiven temperature. This model was previously used by Krishnamur-thy and Srolovitz [67,68] to simulate stresses in a growing oxidelayer and by Zhou et al. to study stress–oxidation interaction in oxi-dation of Cr–Fe alloys [69,70].
Considering isotropic mobility, the governing equations for theevolution of the conserved phase field variable is [72]:
_c ¼ r � ðMcrlcÞ ¼ r � McrdFdc
� �: ð20Þ
The above equation inherently contains the conservation of massconstraint [72]. The mobility coefficient (or the Onsager coefficient),Mc is considered having similar interpolation form as Eq. (10):
Mc ¼ Cm/
Dmc
kmc
þ Co/
Doc
koc
þ Cm/
Dfc
kfc
; ð21Þ
where Dmc ;D
oc and Df
c are the chemical diffusivities of oxygen in themetal, oxide and fluid phases, respectively.
The governing equation for the non-conserved phase field vari-able is based on the time-dependent Ginzburg–Landau (TDGL) Eq.[82]:
_/ ¼ �M/dFd/
¼ �M/@hðc;/Þ@/
þ@Uðc;/; eE
ijÞ@ /
þ @jð/Þ@ /
jr/j2 � jð/Þr2/
" #;
ð22Þ
where M/ is the isotropic mobility correlated to the non-conservedphase field variable, which can be understood as the mobility of thephase fields. In this work, we assume that M/ remains constantthroughout the system and is calculated by successive trials toobtain a diffusion controlled mode of growth similar to [71].
The 2nd order partial differential equation governing mechani-cal equilibrium can be determined by dF/dui = 0, and it has thisform:
@
@xjCijkl
@uk
@ xl
� �¼ eCij
@ e@ xj
; eCij ¼ Cijkl dkl: ð23Þ
By using the definition of the strain energy from Eq. (9) and therelationship between total, elastic, and compositional strain in Eq.(11), the stress can be calculated from:
rij ¼@U@ eT
ij
¼ CijklðeTkl � eC
klÞ: ð24Þ
The above equations show that, as expected, dilatational expansiondue to compositional strain generates compressive stresses.
3. Experiments
In an effort to gauge the predictability of the phase field model,oxidation tests were performed on Zircaloy-4 rolled sheets at900 �C. The oxidation kinetics was determined through thicknessmeasurements of 20 mm � 20 mm � 2 mm sized samples oxidizedunder laboratory air in a Carbolite Tube Furnace. The Zircaloy-4sheets were in the recrystallized annealed (RXA) conditions
exhibiting a sharp basal texture. Prior to oxidation, all sampleswere grinded, polished, and then etched to remove the outer layerthat may have developed defects potentially affecting oxidationkinetics. To avoid oxide scale exfoliation, each sample was oxidizedonly one time and isothermally for a given period of time that ran-ged from 30 s to 3600 s at an increment of 30 s. After oxidation,each sample was nickel plated and then polished on its cross sec-tions to the mirror finish. Thickness measurements were per-formed via a Zeiss optical microscope, and the results ofmeasurements are reported in Fig. 4a and b.
4. Results and discussions
During high-temperature oxidation, three-dimensional stressesare generated in the thermally growing oxide due to the mechan-ical constraint from lateral growth strain. Consequently, onedimensional (1D) models are incapable of properly simulatingstrain and stress generation. Therefore, two dimensional (2D) sim-ulations were carried out in this study. In addition, 2D simulationswill enable future investigations about the effect of surface corru-gations on oxidation, and the formation of surface corrugationsresulted from phase transformation in the oxide layer. In a recentpaper, we demonstrated that the tetragonal to monoclinic phase
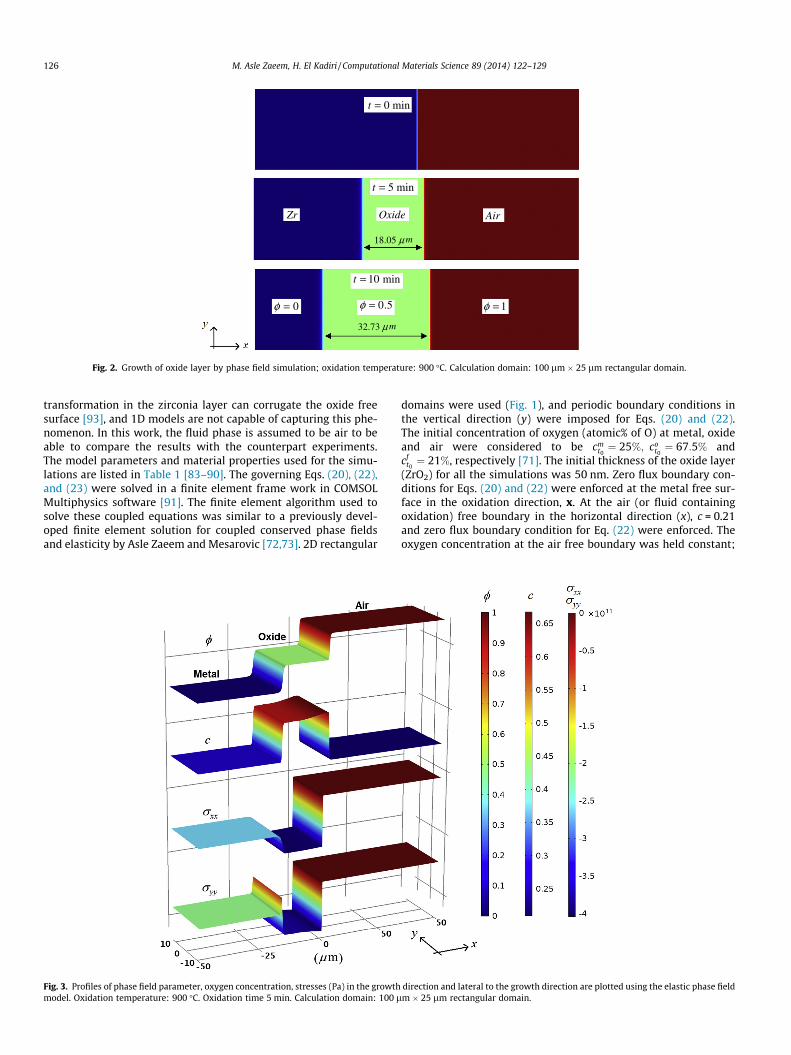
Fig. 2. Growth of oxide layer by phase field simulation; oxidation temperature: 900 �C. Calculation domain: 100 lm � 25 lm rectangular domain.
126 M. Asle Zaeem, H. El Kadiri / Computational Materials Science 89 (2014) 122–129
transformation in the zirconia layer can corrugate the oxide freesurface [93], and 1D models are not capable of capturing this phe-nomenon. In this work, the fluid phase is assumed to be air to beable to compare the results with the counterpart experiments.The model parameters and material properties used for the simu-lations are listed in Table 1 [83–90]. The governing Eqs. (20), (22),and (23) were solved in a finite element frame work in COMSOLMultiphysics software [91]. The finite element algorithm used tosolve these coupled equations was similar to a previously devel-oped finite element solution for coupled conserved phase fieldsand elasticity by Asle Zaeem and Mesarovic [72,73]. 2D rectangular
Fig. 3. Profiles of phase field parameter, oxygen concentration, stresses (Pa) in the growthmodel. Oxidation temperature: 900 �C. Oxidation time 5 min. Calculation domain: 100 l
domains were used (Fig. 1), and periodic boundary conditions inthe vertical direction (y) were imposed for Eqs. (20) and (22).The initial concentration of oxygen (atomic% of O) at metal, oxideand air were considered to be cm
t0¼ 25%; co
t0¼ 67:5% and
cft0¼ 21%, respectively [71]. The initial thickness of the oxide layer
(ZrO2) for all the simulations was 50 nm. Zero flux boundary con-ditions for Eqs. (20) and (22) were enforced at the metal free sur-face in the oxidation direction, x. At the air (or fluid containingoxidation) free boundary in the horizontal direction (x), c = 0.21and zero flux boundary condition for Eq. (22) were enforced. Theoxygen concentration at the air free boundary was held constant;
direction and lateral to the growth direction are plotted using the elastic phase fieldm � 25 lm rectangular domain.

M. Asle Zaeem, H. El Kadiri / Computational Materials Science 89 (2014) 122–129 127
otherwise, the fast oxygen depletion in air would cause the scale tostop growing shortly after the onset of oxidation. For Eq. (23),the plane strain conditions were enforced, and the displace-ment boundary conditions for the domain of study are shown inFig. 1.
In three dimensions, the volume expansion from metal to oxideis characterized by the Pilling–Bedworth ratio (PBR), which corre-sponds to the ratio of the molar volume of oxide over that of themetal. Assuming a fully dense monoclinic zirconia, this ratio is1.56 ðPBR ¼ ð1þ ekÞð1þ ekÞð1þ e?Þ; ek ¼ 0:005; e? ¼ 0:54Þ [92].For a 2D system, an average value of compositional strain param-eter in Eq. (15) can be calculated from:
Fig. 4. Experimental and phase field model (PFM) results of thickness of oxide layerversus time of oxidation; oxidation temperature: 900 �C.
gm!oc ¼ ð1þ ekÞð1þ e?Þ � 1
ðco0 � cm
0 Þ: ð25Þ
For time integration, an adaptive time-step algorithm wasimplemented; at the initial stages of the growth, time steps lessthan 5 � 10�6 s were used to guarantee the convergence of thesolution, and at the later stages of growth, time steps less than0.6 s were sufficient to ensure the convergence. In discretizingthe domain (meshing), and to ensure a reliable finite element solu-tion for the evolution equation of conserved phase field variable (inour case oxygen concentration), we need to have at least 5 ele-ments along the interfaces [72,73], but, this fine mesh is not neces-sary for areas not close to the interfaces. For computationalefficiency, the adaptive meshing algorithm option in COMSOL Mul-tiphysics [91] was implemented, and the adaptive discretizationset-up was set to ensure the 5-element limit only for areas closeto the metal–oxide and oxide–fluid interfaces.
In Fig. 2, a 100 lm � 25 lm rectangular domain is considered,and the metal–oxide and oxide–air interface movement respectto the initial position of the metal–air interface are plotted at threedifferent times; this figure also shows the predicted thickness ofthe oxide layer (/ = 0.5) for oxidation at 900 �C. The predictedthickness of oxide layer after 5 and 10 min oxidation in 900 �Care 18.05 lm and 32.73 lm, respectively. From this figure it is evi-dent that the rate of internal oxidation is much higher than that ofexternal oxidation.
In Fig. 3, the same domain size used in Fig. 2 is considered, andprofiles of non-conserved phase field parameter (/), oxygen con-centration (conserved phase field, c), stress in the growth directionand stress lateral to the growth direction are plotted. By applyingthe mechanical boundary conditions shown in Fig. 1, and due tothe volume expansion resulted from metal to oxide transforma-tion, high compressive stress is generated in the oxide scale in bothdirections parallel and lateral to the growth direction. There ishigher compressive stress in the metal in growth direction com-pared to the lateral direction, and this is because of the zero dis-placement boundary condition in the growth direction applied atthe metal boundary, since the underneath metal will resist themovement in this direction.
The phase field simulation results and experimental data onthickness of oxide layer versus time of oxidation are plotted inFig. 4(a and b). The oxidation temperature is 900 �C and the calcu-lation domain is a 800 lm � 100 lm rectangle. Fig. 4(a) shows thatwithout including generated stresses resulted from oxidation (run-ning the model without considering elastic strain energy), the pre-dicted thickness for oxide layer overshoots the experimental result.The generated stress acts as a soft constraint against oxidationgrowth and lowers the oxidation rate. Fig 4(b) shows the thicknessof the oxide layer for the initial 20 min of oxidation. In our previousworks [93–95], we showed that tetragonal to monoclinic phasetransformation happens in the initial stages of oxidation of zirco-nium which results in transformation stresses in the order ofGPa. Since in our model we only assume one oxidation phase (sta-
ble monoclinic zirconia) and we do not account for any phasetransformation, the predicted results for both cases with and with-out elasticity overshoot the experimental results in the early stagesof the oxidation.
5. Conclusions
We studied the oxidation kinetics of zirconium by both simula-tions and experiments. A phase field model was presented for oxi-dation of pure metals in which the diffusion-controlled phasetransformation is the mode of the oxide growth. The governingevolution equations of phase field variables were coupled to themechanical equilibrium equations to investigate the evolution ofstresses in the oxide and the metal substrate. This model capturedthe composition depth profile of the oxygen in the oxide layer andin the metallic substrate. Stresses induced by compositional devia-tions from the equilibrium values in the metal and oxide phasesand also those induced by metal to oxide transformation weredetermined to be in the order of GPa. The oxidation kinetics of zir-conium achieved by the phase field simulation was validated byexperimental results. The results of phase field simulations showedthat the generation of stresses upon oxidation lowers the oxidationgrowth rate.
128 M. Asle Zaeem, H. El Kadiri / Computational Materials Science 89 (2014) 122–129
Acknowledgments
This work was supported by DOE Battelle Energy Alliance LLCwith INEST funding umbrella under Project No. 00108032 for Year2011, and 00121507 for Year 2012. The United States Governmentretains and the publisher, by accepting the article for publication,acknowledges that the United States Government retains a non-exclusive, paid-up, irrevocable, world-wide license to publish orreproduce the published form of this manuscript, or allow othersto do so, for United States Government purposes. The authors alsoappreciate the sponsorship of the Computational Materials andMechanics Laboratory (CMML) at Missouri S&T and the Centerfor Advanced Vehicular Systems (CAVS) at Mississippi StateUniversity.
Appendix A.
The model parameters, jmo, jof, Wmo and Wof, need to bematched to the interface physics (interface energy, r, and interfacethickness, 2k). If we neglect the elastic strain energy, and assumejr/j2@jð/Þ=@ /� jð/Þr2/, Eq. (22) becomes:
_/ ¼ �M/dFd/¼ M/ jð/Þr2/� @h
@/
� �: ðA1Þ
First, we perform the calculations for the metal–oxide interface.Following Kim et al. [96,97], by considering a thin film diffusioncouple with a planar interface (a metal–oxide diffusion couple)and at thermodynamic equilibrium state, Eq. (A1) becomes:
jmod2/eq
dx2 ¼@hðceq;/eqÞ
@/; ðA2Þ
where x is the distance in direction normal to the interface, andceq = c(/eq). By defining a function:
Hðc;/Þ ¼ hðc;/Þ � leqc c; ðA3Þ
where leqc is the chemical potential at a thermodynamic equilib-
rium state, so leqc is a constant, then:
@Hðceq;/eqÞ@ceq
¼ 0; ðA4Þ
so we have:
@hðceq;/eqÞ@/
¼dHðceq;/eqÞ
d/; ðA5Þ
and Eq. (A2) becomes:
jmod2/eq
dx2 ¼dHðceq;/eqÞ
d/eq: ðA6Þ
After multiplying both sides of (A6) by d/eq
dx and then integrating,the slope of the non-conserved phase field variable at the metal–oxide interface at equilibrium state becomes:
d/eq
dx¼
ffiffiffiffiffiffiffiffi2
jmo
s ffiffiffiffiffiffiffiffiffiffiffiffiffiffiffiffiffiffiffiffiffiffiffiffiffiffiffiffiffiffiHð/eqÞ � Hð0Þ
q; ðA7Þ
where Hð/eqÞ � Hð0Þ ¼ f cð/eqÞ; /eq
�þWmo gð/eqÞ, and contribution
of Wof is negligible. If we consider having just one interface in thesystem, the interface energy is [98]:
r ¼ jmo
Z þ1
�1
d/eq
dx
� �2
dx; ðA8Þ
By using (A7) and (A8), the interface energy for the metal–oxideinterface becomes:
rmo ¼ffiffiffiffiffiffiffiffiffi2j1
p Z 0:5
0
ffiffiffiffiffiffiffiffiffiffiffiffiffiffiffiffiffiffiffiffiffiffiffiffiffiffiffiffiffiffiHð/eqÞ � Hð0Þ
q/eq: ðA9Þ
The contribution of f(c(/eq), /eq) compare to W1g(/eq) is verysmall, by neglecting f(c(/eq), /eq), the metal–oxide interface energybecomes:
rmo ¼ 0:022ffiffiffiffiffiffiffiffiffiffiffiffiffiffiffiffiffiffiWmojmo
p: ðA10Þ
Similar to (A10), the oxide–fluid interface energy becomes:
rof ¼ 0:022ffiffiffiffiffiffiffiffiffiffiffiffiffiffiffiffiWof jof
q; ðA11Þ
If we consider / is in the range [0.05; 0.45] at the metal–oxideinterface, the metal–oxide interface thickness can be calculatedfrom Eq. (A7):
2kmo ¼ffiffiffiffiffiffiffiffijmo
2
r Z 0:45
0:05
d/eqffiffiffiffiffiffiffiffiffiffiffiffiffiffiffiffiffiffiffiffiffiffiffiffiffiffiffiffiffiffiHð/eqÞ � Hð0Þ
q ¼ 8:55ffiffiffiffiffiffiffiffiffiffijmo
Wmo
r; ðA12Þ
Similar to Eq. (A12), if we consider / is in the range [0.55; 0.95]at the oxide–fluid interface, the oxide–fluid interface thicknessbecomes:
2kof ¼ 8:55
ffiffiffiffiffiffiffiffiffijof
Wof
s: ðA13Þ
The model parameters, jmo, jof, Wmo and Wof, can be calculatedusing Eqs. (A10), (A11), (A12), (A13):
jmo ¼ 10:6 rmokmo; jof ¼ 10:6 rof kof ;
Wmo ¼ 194:3 rmo=kmo; and Wof ¼ 194:3 rof =kof :
References
[1] A.G. Evans, M.Y. He, J.W. Hutchinson, Prog. Mater. Sci. 46 (2001) 249271.[2] C.J. Rosa, J. Less-Common Met. 16 (1968) 173.[3] T. Ahmed, L.H. Keys, J. Less-Common Met. 39 (1975) 99.[4] Y. Nishino, A.R. Krauss, Y. Lin, D.M. Gruen, J. Nucl. Mater. 228 (1996) 346.[5] R.E. Pawel, J.J. Campbell, J. Electrochem. Soc. 128 (1981) 1999.[6] H.E. Evans, A.T. Donaldson, T.C. Gilmour, Oxid. Met. 52 (1999) 379.[7] T.J. Nijdam, W.G. Sloof, Acta Mater. 55 (2007) 5980.[8] T.J. Nijdam, W.G. Sloof, Acta Mater. 56 (2008) 4972.[9] H. El Kadiri, Y. Bienvenu, K. Solanki, M.F. Horstemeyer, P.T. Wang, Mater. Sci.
Eng. A 421 (1–2) (2006) 168.[10] G. Merceron, R. Molins, J.L. Strudel, Mater. High Temp. 17 (2000) 149.[11] M. Griffths, J. Nucl. Mater. 159 (1988) 190.[12] C. Lemaignan, A.T. Motta, Mater. Sci. Technol. B10 (1994).[13] K.N. Nikitin, V.N. Shishov, Prot. Met. Phys. Chem. Surf. 46 (2010) 261.[14] B. Cox, J. Nucl. Mater. 336 (2005) 331.[15] V. Busser, J. Desquines, S. Fouquet, M.C. Baietto, J.P. Mardon, Mater. Sci. Forum
595–598 (2008) 419.[16] W. Chen, L. Wang, S. Lu, J. Alloys Compd. 469 (2009) 142.[17] M. Grosse, M. Steinbrueck, E. Lehmann, P. Vontobel, Oxid. Met. 70 (2008) 149.[18] M. Grosse, E. Lehmann, M. Steinbrck, G. Khne, J. Nucl. Mater. 385 (2009) 339.[19] B. Cox, Y.M. Wong, J. Nucl. Mater. 270 (1999) 134.[20] M.B. Elmoselhi, B.D. Warr, S. Mclntyre, A Study of The Hydrogen Uptake
Mechanism in Zirconium Alloys, ASTM, West Conshohocken, PA, 1994.[21] M.B. Elmoselhi, J. Alloys Compd. 231 (1995) 716.[22] F.C. Larche, J.W. Cahn, Acta Metall. 21 (1973) 1051.[23] F.C. Larche, J.W. Cahn, Acta Metall. 26 (1978) 1579.[24] F.C. Larche, J.W. Cahn, Acta Metall. 26 (1978) 53.[25] F.C. Larche, J.W. Cahn, J. Res. 89 (1984) 467.[26] F.C. Larche, J.W. Cahn, Acta Metall. Mater. 40 (1992) 947.[27] F.C. Larche, J.W. Cahn, Acta Metall. 30 (1982) 1835.[28] B. Pieraggi, R.A. Rapp, Acta Metall. 36 (1988) 1281.[29] B. Pieraggi, R.A. Rapp, F.J.J. van Loo, J.P. Hirth, Acta Metall. Mater. 38 (1990)
1781.[30] B. Pieraggi, R.A. Rapp, J. Phys. IV 3 (C9) (1993) 99.[31] B. Pieraggi, R.A. Rapp, Mater. High Temp. 12 (1994) 229.[32] B. Pieraggi, R.A. Rapp, J.P. Hirth, Scr. Metall. Mater. 30 (1994) 1491.[33] B. Pieraggi, R.A. Rapp, J.P. Hirth, Oxid. Met. 44 (1995) 63.[34] Z. Suo, D.V. Kubair, A.G. Evans, D.R. Clarke, V.K. Tolpygo, Acta Mater. 51 (2003)
959.[35] Z. Suo, J. Appl. Mech. 71 (2004) 646.[36] H. El Kadiri, M.F. Horstemeyer, D.J. Bammann, J. Mech. Phys. Solid 56 (2008)
3392.[37] G.B. Stephenson, Acta Metall. 6 (1988) 2663.

M. Asle Zaeem, H. El Kadiri / Computational Materials Science 89 (2014) 122–129 129
[38] A. Galerie, Y. Wouters, M. Pijolat, F. Valdivieso, M. Soustelle, T. Magnin, D.Delafosse, C. Bosch, B. Bayle, Adv. Eng. Mater. 3 (2001) 555.
[39] B.A. Pint, Oxid. Met. 48 (1997) 303.[40] H. El Kadiri, R. Molins, Y. Bienvenu, M.F. Horstemeyer, Oxid. Met. 64 (2005) 63.[41] D. Zimmermann, V.K. Tolpygo, M. Ruhle, D.R. Clarke, Z. Metallkd. 94 (2003)
157.[42] B.A. Pint, I.G. Wright, W.Y. Lee, Y. Zhang, K. Pruessner, K.B. Alexander, Mater.
Sci. Eng. A 245 (1998) 201.[43] W.W. Mullins, Metall. Mater. Trans. A 26 (1995) 1917.[44] D.J. Srolovitz, Acta Metall. 37 (1989) 621.[45] J. Liang, Z. Suo, Interface Sci. 9 (2001) 93.[46] W.H. Yang, D.J. Srolovitz, Phys. Rev. Lett. 71 (1993) 1593.[47] N. Sridhar, J.M. Rickman, D.J. Srolovitz, Acta Mater. 45 (1997) 2715.[48] L. Angheluta, E. Jettestuen, J. Mathiesen, F. Renard, B. Jamtveit, Phys. Rev. Lett.
100 (9) (2008) 096105.[49] L. Angheluta, E. Jettestuen, J. Mathiesen, Phys. Rev. E 79 (2009) 031601.[50] L. Angheluta, J. Mathiesen, Eur. Phys. J. Spec. Top. 178 (2009) 123.[51] M. Asle Zaeem, H. El Kadiri, M.F. Horstemeyer, P.T. Wang, M. Cherkaoui, Mod.
Phys. Lett. B 25 (19) (2011) 1591.[52] H. El Kadiri, R. Molins, Y. Bienvenu, Mater. Sci. Forum 461 (2004) 1157.[53] H. El Kadiri, Y. Bienvenu, Mater. Sci. Forum 461 (2004) 1107.[54] H. El Kadiri, R. Molins, Y. Bienvenu, M.F. Horstemeyer, Oxid. Met. 64 (2005) 99.[55] B. Cox, in: Advances in Corrosion Science and Technology, 1976, p. 173.[56] C. Duriez, T. Dupont, B. Schmet, F. Enoch, J. Nucl. Mater. 380 (2008) 3045.[57] A. Yilmazbayhan, E. Breval, A.T. Motta, R.J. Comstock, J. Nucl. Mater. 349 (2006)
265.[58] J. Godlewski, P. Bouvier, G. Lucazeau, L. Fayette, ASTM STP 1132 (1991) 416.[59] J. Godlewski, J.P. Gros, M. Lambertin, J.F. Wadier, H. Wei-dinger, ASTM-STP
1132 (1991) 416.[60] J. Godlewski, J.P. Gros, M. Lambertin, J.F. Wadier, H. Weidinger, Raman
spectroscopy study of the tetragonal-to-monoclinic transition in zirconiumoxide scales and determination of overall oxygen diffusion by nuclearmicroanalysis of 18 O[C] zirconium in the nuclear industry, in: C.M. Eueken,A.M. Garde (Eds.), 9th Int. Symp. Technical report, ASTM-STP-1132, AmericanSociety for Testing and Materials, West Conshohocken, PA, 1991.
[61] J. Godlewski, How the tetragonal zirconia is stabilized in the oxide scale that isformed on a zirconium alloy corroded at 400 �C in steam, ASTM SpecialTechnical Publication, West Conshohocken, 1993, pp. 663–686. 1245.
[62] J.Y. Park, S.J. Yoo, B.K. Choi, Y.H. Jeong, J. Alloys Compd. 437 (2007) 274.[63] M. Martin, N. Lakshmi, U. Koops, H.I. Yoo, Z. Phys. Chem. 221 (2007) 1499.[64] M. Parise, I. Touet, O. Sicardy, Texture. Microstruct. 30 (1998) 247.[65] H. Steiner, J. Konys, M. Heck, Oxid. Met. 66 (2006) 3767.[66] L. Gosmain, C. Valot, D. Ciosmak, O. Sicardy, Solid State Ionics 141 (2001) 633.[67] R. Krishnamurthy, D.J. Srolovitz, Acta Mater. 51 (2003) 2171.
[68] R. Krishnamurthy, D.J. Srolovitz, Acta Mater. 52 (2004) 3761.[69] H. Zhou, J. Qu, M. Cherkaoui, Mech Mater. 42 (2010) 63.[70] H. Zhou, J. Qu, M. Cherkaoui, Comput. Mater. Sci. 48 (2010) 842.[71] K. Ammar, B. Appolaire, G. Cailletaud, F. Feyel, S. Forest, Comput. Mater. Sci. 45
(2009) 800.[72] M. Asle Zaeem, S.D. Mesarovic, J. Comput. Phys. 229 (2010) 9135.[73] M. Asle Zaeem, S.D. Mesarovic, Solid State Phenom. 150 (2009) 29.[74] M. Asle Zaeem, S.D. Mesarovic, Comput. Mater. Sci. 50 (2011) 1030.[75] M. Asle Zaeem, H. El Kadiri, S.D. Mesarovic, P.T. Wang, M.F. Horstemeyer. TMS
Supplemental Proc. 3 (2011) 341. (doi: 10.1002/9781118062173.ch42).[76] M. Asle Zaeem, H. El Kadiri, S.D. Mesarovic, M.F. Horstemeyer, P.T. Wang, J.
Phase Equilib. Diffus. 32 (4) (2011) 302.[77] M. Asle Zaeem, H. El Kadiri, M.F. Horstemeyer, M. Khafizov, Z. Utegulov, Curr.
Appl. Phys. 12 (2) (2012) 570.[78] B. Echebarria, R. Folch, A. Karma, M. Plapp, Phys. Rev. E 70 (2004) 061604.[79] S.M. McDeavitt, G.W. Billings, J.E. Indacochea, J. Mater. Sci. 37 (2002) 3765.[80] F.C. Larche, J.W. Cahn, Acta Metall. 33 (1985) 331.[81] A.R. Denton, N.W. Ashcroft, Phys. Rev. A 43 (1991) 3161.[82] K. Binder, Phys. Rev. B 8 (1973) 3423.[83] R.A. Versaci, M. Ipohorski, Temperature Dependence of Lattice Parameters of
Zirconium, Comision Nacional De Energia Atomica, Buenos Aires, 1991.[84] I.G. Ritchie, A. Atrens, J. Nucl. Mater. 67 (1977) 254.[85] F.J. Keneshea, D.L. Douglass, Oxid. Met. 3 (1971) 1.[86] J.M. Yos, Transport Properties of Nitrogen, Hydrogen, Oxygen, and Air To
30,000 K, Research and Advanced Development Division AVCO Corporation,Wilmington, Massachusetts, 1963.
[87] E.S. Fisher, C.J. Renken, Phys. Rev. 135 (1964) 1964.[88] E. Yeugo Fogaing, Y. Lorgouillox, M. Huger, C.P. Gault, J. Mater. Sci. 41 (2006)
7663.[89] A.P. Mirgorodsky, M.B. Smirnov, P.E. Quintard, Phys. Rev. B 55 (1) (1997) 19.[90] E.H. Kisi, C.J. Howard, J. Am. Ceram. Soc. 81 (1998) 1682.[91] COMSOL Multiphysics User’s Guide, COMSOL Inc, 2012.[92] P. Barberis, Rebeyrolle, J.J. Vermoyal, V. Chabretou, P. Vassault, J. ASTM Int. 5
(2008) JAI101124.[93] M. Mamivand, M. Asle Zaeem, H. El Kadiri, L.Q. Chen, Acta Mater. 61 (14)
(2013) 5223.[94] M. Mamivand, M. Asle Zaeem, H. El Kadiri, Comput. Mater. Sci. 77 (2013) 304.[95] H. El Kadiri, Z.N. Utegulov, M. Khafzov, M. Asle Zaeem, M. Mamivand, A.L.
Oppedal, K. Enakoutsab, M. Cherkaoui, R.H. Graham, A. Arockiasamy, ActaMater. 61 (2013) 3923.
[96] S.G. Kim, W.T. Kim, T. Suzuki, Phys. Rev. E 58 (1998) 3316.[97] S.G. Kim, W.T. Kim, T. Suzuki, Phys. Rev. E 60 (1999) 7186.[98] A.A. Wheeler, W.J. Boettinger, G.B. McFadden, Phys. Rev. E 47 (1993) 1893.