an effective mobile sensor control method for sparse sensor
TRANSCRIPT

Sensors 2009, 9, 327-354; DOI: 10.3390/s90100327
sensors ISSN 1424-8220
www.mdpi.com/journal/sensors
Article
An Effective Mobile Sensor Control Method for Sparse Sensor Networks
Kriengsak Treeprapin *, Akimitsu Kanzaki, Takahiro Hara and Shojiro Nishio
Dept. of Multimedia Eng., Grad. Sch. of Information Science and Technology, Osaka Univ. 1-5
Yamadaoka, Suita, Osaka 565-0871, Japan; E-Mails: [email protected]; [email protected]
u.ac.jp; [email protected]
* Author to whom correspondence should be addressed; E-Mail: [email protected]
u.ac.jp; Tel.: +81-6-6879-4513; Fax: +81-6-6879-4514
Received: 19 September 2008; in revised form: 25 November 2008 / Accepted: 13 December 2008 /
Published: 8 January 2009
Abstract: In this paper, we propose an effective mobile sensor control method, named
DATFM (Data Acquisition and Transmission with Fixed and Mobile node) for sparse
sensor networks. DATFM uses two types of sensor nodes, fixed node and mobile node. The
data acquired by nodes are accumulated on a fixed node before being transferred to the
sink node. In addition, DATFM transfers the accumulated data efficiently by constructing
a communication route of multiple mobile nodes between fixed nodes. We also conduct
simulation experiments to evaluate the performance of DATFM.
Keywords: Mobile sensor; sparse area; route construction.
1. Introduction
Recent advances in wireless communication technologies have led to an increasing interest in ad
hoc networks that are constructed of only wireless terminals that play the role of a router. Especially,
sensor networks have emerged as an important application of ad hoc networks. Due to the ability to
construct a large-scale sensing system by cooperative behaviors of multiple sensor nodes, sensor
networks are expected to be applied to many applications such as environmental monitoring,
investigation of ecological system and building management.
OPEN ACCESS

Sensors 2009, 9
328
In these areas there are some applications where it is difficult to deploy a large number of sensor
nodes such as disaster sites, planetary exploration, polluted areas and underwater [1-3]. In such
environments, the deployment of sensor nodes becomes too sparse to achieve sufficient sensing and
data transfer. For example, in a planetary or underwater exploration, a large number (e.g. hundreds or
thousands) of nodes cannot be deployed because of space and cost constrains. Moreover, in a polluted
plant, the sensing area is too large to deploy a sufficient number of nodes. Although some studies
assume applications where a large number of nodes are deployed from the air (e.g. from airplanes or
helicopters), such a deployment becomes impossible in a building or under the heap of ruins.
Furthermore, long range radio waves cannot improve the connectivity in these applications, since it is
affected by the ambient surrounding such as obstacles and landscape.
On the other hand, with the development of robotics technologies in recent years, there have been
many studies on sensor nodes with a moving facility (mobile sensors). Mobile sensors are well suited
for a sparse network since a large area can be monitored with a small number of sensor nodes. In this
paper, we call sensor networks which fully or partially include mobile sensors as mobile sensor
networks.
Although many data transfer methods which utilize mobile sensors have been proposed [4-6], these
methods assume an environment where the density of nodes is high. Thus, these methods cannot work
well in a sparse network we assume in this paper. On the other hand, in [7-9], the authors proposed a
data transfer method with mobile sensors that can transfer data even in a sparse network. However,
since data transfer is performed mainly by the movement of mobile sensors, the performance of
sensing and data gathering becomes significantly low especially in a sparse network.
In order to reduce the movement of mobile sensors, it is effective to construct a communication
route for transmitting data to the sink node by using multiple mobile sensors. However, in a sparse
network, it is difficult to construct a communication route due to the low connectivity of mobile
sensors. Therefore, an effective mobile sensor control method is necessary to construct a
communication route in a sparse network.
In this paper, we propose DATFM (Data Acquisition and Transmission with Fixed and Mobile
node), which is an effective mobile sensor control method for sparse sensor networks to improve the
efficiency of sensing and data transfer. In order to achieve effective control of mobile sensors,
DATFM uses two types of sensor nodes, fixed node and mobile node. A fixed node has two roles,
temporarily accumulating data acquired by nodes and constructing a communication route between
fixed nodes for transmitting the accumulated data. By using the fixed nodes, DATFM can effectively
control the behaviors of mobile nodes, and thus, effective sensing and data transfer can be achieved
even in a sparse network.
The reminder of this paper is organized as follows. In Section 2, we briefly introduce the system
model assumed in this paper and the conventional data transfer methods. In Section 3, we explain our
proposed method. The results of simulation experiments are presented in Section 4. Finally, we
conclude this paper in Section 5.

Sensors 2009, 9
329
2. System model and related work
In this section, we introduce the system model assumed in this paper and the conventional studies
on data transfer in sparse sensor networks.
2.1. System model
In this paper, we assume an application which monitors a vast area with a small number of nodes.
For example, in an investigation of the ocean floor or the planetary, detection of the mineral vein or
undiscovered resources in an unexplored area, and observation of the toxic gas in a disaster site, a vast
area should be monitored by a small number of nodes. To monitor the whole area with a small number
of nodes, mobile sensors are introduced into the network. In addition, we assume that each sensor
acquires data whose sizes are relatively large such as pictures or movies.
2.2. Related work
Until now, many data transfer methods in mobile sensor networks have been proposed [4-12]. In [4,
6], a simple and efficient data transfer method named DFT-MSN (Delay/Fault Tolerant Mobile Sensor
Network) has been proposed. In DFT-MSN, mobile sensors are classified into two types of nodes,
mobile sensor nodes and high-end sink nodes. The high-end sink nodes are deployed at strategic
locations where mobile sensor nodes visit with high probability. In addition, they may directly connect
to the sink node all the time by changing their transmission power if necessary. Each mobile sensor
node acquires data and sends it to a nearby high-end sink node by flooding with a probability in order
to prevent duplication of transmitted data. After that, the high-end sink node transmits the received
data to the sink node. This method assumes that each high-end sink node has to connect to the sink
node all the time. As mentioned in Section 1, this assumption cannot be applied to the applications
assumed in this paper.
In [5], the authors have proposed an algorithm which governs the behaviors of nodes in order to
minimize the total energy consumption for moving and communication. In this algorithm, all nodes
have an associated clock cycling and each node determines with a probability whether it acquires data
or transmits data acquired by other nodes in every cycle. In the latter case, the node moves to construct
a communication route between the sink node and a node that determines to transmit data. By doing so,
this algorithm can construct the communication route to the sink node and transfer the acquired data
by autonomous behaviors of nodes. However, this algorithm may not work in a sparse network
because it becomes difficult to construct a communication route due to the low connectivity of nodes.
In [10], the authors assumed an environment in which mobile sensors randomly move around in an
area without any control and proposed a method to determine a mobile sensor for transferring data to
the sink node. In this method, each mobile sensor periodically sends information on its location to
nearby sensors. Using this information, each mobile sensor predicts the locations of other sensors in
the future and determines a mobile sensor to send the data. However, since mobile sensors have to
periodically exchange information on their locations, this method may not work in a sparse network
due to the low connectivity between mobile sensors.

Sensors 2009, 9
330
In [11], the authors proposed a clustering algorithm which divides an area into several zones and
clusters mobile sensors based on the divided zones. In this method, each mobile sensor periodically
sends information on the frequency that it traverses the borders between zones. The mobile sensor with
the smallest frequency among all sensors in a zone is elected as the cluster head. The cluster head in
each cluster acts as a router in the network and transmits the data acquired in the corresponding cluster
to the cluster head in an adjacent zone to which the multi-hop communication route is the most stable.
This algorithm also has to periodically exchange information in order to elect the cluster heads. In
addition, the data is transferred to the sink node via multi-hop communication routes between cluster
heads. Thus, this algorithm may not work in a sparse network.
In [12], a data gathering method considering a sparse network has been proposed. This method
utilizes a broadcasting system to control the movement of mobile sensors. Specifically, the information
on the locations of mobile sensors connected with the sink node by single or multi-hop communication
route is broadcasted to all mobile sensors. By using this broadcasted information, each mobile sensor
can adjust the moving destination in order to decrease the moving distance to connect with the sink
node or a mobile sensor which has already connected with the sink node. Hereby, data gathering from
all mobile sensors can be achieved with small moving costs. However, since this method needs a
broadcasting system, it is difficult to be applied to environments we assume. For example, in a
building or underwater, it is generally difficult for mobile sensors to surely receive broadcasted
information.
In [7, 8], RAMOS (Routing Assisted by Moving Objects) has been proposed as a data transfer
method with mobile sensors. RAMOS defines several modes (classified into three categories listed
below) for each sensor. Each sensor autonomously controls its behavior by changing its mode
according to the existence of data.
Category 1: Fixed
A sensor does a sensing operation without moving. If a neighboring sensor which is within the
communication range locates closer to the sink node, the sensor transmits the data to the
neighboring sensor.
Category 2: Moving
A sensor does a sensing operation and transfers the data by moving to the sink node.
Category 3: Transmitting
A sensor moves around the area to find other sensors that hold data. When it connects to such a
sensor, it receives and transfers the data by moving to the sink node.
In RAMOS, each sensor transfers acquired data to the sink node by changing its mode
autonomously. However, since each sensor has to move to the sink node to transfer acquired data in
most cases, moving cost much increases. Moreover, in a sparse network, since each sensor has few
opportunities to connect to other sensors, the efficiency of sensing and data transfer becomes low.
In [9], the authors have proposed a sensing method using uncoordinated mobile nodes (UM nodes).
In this method, each UM node acquires data until the amount of the acquired data reaches the memory
capacity. Moreover, each UM node exchanges information on the acquired data with a connected UM
node and deletes the data which were acquired by the connected node at the same location and time.
By doing so, duplicated sensing (sensing a location by multiple nodes) can be suppressed and more
data can be accumulated in the memory space of a UM node. In addition, this method proposes two

Sensors 2009, 9
331
mobility models of UM nodes, the multi-homed random way point model and the controlled mobile
nodes model. In multi-homed random way point model, each UM node randomly chooses the
destination and moves there. After reached the destination, it stochastically determines whether it
returns to the sink node or it moves to a new destination. However, since each UM node selects the
destination randomly from the whole area, the moving distance to the destination tends to increase.
Thus, the efficiency of sensing decreases especially in a wide area. On the other hand, in the controlled
mobile node model, the moving path of each UM node is determined in advance and each node does a
sensing operation while moving its path. Furthermore, by setting moving paths of UM nodes to reduce
unnecessary movement, the efficiency of sensing can be further improved. However, it is necessary to
calculate the moving paths of all UM nodes in advance. Thus, the computational cost becomes very
large. Moreover, this model cannot handle dynamic changes of conditions such as the existence of
obstacles. Thus, moving paths cannot be determined in an unknown or highly dynamic area (e.g.
planetary or underwater).
3. DATFM (Data Acquisition and Transmission with Fixed and Mobile node)
In this section, we explain our proposed mobile sensor control method, DATFM.
3.1. Assumptions
In this paper, we assume a sensor network in a wide area which is constructed by a small number of
mobile sensors. The data acquired by sensor nodes are transferred to the sink node located at a corner
of the area similar to the assumption in many conventional works such as target detecting, tracking and
environment monitoring [9, 13-14]. Each node has a unique identifier in the network. In addition, we
assume that all nodes have the same sensor and radio devices. Thus, the sensing and wireless
communication ranges are same among all nodes.
Following the conventional works [4-12], we assume that there are no obstacles in the area. There
are two types of sensor nodes, fixed node and mobile node (the sink node is classified as a fixed node).
Each node acquires its present location by using GPS or other location detection methods [14-16].
Moreover, all nodes know the locations of all fixed nodes. This assumption is valid in applications
where the locations of fixed nodes are strategically decided before deploying them.
3.1.1. Fixed node
A fixed node does not move. It has larger memory capacity, compared with a mobile node, and
accumulates data acquired by itself and from other nodes. In addition, it controls nearby mobile nodes
to construct a communication route when transmitting the accumulated data toward the sink node.
Furthermore, it holds information on nearby mobile nodes that directly connected to it (entered the
wireless communication range) for a certain period; the information includes the identifier of each
mobile node, the time when the node connected to it, the fixed node that the node goes to next, and the
next destination (sensing point or location of the next fixed node to go) of the node. Table 1 shows an
example of the information held by a fixed node. Each fixed node sets the validity period for each

Sensors 2009, 9
332
record in the information (each row in Table 1), and removes it when the validity period expires. Here,
the validity period for mobile node i is calculated by the following equation:
m
areai
SVP
. (1)
In the above equation, areaS and m respectively denote the area size and the velocity of mobile nodes
in the sensing mode (described in the next subsection). By using this information, each fixed node
predicts where each mobile node exists.
Table 1. Information of mobile nodes held by a fixed node.
Node ID Connected time Next fixed node Destination
a 1,232 E (832,324)
c 1,266 F (542,255)
f 1,335 E (832,324)
i 1,552 C (754,743)
o 1,632 C (754,743)
3.1.2. Mobile node
A mobile node moves around the area. In addition, it has the following three modes:
Sensing mode (SM): A node sets a destination randomly within the area and moves there. After
reaching the destination, it does a sensing operation and decides its new destination.
Collecting mode (CM): When a node in SM receives a route request packet (RReq) from a fixed node,
it changes its mode into collecting mode (CM). In CM, a node moves faster than that in SM in order to
collect other mobile nodes to construct a communication route.
Transmission mode (TM): When a node in SM receives a route construction request packet (RCReq)
from a fixed node or a mobile node in CM, it changes its mode into transmission mode (TM).In TM, a
node constructs a route and transfers the data.
Figure 1 shows the mode transition of a mobile node.
Figure 1. Mode transition of a mobile node.
Sensing Mode (SM)
Collecting Mode (CM)
Transmission Mode(TM)
Receives RReqfrom a fixed node
Receives RCReqfrom a fixed node or node in CM Completes searching and
returns to the fixed node that has sent RReq
Receives RRelfrom a fixed node

Sensors 2009, 9
333
3.2. Moving strategy of mobile nodes
DATFM divides the area into several regions based on a Voronoi diagram in which fixed nodes are
the site points. Here, the Voronoi diagram of a set of point partitions the area into convex polygons
that consist of the vertical bisectors of the points. Every point in a polygon is closer to the site point in
the corresponding polygon than to any other site points. In DATFM, each site point (a fixed node) has
charge of the corresponding region. In other words, each fixed node has a role for collecting data
acquired in the region the fixed node exists. We call the region for each fixed node as its territory.
Figure 2 shows an example of Voronoi diagram and divided territories
A mobile node basically sets its mode as SM and moves to the selected destination by the following
steps:
1. It moves to connect to the nearest fixed node (i.e. the fixed node in the current territory) and
transmits its acquired data.
2. It calculates the distances between its destination and all fixed nodes in the adjacent territories
and moves to the fixed node that is the nearest to its destination. In addition, it sends information
on its identifier, its next fixed node to move, and its destination to the connecting fixed node
before moving to the next fixed node. Figure 3 shows an example to choose the next fixed node
to move. After transmitting its acquired data to fixed node A, the mobile node a calculates the
distances between its destination and fixed nodes B, C, and D, which are in territories adjacent to
A's territory. After that, it chooses fixed node C that is the nearest to the destination and moves
there. These procedures are repeated until the mobile node connects to the fixed node that has
charge of the territory which contains the destination.
3. It moves to its destination and does a sensing operation.
Figure 2. Dividing the area.
:fixed node
:sink node
D
A
F
B
E
C
A’s territory
This moving strategy enables each fixed node to have many opportunities to connect to mobile
nodes. Moreover, each fixed node can predict the locations of the recently connected mobile nodes by
using the information shown in Table 1. Therefore, this strategy makes it easy for fixed nodes to
collect mobile nodes in the data transmission phase described in the next subsection.

Sensors 2009, 9
334
3.3. Data Transmission
A fixed node starts to transmit the accumulated data when the amount of the accumulated data in its
memory exceeds the predetermined threshold. In what follows, we explain the procedures for
transferring the accumulated data to the sink node.
Figure 3. Moving route of a mobile node.
: mobile node: moving route
C
E
B
F
A
D
destination
communication range
a
505[m]
320[m]387[m]
3.3.1. Selection of the next fixed node
The fixed node that starts data transmission (the source node) selects a next fixed node to transmit
the data (the destination node) by using the Delaunay triangulation. The Delaunay triangulation can be
performed by connecting the site points in the Voronoi diagram whose polygons share a common edge.
The source node creates Delaunay triangles which include itself, and selects another fixed node that is
a vertex of a Delaunay triangle and is the nearest to the sink node. This node is set as the destination
node. When the sink node is a vertex of the created Delaunay triangles, the source node selects the
sink node as the destination. Figure 4 shows an example of selecting the destination node. Fixed node
A selects the destination node from fixed nodes B, C and D. In this figure, since fixed node C is the
nearest to the sink node, it becomes the destination node. On the other hand, when fixed node D starts
data transmission, it selects the sink node as the destination node since the sink node is a vertex of the
created Delaunay triangles.
3.3.2. Request for collecting mobile nodes
The source node firstly checks whether a communication route to the destination node exists. If it
does, the source node transmits the data to the destination node via the communication route.
Otherwise, the source node sends RReq to a mobile node that firstly connects to it. If multiple mobile
nodes already connect to the source node, the source node randomly selects one of them and sends
RReq to it. The mobile node that receives the RReq changes its mode into CM. Here, a RReq includes the identifiers of the source and destination nodes, the required number of mobile nodes reqN , and the

Sensors 2009, 9
335
time limit limT for collecting mobile nodes. reqN is the number of mobile nodes which is required to
construct the communication route, and is calculated by the following equation:
Figure 4. Selection of the next fixed node.
C
E
B
F
A
D
C
E
B
F
A
D
srcL and dstL are the locations of the source and destination nodes. comR is the wireless
communication range. limT is the time that terminates collecting mobile nodes. The detail of the time
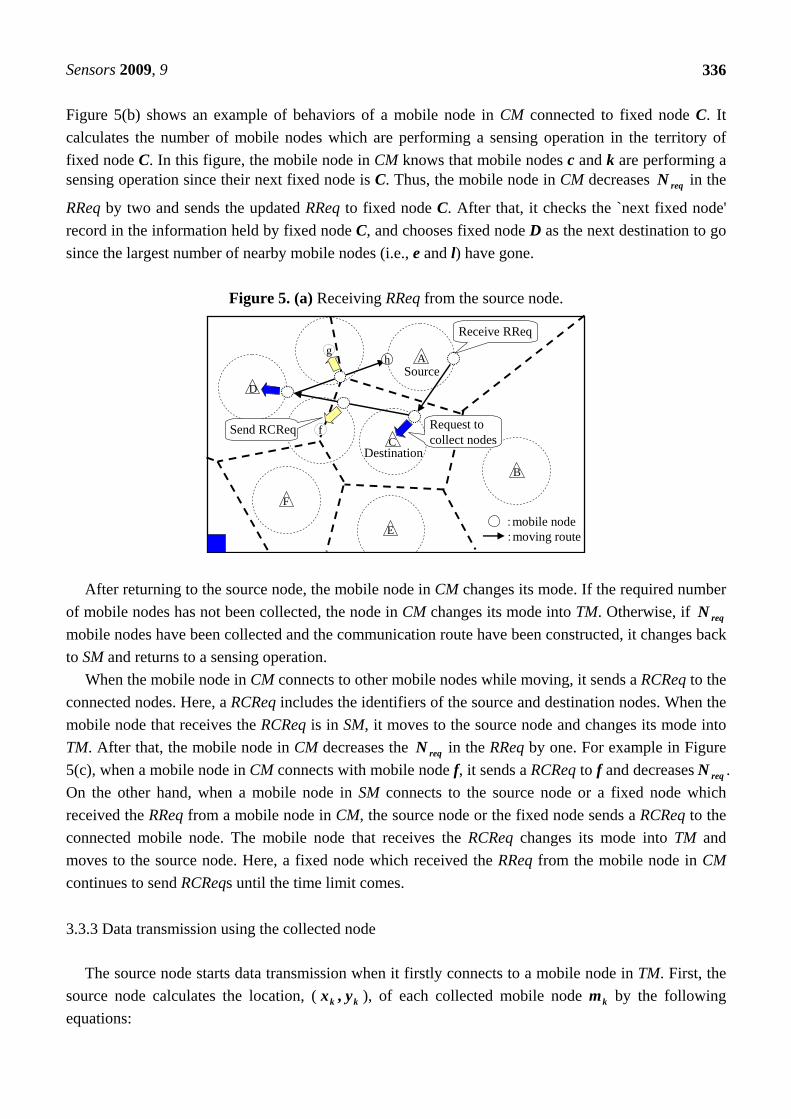
limit is described in Subsection 3.3.4. Figure 5(a) shows an example of RReq sent from the source
node A.
The mobile node in CM travels around the nearby fixed nodes to collect the other mobile nodes.
First, the mobile node in CM moves to the destination node. When the mobile node connects with a
fixed node, it does the following procedures:
1. It calculates the number of mobile nodes which are performing a sensing operation in the
territory of the connected fixed node. This can be done by checking the `next destination' record
in the information held by the fixed node. Specifically, when the `next destination' is in the
territory of the fixed node, the corresponding mobile node is performing the sensing operation in
the territory. 2. It decreases reqN in the RReq by that calculated number of nodes. This is because the mobile
nodes performing a sensing operation in a territory will connect to the fixed node in the territory
after the sensing operation. As described later, those mobile nodes will receive RCReq from the
fixed node, and move to the source node to help data transmission.
3. It sends the updated RReq to the fixed node.
4. It chooses the next fixed node to go. Specifically, it checks the `next fixed node' record in the
information held by the fixed node, and chooses one to which the largest number of mobile
nodes have gone, and which it has not visited yet.
Here, the mobile node in CM goes back to the source node when at least one of the following
conditions is satisfied:
The next fixed node to go cannot be found. reqN in RReq becomes zero.
The time limit has come.
com
dstsrcreq R
NLL
. (2)
Sensors 2009, 9
336
Figure 5(b) shows an example of behaviors of a mobile node in CM connected to fixed node C. It
calculates the number of mobile nodes which are performing a sensing operation in the territory of
fixed node C. In this figure, the mobile node in CM knows that mobile nodes c and k are performing a sensing operation since their next fixed node is C. Thus, the mobile node in CM decreases reqN in the
RReq by two and sends the updated RReq to fixed node C. After that, it checks the `next fixed node'
record in the information held by fixed node C, and chooses fixed node D as the next destination to go
since the largest number of nearby mobile nodes (i.e., e and l) have gone.
Figure 5. (a) Receiving RReq from the source node.
:mobile node:moving route
Source
Destination
Receive RReq
C
E
B
g
F
A
D
Request tocollect nodes
fSend RCReq
h
After returning to the source node, the mobile node in CM changes its mode. If the required number
of mobile nodes has not been collected, the node in CM changes its mode into TM. Otherwise, if reqN
mobile nodes have been collected and the communication route have been constructed, it changes back
to SM and returns to a sensing operation.
When the mobile node in CM connects to other mobile nodes while moving, it sends a RCReq to the
connected nodes. Here, a RCReq includes the identifiers of the source and destination nodes. When the
mobile node that receives the RCReq is in SM, it moves to the source node and changes its mode into
TM. After that, the mobile node in CM decreases the reqN in the RReq by one. For example in Figure
5(c), when a mobile node in CM connects with mobile node f, it sends a RCReq to f and decreases reqN .
On the other hand, when a mobile node in SM connects to the source node or a fixed node which
received the RReq from a mobile node in CM, the source node or the fixed node sends a RCReq to the
connected mobile node. The mobile node that receives the RCReq changes its mode into TM and
moves to the source node. Here, a fixed node which received the RReq from the mobile node in CM
continues to send RCReqs until the time limit comes.
3.3.3 Data transmission using the collected node
The source node starts data transmission when it firstly connects to a mobile node in TM. First, the
source node calculates the location, ( kk yx , ), of each collected mobile node km by the following
equations:

Sensors 2009, 9
337
Figure 5. (b) Sending RReq to connected fixed node.
DestinationC
B
gA
D
f
SourceNode
IDConnected
timeNext
fixed nodeDestination
a 732 A (832,234)
c 821 C (562,544)
k 856 C (542,456)
f 870 B (923,234)
e 959 D (235,748)
l 988 D (235,748)
Node ID
Connected time
Next fixed node
Destination
a 732 A (832,234)
c 821 C (562,544)
k 856 C (542,456)
f 870 B (923,234)
e 959 D (235,748)
l 988 D (235,748)
RReq
NreqDestination Tlim
2C 1,200
Source
A
NreqDestination Tlim
2C 1,200
Source
A
Figure 5. (c) Sending RCReq to connected mobile node.
C
B
gA
D
f
Source
Destination
RCReq
Destination
C
Source
A
Destination
C
Source
ANreqDestination Tlim
1C 1,200
Source
A
NreqDestination Tlim
1C 1,200
Source
A
Here, n is the number of collected mobile nodes and each of the collected mobile nodes is assigned an identifier ( nmmm ,,, 21 ). ( kk yx , ) and ( dstdst yx , ) are the locations of the source and destination
nodes. Then, the source node sends information on the calculated locations to the collected mobile
nodes. The collected mobile nodes move to their locations. Figure 6 shows an example of calculating
the locations of mobile nodes when two mobile nodes are collected. Here, if the sufficient number of mobile nodes are collected, the communication route between the
source and destination nodes is constructed. Otherwise, if the number of collected mobile nodes is
smaller than the required number reqN , the source node transmits the data by using train transmission.
In train transmission, data are transferred by cooperative movement and communication among the
collected mobile nodes. Specifically, the collected mobile nodes firstly form a line segment by the
above mentioned process. After that, the collected nodes repeat the following procedures:
)(1 srcdstsrck xx
n
kxx
, (3)
)(1 srcdstsrck yy
n
kyy
. (4)

Sensors 2009, 9
338
1. The source node transmits a part of the accumulated data so that the amount of the transmitted
data equals to the sum of memory spaces of the collected nodes.
Figure 6. Construction of a train.
A
C
Source node
Destination node
(500,1000)
(400,500)
(480,900)
900100050014
11000
48050040014
1500
1
1
y
x1m1m
(xd,yd) = (400,500)
(xs,ys) = (500,1000)
Requires 4 mobile nodes
A
C
(460,800)
2m
2m
800100050014
21000
46050040014
2500
2
2
y
x
Figure 7. Train transmission.
Source node
Destination node
time
a
b
b
a
a
b
ba
123456 3456 3456 56
12 1234
1
2
3
4
….
….
Sending buffer
Recieving buffer
Train
1
2
3
4
12
2. The collected nodes move toward the destination node with keeping same distances between
adjacent nodes, and stop when the node at the other end of the line segment connects to the
destination node.
3. The collected nodes transmit all the data to the destination node through the line segment
(communication route), and then, move back toward the source node.
Figure 7 shows an example of train transmission with two mobile nodes.
Moreover, when another mobile node in TM connects to the source node after started the train
transmission, the source node adds the connected mobile node to the `train'. Specifically, the source

Sensors 2009, 9
339
node increments the identifiers of mobile nodes (i.e. 1 kk mm ) in the current train and assigns
identifier 1m to the newly connected node. Then, the source node recalculates the location of each
mobile node and sends information on the recalculated locations to all the collected mobile nodes. The
mobile nodes which received the information move to their new locations and restart the train
transmission. Figure 8 shows an example when another mobile node connects the source node. In this figure, the newly connected node is assigned identifier 1m and added to the train.
Figure 8. Reconstruction of a train.
A
C
Source node
Destination node
(500,1000)
(400,500)
(480,900)
(xd,yd) = (400,500)
(xs,ys) = (500,1000)
C
(460,800)
700100050014
31000
44050040014
3500
3
3
y
x
(440,700)3m
1m
2m
A
1m
2m
m1 m2
m2 m3
Here, when the number of the collected nodes reaches reqN , the completed communication route is
constructed. In that case, the source node stops the train transmission and start transmitting the data via
the constructed route. Moreover, the source node sends a route release packet (RRel) to nodes in TM
which newly connects after constructed the complete communication route. The mobile nodes that
received the RRel change their mode into SM and restart moving to their destinations.
Figure 9. Release a communication route.
ASource node
Destination node
1m
2m
A
3m
4m
C C4m3m
1m 2m
Next fixed node
C
RRel
Next fixed node
A
Next fixed node
A
RRel
After transmitting all the accumulated data, the source node sends a RRel to each mobile node in
TM. A RRel includes the information on the next fixed node to go. Each mobile node that receives the
RRel changes its mode into SM and moves to the destination specified in the RRel. Here, the source
node sets the next fixed node for the half of mobile nodes in TM which are far from itself as the
destination node of the data transmission. This helps the destination node to collect mobile nodes for

Sensors 2009, 9
340
the next data transmission since the amount of data in its memory space may exceed the threshold. On
the other hand, for each of the other mobile nodes, the source node sets the next fixed node as itself.
Figure 9 shows an example when the source node A has transmitted all the accumulated data to the
destination node C. The source node A sends RRels including C as the next fixed node to mobile nodes
3m and 4m . It also sends RRels including itself as the next fixed node to mobile nodes 1m and 2m .
After that, mobile nodes 1m and 2m restart to move to the destination after connected to fixed node A.
3.3.4. Decision of the time limit
In DATFM, the source node sets the time limit and notifies it to the mobile node in CM and other
nearby fixed nodes. As described in Subsection 3.3.2, this value is used for terminating collecting
mobile nodes for the corresponding data transmission. Here, in order to set the appropriate time limit,
we use the estimated time elapsed to collect the required number of mobile nodes.
In order to calculate the time limit, we assume that the following parameters are given:
iL : the location of fixed node i.
iT : the territory of fixed node i.
id : the location of the destination (sensing point) of a mobile node in iT (i.e. id iT ).
areaS : the size of the whole area (i.e. i
iareaS T ).
m : the velocity of mobile nodes in SM.
acqT : the time for a sensing operation at a destination (sensing point).
FS : the set of fixed nodes in the whole area.
movN : the number of mobile nodes in the whole area.
ireqN : the required number of mobile nodes to construct the completed communication route from
fixed node i. Let us denote
iestT as the estimated time in which the required number of mobile nodes connect to
fixed node i. Then, the time limit of fixed node i (i
Tlim ) is calculated by the following equation:
ii estcurrent TTT lim . (5) Here, currentT is the current time. In what follows, we describe how to calculate
iestT .
Figure 10. The operations in a sensing cycle.
:mobile node:moving route
C
E
B
F
A
D
1) departs from a fixed node
2) moves to the destination
4) returns to the fixed node
3) performs the sensing operation
FL
BL
BF LL
Bd
Sensors 2009, 9
341
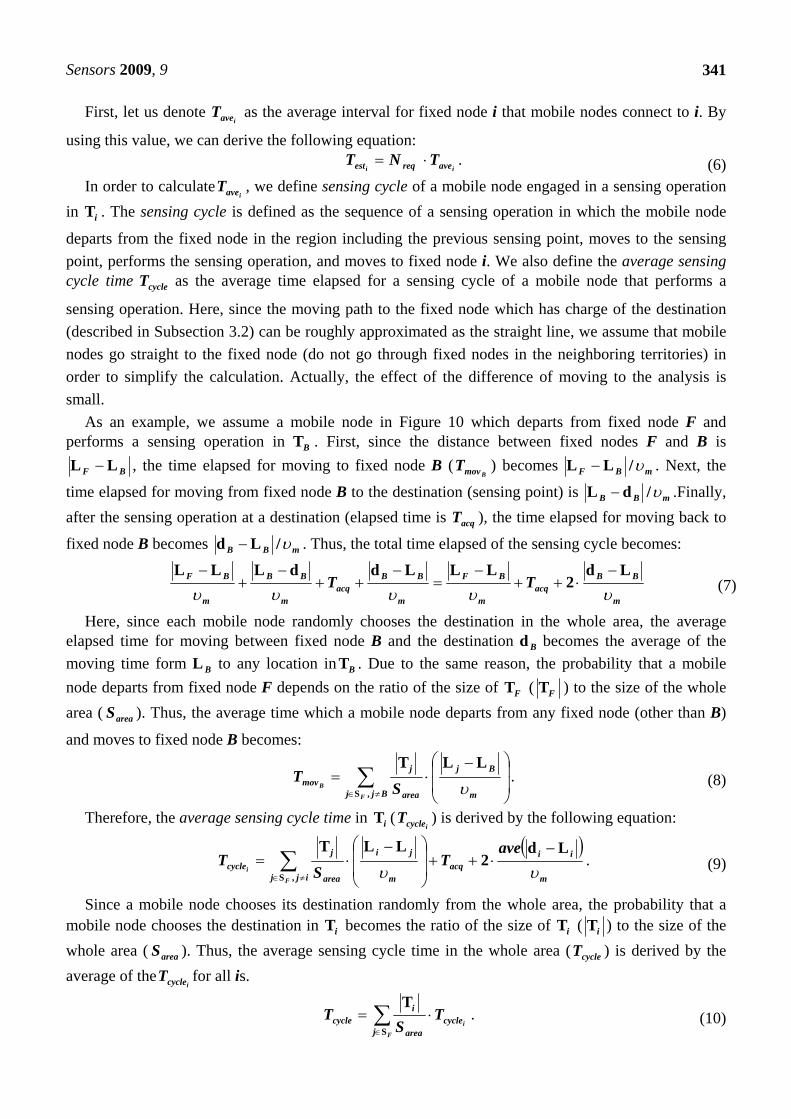
First, let us denote iaveT as the average interval for fixed node i that mobile nodes connect to i. By
using this value, we can derive the following equation:
ii avereqest TNT . (6) In order to calculate
iaveT , we define sensing cycle of a mobile node engaged in a sensing operation
in iT . The sensing cycle is defined as the sequence of a sensing operation in which the mobile node
departs from the fixed node in the region including the previous sensing point, moves to the sensing
point, performs the sensing operation, and moves to fixed node i. We also define the average sensing cycle time cycleT as the average time elapsed for a sensing cycle of a mobile node that performs a
sensing operation. Here, since the moving path to the fixed node which has charge of the destination
(described in Subsection 3.2) can be roughly approximated as the straight line, we assume that mobile
nodes go straight to the fixed node (do not go through fixed nodes in the neighboring territories) in
order to simplify the calculation. Actually, the effect of the difference of moving to the analysis is
small.
As an example, we assume a mobile node in Figure 10 which departs from fixed node F and performs a sensing operation in BT . First, since the distance between fixed nodes F and B is
BF LL , the time elapsed for moving to fixed node B (BmovT ) becomes mBF /LL . Next, the
time elapsed for moving from fixed node B to the destination (sensing point) is mBB /dL .Finally,
after the sensing operation at a destination (elapsed time is acqT ), the time elapsed for moving back to
fixed node B becomes mBB /Ld . Thus, the total time elapsed of the sensing cycle becomes:
m
BBacq
m
BF
m
BBacq
m
BB
m
BF TT
Ld2
LLLddLLL
(7)
Here, since each mobile node randomly chooses the destination in the whole area, the average elapsed time for moving between fixed node B and the destination Bd becomes the average of the
moving time form BL to any location in BT . Due to the same reason, the probability that a mobile
node departs from fixed node F depends on the ratio of the size of FT ( FT ) to the size of the whole
area ( areaS ). Thus, the average time which a mobile node departs from any fixed node (other than B)
and moves to fixed node B becomes:
Bjj m
Bj
area
j
mov
F
B ST
,S
LLT
. (8)
Therefore, the average sensing cycle time in iT (icycleT ) is derived by the following equation:
ijj m
iiacq
m
ji
area
j
cycle
F
i
aveT
ST
,S
Ld2
LLT
. (9)
Since a mobile node chooses its destination randomly from the whole area, the probability that a mobile node chooses the destination in iT becomes the ratio of the size of iT ( iT ) to the size of the
whole area ( areaS ). Thus, the average sensing cycle time in the whole area ( cycleT ) is derived by the
average of theicycleT for all is.
F
ij
cyclearea
icycle T
ST
S
T. (10)

Sensors 2009, 9
342
Since the mobile node connects to the fixed node after the sensing operation, all mobile nodes connect to a fixed node in the period of cycleT . Furthermore, since the number of mobile nodes which
choose the destination in iT is areaimov SN /T , we can estimate that areaimov SN /T mobile nodes
connect to fixed node i in the period of cycleT . Thus, the average time in which a mobile node connects
to fixed node i (iaveT ) is calculated by the following equation:
.T
T
imov
areacycle
area
imov
cycleave
N
STS
N
TT
i
(11)
Based on the above discussion, the time limit (i
Tlim ) can be calculated by the following equation:
.T
lim
imov
areacyclereqcurrent
avereqcurrent
estcurrent
N
STNT
TNT
TTT
i
ii
ii
(12)
3.4. Discussions
DATFM can acquire and transfer data efficiently due to the following features:
The source node can collect mobile nodes easily since each mobile node travels around the fixed
nodes as described in Subsection 3.2.
Since each mobile node transmits the acquired data to the nearest fixed node, it can store new
data more frequently.
Since the accumulated data are transmitted by using multiple mobile nodes, the data can reach to
the sink node easily even in a wide area.
By applying train transmission, the source node can transmit the accumulated data even when the
distance between the source and destination nodes is long.
Here, as described in Subsection 3.1, DATFM assumes a flat environment where no obstacles exist.
However, even when obstacles exist in the area, DATFM can work by letting each fixed node hold the
information on obstacles in its territory and adjacent territories. By doing so, the source node of a data
transmission process can determine an appropriate communication route considering the obstacles.
In DATFM, fixed nodes have larger memory spaces than mobile nodes. If mobile nodes have same
memory spaces as those of fixed nodes, fixed nodes have to start a data transmission process every
time they receive data from a single mobile node. In this case, mobile nodes have to move to transfer
the data towards the sink node every time they send the acquired data to a fixed node. This may cause
the deterioration of the performance of sensing in DATFM. Therefore, we set the size of memory
spaces of mobile nodes smaller than those of fixed nodes in order to balance the efficiencies of data
transfer and sensing. As described in Subsection 3.3.3, the source node sends a RReq with reqN , which is the number of
mobile nodes required to construct a communication route. Here, when a mobile node is performing a

Sensors 2009, 9
343
sensing operation in the territory of the source node, it will certainly connect to the source node. Also,
the source node knows such nodes since all mobile nodes in the territory certainly connect to the fixed
node which has charge of the destination before starting a sensing operation. Thus, the source node can decrease reqN considering mobile nodes which are performing sensing operation in its territory.
However, DATFM does not decrease reqN in order to certainly construct a communication route even
in a case that node failures occur.
In addition, the source node sends a RReq only to the mobile node which firstly connects after
starting the data transmission process. Then, the source node starts a train transmission when the
second mobile node connects. Here, if the source node sends RReqs to multiple mobile nodes it might be able to collect reqN mobile nodes in a shorter time. However, the source node does not do so
because it becomes difficult to correctly manage reqN . For example, when another mobile node (node
b) connects to the source node after the source node has sent a RReq to a mobile node (node a), the source node cannot set the appropriate reqN for node b since it cannot know the number of mobile
nodes collected by node a. Moreover, the main task of a mobile node in CM is to request the nearly
fixed nodes to collect other mobile nodes. This is because a single mobile node has a little chance to
connect to another mobile node in a sparse network. Even if the source node sends RReqs to multiple
mobile nodes, the effect will be little. Therefore, DATFM starts the train transmission when the second
mobile node connects to the source node in order to improve the efficiency of data transmission.
4. Performance evaluation
In this section, we show results of simulation experiments regarding performance evaluation of
DATFM. In the simulation experiments, we compare the performances of DATFM, UM with random
way point model [9], and RAMOS [7,8].
Table 2. Parameters in the experiments.
Parameter Value (Default)
comR 50~10 (50)
m 0.5~0.1 (5.0)
4.1. Simulation environment
In the simulation experiments, we assume a vast agricultural farm in which each sensor acquires
pictures or movies of the crops. Sensor nodes are deployed in a 1,000[m]×1,000[m] flatland. Each sensor node performs a sensing operation with the rate of 100 [ 2sec/ mbit ] and acqT is 30 [sec]. The

Sensors 2009, 9
344
wireless communication range of all nodes and the channel bandwidth are comR [m] and 2 [Mbps],
respectively.
In DATFM, there are 10 fixed nodes and 40 mobile nodes. Each mobile node moves with velocity of m [m/s] in SM and m2 [m/s] in TM and CM. Each fixed and mobile node has a memory space
whose size is 2,000 [Mbit] and 10 [Mbit], respectively. Each fixed node starts data transmission when
the amount of the accumulated data exceeds 800 [Mbit]. Each mobile node performs a sensing
operation every time it arrives the destination. Each fixed node performs a sensing operation every
1,500 [sec]. The rate and the duration of a sensing operation by a fixed node are also 100
[ 2sec/ mbit ] and 30 [sec].
In RAMOS, there are 10 nodes in category1 (fixed), (40 - 10) nodes in category2 (moving), and 10
nodes in category3 (transmitting). This parameter setting is to make the total number of nodes in
category2 and category3 in RAMOS equal to 40 and to guarantee all nodes in category1 can transfer
data to the sink node by using nodes in category3. Nodes in category1 have a memory space of 1,000
[Mbit]. Nodes in category2 and category3 have a memory space of 10 [Mbit]. Nodes in category2 and category3 move with the velocity of m [m/s] when sensing and gathering data, and m2 [m/s] when
transmitting data to the sink node. The nodes in category1 perform a sensing operation every 1,500
[sec] in the same way as fixed nodes in DATFM.
In UM, there are (40 + 10) UM nodes. Each UM node has a memory space of 10 [Mbit]. Each node moves with velocity of m [m/s] when sensing, and m2 [m/s] when transferring data. Each UM node
starts transferring data to the sink node when the amount of the accumulated data exceeds 10 [Mbit]
(i.e. each node transfers data after a sensing operation). We set parameters comR and m as shown in Table 2. In the experiments, we change one of the
parameters and set others as default values in order to verify the effect of each parameter. In this
environment, we evaluate the following four criteria during 60,000 [sec]:
Throughput
The amount of data that arrive at the sink node per 1[sec].
Average moving distance
The average of moving distances of all mobile nodes (i.e. all mobile nodes in DATFM , all nodes
except those in category1 in RAMOS, and all nodes in UM) during the simulation period.
Average delay
The average of the elapsed time after data are acquired until the data arrive at the sink node.
Control traffic
The number of packets to control sensor nodes during the simulation period. Specifically, in
DATFM, the total number of RReqs, RCReqs, and RRels sent by nodes becomes the control traffic.
On the other hand, the control traffic in RAMOS is the total number of packets sent from nodes in
4.2. Effects of the velocity of node
Figures 11, 12, 13 and 15 show the simulation results changing parameter m . The horizontal axis
on all graphs indicates the velocity of sensor nodes m . The vertical axis indicates throughput in Figure
11, average moving distance in Figure 12, average delay in Figure 13, and control traffic in Figure 15.

Sensors 2009, 9
345
4.2.1. Throughput
Figure 11 shows that the throughput in DATFM is always larger than those in RAMOS and UM. This is because DATFM can acquire and transfer data more efficiently than RAMOS and UM. As m
increases, the difference in throughput between DATFM and RAMOS gets larger. Mobile nodes in
DATFM transfer the acquired data to a nearby fixed node while mobile nodes in RAMOS transfer data
to the sink node every time they acquired data. Therefore, mobile nodes in DATFM can return to
perform sensing operation more quickly than those in RAMOS especially when the mobile nodes
move with higher speed. On the other hand, the difference in throughput between DATFM and UM gets smaller as m
increases. This is because the number of mobile nodes in DATFM (40) is smaller than that in UM (40
+ 10). Thus, UM is more affected by the velocity of nodes than DATFM.
Figure 11. Velocity and throughput.
0
0.5
1
1.5
2
1 2 3 4 5Velocity [m/sec]
Thr
uogh
put [
Mbp
s]
DATFM
RAMOS
UM
Figure 12. Velocity and average moving distance.
0
5
10
15
20
25
30
35
40
1 2 3 4 5
x104
Velocity [m/sec]
Ave
rage
mov
ing
dist
ance
[m
]
DATFM
RAMOS
UM

Sensors 2009, 9
346
4.2.2. Average moving distance
Figure 12 shows that the moving distances in all methods increase as m gets larger, which is an
obvious result. In addition, the moving distance in DATFM is smaller than those in RAMOS and UM.
This is because sensor nodes in RAMOS and UM move to the sink node every time they acquire data.
On the other hand, since DATFM accumulates the acquired data on a fixed node before transmitting
them to the sink node, the mobile node that acquires the data does not need to move to the sink node. Furthermore, the difference in the moving distance between three methods increases as m gets
larger. This is because the mobile nodes in all methods can perform much sensing operations as m
gets larger, and thus, the numbers of movements between the sensing point of each sensor nodes and
the sink node in RAMOS and UM become larger.
4.2.3. Average delay
Figure 13 shows that the delay for transmitting data in DATFM is always larger than those in
RAMOS and UM. This is because DATFM needs much time for accumulating data on fixed nodes. On
the other hand, the average delays in the other methods do not change even when the number of
mobile nodes increases. This is because the mobile nodes in these methods transfer data without accumulating data. As m increases, average delays of all methods decrease. This is obvious since
each sensor node can transfer data faster.
Figure 14 shows the details of delay in DATFM. In this figure, the delivery time is the time period
after a mobile node acquires data until it connects to a fixed node. The accumulated time is the time
period during which the data are stored at a fixed node. The transmission time is the time elapsed for
transmitting the accumulated data to the destination node after the amount of data accumulated on a
fixed node exceeds the threshold. From this result, the delay consists mostly of accumulated time. The
accumulated time can be suppressed by controlling the threshold at each fixed node. However, since a
small threshold causes highly frequent data transmissions, the efficiency of sensing may become low.
Figure 13. Velocity and average delay.
0
1000
2000
3000
4000
5000
6000
1 2 3 4 5Velocity [m/sec]
Ave
rage
del
ay [
sec]
DATFM
RAMOS
UM

Sensors 2009, 9
347
Figure 14. Velocity and details of delay in DATFM.
0
1000
2000
3000
4000
5000
6000
1 2 3 4 5Velocity [m/sec]
Del
ay [
sec]
Transmission time
Accumulated time
Delivery time
Thus, the threshold should be appropriately set according to the system parameters and requirements When m is very small, the accumulated time becomes much larger because, mobile
nodes spend much time to transfer the acquired data to the fixed node. This makes the rate of data accumulation low. Moreover, the delivery time decreases when m increases, which is an obvious
result.
Figure 15. Velocity and control traffic.
0
0.5
1
1.5
2
1 2 3 4 5
x104
Velocity [m/sec]
Con
trol
traf
fic
[pac
kets
] DATFM
RAMOS
4.2.4. Control traffic
Figure 15 shows that the control traffic in DATFM is smaller than that in RAMOS. This is due to
the difference of frequency of data transmissions between DATFM and RAMOS. Specifically, the
control traffic in RAMOS occurs every time nodes in category3 connect to those in category2 which
hold data. On the other hand, the control traffic in DATFM occurs only when a fixed node starts
constructing a communication route.
4.3. Effects of the communication range
Figures 16, 17, 18 and 20 show the simulation results changing parameter comR . The horizontal axis
on all graphs indicates the communication range of sensor nodes ( comR ). The vertical axis indicates

Sensors 2009, 9
348
throughput in Figure 16, average moving distance in Figure 17, average delay in Figure 18, and control
traffic in Figure 20.
4.3.1. Throughput
Figure 16 shows that the throughputs in all methods get larger as comR increases. This is obvious
because the large communication range makes the connectivity high. The difference in throughput
between DATFM and RAMOS becomes larger as comR increases. In DATFM, the required number of
mobile nodes to construct a communication route decreases. This makes it easy for mobile nodes to
return to a sensing operation. On the other hand, the throughput in UM is nearly identical to that in
DATFM. This may be due to the following two reasons: a) the number of mobile nodes in DATFM
(40) is smaller than that in UM (40+10), and b) the mobile nodes in DATFM can perform sensing
operations more frequently than those in UM since they do not move to the sink node to transfer data
every time. These are the advantages of UM and DATFM, respectively. In the parameter setting in this
subsection, these advantages are balanced out.
Figure 16. Communication range and throughput.
0
0.5
1
1.5
2
10 20 30 40 50Communication range [m]
Thr
uogh
put [
Mbp
s]
DATFM
RAMOS
UM
Figure 17. Communication range and average moving distance.
0
5
10
15
20
25
30
35
40
10 20 30 40 50
x104
Communication range [m]
Ave
rage
mov
ing
dist
ance
[m
]
DATFM
RAMOS
UM

Sensors 2009, 9
349
4.3.2. Average moving distance
Figure 17 shows that the moving distances in RAMOS and UM are larger than that in DATFM. This is due to the same reasons as that in Figures 12. In addition, as comR gets larger, the average
moving distance in DATFM decreases. This is because the required moving distances between the
source and destination nodes in DATFM decrease. Moreover, the increase of the communication range
makes the moving distance required for the train transmission smaller.
Figure 18. Communication range and average delay.
0
5000
10000
15000
20000
10 20 30 40 50Communication range [m]
Ave
rage
del
ay [
sec]
DATFM
RAMOS
UM
The moving distance in RAMOS increases as the communication range gets longer until a certain
value (about 36[sec]). This is because nodes in category3 have more opportunities to connect to nodes
in other categories due to the increase of the communication range. On the other hand, as the
communication range gets much larger, the moving distance decreases. This is because the moving
distance of nodes in category3 required to transfers the data decreases.
The moving distance in UM decreases as the communication range gets larger. This is obvious
because the UM nodes can transfer the acquired data with the shorter distance when the
communication range is large.
4.3.3. Average delay
Figure 18 shows that the delay in DATFM is always larger than those in RAMOS and UM. This is
due to the same reasons as that in Figures 13.
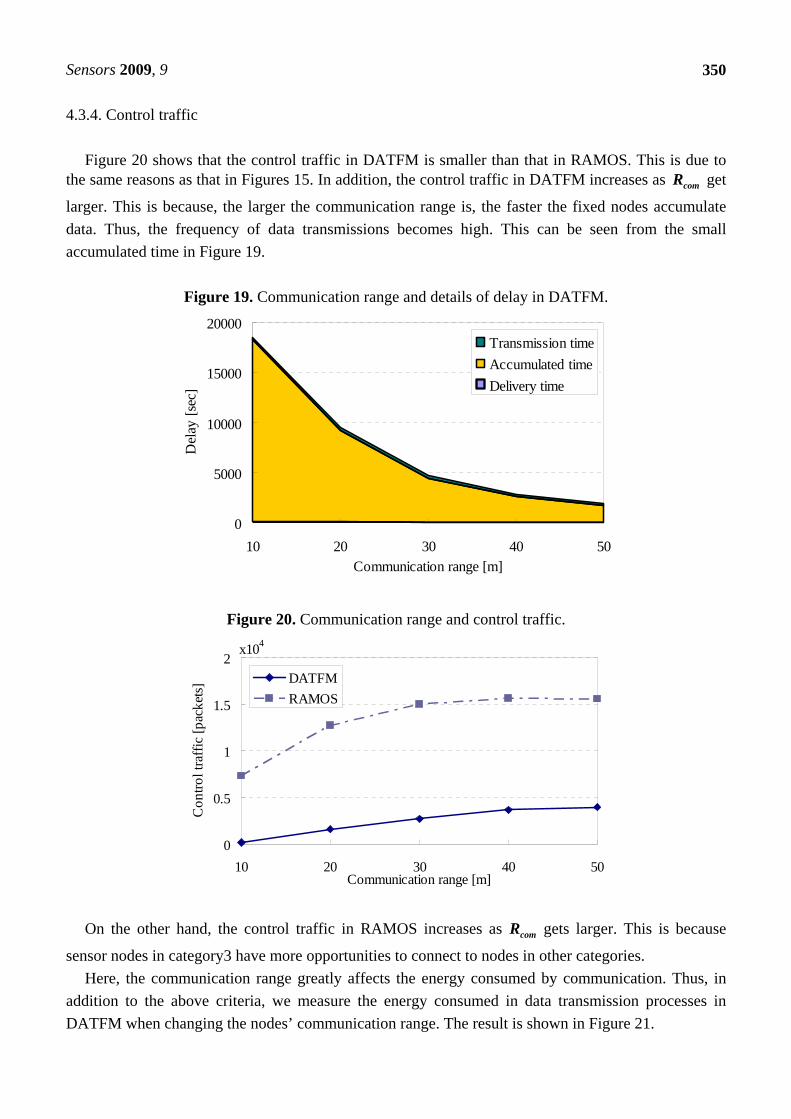
Figure 19 shows the details of delay in DATFM. This result shows that the accumulated time much increases as comR gets smaller. This is because of the increase of the required number of mobile nodes
to achieve a data transmission between fixed nodes. When the required number of nodes increases,
many mobile nodes tend to keep transferring data between fixed nodes. Therefore, the number of
nodes which perform a sensing operation becomes smaller, and thus, the rate of data accumulation on a
fixed node becomes low.
Sensors 2009, 9
350
4.3.4. Control traffic
Figure 20 shows that the control traffic in DATFM is smaller than that in RAMOS. This is due to the same reasons as that in Figures 15. In addition, the control traffic in DATFM increases as comR get
larger. This is because, the larger the communication range is, the faster the fixed nodes accumulate
data. Thus, the frequency of data transmissions becomes high. This can be seen from the small
accumulated time in Figure 19.
Figure 19. Communication range and details of delay in DATFM.
0
5000
10000
15000
20000
10 20 30 40 50Communication range [m]
Del
ay [
sec]
Transmission time
Accumulated time
Delivery time
Figure 20. Communication range and control traffic.
0
0.5
1
1.5
2
10 20 30 40 50
x104
Communication range [m]
Con
trol
traf
fic
[pac
kets
] DATFM
RAMOS
On the other hand, the control traffic in RAMOS increases as comR gets larger. This is because
sensor nodes in category3 have more opportunities to connect to nodes in other categories.
Here, the communication range greatly affects the energy consumed by communication. Thus, in
addition to the above criteria, we measure the energy consumed in data transmission processes in
DATFM when changing the nodes’ communication range. The result is shown in Figure 21.

Sensors 2009, 9
351
4.3.5. Energy consumption
As described in the beginning of this subsection, the communication range affects the energy
consumed by communication. In addition, the communication range also affects the energy consumed
by movement since the moving distance changes according to the communication range as shown in
Figure 17. To analyze the effects of communication range to the total energy consumption, we measure
the energies consumed by each of communication and movement in data transmission process in
DATFM.
Figure 21. Communication range and the energy consumption in DATFM.
0
0.5
1
1.5
2
10 20 30 40 50
Ene
rgy
cons
umpt
ion
[J]
x104
Communication range [m]
energy consumed by communication
energy consumed by movement
In this experiment, we assume that the energy consumed by movement is 1 [J/m], and those consumed by data sending ),( coms RkP and receiving )(kPr are represented by the following equations
[17]: )21.0()50(),( comcoms RkkRkP . (13)
50)( kkPr . (14)
Here, k [bit] is the size of the transmitted/received data. Figure 21 shows the simulation result when changing parameter comR . From this figure, energy
consumed by communication increases as the communication range gets larger. In addition, energy
consumed by movement also increases as the communication range gets larger. This is because the
decrease of the number of mobile nodes to construct the communication route due to the increase of
the communication range makes the number of mobile nodes in SM larger. In such a case, more data
will be accumulated to fixed nodes in a short time, and the frequency of data transmission processes
(including train transmission) increases.
Here, this figure also shows that movement of nodes consumes much more energy than
communication. This indicates that movement is dominant in power consumption in our assumed
environment. As shown in Figure 17, since the average moving distance in DATFM is always smaller
than conventional methods, we can confirm that DATFM reduces the total power consumption.

Sensors 2009, 9
352
4.4. Summary
From the above results, we can see that DATFM can transfer data with smaller moving distance
compared with UM and RAMOS. This means that mobile nodes in UM and RAMOS must move for
longer distance in order to transfer the acquired data to the sink node. In mobile sensor networks, the
energy consumed by movement is much larger than those by communication and computation [17, 18].
Therefore, we can see that DATFM achieves both high throughput and energy-efficiency compared
with UM and RAMOS.
Moreover, from the results in Subsection 4.3, we can see that the performance of DATFM is
affected by the density of nodes in the network. Here, the density also changes when the number of
nodes changes. Although the results are not shown in this paper, we have confirmed by some
experiments that the number of nodes has the same effect as the communication range.
5. Conclusions
In this paper, we have proposed an effective mobile sensor control method named DATFM for
sparse sensor networks. DATFM uses two types of sensor nodes, fixed node and mobile node, and
accumulates the acquired data on a fixed node before transferring them to the sink node. In addition,
DATFM transmits the accumulated data efficiently by constructing a communication route of mobile
nodes between fixed nodes. We have also conducted simulation experiments to evaluate the
performance of DATFM. From the results of the experiments, DATFM can acquires and transfers data
with smaller moving distance. These results show that DATFM improves the efficiency of sensing and
data transmission compared with the conventional methods.
Since each fixed node in DATFM accumulates data generated in its vicinity, the performance of
sensing depends on the deployment of fixed nodes. In addition, since the distances between fixed
nodes affect the number of required mobile nodes to construct a communication route, the performance
of data transfer also depends on the deployment of fixed nodes. Thus, as part of our future work, we
plan to discuss the effects of the locations of fixed nodes in order to improve the performance of
data transfer.
On the other hand, since mobile nodes cannot sense their target locations when they are transferring
the data accumulated by a fixed node, the amount of acquired data tends to decrease in a particular
region where data transmissions frequently occur. Such a skew of data acquisition is not desirable in
some applications such as planetary explosion and detecting dangerous regions. Thus, we plan to
investigate the effects of data transfers in order to achieve the uniform sensing in the whole area while
keeping high effectiveness of the data acquisition and transmission.
In DATFM, data transmission is treated as more important than sensing. For example, a mobile
node in SM which receives a RCReq changes its mode into TM even when it is performing a sensing
operation at its sensing point. However, in some environments, the performance may improve by
treating sensing as more important than data transmission. For example, when communication range is
large, the required number of mobile nodes for a data transmission process decreases. In such a case,
total throughput may be improved when some mobile nodes in SM continue sensing operations even

Sensors 2009, 9
353
when they receive RCReqs. Thus, we plan to analyze the effects of the system parameters to the
performance, and extend our method to change the behaviors of nodes according to the environment.
Furthermore, in order to adapt to a harsh environment, we also plan to extend our method to handle
node failures. Moreover, we plan to examine the effects of difference in memory spaces between
mobile and fixed nodes. Finally, we plan to implement our proposed method on real sensor nodes and
verify its effectiveness on a practical platform.
Acknowledgments
This research was supported by Scientific Research on Priority Areas (18049050) and Grant-in-Aid
for Scientific Research (A)(17200006) of the Ministry of Education, Culture, Sports, Science
andTechnology, Japan, and by International Communications Foundation.
References and Notes
1. Cui, J.-H.; Kong, J.; Gerla, M.; Zhou, S. The challenges of building mobile underwater wireless
networks for aquatic applications. IEEE Netw. 2006, 20, 12–18.
2. Roy, S.; Arabshahi, P.; Rouseff, D.; Fox, W.L.J. Wide area ocean networks: architecture and
system design considerations. In Underwater Networks; ACM, 2006; pp. 25–32.
3. Akyildiz, I.F.; Pompili, D.; Melodia, T. Underwater acoustic sensor networks: research challenges.
Ad Hoc Netw. 2005, 3, 257–279.
4. Lin, F.; Wang, Y.; Wu, H. Testbed implementation of delay/fault-tolerant mobile sensor network
(dft-msn). In PerCom Workshops; IEEE Computer Society, 2006; pp. 321–327.
5. Rao, R.N.; Kesidis, G. Purposeful mobility for relaying and surveillance in mobile ad hoc sensor
networks. IEEE Trans. Mobile Comput. 2004, 3(3), 225–232.
6. Wang, Y.; Wu, H. Delay/fault-tolerant mobile sensor network (dft-msn): A new paradigm for
pervasive information gathering. IEEE Trans. Mobile Comput. 2007, 6(9), 1021–1034.
7. Suzuki, R.; Makimura, K.; Saito, H.; Tobe, Y. Prototype of a sensor network with moving nodes.
In INSS; June 2004.
8. Tobe, Y.; Suzuki, T. WISER: cooperative sensing using mobile robots. In ICPADS 2005; 2005
pp.388-392.
9. Wang, K.-C.; Ramanathan, P. Collaborative sensing using sensors of uncoordinated mobility. In
DCOSS, Lecture Notes in Computer Science; Springer, 2005; volume 3560, pp. 293-306.
10. Son, D.; Helmy, A.; Krishmacharl, B. The effect of mobility-induced location errors on
geographic routing in mobile ad hoc and sensor networks:analysis and improvement using
mobility prediction. IEEE Trans. Mobile Comput. 2004, 3(3), 233-245.
11. Arboleda C.; L.M.; Nasser, N. Cluster-based routing protocol for mobile sensor networks. In
International Conference on Quality of Service in Heterogeneous Wired/Wireless Networks,
August 2006.
12. Shinjo, T.; Ogawa, T.; Kitajima, S.; Hara, T.; Nishio, S. Mobile sensor control methods for
reducing power consumption in sparse sensor network. In SeNTIE; 2008; pp. 133-140.
13. Lin, C.-Y.; Tseng, Y.-C. Structures for in-network moving object tracking in wireless sensor

Sensors 2009, 9
354
networks. In BROADNETS; IEEE Computer Society, 2004, 718-727.
14. Pompili, D.; Melodia, T.; Akyildiz, I.F. Routing algorithms for delay-insensitive and delay-
sensitive applications in underwater sensor networks. In MOBICOM; ACM, 2006, 298-309.
15. Bahl, P.; Padmanabhan, V.N. Radar: An in-building rf-based user location and tracking system. In
INFOCOM; 2000; pp.775-784.
16. Hu, L.; Evans, D. Localization for mobile sensor networks. In MOBICOM; ACM, 2004; pp.45-57.
17. Goldenberd, D.K.; Lin, J.; Morse, A.S.; Rosen, B.E.; Yang Y.R. Towards mobility as a network
control primitive. In MOBIHOC; ACM, 2004, 163-174.
18. Rahimi, M.H.; Shah, H.; Sukhatme, G.S.; Heidemann, J.S.; Estrin, D. Studying the feasibility of
energy harvesting in a mobile sensor network. In ICRA; IEEE, 2003, pp.19-24.
© 2009 by the authors; licensee Molecular Diversity Preservation International, Basel, Switzerland.
This article is an open-access article distributed under the terms and conditions of the Creative
Commons Attribution license (http://creativecommons.org/licenses/by/3.0/).