an effective identification and quantification method for...
TRANSCRIPT

Phytomedicine 23 (2016) 377–387
Contents lists available at ScienceDirect
Phytomedicine
journal homepage: www.elsevier.com/locate/phymed
An effective identification and quantification method for Ginkgo biloba
flavonol glycosides with targeted evaluation of adulterated products
Yuan-Chun Ma
a , b , c , ∗, Ana Mani a , Yaling Cai a , b , Jaclyn Thomson
a , Jie Ma
a , b , Flavie Peudru
a , Sarah Chen
a , Mai Luo
a , b , Junzeng Zhang
d , Robert G. Chapman
d , Zhen-Tuo Shi e
a Canadian Phytopharmaceuticals Corp., 12233 Riverside Way, Richmond, BC V6W 1K8, Canada b Canadian Institute of Medicinal Plants, 12233 Riverside Way, Richmond, BC V6W 1K8, Canada c Hubei University of Chinese Medicine, Wuhan 430 0 0 0, PR China d Natural Health Products Program, Aquatic and Crop Resource Development, National Research Council of Canada, Halifax, Nova Scotia B3H 3Z1, Canada e Hubei Nuokete Pharmaceutical Co., Ltd., Xiaochang, Hubei 432900, PR China
a r t i c l e i n f o
Article history:
Received 30 June 2015
Revised 3 February 2016
Accepted 4 February 2016
Keywords:
Ginkgo biloba
Ginkgo supplements
Adulteration
LC-MS
PCA
Pharmacopeia
a b s t r a c t
Background: Ginkgo biloba L. (Ginkgoaceae) leaf extract is one of the most popular herbal products on
the market, as it contains flavone glycosides ( ≥ 24%) and terpene lactones ( ≥ 6%), which are proposed
to have significant physiological effects. Unfortunately, the challenging financial climate has resulted in a
natural health product market containing adulterated ginkgo products.
Purpose: 42 ginkgo samples were analyzed to establish an HPLC profile for authentic ginkgo and common
ginkgo adulterants, and to develop a method capable of easily detecting adulteration in ginkgo commer-
cial products.
Method: In this study an efficient and targeted HPLC analysis method was established that is capable of
distinguishing flavonol glycosides and aglycones simultaneously for the evaluation of ginkgo powdered
extracts (PEs) and finished products in a single, 13 min run. Thirteen ginkgo leaf samples, fifteen stan-
dardized powdered extracts, and fourteen commercially available ginkgo products have been analyzed
using this new HPLC method. Chromatograms were compared to six standard reference materials: one
flavonol glycoside (rutin), three aglycones (quercetin, kaempferol and isorhamnetin), and two isoflavones
(genestin and genistein). The quantitative chromatographic data was interpreted by principal component
analysis (PCA), which assisted in the detection of unexpected chromatographic features in various adul-
terated botanical products.
Results: Only three of the commercially available ginkgo finished products tested in this study were
determined to be authentic, with flavonol glycoside rutin, and aglycones quercetin, kaempferol, and
isorhamnetin found to be common adulterants in the ginkgo powdered extract and finished product sam-
ples.
Conclusion: Despite evidence of adulteration in most of the samples, each of the samples discussed herein
met most of the current pharmacopeial standards. It is therefore critical that a preliminary evaluation
be utilized to detect adulteration in commercial ginkgo products, prior to the acid hydrolysis procedure
utilized in the current testing methods.
© 2016 Elsevier GmbH. All rights reserved.
M
d
E
c
o
p
d
s
7
h
0
Abbreviations: CCCIEMHP, China Chamber of Commerce for Import & Export of
edicines & Health Products; CP, Chinese Pharmacopeia Commission; CPC, Cana-
ian Phytopharmaceuticals Corp.; CFDA, China Food and Drug Administration; EP,
uropean Pharmacopeia; G. biloba , Ginkgo biloba ; HPLC, high performance liquid
hromatography; I, isorhamnetin; K, kaempferol; LOD, limit of detection; LOQ, limit
f quantification; MS, mass spectrometry; NMT, not more than; PCA, principal com-
onent analysis; PE, powdered extract; Q, Quercetin; R, Rutin; RSD, relative standard
eviation; SRM, standard reference material; USP, united state pharmacopeia. ∗ Corresponding authors at: Canadian Phytopharmaceuticals Corp., 12233 River-
ide Way, Richmond, BC V6W 1K8, Canada. Tel.: +1 604 303 7782; fax: +1 604 303
726.
I
g
o
t
a
ttp://dx.doi.org/10.1016/j.phymed.2016.02.003
944-7113/© 2016 Elsevier GmbH. All rights reserved.
ntroduction
In the last 20 0 0 years, the Ginkgo biloba L. plant has been of
reat interest due to its use in improving the mental capacities
f patients with regular use. ( Zhang et al. 2011 ) Ginkgo leaf ex-
ract is one of the most popular herbal products on the market,
s it contains well-studied active ingredients that are proposed to
E-mail addresses: [email protected] (Y.-C. Ma), [email protected]
(A. Mani).
378 Y.-C. Ma et al. / Phytomedicine 23 (2016) 377–387
p
2
C
f
P
h
i
o
(
n
s
S
t
t
i
f
u
u
a
p
a
p
t
(
c
m
e
p
t
d
t
c
u
f
(
p
(
T
c
M
c
c
u
a
t
t
t
t
m
f
t
p
p
a
a
j
s
i
a
(
t
c
t
have significant physiological effects.( Lin et al. 2008; Song et al.
2010; van Beek and Montoro 2009 ) In fact, extensive clinical re-
search has found that standardized ginkgo extract may reduce pa-
tients’ risk of developing a number of mental diseases, including
Alzheimer’s. ( Sierpina et al. 2003 ) These finding have the potential
to make a great impact on mental health worldwide, as the oc-
currence of Alzheimer’s disease is expected to quadruple by 2050.
( Vellas et al. 2012 )
The natural health product market is constantly expanding as it
provides natural remedies and promotes a healthy lifestyle. Unfor-
tunately, the challenging financial climate is resulting in a market
containing adulterated products. North America is a major provider
of herbal products, a commodity that has recently come under
considerable scrutiny in the media. In February 2015, the New York
State Attorney General released a statement indicating that an in-
vestigation of a number of well-known herbal supplements, in-
cluding G. biloba , revealed that many of the products tested (using
DNA barcoding technique) contain no DNA of the herbal ingredi-
ent. ( Kaplan 2015 ) It has since been shown that this technology
is not appropriate for routine analysis of herbal extracts and their
products, due to the temperatures and solvents involved in pro-
cessing, however, this event did bring to light concerns about the
quality of today’s herbal products. Not long after, the China Food
and Drug Administration (CFDA) ordered over 200 Chinese phar-
maceutical manufacturers to recall their ginkgo products due to
quality issues. (China-Food-and-Drug-Administration May 19 2015)
These investigations have incited a need for more effective quality
control in general, including commercial ginkgo products.
Extensive research has revealed that the active compounds of
ginkgo are flavonol glycosides and terpene lactones. ( Kakigi et al.
2011; Kakigi et al. 2010 ) These compounds are typically found in
standardized ginkgo extracts at ≥ 24% and ≥ 6% for flavonol gly-
cosides and terpene lactones respectively. The current analytical
methods available to test ginkgo require an initial acid hydrolysis
step. This acid hydrolysis step results in the cleaving of the flavonol
glycosides to form aglycones, a series of compounds which are of-
ten not found in the original raw ginkgo herb. It is, however, these
aglycones – quercetin, kaempferol, and isorhamnetin – that are an-
alyzed in the quality control monographs of ginkgo products.
Monographs are comprehensive testing methods developed
by pharmacopeias for the purpose of ensuring the standard-
ization of herbal materials including raw leaves, powdered
extracts (PE), and commercial products. The ginkgo mono-
graphs published by the United State Pharmacopeia (USP)
(United-States-Pharmacopeial-Convention 2015) , British Pharma-
copeia (BP) (British-Pharmacopoeia-Commission 2012) , European
Pharmacopeia (EP) (European-Parmacopoeia 2015) , and Chi-
nese Pharmacopeia Commission (CP) (Chinese-Pharmacopoeia-
Commission 2010) are generally in agreement with respect to
their testing methods and required contents of 22.0–27.0% flavonol
glycosides. There are, however, slight variations with respect to
the high performance liquid chromatography (HPLC) peak ratios
of the aglycones in hydrolyzed ginkgo samples. USP (United-
States-Pharmacopeial-Convention 2015) states that the peak ratios
of kaempferol/quercetin and isorhamnetin/quercetin should be ≥0.7 and ≥ 0.1 respectively, while values of 0.8–1.2 and ≥ 0.15
are required by the Chinese Pharmacopeia Commission (Chinese-
Pharmacopoeia-Commission 2010) for the same respective ra-
tios. The BP and EP monographs do not specify peak ratios,
they simply require the standard 22.0–27.0% ginkgo flavone gly-
cosides, 2.6–3.2% bilobalide and 2.8–3.4% ginkgolides A, B and
C, and not more than (NMT) 5 ppm of ginkgolic acids. (British-
Pharmacopoeia-Commission 2012; European-Parmacopoeia 2015)
Although the monographs provided by USP, BP, EP, and CP play
an essential role in the quality control of ginkgo products, these
monographs do not provide methods for the analysis of sam-
les prior to acid hydrolysis. (British-Pharmacopoeia-Commission
012; European-Parmacopoeia 2015; United-States-Pharmacopeial-
onvention 2015) One exception, the China Chamber of Commerce
or Import & Export of Medicines & Health Products (CCCMH-
IE) does provided analysis specifications for ginkgo prior to acid
ydrolysis: rutin ≤4%; quercetin ≤0.5%; kaempferol ≤0.5%; and
sorhamnetin ≤0.2%. (CCCMHPIE 2015) They also list the peak ratio
f kaempferol/quercetin ≥ 0.7 for post acid hydrolysis samples. USP
United-States-Pharmacopeial-Convention 2015) recently added a
ew test entitled “Limit Criteria of Rutin and Quercetin”, in the
econd supplement of USP 37-2S ( Bzhelyansky et al. 2014; United-
tates-Pharmacopeial-Convention 2015) , however, it does not cover
he limits for kaempferol or isorhamnetin. Although the above cer-
ified values are vital in providing a standard for ginkgo products
n the marketplace, in almost all cases these values do not allow
or the detection of aglycones or other constituents in ginkgo prod-
cts prior to sample acid hydrolysis. This leaves an opening for the
ndetected adulteration of ginkgo products.
There are a number ways that a ginkgo product can be adulter-
ted. The most common form of adulteration is to spike original
lant extracts or product formulations with flavonol glycosides or
glycones. ( Ko et al. 2013 ) This allows manufacturers to use com-
ounds that are significantly less expensive than ginkgo leaf ex-
ract to achieve the typical 24% flavonol glycoside concentration.
van Beek and Montoro 2009 ) Rutin, a flavonol glycoside, and agly-
ones quercetin, kaempferol, and isorhamnetin, are currently the
ost popular ingredients used to spike products, as they are highly
ffective in inflating the flavonol glycosides assay values in ginkgo
roducts. ( Sloley et al. 2003 ) Another form of adulteration is
he use of other G. biloba plant parts (roots, bark, and seeds) to re-
uce costs. ( Nguyen et al. 2012 ) It is reported in the literature that
he other parts of the G. biloba plant contain different sets of active
omponents. ( Liu et al. 2014 ) The consumption of extracts man-
factured from these parts could therefore have significantly dif-
erent physiological effects, which could be harmful to consumers.
Nguyen et al. 2012 ) A third method, unapproved manufacturing
rocedures, involves the use of inappropriate extractions solvents
3% hydrochloric acid in the extraction solvent instead of ethanol).
his extraction procedure results the hydrolysis of flavonol gly-
osides, forming aglycones. (China-Food-and-Drug-Administration
ay 19 2015) This procedure therefore produces a product which
ontains compounds consistent with adulteration. In fact, a re-
ent announcement from the Chinese government stated that the
se of HCl can “decompose the effective constituents of medicine
nd affect the curative effect of medicine” regarding ginkgo ex-
ract. (China-Food-and-Drug-Administration May 19 2015) Though
he aglycones produced through unapproved manufacturing prac-
ices are not formally defined as adulterants, they will be referred
o as such throughout the paper for simplification.
In addition to the above mentioned adulterants, compounds
ade from other flavonoid-rich materials have a high potential
or use in spiking original plant extracts and product formula-
ions. ( Cheng et al. 20 0 0; Crupi et al. 2014 ) Researchers have re-
orted the presence of ginkgo native flavonol glycosides in other
lant species; these plant species could therefore be used for the
dulteration of ginkgo products . ( Riihinen et al. 2014 ) The fructus
nd flos Styphnolobium japonicum (L.) Schott species (syn: Sophora
aponica L., Fabaceae) are natural sources of the flavonol glyco-
ide rutin and aglycone quercetin, ( Chandra et al. 2011 ) however,
n addition to the compounds found in hydrolyzed ginkgo, they
lso contain two other active components, genestin and genistein.
Avula et al. 2015; Wohlmuth et al. 2014 ) If used as ginkgo adul-
erant, these additional compounds might also be present.
With such a high potential for adulteration using flavonol gly-
osides, aglycones, and different plant species containing addi-
ional active compounds, it is critical to establish new methods

Y.-C. Ma et al. / Phytomedicine 23 (2016) 377–387 379
t
t
w
c
a
h
m
i
p
i
M
M
p
a
e
e
r
M
R
A
g
p
l
c
w
c
t
t
c
l
C
P
i
c
e
w
H
l
a
1
fi
h
e
m
t
r
T
g
v
t
s
i
u
(
a
T
r
v
a
0
d
I
H
i
m
a
a
S
o
3
b
a
e
1
3
o
r
t
m
L
c
(
t
u
a
fl
t
1
I
g
t
u
C
w
T
w
s
s
i
t
t
m
a
D
O
i
t
p
o
w
o test ginkgo samples prior to acid hydrolysis: one to test au-
hentic ginkgo including all necessary flavonol glycosides, and one
ith the ability to simultaneously detect and analyze flavonol gly-
osides, aglycones, and other potential adulterants as mentioned
bove.
HPLC analysis is an effective method for the quality control of
erbal preparations and samples. ( Kakigi et al. 2012 ) An analytical
ethod, which can simultaneously analyze a broad range of chem-
cal constituents, and the relative content levels of the major com-
ounds (peak ratios and the total peak area), that will help in the
dentification of adulterated botanical products. ( Ma et al. 2011a;
a et al. 2011b; Ma et al. 2012; Ma et al. 2011c; Ma et al. 2011d;
a et al. 2011e ) The goal of this study is to establish the HPLC
rofile of ginkgo flavonol glycosides, aglycones, and other potential
dulterants in a single run to help verify the authenticity of ginkgo
xtracts and commercial products.
Herein we discuss the comparison of raw ginkgo leaves, ginkgo
xtracts, commercially available ginkgo supplements, and standard
eference compounds of potential adulterants.
aterial and methods
eagents and materials
HPLC grade methanol and acetonitrile were purchased from
nachemica (Canada). Rutin, quercetin, kaempferol, isorhamnetin,
enistein, and genistin were used as reference compounds and
urchased from ChromaDex (Irvine, USA). Ginkgo leaves were col-
ected from a variety of areas in China (nine provinces/cities in-
luding: Sandong, Chong qing, Hubei and Henan). These samples
ere harvested in the same year, from a variety of sources and
onditions, including: various authentic plants, different agricul-
ural soils, and various cultivating environments. Powdered ex-
racts were received from various Canadian suppliers. Seven of the
ommercial products used for the analyses were purchased from
ocal pharmacies and seven were purchased from pharmacies in
hina.
reparation of standards and samples
Reference standard solutions of rutin, quercetin, kaempferol,
sorhamnetin, genistein, and genistin were prepared to the desired
oncentration with methanol (99.96%, HPLC grade) and used as ref-
rence standards for quantitative purposes only. Ginkgo samples
ere prepared at a concentration of 12 mg/ml in methanol (99.96%,
PLC grade) for extracts, and at 100 mg/ml for leaves. Dried ginkgo
eaves, powdered extracts, and commercially formulated capsules
nd tablets were kept under identical conditions. Approximately
g of dried raw herb of G. biloba was milled with a grinder into
ne powder, then suspended and sonicated in methanol for one
our. 120 mg of the powdered extracts and equivalent weight of
ach commercial product were accurately calculated. For the com-
ercially formulated capsules and tablets, the contents equivalent
o 80 mg of flavonol glycoside were weighed into a 10 ml volumet-
ic flask and ultrasonic extracted with pure MeOH as stated above.
he mixture was then mixed with 10 ml 99.96% MeOH (HPLC
rade), and sonicated for an additional 20 min. After sonication, the
olume was adjusted to10 ml with 99.96% MeOH. Prior to injec-
ion, all liquid samples were filtered through a Phenex RC 0.2 μm
yringe filter. Hydrolyzed ginkgo samples were prepared accord-
ng to USP 37-NF 32, and were evaluated with the same method
sed to analyze the pre-hydrolysis samples of this study. Ginkgo PE
0.300 g) was accurately weighed into a 250 ml round-bottom flask
nd 78 ml of methanol: water: HCl (50: 20: 8, v/v/v) was added.
he solution was refluxed at a moderate heat for 135 min (deep
ed color), cooled to room temperature, and transferred to a 100 ml
olumetric flask. The solution was diluted to volume with water
nd mixed thoroughly. Aliquots were filtered through a Phenex RC
.2 μm syringe filter into vials and analyzed using the HPLC con-
itions described below.
nstrument conditions
PLC
Analysis was carried out using an Agilent series 1200 HPLC
nstrument (Agilent, CA, US) equipped with a binary pump, a
icro vacuum degasser, a multi-wavelength (MW) detector, an
uto-sampler, and a thermostated column. Input data (signals
nd integrations) was applied using ChemStation revision B.04.02
P1software. Optimum resolution and peak shape were obtained
n a Luna C18-HST (High Speed Technology) column (2.5 μm,
×100 mm) from Phenomenex (Torrance, CA, U.S.A.). The mo-
ile phase consisted of ultrapure water (18.3 M Ω -cm) (phase A)
nd acetonitrile (phase B). At a flow rate of 1.0 ml/min, the lin-
ar gradient was as follows: 0–1.5 min, 15–15% B; 3–4 min, 17–
7% B; 7–14 min, 20–35% B. UV detection wavelengths of 260 and
60 nm, a column temperature of 34 °C, and an injection volume
f 1 μl were applied. Each run was followed by a 5 min post
un and an equilibration period of 14 min. The relative retention
imes for quercetin, kaempferol, and isorhamnetin are approxi-
ately 1.00 min, 1.17 min, and 1.20 min, respectively.
C-MS
The LC-MS system consisted of a Thermo Accela 1250 pump
oupled with a Thermo Exactive high resolution mass spectrometer
HRMS, Thermo Fisher Scientific, Waltham, MA, USA). The separa-
ion was carried out on a AMT Halo C18 (2.7 μm, 3 × 100 mm) col-
mn, with a gradient elution using acetonitrile (with 0.1% formic
cid) and water (with 0.1% formic acid) as the mobile phase. The
ow rate was 1 ml/min. Negative polarity scan was acquired at al-
ernating MS scan of 0.25 s (4 Hz) across a mass range of m/z 190–
500, and higher energy dissociation scan of 0.1 s (10 Hz) at 60 eV.
on source conditions consisted of a spray voltage of 3 kV, sheath
as of 50, auxiliary gas of 15, and capillary and heater tempera-
ures of 250 °C and 300 °C, respectively. Acquisition was carried out
sing Xcalibur 2.2.
alculation of flavonol glycoside content
The flavonol glycoside content of hydrolyzed ginkgo samples
as calculated according to
USP 37-NF 32,
otal flavonol glycosides = ( r U / r S ) × ( C S /W ) × F × 10
here r U is the peak area of the relevant aglycone in the sample
olution, rs is the peak area of the aglycone in the corresponding
tandard solution, Cs is the concentration (mg/ml) of the aglycone
n the standard solution, W is weight of the ginkgo sample (e.g. PE)
aken to prepare the sample solution (g), and F is the factor used
o convert each aglycone into a flavonol glycoside with a mean
olecular mass of 756.7 (2.504 for quercetin, 2.588 for kaempferol,
nd 2.437for isorhamnetin).
ata analysis
Multivariate statistical analysis (MVSA) was carried out using
riginLab version 9 software. The data matrix was constructed us-
ng HPLC responses of each peak as variables, with the observa-
ions/samples in columns and the peaks in rows. Principal com-
onent analysis (PCA) was used to calculate a basic model and
verview the data. Consequently, only the first three components
ere selected for the description of the data, corresponding to 67%

380 Y.-C. Ma et al. / Phytomedicine 23 (2016) 377–387
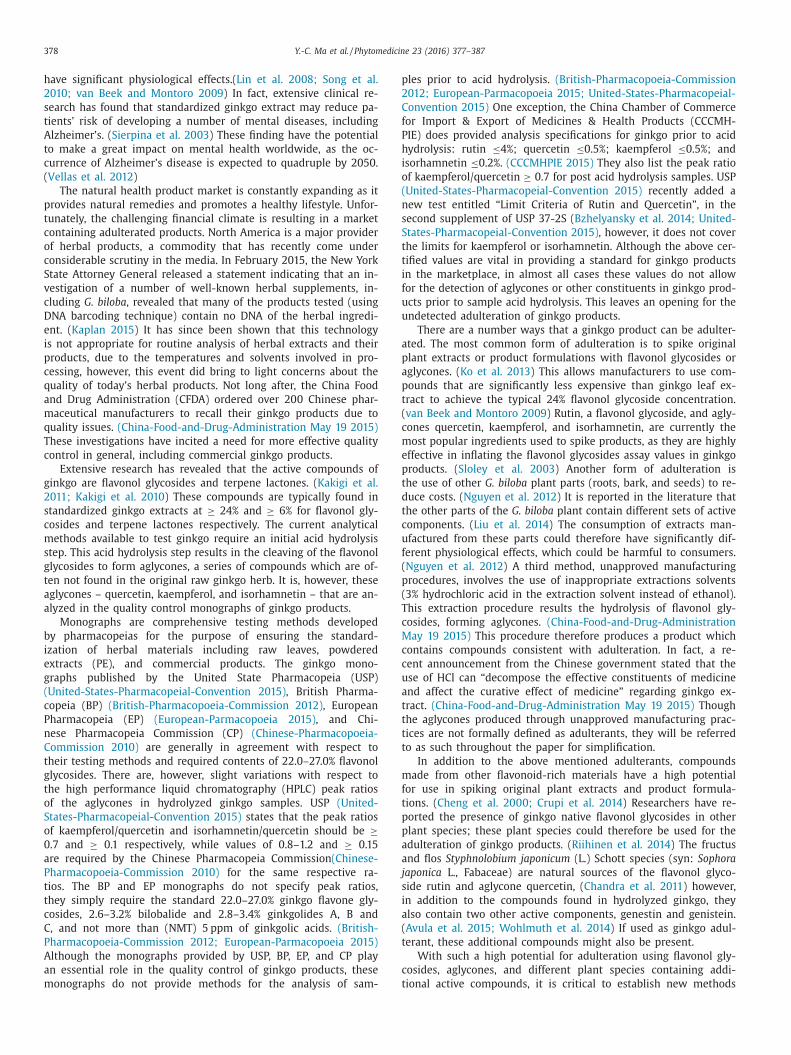
Fig. 1. Typical chromatograms of authentic ginkgo leaf (no.7), authentic ginkgo powdered extract (no. 28), adulterated ginkgo powdered extracts (nos. 19, 20, 23 and 24),
and finished commercial samples (nos. 38–42), using a UV detector at 360 nm wavelength and corresponding standards (rutin, quercetin, kaempferol, and isorhamentin);
peaks were identified using LC-MS.
h
g
fl
s
g
t
a
g
M
t
g
t
i
n
i
o
r
g
p
2
w
t
a
of their variability, with the remaining components each contribut-
ing 5% or less.
Results and discussion
A chromatographic method was optimized to establish a reli-
able HPLC fingerprint for the standardization of ginkgo products.
The method development included the optimization of the mo-
bile phase, column type, column temperature, and UV detector
wavelength. Method reproducibility and repeatability are discussed
herein.
Initial investigations detected thirteen signals in ginkgo leaf
(sample no. 7) and ginkgo PE (sample no. 28; CANPHY
® standard
reference material) ( Fig. 1 ). Twelve of those signals were identi-
fied as flavonol glycosides using LC-MS ( Table 1 ) with analysis of
[M + H] + and [M - H] − ions; the identity of peak 10 remains un-
known. The identity of the most prominent flavonol glycoside –
rutin (peak 5R) - was confirmed by direct comparison with an an-
alytical standard. These identifications are in complete agreement
with the flavonol glycoside compounds identified in previous re-
ports. ( Kakigi et al. 2012; Lin et al. 2008; van Beek and Montoro
2009 ) ( Ding et al. 2008 )
Although quercetin, kaempferol, and isorhamnetin have com-
paratively low detectable levels in leaves, these three aglycones
ave been proposed as potential adulterants along with isoflavones
enistin and genistein (active components from the fructus and
os Styphnolobium japonicum species). The simultaneous analy-
is of flavonol glycosides, aglycones, and isoflavones from various
inkgo products would therefore allow for the detection of adul-
erants in adulterated botanical products. Thus, the five potential
dulterants were also investigated by HPLC. Genistin, quercetin,
enistein, kaempferol, and isorhamentin were identified using LC-
S ( Table 1 ), and confirmed by comparison with their respec-
ive analytical standards. The six reference standards – rutin,
enistin, quercetin, genistein, kaempferol, and isorhamentin – and
he ginkgo PE standard reference material, were used for the qual-
tative and quantitative analysis in this study.
The HPLC method developed was capable of separating sig-
als from twelve flavonol gylcosides, three aglycones, and two
soflavones in ginkgo products within 13 min, with high peak res-
lution ( Fig. 1 ). This is a significant improvement over previous
eports where the HPLC methods for the analysis of adulterated
inkgo products were noted to have run times of over 60 min, with
oor separation of the ginkgo flavonol glycosides. ( Harnly et al.
012 ) The results described herein are in agreement with previous
ork ( Kakigi et al. 2012 ), however, the previous study did not es-
ablish the simultaneous analysis of ginkgo flavonol glycosides and
glycones.

Y.-C. Ma et al. / Phytomedicine 23 (2016) 377–387 381
Table 1
Identification of twelve flavonol glycosides, two isoflavones ∗ and three aglycones using LC-MS. Mass values for ginkgo extract are shown corre-
sponding to the peak numbers in Fig. 1.
Peak no. RT min Compound Mass ( m/z)
[M+H] + [M-H] − Fragments
1 2 .4 Quercetin-3,4 ′ -diglucoside 627 .0 625 .0 599 .2 413 .0 303 .0 178 .1
2 2 .6 Quercetin 3-O-2 ′′ , 6 ′′ -dirhamnosideglucoside 757 .2 755 .2 611 .3 465 .3 303 .0 174 .2
3 3 .6 Kaempferol 3-O-2 ′′ , 6 ′′ -dirhamnosideglucoside 741 .2 739 .2 633 .0 442 .2 327 .1 287 .0
4 3 .8 Isorhamnetin 3-O-2 ′′ , 6 ′′ -dirhamnosideglucoside 771 .2 769 .2 633 .0 441 .1 317 .0 287 .0
5R 4 .1 Rutin 611 .0 609 .0 464 .9 441 .1 397 .1 319 .8
6 4 .5 Quercetin 3-O-glucoside 464 .9 463 .1 433 .1 272 .0 270 .9 178 .1
7 4 .7 Patuletin 3-O-nerohesperidoside 643 .0 641 .1 621 .8 547 .0 483 .0 332 .9
– 4 .9 Genistin ∗ 433 .4 431 .4
8 6 .1 Kaempferol-3-O-rutinoside 595 .2 593 .2 449 .2 287 .1
9 6 .6 Isorhamnetin-3-O-rutinoside 625 .2 623 .2 479 .0 433 .0 317 .1 271 .1
11 8 .0 Kaempferol-3-O-neohesperidoside 595 .1 593 .1 478 .8 397 .0 332 .9 286 .9
12 9 .2 Quercetin 3-O-2 ′′ -(6 ′′ -p-coumaroyl)glucosylrhamnoside 757 .1 755 .1 432 .1 426 .2 409 .1 303 .0
13 10 .1 Kaempferol 3-O-2 ′′ -(6 ′′ -p-coumaroyl)glucosylrhamnoside 741 .2 739 .2 433 .1 427 .0 419 .0 286 .9
14Q 10 .5 Quercetin 304 .9 302 .9 303 .1
– 12 .1 Genistein ∗ 271 .2 269 .2 133 .1 132 .1
15K 12 .3 Kaempferol 288 .1 286 .4 287
16I 12 .6 Isorhamnetin 318 .1 316 .0 317 .1
Table 2
Linear calibration curves for the HPLC analysis of the chemical references in G. biloba .
Compound Calibration equation Correlation factor Concentrations
R.T. (min) y = ax+b ( R 2 ) x ( μg/ μl)
Rutin (4.095) y = 367.029x+6.546 0 .9996 0 .0430 0 .130 0 .4350 1 .3060 3 .0470
Genistin (4.980) y = 54.492x–1.251 0 .9998 0 .4050 1 .2250 2 .0340 2 .2250 5 .5190
Quercetin (10.503) y = 787.259x–20.983 0 .9995 0 .1090 0 .1830 0 .5500 1 .10 0 0 1 .8330
Genistein (12.068) y = 2498.980x–0.092 0 .9999 0 .0 0 03 0 .0041 0 .0082 0 .01630 0 .0032
Kaempferol (12.351) y = 1297.331x–5.593 0 .9998 0 .0140 0 .0270 0 .1370 0 .4120 0 .6860
Isorhamnetin (12.640) y = 523.858x–3.749 0 .9995 0 .0190 0 .0370 0 .0930 0 .1860 0 .5590
s
i
s
t
m
t
t
r
o
p
w
w
s
p
s
w
L
g
s
4
i
l
p
l
o
a
s
m
s
w
c
a
m
g
n
q
w
e
2
t
m
t
g
m
a
p
n
t
t
a
s
s
b
w
2
Calibration curves were obtained for each of the six reference
tandards: rutin, genistin, quercetin, genistein, kaempferol, and
sorhamentin. The calibration curves showed good linear relation-
hips ( R 2 ≥ 0.9995) for each of the analytes over the concentra-
ion range 0.0 0 03–5.5190 μg/ μl ( Table 2 ). The applied calibration
odel for all curves was y = ax + b , where y is the peak area, x is
he concentration, a is the slope, and b is the y-intercept.
Several analytical performance validations were performed on
he method developed in this study: precision, accuracy, recovery
ate, limit of detection ( Krauze-Baranowska et al. 2004 ), and limit
f quantification (LOQ). ( Krauze-Baranowska et al. 2004 ) The sam-
les analyzed in this study were examined over four consecutive
eeks. For accuracy, the method reproducibility and repeatability
ere evaluated by the analysis of three injections for each sample
olution, and five injections for each standard solution. Cycle time
er injection was 3–5 min.
The recovery values for the six standard constituents (in the
pecified concentration range) were determined to be 96.5–101.3%,
ith relative standard deviation (RSD) values ≤2.09% ( n = 5). The
OD values were 17.0, 11.5, 8.0, 2.5, 4.8, and 12.0 μg/ml for rutin,
enistin, quercetin, genistein, kaempferol, and isorhamentin, re-
pectively, and the LOQ values were 57.0, 38.0, 26.0, 8.4, 16.0, and
0.0 μg/ml for rutin, genistin, quercetin, genistein, kaempferol, and
sorhamentin, respectively. The RSD % for different concentration
evels was also determined by analysis in triplicate and shows good
recision with RSD values ≤5.21%, verifying the HPLC method uti-
ized.
Using the method developed for the analysis of a combination
f flavonol glycosides, aglycones, and isoflavones, 42 samples were
nalyzed including: thirteen dried leaf samples (nos. 1–13), fifteen
tandardized powdered extracts (nos. 14–28), and fourteen com-
ercially available ginkgo products (nos. 29–42) ( Table 3 ). Fig. 1
hows the HPLC profiles of selected adulterated ginkgo samples,
ith the major peaks (1–13) indicated on the chromatogram.
The thirteen dried leaf samples contained levels of flavonol gly-
osides that varied significantly between samples. However, the
uthentic ginkgo leaf samples gave a relatively consistent chro-
atographic fingerprint to use in the qualitative analysis of the
inkgo powdered extracts and commercial samples. Predictably,
one of the leaf samples contained detectable levels of aglycones
uercetin, kaempferol, or isorhamnetin, which is in agreement
ith previous reports.( Harnly et al. 2012; Liu et al. 2005; Sloley
t al. 2003 ) Most of the powdered extract samples (nos. 14–18, 21,
2, and 25–28) contained signals which were qualitatively consis-
ent with those of authentic ginkgo leaves, however, in the chro-
atograms of sample nos. 19, 20, 23, and 24 ( Fig. 1 ), those charac-
eristic signals were either significantly minimized, or absent alto-
ether. The majority of the commercially prepared ginkgo supple-
ents have HPLC profiles that differ significantly from those of the
uthentic leaves and the leaf-based extracts.
The right hand side of Fig. 1 includes five commercial ginkgo
roducts (sample nos. 38–42) as representative examples. The sig-
als and relative signal heights present in the chromatograms of
he samples were directly compared with those of the authen-
ic ginkgo leaves ( Fig. 1 ). This comparison showed large discrep-
ncies, including the addition of extra signals in the commercial
amples. These discrepancies indicated that the samples had been
piked with rutin, quercetin, kaempferol, or isorhamentin, or com-
inations therein.
Evidence for the presence of the potential adulterant genistein
as found in only three ginkgo finished products (sample nos.
3, 30, and 35) and at extremely low concentrations. This was
382 Y.-C. Ma et al. / Phytomedicine 23 (2016) 377–387
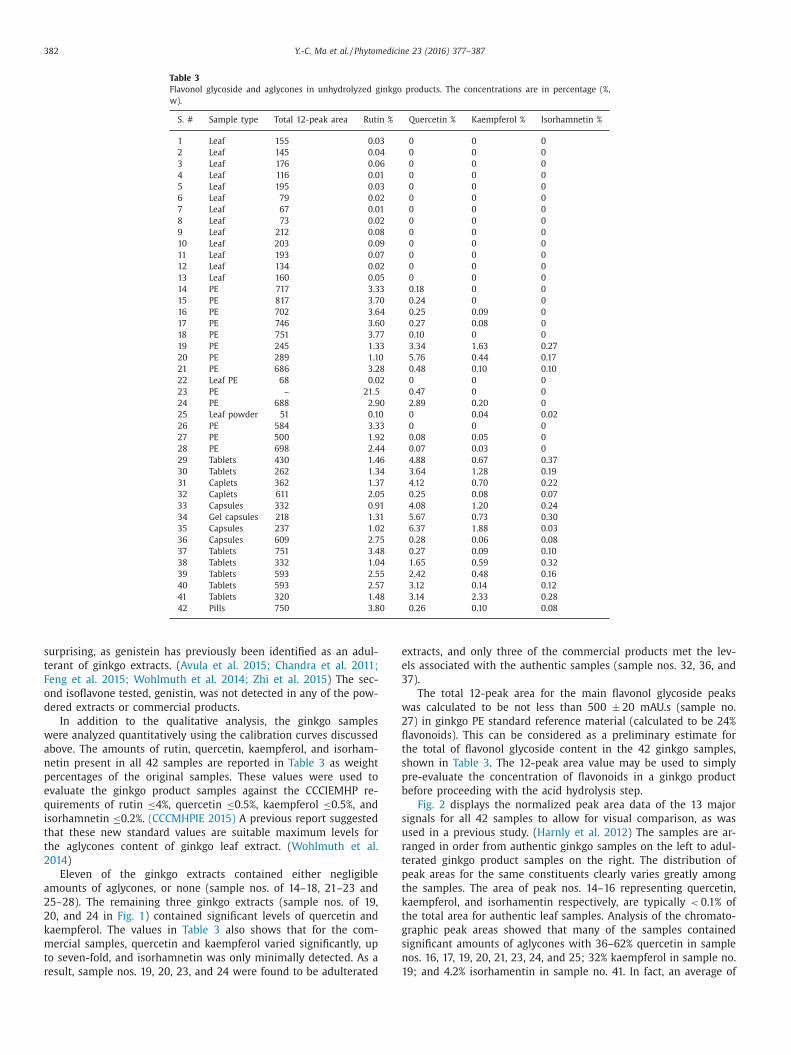
Table 3
Flavonol glycoside and aglycones in unhydrolyzed ginkgo products. The concentrations are in percentage (%,
w).
S. # Sample type Total 12-peak area Rutin % Quercetin % Kaempferol % Isorhamnetin %
1 Leaf 155 0 .03 0 0 0
2 Leaf 145 0 .04 0 0 0
3 Leaf 176 0 .06 0 0 0
4 Leaf 116 0 .01 0 0 0
5 Leaf 195 0 .03 0 0 0
6 Leaf 79 0 .02 0 0 0
7 Leaf 67 0 .01 0 0 0
8 Leaf 73 0 .02 0 0 0
9 Leaf 212 0 .08 0 0 0
10 Leaf 203 0 .09 0 0 0
11 Leaf 193 0 .07 0 0 0
12 Leaf 134 0 .02 0 0 0
13 Leaf 160 0 .05 0 0 0
14 PE 717 3 .33 0 .18 0 0
15 PE 817 3 .70 0 .24 0 0
16 PE 702 3 .64 0 .25 0 .09 0
17 PE 746 3 .60 0 .27 0 .08 0
18 PE 751 3 .77 0 .10 0 0
19 PE 245 1 .33 3 .34 1 .63 0 .27
20 PE 289 1 .10 5 .76 0 .44 0 .17
21 PE 686 3 .28 0 .48 0 .10 0 .10
22 Leaf PE 68 0 .02 0 0 0
23 PE – 21 .5 0 .47 0 0
24 PE 688 2 .90 2 .89 0 .20 0
25 Leaf powder 51 0 .10 0 0 .04 0 .02
26 PE 584 3 .33 0 0 0
27 PE 500 1 .92 0 .08 0 .05 0
28 PE 698 2 .44 0 .07 0 .03 0
29 Tablets 430 1 .46 4 .88 0 .67 0 .37
30 Tablets 262 1 .34 3 .64 1 .28 0 .19
31 Caplets 362 1 .37 4 .12 0 .70 0 .22
32 Caplets 611 2 .05 0 .25 0 .08 0 .07
33 Capsules 332 0 .91 4 .08 1 .20 0 .24
34 Gel capsules 218 1 .31 5 .67 0 .73 0 .30
35 Capsules 237 1 .02 6 .37 1 .88 0 .03
36 Capsules 609 2 .75 0 .28 0 .06 0 .08
37 Tablets 751 3 .48 0 .27 0 .09 0 .10
38 Tablets 332 1 .04 1 .65 0 .59 0 .32
39 Tablets 593 2 .55 2 .42 0 .48 0 .16
40 Tablets 593 2 .57 3 .12 0 .14 0 .12
41 Tablets 320 1 .48 3 .14 2 .33 0 .28
42 Pills 750 3 .80 0 .26 0 .10 0 .08
e
e
3
w
2
fl
t
s
p
b
s
u
r
t
p
t
k
t
g
s
n
1
surprising, as genistein has previously been identified as an adul-
terant of ginkgo extracts. ( Avula et al. 2015; Chandra et al. 2011;
Feng et al. 2015; Wohlmuth et al. 2014; Zhi et al. 2015 ) The sec-
ond isoflavone tested, genistin, was not detected in any of the pow-
dered extracts or commercial products.
In addition to the qualitative analysis, the ginkgo samples
were analyzed quantitatively using the calibration curves discussed
above. The amounts of rutin, quercetin, kaempferol, and isorham-
netin present in all 42 samples are reported in Table 3 as weight
percentages of the original samples. These values were used to
evaluate the ginkgo product samples against the CCCIEMHP re-
quirements of rutin ≤4%, quercetin ≤0.5%, kaempferol ≤0.5%, and
isorhamnetin ≤0.2%. (CCCMHPIE 2015) A previous report suggested
that these new standard values are suitable maximum levels for
the aglycones content of ginkgo leaf extract. ( Wohlmuth et al.
2014 )
Eleven of the ginkgo extracts contained either negligible
amounts of aglycones, or none (sample nos. of 14–18, 21–23 and
25–28). The remaining three ginkgo extracts (sample nos. of 19,
20, and 24 in Fig. 1 ) contained significant levels of quercetin and
kaempferol. The values in Table 3 also shows that for the com-
mercial samples, quercetin and kaempferol varied significantly, up
to seven-fold, and isorhamnetin was only minimally detected. As a
result, sample nos. 19, 20, 23, and 24 were found to be adulterated
xtracts, and only three of the commercial products met the lev-
ls associated with the authentic samples (sample nos. 32, 36, and
7).
The total 12-peak area for the main flavonol glycoside peaks
as calculated to be not less than 500 ± 20 mAU.s (sample no.
7) in ginkgo PE standard reference material (calculated to be 24%
avonoids). This can be considered as a preliminary estimate for
he total of flavonol glycoside content in the 42 ginkgo samples,
hown in Table 3 . The 12-peak area value may be used to simply
re-evaluate the concentration of flavonoids in a ginkgo product
efore proceeding with the acid hydrolysis step.
Fig. 2 displays the normalized peak area data of the 13 major
ignals for all 42 samples to allow for visual comparison, as was
sed in a previous study. ( Harnly et al. 2012 ) The samples are ar-
anged in order from authentic ginkgo samples on the left to adul-
erated ginkgo product samples on the right. The distribution of
eak areas for the same constituents clearly varies greatly among
he samples. The area of peak nos. 14–16 representing quercetin,
aempferol, and isorhamentin respectively, are typically < 0.1% of
he total area for authentic leaf samples. Analysis of the chromato-
raphic peak areas showed that many of the samples contained
ignificant amounts of aglycones with 36–62% quercetin in sample
os. 16, 17, 19, 20, 21, 23, 24, and 25; 32% kaempferol in sample no.
9; and 4.2% isorhamentin in sample no. 41. In fact, an average of

Y.-C. Ma et al. / Phytomedicine 23 (2016) 377–387 383
Fig. 2. Integration output of the HPLC chromatographic signals (demonstrated in Fig. 1 ) for 42 ginkgo samples. Rutin, quercetin, kaempferol, and isorhamentin peaks are
demonstrated with R, Q, K and I, respectively.
3
u
t
a
a
r
m
s
3
c
t
a
e
a
i
p
i
l
t
4
s
i
q
g
w
p
u
a
t
fl
s
q
t
n
w
a
b
A
fl
i
p
q
3
q
T
i
c
o
t
s
a
t
a
t
s
h
i
a
a
c
(
4
g
m
a
s
t
s
t
d
6% aglycone was obtained for the majority of the finished prod-
cts. This average excludes sample nos. 32, 36, and 37, as they are
he commercial samples that have distributions consistent with the
uthentic samples. This analysis also showed that the total peak
rea of the chromatogram for sample no. 23 consisted of 92.5%
utin. Although all of the samples listed above have been deter-
ined to be adulterated, they are still accepted under the current
tandards.
Fig. 3 shows the chromatograms of sample nos. 10, 17, 23, 24,
5, and 42, both pre- and post-hydrolysis (blue). This selection, in-
luding one authentic ginkgo leaf, three powdered extracts, and
wo commercial products, were selected to represent the range of
dulteration indicated by the above results. These samples are cat-
gorized into six specific groups: an authentic leaf sample (no. 10),
n authentic powdered extract sample (no. 17), a sample consist-
ng almost entirely of the flavonol glycoside rutin (no. 23), a sam-
le consisting almost entirely of aglycones (quercetin, kaempferol,
sorhamentin, no. 35), and two samples displaying authentic leaf-
ike flavonol glycoside profiles but were partially spiked with ei-
her aglycones (sample no. 24), or a flavonol glycoside (sample no.
2). As is seen in the chromatograms in Fig. 3 , each hydrolyzed
ample contains the three aglycones: quercetin, kaempferol, and
sorhamentin. Sample no. 23 is an exception, as it contains only
uercetin, the aglycone resulting from the hydrolysis of flavonol
lycoside rutin.
Once the quantities of quercetin, kaempferol, and isorhamentin
ere determined (using peak surface area extracted from the HPLC
lots in Fig. 3 ), the total flavonol glycoside content was calculated
sing the formula proposed by EP (European-Parmacopoeia 2015)
nd USP (United-States-Pharmacopeial-Convention 2015) . The fac-
or F equals 2.51, and is used to convert each aglycone into a
avonol glycoside. The total quantity of flavonol glycosides in the
ample can then be calculated by summing the values for the
uercetin, kaempferol, and isorhamnetin glycosides, as described in
he literature. ( Wohlmuth et al. 2014 )
Fig. 4 shows the ratios of kaempferol/quercetin and isorham-
etin/quercetin (on the left y -axis - see arrows on the leftmost
hite and black bars) and the total flavonol glycosides percent-
ge (on the right y -axis - see the arrow on the rightmost gray
ar) for sample nos. 10, 17, 23, 24, 35, and 42 post-hydrolysis.
s mentioned above, the minimum requirement for the total
avonol glycosides percentage of ginkgo products in North America
s 24%. (United-States-Pharmacopeial-Convention 2015) The three
owdered extracts, sample nos. 17, 23, and 24, all meet this re-
uirement; however, neither of the commercials samples do (nos.
5 and 42). Sample no. 10, the authentic leaf sample, is not re-
uired to meet the ≥ 24% value, as it is not a concentrated extract.
he fact that sample no. 23 meets the required value is mislead-
ng. This result implies that the sample is mixture of flavonol gly-
osides, when it was determined in Fig. 3 to consist almost entirely
f rutin.
The minimum values required in North America for the ra-
ios of kaempferol/quercetin and ginkgo PEisorhamnetin/quercetin,
hown as horizontal white and black lines in Fig. 4 , are ≥ 0.7,
nd ≥ 0.1 (United-States-Pharmacopeial-Convention 2015) , respec-
ively. The authentic leaf sample, two of the powdered extracts,
nd both commercial products (nos. 10, 17, 24, 35, and 42) meet
hose values established for ginkgo products post-hydrolysis. The
ingle peak found in the chromatogram for sample 23 (post-
ydrolysis) led to peak area ratios (kaempferol/quercetin and
sorhamnetin/quercetin) of zero. These results are consistent with
previous report, where the aglycone ratios (kaempferol/quercetin
nd isorhamnetin/quercetin) of three adulterated ginkgo commer-
ial products also complied with the relevant USP-NF monographs.
Wohlmuth et al. 2014 )
Each of the adulterated products (sample nos. 23, 24, 35, and
2) met at least one of the current requirements for standardized
inkgo products. These findings indicate that the use of the phar-
acopeia provided formula (Formula 1), can lead to results that
re misleading, and that the current protocols for the analysis and
tandardization of ginkgo products do not fully cover the detec-
ion of adulterants. The rapid method developed in this study can
imply resolve this issue with respect to all of the types of adul-
erations categorized above and shown in Fig. 3.
OriginLab 9 was used to perform PCA on the chromatographic
ata of the 42 ginkgo samples to calculate a basic model and

384 Y.-C. Ma et al. / Phytomedicine 23 (2016) 377–387
Fig. 3. The chromatograms of hydrolyzed (blue) and unhydrolyzed (black) sample nos. of 10, 17, 23, 24, 35 and 42, including one ginkgo leaf, three powdered extracts,
and two commercial products. All were identified by the retention time and UV spectra (360 nm wavelength) of corresponding standards (rutin, quercetin, kaempferol, and
isorhamentin). (For interpretation of the references to color in this figure legend, the reader is referred to the web version of this article.)
s
p
v
w
f
s
P
B
summarize the data. This type of approach was used in a previ-
ous study for the comparison of flavonol compositions of ginkgo
products on the Japanese market. ( Kakigi et al. 2012 )
The principal components were calculated using the entire set
of chromatographic signals as variables, including both sets of
flavonol glycoside and aglycone signals. The principal values cal-
culated for each sample, called factor scores, were interpreted as
the projections of the originally observed variables onto the prin-
cipal components. Plotting the principal components resulted in
core plots where each data point represented a single ginkgo sam-
le. The separations observed for the ginkgo samples resulted from
ariations in the chromatographic signals, as the original variables
ere the flavonol glycoside and aglycone signals. Statistically dif-
erent peaks were calculated with a confidence interval of 95% and
ignificance level of 0.05.
The 2-D projection score plot of principal components PC1 and
C2, for the 42 samples, can be classified into four groups: A,
, C and D ( Fig. 5 a). The authentic ginkgo leaf (nos. 1–13) and

Y.-C. Ma et al. / Phytomedicine 23 (2016) 377–387 385
Fig. 4. The ratio between kaempferol/quercetin and isorhamnetin/quercetin (on the left y -axis - see arrows on the leftmost white and black bars) and the total flavonol
glycosides percentage (on the right y -axis - see the arrow on the rightmost gray bar) for hydrolyzed sample nos. of 10, 17, 23, 24, 35 and 42, including one ginkgo leaf, three
powdered extracts, and two commercial products, extracted from the HPLC plots in Fig. 3 , using peak surface area as input data.
Fig. 5. (a) 2D projection score plot of two principal components for the 42 samples, which are classified in four groups A, B, C and D. Authentic products are marked with
solid circles (A and B) and adulterated ones with dashed-line circles (C and D). PC1 and PC2 are the first two principal components using entire chromatographic fingerprint
signals as input data b) 3D projection plot of three principal components, PC1, PC2 and PC3 are principal components using chromatographic signals as input data.
e
a
t
t
3
h
p
a
t
f
G
3
c
n
(
t
c
n
c
m
a
i
w
a
xtract (nos. 14–18, 21, 22, 25–28) samples are focused in two
reas marked with solid circles (Groups A and B). This indicates
hat those samples have very similar flavonol glycoside distribu-
ions ( Fig. 5 a). Three of the finished ginkgo products (sample nos.
2, 36, and 37) are also clustered in group B, indicating that they
ave similar flavonol glycoside distributions to the authentic sam-
les. This is consistent with the qualitative and quantitative results
bove, which indicate that those commercial samples contain au-
hentic unadulterated ginkgo. The remaining finished products are
ocused on two different positions marked with dashed-line circles,
roups C (nos. 24, 29 and 35) and Group D (nos. 19, 20, 30, 31,
3, 34, 38–41). These clusters are separated from their authentic
ounterparts based on their quercetin, kaempferol, and isorham-
etin contents. Within Group D, four of the commercial samples
nos. 30, 31, 33 and 34) are separated from the remaining adul-
erated samples, due to the high quercetin and high kaempferol
ombination found in each of the samples, see Table 3 . The sig-
ificant separation of Groups A and B from Groups C and D indi-
ates that the chemical composition of the majority of the com-
ercial samples are substantially different from authentic ginkgo
nd thus confirms the adulteration results discussed above regard-
ng the 42 ginkgo samples. These findings are clearly in agreement
ith the flavonol glycoside and aglycone distributions and percent-
ges shown in Fig. 2 and Table 3.
386 Y.-C. Ma et al. / Phytomedicine 23 (2016) 377–387
(
c
c
t
n
m
h
r
a
e
C
c
A
c
R
A
B
B
C
C
C
C
C
C
D
E
F
H
K
K
K
K
K
Using the original variables of the HPLC chromatographic sig-
nals as the input data, a three-dimensional (3-D) projection plot
of three principal components was used to further interpret the
relationships between the 42 ginkgo samples. The three principal
components, PC1, PC2, and PC3, describe the chromatographic fea-
ture variations related to the samples and were used to clarify the
differentiation in a 3-D configuration, shown in Fig. 5 b. As in Fig.
5 a, the authentic commercial ginkgo samples (nos. 32, 36, and 37)
are gathered in two areas of the 3-D projection plot with the au-
thentic leaf and extract samples. This is also the case for the adul-
terated ginkgo samples which remained focused in a completely
different area of the plot. This further confirms that many of the
ginkgo extracts and commercial samples analyzed in this study are
not consistent with authentic ginkgo leaves and extracts, regardless
of satisfying the testing requirements.
The data points representing sample no. 23 on the 2-D ( Fig. 5 a)
and 3-D ( Fig. 5 b) projection plots were not positioned near any of
the data point clusters. This is due to the fact that the only sig-
nal present in the chromatogram of sample no. 23 was identified
as rutin, and the lack of additional flavonol glycoside or algycone
signals for this sample. Including sample 23 in the PCA is benefi-
cial in locating samples containing larger quantities of rutin when
compared to the other samples.
The results presented herein effectively demonstrate the ne-
cessity for a preliminary evaluation of ginkgo products, prior to
acid hydrolysis. This evaluation must include the identification of
adulterants in ginkgo products using the HPLC method described
above. Following the identification, the ginkgo products need to
be evaluated by comparing the aglycone contents to the limits re-
ported for products prior to hydrolysis: rutin ≤4%, quercetin ≤0.5%,
kaempferol ≤0.5% and isorhamnetin ≤0.2%.
Conclusion
For the first time, a feasible and systematic HPLC method was
developed for the simultaneous analysis of a broad range of chem-
ical constituents, including ginkgo flavonol glycosides, aglycones,
and potential adulterants in authentic and spiked ginkgo samples,
in a single run, which is practical for all types of ginkgo materi-
als and products. The initial approach determined the HPLC sep-
aration of twelve major flavonol glycosides, three aglycones, and
two isoflavones within 13 min and with high resolution. Subse-
quent testing was performed on numerous ginkgo samples includ-
ing: thirteen raw ginkgo leaves, fifteen ginkgo powdered extracts,
and fourteen commercially available ginkgo supplements.
Of the 29 extracts and commercial products tested, 90% were
found to have chromatograms that were inconsistent with that of
authentic ginkgo leaves. However, this widespread adulteration is
almost entirely undetectable using the current testing methods as
most of the samples were found to meet pharmacopeial standards.
The current pharmacopeial standards only contain specifica-
tions for the total flavonol glycosides content and relative quan-
tities of quercetin, kaempferol, and isorhamnetin, determined post
hydrolysis. These methodologies are not sufficient to evaluate the
authenticity of ginkgo products and to detect adulteration with
aglycones.
The HPLC analysis method established in this study is both
effective and efficient, providing a qualification than is more
thorough than those previously reported, including the direct
comparison of commercial ginkgo HPLC profiles with an authen-
tic ginkgo HPLC fingerprint. It is useful not only for the au-
thentication of samples prior to acid hydrolysis, but also for
the quantification of flavonol glycosides as required by the CC-
CIEMHP, and the pharmacopeial monographs of USP (United-
States-Pharmacopeial-Convention 2015) , Chinese Pharmacopoeia
(Chinese-Pharmacopoeia-Commission 2010) , British Pharmacopeia
British-Pharmacopoeia-Commission 2012) , and European Pharma-
opeia. (European-Parmacopoeia 2015)
This will improve the quality control and standardization pro-
edures for ginkgo leaves, extracts, and commercial products, and
hus greatly improve the quality of products available in today’s
atural health product market. It is critical that ginkgo analysis
ethods incorporate a preliminary evaluation, prior to the acid
ydrolysis procedure, with recommended maximum values of 4%
utin, 0.5% quercetin, 0.5% kaempferol and 0.2% isorhamnetin. This
dditional analytical step and these new standard values will help
nsure the exposure of adulterated ginkgo products.
onflict of interest
This work is financially supported by Canadian Phytopharma-
euticals Corporation.
cknowledgment
This work is financially supported by Canadian Phytopharma-
euticals Corporation.
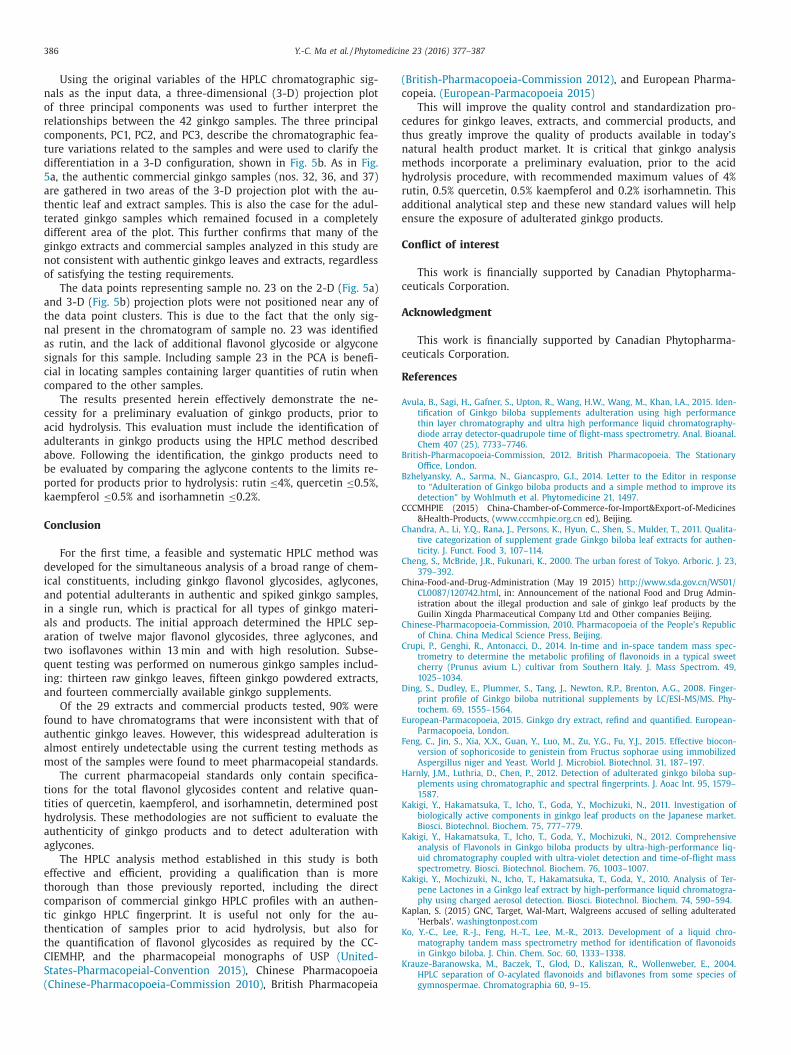
eferences
vula, B. , Sagi, H. , Gafner, S. , Upton, R. , Wang, H.W. , Wang, M. , Khan, I.A. , 2015. Iden-tification of Ginkgo biloba supplements adulteration using high performance
thin layer chromatography and ultra high performance liquid chromatography-diode array detector-quadrupole time of flight-mass spectrometry. Anal. Bioanal.
Chem 407 (25), 7733–7746 . ritish-Pharmacopoeia-Commission, 2012. British Pharmacopoeia. The Stationary
Office, London .
zhelyansky, A. , Sarma, N. , Giancaspro, G.I. , 2014. Letter to the Editor in responseto “Adulteration of Ginkgo biloba products and a simple method to improve its
detection” by Wohlmuth et al. Phytomedicine 21, 1497 . CCMHPIE (2015) China-Chamber-of-Commerce-for-Import&Export-of-Medicines
&Health-Products, ( www.cccmhpie.org.cn ed), Beijing. handra, A. , Li, Y.Q. , Rana, J. , Persons, K. , Hyun, C. , Shen, S. , Mulder, T. , 2011. Qualita-
tive categorization of supplement grade Ginkgo biloba leaf extracts for authen-
ticity. J. Funct. Food 3, 107–114 . heng, S. , McBride, J.R. , Fukunari, K. , 20 0 0. The urban forest of Tokyo. Arboric. J. 23,
379–392 . hina-Food-and-Drug-Administration (May 19 2015) http://www.sda.gov.cn/WS01/
CL0087/120742.html , in: Announcement of the national Food and Drug Admin-istration about the illegal production and sale of ginkgo leaf products by the
Guilin Xingda Pharmaceutical Company Ltd and Other companies Beijing.
hinese-Pharmacopoeia-Commission, 2010. Pharmacopoeia of the People’s Republicof China. China Medical Science Press, Beijing .
rupi, P. , Genghi, R. , Antonacci, D. , 2014. In-time and in-space tandem mass spec-trometry to determine the metabolic profiling of flavonoids in a typical sweet
cherry (Prunus avium L.) cultivar from Southern Italy. J. Mass Spectrom. 49,1025–1034 .
ing, S. , Dudley, E. , Plummer, S. , Tang, J. , Newton, R.P. , Brenton, A.G. , 2008. Finger-
print profile of Ginkgo biloba nutritional supplements by LC/ESI-MS/MS. Phy-tochem. 69, 1555–1564 .
uropean-Parmacopoeia, 2015. Ginkgo dry extract, refind and quantified. European-Parmacopoeia, London .
eng, C. , Jin, S. , Xia, X.X. , Guan, Y. , Luo, M. , Zu, Y.G. , Fu, Y.J. , 2015. Effective biocon-version of sophoricoside to genistein from Fructus sophorae using immobilized
Aspergillus niger and Yeast. World J. Microbiol. Biotechnol. 31, 187–197 .
arnly, J.M. , Luthria, D. , Chen, P. , 2012. Detection of adulterated ginkgo biloba sup-plements using chromatographic and spectral fingerprints. J. Aoac Int. 95, 1579–
1587 . Kakigi, Y. , Hakamatsuka, T. , Icho, T. , Goda, Y. , Mochizuki, N. , 2011. Investigation of
biologically active components in ginkgo leaf products on the Japanese market.Biosci. Biotechnol. Biochem. 75, 777–779 .
akigi, Y. , Hakamatsuka, T. , Icho, T. , Goda, Y. , Mochizuki, N. , 2012. Comprehensive
analysis of Flavonols in Ginkgo biloba products by ultra-high-performance liq-uid chromatography coupled with ultra-violet detection and time-of-flight mass
spectrometry. Biosci. Biotechnol. Biochem. 76, 1003–1007 . akigi, Y. , Mochizuki, N. , Icho, T. , Hakamatsuka, T. , Goda, Y. , 2010. Analysis of Ter-
pene Lactones in a Ginkgo leaf extract by high-performance liquid chromatogra-phy using charged aerosol detection. Biosci. Biotechnol. Biochem. 74, 590–594 .
aplan, S. (2015) GNC, Target, Wal-Mart, Walgreens accused of selling adulterated’Herbals’. washingtonpost.com
o, Y.-C. , Lee, R.-J. , Feng, H.-T. , Lee, M.-R. , 2013. Development of a liquid chro-
matography tandem mass spectrometry method for identification of flavonoidsin Ginkgo biloba. J. Chin. Chem. Soc. 60, 1333–1338 .
rauze-Baranowska, M. , Baczek, T. , Glod, D. , Kaliszan, R. , Wollenweber, E. , 2004.HPLC separation of O-acylated flavonoids and biflavones from some species of
gymnospermae. Chromatographia 60, 9–15 .

Y.-C. Ma et al. / Phytomedicine 23 (2016) 377–387 387
L
L
L
M
M
M
M
M
M
N
R
S
S
S
U
v
V
W
Z
Z
in, L.Z. , Chen, P. , Ozcan, M. , Harnly, J.M. , 2008. Chromatographic profiles and identi-fication of new phenolic components of Ginkgo biloba leaves and selected prod-
ucts. J. Agric. Food Chem. 56, 6671–6679 . iu, C.Q. , Mandal, R. , Li, X.F. , 2005. Detection of fortification of ginkgo products using
nanoelectrospray ionization mass spectrometry. Analyst 130, 325–329 . iu, Y. , Chen, S.N. , McApine, J.B. , Klein, L.L. , Friesen, J.B. , Lankin, D.C. , Pauli, G.F. , 2014.
Quantification of a botanical negative marker without an identical standard:Ginkgotoxin in Ginkgo biloba. J. Nat. Prod. 77, 611–617 .
a, J. , Ma, Y.C. , Cai, C. , Wang, D. , Hou, F.F. , Luo, M. , Lu, S. , Gorecki, D.C. , Patel, A.V. ,
Chen, A. , Jin, P. , 2011a. Simultaneous quantification of Echinacea species, FlosLonicerae, Radix Scutellaria and Fructus Forsythiae combinations by rapid reso-
lution liquid chromatography. Nat. Prod. Commun. 6, 639–643 . a, J. , Ma, Y.C. , Wang, D. , Hou, F.F. , Luo, M. , Lu, S. , Gorecki, D.C. , Patel, A.V. , 2011b.
Simultaneous quantification of Panax and Epimedium species using rapid reso-lution liquid chromatography (RRLC). Nat. Prod. Commun. 6, 581–586 .
a, Y.C. , Chen, S.L. , Thibault, M.E. , Ma, J. , 2012. Enhancing quality control of botan-
ical medicine in the 21st century from the perspective of industry: the use ofchemical profiling and DNA barcoding to ensure accurate identity. J. Am. Bot.
Counc. Herb. Gram 58–67 . a, Y.C. , Wang, X.Q. , Hou, F.F. , Ma, J. , Luo, M. , Chen, A. , Jin, P. , Lu, S. , Xu, I. , 2011c.
Rapid resolution liquid chromatography (RRLC) analysis and studies on the sta-bility of Shuang-Huang-Lian preparations. J. Pharm. Biomed. Anal. 54, 265–272 .
a, Y.C. , Wang, X.Q. , Hou, F.F. , Ma, J. , Luo, M. , Lu, S. , Jin, P. , Chen, A. , Xu, I. , Patel, A.V. ,
Gorecki, D. , 2011d. Simultaneous quantification of polyherbal formulations con-taining Rhodiola rosea L. and Eleutherococcus senticosus Maxim. using rapid
resolution liquid chromatography (RRLC). J. Pharm. Biomed. Anal. 55, 908–915 . a, Y.C. , Wang, X.Q. , Hou, F.F. , Ma, J. , Luo, M. , Lu, S. , Jin, P. , Terevsky, N. , Chen, A. ,
Xu, I. , Patel, A.V. , Gorecki, D. , 2011e. Rapid resolution liquid chromatography(RRLC) analysis for quality control of Rhodiola rosea roots and commercial stan-
dardized products. Nat. Prod. Commun. 6, 645–650 .
guyen, T.T.N. , Quang, T.H. , Tai, B.H. , Song, S.B. , Lee, D. , Kim, Y.H. , 2012. Anti-inflammatory and PPAR transactivational effects of com ponents from the stem
bark of Ginkgo biloba. J. Agric. Food Chem. 60, 2815–2824 .
iihinen, K.R. , Ou, Z.M. , Goedecke, T. , Lankin, D.C. , Pauli, G.F. , Wu, C.D. , 2014. Theantibiofilm activity of lingonberry flavonoids against oral pathogens is a case
connected to residual complexity. Fitoterapia 97, 78–86 . ierpina, V.S. , Wollschlaeger, B. , Blumenthal, M. , 2003. Ginkgo biloba. Am. Family
Phys. 68, 923–926 . loley, B.D. , Tawfik, S.R. , Scherban, K.A. , Tam, Y.K. , 2003. Quality control analyses for
ginkgo extracts require analysis of intact flavonol glycosides. J. Food Drug Anal.11, 102–107 .
ong, J.J. , Fang, G.Z. , Zhang, Y. , Deng, Q.L. , Wang, S. , 2010. Fingerprint analysis of
Ginkgo biloba leaves and related health foods by high-performance liquid chro-matography/electrospray ionization-mass spectrometry. J. Aoac Int. 93, 1798–
1805 . nited-States-Pharmacopeial-Convention, 2015. United States Pharmacopoeia and
National Formulary. United-States-Pharmacopeial-Convention, Rockville, MD . an Beek, T.A. , Montoro, P. , 2009. Chemical analysis and quality control of Ginkgo
biloba leaves, extracts, and phytopharmaceuticals. J. Chromatogr. A 1216, 2002–
2032 . ellas, B. , Coley, N. , Ousset, P.-J. , Berrut, G. , Dartigues, J.-F. , Dubois, B. , Grandjean, H. ,
Pasquier, F. , Piette, F. , Robert, P. , Touchon, J. , Garnier, P. , Mathiex-Fortunet, H. ,Andrieu, S. , GuidAge Study, G. , 2012. Long-term use of standardised ginkgo
biloba extract for the prevention of Alzheimer’s disease (GuidAge): a ran-domised placebo-controlled trial. Lancet Neurol. 11, 851–859 .
ohlmuth, H. , Savage, K. , Dowell, A. , Mouatt, P. , 2014. Adulteration of Ginkgo biloba
products and a simple method to improve its detection. Phytomedicine 21, 912–918 .
hang, L. , Lam, W.P. , Lue, L. , Wang, Y.X.J. , Wong, Y.W. , Lam, L.H. , Tang, H.C. , Wai, M.S. ,Mak, Y.T. , Wang, M. , Yew, D.T. , 2011. How would composite traditional chinese
medicine protect the brain - an example of the composite formula "Pien TzeHuang. Curr. Med. Chem. 18, 3590–3594 .
hi, X.R. , Zhang, Z.Y. , Jia, P.P. , Zhang, X.X. , Yuan, L. , Sheng, N. , Zhang, L.T. , 2015. Qual-
itative and quantitative determination of 15 main active constituents in FructusSophorae pill by liquid chromatography tandem mass spectrometry. Pharma-
cogn. Mag. 11, 196–207 .