an effective and efficient testing strategy utilizes qbd...
TRANSCRIPT

An effective and efficient testing strategy utilizes QbD concepts
Characterize
attributes
and perform
risk
assessment
Characterize
process.
Measure the
critical
quality
attribute at
the point
where it is
controlled
Eliminate
redundant
testing
A lean and targeted control strategy eliminates “noise” and puts
focus on what is important to control
Develop
method(s)
specific for
critical
quality
attributes
E.g. MS Based method
(Future State)
A1
A3
A5 Attribute
DS Process
Step
1 2 DS
CQA 1 X X

Control strategy integrates all aspects of process and product controls
Production Process
Procedural controls (facility, equipment and operational parameters)
Input controls (raw materials and components)
In-process testing (validation, IPCs, process monitoring)
What is the right size and scope of end product testing?
(specifications, comparability, stability)
Control elements are well coordinated and integrated in
effective control strategies
3

There are many Elements to the Overall Control Strategy
• Characterize product attributes
• Characterize processes
• Use characterization methods to further define the process capability
• Establish process monitoring
• Raw material controls
• Conduct product formulation studies, understand degradation pathways
• Establish a comparability program
• NC/CAPA system with product characterization and forensics capabilities

Process and product knowledge enable a rational, risk-based specification design
• Critical quality attributes are identified
• Stability and degradation pathway studies enable understanding of process, formulation, device, container, etc on product stability
• Process control points and stability control points for those attributes are identified
• Process characterization studies enable understanding of process capability to robustly clear / control undesired attributes
• A quantifiable and scientific risk-based strategy can be utilized to create a streamlined and focused control strategy

A Holistic Review of the Control Strategy Resulted in Approaches to Revise Existing Specifications
• Removal of tests for impurities with well understood mechanisms for removal and proven process capability
• Removal of redundant tests that are performed at multiple points in the process and move testing to the point at which it is controlled
• Apply Real-Time-Release-Testing (RTRT) where appropriate
• Removal of tests for quality attributes that are well controlled during manufacturing and where adequate detections are in place in manufacturing and quality control to detect issues
• Removal of stability tests for attributes that are not impacted by the known mechanisms of product degradation and do not change over time
Maintain the ability to “bring back” tests, as needed
e.g., for comparability and non-conformance investigations

Application of the Optimised Testing Strategy to mAb X

Removal of tests for process related impurities with well understood mechanisms for removal and proven process capability for clearance

CHOP levels are well controlled through critical operational parameters
• Process characterization studies elucidated operating parameters that influence CHOP level
• Process controls are in place at the Production Bioreactor, Harvest steps and three chromatography steps
• Historical data shows CHOP is consistently reduced to extremely low levels by the first two steps in the purification process (Col. 1 and VI)
• Excess process capacity to clear CHOP has been demonstrated through challenge studies at Column 2 and Column 3
• Of the 3 purification steps that have been routinely monitored for all mAb X commercial batches, there have been no IPC action limit excursions.

Process Consistency and Excess Capacity for Removal of Host Cell Protein has been Demonstrated
CHO Protein in VI Pool
Lot History
CHOP Challenge Study Demonstrates
Excess Clearance Capacity at Column 3
Process Step Normal Process Challenge
Study Results
Column 1 pool 2500 to 3300
ng/mg
2148 ng/mg
VI pool 1 to 2 ng/mg Skip
Column 2 pool 0 to 1 ng/mg Skip
Column 3 pool NT 8.3 ng/mg
(2.4 LRV)

Removal of redundant tests and movement of testing to the most appropriate control point
Attribute Process Step
VI Pool DS DP
CQA 1 X X X
Attribute Process Step
VI Pool DS DP
CQA 1 X
Current Optimized
11

CE- HPLC control point will be moved to VI Pool with
rejection limits
12
Overlay of Historical VI Pool and DP CE-
HPLC % Main Peak
Parameter Name N p-Value
Purification Pool 2 CE-HPLC vs. Drug Product CE-HPLC
246 < 0.0001
Summary of Testing Assessment
• DP release testing is redundant with VI Pool which is predictive of DP results.
Change from VI pool to DP is minor
• Retention of CE-HPLC testing for future comparability exercises to assess
manufacturing changes that may impact CE-HPLC attributes

pH and osmo testing to be moved off of the DS and DP specifications and retained at the Formulation step
13
Formulated Bulk Product and DP pH
Summary of Testing Assessment
• Stringent DS formulation buffer and DP formulation buffer acceptance criteria
• Positive statistical correlation between Formulated Bulk and DP
• IPC testing is redundant with DP release
• Establish reject limit at Form bulk
Parameter Name N p-Value
FBP pH vs. DP pH 142 < 0.0001
Formulated Bulk Product and DP Osmolality
Parameter Name N p-Value
FBP pH vs. DP Osmolality 142 < 0.0001
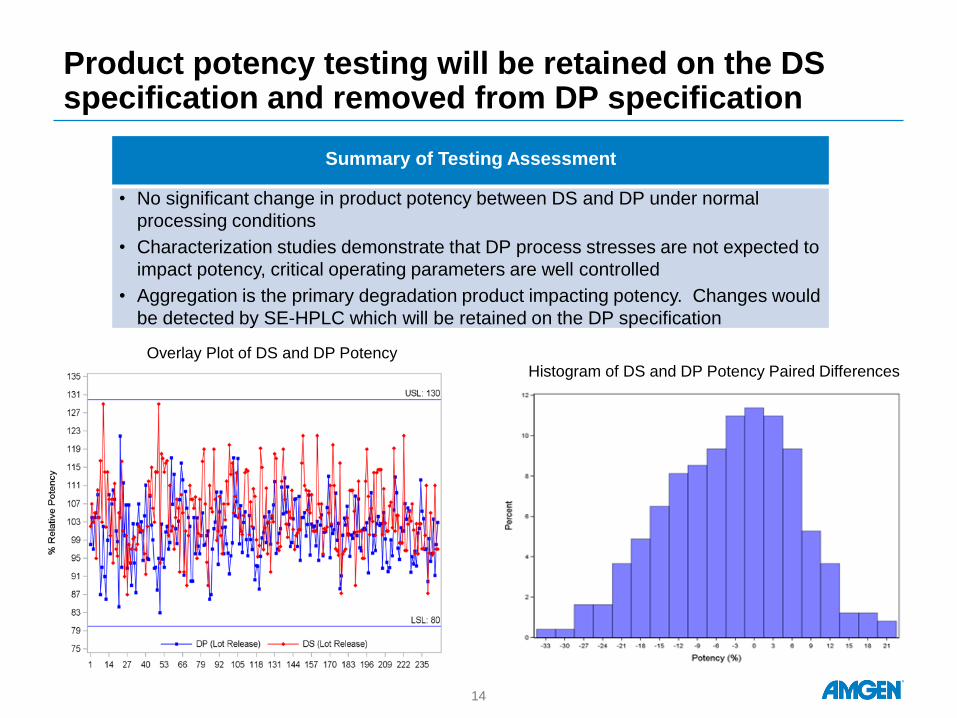
Product potency testing will be retained on the DS specification and removed from DP specification
14
Overlay Plot of DS and DP Potency
Histogram of DS and DP Potency Paired Differences
Summary of Testing Assessment
• No significant change in product potency between DS and DP under normal
processing conditions
• Characterization studies demonstrate that DP process stresses are not expected to
impact potency, critical operating parameters are well controlled
• Aggregation is the primary degradation product impacting potency. Changes would
be detected by SE-HPLC which will be retained on the DP specification

Aggregation is the primary degradation product with the
potential to impact potency. Changes are more readily
detected by SE-HPLC
15
Impact of Accelerated Condition at 60oC of mAb X
Assessed by SE-HPLC and Bioassays
0
20
40
60
80
100
120
0 1 2 3 4 5 6 7 8
Days at 60°C
% R
ela
tive P
ote
ncy
0
20
40
60
80
100
120
% M
ain
Peak
HTRF
Reporter Gene
TRAP
SEC
85
90
95
100
105
110
115
120
0 0.5 1 1.5 2 2.5 3 3.5
% R
ela
tive
Po
ten
cy
Time (Months)
HTRF Bioassay A
98.2
98.4
98.6
98.8
99
99.2
99.4
99.6
99.8
0 0.5 1 1.5 2 2.5 3 3.5
% M
ain
Pe
ak
Time (Months)
SE-HPLC Main Peak B
Impact of Accelerated Thermal Storage Condition at 37C of mAb
X Assessed by HTRF Assays (Panel A) and SE-HPLC (Panel B)
Real Time Release Tests

Proposed Real Time Release Tests
• Proposal to move the lot release test point and retain on the specification
• Protein concentration
• Robust manufacturing controls at the UF/DF and DP formulation steps • Positive statistical correlation (p<0.0001) between UF/DF IPC and DS,
then DS to DP and Formulated Bulk and DP • Proposal is to remove redundant DP release test and replace with real
time release at the formulation step
• Deliverable Volume • Fill weight by in-process testing provides a larger, more statistically
relevant sample size taken across the entire batch
17

Removal of stability tests for attributes that are not stability indicating

Stability Testing for Frozen mAb X Drug Substance
Current State:
(Red—assays to remove)
• Appearance, color, clarity
• CE-HPLC
• SE-HPLC
• rCE-SDS
• Bioassay
• pH
• Protein Concentration
Proposed Actions: Retain
methods which historically have shown change over time at the recommended storage condition (ICH Q5C)
• SE-HPLC
19

Use statistical tools to identify attributes that are not stability indicating
• The lack of significant change observed over time when DS is stored at the recommended storage condition (-30°C) was determined through statistical modeling for quantitative methods
Example - Bioassay
% R
ela
tive P
ote
ncy
70
80
90
100
110
120
130
140
Time (months)
0 6 12 18 24 30 36 42 48
AOFdata.BIOds
___ Predicted Mean __ __ 95% Confidence Bound on Mean
Lot Number
0010023946001003145900100556690010067117001006807600100683330010068338001008852800100893110010110845001011488100101183700010129046001014262400101478440010148022001014850400101557720010173317049C048022049C048023049C080952049D106926049D108163
Lower Spec = 80
Upper Spec = 130
Historical mAb X DS Stability Chart
for Bioassay at the -30C
Recommended Storage Condition.
Individual lots identified, Mean
regression line

Stability Testing for Drug Product
Current State:
(Red—assays to remove)
• Appearance, color, clarity, particulate description
• CE-HPLC
• SE-HPLC
• rCE-SDS
• Bioassay
• pH
• Sub-visible particulates
• Protein Concentration
• Sterility/CCI
Proposed Actions: Retain
methods which historically have shown change over time (ICH Q5C) at the recommended storage condition and those that ensure DP safety
• SE-HPLC
• Sub-visible particles
• Sterility/CCI
21

Statistical Rationale for Removing Attributes that are not Stability-indicating
• The lack of significant change observed over time when DP is stored at the recommended storage condition (5°C) was determined through statistical modeling for quantitative methods.
Example - Bioassay
% R
ela
tive P
ote
ncy
70
80
90
100
110
120
130
140
Time (months)
0 6 12 18 24 30 36
AOFdata.BIO70
___ Predicted Mean __ __ 95% Confidence Bound on Mean
Lot Number
001000702100100070220010007023001007370200100765820010076583001007658400101182610010118714001011907400101375450010166543001017308010263641034781
Lower Spec = 80
Upper Spec = 130
Historical mAb X DP Stability Chart
for Bioassay at the 5C
Recommended Storage Condition.
Individual lots identified, Mean
regression line

Conclusions
• Quality by design principles are improving our basis for process, stability and quality control and offer us the opportunity to have an optimized testing strategy that provides control of important attributes at the appropriate point in the process
• An integrated, risk-based strategy including product quality attribute understanding and process knowledge enables selection of the right methods at the right time
• Many tests and test points can be removed without impacting overall assurance of product quality
23

Acknowledgements
• Chantal Cazeault
• Barry Cherney
• Darrin Cowley
• Alex Mercier
• Karen Miller
• Tony Mire-Sluis
• Tom Monica
24