an ecosystem-based modeling approach: the … an ecosystem-based modeling approach: the chesapeake...
TRANSCRIPT

1
An ecosystem-based modeling approach:
The Chesapeake Atlantis Model
(CAM)
Tom Ihde
Versar, Inc., NOAA Chesapeake Bay Office and
Howard Townsend
NOAA Chesapeake Bay Office

2
Atlantis
Beth Fulton
The Commonwealth Scientific and Industrial Research Organisation

3
Physical environment Geology Chemistry Circulation & currents Temperature Salinity Water clarity Climate variability
Nutrient Inputs Currency is Nitrogen Oxygen Silica 3 Detrital forms Bacteria-mediated recycling
Developing and Applying Tools For Ecosystem-Based Fisheries Management
NOAA Chesapeake Bay Office – Ecosystem Modeling Team
Biological environment Primary production Trophic interactions Recruitment relationships Age structure Size structure Life History
Fisheries Multiple sectors Gears Seasons Spatially explicit
The Chesapeake Atlantis Model (CAM) A Holistic Ecosystem Model
Incorporating:

The Chesapeake Atlantis Model
(CAM)
Design

5
NOAA Chesapeake Bay Office – Ecosystem Modeling Team
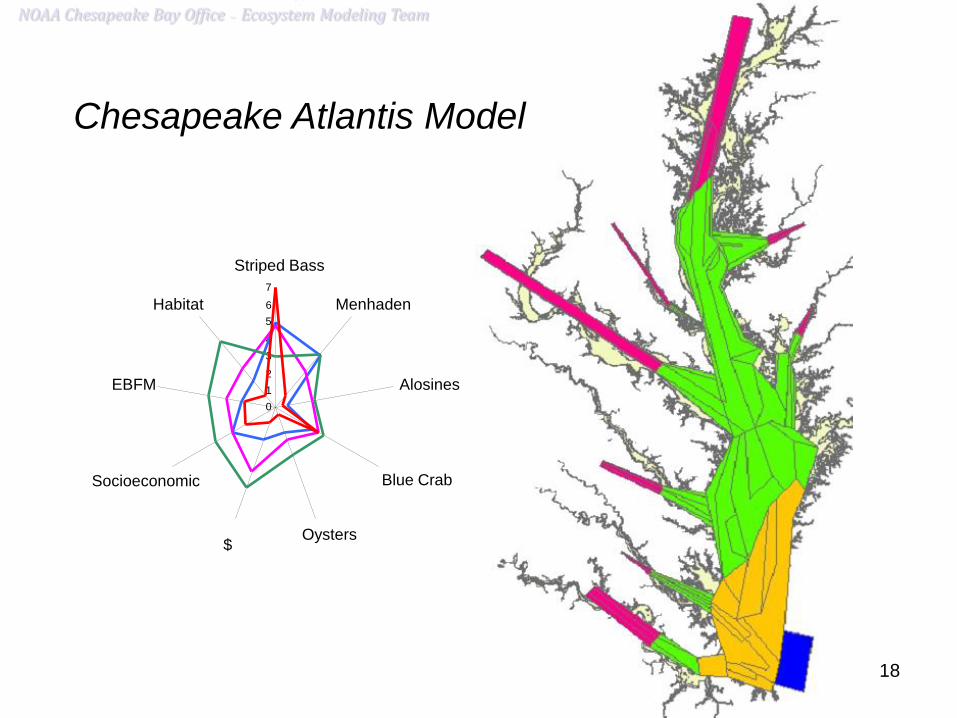
Chesapeake Atlantis Model

6
NOAA Chesapeake Bay Office – Ecosystem Modeling Team
CAM: River Box Structure
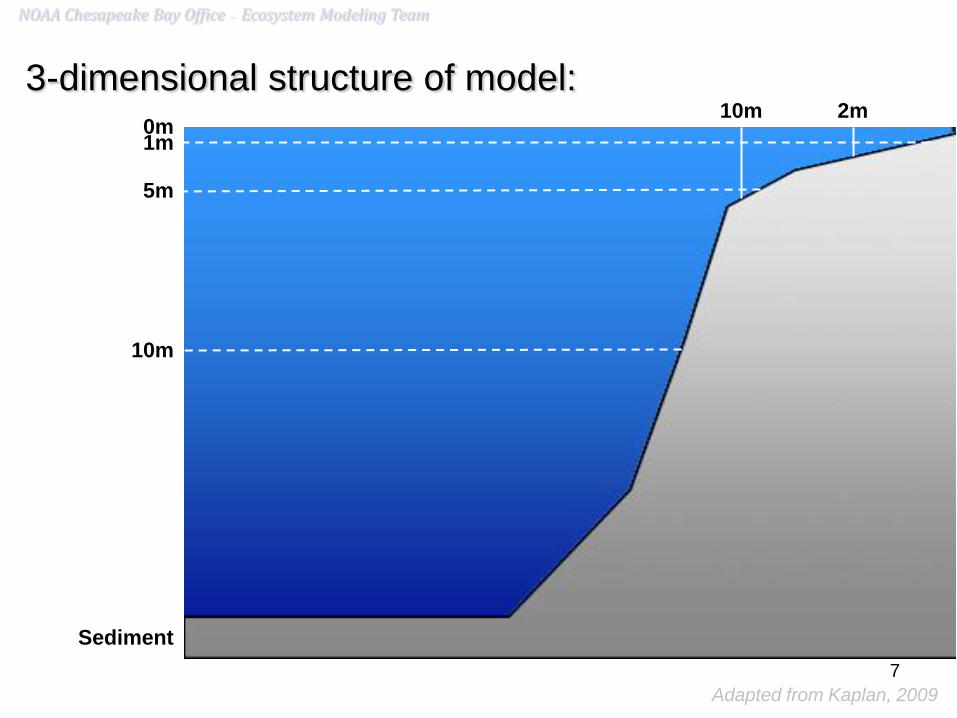
7
0m 1m
5m
10m
Sediment
2m 10m
3-dimensional structure of model:
Adapted from Kaplan, 2009
NOAA Chesapeake Bay Office – Ecosystem Modeling Team

8
0m 1m
5m
10m
Sediment
2m 10m
3-dimensional structure of model:
Adapted from Kaplan, 2009
Hardbottom
or
Softbottom
Salinity:
0-10 ppt
>10-18
>18

9
Finfish - Alosines (Amer.Shad, Hickory Shad, Alewife & Herring)
- Atlantic Croaker
- Bay anchovy
- Black drum
- Bluefish
- Butterfish, harvestfish (“Jellivores”)
- Catfish
- Gizzard shad
- Littoral forage fish: silversides, mummichog
- Menhaden
- Striped bass
- Summer flounder
- Other flatfish (hogchoker, tonguefish, window pane, winter flounder)
- Panfish:
Euryhaline: Spot, silver perch; FW to 10ppt: yellow perch, bluegill
- Reef assoc. fish: spadefish, tautog, black seabass, toadfish
- Spotted hake, lizard fish, northern searobin
- Weakfish
- White perch
Elasmobranchs - Cownose ray
- Dogfish, smooth
- Dogfish, spiny
- Sandbar shark
Birds - Bald Eagle
- Piscivorous birds (osprey, great blue heron, brown pelican, cormorant)
- Benthic predators (diving ducks)
- Herbivorous seabirds (mallard, redhead, Canada goose, & swans)
Mammals - Bottlenose dolphin
Reptiles - Diamond-back Terrapin
- Seaturtles
Invertebrates - Benthic feeders: (B-IBI “CO”+”IN”) …,
- Benthic predators: (B-IBI “P”) …,
- Benthic suspension feeders: (B-IBI “SU”)
- Blue crab YOY
- Blue crab adult
- Brief squid
- Macoma clams: (B-IBI)
- Meiofauna: copepods, nematodes, …,
- Oysters
Primary Producers - Benthic microalgae (“microphytobenthos” benthic diatoms, benthic cyanobacteria,
& flagellates)
- “Grasses:”
SAV – type varies with salinity
- Marsh grass
- Phytoplankton – Large: diatoms & silicoflagellates (2-200um)
- Phytoplankton – Small: nannoplankton, ultraplankton,
aka “picoplankton” or “picoalgae” (0.2-2um),
cyanobacteria included (2um)
- Dinoflagellates (mixotrophs) (5-2,000um)
ZooPlankton - Ctenophores
- Sea nettles
- Microzooplankton (.02-.2mm): rotifers, ciliates, copepod nauplii
- Mesozooplankton (.2-20mm): copepods, etc.
Detritus - Carrion
- Carrion (sediment)
- Labile
- Labile (sediment)
- Refractory
- Refractory (sediment)
Bacteria (.2-2 um [.002 mm] - feed microzooplankton food chain)
- Benthic Bacteria (sediment)
- Pelagic Bacteria: (free-living)
Ecological Groups in CAM

10
System
Features
Modeled
CAM EwE MS SS
X Forced
X X X
X X X X
X X X X
X
X X X X
X
X
X
X Forced Forced Forced
X Forced Forced Forced
X
X Forced Forced Forced
X X X X
X X
X
Yes No No No
Direct(N) Indirect(N)
NH3
NO2
Si
D.O.
X X
X X
X X
X X
Dimension
Primary Production
Trophic Interaction
Recruitment relationships
Age structure
Size structure
Life history rates
Geology
Chemistry
Circulation & currents
Temperature
Salinity
Turbidity
Climate variability
Multiple sectors
Multiple gears
Seasonal shifts
Spatially explicit
Nutrient Inputs
Monitoring
Assessment
Management
Implementation
Biological:
Physical:
Fisheries:
Spatial:
Nutrients:
Fisheries Management:
In Progress

11
Daily oceanographic fluxes (water, heat, salt) into and out of each box are controlled by
a ROMS (Regional Ocean Modeling System ) oceanographic model by Raleigh Hood, UMCES-HPL/
Image from Li and Zhong, UMCES-HPL
NOAA Chesapeake Bay Office – Ecosystem Modeling Team

EXTRA SLIDES

13
Modular Components: • Biogeophysical
• Fisheries (harvest)
• Assessment/ Management triggers
• Socioeconomics
Program Code • C++
• NetCDF
Atlantis Architecture

The Chesapeake Atlantis Model
(CAM)
Benefits

15
Atlantis Management Strategy Evaluation (MSE)
PERFORMANCE
MEASURES
DEFINE
OBJECTIVES
Biophysical
Industry
Monitoring
Assessment
Implementation
Management
Simulation Cycle Manager Roles
Modified from E. Fulton
NOAA Chesapeake Bay Office – Ecosystem Modeling Team

16
Atlantis Management Strategy Evaluation (MSE)
PERFORMANCE
MEASURES
DEFINE
OBJECTIVES
Biophysical
Industry
Monitoring
Assessment
Implementation
Management
Simulation Cycle Manager Roles
NOAA Chesapeake Bay Office – Ecosystem Modeling Team
Modified from E. Fulton

17
Tradeoffs - Hypothetical
Least Stringent Scenario
Partial TMDL goals met
100% TMDL goals met
Status quo
0
1
2
3
4
5
6
7
Socioeconomic
$
EBFM
Habitat
Striped Bass
Menhaden
Alosines
Blue Crab
Oysters
For Illustrative Purposes Only -- Not Based on Actual Modeling Results
CAM Output 20 year Simulation
NOAA Chesapeake Bay Office – Ecosystem Modeling Team
18
NOAA Chesapeake Bay Office – Ecosystem Modeling Team
Chesapeake Atlantis Model
0
1
2
3
4
5
6
7
EBFM
Habitat
Striped Bass
Menhaden
Alosines
Blue Crab
Oysters $
Socioeconomic

19
Tradeoffs CAM Output
20 year Simulation
0
2
4
6
8
10
12
0
2
4
6
8
10
MD
VA
For Illustrative Purposes Only -- Not Based on Actual Modeling Results
Striped Bass
EBFM
Habitat Menhaden
Alosines
Blue Crab
Oysters $
Socioeconomic
EBFM
Habitat
Striped Bass
Menhaden
Alosines
Blue Crab
Oysters $
Socioeconomic

20
Tradeoffs CAM Output
20 year Simulation
For Illustrative Purposes Only -- Not Based on Actual Modeling Results
0 2 4 6 8 10 12
0 2 4 6 8 10
0
5
10
15
0 2 4 6 8 10 12
Potomac
Rappahannock
York
James
Mid-Bay
0
5
10
15
Lower-Bay
0
5
10
15
Focus areas:
0 2 4 6 8 10 12
0
5
10
15
Choptank
Nanticoke
Susquehanna/
Upper-Bay 0 2 4 6 8 10 12

21
NOAA Chesapeake Bay Office – Ecosystem Modeling Team
Every 12 hours simulation-time…
x
56 ecological groups
97 spatial polygons
5 vertical depth layers x
33 fisheries x
= ~900,000 parameter estimates

22
Output Scads of output:
Though we try to limit, could potentially have
>100 GB of output for a run (current runs
generate ~ 3-5 GB)

23
MPA planning in E.S. context
ITQ’s/
“catch shares”
Evaluate
ecological
indicators
Sustainability of fisheries in context of climate change:
Evaluate economic pressures
Effort allocation
Gear choice
Eutrophication most critical
A few key species
capture the major ecosystem impacts
Ecosystem models identify
impacts single-species
models miss
Developing and Applying Tools For Ecosystem-Based Fisheries Management
NOAA Chesapeake Bay Office – Ecosystem Modeling Team

24
Marine and Atmospheric Research
Thanks to: