an economic interpretation of etf evolution suggestions ... · horizontal approach, (2) following...
TRANSCRIPT

AN ECONOMIC INTERPRETATION OF ETF EVOLUTION: SUGGESTIONS FOR CHINA ETF INNOVATION
周 昆 K. Victor Chow1
Professor of Finance, West Virginia University Visiting Financial Economist, Shanghai Stock Exchange
ABSTRACT Exchange Trade Funds (ETF) perhaps are one of the most significant and successful financial innovation in that past decades. This manuscript provides not only a brief survey of the ETF development but also the economic interpretation of ETF evolution. Specifically, demand for market basket from the theory of mutual fund separation is the fundamental driving force for index instruments. Arbitrage process toward market equilibrium explains the need for continuously tradable index tracking products. The arbitrage theory is also crucial for the explanation of ETF expansion. The paper demonstrates that the ETF expansion should consider the replication of risk-factor borne by investors: in addition to the market risk factor, there are four factors, value, momentum, contrarian, and liquidity. Importantly, this article conservatively makes few suggestions for the ETF innovation in China. From the viewpoint of fair-market equilibrium, this research paper recommends the allowance of conditional short-sale of ETF products. The money market ETF could be an important ETF innovation in China. It attracts non-speculative investors or savers and increases Stock Exchange's activities. The development of ETF derivatives is also necessary to eliminate unnecessary arbitrage opportunity and further promote market efficiency. Finally, this article proposes a simple centralized model using ETF for facilitating China Share Reform. 1 I wish to thank the Shanghai Stock Exchange for providing financial support for this research. I also want to thank Fang Xinghai, Hu Ruying, Tang Xuan, Zeng Gang, Fu Hao, Shi Donghui, Liu Ti, Situ Danian, Lu Wenyin, Gu Yanxiang, Wang Fenghua and all seminar participants at the Shanghai Stock Exchange for their helpful comments and suggestions. Administrative assistances from various departments at Shanghai Stock Exchange including the department of Human Resources, the department of finance, and the department of administration are greatly appreciated. All opinions herein are my own and do not necessarily reflect those of the Shanghai Stock Exchange, or the University of West Virginia.

I. Introduction
Exchange traded funds (ETFs) – though ‘ETF’ may still be a buzz-word to many
investors – are becoming one of the most popular and important investment products available to
both institutional and retail investors, developed in the last ten to fifteen years. Since its humble
beginnings in Canada’s Toronto Stock Exchange and the American Stock Exchange, exchange
traded funds have proven to be innovative, effective, and on the cutting edge of investing.
Although countless articles have been written explaining what ETFs are, why investors may
benefit from using them in their investment portfolios, and/or how the ETF affects market
liquidity and volatility, there is no theoretical explanation about the demand for ETF and its
important function toward market efficiency.2 One of the purposes of this article is to summarize
the development of ETFs and provide a rational economic interpretation of ETF evolution.
As reported by Bloomberg, by the end of 2004, the worldwide ETF market included 329
different funds with $313.2 billion in assets under management. Of that market the United States
had an astonishing $227.7 billion in 152 portfolios (see Ackermann, M (2005)). ETFs have
grown in popularity with both short-term and long-term investors for a number of reasons,
including their net asset value pricing model, tax efficiency, low costs, liquidity, and flexibility.
ETFs are considered to be a hybrid between traditional mutual funds – particularly those that
track indices - and equity stock. ETF shares can be traded like any other share on major stock
exchanges, as investors may take long or short positions, buy on margin, and even purchase
options contracts on the funds. Unlike mutual funds which are traded only at the end of the day,
ETFs are traded throughout the trading day just as common stocks are. Like an indexing mutual
fund, each share represents a basket of stocks held by the ETF. The stocks generally track a
specified index which could be a well known index such as the Standard & Poor’s 500 Index or
it could track a specific country, sector, or industry.
ETFs offer many of the same benefits as traditional mutual funds, particularly instant
diversification. Most retail investors cannot afford to adequately diversify their portfolios or to
successfully track an index. Instead, investors may invest in mutual funds and ETFs as a way to 2 In addition to newspaper reports and professional magazine articles, there are many academic papers focus on the analysis of ETF. For example, Elton, Gruber, Comer and Li (2002) analyze the performance of ETF. Chu, Hsieh and Tse (1999) and Chu and Hsieh (2002) address the issue of pricing efficiency of ETF. Hasbrouck (2003) investigates price discovery of ETF. Hedge and McDermott (2004) examine the market liquidity of ETFs and their underlying securities.
1

claim ownership in a huge basket of stocks that they would otherwise not be able to own.
Evidence shows that the growing popularity of ETFs comes from investors who have invested in
traditionally managed mutual funds. Though mutual funds have become exceedingly popular,
most fund managers have not been able to consistently beat the market. As a result, investors
naturally tend to hold the market funds, since aggressive fund managers fair to beat it. In
addition, long-term, buy-and-hold investors prefer ETFs to open-end index funds because of
their tax advantages. ETFs are tax advantageous in comparison to traditional mutual funds in
that ETFs rarely have to make capital gains distributions to its holders. This is true for two
reasons. First, the funds are not actively managed. That is, the assets of the fund are not actively
bought and sold as with traditional mutual funds. The only time that the make up a fund is
changed is when the make up of its underlying index changes. Second, the creation/redemption
procedure for ETFs is tax efficient. With a traditional mutual fund, when demand for the fund
decreases fund managers must sell some of the underlying assets and thus create capital gains for
the investors who continue to hold the fund. ETFs conversely are set up so that fund managers
may trade with investors in the primary market, shares of the ETF for proportionate baskets of its
underlying stocks and vice versa to adequately meet the demand for the ETF. With this method
of redemption, low capital gains are realized and thus a lower tax burden to investors.
Investors prefer investment of ETF to that of closed-end funds because that ETFs trade at
or very close to the net value of its underlying assets, free of any substantial premium or discount.
This is mostly a result of the creation and in-kind redemption structure of ETFs. Because large
investors in the primary markets can easily exchange baskets of stocks for ETF shares and vice
versa, they may readily harp upon any disparity between the trading price of the ETF and the
underlying NAV and thus keep the ETF trading at or very close to its NAV. While the benefits
and growing popularity of exchange traded funds is becoming clearer, there is no rational
economic explanation of the evolution of ETF. This article attempts to fulfill this gap.
The creation of ETF originates from the demand for market basket products (Rubinstein,
1989). In fact, this demand for index product has been implicitly documented by the theory of
mutual fund separation (Ross, 1976). Under the equilibrium, the efficient set of investment
alternatives can be fully characterized by a zero-systematic risk asset and fully diversified market
portfolios. Investors are able to allocate their efficient investment by a combination of risky-free
bond and index funds according to their different degree of risk-aversion. The arbitrage process
2

eliminates arbitrage profit, discover prices and promote efficiency. Nevertheless, this process
requires basket or index instruments have high tracking ability, a continuous market through time,
and low creation and trade execution costs. The natural evolution of ETF is to meet this market
requirement as the traditional index funds fail to do so.
For well-diversified portfolios of assets, the idiosyncratic risk is eliminated, and the risk
can be quantified as the systematic risk or technically as the beta risk. The beta risk is linear in
nature. This manuscript demonstrates that the linearity of beta risk creates arbitrage opportunity
such that investors are able to combine different market baskets – though they are all efficient in
the risk-return trade off – to form arbitrage portfolios. This provides an incentive for the
expansion of ETF. I classify the expansion of ETF as the ETF decomposing into two ways: (1)
there is a tendency of horizontal expansion. The core market ETF is decomposed into a set of
sector ETFs. For instance, Dow Jones U.S. sector ETFs can be viewed as the decomposed ETF
of Dow Jones total market index ETF; (2) contrary to horizontal expansion, the vertical
expansion naturally occurs by decomposing the core market ETF by different characters such as
Dividend ETF, Capital-Gain ETF, Value ETF, and Growth ETF. The decomposing expansion
of ETF also indicates that investors seek not only immediate risk diversification but stock
selection based on some preferable selection criteria.
The investment preference selection of investors shows that the possible next expansion
of ETF could be the transform of passive market index oriented ETF to the aggressive nature of
managed ETF. However, different from traditional aggressive mutual funds, many owners of
ETF may demand transparency so that they are able to, at any time, look into the baskets. This
paper attempts to analyze the possibility of this kind of ETF expansion. The second purpose of
the article is to provide suggestions to the Shanghai Stock Exchange for the innovation of ETF in
China. It is important to note that allowing short-selling on ETF, particularly for market index
ETFs covered by put options writing, could be a smooth approach to release the short-sale
restriction in China equity market without any significant instability. This article suggests that
forming a ETF trust fund by converting state shares into ETF with a portfolio insurance using
ETF put options could significantly promote China stock market stability in the post share
reform period. The author of this manuscript strongly recommends that any expansion of ETF
products could follow the guideline of vertical and horizontal expansions of market baskets and
importantly the parity relationship among different ETF instruments and markets.
3
The remaining of this paper is organized as follows: Section 2 presents a theoretical
interpretation of demand for market baskets. The theories of two-fund separation and arbitrage
behaviors explain the development of ETF. Section 3 describes the ETF development from
1980s to 2000s in the U.S. financial markets. Section 4 surveys several important academic
literatures about ETF performance, market liquidity of the underlying securities of ETF, price
formation process and price discovery of ETF and other issues. In Section 5, I demonstrate the
importance of ETF derivatives. The invisible hand toward market equilibrium through arbitrage
process across markets is carefully documented in the section. The index arbitrage shows the
importance of ETF futures contracts. Section 6 provides suggestions for China ETF innovations.
These suggestions can be summarized as (1) the expansion of ETF based on the vertical and
horizontal approach, (2) following the market nature of arbitrage process toward equilibrium by
allowing short-sale on market ETFs, (3) carefully designing derivatives for serving the purpose
of risk-diversification, and (4) fully utilizing ETF and its derivative for market stability of the
post China Share Reform. Finally, a conclusion remark is provided in Section 7.
II. DEMAND FOR ETF: A THEORETICAL INTERPRETATION
Although exchange-trade funds (ETF) are the most significant and successful financial
innovation in the recent history, the theory of this development has been documented for almost
three decades. In fact, the ETF development can be viewed as a natural evolution of financial
products to meet the demand of investors' risk behaviors.
II.1 Two-fund Separation: Demand for Index Funds
The theoretical of ETF evolution relies on the theory of mutual fund separation. David
Cass and Joseph Stiglitz (1970) derive conditions for two-fund separation. The separation means
that under certain conditions such that investors' risk preference and utility function is irrelevant
to the investment choice of individual securities and/or their combinations (portfolios). All risk-
averse investors agree that the optimal investment choice depends on a linear combination of two
funds: a risk-free bond fund and a risky index portfolio. Cass-Stiglitz show that in an incomplete
market, the two-fund separation holds for a class of utility functions called as Hyperbolic
Absolute Risk Aversion (HARA) utility class. Without a risk-free asset, the separation holds
4

only for quadratic and constant relative risk aversion (CRRA) utility funds. Although Cass-
Stiglitz two-fund separation is usually applied in a static framework without considering
portfolio rebalancing, it is also valid for analyzing dynamic strategies. Besnainou, Jordan and
Portait (2001) demonstrate that in the dynamic framework, portfolio rebalancing, as opposed to
a buy-and-hold strategy, is necessary to two-fund separation. Specifically, investors need to
synthesize a risk-free asset or a zero-beta portfolio as time passes. It is important to note that the
portfolio rebalancing requires a continuous trading process among cash, bonds and mutual funds.
Robert Merton (1971, 1973) shows that within an explicit dynamic framework and
without restrictions to the way risk-aversion parameters may vary as in the Cass-Stiglitz
approach, investors’ investment choices depend on two funds in an arbitrage-free market. Again,
one fund is a risk-free portfolio, and another fund is the growth-optimal risky portfolio. In the
dynamic framework, increasing risk aversion can be reflected by decreasing weight in the
growth-optimal portfolio, and consequently increasing weight in cash. This indicates the optimal
choice of investment could be continuously moving along a linear tradeoff between the two-fund.
This is the market equilibrium that is agreed by all investors regardless their rsik-reference.
Stephen Ross (1976) Let the return generating process of asset follows a linear format such that
jmjjj rr εβα ~~~ ++= , where jr~ is the returns on asset j, jα is a non-dynamic term, mr~ is the index
return of risky securities, and 0)~~( =mj rE ε ; the conditional mean of noise term on the index
return is zero. Stephen Ross (1976) demonstrates that without any restriction on utility functions,
the two-fund separation holds. This condition of the linearity of returns ensures the irrelevance
of investor risk-preference to the individual asset choice. From the above two-fund separation
theory, ETF is superior to the traditional (open-end) index mutual fund in that ETF is
continuously tradable in the open market. That is, the traditional index funds are unable to
ensure the separation result. In addition, the arbitrage theory is able to explain the existence of
ETF.
II.2 Arbitrage Process toward Pricing Equilibrium
For a purpose of simplicity, let’s consider the following numerical example. There are
three well diversified portfolios (with no idiosyncratic risk) have risk and returns as:
Portfolio A Portfolio B Portfolio C
5

Expected Return 0.06 0.09 0.11
Systematic Risk 0.5 1.0 1.5
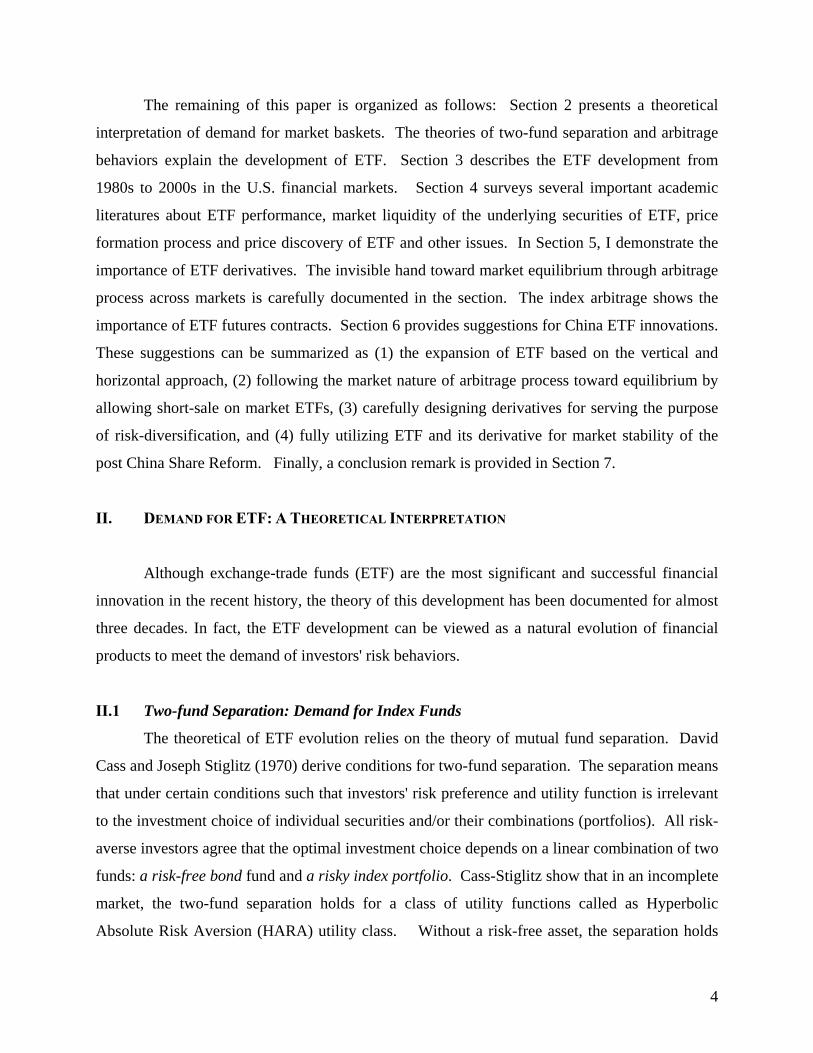
Since the systematic (or ß) risk is linear in nature, one is able to form a zero-beta portfolio using
A and C such that CAAAz ww βββ )1(01 −+== . By substituting the betas of A and C into the
equation and solving for wA, we have wA = 1.5, and wC = -0.5. That means that for an investment
with net worth of $100, to form a zero-risk portfolio (Z1), one could short A for $50 and
simultaneously long $150 of C. The return of Z1 is then equal to 0.035 (1.5x0.06-0.5x0.11).
Meanwhile, another zero-beta portfolio can be constructed by combining B and C. That
is, CBBBz ww βββ )1(02 −+== )1(5.1 BB ww −+= , wB = 3, and wC = -2. Interestingly, the
return of this zero-beta portfolio, Z2, is equal to 0.05, which is higher than that of Z1. Since both
Z1 and Z2 are risk-free, one obtains risk-less arbitrage profit by shorting Z2 and purchase Z1.
Figure 1 depicts this risk-return relationship among well-diversified risky portfolios A, B and C.
Although this relationship is infeasible under the equilibrium, it necessarily exists for the market
making process toward equilibrium. I discuss this issue as follows:
6
Figure 1
Infeasible Arbitrage relationship between Expected Return and Risk for Well-Diversified Portfolios
Expected Return
CB
Z2
A
Z1
Systematic Risk
7

Arbitrage opportunity dependents on three parameters: Investment, Risk and Return. If a
project requires no Investment (no out of pocket cash outlay), the project has no risk, and the
return is positive, then an arbitrage opportunity exists. Alternatively, if there is a positive
investment outlay, the project is risk-free, and the return is higher than the market risk-free rate,
then the arbitrage also appears. The above example such that the return of Z2 is higher than that
of Z1 clearly indicates the existence of arbitrage. Arbitragers take the arbitrage profit, whenever
they found the opportunity. For example, shorting Z2 means that the investor will
simultaneously short sell portfolio B and purchase portfolio C. At the same time, the arbitrager
long Z1 by buying A and Shorting C. Consequently, through this arbitrage process, the buying
pressure will increase A’s price, and the selling pressure pushes down the B’s price.
Consequently, portfolios A, B and C risk-return are priced as a linear relationship. That is, no
matter how one form zero-beta portfolios among A, B and C, the result is the same. The return
of all zero-beta portfolios is identical and unique, the price is fair to all buyers and sellers, and
thus equilibrium exists. Importantly, this indicates that the equilibrium is non-static and is in fact
dynamic through a continuous arbitrage process.
There are three important characteristics of Exchange Trade Funds that make them as
very useful tools for arbitrage process. First, ETF are continuously tradable during the market
opening period; Second, ETF are well-diversified portfolios; and Third, ETF are tracking
instruments with very small tracking errors. Following the above example of arbitrage process
toward pricing equilibrium, portfolios A, B and C must be well-diversified portfolio, index
instruments, and tradable for all investors. Traditional index funds fail to do so. For open-end
funds, although they behavior as indexes, these funds are not tradable during the daily trading
hour. For closed-end index funds, there is a large tracking error, and thus it is surely unsuitable
for arbitrage process. Note that this arbitrage process occurs at the spot markets, and thus index
futures contracts are not useful. Consequently, the exchange trade funds or index tracking stocks
are financial products from natural market evolution. Specifically, the necessary arbitrage
process for market equilibrium promotes the creation of ETF. Since there is infinite number of
diversified portfolios (or funds) along the efficient frontier, the arbitrage opportunity caused by
the dynamic infeasible but existing non-linear relationship among funds is obviously infinitive.
In summary, the reason of creating ETF is simply a market evolution of pricing efficiency, and
this creation and/or innovation will be continuous and expanding.
8

II.3 Index Arbitrage: Motivation for ETF Creation
The arbitrage process toward price equilibrium not only exists in the cash market but also
appears across different markets, for example between Spot and Futures markets. It is well
known that in theory, futures prices are determined by force of arbitrage. There is an invisible
hand for keeping the price balance between futures and its underlying spot assets. When
arbitrage opportunity exists, markets are not in equilibrium, and traders will quickly act to
exploit arbitrage profits. The arbitrage process always involves simultaneous execution of long
and short activities. An arbitrage profit is risk-less, involving a positive cash inflow at one or
more dates, and zero cash flows at all date. That is, arbitrage requires no investment and no cash
outlay, and the arbitrageur generates only cash inflows at one or more dates.
To illustrate the arbitrage process between a stock index and its futures contract, I employ
a hypothetically numerical example. Consider a value-weighted index of 3-stock.
Stock Current Price Share
Outstanding
Market Value Weight
A 60 250,000 15000000 0.3
B 25 600,000 15000000 0.3
C 10 2,000,000 20000000 0.4
Suppose stock A will trade ex-dividend in the amount of $1.0/share 10 days from today. Stock B
will trade ex-dividend in the amount of $0.6/share 45 days from today. Stock C pays no
dividends. The maturity of an index futures contract is 70 days from now. We may graph these
future dividends in a time line as follows:
0 10-day 45-day 70-day
|------------- | -----------------------------------------|----------------------- |
D1=$1/share D2=$0.6/Share Maturity
9

If the futures contract is priced at 1199 (with a value of 1199*250 = $99,750/Contract), is there
any arbitrage opportunity? From the theory, the futures value (F) is equal to the spot price (S)
pluses the carrying cost (CC) and minuses the carrying returns (CR) such that
F = S + CC – CR. For stock index futures, the carrying is the interest income of holding the
index, and the carrying returns are dividend incomes that investors hold until maturity of the
futures. Suppose the risk-less rate of interest rate is 5% per year, then the holding period interest
rates for dividends and/or current cash until maturity of the futures contracts (70-day) can be
calculated as:
Holding Period Today to 70-day 10-day to 70-day 45-day to 70-day
Interest Rate 0.96% 0.82% 0.34%
Thus, the carrying cost (CC) can be calculated easily as
CC = 1200 x 0.96% = $11.51.
However, to calculate the futures value, particularly for the carrying costs (CR), investors must
form a portfolio of stocks to replicate the index. First, one needs to determine how many shares
of the underlying stocks A, B and C to purchase. Consider that the market value of spot is
$300,000 (=1200*250). By using the weights that has been determined in the previous table, the
number of shares for replicating the index can be determined in the following table:
Stock Cash Value of stock
in 250 Shares of Index
Number of Share needed to
Replicate the index
A 90000 1500
B 90000 3600
C 120000 12000
The CR of stock A is then computed as CRA = [1500 * $1 * (1+0.82%)]/250 = $6.05, and that of
stock B is $8.67, where CRB = [3600 * $0.6 * (1+0.34%)]/250. Consequently, the index futures
should be priced at F = 1200 + 11.51 – 6.05 – 8.67 = 1196.79.
The current futures price of 1199 is higher than the theoretical value such that F > S + CC
– CR or F–( S + CC – CR) = 2.21 > 0. There is clearly an opportunity of arbitrage, and the
traders and/or market makers will re-act immediately to take the profit. The amount of arbitrage
10

profit is approximately $550/contract. This is the Index Arbitrage. To implement the arbitrage
trading, traders will perform the cash-and-carry arbitrage as follows:
Today: Cash
(1) Buy the component stocks of the index in
the appropriate weights, so that the index is
replicated: Buy 1500 shares of A, 3600 shares
of B and 12000 shares of C
- $300,000
(2) Borrow the foregoing amount for 70-day, at
a holding period rate of 0.96%
+ $300,000
(3) Sell one future contract at its current futures
price of $1199 (no cash flow results; use a
bank letter of credit, or securities, to meet
initial margin requirements)
0
Total initial Cash Flow 0
10-day: Cash
(1) Receive dividends from Stock A ($1/share
for 1500 shares)
+ $1500
(2) Save or lend dividends for 60 days at a
holding period rate of 0.82%.
- $1500
Total Cash Flow 0
45-day: Cash
(1) Receive dividends from Stock B
($0.6/share for 3600 shares)
+ $2160
(2) Save or lend dividends for 25 days at a
holding period rate of 0.34%.
- $2160
Total Cash Flow 0
On the Delivery Date (70-day): Cash
11

(1) Sell 1500 shares of A, 3600 shares of B and
12000 shares of C at the market prices
+ (1500 SA(T) + 3600 SB(T) + 12000 SC(T) )
(2) Repay loan and interest - $300,000 (1+0.96%) = -302,880
(3) Buy (offset) the futures contract at FT +F0 - FT = 299750 - (1500 SA(T) + 3600 SB(T) +
12000 SC(T) )
(3) Receive Payment from lending of $1500
for 60-day
+ $1500 (1+0.82%) = + 1512.30
(3) Receive Payment from lending of 2160 for
25-day
+ $2160 (1+0.34%) = + 2167.34
Total Arbitrage Profit $550/Contract
From the above simple example, it is clear that the index arbitrage promotes the need for stock
basket trading. Unfortunately, before the introduction of ETF, the basket trading requires a large
amount of capital and a simultaneous execution of trading (i.e., program trading). Therefore,
only few capable institutional traders are able to conduct index arbitrage, and thus, it increases
market inefficiency and potential market risk of irrational behavior. The US stock market crash
of 1987 is a typical case. Under a computerized program trading for executing a set of large
number of stocks, it may cause a very significant and irrational market movement. For instance,
when futures contracts are priced below their theoretical value, a negative basis, arbitrage profit
exists by buying futures and simultaneously shorting or selling the underlying stocks. This
arbitrage process is taken in a very short period of time. A wide range of selling pressure
appears in the stock market creates panic selling force from individual investors and/or
speculators. Consequently, it results a market crash. To prevent this type of market crash, the
most effective approach is to naturally eliminate the program trading by allowing all investors to
participate index arbitrage process. That is, if the basket trading is available for even a small
investors (it is no longer a special privilege to few large institutional traders), then the arbitrage
opportunity is almost infeasible, and the market becomes efficient. ETF was created for this
purpose.
12

II.4 Guidelines for ETF Innovation
One of the key factors for ETF innovation is to provide perfect instruments for arbitrage
process and for all investors. There are eighteen characteristics to have an ideal market basket
instrument (the ETF):3
(1) it represents an important component of risk borne generally by investors;
(2) it should have low tracking error;
(3) it has a continuous market through time;
(4) it has low creation costs;
(5) it has low trade execution costs;
(6) it has low inventory carrying costs;
(7) it preserves or enhance tax benefits;
(8) it has full collateralization;
(9) it passes through voting rights;
(10) it is offered in small enough unit size to appear to small investors;
(11) it has a predetermined long life before forced liquidation or turnover;
(12) it does not provide incentive to manipulate price illegally;
(13) it is part of related system of securities permitting desirable variations in patterns of
returns;
(14) it is not subject to various miscellaneous security regulations;
(15) it possess a number of desirable trading features;
(16) it is simply described to potential investors and readily accessible price quotations;
(17) it is consistent with existing securities regulation; and
(18) it removes all basket-motivated trading away from the individual securities
comprising the basket.
These characteristics can be summarized as: First, the creation of ETF is to mimic an important
component of risk borne generally by investors. For example, a broad market index ETF
quantifies the systematic risk that is un-diversifiable for general investors. A sector ETF tracks
the price volatility of a subset of the board market (a specified industry). The volatility of a fixed
income ETF represents the interest rate risk. Second, ETF must be a perfect tracking instrument
3 These characteristics have been proposed by Mark Rubinstein (1989)
13

such the change of net asset values of fund is equal to price movement of the underlying index.
Third, ETF must be accessible for general public investors. Fourth, the protection to investors is
ensured. Finally, ETF minimizes market imperfection such as regulative restrictions, taxation,
and transaction costs. In addition, the creation of ETF must consider short-sale allowance.
With short-sale restriction, the arbitrage process for fail price discovery is incomplete, the price
equilibrium is unable to reach, and the market will be inefficient.
III. THE HISTORY OF ETF
Just months after Black Monday, a general manager of the Toronto Futures Exchange
(TFE) named Andrew Clademenos was appointed director of derivative markets at the TFE in
January 1988. Clademenos approached his new task determined to breathe new life into the
incredibly volatile market. The Futures Exchange had not lived up to its earlier expectations,
mainly due to fierce competition from the Chicago and New York futures markets, and
Clademenos was resolute to inject more vigor into the futures market by introducing new
products.
III.1 Toronto Index Participation Units:
Whilst Clademenos and the researchers at the TFE worked diligently to create a product
that might bring a new life to the exchange, independent futures and options traders grew
exceedingly scarce. They grew so scarce, in fact, that the TFE began taking drastic measures to
bring in international investors. In the summer of 1988, advertisements sponsored by the
exchange appeared in the South China Morning Post offering to help traders interested in futures
trading in Toronto to qualify as immigrants through Ottawa’s business immigration program.
The TFE offered letters of recommendation to immigration officials to Hong Kong traders who
could deposit a minimum of $100,000 into a trading account with the futures exchange and
provide guarantees that they would remain active and independent traders for some time.
Then, on 13 October 1989 things got even worse. The proposed financing arrangements
of a proposed purchase of the parent company of United Airlines Inc., UAL Corp., collapsed.
Investors, fearing that other debt financed takeovers would share the same fate, began frantically
dumping their stocks. The values of the NYSE and the TSE both fell drastically, the worst
market meltdown since Black Monday. At this point in time, many analysts believed that, as in
14

1987, several adverse financial and economic developments were coalescing to unnerve
investors’ confidence. Indeed, they were right. The TSE soon plummeted to its fourth-worst
trading day in history. Retail investors were simply too nervous to play the volatile market.
This downtime in the market fostered an intense turf war between exchanges over both
retail and institutional investors. The TSE was competing with the Montreal Exchange for
domestic institutional and retail investors. They were also competing with New York and
Chicago exchanges for institutional futures and options traders.
With uncanny timing – just 11 days after the October 13th drop, addressing delegates at
the Fifth Canadian International Futures & Options Conference, Andrew Clademenos revealed
plans for a new product that he believed would bring back retail investors as well as attract
interest from domestic and international institutions. The product was of course the Toronto
Index Participation Units or TIPs. Clademenons informed the delegation that TIPS would be a
new way to invest in all of the 35 blue ribbon companies in the TSE 35 index. He added that the
TSE was seeking “regulatory approval for a derivative product that allows institutions and small
investors to buy all 35 equities in one basket.” Units in the index fund would resemble mutual
funds and trade on the exchange like stocks, offering advantages such as instant diversification,
no management fees, RRSP eligibility, dividend income tax credits, and voting rights.
The announcement of TIPs was met with mixed reactions. Many analysts were excited
by the idea, maintaining that volatility was a fact of life in the market but the withdrawal of so
many retail investors further increased price swings in share prices. These analysts believed that
attracting retail investors back to the TSE would help stabilized prices. Others were intrigued by
possible hedging strategies. One hundred eighty degrees away from these analysts were TSE
members who argued that TIPs would work against investors buying individual stocks and thus
hurt the overall market. Others still were against TIPs because they saw it as a vehicle for
promoting program trading. Nevertheless, the TSE approved the issue of nearly 12.5 million
Toronto Index Participation Units, valued at $248 million on 16 February 1990.
On 9 March 1990, TIPs began trading on the TSE and exceeded the expectations of of
TSE officials and market analysts as investors traded 157,765 units. Reacting to the first day
accomplishment of his new innovation and sensing that the introduction of TIPs was successful
on even the first day of attracting retail investors, Andrew Clademenos proclaimed, “we’re
15

delighted with the first day of trading. It was more than expected and where were lots of small
orders, so it’s not just the big guy who’s trading.”
In the ensuing months, TIPs became exceedingly popular. By September of 1990, only 6
months after its introduction, the number of issued TIPs was up to 23.2 million with an average
of 230,000 units being traded every day. By January of 1991, there were nearly 33 million
outstanding units and by May of 1991, 44.4 million units. In December of 1991, less than two
years after its introduction, TIPs surpassed the $2 billion mark in value of TIPs trades. This
innovative product had undoubtedly caught on as a legitimate and popular investment vehicle for
all types of investors, and the United States exchanges were taking notice.
III.2 Amex’s Equity Index Participations:
Nearly every report issued by the Security and Exchange Commission following the 1987
market crash encouraged the development of innovative products to more closely link equity and
futures markets, specifically an equity index product and a mechanism for trading baskets of
stock on exchanges. By July of 1988, the American Stock Exchange filed an application with
the SEC to trade equity index participations (EIPs) – a new product that stirred controversy and
sparked a turf war between financial markets. The proposed EIPs were designed to allow
investors to participate in the overall movement of the market, based on the Standard and Poor’s
500 index. Giving individual investors the opportunity to participate in the market appreciation
in the stocks of an entire index as if they owned all of the stocks, the product was also designed
as an effort to attract retail investors back to the market as officials at Amex hoped that this
future-option hybrid that trades like a stock would attract public interest.
In the months approaching the SEC ruling on Amex’s application, ambiguity surrounding
the product sparked intense debate over jurisdiction and foreshadowed the impending legal battle
that ultimately killed index participations in US markets. Futures markets, backed by the
Commodity Futures Trading Commission, fervently disputed that the index participations were
“badly disguised stock-index futures contracts” and that only the CFTC had the right to approve
such a product.i The Philadelphia stock exchange, which was the first market to propose a
basket product, along with Amex emphasized the characteristics of an option in the EIPs. The
trade association for mutual funds even chimed in, claiming that EIPs were really a form of
mutual funds. On 14 March 1989 - only minutes after the SEC approved proposals by Amex as
16

well as the Philadelphia Stock Exchange and the Chicago Board options exchange to trade index
participations – the Chicago Mercantile Exchange, the Chicago Board of Trade, and the CFTC
filed a suit in US appeals court challenging the SEC’s jurisdiction to make such an approval,
marking the beginning of an overly litigious and political battle that lasted for years. The basis
of the CME’s argument was that EIPs were “economically indistinguishable from stock index
futures contracts” and should therefore be regulated by the CFTC.
Kenneth Leibler, the president of Amex at that time, rebuked the suit as “harmful to
investors and the financial markets”, referencing the fact that an equity index product was
suggested by many studies following Black Sunday. He added that “approval of Equity Index
Participations is truly a major step in the evolution of financial instruments to meet the needs of
today’s investors” and to “provide investors with an economical and practical means of investing
in virtually the entire stock market.” The SEC placed a stay on its approval for trading index
participations to allow it time to consider the CME’s dispute but lifted it after one month. While
the CME made plans to file for a motion for a stay, Amex began trading EIPs on 12 May 1989
and reached a first day volume higher than any new derivative securities product introduced in
the 20 years prior to its release. Meanwhile, the debate over jurisdiction entered Capitol Hill as a
senate subcommittee was created to focus on the issue of index participations.
Though they were gaining great popularity among investors – trading about 1 million
certificates per day, EIPs didn’t stay listed for long. Despite losing its appeal for a stay, the
CME won its jurisdictional appeal in a US Court of Appeals only three months after EIPs began
trading on Amex. EIPs were never traded again. The turf war over who should regulate such
products continued well into 1992, but soon after, Amex rolled out a product that made EIPs
obsolete and no longer necessary to fight for.
III.3 Nate Most and His Spiders
Whilst the turf war over index participations ensued, Nate Most, a former professor in
physics and head of new product development for Amex in the late 80s and early 90s, had an ace
in the hole with a product he called ‘Standard and Poor’s Depository Receipts’ or SPDRs.
Because SPDRs so closely resembled EIPs, they were put on the back-burner while Amex
pursued listing EIPs, since it didn’t make much sense for the exchange to list two products that
were so much alike. Most recognized that SPDRs, which were designed more like the Toronto
17

Stock Exchange’s TIPs, were fundamentally designed to be traded as securities. SPDRs were
designed to have an underlying trust with a portfolio of stocks underwritten by member firms
and had no expiration dates.
As the dispute continued and indexing products were no longer available from exchanges,
investors began moving towards index-tracking mutual funds. As Most witnessed the growing
popularity of these mutual funds, he recognized opportunity for listing SPDRs. With the help of
the Boston based State Street, Most came up with the structure for SPDRs as it exists today. In
June of 1992, Amex finally filed with the SEC a proposal to trade SPDRs. To get SPDRs
approved, however, Amex needed a laundry list of exemptions from the SEC. It took nearly an
entire year for the exemptions to come through and for SPDRs to be approved for trading. But
on 29 January 1993, with a giant 9-foot spider hanging over the floor of the exchange from the
ceiling and great deal of fanfare, SPDRs began trading on the American Stock Exchange. On its
opening day SPDRs was the third most actively traded stock with a total volume of 1,003,200
shares.ii After six months of trading SPDRs had already increased its trust by 50% to $280
million and was increasing in popularity, appealing to both the average investor as well as the
more sophisticated investor. Officials at Amex took notice of SPDRs’ success and began
planning spin-off products for other indices even though it was rather early in life of the new
product.
SPDRs have since paved the way for the ETF market in the US, and essentially created a
market for a brand new category of investment vehicle. In January of 1993 SPDRs took off and
never looked back. Today it is the largest and most popular ETF available with $55 billion in
assets as of 31 December 2004.
III.4 World Equity Benchmark Shares and iShares:
World Equity Benchmark Shares or WEBS were the next major development in ETF
products. Borrowing the structure for SPDRs, officials at Morgan Stanley Group, Inc. and Amex
joined together to create a family of exchange traded funds intended to each individually track
one of 17 different Morgan Stanley Capital International Indices. The funds were created for a
niche group of investors who desired vehicles that would allow them to make bets on individual
oversees markets. Some indexing mutual funds existed for these indices but often traded at a
premium or discount. The ETF structure would allow investors to trade much closer to net asset
18

value. Additionally, since ETFs are American listed securities, fund managers who wished to
hold pieces of international markets but were explicitly banned from doing so now could with
WEBS.
On 18 March 1996 17 WEBS began trading on the American Stock Exchange with
similar fanfare to the debut of SPDRs. An enormous globe was suspended over the trading floor
and the flags of each of the countries represented by the 17 WEBS were hung. Amex chairman
Richard F. Syron proclaimed that “for the first time ever, both institutional and individual
investors will be able to take advantage of international opportunities through a single equity
trade on the American Stock Exchange and in US dollars. Trading internationally has never
been easier.”iii In their first quarter of trading, WEBS received so much attention that plans were
made to launch at lest six more and to gradually create 21 more for a total of 38 WEBS.
WEBS are now known as iShares Morgan Stanley Capital International Index Exchange
Traded Funds (MSCI) and are part of a larger iShares family of ETFs. Seeking to capitalize on
the success of ETFs and to offer products to meet any investor’s taste, Barclays Global Investors
(BGI) aggressively released over 50 iShares in 2000 – a move that doubled the number of ETF
offerings in the U.S. – and expanded from offering ETFs for single international markets. Not
only were distinct international markets indexed but ETFs indexing emerging markets, domestic
and global sectors, as well as more traditional domestic indices were also released. BGI sliced
the market into nearly every conceivable way and indexed it as an ETF. iShares is now the
largest family of ETFs available in the US market listing 82 different iShares as of March 2005.
Appendix A shows a complete list of iShares products available as of July 2005.
III.5 Diamonds and Cubes
Building on the success of SPDRs and WEBS, Amex announced in June of 1997 plans to
create a third ETF, this one to be based on what to some is considered the world’s best market
indicator – the Dow Jones Industrial Average. This new ETF was designed to allow investors to
buy and sell all thirty blue chip stocks represented in the DJIA with the trade of a single security,
the “Diamonds Trust”. The Diamonds Trust began trading 20 January 1998 and after only four
days saw nearly 7 million shares traded and it’s total assets increase from $39 million to an
astounding $193 million.
19

The real breakthrough for ETFs, though, came in March of 1999 when Amex unveiled its
Nadaq-100 Shares, also known as “Cubes”. The trust was set up just as its predecessors –
Spiders, WEBS, and Diamonds. Its underlying portfolio held the Nasdaq’s 100 largest non-
financial stocks, including several giant technology companies that were making tremendous
gains. Cubes could not have been released at a better time; it was a time when the technology
sector was taking off – and so did cubes. The Nasdaq-100 Trust opened to the most successful
launch of any new product in the history of the American Stock Exchange (at that time) with 2.6
million shares being traded. The trust grew so quickly that after only a little over one month, it
had over $1 billion in assets. By this time, Nate Most’s novel idea of index shares now had 30
unique products with over $16 billion in management and traded over 9 million shares per day.
The cubes continued to grow rampantly. By the beginning over November 1999, it
reached the $3 billion mark and by the end of the month surpassed the $4 billion mark. One year
later it rose past $20 billion, all the while bringing some much needed prestige back to the
American Stock Exchange and serving as a catalyst to spark the growth of the ETF industry into
what it is today. Today’s investors can track much more than traditional indices such as the S &
P 500 or the DJIA. Many ETFs have been created to track specific sectors both domestically and
abroad while other ETFs have been designed to track certain investment styles, such as those
established by Morningstar – small and large growth, small and large value, blend, etc. As of 31
December 2004, 169 ETFs were listed in the United States. One hundred forty four of those
were listed on the American Stock Exchange, the premier venue for exchange traded funds.
Another form of ETF that is not in existence but has been discussed are actively managed
ETFs. However, an actively managed ETF would defeat many of the fundamental reasons for
which investors have come to choose ETFs over actively managed mutual funds. While there
have been whispers of such product, it is unlikely that one will ever materialize.
III.6 Fixed Income ETFs
On 26 July 2002, Barclays Global Investors became the first to offer fixed income ETFs
with the launch of four iShares products that tracked bond indexes based on Lehman Brothers
indexes and Goldman Sachs indexes.iv In addition to offering many of the same benefits to
investors as stock ETFs – low cost, diversification, professional management, buy and sell in any
brokerage account, trade throughout the day – bond ETFs also give retail investors access to
20

fixed income pricing information, as it is difficult for investors to figure out what the price is for
a bond.13 In 2002, Lee Kranefuss, chief executive of BGI’s individual investor business said the
“with the ETF, a package of bonds trading on the stock exchane, you can look up what price it
has traded for today; it’s updated every 15 seconds.”13 He later added that “Unlike stocks, for
which prices are widely disseminated, secondary bond market offerings are not centrally listed.
Investors may have to turn to brokers who might mark up prices by as much as 5%, with
investors having no way to verify the fair market value of the bond.”v It is evident that the major
advantages to investing in bond ETFs are getting fair market value on a portfolio of bonds that
have similar maturities or qualities and the generation of income. One advantage of stock ETFs
that fixed income ETFs are missing is the tax advantage. Though investors do not incur capital
gains – bond ETFs share the same creation/redemption structure as stock ETFs – they are taxed
at the regular income tax rate on the income generated through the bonds.
As of August 2004, there six fixed income ETFs listed, five tracking government bonds
and one tracking corporate bonds. The chart below lists them.
Fixed Income ETFs Ticker Category
iShares Lehman 7-10 Year Treasury IEF Intermediate Government
iShares Lehman Aggregate Bond AGG Intermediate-Term Bond
iShares Lehman 20+ Year Treas Bond TLT Long Government
iShares Lehman TIPS Bond TIP Long Government
iShares Lehman 1-3 Year Treasury Bond SHY Short Government
iShares GS $ InvestTop Corp Bond LQD Long-Term Bond
21

IV. SOME SUGGESTIONS TO CHINA ETF INNOVATION
ETF is relative new financial products in China. Since the purpose of this article is not
for introducing Chinese ETF, the focus will be on the nature and characteristics of ETF in China
and the suggestion for improving the effectiveness of these newly created products.4 It is
important to note that any arbitrage process requires two-side markets, where long and short
positions exist simultaneously. ETF are tracking instruments. To minimize tracking errors,
arbitrage process is necessary. In China financial markets, short-selling is not allowed for both
institutional and individual investors. Logically, then, one may question the tracking ability
and/or effectiveness of China ETF. Nevertheless, the tracking errors of ETF in China equity
markets are quite small.
ETF is an innovated product such that direct short-selling is unnecessary for arbitrage
process. The creation of ETF involves “in-kind” transfer which avoids selling activities (cash
conversion) of the underlying securities in the market. Unlike mutual funds and unit investment
trusts, ETF shares are created when an institutional investor deposits a block of securities with
the ETF in return for this deposit, the investor receives a fixed number of ETF shares, some or all
of which it may then sell on a stock exchange. The institutional investor can get its deposited
securities back by redeeming the same number of ETF shares it got from the fund. The arbitrage
process is conducted as follows: If the underlying securities price is higher than the ETF, the
institutional investors will trade a lower priced ETF shares back to the sponsor in exchange for
the higher price securities by selling the securities and buy more ETF shares. Consequently, the
ETF shares price increases and securities prices decrease. If the ETF shares price becomes
higher than that of the underlying index, the institutional investors will trade the lower priced
securities back to the fund in exchange for ETF shares. Then, the index price up and ETF price
down until they are equal to each other. Note that this arbitrage mechanism is effective only
when there is a large number of institutional investor participations and/or a significant size of
capital investment.
IV.1 Conditional Short-Sale Allowance for Exchange Trade Funds
4 For detail introduction of Chinese ETF, please visit www.sse.com.cn.
22

One of the major differences between ETF and open-end mutual funds is that ETF can be
shorted and traded continuously with the markets.5 In section II, we learn that the theoretical
explanation of ETF evaluation is the market demand for the arbitrage process toward equilibrium.
This is a natural market behavior, and any artificial restriction and/or blocking will definitely
produce market inefficiency. It is extremely crucial to understand that although the in-kind
transfer provides an alternative arbitrage process without short-selling, it has two major problems:
First, zero-tracking error does not imply equilibrium. ETF could perfectly track the index
movement; but this does not mean that there is a correct pricing on the underlying index.
Second, the in-kind arbitrage process of index ETF is only for large institutional investors. It is
absolutely not available for small investors. Therefore, ETF, from small investors’ viewpoint, is
just like a stock that tracks an index.
For small investors, if short-sale is not allowed, then the difference between ETF and
Index Funds is quite insignificant. Consider a buy-and-hold strategy; an index mutual fund
could track the index as good as the ETF. There is no need for frequent trades, and thus ETF
will be unattractive. However, if ETF is short-able, then it could be used as a good hedge
instrument. To see this, let’s assume an investor has a long position of a stock, j, and wish to
hedge his/her position by shorting h shares of ETF. Consider the gain or loss on this portfolio is
)~()~(1 0101 EEhSS −−− ,
and the risk of this portfolio is
(4.1) )]~()~(1[ 0101 EEhSSVar −−−
= . )~,~(2)~()~( 2 EShCovFVarhSVar ∆∆−∆+∆
To minimize risk, take the first derivative of Equation (4.1) with respect to h:
0]0([=
dhhriskd .
The solution to this equation is
(4.2) )~(
)~,~(*
EVarESCovh
∆∆∆
= =Price Beta
5 Although closed-end mutual funds can be traded just like stocks, they usually involve large tracking errors. That is, the share price is quite different from fund’s net asset value.
23

This is the optimal hedge ratio which is interestingly equal to the beta coefficient price change.6
For example, if a stock beta to a market index is 0.90, then the optimal hedge for this stock
position is to short-sell 90 shares of ETF for every 100 shares of stock purchase.
Traditionally, in US, investors employ Index Futures to hedge their equity positions in
the cash markets. Unfortunately, the index Futures is not an effective hedging tool for small
investors particularly. The contract size of index Futures is large. For instance, it is usually 250
times the index value. Index futures are tied to the underlying cash index only by their
contractual term at maturity. Prior to maturity, futures prices can exhibit substantial discount or
premium to fair value. Thus, index futures are not tacking instruments. This indicates that ETF
is indeed an ideal financial vehicle for small investors to hedge their market risk exposure. Thus,
I strongly recommend conditional short-sale allowance for stock hedge purpose.
Suggestion 1. ETF is a tracking instrument for market risk exposure and is available for small
investors. It can thus be used as a convenient hedging tool for market risk. Allow investors to
short-sale ETF conditional on simultaneous purchase of stocks based on the hedge ratio
calculated by Equation (5.2).
IV.2 Creation of New ETF Should Consider What Risk Borne by Investors?
ETF are tracking stocks of a basket or index of equities. Traditionally, broad market
index Exchange Trade Funds are popular for small investors in that index ETF involve no
idiosyncratic risk. The information about index ETF focus on macro factors which are relatively
easier to obtain than information about individual firms. In section II.4, one of major
characteristics of ETF is that it represents an important component of risk borne generally by
investors. That is, a broad based market index ETF represents the systematic risk that all
investors face. This indicates that as long as we can identify a set of securities (an index) such
that its price movement and/or volatility represents a particular risk component that investors
concern, we could create an ETF to replicate the risk. For the past decade, financial researchers
6 Note that the beta coefficient is calculated from the price change of stock and ETF not the returns or log-price changes.
24

have found in addition to the market risk, there are several significant macro risk factors borne
by investors
Risk Factors of Value/Size, Momentum, and Contrarian
In the past decade, one of the most extensively studied areas of financial research
concentrates on the predictability of cross-section stock returns based on either a firm’s
fundamental information or past price history. Fama and French (1992, 1996, 1998) document
that stocks with high ratios of book-to-market (B/M), earnings to price (E/P) or cash flow to
price (C/P) have higher average returns than low B/M, E/P or C/P stocks. In addition, small size
firms seem to perform better than large size firms. This is called the value/size effect.
Jegadeesh and Titman (1993, 2001), Rouwenhorst (1998), Chan, Jegadeesh and Lakonishok
(1996) reveal that short-term past returns or past earnings predict future returns. Average returns
of the best prior performing stocks (winners) exceed those of the worst prior performing stocks
(losers), so that there is momentum in stock prices. On the other hand, DeBondt and Thaler (1985)
find a contrarian effect such that stocks with low long-term past returns outperform stocks with
high long-term past returns. Because these patterns in average returns are not explained by the
conventional capital asset pricing model (CAPM) of Sharpe (1964) and Linter (1965), they are
typically called anomalies.
If anomalies exist, investors are able to create profitable investment strategies by
purchasing dominating assets (e.g., the value stocks or the past winners) at the cost of selling
dominated assets (e.g., the growth stocks or the losers). Many empirical studies show that this
asset reallocation process generates positive excess returns. 7 However, despite pervasive
evidence of excess returns or anomalies, there remains debate on this issue. Many argue that the
empirical evidence may be simply a data snooping bias in that the anomalies are sample specific
results that are unlikely to be observed out of sample.8 Excess returns may not be evidence of
anomalies in that the premium between dominating and dominated assets is compensation for
7 Again, for the momentum effect, see Jegadeesh and Titman (1993, 2001), Rouwenhorst (1998), Chan, Jegadeesh and Lakonishok (1996). On the contrary, DeBondt and Thaler (1985, 1987), Chopra, Lakonishok, and Richards (1997) suggest a profitable contraian strategy of buying the losers and selling the winners. Fama and French (1992, 1996, 1998) argue that a positive premium between value and growth stocks indicates that the investment strategy of longing the value and shorting the growth produces positive returns. 8 See MacKinlay (1995), and Knez and Ready (1997).
25

risk.9 It can be thus viewed as a risk factor, in equilibrium, priced in addition to the traditional
CAPM type systematic risk.10 That is,
(4.3) Expected Return of Stock j = Risk-Free Return + (Market Premium) mjβ
+ (Value Premium) vjβ
+ (Momentum Premium) mmjβ
+ (Contrarian Premium) cjβ
+ (Liquidity Premium) ljβ
It is obvious that the market premium cab be replicated by the Market Index ETF. If other risk-
premium are insignificant to the return generating process, a risk-free investment can be obtained
by holding a stock and short Market Index ETF. This is consistent with the results shown in
the previous Section V.1. However, financial researchers have strongly suggested that the
market factor is insufficient to quantify all component risk borne by all investors. There are
other types of compensation for systematic risk also needed to be considered. That is, the
traditional CAPM-type single-factor market model should be replaced by multi-factor APT
models which incorporate the effects of value, size, momentum, contraian, and liquidity
mjβ
This theoretical and empirical evidence provides a solid foundation for ETF expansions.
Instead of blindly creation of new ETF based on subjective imagination of creators, we need to
carefully understand and discover the nature pricing behavior of the market. Therefore, I suggest
that for the next step of ETF innovation, perhaps, consider the ETF that represent the value
premium, the liquidity premium, the momentum premium, and the contrarian premium. Note
that all these risk premium are calculated from returns of particular set of stock portfolios. For
the method of constructing Value Stock Portfolios (Value ETF), Momentum Stock Portfolios
9 See Brennan, Chordia, and Subrahmanyam (1998), Chan, Chen and Hsieh (1985), Chan, Karceski and Lakonishok (1998), Chen and Zhang (1998), and Dichev (1998). 10 Fama and French (1993, 1995, 1996, 1998) argue that the value premium is compensation for systematic risk. There is no evidence that average returns vary with firm size and B/M in a way that cannot be explained by risk loading, and there is no evidence that variation in risk loadings is uncompensated when it is unrelated to size and B/M.
26

(Momentum ETF), and Contrarian Stock Portfolios (Contrarian ETF), see Fama and French
(1992, 1996, 1998), Jegadeesh and Titman (1993, 2001), and DeBondt and Thaler (1985).
Suggestion 2. A good ETF should represent an important component of risk borne generally
by investors. The market index ETF represents one of component risk of the Market, where the
market premium is a compensation for the systematic risk. Following financial research
evidence, there are four different types of ETF could be created for representing other four
important systematic risk components:
(1) Value ETF represents Risk Premium from Value Stocks.
(2) Momentum ETF represents Momentum Premium from Short-term Past Winners
(3) Contrarian ETF represents Contrarian Premium from Long-term Past Winners.
(4) Liquidity ETF represents Liquidity Premium from illiquidity stocks.
IV.3 There is a need for Money Market ETF in China
From Equation (5.3), it is clear that not only the risk factors are important to the return
generating process, but also the risk-free asset is crucial in the asset pricing system. We note
that the formation of ETF is to create a vehicle that represent the risk-factor and carry out
transaction in a very effective and convenient manner. Since there is a need for ETF to replicate
risk factors, there is also a demand for creating an ETF that replicates the risk-less factor. In the
United States and many other western capital markets, the short-term debt market is non-
segmented from the equity markets. The borrowing and lending is freely activated between
money market and stock market. That is, the bridge between money market and stock market is
completely open, and thus the inventive for ETF instrument is low. However, in China, the
segmentation between cash market and stock markets appears. A large and very significant
amount of capital form individuals saving flows into the banking sector. Unfortunately, due to
stock market inefficiency, the capital flow to equity market is less than 10% of the total capital
saving. Lacking of transparency and available hedging instruments, the risk-exposure is large,
and trading is short-term and speculative. This prohibits individual investors' interest of
participation in the stock markets.
27

To increase the market participation and trading activities, perhaps, a risk-free Money
Market ETF is a potential vehicle in China. The Money Market ETF (MM ETF) replicates a
portfolio of short-term debts. Employ the "in-kind transfer" approach for institutional investors
as creation units (CU) to ensure the equivalency between NAV and share price. All individual
investors are able to buy/sell the Money Market ETF shares in the open markets. The share price
could be locked in at fixed price, said $1/share. In addition, investors could use MM ETF shares
as a margin (collateral) for the conditional short selling of equity ETF as stated in Suggestion 1.
Suggestion 3. There is a need for creating Money Market ETF (MM ETF) in China because
(1) MM ETF replicates Risk-less Component in the Pricing System.
(2) MM ETF breaks the segmentation between the Cash market and Equity Markets.
(3) MM ETF attracts small investors (savers), and it increases Stock Exchange's activities.
(4) MM ETF shares can be used as a margin (or collateral) for the Conditional Short-Sale
Allowance of ETF in Suggestion 1.
IV.4 ETF Derivatives and Price Equilibrium
Speculation is a conventional view about derivatives markets. Thus, some call the
derivative market as a Speculative Market. In this paper, I am providing a different viewpoint
that Derivatives of ETF, particularly, Options on ETF, are necessary instruments for a fair price
discovery and an efficient capital market. The tracking ability of ETF for the underlying market
indexes makes the ETF to be a very effective and convenient tool to replicate the equity market
price movement. That is, the volatility of an index ETF represents the market systematic risk.
From the theory of financial economics, the system of equilibrium is continuously and
diametrically controlled by an invisible hand such that the risk or volatility of the market could
be balanced in a crossing sectional joint relationship among different natures of securities.
Consider a market ETF with a current price of 120 (the underlying index is 1200) has
uncertain outcomes 3-month in the future as follows:11
Today’s Random Price 3-Month in the Future
11 For simplicity, we assume that the underlying stocks pay no dividends during the 3-month period.
28

Price
Long ETF 120 80 100 120 140 160
To insure the down-side risk exposure such that the future price of the ETF below the current
price of 120, an at-the-money Put Option with an exercise price of 1200 can be employed as
follows:
Today’s
Price
Random Price 3-Month in the Future
Long ETF 120 80 100 120 140 160
Long Put
(X=120)
1 40 20 0 0 0
ETF + PUT 120 120 120 140 160
Now, if we write a Call Options (with a 3-month duration and a strike price of 120) in addition to
long a Put Options, then the comes show below:
Today’s
Price
Random Price 3-Month in the Future
Long ETF 120 80 100 120 140 160
Long Put
(X=120)
1 40 20 0 0 0
Write Call
(X=120)
-1.5 0 0 0 -20 -40
ETF+Put-Call 120 120 120 120 120
It is important to note that the outcomes of 120 are identical from a portfolio of ETF, Put and
Call. That is, the risk-free portfolio is formed by three risky assets.12 Therefore, there is an
invisible hand to control the parity between risky assets and a risky-free portfolio such that
(4.4) ETF + PUT – CALL = Risk-Free Bond.
12 This relationship among equity, call and put is called as Put-Call Parity.
29

The equality (5.4) is an important equilibrium system for discovering fair price through arbitrage
process. Specifically, the appropriate price of ETF can be determined by
(4.5) ETF = CALL – PUT + Risk-Free Bond.
If the ETF is price too low such that ETF < CALL – PUT + Bond, then an arbitrage opportunity
exists. Traders make a risk-free arbitrage profit by shorting call option, buy put options, and
borrowing money to buy ETF. The purchasing forces from arbitrage process will push the ETF
price higher until it reaches the equilibrium as shown in Equation (5.4), or the arbitrage
opportunity disappears.
Suggestion 4. Call and put options are useful for price discovery of ETF. Nevertheless, the
derivative markets are very speculative. To eliminate unnecessary market volatility, the
derivatives trading for ETF (not for individual stocks) may be allowed for market makers, if the
market making system is established in China financial markets. That is, the ETF derivatives are
used only for arbitrage and hedging purpose.
IV.5 Application of ETF to China Share Reform
The split share structure between tradable public and non-tradable state shares has long
been a major inefficiency toward Chinese equity market development. Significantly, the non-
tradable shares account for approximately two thirds of total voting share outstanding. That is,
only thirty percent of shares are flowing in the open market. Form the fundamental financial
theory, the major functional purpose of financial markets is determining the fair valuation of
firms' assets. It is well known that the value of assets including both tangible and intangible is
determined by the market value of debts and equity. Therefore, well functioning debt and stock
markets provide fair value of the firms that allow investors or shareholders to govern firms.
With partial equity flow in the market, it is obviously that the appropriate valuation
machine fail to function, and the pricing mechanism is consequently distorted. The secondary
equity market naturally becomes an ideal place for speculation and gambling. Investors have no
long-term commitment, and the trading behavior is short-term oriented. In such an environment,
institutional investors and large capital providers hesitate to participate. Importantly, since a
large portion of ownership is not tradable, the market prices are unable to encourage major
30

shareholders or the management to improve corporate governance. Consequently, the market
provides no protection for small investors' interest from malpractice of corporate governance,
insider or related-party transactions and manipulation of stock price.
Chinese government realizes that the split-share problem has become a major barrier for
China capital market development; a Reform of State Share is thus extremely important and
necessary. In addition, a growing number of domestic and foreign institutional investors had
also increased pressure for fundamental reform. By May 2005, Chinese stock market regulator
lunched a serial of trials for a set of testing companies. Four public listed firms and forty-two
large size corporations were selected for the first and second trial, respectively. The initial stage
of the reform are followed by three major guidelines: (1) State shareholders are responsible for
compensating existing tradable shareholders in terms of cash, stock dividends, and/or warrants,
(2) non-tradable shares will be locked-up for 12 months after the individual company's reform
scheme takes effect and non-tradable shareholders cannot sell more than 5% of their stakes
within another 12 months; and (3) the companies should obtain the approval of reform schemes
from at least two thirds of tradable shareholders before implementation.
It is important to note that the State Share Reform is not for privatization of state-owned
firms. In fact, there is no intent to sell state ownership to the public. The purpose of the reform
is to eliminate trading rights differences between non-tradable and tradable shares, not to float all
non-tradable shares on the stock market. Specifically, after the reform on non-tradable shares is
completed, state-owned shares can be cashed in only upon the approval of the State-owned
Assets Supervision and Administration Commission (SASAC). That is, SASAC allows
proportion of state-owned shares in state-controlled companies - in line with national economic
restructuring plans - as well as the need to facilitate a sound development of the capitals market.
Nevertheless, although the floating of State Shares is controlled by SASAC, it is inevitable that
new capital is needed to be floated in the market to assort the new tradable State Shares. Merrill
Lynch has estimated that domestic boards will need as much as 216 billion Yuan ($26.7 billion)
to absorb new stocks if 10 percent of all state shares hit the market in the next three years, the
maximum amount allowable. That amounts is equivalent to 23.5 percent of the current total
capitalization of China's freely traded shares.
31

My viewpoint is that the current decentralized approach (compensation plans determined
by floating and non-floating shareholders negotiation of individual firms) maybe ineffective.
First, most of non-floating shares are State Shares. This is a result from the past centralized plan
economy. There is no natural market mechanism (the invisible hand) to resolve the problem.
Second, the compensation plan, particularly, the cash compensation, is just a temporal settlement
for the existing shareholders. It provides no incentive for new participants. We must realize that
the success of this Share Reform needs share circulation, and the circulation has to have new
capital and new participants flow into the market. Unfortunately, under current circumstance,
there will be no investor (either domestic or international) confidence for putting new capital to
the stock markets because of the market unfairness. The market is unfair due to two major
reasons: (1) State owned firms have moral hazel. These companies tend to be risk neutral in that
they are implicitly insured by the government, and thus firms’ behavior is completely out of
control by the public investors; (2) There is no hedge or insurance vehicle for public investors
to eliminate and/or reduce this risk. I believe that until the above two problems are resolved; the
State Share reform is unable to have a long-term success. The one to resolve the problem is the
one who creates the problem. Consequently, this reform has to be a Centralized Approach.
This research article proposes a simple macro financial model for facilitating state share
circulation that could avoid the risk of share price crash due to market flooding. The main
characteristics of the model are:
• Investment Insurance: establishing confidence of investors and attracting non-
speculators or savers to participate stock markets.
• Eliminating Moral Hazel: setting a market rewarding and punishment system for
firms to maximize public shareholders' wealth not the state shareholder’s and/or
agent’s wealth.
Since no available hedging tool is available for small investors and the short-sale is not
allowed, it is necessary for a centralized unit to set up a protection mechanism for stimulating
investors' enthusiasm of market participation. This centralized unit serves as a "Pass-Through"
not-for-profit insurance agent. However, the mandatory insurance policy is issued by the non-
floating shareholders. There are five key factors of the model: (1) a public trust (served as a
32

centralized unit), (2) in-kind transfer between state shares and stock portfolios, (3) portfolio
insurance, (4) stock repurchase and debt payout, and (5) government support. This model is
unique and quite different from any existing system in the world. It is a market-oriented system
but is managed by the not-for-profit governmental fund for protecting peoples' interest. To
demonstrate this model, a graphical illustration is presented as follows:
Non-FloatingShareholders
Stock
Stock Stock
Stock
Stock
PublicInvestors
EquityETF
Public TRUSTFund
Non-floating Shares
Non-floating Shares
ETF
CASH=10+Put Premium
Liquidity Shares(Cash – PUT)
Principal Protection Shares(ETF + PUT)
E=10, E*= 5, Put = 5, L=10 - 5 = 5 E=10, E*=10, Put = 0, L=10 – 0 = 10 E=10, E*=15, put = 0, L =10 – 0 = 10
E=10, E*= 5, PUT= 5, PPS = 10E=10, E*=10, PUT= 0, PPS = 10E=10, E*=15, PUT= 0, PPS = 15
Government
IPOCash &Put Obligation
CertificateOf Deposit
Buyback Floating Shares
FloatingShares
Put(cost of Capital)
State Share CirculationEquilibrium Approach
(A) Non-Floating Shares ↔ Public Trust Fund:
The public trust fund (PTF) plays the center role of this model. It is a not-for-profit organization
organized by the government for controlling capital flow, state assets and investor protection.
PTF is the Centralized Unit for managing and controlling capital flow between non-floating
shareholders and public investors. The non-floated shares (particularly, the state shares) are sold
to the PTF for cash. Nevertheless, for selling every non-floating share, shareholder needs to
33

write a put option to the PTF. The put option is closed-end and will not be traded at any
secondary market. The strike price of the put option is at-the-money according to the current
market price of the floating shares, and non-floating shareholders receive cash according to the
following two conditions:
(1) If the non-floating shareholders issue a plan for Stock-Repurchase Agreement that buying
the floating shares back from the open market, PTF will pay the full amount of cash
according to the current share price plus Put Premium.
(2) Otherwise, PTF pays 50% of cash value of current price (retaining 50% of cash as
collaterals) plus Put Premium.
Importantly, by the nature of market invisible hand (the put-call parity), it is obvious that
(4.6) Risk-Free Bond – PUT = Stock - CALL.
That is, non-floating shareholders sell the non-floating shares, obtain Cash (current value of the
risk-free bond), and issue Put Options. It is equivalent to own stocks and covered by call options
writing. Therefore, by theory, if non-floating shareholders use the cash to buyback shares from
open markets, then it will naturally becomes a covered call strategy.
(B) Public Trust Fund ↔ ETF:
The PTF packages the non-floated shares according to the value weights of ETF (Index Share)
and converts to ETF shares. This approach eliminates the idiosyncratic risk of individual stocks,
which diversifies risk for public investors. Since the creation/redemption of ETF shares is in-
kind transfer, there is no cash transaction involved for PTF.
(C) Public Trust Fund ↔ Public Investors:
PTF initially issues Protection Shares (PS) to the public. The PS is a hybrid of an ETF and a Put
Option. The ETF is converted from non-floating shares and the put options are issued by non-
floating shareholders. Again, we note the Put Option serves as Insurance Policy for a Portfolio
(ETF). Therefore, PS has no down-side risk and has up-side systematic pattern as the market
34

movement. Ideally, this will be a very attracted financial instrument for small and/or
conservative investors. Investors pay ETF price plus a Put option premium to the PTF, and PTF
uses this fund to finance the purchase of non-floated shares and put options. As a result, PTF
serves purely as a PASS-THROUGH function. There is no actual capital investment for the PTF.
From Equation (4.5), Protection Shares essentially are
(4.7) ETF + PUT = CALL + Risk-Free Bond.
Investors purchase a risk-free bond and buy a call option of ETF for up-side potential of the
market.
(D) Non-Floated Shares ↔ Government ↔ Public Trust Fund:
Finally, it is quite important to have supporting and monitoring system from the government for
ensuring the capital flows and fulfillment of obligations from all parties.
This model provides a conservative method to ensure smooth capital flows between state-
owned firms and public investors. The portfolio insurance provides protection for small
investors and attracts new capital and market participants. Although it is centralized and planned
by government sponsored unit (PTF), it is not a welfare program but utilizes market insurance
approach to stabilize capital market volatility. Importantly, this model focus on the long-term
healthy structure of capital facilitation without violating the basic nature of market oriented
economic system.
35
V. SUMMARY AND CONCLUSIONS
Exchange Trade Funds (ETF) are successful innovation in the recent financial history.
This paper theoretically demonstrates that ETF in fact can’t be claimed as innovation, it is a
market natural evolution from the demand of market basket. To illustrate the theory of demand
for ETF, this manuscript focuses on three aspects: (1) the theory of two-fund separation explains
the demand for index instruments, (2) arbitrage process of well-diversified portfolios is the
fundamental driving factor for market equilibrium, and (3) index arbitrage between index futures
and cash markets is the direct demand for ETF development. From these theoretical
interpretations, this article summarizes eighteen characteristics serve as guidelines for ETF
innovation.
The history of ETF development in North America is briefly presented in Section III. It
shows the ETF revolution from the early stage products such as TFE and AEIP to the recent
popular ETF such Spiders, iShares, Diamonds, and Cubs. The main focus of this article is to
provide suggestions for China ETF innovation. There are five suggestions summarized as
follows: (1) There are two major problems in current China stock markets. One is lacking of
transparency of firms' financial activities, and another is no hedging instruments for investors to
reduce risk exposure. I suggest the allowance for conditional short-selling of ETF. That is, let
the ETF be a hedge instrument for stock purchasers. The conditional short-selling means the
short-sale of ETF is allowed only when investors are buying the underlying stocks according to
the hedge ratio shown in Equation (4.2); (2) Further creation of new ETF should consider the
Risk Factor borne by general investors. That is, the price movement ETF should replicate a
potential risk component that investors face. In addition to the market risk factor, this
manuscript suggests that Value, Momentum, Contrarian, and liquidity are four important risk
factors that ETF could replicate; (3) There is a need for Money Market ETF (MM ETF) in China.
This is because MM ETF replicates the risk-free factor in asset pricing system. In China, MM
ETF could break the segmentation between cash and stock markets. MM ETF will attract small
and non-speculative investors (savers), and it increases Stock Exchange's activities. In addition,
MM ETF shares can be used as a margin (or collateral) for the Conditional Short-Sale Allowance
of ETF; (4) Call and put options are useful for price discovery of ETF. Nevertheless, the
derivative markets are very speculative. To eliminate unnecessary market volatility, the
derivatives trading for ETF (not for individual stocks) may be allowed for market makers, if the
36

market making system is established in China financial markets. That is, the ETF derivatives are
used only for arbitrage and hedging purpose; (5) ETF is very useful tool for China Share Reform
(CSR). This article argues that the decentralized approach of current CSR may be ineffective. A
centralized model is proposed to provide portfolio insurance for investors and ensure smooth
capital flow from non-floating shares to general public. The key factors of the success of China
stock market reform are twofold: (a) bring back investor confidence by providing investment
insurance, and (b) eliminate moral hazel of firms to change firm’s risk neutral behavior to be
risk-averse. The macro model in this paper targets these factors. It shows that through ETF, by
creating principal protection shares and liquidity shares, a public trust fund (serves as a
centralized unit) is able to smooth capital flows and importantly, attract new participants to the
stock markets.
37

Appendix A – The iShares Family of ETFs iShares MSCI South Africa Index iShares Goldman Sachs Software Index
iShares MSCI South Korea Index iShares S&P MidCap 400 Index
iShares MSCI Sweden Index iShares S&P MidCap 400/BARRA Value
iShares MSCI Taiwan Index iShares Morningstar Large Growth Index
iShares MSCI Australia Index iShares MSCI EAFE Index Fund
iShares MSCI Brazil (Free) Index iShares Goldman Sachs Technology Indx
iShares MSCI Spain Index iShares Morningstar Mid Growth Index
iShares MSCI Singapore (Free) Index iShares S&P MidCap 400/BARRA Growth
iShares MSCI Pacific ex-Japan iShares S&P Global Healthcare Sector
iShares MSCI Belgium Index iShares S&P Global Financials Sector
iShares MSCI Germany Index iShares Russell 3000 Growth Index
iShares MSCI United Kingdom Index iShares Russell 1000 Growth Index
iShares MSCI France Index iShares Dow Jones US Financial Sector
iShares MSCI Switzerland Index iShares Russell Midcap Value Index
iShares MSCI Italy Index iShares Russell 3000 Index
iShares MSCI Hong Kong Index iShares S&P 1500 Index
iShares MSCI Canada Index iShares Dow Jones US Utilities
iShares MSCI Malaysia (Free) Index iShares Morningstar Large Core Index
iShares MSCI Mexico (Free) Index iShares Dow Jones US Consumer Services
iShares MSCI Netherlands Index iShares Dow Jones US Industrial
iShares MSCI Japan Index iShares Russell Midcap Growth Index
iShares MSCI Austria Index iShares Dow Jones US Technology
iShares Morningstar Small Growth Index iShares Morningstar Large Value Index
iShares S&P Global Technology Sector iShares Russell Midcap Index
iShares S&P Europe 350 Index iShares S&P 500/BARRA Growth Index
iShares MSCI EMU Index iShares Dow Jones US Total Market Ind
iShares S&P Latin America 40 Index iShares Dow Jones Select Dividend Index
iShares Goldman Sachs Semiconductor iShares Morningstar Mid Value Index
iShares MSCI Emerg Mkts Index iShares S&P/TOPIX 150 Index
iShares Morningstar Small Value Index iShares S&P 500 Index
iShares Dow Jones US Real Estate iShares Russell 1000 Index
iShares Dow Jones US Basic Materials iShares Russell 3000 Value Index
iShares Russell 2000 Value Index iShares Dow Jones US Financial Svcs
iShares S&P SmallCap 600/BARRA iShares S&P 100 Index
38

Value
iShares Russell 2000 Index iShares S&P Global Energy Sector
iShares S&P SmallCap 600/BARRA
Growth
iShares Dow Jones US Healthcare
iShares Russell 2000 Growth Index iShares Dow Jones US Telecom
iShares Dow Jones Transportation
Average
iShares Russell 1000 Value Index
iShares Cohen & Steers Realty Majors iShares S&P 500/BARRA Value Index
iShares S&P SmallCap 600 Index iShares Lehman 1-3 Year Treasury Bond
iShares Goldman Sachs Networking iShares Lehman Aggregate Bond
iShares S&P Global 100 Index iShares Goldman Sachs Natural Resourc
iShares Morningstar Small Core Index iShares Dow Jones US Energy
iShares Dow Jones US Cons Goods iShares Lehman TIPS Bond
iShares S&P Global Telecommunications iShares Nasdaq Biotechnology
iShares Morningstar Mid Core Index iShares Lehman 7-10 Year Treasury
iShares FTSE/Xinhua China 25 Index
Fund
iShares Lehman 20+ Year Treas Bond
iShares GS $ InvestTop Corp Bond
39

REFERENCE
Bajeux-Besnainou, I, J. V. Jordan, and R. Portait, 2001, An Asset Allocation Puzzle, American Economic Review, 91 (4), 1170-1179. Cass, David, and J. E. Stiglitz, 1970, The Structure of Investor Preference and Asset Returns, and Separability in Portfolio Allocation: A Contribution to the Pure Theory of Mutual Funds, Journal of Economic Theory, 2(2), 122-160. Chan, Louis K. C., Narasimhan Jagadeesh, and Josef Lakonishok, 1996, Momentum strategies, Journal of Finance 51, 1681-1713. Chan, K. C., Nai-fu Chen and David Hsieh, 1985, An Exploratory Investigation of the Firm Size Effect, Journal of Financial Economics 14, 451-471. Chan, Louis, J. Karceski and J. Lakonishok, 1998, The Risk and Return from Factors, Journal of Financial and Quantitative Analysis, 33, 159-188. Chen, Nai-fu and Feng Zhang, 1998, Risk and Return of Value Stocks, Journal of Business 71, 501-535 Chopra, Navin, Josef Lakonishok, and Jay R. Ritter, 1992, Measuring abnormal performance: Do stocks overreact?, Journal of Financial Economics 31, 235-268 DeBondt, Werner, and Richard Thaler, 1985, Does the stock market overreact?, Journal of Finance 40, 793-805. DeBondt, Werner, and Richard Thaler, 1987, Further evidence of overreaction and stock market seasonality, Journal of Finance 42, 557-581. Dichev, I. D., 1998, Is the risk of bankruptcy a systematic risk?, Journal of Finance 53, 1131-1147. Fama, Eugene F. and Kenneth R. French, 1992, The cross-section of expected stock returns, Journal of Finance 47, 427-465. Fama, Eugene F. and Kenneth R. French, 1993, Common risk factors in the returns on stocks and bonds, Journal of Financial Economics 33, 3-56. Fama, Eugene F. and Kenneth R. French, 1995, Size and book-to-market factors in earnings and returns, Journal of Finance 50, 131-155. Fama, Eugene F. and Kenneth R. French, 1996, Multifactor explanations of asset pricing anomalies, Journal of Finance 51, 55-84. Fama, Eugene F. and Kenneth R. French, 1998, Value versus growth: the international evidence, Journal of Finance 53, 1975-1999.
40

Jegadeesh, Narasimhan, and Sheridan Titman, 1993, Returns to buying winners and selling losers: Implications for stock market efficiency, Journal of Finance 48, 65-91. Jegadeesh, Narasimhan, and Sheridan Titman, 2001, Profitability of momentum strategies: an evaluation of alternative explanations, Journal of Finance 56, 699-720. Knez, Peter J. and Mark J. Ready, 1997, On the robustness of size and book-to-market in cross-sectional regressions, Journal of Finance 52, 1355-1382. Lintner, John, 1965, The Valuation of Risky Assets and the selection of Risky portfolios in stock portfolios and capital budgets, Review of Economics and Statistics 47, 13-37. MacKinlay, A. Craig, 1995, Multifactor models do not explain deviations from the CAPM, Journal of Financial Economics 38, 3-28. Merton, Robert, 1971, Optimum Consumption and Portfolio Rules in a Continuous-Time Model, Journal of Economic Theory, 3(4), 373-413. Merton, Robert, 1973, An Intertemporal Capital Asset Pricing Model, Econometrica, 41(5), 867-887. Richards, Anthony J., 1997, Winner-loser reversals in national stock market indices: Can they be explained?, Journal of Finance 52, 2129-2144. Rouwenhorst, K. Geert, 1998, International momentum strategies, Journal of Finance 53, 267-284. Rubinstein, Mark, 1989, “Market Basket Alternatives,” Financial Aanlysts Journal, September-October, pp. 20-63. Sharpe, W.F., 1964, Capital Asset Prices: A Theory of Market Equilibrium under Conditions of Risk, Journal of Finance 19, 425-442. i Ricks TE. March 14, 1989. ‘Stock Basket’ Plan May Get Support, But Faces Hurdles. The Wall Street Journal.
New York, NY. ii January 29, 1993. Amex Launches New Security, Standard & Poor’s Depository Receipts (“Spiders”). PR
Newswire iii March 18, 1996. Amex Today Kicks Off Trading on WEBS. PR Newswire. iv Maxey D. July 8, 2002. Quarterly Mutual Funds Review – Fixed Income ETFs to Make Debut – Funds Track
Bonds Inexes; Can They Match Success of Stock Counterpart? The Wall Street Journal. pp. R18. New York, NY
v Kresbach K. May 1, 2003. Bond ETFs Deliver 1-2 Punch. Bank Investment Consultant. Volume 11, Issue 5. pp. 38. New York, NY.
41