an economic evaluation ofbeach erosion managementaltematives · the desirability ofmanagement...
TRANSCRIPT

Marllfl.. RnolJrc,· EC<llfllmks, Volume Ill, pp. 105- [27Pdoled in lhe U.S,A. A[[ righls reserved
0738·1J60100 $3.00 + .00COp)'righIO 2003 Marlne ResO\lr~es Foundation
An Economic Evaluation of Beach ErosionManagement Altematives
CRAIG E, LANDRYUniversity of Maryland
ANDREW G. KEELERWARREN KRIESELUniversity of Georgia
Abstract This paper examines the relative economic efficiency ofthree distinctbeach erosion management policies ,- beach nourishment with shorelinearmoring, beach nourishment wilholll armoring, and shoreline retreat. Theanalysis focuses on (i} the recreational benefits of beaches, (OJ the propertyvalue effects ofbeach management, and (iii) the costs associated with the threemanagemelll scenarios. Assuming the removal ofshoreline llrmoring improvesoverall beach quality, beach nourishment with shoreline armoring is the leastdesirable olthe three alternatives. The countervailing property losses under aretreat strategy are ofthe same order ofmagnitude as the foregone managementcosts when the beneficial effects of retreat - higher values ofhOllsing sen'icesfor those houses not lost to erosion - are considered. The relative desirabilityof these alternative strategies depends upon the realized erosion rate and holl'manogemelll costs change over time.
Kc)' \Vol'ds Beach erosion, coaslalmunagement, hedonic ,)riees, contingentchoice.
JEL Classification Codes Dt2. D61. H43. Q2t. Q24. Q26.
Introduction
By their nature, coastal areas, and in particular beaches, are unstable landforms. Inresponse to changing ocean currents, sediment loads, wave action, and sea levels,most coastlines changc their shape over time. East Coast U.S. beaches on barrier islands have tended to follow a shoreward erosion trend, but local areas can accrete aswell as erodc, and islands can also migrate northward or southward. The accumllla~
tion of real property development on these barrier islands over the past 50 years hascreated a demand to manage erosion processes through large-scale engineering
Craig E. Landry is a research assistant in the Department of Agricultural and Rcsouree Economics, Uni·versity of Maryland, 2200 Symons Hall, College Park, MD 20742, email; clandry@arcc,umd.edu. InFall 2003, Landry will be an assislant professor in the Department of Economics, East Carolina University, Greenville, NC. Andrew G. Keeler arc Warren Kriesel arc associate professors in the Department of/l,gricullural and Applied Economics, University of Georgia, 312 Conner Hall, Athens, GA 30602, email,respec tive Iy: [email protected], wk ri esel@agecon,uga,edu.
We thank two anonymous reviewers for helpful eOllllllcnts. Any remaining errors arc our own, Thisresearch was supported in part by the Georgia College Sea Grant Program under grant NA66RG0282,Project RISD·2.
105

106 Landry, Keeler, and Kriesel
projects. These projects, however, may hnpact the quality of coastal resources.There arc three basic strategies thnt have emerged to manage beach erosion.
Shoreline armoring involves the construction of seawalls, rip~rap (rock piles), andother devices designed to prevent any shoreward movement of the coastline. Thereis ample evidence that armored beaches tcnd to be narrower and steeper, Hurl therefore less desirable for recreation, than beaches that urc not armored (Clayton et al.1992; Leatherman 1988). Shoreline armoring has come under increased firc for itsexpense, negative aesthetic consequences, and environmental effects, such as habitatloss. However, this strategy is still utilized in many areas of the eastern U.S., including the study site reportcd here.
The second strategy is beach 1l0urisluuentJ the process of maintaining the coastline by pumping or trucking sand onto the beach to replace sand that has been lost toerosion. It does not have the negative aesthetic consequences of shoreline armoring,but it is an expensive process and is only a temporary solution to erosion problemsin most cases (Pilkey and Dixon 1996; P.ompe and Rinehart 1995b). In addition,there is concern that the dredging of offshore sand can aggravate the forces causingerosion. Armoring and nourishment have generally been the favored managementschemes of coastal engineers in both their policy recommendations and in their aca
. demic literature.The third management strategy is that of shoreline retreat. Many coastal geolo
gists feel that erosion is an inevitable process that can be contained only locally andtemporarily (Clayton ef al. 1992; Pilkey and Dixon 1996). The policy of retreat isbased on this proposition: Coastlines should be allowed to erode naturally withoutengineering intervention. The recommended policy response is to move or dismantlestructures that will be lost to this erosive process in the short and medium run. In thelong run, structures should be constructed at a sufficient distance from the beach sothey will not be at risk over their expected lifetime. Allowing beaches to migrate,this argument goes, will maintain the flow of recreational and environmental services to the public at large with much lower public expenditures than any activemanagement strategies.
There are three important considerations in making empirical judgments aboutthe desirability of management alternatives on efficiency grounds. One is the effecton coastal property owners. Beachfront property, in particular, is at risk of total lossfrom erosion, and individuals who own such property l'isk losing significant wealthunder a retreat strategy. A second category is the effect upon recreational beach users. Beachgoers generally prefer a beach devoid ofscawalls and groins, both foraesthetic llnd safety reasons. In addition, wider beaches are generally preferred tonarrower ones. The third is the cost of management, consisting of possible construction and maintenance expenditures on armoring, possibly including periodicexpenditures on nourisluuent, or consisting of outright property losses associatedwith the retreat scenario. One might also emphasize environmental and habitat effects of management programs, though this is not something We chose to focus uponin the present paper.
This purpose of this paper is to make quantitative estimates of the costs andbenefits of each of the erosion management strategies for Tybee Island, Georgia.Tybee is a typical East Coast barrier island, consisting of a similar geologicalmakeup and subjected to weather conditions that arc similar to other beaches in theeastern U.S. These estimates are then combined in a 25-year simulation of the threealternatives in order to provide evidence of the relative desirability of alternativebeach management schemes in the eastern U.S.
The paper is organized as follows. We begin with a brief discussion of the studysite. We then turn to the measurement of benefits and costs accruing to property

Evaluation 0/ Beach Erosion Management Alternatives 107
owners through hedonic price rcgression analysis. The next section describes themeasurement of recreational benefits through a stated preference survey, which isfollowed by estimates of management costs based on an examination of historicalcxpenditures. We thcn describe the way that cmpirical results were adapted to fit themanagement scenarios. The results of the simulation are then presented and discussed. The final part of the papcr draws a few central conclusions from the results.
The Study Site - Tybee Island
Tybee Island is located at the mouth of the Savannah River, about J9 miles east ofthe city of Savannah. It has a relatively small year-round population of less than3,000 people (1998 cstimate). It serves as an accessible beach recreation area fornearby communities, most notably the metropolitan area of Savannah (293,000population in 2000), and is also a resort destination for visitors from Atlanta andother population centers.
Rcsidcntial and commercial development of the island began in the late 1800s(Godley 1958). Thc historical erosion management practicc has been a combinationof shoreline armoring and nourishment. The first seawall was constructed on thesouthern part of the island in 1936, and substantial additions of groins and ripraphave been made over the past 40 years. There havc been five major beachrenourishment operations since 1976, the most recent completed in 2000. Whilcmanagement has, for the most part, protected buildings and infrastructure, it has notfully protected thc beach amenities that fuel this resort community's economy. Tourists expect that they will cnjoy recreation on the beach, but the effects of erosion cancause long stretches of the beach to disappear at high tide. Disappointed touristsmay takc their business to other recreational destinations. We examinc the incremental value of improved beaches for both tourists and coastal residents.
Hedonle Analysis of the Benefits of Erosion Proteetion to Property Owners
Beaches provide recreational and amenity values to coastal property owncrs, andthey also influence the flood and crosion risk faced by these propcrty owners. Historically, residcntial structures on or near beaches were built with salvaged orinexpensive rnaterials in recognition of stonn and crosion risks (Pilkey 1995). Thishas changed over the past sevcral decadcs, as more pcople havc SPCllt substantialsums of money 011 property improvemcnts close to the ocean. .
It has been suggcsted that beach width and stability arc imporlant determinantsof properly value, affccting both recreational/amenity values and nood and erosionrisk (Edwards and Gable 1991; Pompe and Rinehart 1995a). The relationship betwecn property valuc, distance from the crosion rcference feature (ERF - usuallymeasured as the high-tide line), and thc erosion rate is a complex one. Propertyowners value shorter distances from the ERF for recrcational and amenity reasons,but they also value protection from storms and erosion risks, which is holstcred bygreater bcach width, more distance from the ERF, and a lower erosion rate.
Interpreting the results of a hedonic analysis of this relationship is made substantially more difficult by their dependence on homeowner's cxpectations of futurccoastal management actions. We interpret our results for Tybee Island as rcnectinglhe residual risk of damagc faced by property owners given the historical and existing programs. QUI' results are also conditioned on thc availability of federal noodinsurance, which most of the" propcrties in the analysis are rcquired to hold. \Ve

108 Landry, Keeler, and Kriesel
should note, however, there is uncertainty over whether sunny-day erosion losses(those not associated with a flooding event) would be covered under this program;there is a very plausible risk that they will not. If property owners are allowing forthe risk of significant changes in erosion protection actions or insurance coverage,our interpretation is biased.
We employ a straightforward application of hedonic analysis, positing thathousing price, Ph is a function of structural characteristics, 8/ (square fcct, age, etc.),and environmental chamctcristics, QI (beach width, distance from the beach, erosionrisk, and the presence of erosion control structures). Neighborhood variables not reflected in these environmental regressors were omitted based on a judgment thut thecommunity on Tybee was small and homogeneous enough to make them unitnpo~
tant.The data set consists of 318 properties on Tybee Island that were sold between
1990 and 1997, chosen at random from the county tax assessor database. We use thisdata set to make inferences about the value of beach resources for all properties onthe island. Residential properties on Tybee were fully developed during the 1970s.New construction during 1990-97 was confined to a few redeveloped lots on theisland's north side. \Ve feel, therefore, that our sample is representative.
The variables representing environmental conditions reflect their condition inthe spring of 1997. Thirty~two transects of beach and dune widths were measuredalong the beach front portion of Tybee Island with an electronic range finder. Promthese measurements, another seven estimates were interpolated to provide adequatecoverage over Tybee's beachfl'Ont. As such. the beach und dune width variables indicate coastal conditions within 200 feet ofa property. Assuming u constant erosionrate across the island, it would be possible to infer what beach widths were in previous years. Nourishment operations in '93 and '95, however, make such u procedureunreliable. To the extent that beach conditions in previous years ('90 to '96) weresignificantly different from the spring of '97, the hedonic price of beach width couldbe biased.
Property distances from the shoreline were calculated using tax maps. Therewere no major storms during this period, and property distance from the shorelinedid not change. Distance from the ERP was calculated as the sum of distance fromthe shoreline, the width of the dune field, aud the width of the dry beach (above thehigh tide line - often zero if a seawall is present). Here, again, beach width is measured in the spring of 1997 and may not be representative of previous years. Erosionrisks were defined qualitatively by each property's proximity to the north and southends of the island (historically high risk areas [Clayton ef al. 1992]) relative to allother areas (classified us 'not high risk'). '
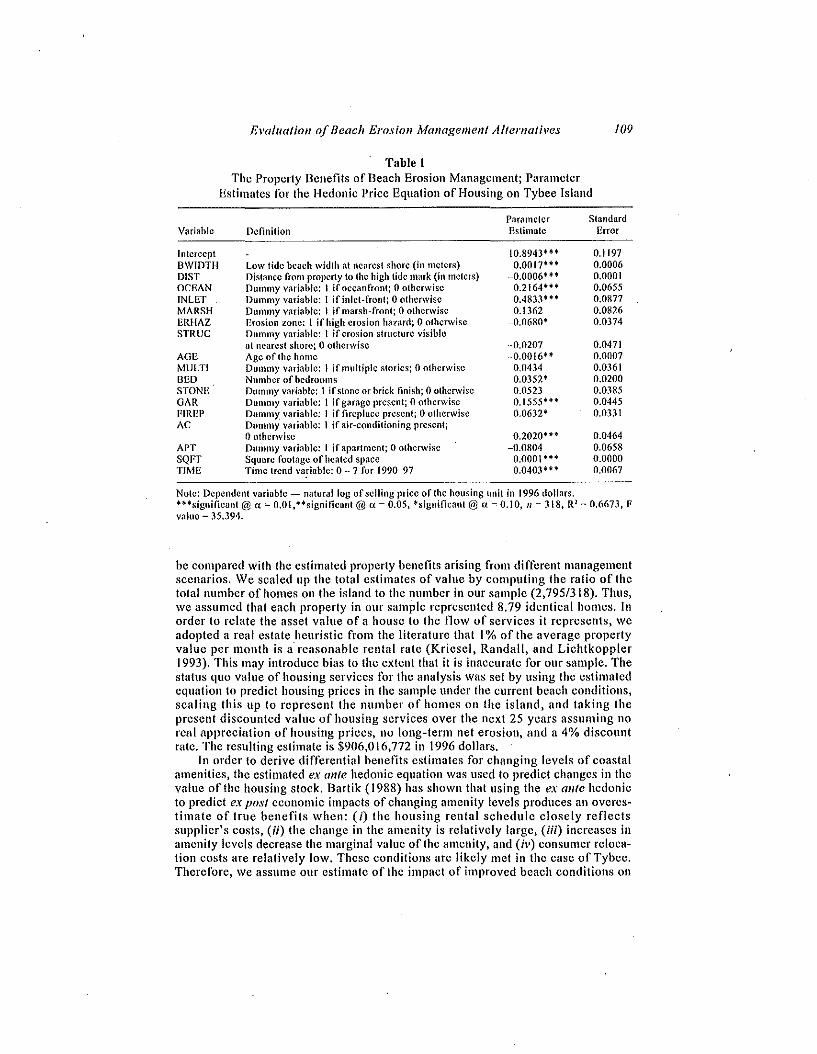
The hedonic regression was estimated us a semi~logarithmic model with ordiuary least squares. The model performed reasonably well, with 13 out of 17variables significant at the 10% level and an R2 of 0.67. The results are given intable I. Beach width was highly significant, both statistically and economically.Evaluated at the means of the data, a one-meter increase in beach width implies unadditional $233 in property value. Similarly, oceanfront and inlet-front status werehighly significant and implied an increase in value of $34,068 for oceanfront homesand $87,620 for inlet-frollt homes. The variable measuring distance from the ERFwas also highly significant, implying that each meter of additional distance reducedproperty value by $91. The erosion risk dUlluny was significant and implied thatpresence in the high-erosion zone reduced property value by $9,269.
Combining the results of the hedonic analysis with other costs and benefits rc~
quires the setting of a basclinc estimate of the property benefits when the status quobeach management practices are in effect on Tybee Island. These estimates can then
Evaluation ofBeach Erosion Management Alternatives
Table IThe Property Bcnefits of Beach Erosion Management; Parameter
Estimatcs for the Hedonic Pricc Equation ofT-lousing on Tybee Island
109
Parameter StandardVariable Definition Estimate Error
Intercept 10.8943·" 0,1197BWIDTH Low tide bcaeh widlh at ncarest shore (in meters) 0.0017·" 0.0006mST Distance from property to the high tide mark (in meters) -0.0006·" 0.0001OCEAN Dummy variable: 1 if oecanfront; 0 otherwise 0.2164*+01' 0.0655INLET Dummy variable: I ifinlet-front; 0 otherwise 0.4833H * 0,0877MARSH Dummy variable: I if marsh-front; 0 otherwise 0.1362 0.0826ERHAZ Erosion zone: I ifhigh erosion hazard; 0 otherwise -0.0680* 0,0374STRUC Dummy variable: I if erosion structure visible
at nearest shore; 0 otherwise -0.0207 0,0471AGE Age of the home -0,0016" 0,0007MULTI Dummy variable: I if multiple stories; 0 otherwise 0,0434 0,0361BED Number of bedrooms 0.0352* 0,0200STONE Dummy variable: I if slone or brick finish; 0 otherwise 0,0523 0,0385GAR Dummy \'ariable: I if garage present; 0 otherwise 0,1555*" 0,0445FIREP Dummy.variable: I if fireplace present; 0 otherwise 0,0632'" 0,0331AC Dummy variable: 1 if air-conditioning present;
ootherwise 0.2020**'" 0.0464APT Dummy variable: I if apartment; 0 otherwise -0,0804 0,0658SQPT Square footage of heated space 0,0001"'** 0,0000TIME Time trend variable: 0 -" 7 for 1990-97 0.0403*** 0,0067
Note: Dependent variable - natural log of selling price of the housing lInit in 1996 dollars,H"'significant@o: = O.OI,"signifieant@ 0: = 0.05, "'significant@o:=O,IO, 1/ = 318, Rl = 0.6673, rvalue = 35.394.
be comparcd with the estimated property benefits arising from diffcrent managementsecnarios. \Ve scaled up the total estimates of value by computing the ratio of thetolal number of homes on the island to the number in. our sample (2,795/318). Thus,we assumed that each property in our sample represented 8.79 identical homes. Inorder to relate the asset value of a house to the flow of services it represents, weadopted a real estate hcuristic from the literature that I% of the average propertyvalue per month is a" reasonable rental rate (Kricsel, Randall, and Lichtkoppler1993). This may introduce bias to the extent that it is inaccurate for our sample. Thestatus quo value of housing services for the analysis was set by using the estimatcdequation to predicl housing prices in the sample under thc current beach conditions,scaling this up to rcprescnt the number of homes on the island, and taking theprescnt discounted value of housing scrvices over the next 25 years assuming noreal apprcciation of housing prices, no long-term net erosion, and a 4% discountrate. The resulting estimate is $906,016,772 in 1996 dollars,
In ordcr to derive differential benefits cstimates for changing levels of coastalamenities, thc cstimated ex ante hedonic equation was used to predict chungcs in thevalue of Ihc housing stock. Bartik (1988) has shown that using the ex ante hedonicto predict ex post economic impacts of changing amenity Icvels produces an. ovcrcstimate of true benefits when: (;) the housing rental schedule closely reflectssupplier's costs, (ii) the changc in the amenity is relativcly largc, (iii) increases inamenity levels decrease lhe marginal value of the amenity, und (iv) consumer relocation costs are relatively low. These conditions are likely met in the case of Tybee.Thcrcfore, We assume our estimate of the impact of improved beach conditions on

llO Landl)l, Keeler, and Kriesel
the value of the housing stock is an upper bound estimate of the true impact.\OUf alternative management scenarios involve increasing beach width and re
moving the bulk of shoreline armor (with the exception of the terminal groins) onTybee Island. In one case, we assume that these beach conditions arc maintained bydrastically increasing the amount of beach nourishment. In the other, we assume thatshoreline retreat maintains these conditions. To derive property benefits associatedwith the Nourishment Alternntivc, we estimated the value of houses in our sampleassuming a 2.S-meter increase in the average beach width, and calculated thepresent discounted value ofhotlsing services over 25 years (employing the same assumptions as the status quo measure). The resu lting measure is $908,143,449 in1996 dollars, a $2,126,677 increase over the statns quo. The properlY effects associated with the Shoreline Retreat Alternative are explained in a subsequent section.The differential property value effects of both alternatives can be found in themiddle column of table 7.
Stated Preference Analysis of the Recreational Benefits to Beach Visitors
Beaches provide benefits to visitors who utilize them as a place for sunning, swimming, walking, fishing, and other sporting and leisure activities. The magnitude ofthese benefits depends, in'part, on beach characteristics that are directly affected byerosion management choices, including beach width and the presence and nature ofengineering structures, as well as the number of beach visitors attracted to the site(Silberman and Klock 1988). The recreational benefits of alternative managementstrategies relative to the status quo were measured through a contingent choice2
(CC) survey of recreational beach users on Tybee Island during three seasons in1998. To avoid double counting, Tybee Island residents were removed from thisdataset.
The survey instrument for this research (which can be found in the Appendix)was designed around a map of Tybee Island that illustrates the types of beach conditions and depicts the location of beach types on Tybee under alternativemanagement conditions. It begins with a short description of Tybee Island nod itsshoreline erosion phenomena, and then inquires about the frequency of beach visitation and experience with poor beach conditions that Were erosion-related. Theinstrument then presents four color pictures of different beach conditions: widestbeach (approx. 28 meters wide at high tide, 73 meters at low tide), wide beach(approx. 23 meters wide at high tide, 68 meters at low tide), narrow beach (approx.9 meters wide at high tide, 55 meters at low tide), and narrowest beach (no beach at
IOn Ihe other hand, if Ihe Tybee housing market were a very small part of a larger market for coastalhousing, then a localized change in beach condilions would not affect the equilibrium market relationship. The predicted value of the housing stock would precisely reOeet the change in welfare, whichwould accrue to landlords in the form of increased rellis. Most of the barrier islands in Georgia arc undeveloped. There arc only Ihree developed substitute sites within Georgia. The closest; Saint Simon'sIsland, is 80 miles from Savannah. The South Carolina coast has a !lumbcr of developed beaches, someof which arc closer in proximity to Savannah (such us Hilton Head, 40 miles away). As such, Tybee is asignificant portion of the coastal housing market in the southeastern U.S., and changes in amcnity levelswould likely have an impact Oil the equilibrium hedonic price function in the region.2 The only difference bctwcen a traditional referendum contingent valuation (CV) survey and conlingentchoice is that, in the laUer, the respondent is presented with two (or more) distinct choices. Each choiceis characterized by a set of beach conditions (the status quo versus an improvement) and an associatedprice. In a comparable CV survey, tho respondent would be presented with a set of beach conditions andan associated price, each marginal to the status quo, and asked to make a )'es-or-I/o decision on the proposed changes to status quo,

Evaluation ofBeach Erosion Management Alternatives 11/
high tidc, 45 meters at low tide). The facing page describes these beach conditionsand discusses policies that can be used to maintain beach width.
The respondent is then pr~sented with two color maps of the island: the statusquo conditions and the improved conditions brought about by one alternative management plan. The contingent choice being made posits the status quo conditionsagainst four alternatives (summarized in table 2), one of which was presented in anygiven survey. Alternative One depicts wider beaches (a one-meter increase in the average width) with shoreline armorillg similar to the status quo. Alternative Twooffers even wider beaches (a 2.5~meter increase in the average width) with minimalarmoring (only the terminal groins, at the north and south cnds of the island, remain). Thc third and fourth alternatives are graphically identical to the second, butcontain a specification of the management strategy to be used to achieve the improvements. The third alternative specifies that a policy of increased beachnourishment be used to maintain wider beaches devoid of seawalls. The fourth alternative specifics that a policy of shoreline retreat be the management approach usedto maintain the wider beaches. An existing payment vchicle - beach parking feeswas chosen for the survey. The facing page presents the primary valuation question:
Considering the beach conditions and thc price of using the beach, whichwould you prefer to see at Tybee Island? (circle one)
a. Current Conditionsb. Alternative Management
(at $O.50/hour or $5/day or $50/year)(at $X/hour or $Y/day or $Z/year)
where X, Y, and Z vary among respondents. In order to prevcnt free riding of beachvisitors that rent beach houses or hotcl rooms, the survey clearly stated, u ... parkingfees would be extended to rental houses and hotels."
Potential participants were approached at the beach on Tybee Island and askedto participate in the survey. If they agreed, their name, address, and a brief survey ofpersonal characteristics were recorded, and surveys were distributed with return envelopes. A foHow-up postcard was sent to respondents' homcs two weeks later, anda replacement survey was scnt a month after initial contact if a response had notbeen received (Dillman 1978). The response rate for the survey was just under 50%,and the nnmber of usable responses (1,612) was 48% of the surveys distributed. Because beach visitors have a choice bctwecn daily parking and an annual pass, twoseparate models were estimated (referred to as the 'day-tripper' and 'pass~holdcr'
Table 2Mahagcment Scenarios for Recreational Benefits Survey
Scenario
Status quoAlternative IAlternative 2
Alternative 3Alternative 4
Description
Current levels of armoring and beaeh width*Wider beaches than status quo with similar shoreline armoringWider beaches than Alternative I with greatly reduced shoreline annoringthrough unspecified policiesSame as Alternative 2, but specified as achieved through beach nourishmentSame as Alternative 2, but specified as achieved through shoreline retreat
.. The stalus quo scenario assumes Ihal nourishment is sufficient to prevent any long-term net beach erosion.

/12 Landry, Keeler, and Kriesel
1l.1Odels, whose separation was justified by use of the Wald tcst for structuralchange)3 and the results combined to make estimates for the beach visitor population.
Bell and Lecworthy (1990) use an. 'on-site' cost model to estimate the benetlts ofFlorida beaches. In their model, they distinguish between the conventional travel costsand those costs incurred at the recreational site, finding that the former are positivelyrelated to the demand for beach days, while the latter are inversely related. OUf paymentvehicle is an oIlwsitc cost that could have a similar inverse effect on the demand forbeach days. While we felt that the payment vehicle was more believable than themore standard "voluntary contribution" mechanism, changing parking fees may induce substitution away from beach recreation (or induce recreation at otherbeaches). Moreover, we did not feel that we had sufficient data on travel costs to estimate a model following Bell and Leeworthy that would allow for changingvisitation after the improvement. As such, our price increase measure is calculatedas the prospective increase in parking fees, calculated at current visitation rates. \Vedo not take into account how visitation changes after the improvement have occurred.This implies that our recreational benefit estimates are lower bounds to the truemeasure, because any adjustment in visitation will be strictly welfare increasing.
\Ve only sketch the model underlying these estimates, which is a very conven~
tional (\pproach to analyzing dichotomous choice stated preference data. Individualutility depends on beach conditions associatcd with management actions, wealth,and a composite good (11). Letting bo represent status quo beach quality and management actions and bl represent proposed changes in beach quality (and in some casesmanagement actions), respondents choose the alternative that gives them the highestutility. They Will, therefore, choose the alternative management strategy if its indirect utility is higher than that associated with the status quo:
(I)
where y is the respondent's incomc, A is the incremental cost to the respondent ofthe proposed managemcnt alternative, II is a composite commodity, and s is a vcctorof observable characteristics (gender, age, history of visiting Tybee, etc.). The variables Eo and E, are identically and independently distributed stochastic disturbanceterms with zero means.
A logistic regression is used to estimate this model. The regression is specified as:
Prob {alternafivestrategychosen} ;= 0 + e-I'] I, (2)
where v represents the change in indirect utility relative to the choice representingstatlls quo conditions (which is assumed to follow a logistic distribution)(Hanneman 1984). Eighty percent of the respondents were identified as 'day-trippers'. The estimation results for this portion of the data are presented in the firstcolumn of table 3. Ten of the 16 covariates were statistically significant at the 10%level. The estimated coefficients on NOURISH and RETREAT were bolh greaterthan that on \VIDER. The only difference between these alternatives is that the twoformer specify the method of management, whilc the latter does not. Moreover, thespecified management methods, beach nourishment and shoreline retreat, are verydifferent in their approach. While one would expect that physical outcomes ofbcachmanagement are important, this result suggests that management processes arc as
3 Wald statistic co 60.87 with IS degrees of freedom. Conclusion: reject Ho, f1r,,,,_ldJ.., 110t equal to P.L./,rin~"

Evaluation ofBeach Erosion Management Alternatives
Table3Discrete Choice Models for Beach Improvements on Tybee Island
113
Day-tripper Pass-holderVariable Definition Model Model
PRICEINC The amount of the annual price increase -0,0055... • -0,0049·"(0.0009) (0.0010)
INCOME Annual household income (in thousands of dollars) 0,0069"" 0.0082"(0.0022) (0.0048)
WIDER Dummy variable: I if Alternative 2 (wider beaches 0.3214· --0.2654with minimal armoring); 0 otherwise (0.1715) (0.3713)
NOURISH Dummy variable: I if Nourishment Alternative; 0.5662" 0.3046ootherwise (0.2318) (0.4617)
RETREAT Dummy variable: I if Retreat Alternative; 0.4266* -0.4501ootherwise (0.2313) (0.4804)
BQUAL Scale variable: 1-5, high to low satisfaction with 0,3921+'" 0.4491·'"current Tybee Island beach quality conditions (0.0709) (0.1485)
SPRING Dummy variable: I for Spring season; 0 otherwise 0.5452** -1.2900"(0.2328) (0.5059)
SUMMER Dummy variable: I for Summer season; 0 otherwise 0.Q740 -0.4745(0.2112) (0.4182)
AGE Age of the survey respondent -0.0071 0.0184+(0.0051) (0.0111)
MALE Dummy variable: I for male; 0 otherwise -0.1036 -0.1933(0.1358) (0.2735)
PROGOV Score variable: 2-10, low to high support for 0,1277· ... 0.1059government intervention in land use activities (0.0409) (0.0882)
ENVIRO Score variable: 3-15, low to high support for -0.0208 0.0316'environmental protection (0.0323) (0.0675) .
TRANSIT Hourly transit time to the Island -0.0076 0.0640(0.0113) (0.0391 )
HEDUC Dummy variable: I indicating college degree; -0.0312 0.1531'"ootherwise (0.1407) (0.3429)
LOCAL Dummy variable: I if local resident -0,3973+· -1.1644"'+(Savannah or Thunderbolt); 0 otherwise (0.1715) (0.3262)
INTERCEPT -1.9330+" -2.4451'"(0.4995) (1.1608)
N 1,229 313Log-likelihood -725.85 -168.51LRTstat (w/15 df) 151.57 90.41Prob: Predicted Prob 35,80%: 32,09% 42.81%: 39.86%
Notes: Dependent variable=l for an affirmative response to beach improvements with associated fcc increase, 0 otherwise,·"significant@ 0; = 0,01, Hsignificant@ « = 0,05, ·significant@ « = 0,10 (Standard errors arc inparentheses.)
well) and that beach visitors exhibit positive values for both of these distinct approaches, The model predicted a 32. t% affirmative response rate associated with thealternative strategies, which was close to the actual affirmative response rate of35.8%.
The 'pass-holder' model included the remaining 20% of survey respondents,and the results arc given in the second column of table 3, Eight of the sixteen
. covariates were statistically significant at the 10% level. Interestingly, none of thedummy variables identifying the alternative treatments were significant, A majority(53%) of Ihe 'pass-holders' were local residenls from nearby Thunderboll and Savannah. (This is considerably higher than in the 'day-tripper' sample, 24%.) Localrecreational users will be affected to a greater extent by changes in beach condi-

lJ4 Landry, Keeler, and Kriesel
tions, since their substitution possibilities arc more limited, and there is much uncertainty about the longMterm management of barrier islands, especially in light of thepotential for sea level rise. As such, it is possible that there is no clear consensusamong local people on the attractiveness of either management approach, and thusthere is a good deal of noise in the parameter estimates. Also, the point estimate ofone of the coefficients (WIDER) had an unexpected sign, which could reOect the belief of sOl11e local residents that wider beaches wilt bring more tourists, withassociated congestion problems. The model predicted an affirmative response rate of39.9%, which is reasonably close to the actual rate of 42.8%.
Due to the large number of 'no' responses in the data (roughly 2/3 for the 'daytripper' model and over half for the 'pass-holder' model), we decided to use themean measure of marginal WTP rather than the rnedian. \Vhile these two should beequal for a symmetric distribution (as is the logistic), our point estimate of the me~
dian was negative (with a wide confidence interval) for one of the models('day~tripper').The mean marginal WTP, however, can be estimated as the area un~
del' the fitted logistic regression curve, which is non-negativc. The area under thelogistic curve was calculated by numerical integration.
'Day-tripper' Welfare Measures
The integration procedure yielded a mean marginal WTP estimate of $97.65 (deflated to 1996 dollars) per 'day-tripper' household per year. Dividing by averagevisits per year (l0.36 days), we arrive at a daily marginal WTP of $9.43 per household. These overall averages were calculated with all covariates set at their samplemeans. To derive differential welfare measures, we manipulate the sequence ofdummy variables (WIDER, NOURISH, and RETREAT) to correspond with each ofthe alternatives, ilLturn. For example, the marginal WTP for Alternative One (thebaseline for the logit model) was calculated by setting all three of the includeddummy variables to '0'. This resulted in a daily marginal WTP of $7.43 per household. This is a monetary measure of what the average 'day-tripper' household iswilling to give up (in tefll1S of purchasing power) to attain the conditions identifiedin Alternative One relative to those in the status quo.
Likewise, the marginal WTP for Alternative Two was calculated by setting the\VIDER dummy variable to 'I' and the othcr two to '0'. This resulted in a daily marginal WTP of $9.56 per household. Alternative Two was designed to elicit the valueassociated with the removal of a seawall on Tybee. There is strong evidence thatsuch a sccnario would lead to an increase in the quality of the beach. We cannotclaim, however, that the removal of shoreline armoring and an improvement inbeach conditions are perfectly correlated in all cases, and we do not know whichchange subjects were responding to. As such, we must interpret this result with caution. We conclude that this is weak evidence that the removal of shoreline armoringwill enhance recreational benefits.
The 'day-tripper' daily marginal \VTP measures for the Nourishment and Retreat alternatives were $11.39 and $10.35 per household per day, respectively. Aprimary objective of this research is to assess the relative efficiency of these twodistinct methods. We find that recreational benefits nrc sensitive to the managementregime when resultant beach conditions are identical, and these results are key in theanalysis th.at follows. These differential welfare estimates will be used in conjunction with welfare estimates from the pass-holder model to analyze the overallrecreational benefits of the various management alternatives under consideration.

Evaluation 0/ Beach Erosion Management Alternatives
'Pass-holder' Welfare Measures
115
The mean marginal WTP estimate for the 'passwholder' sample is $176.09 (deflatedto in 1996 dollars) per household per year. 'Dividing this by the average visits peryear (46.71 days) produces a daily marginal WTP eslimate of$3.77. We follow thesame procedure as outlined above to estimate the welfare measure for AlternativeOne, which produces a daily marginal WTP estimate of$4.02 for the 'pass-holder'group. None of the other dummy variables were significantly different from zero, sowe do not derive differential WTP measures for the other alternatives.
Aggregate Welfare Measures
We calculate weighted average welfare measures for each alternative assuming thatthe true proportion of daily uscrs and pass holders is reflected in our sample. Thesefigures are presented in column one of table 4. The estimated welfare measures werescaled up using Georgia Department of Transportation traffic count data (Deloney1994). These data were generated from procedures that netted out regular cOlnmutertraffic from actual beach visitors. The resulting estimate of recreational trips toTybee Island is 899,284 per year. Since our welfare estimates correspond to thehousehold level, we make the conservative assumption that each car corresponds toone survey response. The annualized welfare estimates are presented in column twoof table 4.
Table 4The Recreational Benefits of Beaches; Weighted Averages of Marginal
Willingness-To-Pay Estimates for the Valuation Alternatives
Daily* AnnualMean Mean PDY** of
Marginal Marginal RecreationalAlternative Description WTP WTP Benefits
Wider beaches with similar S6.75 S6,070,167 $94,828,634shoreline armoring
2 Wider beaches with minimal $8.45 $7,598,950 $118,711,404shoreline armoring(No management policy specified)
3 Wider beaches with minimal $9.92 S8,821,697 S137,813,255shoreline armoring(Beach nourishment specifiedas management policy)
4 Wider beaches with minimal $9.08 $8,074,698 S126,143,577shoreline armoring(The adoption of a retreat policyspecified for management)
Notes: Averagcs havc been denated to 1996 dollars, Weighted averages assume the same proportion of'day-trippers' and 'pass-holders' found in the sample: 4/5 and lIS, respectively. The welfarc mcasuresassume no change in thc numbcr of rccrcationaltrips... Pcr vehielc day cstimates arc used because the contingent choice survey elicited WTP pcr household.H Present discounted value ofreerealional benefils over 25 years assuming a 4% diseounl rate and aconstant tourist population.

116 Landry, Keeler, and Kriesel
The weighted average daily marginal WTP for Alternative One (n one-meter il1 w
crease in the average width with shoreline armoring similar to the status quo) is$6.75 (in 1996 dollars) per household. Scaling this numher by the estimated beachuser days provides an annual benefit estimate 0[$6,070,167 from wider beaches. Alternative Two (n 2.5 w meter increase in the average beach width with minimalshoreline armoring) had a significant effect in the 'day-tripper' model. Taking thiseffect into account, daily marginal \VTP increases by $L70, corresponding with anannual welfare estimate of $7,598,950.
The only significant effects associated with specifying the management strategy(Alternatives Three and Four) Were found in the 'day-tripper' model, where subjectsexhibited an increased marginal \VTP when either management strategy was specified. The marginal WTP for beach conditions maintained by nourishment were
.estimated to be about 10% higher than the same conditions maintained by a policyof shoreline retreat for the daily visitors. The weighted daily average marginal WTPfor improved, nourished beaches was estimated at $9.92, while the weighted dailyaverage marginal WTP to i1nproved, natural beaches (trmintained by retreat) was estimated at $9.08. These estimates correspond with annual recreational benefits of$8,821,697 and $8,074,698, respeelively.
To estimate recreational benefits over the 25-year Hille horizon of our simulations, we made the conservative assumption that visitor days remain constant. Theestimated valuation measures are assumed to remain constant, and futurc benefitsare discounted at 4%. The resulting recreational benefit estimates urc prescnted inthe third column of table 4.
The Costs of Erosion Management
Structural engineering on Tybee Island began in 1882 and has had a constant pres w
ence since then. Table 5.A lists the major shoreline enginecring structures erectedand their accompanying costs. The present value of all erosion control structuresamount to about $16.24 million (1996 dollars), which includes a rough estimate forstructures built before the 1936 seawall (rye 1998).
Table 5.B provides estimates of beach nourishment costs beginning in 1976 andrunning through to the renourishment undertaken by the Georgia Ports Authority in1995. (At the time of this writing, another nourishment project had just been conl w
pleted on which we did not have data.) The present value of beach nourishmentcosts since 1976 amounts to $16.62 million. Thus, the total costs of beach manage w
ment on Tybee Island, including both structures and beach nourishment, amount toan estimated present cumulative value of $32.86 million.
In this analysis, the historical costs of beach management on Tybee Island serveas a guide to the projected future costs of the status quo maliagement scenario. Theaverage cost of beach management on Tybee over the past 35 years has been about$1 million per year (in 1996 dollars). This number is slightly higher than the ArmyCorps projected nourishment cost estimates of $972,000 per year (Delony 1994).The Corps estimates reflect initial nourishment costs of $5.5 million (projected from1994 to occur in 1996) and three periodic renourishment costs at about $4.3 millionevery seven years (effectively, until around 2024). Included in these estimates aremobilization/demobilization costs and dredging costs, each with contingcncy costbuffers, as well as cultural resource investigation, planning, engineering, design, andconstruction management costs. \Ve use the million-dollar yearly cost of status quobeach management as a benchmark.
In estimating the costs of erosion management using nourishment with minimal·shoreline protective devices, we assumed that only the terminal groins at the ex-

Eva/uation ofBeach Erosion Management Alternatives
Table 5Historical Erosion Management Costs on Tybee Island, Georgia
117
A: Structural Engineering Projeets
Year(s) Typc of Structure Reach Currcnt Dollars 1996 Dollars
1882-1940 Various Mostly ncar FI. Screven -$700#+ ~S7,775#+
1936 Seawall South end to Tilton Ave. S93.5+ SI,046+1965 Riprap Tybee light to 7'h Sf. S301 SI,4891971 Scawail/riprap Repair 100 n. S65 S2521975 Terminal groin North end S876 S2,5961984 Riprap South of I7L~ SI. S321.9 S4881987 Tenllinal groin (& repairs) South end S607.4 S8431995 Groin ficld South end SI,700 SI,746
TOTALS S4,664,8 S16,235
B: Beaeh Nourishment Projects
Volulllc Linear Current 1996 Sku. S/LinearYear Reach (cu, yds,) Feet Dollars Dollars Yard Foot
1976 North groin to 18'h SI. 2,300,000 18,480 S2,628 S7,298 S3,17 SO,391987 North and south ends 1,360,000 14,SOO SI,989 S2,762 S2,03 SO,191993 North groin to 2 M SI. 918,000 4,610 S3,780 S4,093 S4.46 SO,891995 North and south ends 344,000 7,100 S2,400 S2,465 S7,17 SO,35TOT/AVO, 4,922 44,690 SIO,797 S16,618 S3,14 SO,35
Note: All costs arc in thousands of dollars.# These figures arc rough estimates from a review of historical engineering operations at Fort Screvensupplied by Pye (1998)... Not used in subsequent analysis,
trcme north and south ends of thc island remained. (These are likely to be retaincdundcr any management scenario to hclp stabilize the beach template under the pressure of thc long-shore current.) \Vhile thc rcmoval of seawalls, groins, and rip-rapshould increase beach quality, beach nourishment would have to be increased drastically to maintain the present/oeation of the shoreline, and overall costs are expcctedto be significantly highcr than the status quo. \Ve consider ad hoc cost increases of50, 100, and 200% over the status quo.
The Retl'eat Simlllatioll
Examining the costs and benefits of a retreat strategy was the most challenging andmost interesting part of this analysis. Shoreline retreat differs from the other management strategies in that the composition and characteristics of the housing stockare directly affected in ways that vary over the course of the analysis. We focus onresidential properties, which comprise the majority of buildings on Tybee Island.
We assume that once engineering structures were removed and nourishmcntprojects ceased, the ocean shoreline of Tybee would begin to move landward at aregular rate. Unfortunately, unlike at many other east coast beaches, there has beenso much intervention for so long that there is no way to make accurate estimates of a'natural' erosion rate. In addition, erosion rates would vary at different parts of theisland. We have chosen to use a variety of erosion rates based on maps of Tybee

118 Landry, Keeler, and Kriesel
from the previous century and on erosion ratcs on similar barrier island beaches, nudwe have chosen to apply these uniformly along Tybee's shore. We examine six erosion rates, ranging from 1/3 meter to 2 meters per year.
Recall that we arc using the rental rate as an npproximation of use value associated with the housing stock, not changes in the value of capital. \Ve assume that theuse value ora house close to the beach stays high until the house becomes unusable,at which time all value is lost. As indicated above, using the ex anle hedonic equation to predict ex post eff~cts will likely overshoot the true measure. Coastalproperty characteristics that arc valued by homeowners include proximity to thebeach (the inverse of distance), as well as quality of the beach. \Ve value physicalchanges in the coastal environment accruing to homeowners under the assumptionthat estimated hedonic prices associated with these attributes remain constant. In ad w
dition, the value associated with frontage on the ocean is not lost, but rathertransferred to other properties. These stylized facts partially compensate for thevalue of houses lost to erosion, but the hedonic prices of these attributes couldchange, which may damper this effcct. Our approach abstracts from any structuralchange in the underlying hedonic relationship, which could be an important consideration.
Distance and beach width Ill.USt be recalculated for every period in the erosionprocess and recvaluated in terms of its effect on the remaining housing stock. \Veassumed that a retreat process would generally maintain wide, high-quality beaches(Pilkey 1999), which increases the use value associated with housing. For consistency, beach widths in the retreat simulation were altered in accordalJ.ce with thcRetreat Alternative in the contingcnt choice survey. The distance ofcach housc fromthe ERF is reduced annually by the erosion rate, which also increases the use valueof housing. The effect of distance can be expected to become negligible at some significant dist.ance from the beach, and in our sample there seemed to be nosignificant relationship beyond 460 meters from the ERF. Houses further than 460
. meters were not modeled ns increasing in value as their distance from the beach decrensed.
In addition, there are two important discrete effects that must be addressed:houses that are lost to the erosion process, and houses that move from nonheachfront to beach front status. To identify these properties, we examined everyproperty within 100 meters of the dune line (slightly more than 10% of the sample).For each of these properties, two distances were measured on the county tax maps:the distance at which the property would be consumed by erosion, and the distanceat which it became henchfront, Ifeither of these distances were surpassed during thesimulation, the status and resulting value of the house was adjusted. In the case ofhouses lost to erosion, the value of the housing services was permanently lost and aone-time charge of $14,000 (Pnrsons and Powell '1997) was assessed as the cost ofdismantling and removal. In the case of a change to beachfront status, the value ofthe dum.my variable for beachfront is changed from '0' to 'I', and the house re w
ce~ves the increment in benefits predicted by the hedonic model for beach fronthouses.
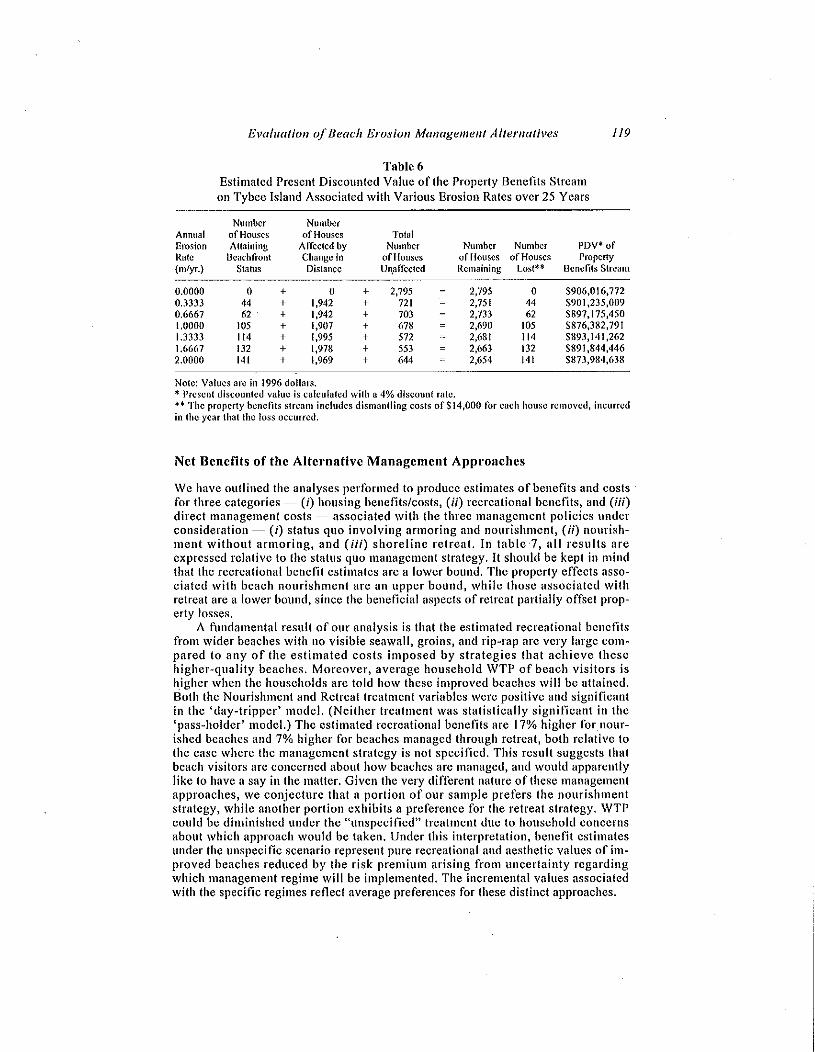
Under the assumptions governing this analysis, the effect of a retreat scenarioon the value of housing services depends somewhat idiosyncratically on the erosionrate (sec table 6). The stream of property benefits clearly decreases under a retreatscenario, but the degree of diminution is not monotonically related to the rate of ero w
sion. At higher rates of erosion, beaches widen and proximity increases morequickly, which partinlly compensates for lost housing. As mentioned above, oceanfront statlls is never lost outright, but rather transferred to remaining properties. Atan erosion rate of two meters per yea"r, the estimated welfare loss for homeownersaccruing from retreat over the 25-year simulation is around $32 million.
Evaluation ofBeach Erosion Management Alternatives
Tobie 6Estimated Present Discounted Value of the Property Benefits Streamon Tybee Island Associated with Various Erosion Rates over 25 Years
119
Number NumberAnnual of Houses of Houses TotalErosion Attaining AlTeeted by Number Number Number PDY* ofRate Beachfront Change in of Houses of Houses of Houses Property(m/yr.) Status Distance Un.alTecled Remaining LostH Benefits Siream
0.0000 0 + 0 + 2,795 2,795 0 $906,016,7720.3333 44 + 1,942 + 721 2,751 44 $901,235,0090.6667 62 . + 1,942 + 703 2,733 62 $897,175,4501.0000 105 + 1,907 + 678 2,690 105 $876,382,7911.3333 114 + 1,995 + 572 2,681 114 $893,141,2621.6667 132 + 1,978 + 553 2,663 132 $891,844,4462.0000 141 + 1,969 + 644 2,654 141 $873,984,638
Note: Yalues arc in 1996 dollars.* Present discountcd value is calculated with a 4% discount ratc.H The propcrty bcnefits slream includes dismantling costs ofS14,000 for each house removed, incurredin the year that the loss occurred.
Net Benefits of the Alternative Management Approaches
\Ve have outlincd the analyses performcd to produce estimates of benefits and costs'for three categories - (;) housing benefits/costs, (ii) recreational benefits, and (iii)direct management costs - associated with the three management policies underconsideration - (i) status quo involving armoring and nourishment, (ii) nourishment without armoring, and (iii) shoreline retreat. In tablc'7, all results areexpressed relative to the status quo management strategy. It should be kept in mindthat the recreational benefit estimates are a lower bound. The property effects associated with beach nourishment are an upper bound, while those associated withretreat are a lower bound, since the beneficial aspects of retreat partially offset property losses.
A fundamental result of our analysis is that the estimated recreational benefitsfrom wider beaches with no visible seawall, groins, and rip-rap are very huge compared to any of the estimated costs imposed by strategies that achieve thesehigher-quality beaches. Moreover, average household WTP of beach visitors ishigher when the households are told how these improved beaches will be attained.Both the Nourishment and Retreat treatment variables were positive and significantin the 'day-tripper' model. (Neither treatment was statistically significant in the'pass-holder' model.) The estimated recreational benefits are 17% higher fornourished beaches and 7% higher for beaches managed through retreat, both relative tothe case where the management strategy is not specified. This result suggests thatbeach visitors are concerned about how beaches are managed, and would apparentlylike to have a say in the matter. Given the very different nature of these managementapproaches, we conjecture that a portion of our sample prefers the nourishmentstrategy, while another portion exhibits a preference for the retreat strategy. WTPcould be diminished under the "unspecified" treatment due to household concernsabout which approach would be taken. Under this interpretation, benefit estimatesunder the unspecific scenario represent pure recreational and aesthetic values of improved beaches reduced by the risk premium arising from uncertainty regardingwhich management regime will be implemented. The incremental values associatedwith the specific regimes reflect average preferences for these distinct approaches.

120 Landry, Keeler, and Kriesel
Table 7Marginal Changes in the Prescnt Discounted Value* of Welfare Measures
for Beach Management Alternatives on Tybee Island over 25 Ycars
Murginal Marginal Marginal MarginalChange in Change in Change in Change
Recreational Property Management in SocialAlternative Benefits Benefits· * CoSlsu+ Welfare
Nourishment WID SI37,813,255 + S2,126,677 S7,811,040 SI32,I28,892AmlOring (50%,cost increase)Nourishment wlo S137,813,255 + $2,126,677 S15,622,080 SI24,317,852Annoring (100%cosl increase)Nourishment w/o SI37,813,255 + S2,126,677 531,244,160 SI08,695, 772Annoring (200%cost increase)Retreat (1/3 mlyr. S126, 143,577 c (-)S4,78I,763 (-)SI5,622,080 S136,983,894erosion rate)Rctf(,.'ul (2/3 m/yr. S126,143,577 + (-)$8,841,322 (-)SI5,622,080 SI32,924,335erosion mtc)RclrcHI (1 m/yr. S126,143,577 (-)$29,633,981 (-)SI5,622,080 SI12,131,676erosion rate)
SI26,I43,577Retreat (I 113 m/yr. + (-)SI2,875,510 (-)SI5,622,080 SI28,890,I47erosion rale)Retreat (t 2/3 m/rr. $126,143,577 + (-)SI4,I72,326 (-)SI5,622,080 S127,523,331erosion rate)Retreat (2 m/yr. $126,143,577 + (-)S32,032,134 (-)$15,622,080 SI09,733,523erosion rate)
• The present discounted values arc cnleulatcd with a 4% discount rate .... The strcam of property benefits reflects a 2.5-meter increase in average beach width for all alternatives. The Retrcat Alternative includes lost houses and changes in distallces and beachfront status,... Management cost estimates for the Nourishment w/out Armoring Alternative reflcct permanent costincreases of SO, 100, nnd 200% ahove the currcnt le\'el of S I million per year, While the Retreat Alternative reflects cost savings of the rDV of $ I million per year over 2S years.
The sizable recreational benefits from both alternative regimes drive the overallresulting social welfare measures presented in table 7, The marginal change in socialwelfare across both regimes ranges from approximately $108 million to $136 million. The higher estimated net benefits of beach management on Tybee Island over25 years are associated with the retreat strategy under modest erosion (1/3 - 2/3meters per year). These scenarios exhibit high recreational benefits, managementcost savings (in terms of foregone nourishment and armoring expenditures), andsmall net pecuniary effects on the property market.
If the realized erosion rute is greater than 2/3 meter per year and beach nourish~
ment costs without shoreline armoring do not rise drastically (less than double thecurrent costs), beach nourishment would be the preferred strategy over the timeframe of this analysis, The estimated recreational benefits of beach nourishment arcgreater than those under shoreline retreat, and in this scenario the rising mannge~
ment costs are further justified by the forgone property damage, If beachnourishment costs rise drastically (triple), on the other hand, the optimal strategyagain becomes shoreline retreat. This conclusion is similar to that obtained by Kyperand Sorenson (1985), though their analysis did not include recreational benefits, Itshould be noted, however, that the property benefits measure is an upper bound. In

Evaluation ojBeach Erosion A-/anagement Alternatives J21
the beach nourishment scenario, this implies that the true effect could be less than$2,126,677; while in the retrcat scenario, the true negative effect could be evengreater in absolute value than what we have estimated. We also note that the recreational benefits are lower bounds. More research on both the recreational benefitsand property effects of beach management is clearly warranted. Given the sensitivityof our results to the erosion rate and the rate of increase in management costs, thesetopics would also be fmitful areas of future research.
Conclusions
III this paper, we have compiled differential costs and benefits to evaluate the efficiency consequences of three relevant management strategies for Tybee Islandbeaches. \Vc find that the potential benefits from maintaining wide beaches withoutshoreline armoring are substantial and make the status quo management strategy theleast desirable of the three strategies examined. Our stated preference study of therecreational value of beaches indicated that a beach nourishment strategy providesfor higher recreational benefits, while the recreational benefits of shoreline retreatare slightly lower. Both strategies, however, receive higher evaluations for the sameresulJing general beach conditions than when no management strategy is specified.This result suggests that people value information on the management of natural resources in a substantial way.
Our analysis suggests that the countervailing property losses under a retreatstrategy are of the same order of magnitude as the foregone management costs whenthe beneficial effects of retreat - higher values of housing services for those housesnot lost to erosion - are considered. However, property losses are highly dependentupon the rate of shoreline erosion. If unabated shoreline erosion proceeds at a highrate (two meters per year), property losses are estimated at roughly twice the valueof management costs foregone. Our results also depend upon how management costschange over time. Under modest cost increases and relatively high erosion rates,beach nourislunent is optimal. However, if costs rise dramatically, shoreline retreatis preferable over beach nourishment.
We interpret our results as indicating that there arc good economic reasons forphasing out the current strategy for managing coastal erosion at Tybee Island. Ourresults also indicate that a retreat strategy should not be rejected out of hand becauseof the potential magnitude of losses to property owners. Assuming that the hedonicprice function remains stable, we find that the countervailing effects of widerbeaches and increasing proximity to the shoreline offset a large portion of the property losses. On the other hand, the value associated with these characteristics maychange. Also, an abrupt change in management strategy could shock the propertymarket, inducing larger welfare effects. Understanding the relationship betweencoastal management, recreational and property benefits, and the housing market iscritical.
\Ve would also like to see the results of similar analyses applied to differentcoastlines. Tybee is a somewhat typical East Coast barrier island, consisting of geological formations similar to that of other islands in the southeast and mid-Atlantic,and exposed to similar weather events (Clayton et al. 1992). The bathymetry andgeographic setting of the Georgia coast, however, partially shelter it frolll the fullbrunt of hurricane and tropical storm forces. As such, erosive forces, and thus thecosts associated with beach management, could be higher in other areas. Moreover,costs and benefits will be proportional to the levels of development and visitation ona given barrier island. Our analytical approach could be instructive in making deci-

122 Landry, Keeler, and Kriesel
sions regarding beach and coastal management, but our specific results are probablynot representative of the eastern U.S. in general.
This analysis has focused only on efficiency and not on the distributional consequences of the management alternatives. Retreat, in particular, would placesignificant burdens on a small, concentrated group of users. Our research indicatesthat exploring avenues of full or partial compensation, if that is what is required tomake a transition to a policy of retreat, is worth the effort. Investigation of govcrnIll.cnt-sponsored erosion insurance and other financing mechanisms could be arewarding area of future research.
References
Bartik, T.J. 1988. Measuring the Benefits of Amenity Improvements in HedonicPriec Models. Lalld Ecollomics 64(2): 172-83.
Bell, F.W., and V.R. Lceworthy. 1990. Recreational Demand by Tourists for Saltwatcr Bcach Duys. Journal of Environmental Economics and Alanagement18: 189-205.
Clayton, T.D., L.A. Taylor, Jr., W.J.Cleary, P.E. Hosier, P.H.F. Graber, W.J. Neal,and a.H. Pilkcy, Sr. 1992. Lh,ing with the Georgia Shore. Durham, NC: DukcUniversity Press.
Delany, J.W. 1994. Tybee Islalld Beach Erosioll COlltrol Praject: Seclioll 934 RefJvaluation Report. Suvannah District, GA: United Statcs Army Corps ofEngineers.
Dillman, D.A. 1978. Mail alld Telepholle SlIrvey: The Total Desigll Method. NewYork, NY: John Wiley & Sons.
Edwards, S.F., and F.J. Gable. 1991. Estimating the Valtl~ of Beach Rccreation fronlProperty Values: An Exploration with Comparisons to Nourishment Costs.Oceall alld Shorelille Mallagemellt 15:37-55.
Godley, M. 1958. Historic Tybee Island. Savannah Beach, GA: The Savannah BcachChamber of Commerce.
Hanncman, W.M. 1984. \Vclfnre Evaluations in Contingent Valuation Experimentswith Discrete Responses. American Journal of Agricultural Economics66(3):332-41.
Kricsel, \V., A. Randall, an9 F. Lichtkoppler. 1993. Estimating the Benefits ofSllorcErosion Protection in Ohio's Lake Erie HOllsing Market. Water Resources JourlIal 29(4):795-80 l.
Kyper, T.N., and R.M. Sorenson. 1985. The Impacl of Selected Sea Level Rise See-'narios on the Beach and Coastal Structures at Sca Bright, N.J. Coastal Zone '85(2):2645-61.
Leatherman, S.P. 1988. Barrier Island Handbook. Coastal Publication Series, Laboratory for Coastal Research. College Park, MD: University of Maryland.
Parsons, G., and M. Powell. 1997. The Cost of Beach Retreat: A Hedonic PriceAnalysis of Delaware Beaches - unpublished manuscript. Newark, DE: Collegeof Marine Studies, University of Delaware.
Pilkey, Jr., O.H. 1995. The Beaches Are MOVing: The Drowning ofAmerica's Shoreline. Video Documcntary, Chapel Hill, NC: Environmental Media Corporation.
_. 1999. MIMED. Room 200A - GGS Building, University of Georgia - January19, Athens, GA.
Pilkey, Jr., O.H., and K.L. Dixon. 1996. The COIPS and the Shore. Washington,D.C.: Island Press.
Pompe, 1.J., and l.R. Rinehart. 19956. Beach Quality and the Enhancement of Rec-

Evaluation ofBeach Erosion Management Alternatives 123
reational Properly Values. JOl/mal 'ifLeisl/re Research 27(2): 143-54.. 1995b. The Value of Beach Nourishment to Property Owners: Storm Damage
- Rednetion Benefits. JOl/mal ojRegiol/al Stl/dies 25(3):271-86.Pye, W.B. 1998. Personal inlerview with Superinlendenl of Public Works, Tybee Is
land, GA.Silberman, J., and M. Klock. 1988. The Recreational Benefits of Beach
Renourishment. Ocean and Shoreline Management II :73-90.
Appendix: Contingent Choice Survey of Beach Users (This versioncorresponds with Altel'llative 1.)
Please read this page first
Georgia's Tybee Island
is one of the state's 13 barrier islands, of which only Tybee, Sea, St. Simon'sund Jekyll Islands huve road access and have significant tourism.has been eroding at its north and south shore, but it has been guining sand atits central shore.has a total of2.9 miles of ocean front. Beginning in 1882, rock seawalls andgroins have been constructed in an effort to control erosion and protect buildings. More recently, beach replenishment has becn used to maintain the beach.t7 percent of the ocean front is currently covered with rocks and concrete.provides recreation for visitors and local residcnts, including sunbathing,walking, swimming, beach volleyball, etc.
Shore erosion is thc disappcarance of land into water. Some erosion is a natural consequence of the shifting nature of sand. Erosion is also caused by channel drcdgingand other human activities. When people try to prevent the loss of land to erosion,beach conditions usually change. Beaches become narrower and arc often borderedby manmade structures like rock or concrete seawalls, rock groins, and jetties.
On Tybee Isla-nd there are stretches of ocean that have experienced a buildup ofsand, and beachgoers arc generally pleased with the resulting wide sandy beach.Along other parts of the shore there has been serious erosion. On these stretches,visitors have experienced IHUroW low-tide beaches, the disappearance of the beachat high tide, and large rock and concrete structures next to or in the ocean.
Future beach conditions on the island depend on the management choices made inreaction to erosion. Your participation in this study will provide information on howpeople value beaches alld what erosion control strategies will be best for Tybee Is~
land.
Beach Erosion and Outdoor Recreation
In recent years many public facilities, including parks, have been financed by userfees instead of tax revenue. User fees can pay for maintenance and for improvements such as better beach conditions. At Tybee Island, parking meters currentlycharge from $0.50 to $l/hOUf, or you can use the city parking lots for $5.00/day, oryou can buy an annual sticker for $50.00 that lets you park at the meters or the lots.

124 Landry, Keeler, and Kriesel
At other beaches you have to pay morc, especially the state park beaches in Floridaand South Carolina, while other beaches fife free. The quality of these beaches alsovaries.
The amount that people arc willing to spend on parking fees (and other items likegasoline, food, etc.) in order to visit the beach is determined partly by the quality ofthe beach for recreation. We UfC interested in how beach width and erosion controlstructures affcct the way you value Tybee Island beaches for recreation.
In the following pages, we would like for you to consider a management scenariofor Tybee Island. Your evaluation will provide information which can help agenciesto bettcr manage our coastal public resources.
l. A. Over the lost year, how Illany days did you visit Tybee Island: _ daysB. How many of these days involved an overnight stay: _ days
2. Do you currently own a Tybee Island annual parking sticker? _ Ycs _ No.
3 Of course, there are other beaches that you can visit besides Tybee Island. Overthe last year, how many days did you visit other beaches? _ days
4. How much personal experience have you had with poor beach conditions thatwere erosionHfelatcd? (Circle one Humber)
Have neverseen it
2
Moderatelyaware of it
3 4
J have experiencedit many times
5
[Note: Beach pictures have not beenincluded in this abbreviated version of the survey.]
E"osion Management Techniques
The types of beach you can observe at Tybee Island are illustrated on the page atleft. All of these pictures were taken during high tide when all beaches me at theirnarrowest. The beach will appear wider during other times of the day.
Please read and evaluate each management situation carefully. In each situation, weask you to compare the outcomes of beach management altcrnatives. In short, beachmanagement can result in two outcomes: (a) outcomes that gencrate wide beaches,and (b) outcomes thnt generate narrow heaches.
\Vide heaches result from natural sand accumulation, or beach nourishment or a retreat policy. Bcach nourishment is where sand is pumped or trucked to artificiallywiden the beach. The resulting beach has more recreational potential and it providessome storm protection to oeean front buildings. tlowever, some critics argue that theborrowed sand may contain harmful substanceS, bad side effects might be sufferedat the borrow site and the nourished beach may erode back to its original state veryquickly.
Evaluation 0/Beach Erosion Management Alternatives 125
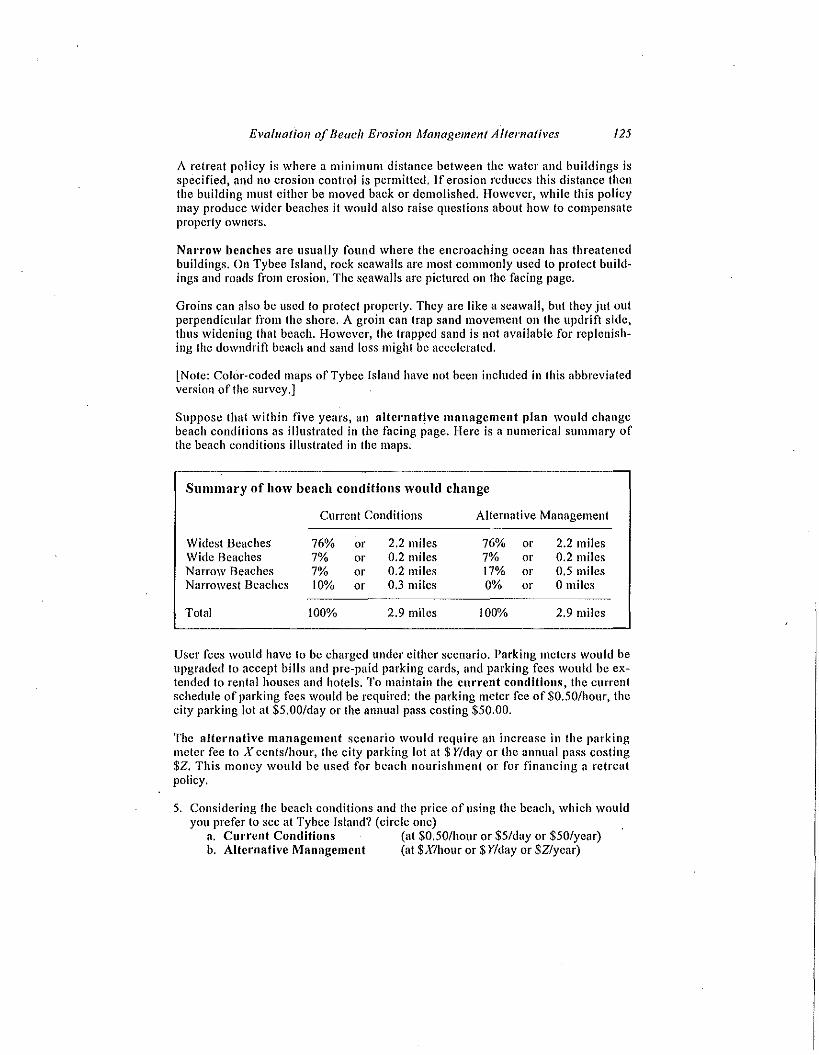
A retreat policy is where a rninimum distance between the water and buildings isspecified, and no erosion control is permitted. If erosion reduces this distancc thcnthe building must either be moved hack or dcmolished. However, while this policymay produce widcr beaches it would also raise questions about how to compensateproperty owncrs.
Nanow beaches are usually found ·where the encroaching ocean has threatenedbuildings. On Tybee Island, rock seawalls are most commonly used to protect buildRings and roads from erosion. The seawalls are pictured 011 the facing page.
Groins call also he used to protect property. They arc like a seawall, hut they jut outperpendicular from the shore. A groin can trap sand movement on the updrift side,thus widening that beach. However, the trapped sand is not available for rcplcnishing thc downdrift beach and sand loss might be accelerated.
[Note: ColorRcoded maps of Tybee Island have not been included in this abbreviatedversion of the survey.]
Suppose that within five years, an alternat!ve management plan would changebeach conditions as illustrated in the facing page. Here is a numerical summary ofthe beach conditions illustrated in the maps;
Summary of how beach conditions would change
Currcnt Conditions Altcrnative Management
\Vidcst Beaches 76% or 2.2 miles 76% or 2.2 milesWide Beaches 7% or 0.2 miles 7% or 0.2 milesNarrow Beaches 7% or 0.2 miles 17% or 0.5 milesNarrowcst Beaches 10% or 0.3 miles 0% or omiles
Total 100% 2.9 miles 100% 2.9 miles
Uscr fees would have to be charged under cither scenario. Parking meters would beupgraded to accept bills and pre-paid parking cards, and parking fees would be extcnded to rental houses and hotels. To maintain the cUlTent conditions, the currentschedule of parking fees would he required: the parking meter fcc of $0.50/hour, thecity parking lot at $5.00/day or the annual pass costing $50.00.
The altcrnative managemcnt scenario would require an increase in the parkingmeter fcc to X cents/hour, the city parking lot at $ Y/day or the annual pass costing$Z. This money would bc used for heach nourishment or for financing a retreatpolicy.
5. Considcring the beach conditions and the price of using the beach, which wouldyou prefer to see at Tyhee Island? (circle one)
a. Cu ....ent Conditions (at $0.50/hour or $5/day or $50/year)h. Alternative Management (at $X/hour or $ Ylday or $Zlycar)

126 Landry, Keeler, and Kriesel,6. In either scenario, residents and frequent users would most likely buy an annual pass
while occasional users would not. What option would you choose? (circle one)a. Parking meter feeb. City parking lotc. Annual pass
7. Suppose that the alternative management plan happens and beach conditions inthe righI-hand Illap result. AI the new fees of $Xlhour or $ Ylday or $Zlyear, howwould you change the number of days you visit Tybee in a one-year period?(circle one)
a. Visit Tybee the same number of days.b. Reduce the days you visit Tybee. How Illany fewer days? (fill in blank)c. Increase the days you visit Tybee. How many more days? (fill in blank)
8. \Vhat other beaches have you visited in the last 12 months? __~ _
9. If Tybee beach conditions and prices changed to those in the Alternative Man-agement Plan would you switch to (circle one):
a. Visiting other beaches more often.b. Visiting other beaches less often.c. Doing some other type of recreational activity.d. Not applicable.
10. Please name the beach you would probably visit instead of Tybee Island:
I t. How do you feci about the overall quality of the shore and beach conditions atTybee Island? (Circle one)
Pleased Satisfied
2
Neulral
3
Dissatisfied
4
Unhappy
5
12. Compared with Tybee Island, how do you feel aboul Ihe overall quality of theshore and beach conditions at the other beaches you visited in the last 12months? (Circle one)
I. Not as good as Tybee2. About the same as Tybee3. Beller than Tybee
The following questions ask for some important information about your household.Remember, your answers are completely confidential. This information is for statistical purposes only.
13. How many people usually visit Tybee with you? number of people.
14. What is your annual household income?Less than $15,000 $45,000 - $59,999
- $15,000 - $29,999 - $60,000 - $74,999=$30,000 - $44,999 - $75,000 - $89,999
_ $90,000 - $104,999_ $t05,000 - $119,999_ $120,000 or more

Evaluation of Beach Erosion Alunogement Alternatives J27
15. Did anyone in your household give up a chance to earn income to come on thistrip? _ yes _ no
16. How many children live in your household? _ children
17. Your age: _ years
18. Your gender: _ male _ female
19. What level of schooling do you have? (Circle one number)I ~ high school 2 ~ college 3 ~ advanced degree
The statements below summarize popular but divergent attitudes about coastal erosion policy. Please circle a number to indicate how you agree with each attitude.
Strongly StronglyAgree Agree Neutral Disagree Disagree
20. Buildings must be protccted 2 3 4 5from the ocean.
21. The government should not 2 3 4 5tell people what they can dowith their ocean front property.
22. There should be a ban on any 2 3 4 5more construction of erosionprotection structures.
23. Government is not obligated 2 3 4 5to help people who want tobuild near the shore.
24. It is more important to make 2 3 4 5beaches pleasing to beachgoers than to preserve coastalecosystems in their natural state.