an economic encyclopedia of sub-saharan africa (samples) 5 9 2016
TRANSCRIPT

Journey to 2030
oculus prime
An economic encyclopedia of Sub-Saharan Africa
Samples
Andrew L. Owiti
oculus prime Ltd
+254 (0) 708 377 699
+1 703 981 4201

AN ECONOMIC ENCYCLOPEDIA OF SUB-SAHARAN AFRICA
KENYA oculus prime

1. GDP2. Production Accounts3. Fiscal Position4. Revenues5. Expenditures6. Public Debt7. Public Finance8. Monetary Position9. Money, Banking & Finance10.Consumption & Saving11.Investments
AN ECONOMIC ENCYCLOPEDIA OF SUB-SAHARAN AFRICA
PART 1
KENYA oculus prime

Introduction
oculus prime

SAMPLE
Indigenous People
Trade with Arabia
Portuguese Influence
British Invasion
Independence
Multiparty Politics
Regional Hegemon?
Prehistory
100-1400
1500
1895
1963
1991
2015
• Some of the oldest hominids fossils are Kenyan.
• Kenya is settled by Bantu-speakers, Cushitic-speakers and Nilotic-speakers.
• Free trade and privatization are flourishing.• Some meaningful attempts to combat
rampant corruption are being made.
• Multiparty politics slowly begins to transform Kenyan social, political and economic life.
• In 2010 Kenya enacts a new constitution devolving more economic and political power to the various provinces.
• Kenya establishes itself as an important trading state. Exporting tea, coffee, pyrethrum and tourism.
• Ethnic tensions and single party rule hinder governance and economic development.
• Britain officially claims Kenya as its own and builds a railroad from Mombasa to Uganda using Indian laborers who stay in Kenya.
• Nairobi is established as Kenya’s capital.
• Portugal conquers Mombasa and builds Fort Jesus (a naval base) to protect trade routes in the Indian Ocean
• Trade with Oman in slaves, ivory, and tortoise-shells establishes several trading city-states on Kenya’s coast
Kenya’s long history highlighted by several key periods
oculus prime
SAMPLE
oculus prime
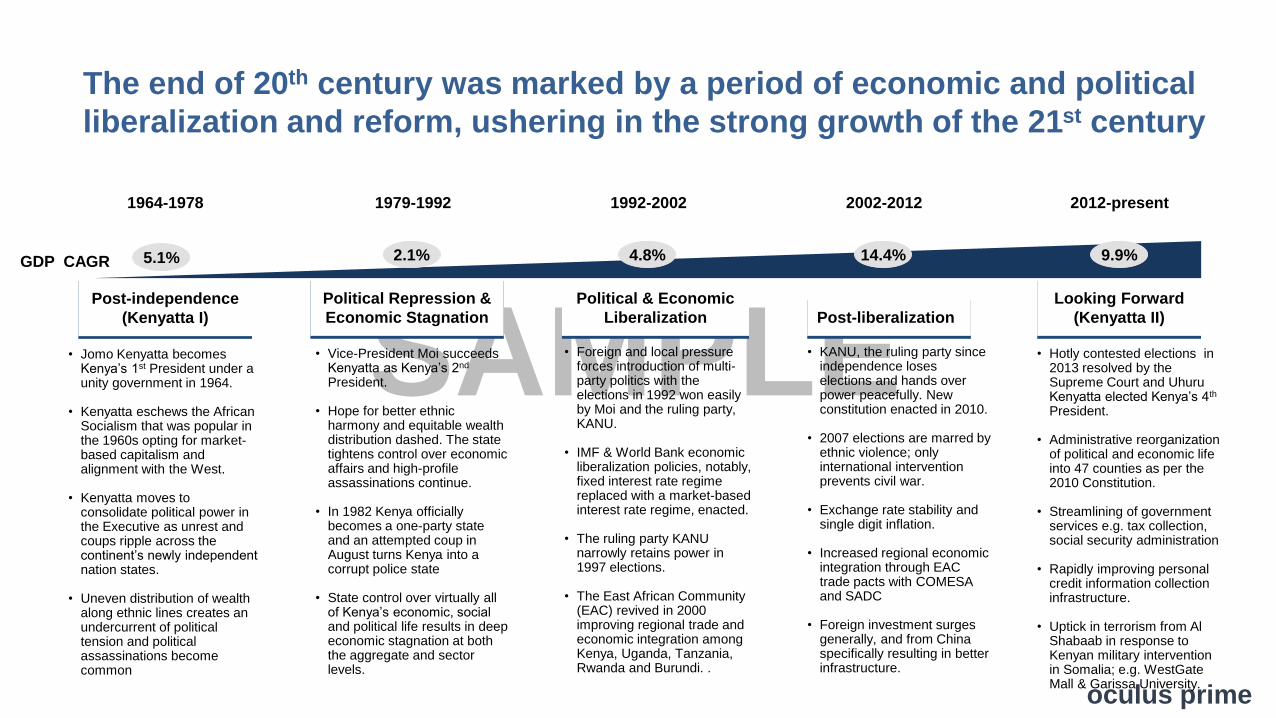
The end of 20th century was marked by a period of economic and political
liberalization and reform, ushering in the strong growth of the 21st century
• Foreign and local pressure forces introduction of multi-party politics with the elections in 1992 won easily by Moi and the ruling party, KANU.
• IMF & World Bank economic liberalization policies, notably, fixed interest rate regime replaced with a market-based interest rate regime, enacted.
• The ruling party KANU narrowly retains power in 1997 elections.
• The East African Community (EAC) revived in 2000 improving regional trade and economic integration among Kenya, Uganda, Tanzania, Rwanda and Burundi. .
Political & Economic
Liberalization
• Vice-President Moi succeeds Kenyatta as Kenya’s 2nd
President.
• Hope for better ethnic harmony and equitable wealth distribution dashed. The state tightens control over economic affairs and high-profile assassinations continue.
• In 1982 Kenya officially becomes a one-party state and an attempted coup in August turns Kenya into a corrupt police state
• State control over virtually all of Kenya’s economic, social and political life results in deep economic stagnation at both the aggregate and sector levels.
Political Repression &
Economic Stagnation
• Jomo Kenyatta becomes Kenya’s 1st President under a unity government in 1964.
• Kenyatta eschews the African Socialism that was popular in the 1960s opting for market-based capitalism and alignment with the West.
• Kenyatta moves to consolidate political power in the Executive as unrest and coups ripple across the continent’s newly independent nation states.
• Uneven distribution of wealth along ethnic lines creates an undercurrent of political tension and political assassinations become common
Post-independence
(Kenyatta I)
• KANU, the ruling party since independence loses elections and hands over power peacefully. New constitution enacted in 2010.
• 2007 elections are marred by ethnic violence; only international intervention prevents civil war.
• Exchange rate stability and single digit inflation.
• Increased regional economic integration through EAC trade pacts with COMESA and SADC
• Foreign investment surges generally, and from China specifically resulting in better infrastructure.
Post-liberalization
• Hotly contested elections in 2013 resolved by the Supreme Court and Uhuru Kenyatta elected Kenya’s 4th
President.
• Administrative reorganization of political and economic life into 47 counties as per the 2010 Constitution.
• Streamlining of government services e.g. tax collection, social security administration
• Rapidly improving personal credit information collection infrastructure.
• Uptick in terrorism from Al Shabaab in response to Kenyan military intervention in Somalia; e.g. WestGateMall & Garissa University.
Looking Forward
(Kenyatta II)
1964-1978 1979-1992 1992-2002 2002-2012 2012-present
9.9%4.8%2.1% 14.4%GDP CAGR 5.1%

GDP
oculus prime

SAMPLE
Kenya’s economy was flat in the 1980s but has been growing rapidly in the last
decade and is now the 8th biggest in Africa.
55
25
20
15
10
5
60
45
50
65
35
40
30
0
1985
+12%
2005
40.0
Nominal GDP (Billions, 2014 USD )
12.7
+6%
+11%
199519901980 2014
7.3
2010
+9% 60.9
8.6
2000
Africa GDP ranking 2014, (2014 USD)
12.6
Senegal 15.6
Botswana
Malawi 4.3
Billions, 2014 USD
Mauritius
27.1
Kenya 60.9
Ethiopia
15.8
568.5
Zambia
38.6
South Africa
Tanzania
54.8
Nigeria
Ghana
49.2
349.8
Kenya’s GDP, 1980 – 2014
World Rank
(2013)
26
33
78
83
85
90
102
120
121
131
Africa Rank
(2014)
1
2
8
9
10
13
17
21
22
29
40 157
oculus prime

SAMPLE
Nigeria & South Africa have controlled and continue to control over 50% of Sub-
Saharan Africa’s GDP while Kenya’s share has hovered between 2.7% and 3%
GDP (2014 USD) % Sub-Saharan Africa by Country, 1980 – 2014%
20.0%
46.8%
32.5%
32.5%
8.6%
25.9%
3.5%
0%
5%
10%
15%
20%
25%
30%
35%
40%
45%
50%
55%
60%
65%
70%
75%
80%
85%
90%
95%
100%
2.9%
0.7%
2.2%
2.8%
0.9%
200019851980 1990
3.1%
2005
0.9%
3.5%3.0%2.8%
2.7%
2010
2.8%3.0%
Senegal
Nigeria
Zambia
Tanzania
South Africa
Ghana
Ethiopia
Mauritius
Botswana
2014
Kenya
1.5%
Malawi
1995
Africa
Rank (54)
World
Rank (214)
9 83
17 102
21 120
13 90
10 85
2 33
1 26
22 121
29 131
40 157
8 78
oculus prime

SAMPLE
In 2013, Kenya’s top 10 counties generated nearly 60% of Kenya’s GDP, with the top
three (Nairobi, Kiambu and Nakuru) responsible for 1/3rd; the bottom 10 generated 4.5%
Median
Mean
Kenya’s GDP by County, 2013
Middle 27
25.5%
4.5%
37.8%
32.3%
Bottom 10
Top 3
Next 7
1 = Billions, USD
oculus prime
-24 -22 -20 -18 -16 -14 -12 -10 -8 -6 -4 -2 0 2 4 6 8 10 12 14 16 18 20 22 24 26
3.5
2.0
1.0
0.0
-1.0
-0.5
6.0
-1.5
5.0
7.0
6.5
5.5
4.5
4.0
3.0
2.5
1.5
0.5
Distance from the Median
Distance from Mean
Isiolo Lamu
Tharaka NithiSamburu
Elgeyo Marakwet
Nairobi
Marsabit
Kilifi
Narok
Machakos
Tana River
Kajiado
Nakuru
Kwale
NyamiraBaringo
Nyeri
Kiambu
West Pokot
Murang’a
Mombasa

SAMPLE
Relative to her peers, Kenya stands out as very high private consumption
economy “financed” by equally low national savingsNigeria Senegal South Africa Tanzania
Kenya SSA Average
70.9%66.1%
16.0%21.2%
100%
90%
80%
70%
60%
50%
10%
0%
30%
40%
20%
100
2011
100
2012 2013
100100
2010 2014
100
12.7% 13.1%
Taxes & Subsidies
Gross National Savings
Private Consumption
Zambia
77.4%78.5%
19.1%17.6%
100%
90%
80%
50%
60%
70%
30%
40%
10%
20%
0%
100100
201320112010
100 100 100
2012 2014
3.5%3.9%
61.2%59.0%
14.9%18.0%
40%
80%
50%
10%
90%
100%
60%
30%
20%
0%
70%
2014
100
20132012
100
2011
100
2010
100100
23.0% 23.9%
65.6%68.4%
21.9%21.2%
100%
60%
10%
80%
20%
50%
40%
70%
30%
0%
90%
2014
100100
20132010
100 100100
20122011
12.5%10.4%
53.3%50.9%
29.7%37.4%70%
20%
100%
60%
50%
90%
80%
40%
30%
10%
0%
2014
100
20132011
100
2010
100 100100
2012
11.7% 17.0%
82.1%78.0%
11.0%14.8%
100%
80%
70%
40%
30%
50%
20%
90%
60%
0%
10%
2013
100 100100
2011
100100
7.2%
2014
6.9%
2010 2012
71.9%71.5%
16.5%
100%
90%
80%
70%
60%
20%
50%
40%
0%
10%
30%
2014
100100
14.4%
2010
100
2011
100
20132012
100
13.7%12.0%
oculus prime

SAMPLE
Relative to her peers, Kenya stands out as very high private consumption
economy “financed” by equally high trade deficits
Botswana Ethiopia Ghana Kenya
Mauritius SSA Average
46.2%50.1%
16.5%19.8%
31.5%
38.0%
0%
20%
40%
60%
80%
100%
120% 100
2014
100
5.8%
20132012
100
2011
100100
-7.9%
2010
Net Exports
Government Spending
Private Consumption
Investments
Malawi
70.2%76.4%
24.4%
-16.3%-11.8%
0%
20%
40%
60%
80%
100%
120%
2014
100
201320122010
100
2011
100100 100
36.8%
11.0%9.3%
64.3%80.1%
18.0%
24.8%25.7%
-16.2%
0%
20%
40%
60%
80%
100%
120%
-7.1%
20142013
100
2011
100100
2012
100100
2010
10.4%
82.1%78.0%
-17.5%-12.9%
0%
20%
40%
60%
80%
100%
120% 100 100
14.0%
21.4%
20132010
100100
20.7%
201420122011
100
14.2%
23.1%
77.6%71.5%
17.4%23.3%22.4%18.0%
-9.1%
0%
20%
40%
60%
80%
100%
120%100100100100
2014201320122011
-17.9%
100
2010
73.9%73.6%
14.5%13.9%
-11.3%-13.3%-11.2%
0%
20%
40%
60%
80%
100%
120% 100
2011
100
2010
23.7%
100
2013 2014
100100
22.9%
2012
71.9%71.5%
15.6%15.4%
23.1%23.8%
-10.6%-10.7%
0%
20%
40%
60%
80%
100%
120%
2014
100100
2010 2013
100
20122011
100 100
oculus prime

SAMPLE -20%
0%
20%
40%
60%
80%
100%
2014
100 100100
19901970
Unlike many of her peers, Kenya’s economic structure has not experienced massive
shocks or substantial changes in the last 44 years!
Construction
Manufacturing
Taxes less Subsidies
Agriculture
Other Activities
Trade & Accommodation
Mining & Utilities
Transport & Communication
-20%
0%
20%
40%
60%
80%
100%
2014
100
1990
100
1970
100
-20%
0%
20%
40%
60%
80%
100%
1970 1990 2014
100 100100
80%
20%
100%
40%
60%
0%
2014
100 100100
1970 1990
Botswana Ethiopia Ghana Kenya
-20%
0%
20%
40%
60%
80%
100%100
1990
100100
20141970
60%
80%
20%
100%
0%
40%
1970
100
1990 2014
100100100%
40%
0%
60%
80%
20%
20141970
100 100
1990
100
Malawi Mauritius Sub-Saharan Africa
oculus prime

SAMPLE
Access to credit is notoriously tight in Kenya, but it is especially bad for agriculture
and growth of credit to agriculture significantly lags most sectors
Kenya’s Sector Value Added vs. Credit to Sector, 2014
-7.2
12.6
13.6
15.8
19.3
20.5
20.6
21.3
25.3
Mining & Utilities
Manufacturing
Total Economy
Transport & Comm.
Credit to Sector Growth, 2010 - 2014
CAGR 2010-2014
Government
Agriculture
Other Activities
Trade & Accomm.
Construction
Growth of Credit to Sectors, 2010 – 2014
CAGR 2000-2014
3 = Credit to Sector (Billions, USD)
0
10
20
30
40
50
60
70
80
90
100
110
120
108 1312 173 18161514119742 6510
Credit % Value Added
Value Added (Billions, USD)
Mining & Utilities
Manufacturing
Agriculture
Other Activities
Transporation & Communication
Government
Trade & Accommodation
Construction
oculus prime

SAMPLE313
520
376
3,169
5,358
3,726
2014
25
52
20132012
4,261
2010
-133
57
437
420
279
-124
537
42
58
42
444
61
66
69
90
1,464
28
478
470
252
252
1,251
508
70
340
191
1,114
432
68
-91
18643
32
381
57
371
55
359
240
48
21
213
343
39
229
378
29 24
94
86
21750
-112
980
342
46
-72
17450
213177
334
143
69
199
47
33
243
50
35
266 68
62
263
139
66
68
300
159
50 61
438
301
357 165
787
1927
26
260
37 75
97
209
4,731
2011
37
Kenya’s Gross Domestic Product by Activity, 2010 - 2014
Manufacturing
FSIM
Finance & Insurance
Transport & Storage
Construction
Taxes less Subsidies
Public Administration & Defence
Real Estate
Other Services
Private Households with Employed Persons
Wholesale & Retail Trade
Information & Communicaton
Health & Social Work
Education
Administrative & Support Services
Accomodation & Food Service
Electricuty & Water Supply
Agriculture & Forestry
Mining & Quarrying
Professional, Scientific & Techincal Activities
Billions, 2014 Ksh
oculus prime

SAMPLE
In short, Kenya is a slightly above mid-sized sub-saharan economy
growing about as fast as her peers
Size vs. Growth, 2000 - 2014
100= Billions, 2014 USD
oculus prime
340330 550 58032030028026025090807060
8
0 40
22
13
21
17
15
600
20
19
18
14
0
590
11
10
16
12
9
7
6
100 530520510 56029010 5020 54031027030 570500
2014 GDP (Billions, 2014 USD)
SSA Average
CAGR 2000 -2014
Botswana
Ethiopia
Nigeria
Senegal
Zambia
South Africa
Africa 11
Tanzania
Malawi
Kenya
Mauritius
Ghana
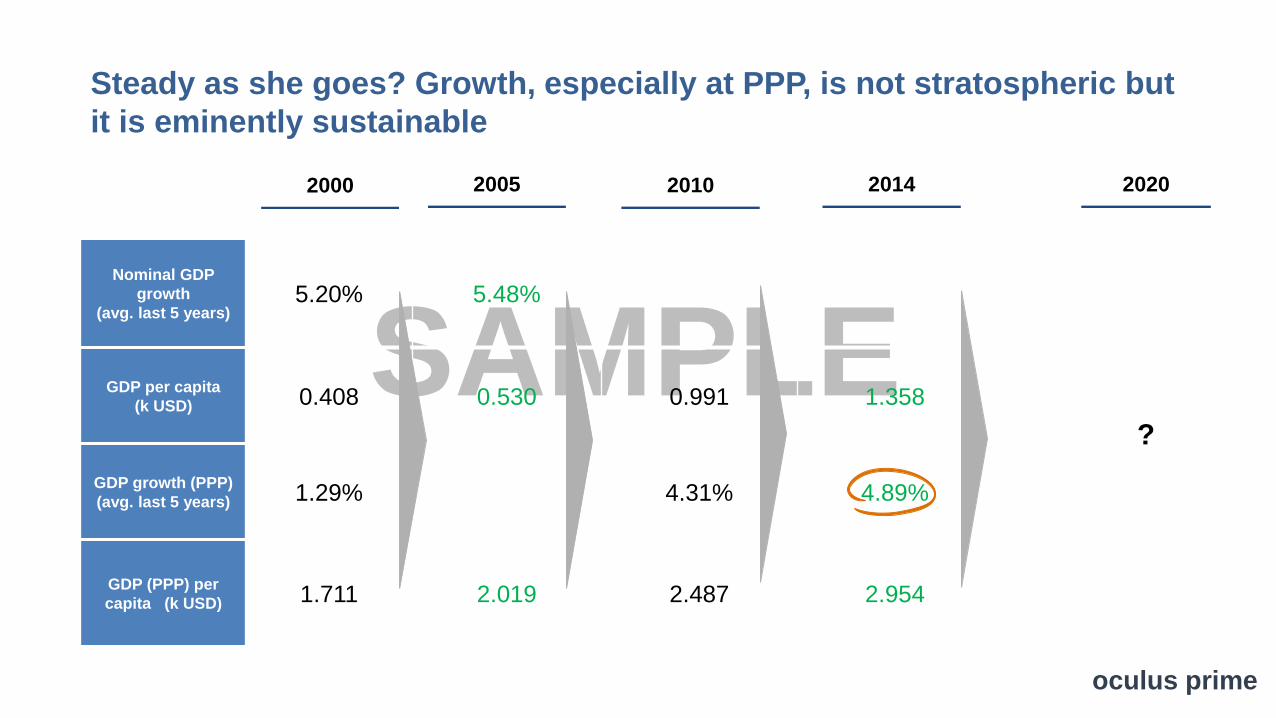
SAMPLENominal GDP
growth
(avg. last 5 years)5.20% 5.48% 13.97% 7.69%
GDP per capita
(k USD) 0.408 0.530 0.991 1.358
GDP growth (PPP)
(avg. last 5 years) 1.29% 3.40% 4.31% 4.89%
GDP (PPP) per
capita (k USD) 1.711 2.019 2.487 2.954
Steady as she goes? Growth, especially at PPP, is not stratospheric but
it is eminently sustainable
2000 2020
?
2005 2010 2014
oculus prime

SAMPLE
But there’s a PPP problem; Under PPP, Kenya’s ranking falls both in the aggregate and on
a per capita basis suggesting Kenya is relatively more expensive than her peer countries
GDP per capita vs. GDP per capita at PPPGDP vs. GDP at PPP
PPP BeneficiariesPPP Beneficiaries
0
5
10
15
20
25
30
35
40
45
50
55
0 5 10 15 20 25 30 35 40 45 50 55
Per capita GDP at PPP Rank
South Africa
Nigeria
Per capita GDP Rank
Tanzania
Zambia
Senegal
Malawi
Mauritius
Botswana
Ethiopia
Ghana
Kenya
Ranking Parity
Ranking Parity
0
5
10
15
20
25
30
35
40
45
0 5 10 15 20 25 30 35 40 45
GDP Rank
Ghana
Ethiopia
Mauritius
Nigeria
Kenya Tanzania
Zambia
South Africa
Senegal
Malawi
Botswana
GDP at PPP Rank
oculus prime
• Nominal GDP Rank: 8
• GDP at PPP Rank: 9
• Nominal Per Capita GDP Rank: 25
• Per Capita GDP at PPP Rank: 26

Fiscal Position
oculus prime
SAMPLE
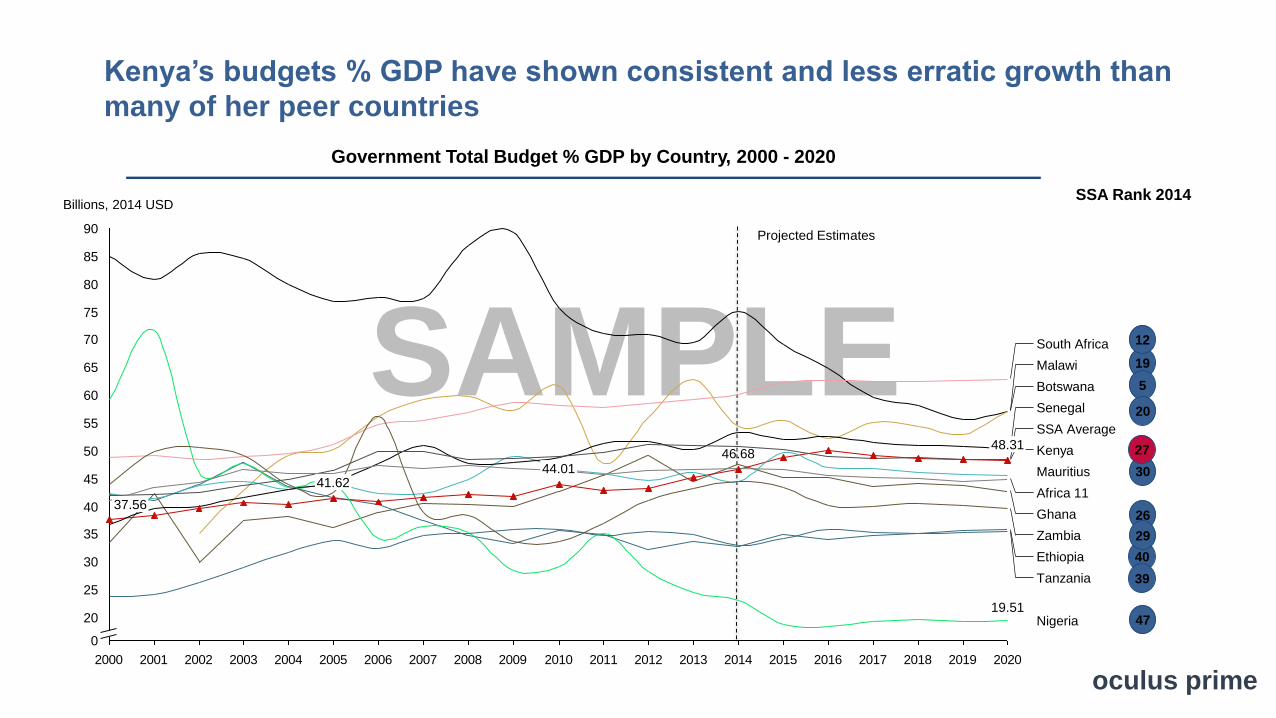
Kenya’s budgets % GDP have shown consistent and less erratic growth than
many of her peer countries
Government Total Budget % GDP by Country, 2000 - 2020
Billions, 2014 USDSSA Rank 2014
40
30
19
26
39
12
29
27
Projected Estimates
5
20
47
2000 2001 2002 2003 2004 2005 2006 2007 2008 2009 2010 2011 2012 2013 2014 2015 2016 2017 2018 2019 2020
85
60
40
65
25
0
30
45
90
20
80
50
35
75
70
55
44.0146.68
41.62
37.56
48.31
Nigeria
Tanzania
Mauritius
Malawi
Ghana
Botswana
Africa 11
19.51
Zambia
Kenya
Ethiopia
SSA Average
South Africa
Senegal
oculus prime

SAMPLE60
75
70
35
25
50
5
10
15
20
0
30
40
55
45
85
65
80
100
95
90
2000
18.9
20.0
-0.3%
2020
22.2
1990
48.3
26.1
20151985
24.221.6
2010
19.8
46.7
2005
41.6
27.0
44.0
18.5
39.2
17.5
20.9
1980
21.7
37.619.7
46.0
23.1
41.6
23.3
22.8
% GDP
1995
37.6
18.616.7
Kenya’s budget % GDP in relation to GDP
Kenya’s Budget & GDP, 1982 - 2020
Expenditure
Revenue
GDP
oculus prime
SAMPLE
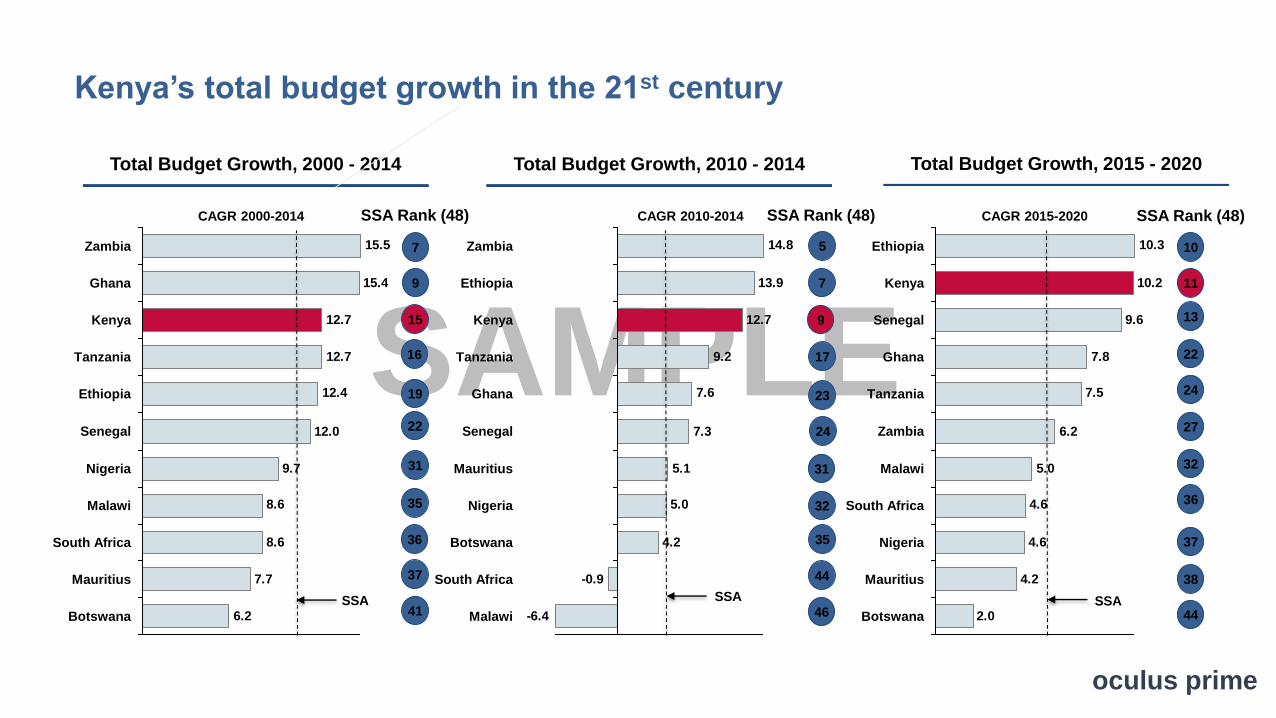
2.0
4.2
4.6
4.6
5.0
6.2
7.5
7.8
9.6
10.2
10.3Ethiopia
Kenya
Senegal
CAGR 2015-2020
Botswana
Mauritius
Nigeria
South Africa
Tanzania
Ghana
Zambia
Malawi
-6.4
-0.9
4.2
5.0
5.1
7.3
7.6
9.2
12.7
13.9
14.8
Malawi
Senegal
South Africa
Botswana
Tanzania
Nigeria
Kenya
Mauritius
Zambia
Ethiopia
CAGR 2010-2014
Ghana
6.2
7.7
8.6
8.6
9.7
12.0
12.4
12.7
12.7
15.4
15.5
Senegal
Tanzania
Kenya
South Africa
Malawi
Botswana
Nigeria
CAGR 2000-2014
Mauritius
Ethiopia
Ghana
Zambia
Kenya’s total budget growth in the 21st century
Total Budget Growth, 2000 - 2014
10
27
32
36
37
38
44
13
11
22
24
SSA Rank (48)
SSA
Total Budget Growth, 2010 - 2014 Total Budget Growth, 2015 - 2020
5
17
7
23
915
35
31
36
22
37
41
19
16
9
7
24
44
46
35
32
31
SSA Rank (48)SSA Rank (48)
SSA SSA
oculus prime

SAMPLE
Deficits have been constant since 1982 but the deficit cycle that began in 2005 is less worrisome
than that of the 1980s and early 1990s because GDP has been rising in the 21st century
Kenya’s Budget Surplus/Deficit %GDP, 1982 - 2020
SSA Average
Kenya
Africa 11
+12.7%
-3.9
-7.2
-4.4
-1.5
-0.2
-15
-10
-5
0
5
2000
-13.7%
% GDP
20202010 201520051995199019851980
-4.3
-8.9
oculus prime

SAMPLE
1.41.21.00.60.20.0 0.4
10
17
12
4
2
7
9
9.08.8
6
0
8.6
8
5
1
8.4
3
12.28.28.07.87.67.4
11
7.27.06.6 6.83.41.6 5.00.8 4.03.2 3.8 5.44.6 6.02.82.6 6.24.43.6 4.2 5.23.02.4 6.44.82.2 5.6 5.82.01.8
Cameroon
Burkina FasoBurundi
Central African Republic
Zambia
Gabon
Congo, Dem. Rep.
Ghana
Cote d’Ivoire
Guinea
Lesotho
Congo, Rep.
Liberia
Equatorial Guinea
Eritrea
Kenya
Mozambique
Madagascar
Revenues (Billions, USD)
Expenditures (Billions, USD)
Togo
Zimbabwe
Sudan
Uganda
Swaziland
Tanzania
Mauritania
MaliMalawi Mauritius
Chad
Niger
Rwanda
South Sudan
Seychelles
NamibiaSenegal
Benin
Botswana
Ethiopia
Only seven out of forty-seven countries in Sub-saharan Africa ran budget
surpluses in 2014
Revenues vs. Expenditures (w/o South Africa, Nigeria & Angola), 2014
oculus prime

SAMPLE
Kenya’s per capita GDP and per capita public debt are both mid-sized
Per capita GDP 2014 vs. Per capita Debt, 2014
= Per capita Public Debt (2014 USD)1,000
Per capita GDP = Per capita Public Debt
-500
0
500
1,000
1,500
2,000
2,500
3,000
3,500
4,000
4,500
5,000
5,500
6,000
6,500
0 5,500500 1,500 7,0002,500 9,5005,000 8,0004,000 10,0006,500 9,0006,000 11,00010,5008,5007,5002,000 4,5003,000 3,5001,000
2014 Per capita GDP (2014 USD)
2014 Per Capita Public Debt (2014 USD)
Nigeria
SSA AverageZambia
Tanzania
South Africa
Senegal Africa 11
Mauritius
Ethiopia
Malawi
Ghana
Botswana
Kenya
oculus prime

SAMPLE
Overall, Kenya is a high debt % GDP, mid-sized per capita debt and low credit
rating relative to her peer countries
Credit Rating, Debt % GDP & Per Capita Debt, 2014
1,000 Per Capita Total Debt (USD)
1,003
550
690
1,045
547347
136
1,193
2,973
5,281
995
0 5 10 15 20 25 30 35 40 45 50 55 60 65 70
45
35
5
75
40
30
0
55
65
60
50
80
70
Mauritius
Zambia
Africa 11
Nigeria
Botswana
KenyaEthiopia
SSA
South Africa
Ave. Credit Rating
Debt% GDP
Ghana
Senegal
oculus prime

SAMPLE
0
2
4
6
8
10
12
14
16
18
20
22
24
26
28
30
32
34
0 100 200 300 400 500 600 700 800 900 1,000 1,100 1,200 1,300 1,400 1,500 1,600 1,700 1,800 1,900 2,000 2,100 2,200
Kilifi
Baringo
Marsabit
Makueni
KwaleKisii
Kirinyaga
Kisumu
Kiambu
Kakamega
Homa Bay
Busia
Bungoma
Bomet
Mandera
Machakos
Laikipia
Kericho
Garissa
Isiolo
Elgeyo
Kitui
Embu
Tana River
SiayaNyandarua
KajiadoLamu
Fin & Econ Planning (Ksh, Millions)
Fin & Econ Planning (% Expenditure)
Pokot
Vihiga
Uasin GishuWajir
Turkana
Trans Nzoia
SamburuNyeri
Nyamira
NarokNakuru
Nairobi
Tharaka
Murang’a
Migori
Mombasa
Meru
Nandi
In 2014, 18 out of 47 Kenyan counties spent more than 10% of total expenditure on
finance and economic planning with nine spending more than 15%
Finance & Economic Planning Expenditures by County, 2014
oculus prime
Monetary Position
oculus prime

SAMPLE
1.5
3.0
4.4
5.2
5.2
5.6
5.9
8.0
8.1
8.4
9.3
Mauritius
Senegal
CAGR 2015-2020
Botswana
Kenya
South Africa
Ghana
Ethiopia
Malawi
Tanzania
Zambia
Nigeria
1.8
5.4
5.9
7.5
7.7
7.9
12.1
12.9
13.1
14.2
14.3
Kenya
Senegal
Mauritius
Botswana
CAGR 2000-2014
Nigeria
Ethiopia
Malawi
South Africa
Tanzania
Ghana
Zambia
3.6
7.1
8.6
9.3
9.5
11.2
17.6
18.8
19.4
25.5
35.2
Nigeria
Kenya
Tanzania
CAGR 1980-2014
Mauritius
South Africa
Botswana
Senegal
Ethiopia
Malawi
Ghana
Zambia
Kenya’s CPI growth has been average relative to her peers between 1980
and 2014, low in the 21st century and projected to stay low through 2020
CPI Growth, 1980 - 2014
6
16
20
7
26
31
47
4
21
8
12
SSA Rank (48)
SSA
CPI Growth, 2000 - 2014 CPI Growth, 2015 - 2020
7
10
8
11
19
13
20
8
22
18
24
34
10
9
4
2
17
9
45
28
29
18
SSA Rank (48)SSA Rank (48)
SSA SSA
USA = 3.0 USA = 2.2 USA = 2.1
oculus prime
SAMPLE
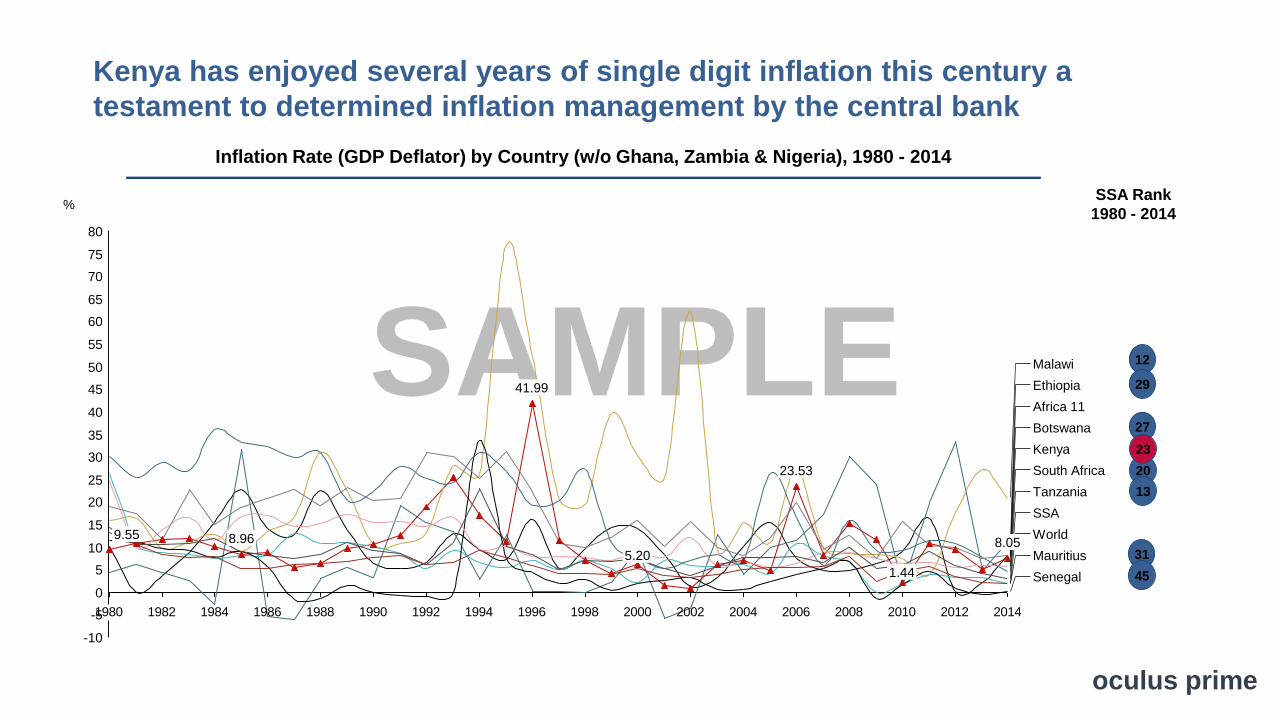
Kenya has enjoyed several years of single digit inflation this century a
testament to determined inflation management by the central bank
Inflation Rate (GDP Deflator) by Country (w/o Ghana, Zambia & Nigeria), 1980 - 2014
%SSA Rank
1980 - 2014
27
20
31
12
13
29
45
23
1980 1982 1984 1986 1988 1990 1992 1994 1996 1998 2000 2002 2004 2006 2008 2010 2012 2014
80
60
40
70
35
50
30
75
65
55
45
25
-5
5
20
-10
15
10
0
World
Africa 11
SSA
Tanzania
South Africa
Senegal
8.96
1.44
41.99
Mauritius
Malawi
23.53
5.208.05
Botswana
9.55
Kenya
Ethiopia
oculus prime

SAMPLE
In addition to being very stable (close to zero overall growth) Kenya’s inflation
rate and has been only moderately volatile (STDEV of 7.6)
Inflation Volatility vs. Inflation Rate Growth, 1980 - 2014
5 = Volatility (STD DEV Inflation, 1980-2014)
-15
-14
-13
-12
-11
-10
-9
-8
-7
-6
-5
-4
-3
-2
-1
0
1
2
3
4
0 1 2 3 4 5 6 7 8 9 10 11 12 13 14 15 16 17 18 19 20 21 22 23 24 25 26 27 28 29 30 31 32 33 34 35 36 37 38 39 40 41 42
Kenya
Malawi
Botswana
Ghana
Zambia
World
Sub-Saharan Africa
Mauritius
Tanzania
Africa 11
Ethiopia
Senegal
South Africa
Nigeria
Inflation Rate CAGR 1980 - 2014
Inflation Volatility (STDEV 1980 - 2014) oculus prime

SAMPLE
-28.4
323.6
50.0
-500
-400
-300
-200
-100
0
100
200
300
400
500
600
700
800
900
1,000
1,100
1,200
1,300
1,400
1985
-12.1
2000
7.5
19901980 1995 2005 2014
%
2010
Over the long term, Kenya’s Y-o-Y real interest rate can swing by up to
436.2% (3x STDEV) but has been much less volatile than most of her peers
Kenya’s Y-o-Y Real Interest Rate Change, 1981 - 2014 Volatility of Real Interest Rate by Country, 1981 - 2014
37.5
67.6
128.4
145.4
348.4
428.1
509.6
648.4
709.4
962.1
2,088.2
Senegal
Zambia
Tanzania
Kenya
Botswana
Nigeria
Mauritius
Malawi
STDEV Real Interest Rate Y-o-Y Change
Ethiopia
Ghana
South Africa 3
19
15
11
35
41
42
9
33
21
12
SSA Rank
SSA
Kenya
Africa 11
SSA
oculus prime

SAMPLE
8.95.3
0
5
10
15
20
25
30
35
40
45
50
55
60
%
+25.5%
+1.6%
-2.1%
1985 1990 1995 2010
12.1
3.6
20052000 2014
8.4
1980
Not only has Kenya’s T-bill rate dropped, it has also experienced several
years in the single digits this century a testament to monetary stability
Kenya’s T-bill Rate, 1980 - 2014 Average T-bill Rate by Country, 1980 - 2014
3.7
6.6
11.2
12.5
13.0
13.5
21.2
22.2
25.2
Ghana
Nigeria
Zambia
Kenya
Malawi
Tanzania
Senegal
Mauritius
South Africa
Botswana
%
Ethiopia
2
12
11
22
24
3
10
4
13
SSA Rank
SSA
Kenya
Africa 11
SSAFixed interest rate regime Market based interest rate regime
oculus prime

SAMPLE
-9.1
-0.8
2.6
6.1
7.1
7.7
10.3
10.4
11.8
15.2
16.9
Tanzania
Mauritius
Nigeria
Zambia
Botswana
Ethiopia
Ghana
Senegal
Kenya
Malawi
CAGR 2010-2013
South Africa
10.2
10.6
11.0
13.2
13.7
15.3
15.3
15.9
15.9
17.0
24.7
Zambia
South Africa
CAGR 2000-2010
Tanzania
Ghana
Malawi
Ethiopia
Botswana
Senegal
Kenya
Mauritius
Nigeria
5.9
6.7
9.7
11.4
11.9
14.1
14.3
14.4
16.3
16.9
24.4
CAGR 2000 - 2013
Tanzania
Malawi
Mauritius
Senegal
South Africa
Zambia
Botswana
Kenya
Ethiopia
Ghana
Nigeria
Kenya’s M3 growth in the 21st century has been middle-of-the-road
M3 Growth, 2000 - 2013
9
25
26
18
33
35
39
20
28
11
21
SSA Rank
SSA
M3 Growth, 2000 - 2010 M3 Growth, 2010 - 2013
6
15
13
20
2828
30
22
32
13
37
38
21
20
11
4
21
35
14
34
30
37
SSA Rank SSA Rank
SSA SSA
oculus prime
SAMPLE
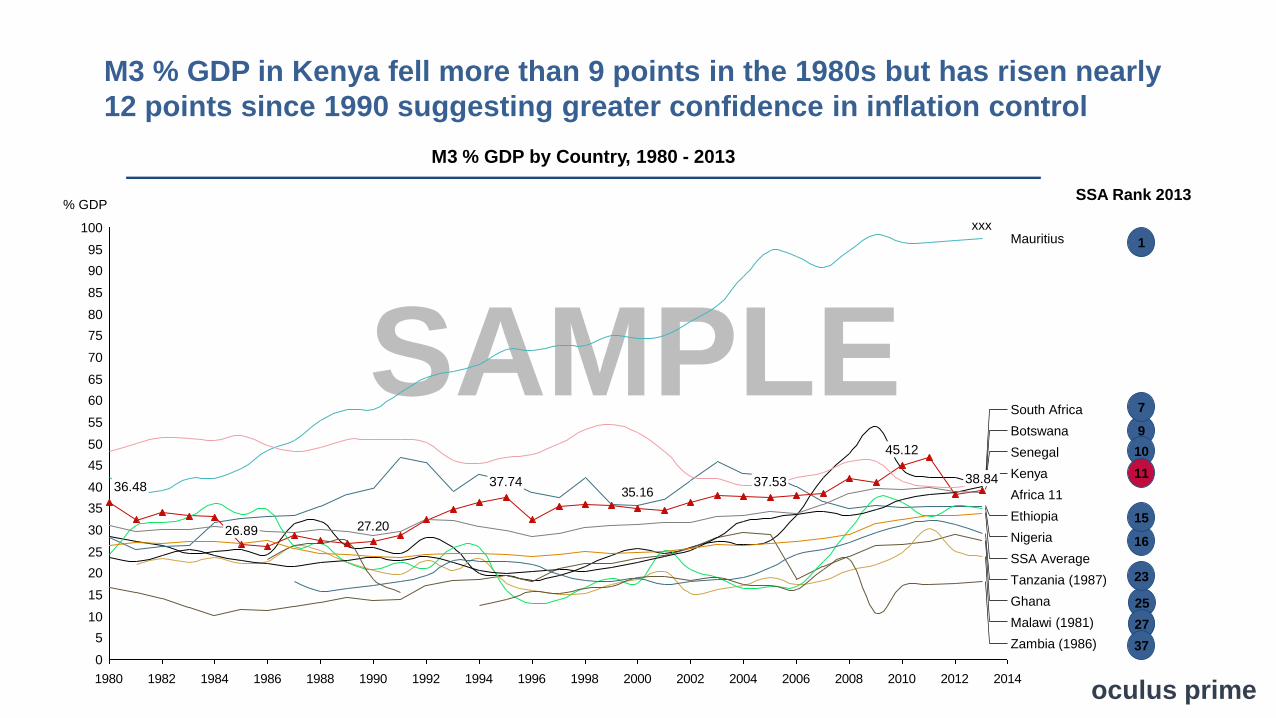
M3 % GDP in Kenya fell more than 9 points in the 1980s but has risen nearly
12 points since 1990 suggesting greater confidence in inflation control
M3 % GDP by Country, 1980 - 2013
% GDPSSA Rank 2013
25
9
16
15
27
1
23
7
10
37
11
35.16
27.20
1980 1982 1984 1986 1988 1990 1992 1994 1996 1998 2000 2002 2004 2006 2008 2010 2012 2014
80
20
0
25
95
60
15
70
85
65
45
30
75
55
35
90
40
50
10
5
100Mauritius
Tanzania (1987)
Ethiopia
Zambia (1986)
xxx
Africa 11
South Africa
SSA Average
Senegal45.12
37.53
Malawi (1981)
Nigeria
Ghana
Botswana
Kenya36.48
38.8437.74
26.89
oculus prime

SAMPLE
In the 21st century the KES has enjoyed the greatest stability among her peer
currencies except for Senegal’s CFA Franc which is pegged to the Euro
USD/LCU Growth in the 21st Century
5 = CAGR 2010 - 2014
-2
0
2
4
6
8
10
12
14
16
18
20
22
24
26
28
30
32
34
-4.0 -3.5 -3.0 -2.5 -2.0 -1.5 -1.0 -0.5 0.0 0.5 1.0 1.5 2.0 2.5 3.0 3.5 4.0 4.5 5.0 5.5 6.0 6.5 7.0 7.5 8.0 8.5 9.0 9.5 10.0 10.5 11.0
Ethiopia
Nigeria
Mauritius
Tanzania
South Africa
Malawi
Kenya
Senegal
Ghana
Botswana
CAGR 2010-2014
CAGR 2000-2010
SSA AverageAfrica 11
Zambia
oculus prime

SAMPLE
Kenya’s total reserves have increased nearly 9x in the 21st century
and at a much faster pace than GDP
GDP
Reserves
Kenya’s Total Reserves, 1980 - 2014
4.3
1.80.9
60.9
40.0
14.111.912.2
8.710.1
50
55
30
5
65
60
45
40
35
25
20
15
0
10
Billions, USD
1990 20052000
+17%+16%
xxx
1995 201019851980
+11%
2014
21.0
+11%
oculus prime

SAMPLE
Kenya’s share of SSA’s total reserves has increased an uneven 70% since 2000
Total Reserves % Sub-Saharan Africa, 1980 – 2014
%
0%
5%
10%
15%
20%
25%
30%
35%
40%
45%
50%
55%
60%
65%
70%
75%
80%
85%
90%
95%
100%100 100100 100 100100 100
2.1%
20051995
100100
1990
100 100100
1.5%
100100
2000
1.8%
100
2.4%
100100100100 100 100
Senegal
Ghana
Mauritius
Tanzania
Zambia
Nigeria
South Africa
Malawi
Kenya
Ethiopia
Botswana
100
1980
2.4%
5.0%
100 100100
4.2%
100100100
20101985
2.6%
100
2014
100100100 100 100
2014 SSA
Rank (48)
28
14
4
10
9
6
1
18
17
2
5
oculus prime
SAMPLE
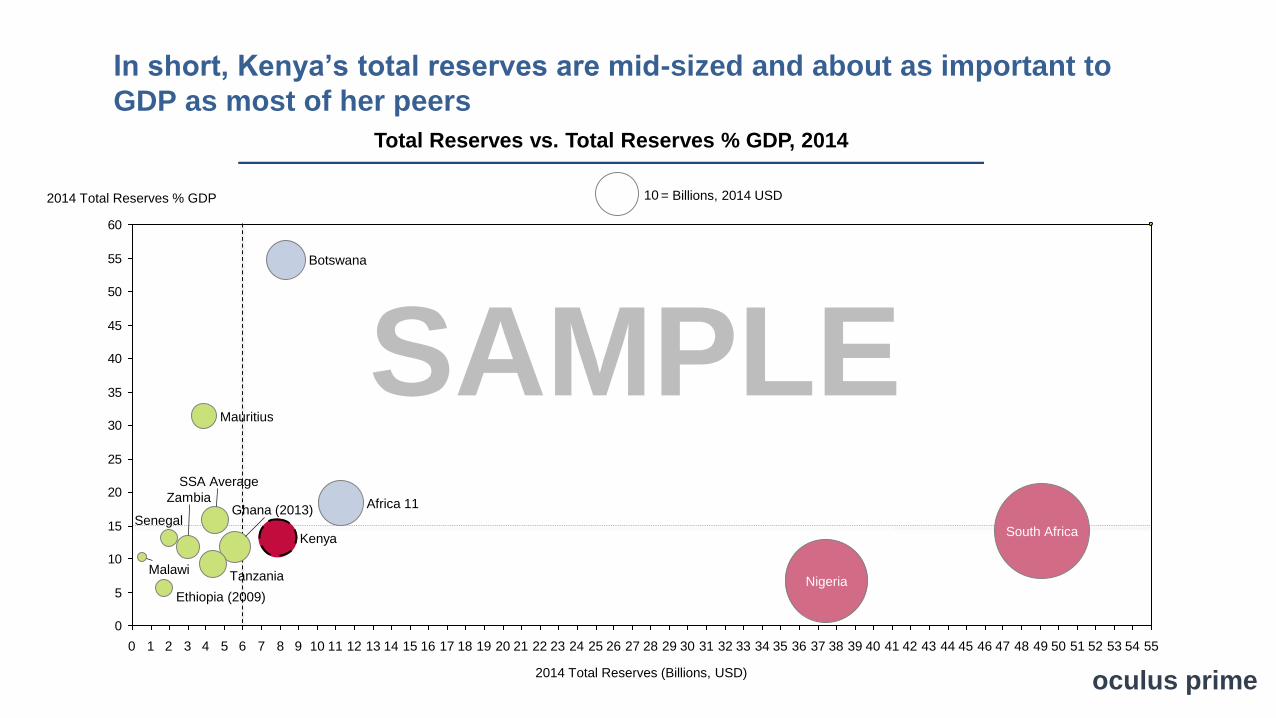
In short, Kenya’s total reserves are mid-sized and about as important to
GDP as most of her peers
Total Reserves vs. Total Reserves % GDP, 2014
= Billions, 2014 USD10
oculus prime
0
5
10
15
20
25
30
35
40
45
50
55
60
12 2928 331917141310 11543 2116150 27261 3792 1887 206 36 42343025242322 3935 4846 54504441 5240 49 53 55514745433231 38
SSA Average
Zambia Africa 11
Malawi
South AfricaKenya
Tanzania
Senegal
Ethiopia (2009)
Ghana (2013)
Nigeria
2014 Total Reserves % GDP
2014 Total Reserves (Billions, USD)
Botswana
Mauritius

SAMPLE
Kenya’s Forex Reserve position has strengthened considerably (by almost 50% in the
24 months between Jan 2013 and Dec 2014) and this strengthening is in cash and gold
Billions, Ksh
Forex Reserve Position, 2010 - 2014
Reserves of Central Govt
SDRs
Forex (Cash + Gold)
0
750
550
150
700
500
650
600
450
400
250
350
200
100
300
50
+46.5%
Jul-14
560
Apr-14 Oct-14
+24.5%
590
653
Aug-14 Nov-14
+12.8%
644
588
+36.2%
Jun-14 Dec-14Sep-14
564
-3.7%
May-14
574
Mar-14
563
Sep-13Jun-13 Nov-13May-13
561
Jan-14
535520
Oct-13 Feb-14
533563
529
Aug-13Jul-13
519
Dec-13
524519519
Apr-13
496
559
640
2010
313
Jan-13
463
Feb-13
701649
454
2012 Mar-132011
353
443
570 561557
481
532559
704
588
520
671
666
514 514 525
287
516
350
558583
514492530
451461 440478
oculus prime

SAMPLE
This decade, remittances to Kenya have grown at the 3rd fastest pace among
her peers
Remittances Growth in the 21st Century
25 = CAGR 2010 -2014
-10
0
10
20
30
40
50
60
70
80
90
100
110
-28 -18 34 40-40 -12-24 -16-22-34 -32 -14-30-38 -26 -20-36-42 22 46443630-4-8 -2 420-6 10-10 201816126 8 14 26 32 42382824 48
South Africa
Zambia (2003)
World
SSA Average
Africa 11
Tanzania (1995)
Botswana (2013)
NigeriaSenegal (2011)Mauritius (1994)
Ghana
Ethiopia (2012)
Malawi (1994)
CAGR 2010-2014
Kenya
CAGR 2000-2010 oculus prime

SAMPLE
In short, Kenya’s per capita remittances are mid-sized but have grown
slower than most of her peers this century
Per Capita Remittances vs. Per Capita Remittances Growth in the 21st Century
= 2014 USD25
-35
-30
-25
-20
-15
-10
-5
0
5
10
15
20
25
30
35
0 5 10 15 20 25 30 35 40 45 50 55 60 65 70 75 80 85 90 95 100 105 110 115 120 125 130
Botswana (2013)
Ghana
Ethiopia (2012)
Per Capita Remittances CAGR 2000 - 2014
2014 Per Capita Remittances (2014 USD)
Tanzania (1995)
Senegal (2011)KenyaSSA Average
Mauritius (1994)
South AfricaZambia (2003)
Africa 11
Nigeria
Malawi (1994)
oculus prime
SAMPLE
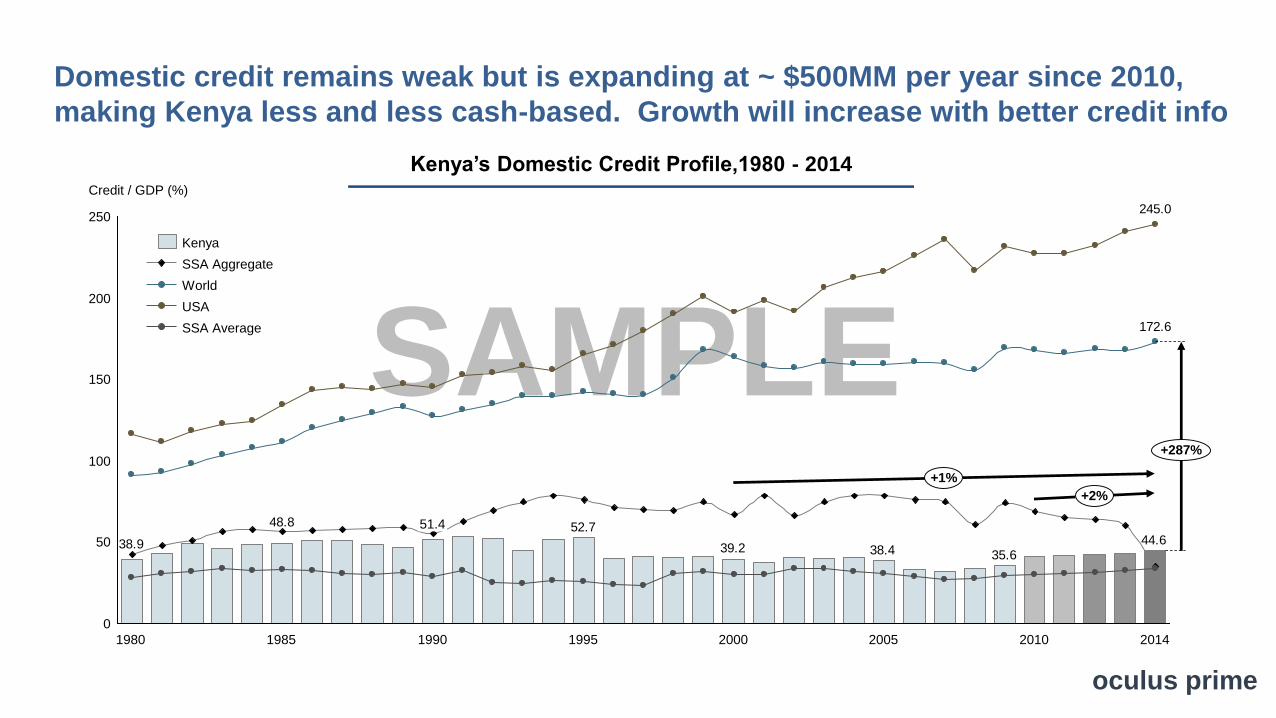
Domestic credit remains weak but is expanding at ~ $500MM per year since 2010,
making Kenya less and less cash-based. Growth will increase with better credit info
Kenya
SSA Average
USA
World
SSA Aggregate
Kenya’s Domestic Credit Profile,1980 - 2014
52.748.8
38.935.6
44.638.439.2
172.6
245.0
50
100
0
250
150
200
20141995
Credit / GDP (%)
2010
+287%
+1%
+2%
20052000199019851980
51.4
oculus prime

SAMPLE
Domestic Credit % GDP in Kenya relative to South Africa and Mauritius looks flat
Domestic Credit % GDP by Country, 1980 - 2014
% GDPSSA Rank 2014
28
10
23
14
31
1
27
2
12
41
7
44.5841.08
1980 1982 1984 1986 1988 1990 1992 1994 1996 1998 2000 2002 2004 2006 2008 2010 2012 2014
20
0
180
140
-20
120
100
80
160
60
40
200
-80
-40
-60
38.92 39.24
51.38
38.40
52.7448.81
Ghana (2013)
Ethiopia (’81 -’08)
SSA
Nigeria
Botswana
SSA Average
Africa 11
Zambia
Tanzania (1988)
Senegal
Mauritius
South Africa
Malawi
Kenya
oculus prime

SAMPLE
Relative to her peers, Kenya’s domestic credit % GDP has grown at a
medium pace both since 1980 and this century
Domestic Credit % GDP Growth 1980 - 2014
1 = CAGR 2000 -2014
-9
-8
-7
-6
-5
-4
-3
-2
-1
0
1
2
3
4
5
6
7
8
-2.8 -2.6 -2.4 -2.2 -2.0 -1.8 -1.6 -1.4 -1.2 -1.0 -0.8 -0.6 -0.4 -0.2 0.0 0.2 0.4 0.6 0.8 1.0 1.2 1.4 1.6 1.8 2.0 2.2 2.4 2.6 2.8
Africa 11
SSA Average
Tanzania (1988)
Zambia
USA
World
Mauritius
Nigeria
Senegal
Ethiopia (’81 -’08)
South Africa
Kenya
Ghana (2013)
Malawi
CAGR 2000 - 2014
CAGR 1980-2014 oculus prime

SAMPLE
Recent reforms have improved businesses in Kenya’s ability to evaluate credit
risk surpassing even the OECD
Credit Information vs. Legal Rights, 2015
-0.5
0.0
0.5
1.0
1.5
2.0
2.5
3.0
3.5
4.0
4.5
5.0
5.5
6.0
6.5
7.0
7.5
8.0
8.5
0 1 2 3 4 5 6 7 8 9 10 11 12
Malawi
Botswana
Kenya
Angola
Sub-Saharan Africa
Ghana
OECD high income
Ethiopia
Legal Rights Index (0-12)
Credit Information (0-8)
Rwanda
Tanzania
Mauritius
Kenya 2013
Senegal
Namibia
Zambia
South Africa
Nigeria
0
0
0
0
0
(0 - 8)
Senegal
Malawi
Tanzania
Ethiopia
SSA 2
Nigeria 6
Ghana
Botswana 6
South Africa
6
Angola
Mauritius
7
Namibia
7
7
Kenya 7
8Zambia
Rwanda 8
Kenya
Ghana 7
7
11Rwanda
Senegal
6
Mauritius 6
Zambia 7
Ethiopia
Sub-Saharan Africa
5
5
1
5
3
6
South Africa
(0 - 12)
5
Tanzania 5
Angola
Namibia
Malawi 5
Botswana
Nigeria
Credit Information Index, 2015 Legal Rights Index, 2015
oculus prime
SAMPLE
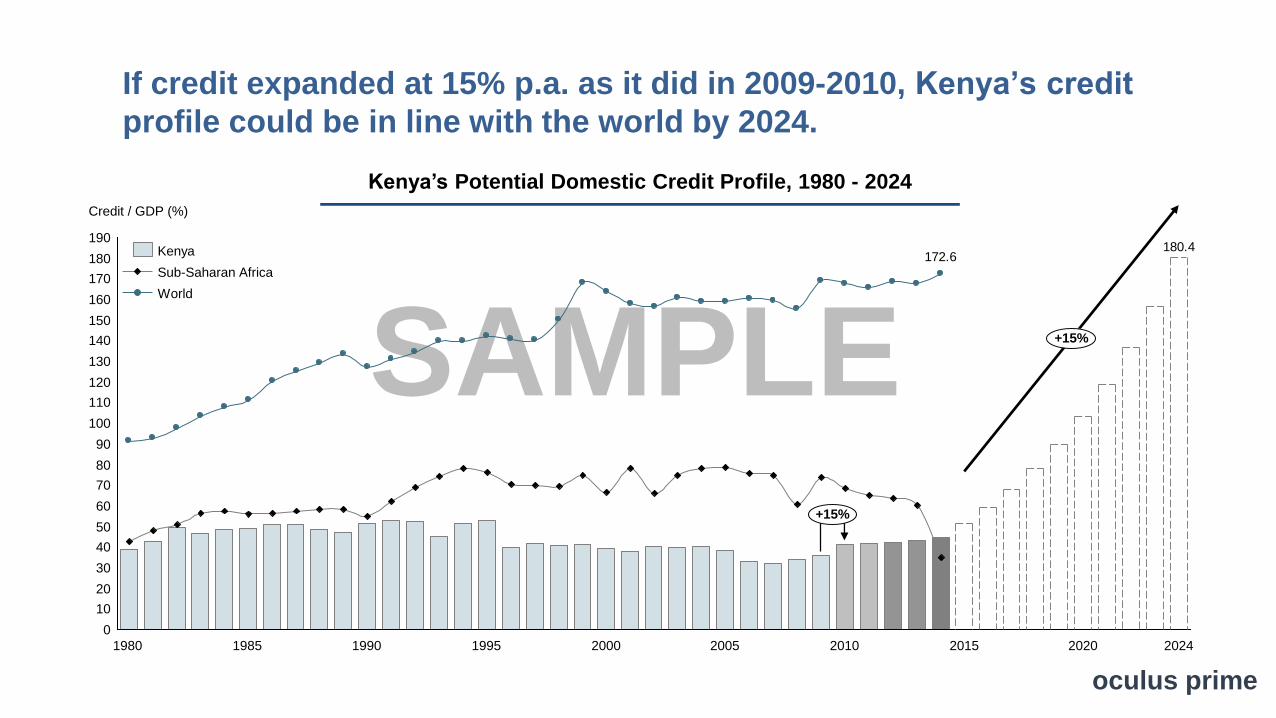
If credit expanded at 15% p.a. as it did in 2009-2010, Kenya’s credit
profile could be in line with the world by 2024.
World
Sub-Saharan Africa
Kenya
Kenya’s Potential Domestic Credit Profile, 1980 - 2024
180.4172.6
150
140
110
90
80
60
20
70
130
40
10
50
30
0
190
160
120
100
180
170
20102000 2024
+15%
+15%
1985 20151995 200519901980
Credit / GDP (%)
2020
oculus prime

SAMPLE
Kenya’s market cap has exploded in the 21st century but is dwarfed by the
scale at with South Africa operates
Market Cap by Country, 1990 - 2014
Billions, 2014 USD SSA Rank 2014
1
24.7
0
50
100
150
200
250
300
350
400
450
500
550
600
650
700
750
800
850
900
950
1990 1991 1992 1993 1994 1995 1996 1997 1998 1999 2000 2001 2002 2003 2004 2005 2006 2007 2008 2009 2010 2011 2012 2013 2014
Botswana (2012)
Kenya (2013)
7.2
Mauritius
Zambia (2012)
Senegal
Ghana (2013)
Malawi (2003-2012)
Nigeria
Tanzania (2012)
Ethiopia
South Africa
14.51.40.6 2.5
Africa 11
oculus prime

SAMPLE
Arguably, Kenya’s financial markets are best positioned for growth: mid-
sized market cap to GDP, and company size is also mid-sized
Market Capitalization, GDP, & Average Company Size Select African Countries, 2014
250MM, Ave Company Size
205 10510 25 4015 30 350 485 580
0
585
250
475
50
25085 49010065
200
55 956050 9045 480
300
495470807570 575
77
Cote D’Ivoire
160
693
405
Namibia
Mauritius
%GDP
186
138
Ghana
Africa 11132
800
Kenya
Zambia
South Africa
Nigeria
Uganda
3,053
GDP, Bln
200
Botswana
2,900
729
Morocco
132
Tanzania
212Malawi (2003-2012)
oculus prime

1. Broad Economic Structure2. Sectors3. Sector Value Added, Labor & Productivity4. Agriculture5. Manufacturing6. Construction7. Mining8. Utilities9. Transportation Services10.Business Services11.Government Services12.Personal Services13.Trade Services
AN ECONOMIC ENCYCLOPEDIA OF SUB-SAHARAN AFRICA
PART 2
KENYA oculus prime

SAMPLE
Anatomy of a Diversified and Balanced Economy?
Industry
20%
50%
Agriculture
30%
Services
20%24%
Government
30%
Personal
Transport
19%
7%Trade Business
Livestock & Dairy Temporary Crops
Horticulture
25%
Permanent Crops
7%
7%
xx
Cereals
29%
57%Manufacturing
5%
Construction
Mining
Utilities
10%
28%
oculus prime

Broad Economic Structure
oculus prime

SAMPLE11.1
3.3
18.4
4.63.6
3.3
0
5
10
15
20
13.7
20001995 2014
5.3
1.7
Billions, 2014 USD
18.0
+13.5%
7.0
+5.2%
20102005
3.6
1990
1.9
1980
1.7
1985
Kenya’s agricultural value added has been substantially higher than SSA since
1980 and after a blistering 13.5% CAGR from 2010 stood at $18.4B in 2014
Kenya’s Agricultural Value Added, 1980- 2014 Agricultural Value Added by Country, 2014
0.4
0.4
2.0
2.5
2.6
8.6
8.7
15.1
18.4
23.0
116.2
Billions, 2014 USD
Mauritius
Botswana
Zambia
South Africa
Senegal
Ghana
Malawi
Tanzania
Ethiopia
Nigeria
Kenya
1
8
7
22
24
36
37
2
4
21
5
SSA Rank
Sub Saharan Average
+9.3%
Africa 11
Kenya
SSA Average
oculus prime
SAMPLE
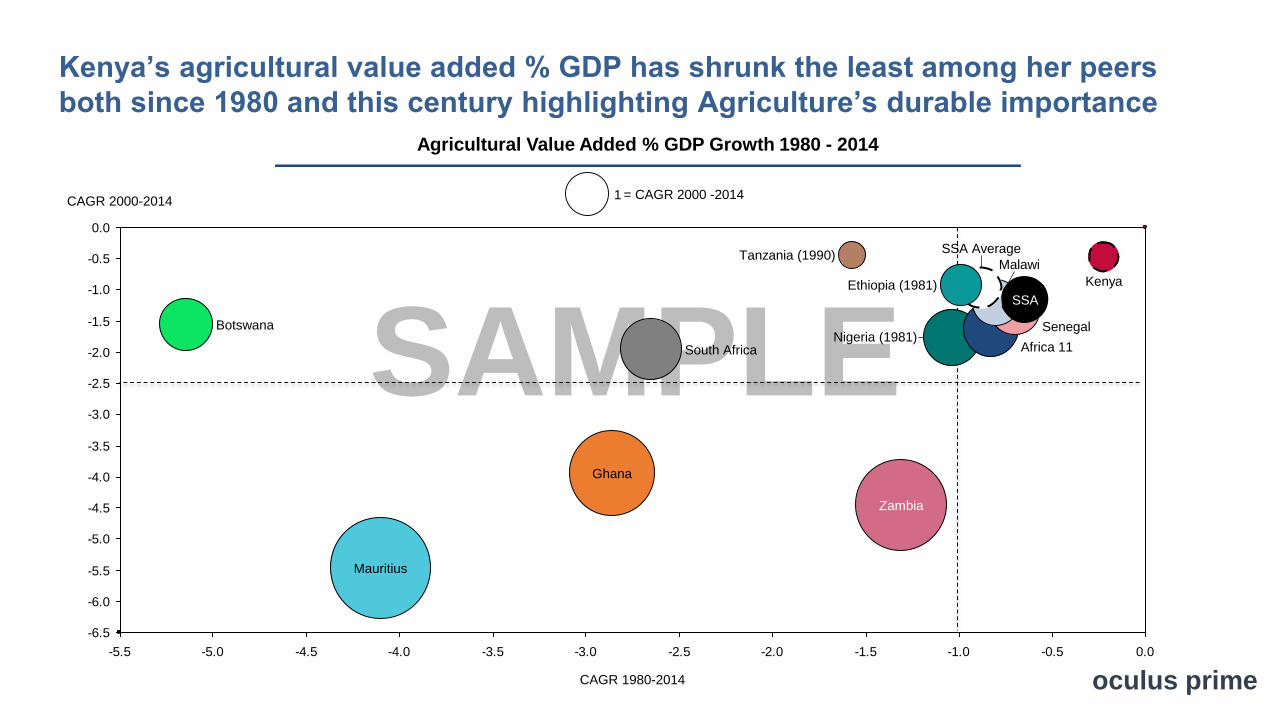
Kenya’s agricultural value added % GDP has shrunk the least among her peers
both since 1980 and this century highlighting Agriculture’s durable importance
Agricultural Value Added % GDP Growth 1980 - 2014
1 = CAGR 2000 -2014
-6.5
-6.0
-5.5
-5.0
-4.5
-4.0
-3.5
-3.0
-2.5
-2.0
-1.5
-1.0
-0.5
0.0
-5.5 -5.0 -4.5 -4.0 -3.5 -3.0 -2.5 -2.0 -1.5 -1.0 -0.5 0.0
South Africa
Senegal
SSA AverageTanzania (1990)
SSA
Zambia
Mauritius
KenyaEthiopia (1981)
Ghana
Nigeria (1981)Botswana
Malawi
Africa 11
CAGR 1980-2014
CAGR 2000-2014
oculus prime
SAMPLE
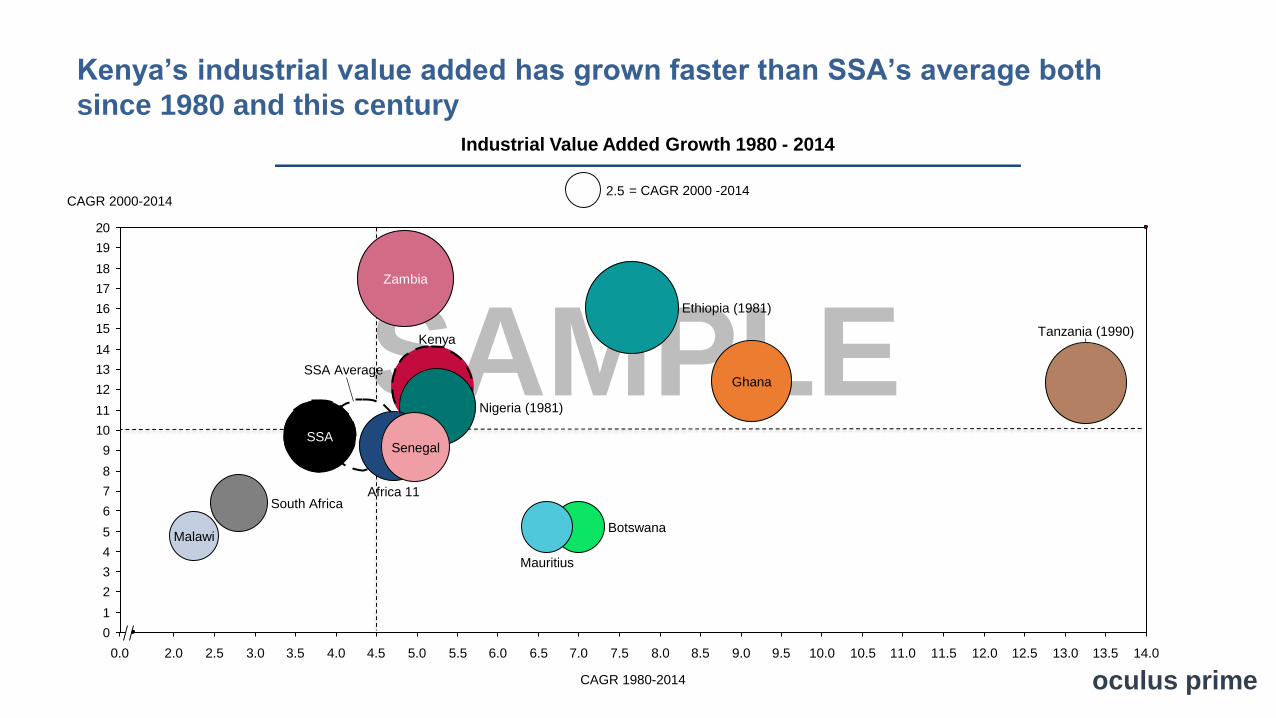
Kenya’s industrial value added has grown faster than SSA’s average both
since 1980 and this century
Industrial Value Added Growth 1980 - 2014
2.5 = CAGR 2000 -2014
0
1
2
3
4
5
6
7
8
9
10
11
12
13
14
15
16
17
18
19
20
6.54.5 8.0 14.012.5 13.0 13.510.510.0 12.07.5 11.09.59.08.5 11.54.03.52.5 3.0 7.06.05.55.02.00.0
South Africa
Mauritius
Botswana
Ghana
Ethiopia (1981)
Tanzania (1990)
Zambia
Africa 11
CAGR 1980-2014
SSA Average
CAGR 2000-2014
SSA
Kenya
Nigeria (1981)
Malawi
Senegal
oculus prime
SAMPLE
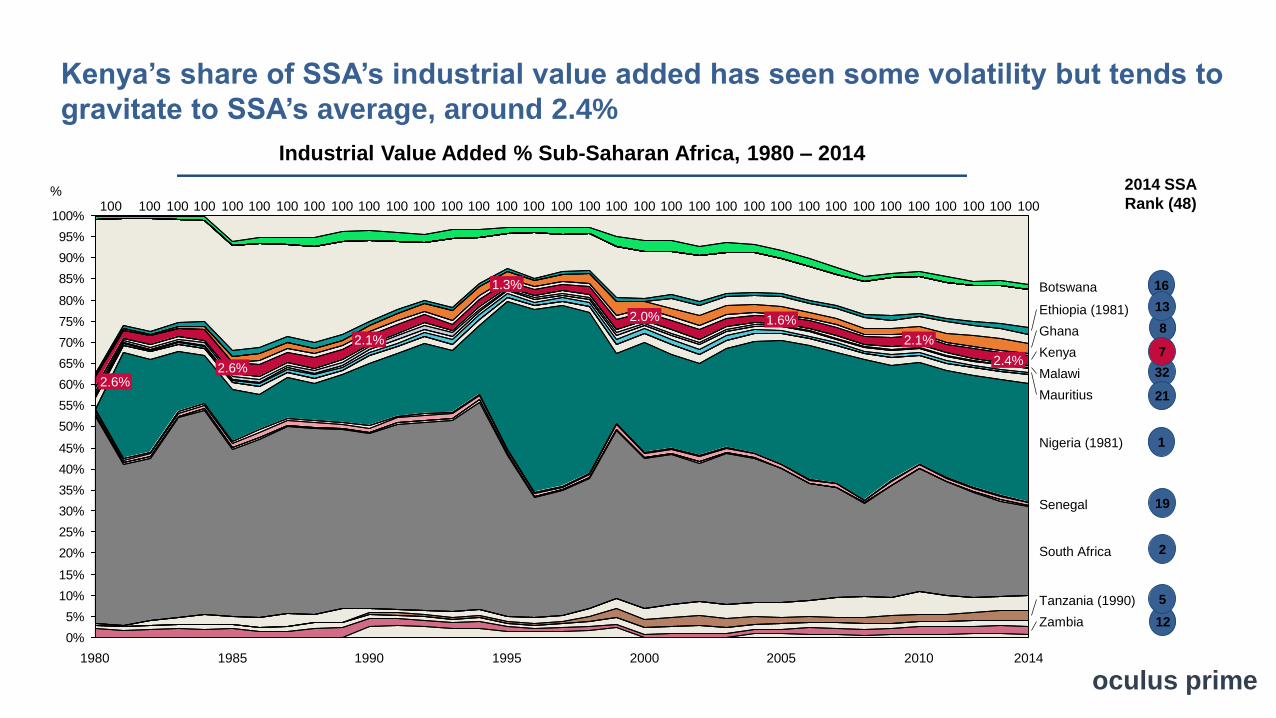
Kenya’s share of SSA’s industrial value added has seen some volatility but tends to
gravitate to SSA’s average, around 2.4%
Industrial Value Added % Sub-Saharan Africa, 1980 – 2014
%
0%
5%
10%
15%
20%
25%
30%
35%
40%
45%
50%
55%
60%
65%
70%
75%
80%
85%
90%
95%
100%100 100
Tanzania (1990)
South Africa
Ethiopia (1981)
Kenya
Zambia
Ghana
2014
Nigeria (1981)
Mauritius
Malawi
100100100 100100
2.1%
1990
100100100 100
2.1%
100
1.6%
100100 100100100100100 100
1.3%
100
2.0%
100
2000
100100
1995
100
20051980
100100100 100
1985
2.6%
100 100
2.6%
100
Senegal
100
Botswana
2.4%
2010
100
2014 SSA
Rank (48)
32
12
16
21
5
8
19
13
2
1
7
oculus prime

SAMPLE
In short, Kenya’s industrial value added is mid-sized and it plays a less significant
role in the economy than it does for most of her peers
Industrial Value Added vs. Industrial Value Added % GDP, 2014
25 = Billions, 2014 USD
0 5 10 15 20 25 30 35 40 45 50 55 60 65 70 75 80 85 90 95 100 105 110 115 120 125 130 135 140 145 150
40
25
20
15
35
30
0
Nigeria (1981)Africa 11
2014 Industrial VA % GDP
2014 Industrial VA (Billions, USD)
Kenya
Malawi
Botswana
Mauritius
Ethiopia (1981)
Ghana
Tanzania (1990)
South Africa
Senegal
Zambia
SSA Average
oculus prime
SAMPLE
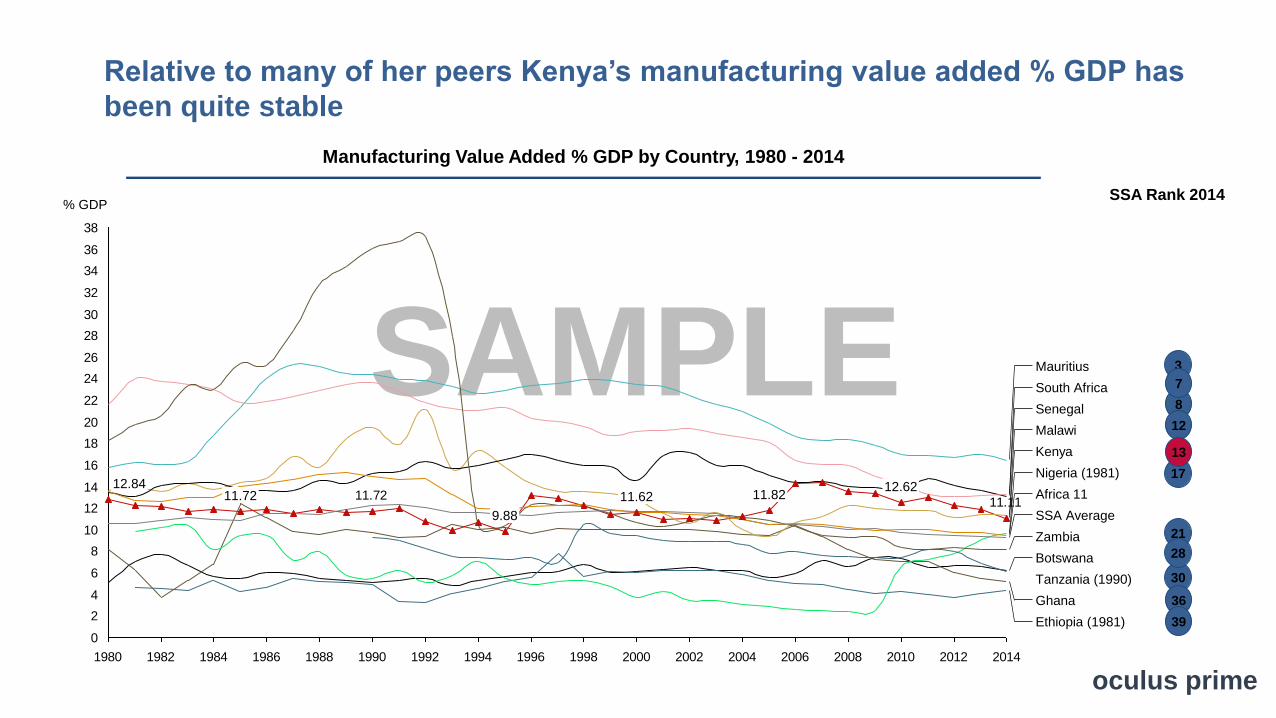
Relative to many of her peers Kenya’s manufacturing value added % GDP has
been quite stable
Manufacturing Value Added % GDP by Country, 1980 - 2014
% GDPSSA Rank 2014
30
8
21
17
36
3
28
7
12
39
13
11.1111.72
0
2
4
6
8
10
12
14
16
18
20
22
24
26
28
30
32
34
36
38
1980 1982 1984 1986 1988 1990 1992 1994 1996 1998 2000 2002 2004 2006 2008 2010 2012 2014
11.72
Nigeria (1981)
Zambia
Malawi
11.82
9.88
Botswana
12.62
Tanzania (1990)
Mauritius
Kenya
Ethiopia (1981)
11.6212.84
SSA Average
Africa 11
South Africa
Ghana
Senegal
oculus prime

SAMPLE
In the 21st century, Kenya’s share of SSA’s services value added has fallen from 4%
in 2000 to 3.3% in 2014
Services Value Added % Sub-Saharan Africa, 1980 – 2014
%
4.0%
0%
5%
10%
15%
20%
25%
30%
35%
40%
45%
50%
55%
60%
65%
70%
75%
80%
85%
90%
95%
100%
Tanzania (1990)
Senegal
Nigeria (1981)
Malawi
Kenya
100100
South Africa
100
Mauritius
2014
100100100100100100
1990
100100
1995
100 100100 100
3.2%
100100
2000
100100
3.3%
100 100100100
2005 2010
Ghana
3.3%
Ethiopia (1981)
Botswana
2.9%
Zambia
100
1980
100
4.6%
100 100 100 100100100
4.1%
100100
1985
100
4.7%
2014 SSA
Rank (48)
29
12
17
15
7
8
14
6
2
1
5
oculus prime

SAMPLE
In short, Kenya’s services value added is mid-sized and plays a less dominant
role in the economy than it does for many of her peers
Services Value Added vs. Services Value Added % GDP, 2014
= Billions, 2014 USD50
0 10 20 30 40 50 60 70 80 90 100 110 120 130 140 150 160 170 180 190 200 210 220 230 240 250 260 270 280 290 300 310 320 330 340
0
45
50
75
55
70
65
60
2014 Services VA (Billions, USD)
Tanzania (1990)
Zambia
South Africa
SSA Average
Services VA CAGR 1980-2014
Ethiopia (1981)
Botswana
Nigeria (1981)
Mauritius
Senegal
Ghana Kenya
Malawi
Africa 11
oculus prime

SAMPLE
A rising tide lifts all boats? South Korea’s prosperity has been driven by dramatic
changes in her broad economic structure. What of Kenya?
Kenya’s Sector Development, 1980 - 2014 South Korea’s Sector Development, 1980 - 2014
% GDP
0%
10%
20%
30%
40%
50%
60%
70%
80%
90%
100%Agriculture
100
Services
Industry
201020051985 1990 1995 20001980
0%
10%
20%
30%
40%
50%
60%
70%
80%
90%
100%
1980
100
200520001995 201019901985
Agriculture
Services
Industry
% GDP
oculus prime

Sectors
oculus prime

SAMPLE
Agriculture, Transportation, Construction & Business Services are Kenya’s
most impressive growth sectors by Value Added
Gross Value Added Growth by Sector, 2010 - 2014
= Billions, 2014 Ksh250
0
2
4
6
8
10
12
14
16
18
20
22
24
13.00.0 11.510.5 12.5 13.5 17.516.515.515.0 16.014.0 17.012.011.010.0 14.59.5
Construction
CAGR 2010-14
Agriculture
Business Services
Trading Services
Manufacturing
CAGR 2013-14
Mining & Quarrying
Utilities
Transportation
Government Services
Personal Services
oculus prime

SAMPLE
At ~15%, Kenya’s Government Services, % Total Economy Value Added is
not unusual among her peer countries
Government Services % Total Economy Value Added
0
5
10
15
20
25
30
35
40Botswana
Ethiopia
Ghana
Kenya
Malawi
Mauritius
Nigeria
Senegal
South Africa
Tanzania
Zambia
Africa 11Agriculture
Mining
Manufacturing
Utilities
Construction
Trade services
Transport services
Business services
Dwellings
GovernmentservicesPersonal services
oculus prime

SAMPLE
Productivity: Kenya’s agriculture is caught in a low value added growth/low
productivity trap
Agricultural Value Added vs. Productivity Growth by Country, 1980- 2010
1 = Value Added CAGR, 2010-2010
0.0
0.5
1.0
1.5
2.0
2.5
3.0
3.5
4.0
4.5
5.0
5.5
6.0
6.5
7.0
7.5
8.0
6,5002,5000 1,000500 1,500 3,500 4,000 6,000 7,0005,0004,500 5,5003,0002,000 14,500
Ghana
Botswana
Ethiopia
Value Added CAGR 2000-2010
Kenya
Africa 11
Nigeria
2010 Value Added/Worker, 2014 USD
Mauritius
Tanzania
Senegal
ZambiaSouth Africa
Malawi
oculus prime

SAMPLE
Agriculture: Scale of Production – Yields on large farms range from 1/3x
to 3x higher than those on small farms. Lost value? Opportunities?
Area under Production,
2010 - 2014
Ha, ‘000 Tons, ‘000
1718
22
17
20
33
22
28
2022
20122010 2013 20142011
680
383
0
100
200
300
400
500
600
700
800
900
xxx
20132011 2012
+78%
20142010
Production,
2010 - 2014
Yields,
2010 - 2014
Estates
Small Farms
78%
22%
63%
37%
Tea
Small Farms
Estates
183183
151159174
262250
219219225
20142012 201320112010
Small Farms
Estates
0
500
1,000
1,500
2,000
2,500
3,000
3,500
2013
xx
+49%
2010 201420122011
Coffee
Kg/Ha
oculus prime

Ownership of agricultural land parcels, Selected Counties
%
other
community
free
family
Self
rented
SAMPLE
8
5
20 11 158 19
7
10
22
20
13
1515
19
39
18
13
12
14
6457
67 7067
78
48
76
68
81
72
000006 00000
35
18
60
1
100100
Tharaka Nithi
100
NyandaruaKirinyaga Murang’a
100
Busia
03 03 0
Nakuru
000 13
0000
0
Kenya average
100
Nyeri
0
Kiambu
100
0
100
0
100
NairobiMeru
100 100 100
Ownership of Agricultural Parcels by County
oculus prime
SAMPLE
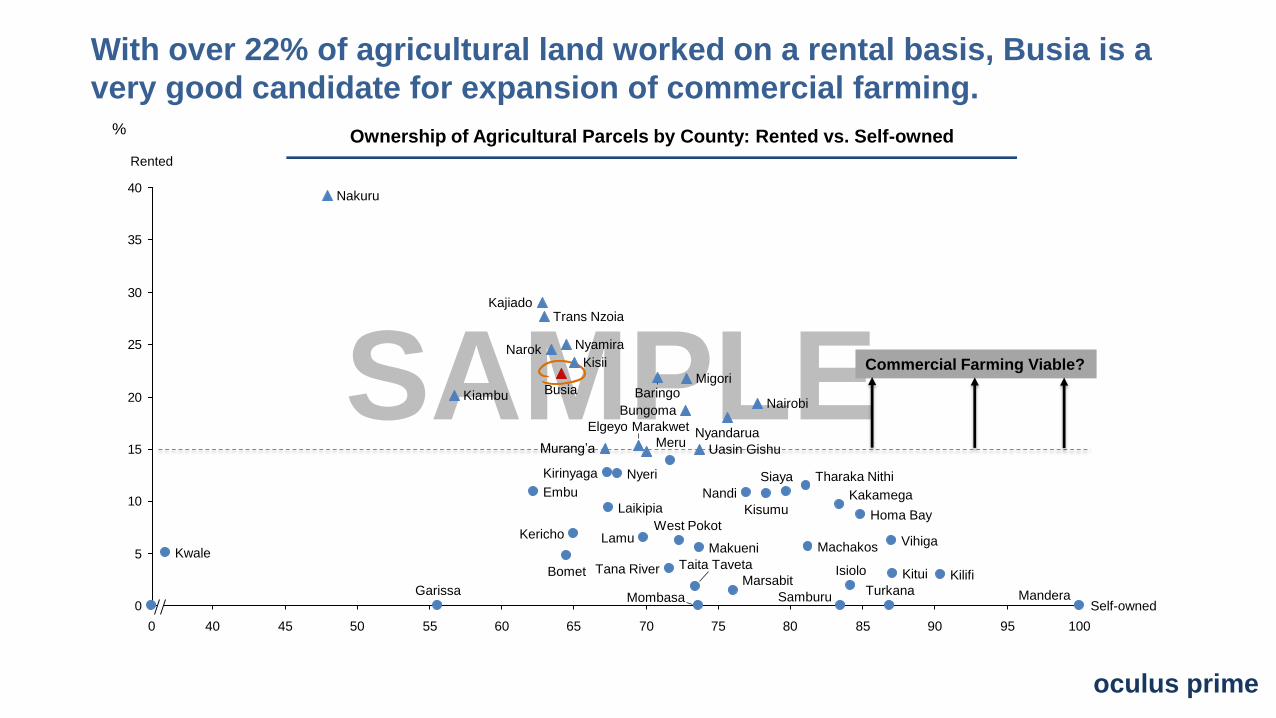
With over 22% of agricultural land worked on a rental basis, Busia is a
very good candidate for expansion of commercial farming.%
Commercial Farming Viable?
oculus prime
Ownership of Agricultural Parcels by County: Rented vs. Self-owned
0
5
10
15
20
25
30
35
40
1008570655045 550 40 8075 90 9560
West Pokot
Taita Taveta
Mandera
Kericho
GarissaSamburu
Murang’a
Mombasa
Nandi
Bomet Kitui
Self-owned
Kajiado
Narok
Migori
Nairobi
Machakos
Rented
Baringo
NyandaruaElgeyo Marakwet
Trans Nzoia
Bungoma
Uasin GishuMeru
NyeriKirinyaga
Nakuru
Kisii
Nyamira
BusiaKiambu
Tharaka NithiSiaya
Kisumu
MakueniKwale
Isiolo
TurkanaKilifi
Lamu
KakamegaLaikipia
Vihiga
Tana RiverMarsabit
Homa Bay
Embu

SAMPLE
It is safe to say that Busia is not a land of cattle
Median
Mean
oculus prime
Number of Cattle by County
-24 -22 -20 -18 -16 -14 -12 -10 -8 -6 -4 -2 0 2 4 6 8 10 12 14 16 18 20 22 24
600
-200
500
1,200
800
100
700
300
1,100
200
-300
1,000
400
0
900
-100
-400
Distance from the Mean
Distance from the Median
Busia
KajiadoKakamega
Marsabit
Bomet
Migori
Homa Bay
Narok
Wajir
West Pokot
Garissa
Nakuru
Turkana
Baringo
Mandera
Meru

SAMPLE
Construction is one of Kenya’s top five sectors in productivity.
Relative Sector Productivity, 2014
Total Economy Productivity, $2954/worker
5,000 = Value Added per Worker, USD
2,9551,588
24,983
2,474
33,989
2,7325,449
2,679
7,164
11,929
1,4240
100
200
300
400
500
600
700
800
900
1,000
1,100
1,200
1,300
1,400
4020105 35-5 105450 30 1002515
Total Economy
% 2014 Workforce
Government Services
Construction Manufacturing
Mining
Utilities
Personal Services
Transport Services
Trade Services Agriculture
% Total Economy Productivity
Business Services
oculus prime

SAMPLE
Strong growth in construction is reflected in the consumption of inputs (raw
materials, labor and financing) which have all risen strongly in the last five years.
Credit to Construction
2010 - 2014
Cement Consumption
2010 - 2014
Tonnes, ‘000
4,267
3,9913,871
5,197
3,105
+3%
+14%
+7%
+22%
2013 2014
+25%
2011 20122010
Workers, ‘000
1818171719
125
81
0
10
20
30
40
50
60
70
80
90
100
110
120
130
2011 20122010
+11%
Private
-1%
Public
20142013 20122011
+36%
2014
+14%
+25%
20132010
+56%
32.6
80.4
69.2
50.8
70.8
Employment in Construction
2010 - 2014
Billions, Ksh
oculus prime

SAMPLE
Construction permits can be acquired relatively quickly in Kenya but
building quality control is not as robust as many other African countries
Time to get a Construction Permit & Quality Control Procedures, 2014
115 1551501401051007570 85 950 80 90
6.0
11.0
13.0
12.0
11.5
10.5
10.0
12.5
8.5
9.0
225
7.5
6.5
9.5
8.0
7.0
0.0
220 230110 215130 185125 195 210170165 175145 205200190180120 160135
South Africa
Malawi
Sub-Saharan Africa
Morocco
Namibia
Rwanda
Zambia
Uganda
Nigeria
Ghana
Senegal
Angola
Botswana
Time (Days)
Quality Control (0-15)
Algeria
Tanzania
Kenya
OECD
Ethiopia
oculus prime
SAMPLE
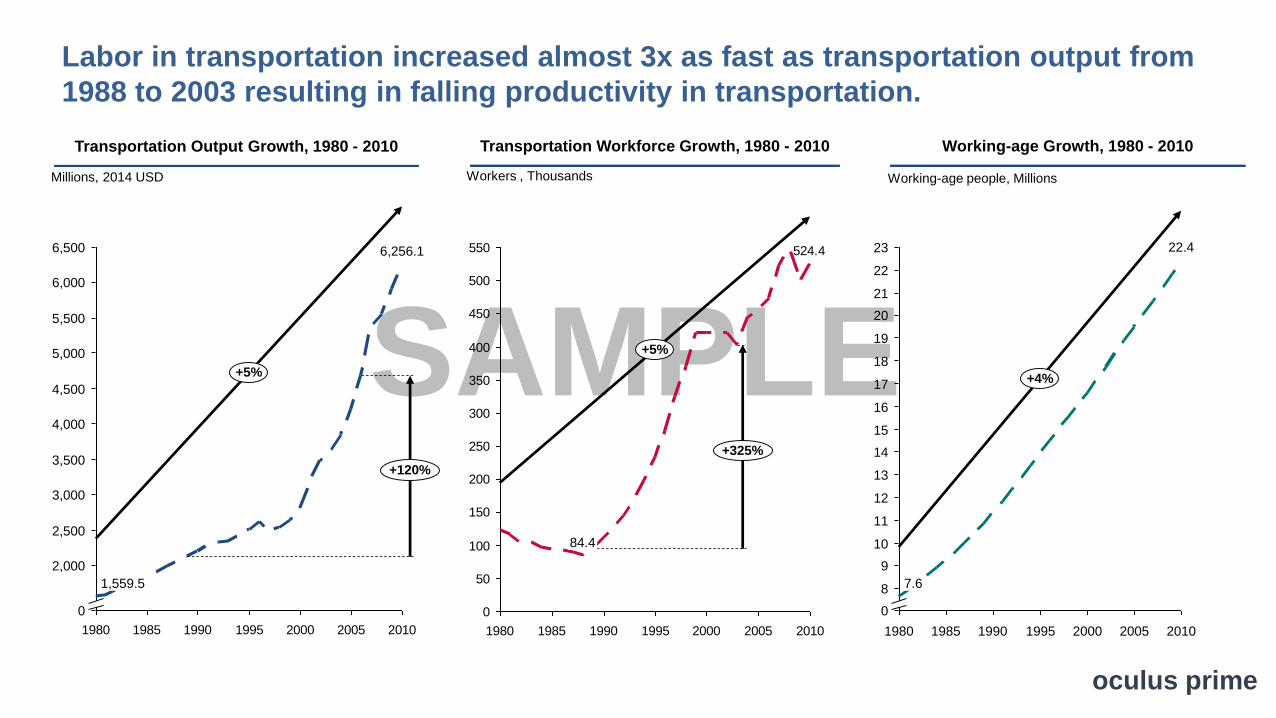
Labor in transportation increased almost 3x as fast as transportation output from
1988 to 2003 resulting in falling productivity in transportation.
Millions, 2014 USD
Transportation Output Growth, 1980 - 2010
1980 1985 1990 1995 2000 2005 2010
4,000
0
6,000
5,000
2,000
5,500
3,500
6,500
4,500
3,000
2,500
1,559.5
6,256.1
+5%
+120%
524.4
0
50
100
150
200
250
300
350
400
450
500
550
1980 1985 1990 1995 2000 2005 2010
+5%
+325%
84.4
Transportation Workforce Growth, 1980 - 2010
Workers , Thousands
1995
0
1985
9
20051980
18
8
2000
11
20
19
17
16
15
14
13
12
10
23
22
21
20101990
+4%
22.4
7.6
Working-age people, Millions
Working-age Growth, 1980 - 2010
oculus prime

SAMPLE
Labor market flexibility: Kenya, Botswana and Malawi are the 3 peer countries with
the most movement and volatility in transportation labor
% difference between labor growth
and output growth
Transportation Productivity, 1980 - 2010
Nigeria
Tanzania
South Africa
Mauritius
Malawi
Zambia
Senegal
Kenya
Ghana
Ethiopia
BotswanaLabor Growth > Output Growth
Output Growth > Labor Growth-40
-35
-30
-25
-20
-15
-10
-5
0
5
10
15
20
25
30
35
40
1980 1985 1990 1995 2000 2005 2010
oculus prime

SAMPLE
11.4
61.556.6
20.0
1980 1985 1990 1995 2000 2005 2010
160
140
130
120
30
170
150
180
80
70
60
90
110
50
40
20
100
0
10
Tanzania
Senegal
South Africa
Africa 11
Mauritius
Kenya
Ghana
Ethiopia
Zambia
Nigeria
Botswana
Malawi
5.5
92.9
Like many African countries, the number of Mining workers in Kenya
has risen strongly form the 1990s
Thousands
Mining Workers by Country (w/o South Africa), 1980 - 2010
oculus prime

SAMPLE
Mining’s share of Kenya’s total workforce grew steadily from 1980 and has
continued to do so since 2005
Change in Mining Share of Total National Workforce by Country, 1980- 2010
-14
-12
-10
-8
-6
-4
-2
0
2
4
6
8
10
12
14
16
18
20
-5.5 -5.0 -4.5 -4.0 -3.5 -3.0 -2.5 -2.0 -1.5 -1.0 -0.5 0.0 0.5 1.0 1.5 2.0 2.5 3.0 3.5 4.0 4.5 5.0 5.5 6.0 6.5 7.0 7.5 8.0 8.5 9.0 9.5 10.0 10.5
CAGR 2005-2010
CAGR 1980-2010
Africa 11
Nigeria
Mauritius
Tanzania
South Africa
Zambia
Senegal
Botswana
Ethiopia
Ghana
Kenya
Malawi
oculus prime

SAMPLE
Mauritius’ productivity share of Trade Services has more than doubled since 1980 while
Kenya and Botswana have seen their shares almost halved
Trade Services
Productivity, 1980
%, Africa 11 Total (2014 USD)
Mauritius
4.8%
South Africa
Nigeria
Malawi
5.3%
Zambia
7.3%
2.8%
Tanzania
2.7%
Senegal
11.0%
12.3%
Kenya
6.1%
Ghana
0.6%
Botswana
Ethiopia
2.0%
45.0%
Tanzania
Senegal
4.4%
Zambia
18.5%
South Africa
3.4%
12.9%
22.8%
Nigeria
Ghana
6.0%
Ethiopia
2.4%
Kenya
Mauritius
1.1%
Botswana
4.5%
21.4%
2.6%
MalawiKenya
Tanzania
Mauritius
16.8%
Malawi
25.1%
1.2% Ethiopia
10.1%
Senegal
Nigeria
8.0%
South Africa
1.2%
3.4%
2.4%
Botswana
25.5%3.1%
Zambia
3.3%
Ghana
Trade Services
Productivity,1995
Trade Services
Productivity, 2010
%, Africa 11 Total (2014 USD) %, Africa 11 Total (2014 USD)
oculus prime
SAMPLE
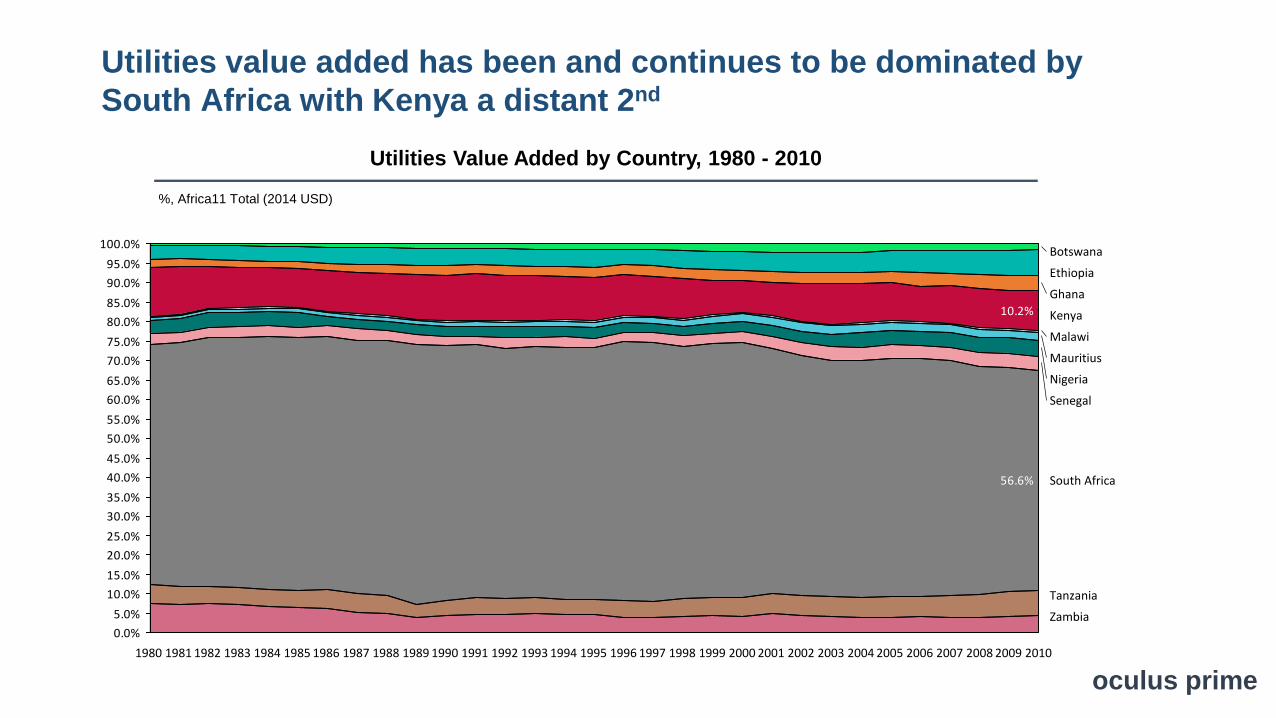
Utilities value added has been and continues to be dominated by
South Africa with Kenya a distant 2nd
Utilities Value Added by Country, 1980 - 2010
%, Africa11 Total (2014 USD)
56.6%
10.2%
0.0%
5.0%
10.0%
15.0%
20.0%
25.0%
30.0%
35.0%
40.0%
45.0%
50.0%
55.0%
60.0%
65.0%
70.0%
75.0%
80.0%
85.0%
90.0%
95.0%
100.0%
1986 19991987 20022001199819851981 19951993 199419891984 19971990 1992198819831980 1991 20001982 1996 200720042003 20062005
Ghana
2010
Senegal
Botswana
2008
Tanzania
Zambia
South Africa
Mauritius
Malawi
Nigeria
Kenya
Ethiopia
2009
oculus prime

1. International Trade2. Labor & Employment3. Energy4. Infrastructure5. ICT6. Tourism7. Population8. Personal Wealth9. Cost of Living10.Education & Health11.Food Security12. Financial Inclusion13.Competitiveness
AN ECONOMIC ENCYCLOPEDIA OF SUB-SAHARAN AFRICA
PART 3
KENYA oculus prime

International Trade
oculus prime

SAMPLE
Kenya’s exports have grown at the slowest pace of her peer countries since
1980 and at about the average pace of her peers this century
Exports of Goods & Services Growth 1980 - 2014
2.5 = CAGR 2000-2014
oculus prime
0
2
4
6
8
10
12
14
16
18
20
22
24
4.0 6.0 8.55.5 8.07.00.0 5.03.5 4.5 7.56.5
Mauritius
Africa 11
Zambia
Malawi
SSA
South Africa
Senegal NigeriaKenya
Ghana
Botswana
Ethiopia
Tanzania
CAGR 2000-2014
CAGR 1980-2014
SSA Average

SAMPLE
1980 1982 1984 1986 1988 1990 1992 1994 1996 1998 2000 2002 2004 2006 2008 2010 2012 2014
70
50
25
10
60
75
55
45
40
80
65
35
30
20
15
5
0
32.90
Senegal
Africa 11
SSA Average
Tanzania
Zambia
South Africa
Nigeria
Mauritius
20.66
29.52
25.30
16.40
25.69
Ghana
Botswana
Malawi
28.51
21.59
Ethiopia
Kenya
In 1980 Kenya’s exports % GDP were unremarkable relative to her peers. It is
noteworthy, concerning even, how low Kenya’s exports % GDP were in 2014
Exports of Goods & Services % GDP by Country, 1980 - 2014
% GDPSSA Rank 2014
33
10
22
16
34
5
26
8
13
45
40
oculus prime

SAMPLE3.45
0.0
0.5
1.0
1.5
2.0
2.5
3.0
3.5
4.0
4.5
5.0
5.5
6.0
6.5
7.0
1980 1982 1984 1986 1988 1990 1992 1994 1996 1998 2000 2002 2004 2006 2008 2010 2012 2014
2.00
Zambia
Ethiopia
Mauritius
Botswana
2.07
2.38
Ghana
Senegal
3.10
Kenya
Malawi
Africa 11
3.43
SSA Average
Tanzania
2.56
3.87
The decline of Kenya’s share of SSA’s exports is marked by two episodes (1994-
1997) and (2005-2008) of steep declines that were never recovered from
Exports % SSA by Country (w/o Nigeria & South Africa), 1980 - 2014
% SSASSA Rank 2014
16
4
13
12
22
15
8
29
9
oculus prime

SAMPLE
Growth of Kenya’s imports were in line with many of her peers in the last
decade and but have been among the fastest this decade
Imports of Goods & Services Growth in the 21st Century
2.5 = CAGR 2010-2014
0
1
2
3
4
5
6
7
8
9
10
11
12
13
14
15
16
18.517.516.516.012.58.5 13.511.09.5 15.09.08.0 14.511.510.5 15.512.010.0 13.00.0 14.0 17.0 19.018.0
SSA Average
Malawi
Botswana
Ghana
Nigeria
Kenya
Mauritius
Tanzania
CAGR 2000-2010
SSA
Zambia
Senegal
Ethiopia
Africa 11South Africa
CAGR 2010-2014
oculus prime

SAMPLE
Changes in Kenya’s imports % GDP have been the lowest both since 1980
and this century highlighting the stability of the imports to Kenya’s economy
Imports of Goods & Services % GDP Growth 1980 - 2014
0.5 = CAGR 2000-2014
-5.0
-4.5
-4.0
-3.5
-3.0
-2.5
-2.0
-1.5
-1.0
-0.5
0.0
0.5
1.0
1.5
2.0
2.5
3.0
3.5
4.0
4.5
5.0
-2.0 -1.5 -1.0 -0.5 0.0 0.5 1.0 1.5 2.0 2.5 3.0 3.5 4.0 4.5 5.0 5.5
SSA Average
Africa 11
SSA
CAGR 1980-2014
CAGR 2000-2014
Kenya
Ghana
MauritiusBotswana
Tanzania
Senegal
Zambia
Nigeria
South Africa
Malawi
Ethiopia
oculus prime

SAMPLE
In short, Kenya’s imports are mid-sized and relative to her peers are a less
important part of her economy
Imports vs. Imports % GDP, 2014
25 = Billions, 2014 USD
0
5
10
15
20
25
30
35
40
45
50
55
60
65
0 5 10 15 20 25 30 35 40 45 50 55 60 65 70 75 80 85 90 95 100 105 110 115 120 125
2014 Imports (Billions, USD)
2014 Imports % GDP
Tanzania
Senegal
Nigeria
SSA Average
Africa 11Zambia
South Africa
Mauritius
Malawi
Kenya
Botswana
Ghana
Ethiopia
oculus prime
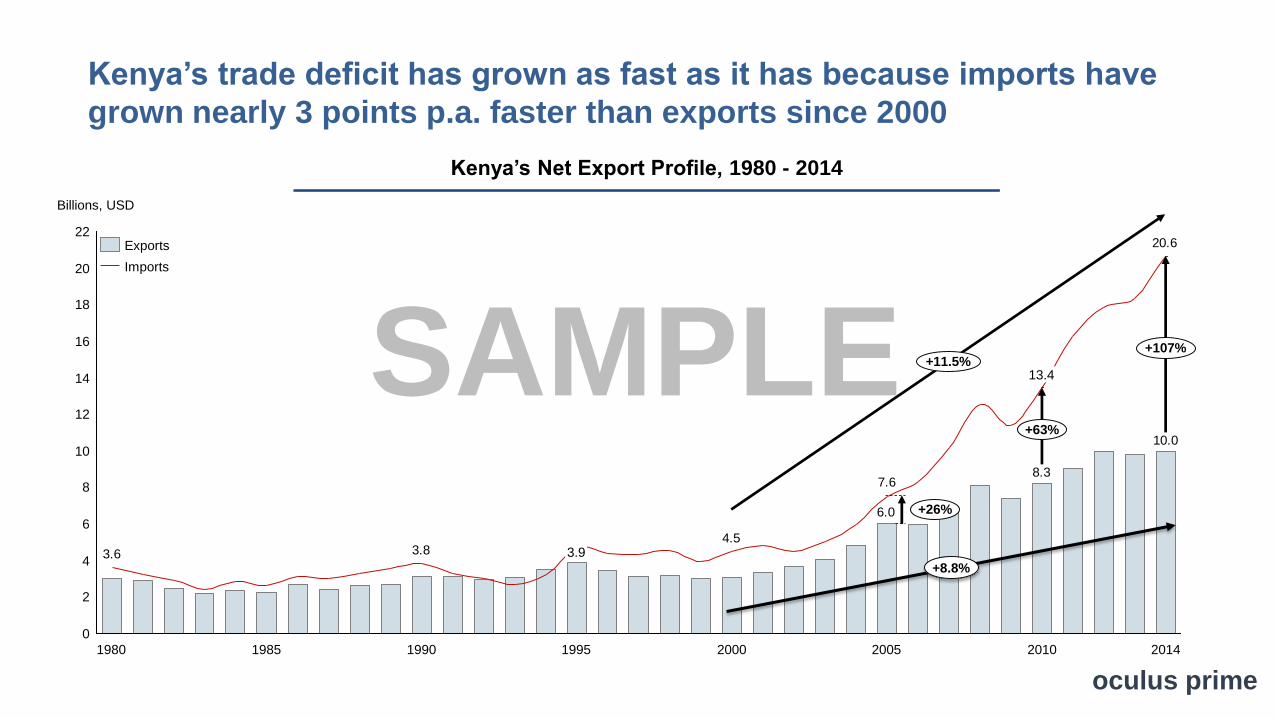
SAMPLE10.0
8.3
6.0
7.6
20.6
4.53.83.6
12
4
10
8
16
2
0
22
18
14
20
6
Billions, USD
+63%
+11.5%
2014
+26%
+107%
1980 1985 20052000
13.4
20101990 1995
3.9
Kenya’s trade deficit has grown as fast as it has because imports have
grown nearly 3 points p.a. faster than exports since 2000
Kenya’s Net Export Profile, 1980 - 2014
Imports
Exports
+8.8%
oculus prime

SAMPLE
-10.65
1980 1985 1990 1995 2000 2005 2010 2015
6
5
4
3
-7
1
-3
2
8
9
7
-5
-8
-11
-9
0
-2
-4
-10
-1
-6Tanzania
Zambia
SSA Average
Africa 11
South Africa
-0.42
-5.17
-0.78
Mauritius
Kenya
Ghana
Senegal
Botswana
-0.69
-1.57
Malawi
Ethiopia
-0.64
-1.43
Kenya’s net exports were flat between 1980 and 2000 but have more than
quintupled in the 21st century
Net Exports of Goods & Services by Country, 1980 - 2014
Billions, 2014 USDSSA Rank 2014
4
33
8
11
22
6
30
36
15
3
oculus prime

SAMPLE
-20
-15
-10
-5
0
5
10
-12 -10 -8 -6 -4 -2 0 2 4 6 8 10 12 14 16 18 20 22 24 26 28 30 32 34 36 38
Africa 11
South Africa
Senegal
Zambia
Tanzania
Kenya
Ethiopia
SSA Average
Mauritius
Malawi
Nigeria
Ghana
Botswana
2014 Net Exports % GDP
2014 Net Exports (Billions, USD)
In short, Kenya’s net exports are large and represent a very important part
of GDP relative to her peers
Net Exports vs. Net Exports % GDP, 2014
5 = Billions, 2014 USD
oculus prime
SAMPLE
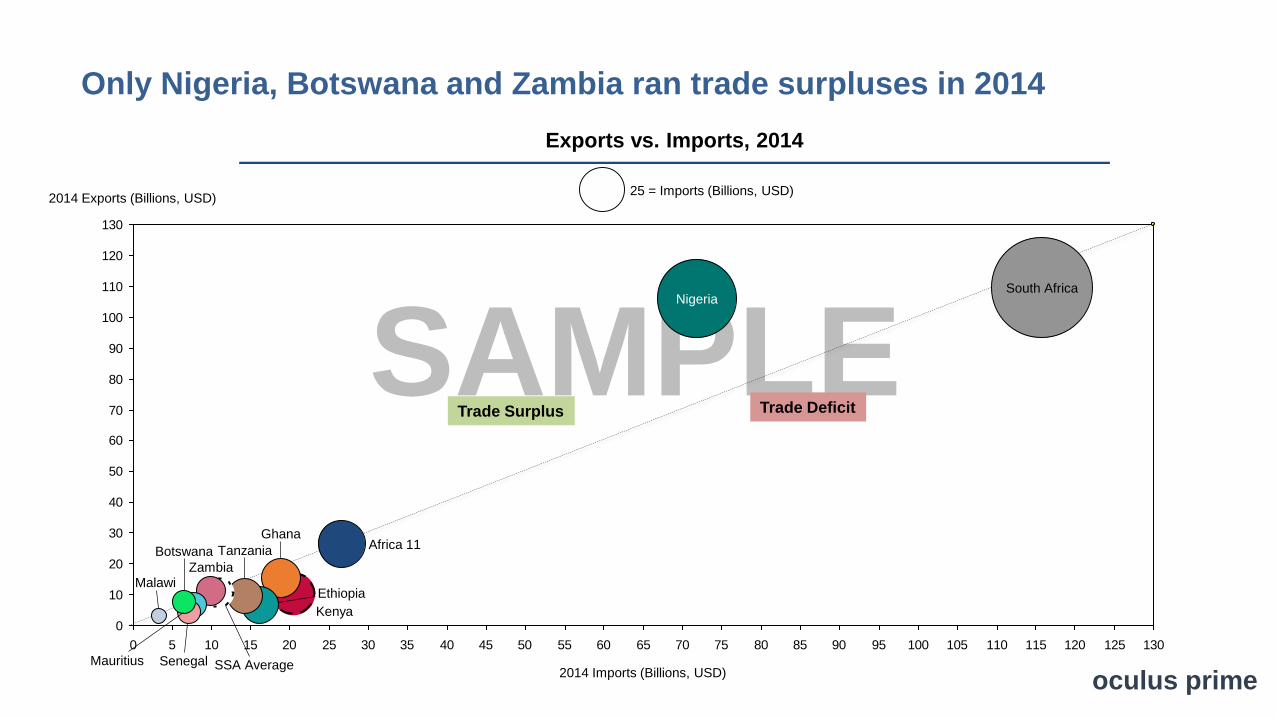
Only Nigeria, Botswana and Zambia ran trade surpluses in 2014
Exports vs. Imports, 2014
25 = Imports (Billions, USD)
Trade DeficitTrade Surplus
0
10
20
30
40
50
60
70
80
90
100
110
120
130
0 5 10 15 20 25 30 35 40 45 50 55 60 65 70 75 80 85 90 95 100 105 110 115 120 125 130
2014 Exports (Billions, USD)
2014 Imports (Billions, USD)Senegal SSA Average
Zambia
Tanzania
South Africa
Africa 11Botswana
Nigeria
Kenya
Mauritius
MalawiEthiopia
Ghana
oculus prime

SAMPLE
But trade was less important to Kenya than many of her peers in 2014
Exports % GDP vs. Imports % GDP, 2014
10 = Imports % GDP
Trade Deficit
Trade Surplus
oculus prime
0
5
10
15
20
25
30
35
40
45
50
55
60
0 5 10 15 20 25 30 35 40 45 50 55 60 65 70
2014 Imports % GDP
2014 Exports % GDP
SSA Average
Senegal
Kenya
Ghana
Botswana
Zambia
Africa 11South Africa
Ethiopia
Malawi
NigeriaTanzania
Mauritius

SAMPLE
Tea and Horticulture are by far the most valuable agricultural exports in the aggregate
and seem to be countercyclical to the other exported agricultural commodities
Agricultural Exports by Product, 2010 - 2014 Agricultural Exports by Product % Change, 2011 - 2014
Billions, Ksh
-50
-45
-40
-35
-30
-25
-20
-15
-10
-5
0
5
10
15
20
25
30
2011 2012 2013 2014
Horticulture
Coffee
Tea
Others
Fish
Sugar
Tobacco
2010 2011 2012 2013 2014
95
90
80
20
10
5
0
85
75
15
105
100
5.3
Tea
97.1
Others
Tobacco
Horticulture
19.9
Sugar
94.0
Coffee
4.3
16.8
Fish
%
oculus prime

SAMPLE
Kenya’s top ten export earners account for 67% of total export earnings while
Kenya’s fastest growing exports account for only 16% of total export earnings
10 Most Valuable Exports, 2014 10 Fastest Growing Exports, 2010 - 2014
33%
2%
All Other Exports
Soda Ash
Medicines & Pharma
6%
21%
Iron & SteelApprel & Clothing
20%
Horticulture
4%Articles of Plastic
Coffee, unroastedTobacco
Tea
Essential Oils 2%
3%
2%
4%
2%
All Other Exports
Tobacco
84%
0%
Leather
Sheet Plastic
2%
Apprel & Clothing
Paints
4%
2%1%
6%
Scrap Metal
1%
Hides & Skins
Fluorspar
0%
Stone, Sand & Gravel
Articles of Plastic0%
0%
% Export Earnings % Export Earnings
oculus prime
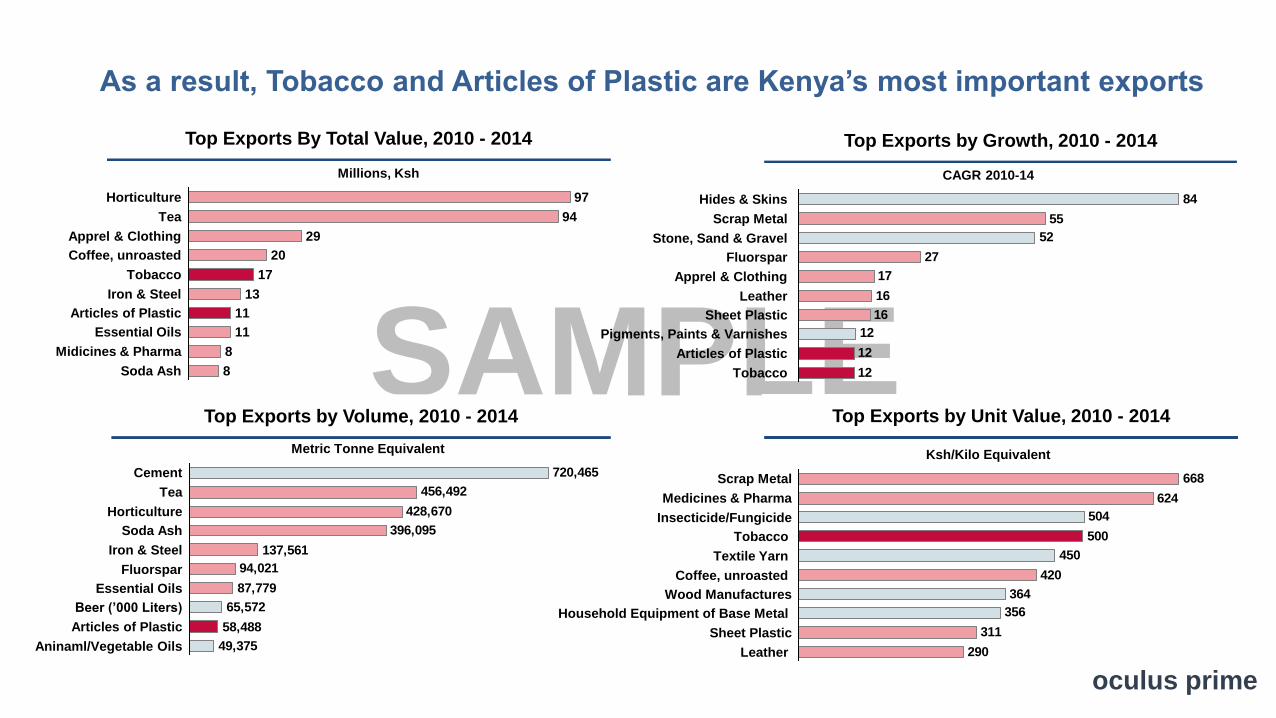
SAMPLE
As a result, Tobacco and Articles of Plastic are Kenya’s most important exports
Top Exports By Total Value, 2010 - 2014 Top Exports by Growth, 2010 - 2014
Coffee, unroasted
Horticulture
Tobacco
Tea
Iron & Steel
Midicines & Pharma
Apprel & Clothing
Essential Oils
Articles of Plastic
Millions, Ksh
Soda Ash
29
11
94
11
8
17
97
20
13
8
49,375
58,488
65,572
87,779
94,021
137,561
396,095
428,670
456,492
720,465
Aninaml/Vegetable Oils
Metric Tonne Equivalent
Articles of Plastic
Beer (’000 Liters)
Horticulture
Iron & Steel
Tea
Cement
Soda Ash
Essential Oils
Fluorspar
12
12
12
16
16
17
27
52
55
84
Scrap Metal
Stone, Sand & Gravel
CAGR 2010-14
Tobacco
Articles of Plastic
Leather
Pigments, Paints & Varnishes
Sheet Plastic
Apprel & Clothing
Fluorspar
Hides & Skins
290
311
356
364
420
450
500
504
624
668
Textile Yarn
Coffee, unroasted
Tobacco
Ksh/Kilo Equivalent
Leather
Sheet Plastic
Household Equipment of Base Metal
Wood Manufactures
Insecticide/Fungicide
Medicines & Pharma
Scrap Metal
Top Exports by Volume, 2010 - 2014 Top Exports by Unit Value, 2010 - 2014
oculus prime

SAMPLE
Kenya imports the same share of Industrial Supplies as it exports ~ 28%. The
shares of high value Fuel and Capital Goods versus low value Food and Consumer
Goods are flipped…
Kenya’s Imports Kenya’s Exports
6.9
8.7
17.2
28.6
17.2
21.4
20142011 2012 20132010
1.6
1.6
27.0
28.2
40.8
201320122011
0.7
20142010
% Imports % Exports
Transport Machinery
Fuel & Lubricants
Food & Beverages
Capital Goods
Industrial Supplies
Consumer Goods
oculus prime

SAMPLE
Hence: Import heavy and expensive. Export light and cheap.
Net exports ($M US)
Import
Heavy
Export
Light
0
1
2
3
4
5
6
7
8
9
10
11
12
13
14
15
16
17
-800-1,200 1,000-1,800-3,000 -1,600-2,000 -600-2,200 -1,000-1,400 800-200 600-400 1,2004002000-2,800 -2,600 -2,400-3,200-3,600 -3,400-3,800-4,000
Leather
Soda ash
% total trade
Cement
All other Commodities
Coffee
All other Commodities
TobaccoTelecommunications equipment
Apparel and accessories
Aircraft + equipment
Tea
Industrial Machinery
Non-ferrous metals
Organic & inorganic chemicals
Paper
PlasticsWheat
Rice
Road Motor Vehicles
Rubber tyres and tubes
Textile yarn and Fabrics
Crude Petroleum1
Chemical Fertilizers
HorticultureAnimal/vegetable fats and oils
Petroleum Products
InsecticidesMedicine & Pharma
Iron and Steel
oculus prime

SAMPLESAMPLE
International trade with Asia occurs on a vastly different scale than
with any other continent and it is mostly one way
250 = Total Trade (Billions, Ksh)
Kenya’s Net Export Profile, 2014
0
5
10
15
20
25
30
35
40
45
50
55
60
65
70
75
80
85
90
95
100
-100,000-150,000-200,000 100,000-50,000-900,000 -300,000-950,000 0-350,000 50,000-250,000
Total Europe
EU
EAC
Asia
Other Africa
Total Africa
Canada
Other Europe
Other America
USA
Total America
Net Exports (Millions, Ksh)
Net Exports % Total Trade
Rest of World
Comesa
oculus prime

SAMPLE
1996 1998 2000 2002 2004 2006 2008 2010 2012 2014
60
50
45
55
20
10
35
15
0
25
5
40
30
Paper & Paper Products
Chemicals
Agriculture
Textiles, Clothing & Furniture
Plastics & Rubber
Wood
Metal & Minerals
Machinery
Stone Glass & Ceramics
Kenya’s exports to India are dominated by agricultural products, chemicals
and minerals
Kenya’s Exports to India, 1997 - 2013
%
oculus prime
11.5%Stone Glass & Ceramics
37.4%
Machinery1.6%
Plastics & Rubber
Paper & Paper Products
Wood
Chemicals
Textiles, Clothing & Furniture
1.9%
Agriculture
1.2%
0.1%
0.3%
0.0%
Metal & Minerals
45.9%
Kenya’s Exports to India, 2013
Millions, 2014 USD

SAMPLE
And of Kenya’s agricultural exports to India, edible vegetables (pulses,
beans etc.) and tea & coffee were dominant (>70%) in 2013
Kenya’s Agricultural Exports to India, 2013
%
oculus prime
45.9%
Paper & Paper Products
Textiles, Clothing & Furniture
Plastics & Rubber
Agriculture
Chemicals
37.4%
1.2%
Wood
Machinery
0.1%
1.6%1.9%
0.3%
Stone Glass & Ceramics
0.0%
Metal & Minerals
Kenya’s Exports to India, 2013
Animal Products
Cereals
0.0%
Edible vegetables
Raw hides and skins
Oil seeds 44.2%
27.7%
0.2%Wool & animal hair
6.4%
Textile fibres
Wattle extract
Edible fruit and nuts
0.0%
0.1%
Other
5.3%
Cut flowers0.1%
Coffee, tea and spices
0.2%
xxx
3.7%
%

SAMPLE
Since 2010, exports to Burundi grew the fastest while imports from Uganda grew
the fastest; but Tanzanian imports picked up strongly between 2013 and 2014
Exports, 2010 - 2014 Imports, 2010 - 2014
10 = Billions, 2014 Ksh 3 = Billions, 2014 Ksh
-15
-10
-5
0
5
10
15
20
25
30
35
40
45
0 1 2 3 4 5 6 7 8 9 10
Uganda
TanzaniaRwanda
Burundi
CAGR 2010-14
CAGR 2013-14
-50
-40
-30
-20
-10
0
10
20
30
40
50
60
70
80
18161514 1911 1310 12-33 17 20
CAGR 2013-14
Uganda
Rwanda
Tanzania
CAGR 2010-14
Burindi
oculus prime

SAMPLE
Kenya’s trade with Europe
Imports generally rising, 2010 - 2014 Exports generally flat, 2010 - 2014
2010 2011 2012 2013 2014
50
25
35
30
20
45
10
5
15
0
40
Other Europe
Austria
Sweden
Ireland
Imports, (Billions, Ksh)
Denmark
Other EU
Hungary
Poland
Czech Republic
UK
Netherlands
Italy
France
Belgium
Spain
Germany
Finland
2010 2011 2012 2013 2014
50
30
45
40
25
35
20
10
0
15
5
Exports (Billions, Ksh)
Netherlands
Burundi
Other EU
Poland
Finland
Sweden
Other Europe
UK
Spain
Italy
Germany
Belgium
oculus prime

SAMPLE
Yemen is the only Middle Eastern country with which Kenya had a trade surplus
-50 100-160 -100 -30-40-60-70-150 -90 -20 -10-120 -110 -80-130-140-190-200 -180 -170
Net Exports 2014, Billions Ksh
Iran
Saudi Arabia
-4.3
Bahrain
Other Middle East
-192.2
4.4
Oman
Yemen
Israel
-41.4
Jordan
UAE
-3.6
-10.5
Total
xxx
-51.7
-0.5
-1.5
oculus prime

SAMPLE
Kenya’s Balance of Trade By Country
Exports (MM, Ksh )
Trade Deficit Countries
Trade Surplus Countries
-2,500-7,500 22,50020,00012,500 17,500
40,000
260,000
100,000
10,000
62,500
90,000
30,000
60,00042,500
0
37,500 40,00035,000
270,000
70,000
60,000
80,000
250,000
50,000
20,000
-10,000 15,0005,000 10,0007,5002,5000
Sweden
Australia
Hungary
Denmark
Ireland
Poland
Czech Republic
Belgium
Spain
France
UK
Israel
Jordan
Iran
Saudi Arabia
Canada
Afghanistan
China
Thailand
Indonesia
USA
Singapore
Oman
Malaysia
S. Korea
Finland
India
Pakistan
Taiwan Bahrain
Rest of World
Japan
Yemen
Kazakhstan
Ukraine
Brazil
Russia
Imports (MM, Ksh)
UAE
Germany
Italy Netherlands
Austria
DROC
Swaziland
Rwanda
Tanzania
Zambia
Egypt
SouthAfrica
Ethiopia S. Sudan
Sudan
Somalia
Mauritius
Uganda
oculus prime

SAMPLE
… Resulting in Kenya being middle-of-the-pack in Africa in terms of ease of
cross border trading
World Rank vs. Africa Rank
0 2 4 6 8 10 12 14 16 18 20 22 24 26 28 30 32 34 36 38 40 42
200
190
180
170
150
90
60
70
100
140
130
110
160
80
0
120
World Rank (189)
Botswana
Africa Rank (47)
Ghana
Senegal
Malawi
Nigeria
Zambia
Namibia
Mauritius
Kenya
Rwanda
South Africa
Angola
Tanzania
Ethiopia
Nigeria
Angola
182
181
South Africa
Namibia
Mauritius
51
131
123
113
Ghana
Ethiopia
Rwanda
Zambia
156
152
130
118
66
180Tanzania
171
166
Kenya
Malawi
Senegal
Botswana
Africa Rank World Rank
1
South Africa
Botswana
40
36
28
22
21
15
Ghana
42
41
Rwanda
Nigeria
26
34
16Malawi
Namibia
Senegal 13
4
Ethiopia
Zambia
Kenya
Angola
Tanzania
Mauritius
oculus prime

Labor Productivity
oculus prime

SAMPLE
Kenya enjoyed long stretches of productivity growth from the 1960s to 1990; declining
productivity then persisted till 2002 when strong productivity growth resumed
Kenya’s Output Growth, Employment Growth & Labor Productivity Growth Profile, 1955 - 2015
3.2
5.1
3.1
4.95.8
-5
-4
-3
-2
-1
0
1
2
3
4
5
6
7
8
9
10
11
12
13
1995 20151985 201020052000
-1.6-2.7
0.90.6
199019801960
-1.4
1955
2.1
19751965
-2.8
2.2
1970
Labor Productivity Growth
Employment Growth
Financial Crisis
Dotcom Bust
Structural Reforms
%
oculus prime
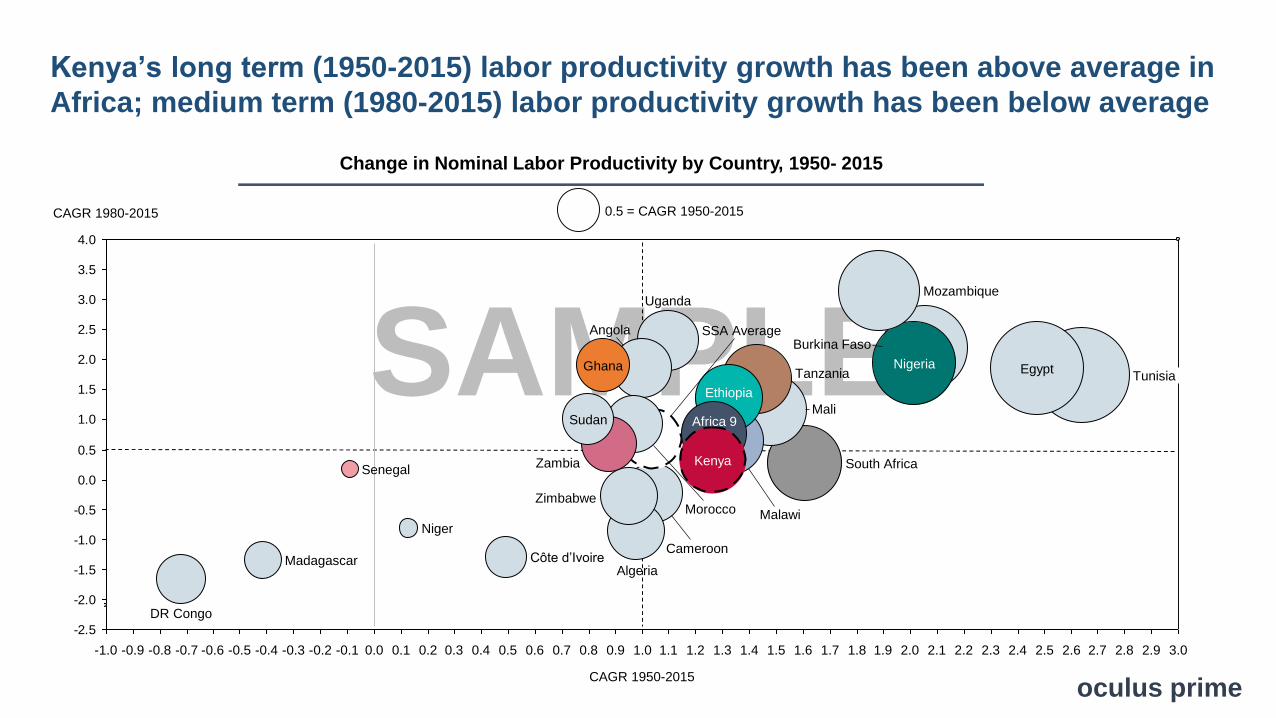
SAMPLE
Kenya’s long term (1950-2015) labor productivity growth has been above average in
Africa; medium term (1980-2015) labor productivity growth has been below average
Change in Nominal Labor Productivity by Country, 1950- 2015
0.5 = CAGR 1950-2015
-2.5
-2.0
-1.5
-1.0
-0.5
0.0
0.5
1.0
1.5
2.0
2.5
3.0
3.5
4.0
1.41.31.10.3-0.8 0.5 0.90.2-0.2 1.8-0.5-0.6-0.7-1.0 0.0-0.1-0.4-0.9 -0.3 0.70.60.40.1 2.31.6 3.01.21.0 2.6 2.92.52.12.0 2.41.9 2.72.20.8 2.81.71.5
EgyptGhana
Madagascar
Ethiopia
DR Congo
Angola
Algeria
Malawi
Mozambique
Niger
Mali
Kenya
Morocco
Burkina FasoSSA Average
SenegalZambia
CAGR 1950-2015
Cameroon
Africa 9
Zimbabwe
Uganda
Tanzania
Sudan
South Africa
Nigeria
CAGR 1980-2015
Côte d’Ivoire
Tunisia
oculus prime

SAMPLE
Labor productivity growth in Kenya’s transport services was completely overwhelmed
by employment growth in the 1990s; there has been a decent reversal in the 21st century
Kenya’s Transport Services Output Growth, Employment Growth & Labor Productivity Growth Profile, 1971 - 2010
-20
-18
-16
-14
-12
-10
-8
-6
-4
-2
0
2
4
6
8
10
12
14
16
18
1990
-11.9
20102005
12.4
-8.2
0.4
6.1
1995
4.6
2000
-11.6
6.1
1975
8.7
19851970 1980
Employment Growth
Labor Productivity Growth
oculus prime

SAMPLE
Employment and output in Kenya’s government services sector both had strong
correlations to labor productivity in the 1990s but in the 21st century correlations for
both collapsed; this is puzzling and bears further scrutiny
Kenya’s Government Services Decennial Productivity Correlations, 1970 - 2010
-0.952-0.929
-0.388-0.352
-0.987
-0.386
0.036
-0.859
-0.754
-0.278
-0.031
-0.893
-0.190
0.299
1980-1989 1990-20102000-2010 1970-19901990-1999 1970-20101970-1979
Value Added & Labor Productivity
Employment & Labor Productivity
oculus prime

Labor & Employment
oculus prime

SAMPLE
Public Sector Employment is dominated by Education and Public
Administration & Defense with nearly ¾ of all public sector workers
Wage Employment in the Public Sector by Industry, 2010 - 2014
Thousands
41.4
207.4
0
20
40
60
80
100
120
140
160
180
200
220
240
260
280
300
2010 2011 2012 2013 2014
Manufacturing
Agriculture, Forestry & Fishing
Education
Scientific & Technical Activities
Wholesale & Retail Trade
Transpotation & Storage
Finance & Insurance
Health & Social Work
Information & Communication
Public Administration & Defense
Accomodation & Food Services
Construction
0,3%
1,3%
Education
0,2%
4,7%
33,3%
Finance & Insurance
Scientific & Technical
0,1%
0,2%
Trade
Electricity, gas, steam
Construction
1,3%
ManufacturingAgriculture
6,1%
Arts, entertainment & recreation
0,3%
Health & Social Work
2,1%
2,5%
Water supply, sewage
Public Administration & Defense
Accomodation & Food
0,8%
2,6%
Transpotation & Storage3,7%
Mining
ICT
40,4%
Wage Employment in the Public Sector by Industry, 2014
oculus prime

SAMPLE
But growth in public sector employment has been fastest in trade
and utilities
Growth of Wage Employment in the Public Sector by Industry, 2010 - 2014
10% = CAGR 2010-14
-20
-15
-10
-5
0
5
10
15
20
-20 -15 -10 -5 0 5 10 15 20 25 30 35 40 45 50
2013-14
2010-14
Arts & EntertainmentManufacturing
Scientific & Technical
Information & Communication
Accomodation & Food
Transpotation & Storage
Construction
Education
Electricity, Gas & Steam Supply
Public Admin & Defense
Finance & Insurance
Health & Social Work
Trade
Water & Sewage
Mining
Agriculture
oculus prime

SAMPLE
Overall, workers in financial services and in extraterritorial organizations
are the best paid in KenyaPer Employee Overall Wage Payments by Industry, 2010 - 2014
Ksh
0
200000
400000
600000
800000
1000000
1200000
1400000
1600000
1800000
2000000
2200000
2400000
2600000
2800000
3000000
2010 2011 2012 2013 2014
Extraterritorial Organizations
Households
Other
Health & Social Work
Education
Public Admin & Defense
Trade
Scientific & Technical
Admin & Support
Real Estate
Accomodation & Food
Electricity, gas, steam
ICT
Construction
Manufacturing
Transpotation & Storage
Finance & Insurance
Agriculture, Forestry & Fishing
2,6%
Households as Employers
2,4%
0,7%
9,8%
Other Service Activities
Extraterritorial Organizations
Arts & entertainment
4,2%
Health & Social Work5,6%
Education
Public Admin & Defense
Admin & Support
10,6%
8,7%
8,2%
Mining
Accomodation & Food
Transpotation & Storage
Construction
0,9%
Water supply, sewage
7,6%
ICT
Real Estate
Finance & Insurance
Electricity, gas, steam
Manufacturing
2,4%
5,0%
4,5%
2,0%
4,0%
5,0%
Trade
4,5%
5,0%
2,8%
3,8%
Agriculture
Scientific & Technical
Per Employee Overall Wage Payments by Industry, 2014
oculus prime
Energy
oculus prime
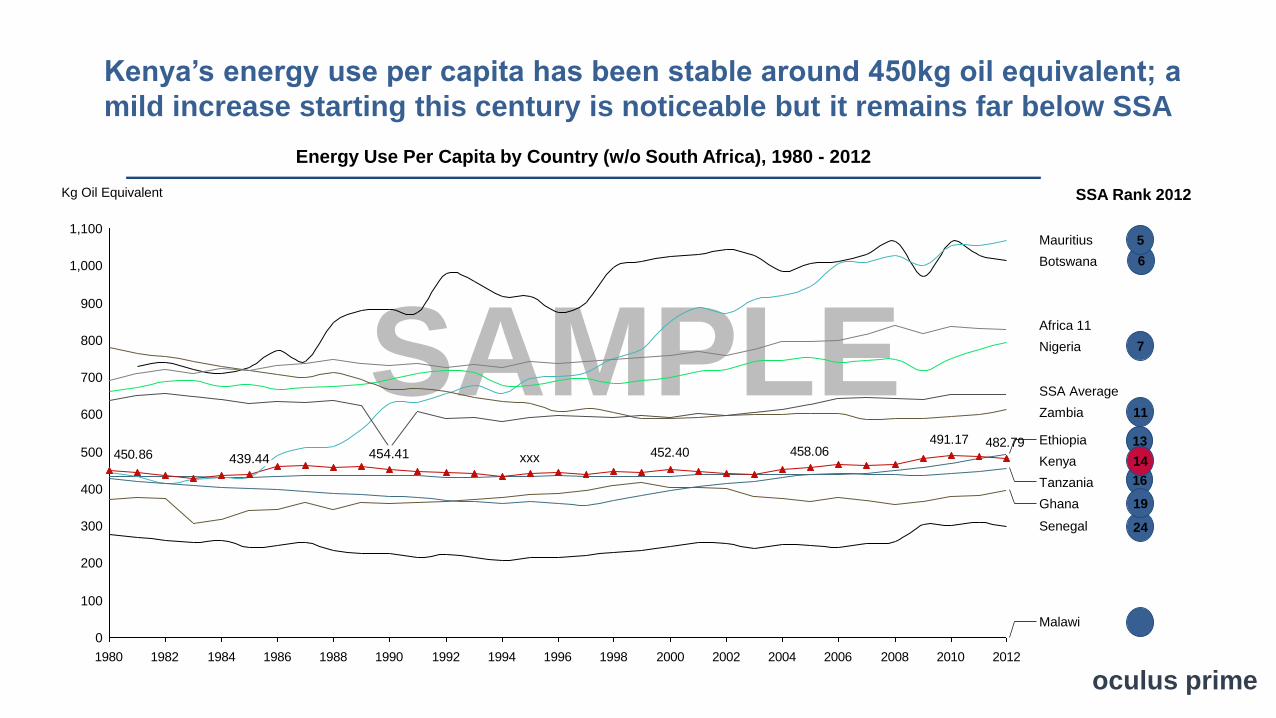
SAMPLE
Kenya’s energy use per capita has been stable around 450kg oil equivalent; a
mild increase starting this century is noticeable but it remains far below SSA
Energy Use Per Capita by Country (w/o South Africa), 1980 - 2012
Kg Oil Equivalent SSA Rank 2012
24
6
16
11
19
5
7
13
14
482.79491.17458.06452.40450.86
1980 1982 1984 1986 1988 1990 1992 1994 1996 1998 2000 2002 2004 2006 2008 2010 2012
600
700
0
100
300
200
400
500
900
800
1,100
1,000
Africa 11
SSA Average
Tanzania
Senegal
Zambia
Mauritius
439.44
Ghana
Botswana
454.41
Nigeria
Ethiopia
Kenyaxxx
Malawi
oculus prime

SAMPLE
In short, Kenya’s GDP per unit energy is low and has been growing at an
average pace relative to her peers in the 21st century
GDP/Unit Energy vs. GDP/Unit Energy Growth in the 21st Century
2.5 = USD at PPP
0.0
0.5
1.0
1.5
2.0
2.5
3.0
3.5
4.0
4.5
5.0
5.5
6.0
6.5
7.0
7.5
17.014.57.5 16.512.5 16.015.52.0 15.014.013.513.010.01.0 10.56.56.04.0 5.53.0 9.5 11.52.51.50.5 8.00.0 8.5 12.011.05.0 9.04.53.5 7.0
GDP/Unit Energy CAGR 2000-2012
2012 GDP/Unit Energy (USD at PPP)
Africa 11
SSA AverageSouth Africa
Zambia
Tanzania
Mauritius
Nigeria
Senegal
Ethiopia
Botswana
Kenya
Ghana
oculus prime

SAMPLE
In short, Kenya’s electricity consumption per capita is very low and, relative
to her peers, suffers average losses due to transmission
Per Capita Electricity Consumption vs. Transmission Losses, 2012
1,000 = kWh per capita
-20
-10
0
10
20
30
40
50
60
70
80
90
100
110
120
130
140
150
160
170
180
0 200 400 600 800 1,000 1,200 1,400 1,600 1,800 2,000 2,200 2,400 2,600 2,800 3,000 3,200 3,400 3,600 3,800 4,000 4,200 4,400 4,600 4,800
2012 Transmission Losses (% Output)
2012 Electricity Consumption (kWh per capita)
SSA Average
Senegal MauritiusNigeria
Kenya Africa 11
Zambia
Tanzania
South Africa
Ethiopia
Ghana
Botswana
oculus prime

SAMPLE
0
5
10
15
20
25
30
35
40
45
50
55
60
65
70
75
80
85
90
95
100
0 5 10 15 20 25 30 35 40 45 50 55 60 65 70 75 80 85 90 95 100
Ethiopia Mauritius
Kenya
Malawi
Ghana
Botswana
% Urban Population
% Total Population
Africa 11
Zambia
SSA Average
South Africa
Tanzania
World
Senegal
Nigeria
0 5 10 15 20 25 30 35 40 45 50 55 60 65 70 75 80 85 90 95 100
Mauritius is the only peer country that had perfect access to electricity in
2012 but Kenya’s access-to-electricity profile is in line with SSA trends
SSA Access to Electricity: % Total vs. % Urban, 2012
oculus prime

SAMPLE6.0
14.0
22.7
72.4Mombasa
Kajiado
Laikipia
Nairobi
Uasin Gishu
Kiambu
Isiolo
Machakos
Kisumu
NyeriKenya Average
Nakuru
Wajir
Nyamira
Kakamega
Elgeyo Marakwet
Migori
Narok
Turkana
Makueni
On-grid Electricity
Tana RiverMandera
Siaya
Tharaka Nithi
BungomaKitui
Homa Bay
Busia
West Pokot
Bomet
SamburuNandiVihiga
Taita TavetaKirinyaga
Murang’a
KilifiLamu
Trans Nzoia
KwaleNyandarua
KerichoMeru
MarsabitKisii
Baringo
Embu
Garissa
4.5
73.0
Kisii
Solar
Mombasa
SiayaMurang’a
NairobiKiambu
NandiMachakos
Kisumu
NyandaruaKirinyaga
Migori
Kilifi
Trans Nzoia
Kakamega
Tharaka Nithi
Isiolo
Busia
Bungoma
Taita Taveta
Homa Bay
Embu
Nyamira
Bomet
Kwale
Uasin Gishu
Meru
Kenya Average
Nakuru
Lamu
Kericho
Laikipia
Vihiga
Makueni
Kajiado
Tana River
Nyeri
NarokGarissa
Elgeyo Marakwet
Baringo
Kitui
ManderaMarsabit
Wajir
West PokotSamburuTurkana
Only 6% of Busia’s households have access to on-grid electricity and a
paltry 0.37% have access to solar powered electricity%
Cost for solar lamps from
M-KOPA ~ Ksh 500 Million
Cost for conventional on-
grid electrification Ksh ??
oculus prime

Infrastructure
oculus prime

SAMPLE
10
40
20
60
100
90
70
50
30
80
0
96.8
+7.1%
Thousands
+9.0%
45.9
+5.5%
7.419.6
16.0
2000
20.2
20101995
39.9
13.0
1985 19901980
10.1
2005
29.1
9.3
28.4
78.3
Kenya’s air carrier departures have grown at a rapid 7.1% p.a. since 1980
and at a faster 9% this century, ranking 2nd only to South Africa in SSA
Kenya’s Registered Air Carrier Departures, 1980- 2014 Registered Air Carrier Departures by Country, 2014
1.6
4.0Senegal
Botswana 8.3
Mauritius
7.7Zambia
Malawi
Ethiopia
Ghana
Kenya
26.0
66.1
Tanzania
96.8
195.7
12.7
South Africa
16.7
Nigeria
69.4
Thousands
1
8
13
19
21
25
32
3
2
5
4
SSA Rank
Sub Saharan Average
SSA Average
Kenya
Africa 11
oculus prime

SAMPLE
Ukraine, about the same size as Kenya (~600K square kilometers), has a
railway density 12x that of Kenya
Railway Density Selected Countries, 2014
1.0 Meter of Railway per Square Kilometer
2,300 2,400
1
2,2002,100
-1
1,2001,100
0
500400 7000 900
21
-100 1,000100 600 800
7
6
200
22
5
23
20
4
3
300
2
Congo, Dem. Rep.
0.2
Botswana
BeninCameroon
Rail Lines, ’000 Km
Country size, ‘000 sq. km.
Ukraine
6.3 Poland
0.6South Korea Africa 11
3.6
3.7
0.4SSA Average
South Africa
Tanzania
Senegal Namibia
Uganda
Sudan
0.3
Swaziland
Zimbabwe
Zambia
1.7
0.5
0.4Nigeria
Mozambique
Mauritania
Malawi Gabon
Madagascar
Kenya0.3
Ghana
0.10.4
EthiopiaMali
Cote d’Ivoire
Congo, Rep.
oculus prime

SAMPLE7.2
7.9
1.9
3.01.8
2.1
+19%
20142010
Kenya has built over 12,000 km of new roads, a growth of ~20%, over 4
years, with the biggest growth being in secondary roads.
Kenya’s Paved Roads
2010 - 2014
7.1 6.3
35.6
46.0
10.4
10.8
63.1
20142010
53.1
+19%
‘000 km
Kenya’s Earth/Gravel Roads
2010 - 2014Kenya’s Total Roads
2010 - 2014
‘000 km
+10%
+58%
+17%
+29%
+4%
-11%12.2 12.9
37.5
49.0
14.3
14.2
2010 2014
xxx
+19%
Primary
Secondary
Urban
-0.6%
+5.7%
+30%
Urban
Secondary
Primary Primary
Secondary
Urban
‘000 km
oculus prime

ICT
oculus prime

SAMPLE
The speed with which Kenyans have taken to the Internet is breathtaking
Ksh
ISPs vs. Users, 2010 - 2014 Internet Users, 2010 - 2014
185
171165
90
57
20122010
+57.9%
+83.3%
+5.9%
201420132011
ISPs
5,000,000 Users
+53.0%
20142013201220112010
21.3
11.3
13.5
26.2
4.8
Users (Millions)
Internet Service Providers, 2010 - 2014
4,772,446
0 50 100 150 200 250
15
5
10
0
30
25
20
Internet Users (Millions)
21,273,738
2010
ISPs
2013
13,541,868
2012
11,334,694
2011
26,163,5602014
oculus prime

SAMPLE
Mobile money has grown at 34% CAGR since 2010; mobile money users
constitute 77.4% of all mobile users and the amounts involved are staggering!Mobile Money, 2010 - 2014 Mobile Money Transfers, 2010 - 2014Mobile Money Deposits, 2010 - 2014
566
811
1,033
1,269
391
2,372
0
5
10
15
20
25
30
35
40
45
50
55
60
65
70
75
80
85
800
1,200
2,200
1,600
1,800
2,000
1,000
200
0
1,400
400
2,400
600
+34%
+45%
2012 2014
+27%
43
77
+23%
2013
732
2010 2011
+43%
%
Mobile Money Trasfers
MM Users % Total Mobile
Mobile Money Deposits
253
241
217
188
120116
105
93
67
44403331
23
260
240
220
200
180
140
0
60
80
40
100
20
160
120
2013
% M2
% L
2010
% M1
2011
% GDP
% M3
+100%
20142012
127
136131
114
91
686463
55
45
36
24221815
12
40
0
10
60
20
80
70
30
50
130
140
110
100
90
120
%M3
% GDP
+100%
2014
%M2
20122010
%L
%M1
20132011
Billions, Ksh
% %
oculus prime

Tourism
oculus prime
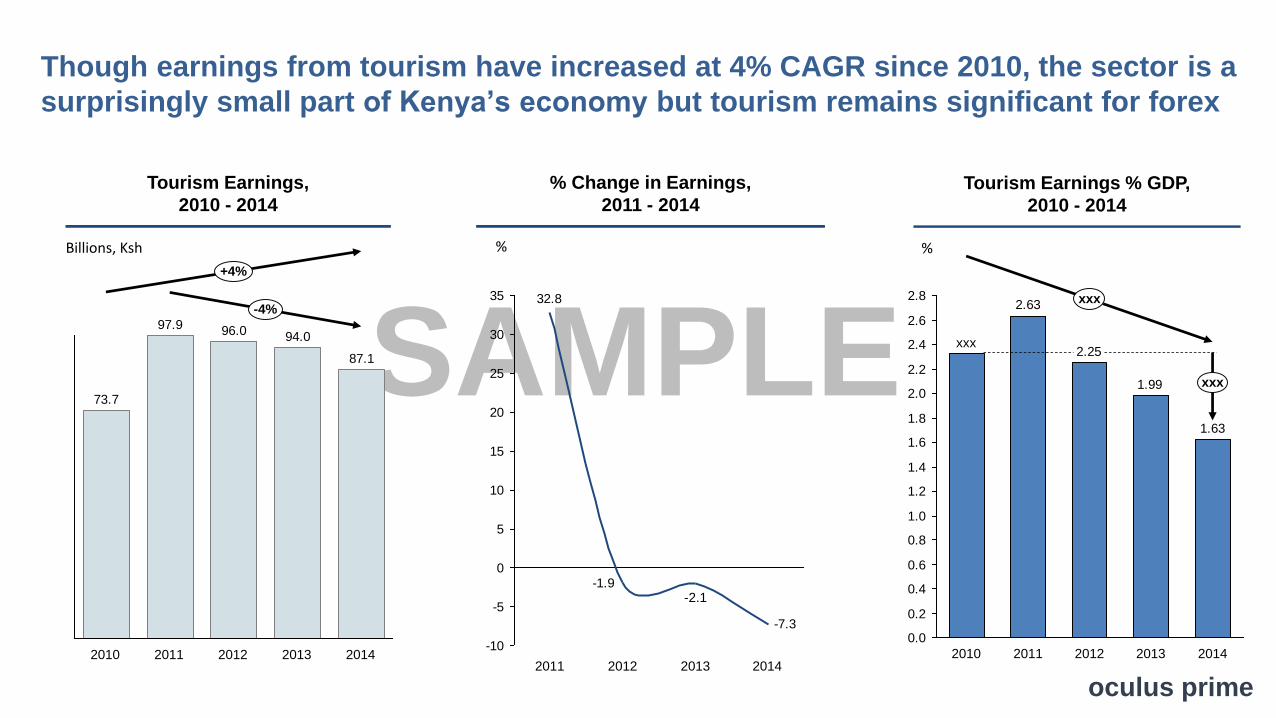
SAMPLE
Though earnings from tourism have increased at 4% CAGR since 2010, the sector is a
surprisingly small part of Kenya’s economy but tourism remains significant for forex
87.1
94.096.097.9
73.7
201320112010 2012
-4%
2014
+4%
Tourism Earnings,
2010 - 2014
% Change in Earnings,
2011 - 2014
-7.3
-1.9
32.8
-10
-5
0
5
10
15
20
25
30
35
20142011 2012 2013
-2.1
1.63
1.99
2.25
2.63
0.0
0.2
0.4
0.6
0.8
1.0
1.2
1.4
1.6
1.8
2.0
2.2
2.4
2.6
2.8
2011
xxx
xxx
xxx
2013 201420122010
Tourism Earnings % GDP,
2010 - 2014
%%Billions, Ksh
oculus prime

SAMPLE
Holiday travel to Kenya looks more sensitive in absolute terms but on a
percentage basis business travel is more sensitive to exogenous shocks
Y-o-Y Quarterly Change, 2011 - 2014
Thousands
-104
9
-88
109
42
-20
4
-23
-12
4
-120
-100
-80
-60
-40
-20
0
20
40
60
80
100
120
Q4 Q3Q2Q1 Q4Q3Q2Q2 Q4Q3Q1 Q1Q3Q1 Q4Q2
Holiday Travel
Business Travel
-31
-21
36
16
-36
9
-33
-19
7
-40
-35
-30
-25
-20
-15
-10
-5
0
5
10
15
20
25
30
35
40
Q4Q3Q4Q3 Q2Q1
3
Q1Q3 Q2 Q3 Q2Q4 Q1Q4Q2Q1
% Business Travel
% Holiday Travel
% Y-o-Y Quarterly Change, 2011 - 2014
%
2011 2012 2013 2011 2012 2013 20142014
• Pre-lection violence feared
• Rising cost of flying
• Westgate effect
• Ebola effect
• Pre-lection violence feared
• Rising cost of flying
• Westgate effect
• Ebola effect
oculus prime

SAMPLE
It is a curious thing as to why Germans don’t do more business in
Kenya and why Other Asians (Chinese) don’t vaction more in Kenya
Percentage breakdown of visitors by Country, 2014
oculus prime
21
22
20
19
18
16
15
9
85.3575.85 85.20
17
85.00 85.0575.90 75.9575.60 85.100.00 85.3075.55 85.2562.95 64.00 85.15
23
0
85.40
12
14
13
25
11
10
24
Business, % of total
Oceania
RoW
Other Asia
Holiday, % of total
India
Other Africa
USA
Tanzania
Other Europe
Israel
Uganda
Canada
Italy France
Germany
Scandinavia
UK
Switzerland
Japan

SAMPLE
Germans and Italians come almost exclusively for the beaches while the
Brits and the French also enjoy spending time in NairobiGermans, 2014
Coast
91%
Nairobi
4%
Other
2%
Safaris3%
Safaris
Other
4%6%
Coast
76%
14%
Nairobi
50%
Safaris 30%11%
Other
Coast
Nairobi
9%
Other
13%
31%
40%
16%
Coast
Safaris
Nairobi
Other
Safaris6%
58%
Coast
14%
Nairobi
22%
Other
5%
11%
65%
19%
Safaris Nairobi
Coast
The Swiss, 2014 Brits, 2014
French, 2014 Scandinavians, 2014 Other Europeans, 2014
14%
NairobiSafaris
Coast
7%
Other
74%
4%
3%
Coast
84%
8%5%
NairobiOther
Safaris
All Europeans, 2014
Italians, 2014
oculus prime
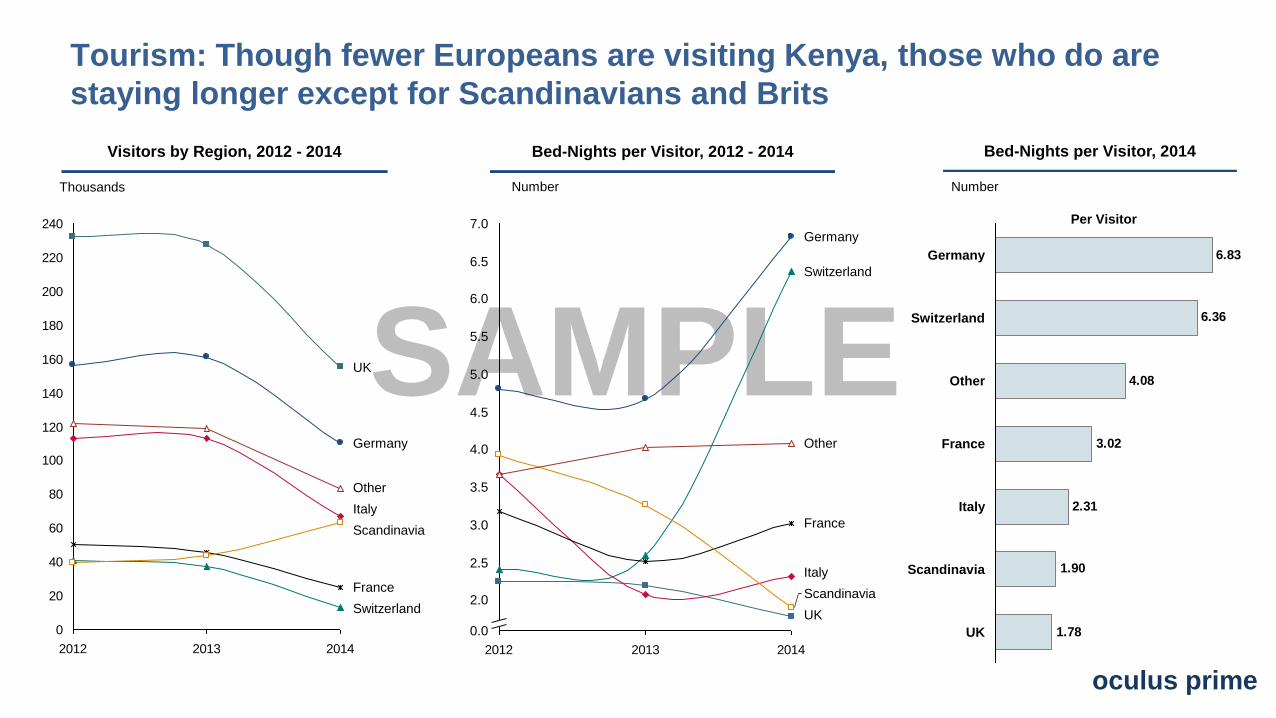
SAMPLE
Tourism: Though fewer Europeans are visiting Kenya, those who do are
staying longer except for Scandinavians and Brits
Thousands
Visitors by Region, 2012 - 2014
2012 2013 2014
5.5
3.5
2.5
2.0
4.0
3.0
0.0
6.5
4.5
5.0
7.0
6.0
Germany
Switzerland
UK
Other
Scandinavia
France
Italy
Bed-Nights per Visitor, 2012 - 2014
1.78
1.90
2.31
3.02
4.08
6.36
6.83
Per Visitor
UK
Scandinavia
Italy
France
Switzerland
Other
Germany
0
20
40
60
80
100
120
140
160
180
200
220
240
2012 2013 2014
Other
Italy
UK
Scandinavia
Germany
France
Switzerland
Bed-Nights per Visitor, 2014
Number Number
oculus prime
Population
oculus prime

SAMPLE40
25
15
10
5
30
55
50
45
35
20
0
Millions
2015
13.9
18.2
20.8
46.1
2005
52.2
31.1
2010 2020
23.7
+2.6%
2000
15.9
35.3
40.3
Kenya’s population has had a smooth and steady growth story over the
last 15 years, ranking sixth in SSA
Kenya’s Total Population, 2000 - 2020 Total Population by Country, 2015
Billions, 2014 USD
Mauritius
15.1
16.2
2.3
1.3
Botswana
Senegal
Zambia
182.2
Ghana
55.0South Africa
Ethiopia
46.1
Tanzania
99.4
Malawi
27.4
Kenya
17.2
53.5
Nigeria 1
10
18
19
21
37
43
2
6
5
4
SSA Rank
Sub Saharan Average
+2.7%Africa 11
Kenya
SSA Average
oculus prime

SAMPLE
1,6 3,43,21,4 3,62,01,0 1,20,80,60,20,0 1,8 2,8 3,02,62,42,20,4
80
90
35
50
1015202530
5055
6560
7075
85
95100
4045
But Kenya enjoys a young and virtually perfectly symmetrical demography
1,42,8 2,4 2,02,6 1,21,8 0,83,0 1,0 0,43,23,43,8 3,6 2,2 1,6 0,6 0,2 0,0
Population (M)
Male Female
Kenya’s Age Pyramid in 2015
Total Population: 46.05M
Fertility rate: 3.9
Life expectancy: 63 years
oculus prime

SAMPLE
Unlike Botswana, Mauritius and South Africa that are older populations
Botswana Ethiopia Ghana Kenya
Mauritius SSA AverageMalawi
200.000 0
Male
200.0000
15
6570
10
90
25
758085
95
5
60
30
0
40455055
20
35
100
Female
010,000 5,000 0 10,0005,000
50
6570
15
5
30
0
10
2025
354045
5560
90
75
100
8085
95
0 2.000 4.000
10
2530
05
1520
35
90
55
70
6065
100
50
40
75
95
45
8085
4.000 2.000 0 2.0004.000 0 4.0000 2.000
80
90
60
75
30
65
40
85
35
100
45
25
5055
70
95
5101520
0
1.0002.000 0 1.000 2.0000
5
80
100
30
20
45
60
15
65
85
75
90
25
70
55
10
50
40
0
35
95
60 40 20 0 6020 400
0
25
10
95
30
50
20
35
7570
45
5
8590
15
5560
80
100
65
40
2.0001.0000
65
45
25
35
20
80
15
75
90
40
30
05
50
10
70
85
5560
95100
2.000 1.000 0 oculus prime

SAMPLE
Not only does Kenya enjoy near perfect gender parity, several population
indicators are also moving in the right direction
Population Growth Rate, 1980 - 2014Kenya Population, 1980 – 2014
50
20
10
40
0
30
1990
16
+3.1%
46
201020001980
Live births per woman
2.7
0
1
2
3
4
2000
1.2
1980 20101990
0
2
4
6
8
4.4
20102000
2.5
19901980
62
0
20
40
60
80
1980 1990 2000 2010
Life Expectancy, 1980 - 2014Fertility Rate, 1980 – 2014
%Millions
Years
109
0
50
100
150
200
250
71
-35%
2010200019901980
World
SSA
Kenya
< 5 Year Old Mortality, 1980 - 2014
8.2
11.5
0
5
10
15
20
-29%
1980 1990 20102000
Overall Mortality, 1980 - 2014
Deaths per 1000 people
Per 1000 live births
oculus prime

SAMPLE
The age structure of Kenya’s population stands out because the proportion of
elderly Kenyans is smaller in 2015 than it was in 1980
Botswana Ethiopia Ghana Kenya
Mauritius SSA AverageMalawi
20%
0%
100%
80%
70%
60%
90%
40%
30%
50%
10%
2020201019901980 2000
1003.6%2.5%
100
0-14
15-64
65+
70%
20%
90%
80%
60%
50%
40%
100%
30%
10%
0%
100
2020
100
201020001990
3.2%
1980
3.5% 100%
60%
80%
70%
90%
50%
40%
0%
20%
10%
30%
20202000
1002.6%
100
2010
3.4%
19901980
55.3%
41.9%50.0%
47.0%
30%
10%
70%
50%
20%
80%
0%
100%
60%
90%
40%
20202000
2.8%100
20101980
100
1990
3.0%
100%
0%
20%
90%
70%
60%
50%
40%
30%
10%
80%
2.4%
2020
1003.4%
20102000
100
19901980
19.3%
35.6%
71.1%
60.7%
9.6%90%
70%
40%
30%
100%
80%
60%
50%
10%
20%
0%
2020
100
20001980 20101990
1003.6%
80%
60%
10%
20%
30%
100%
40%
70%
50%
90%
0%
3.3%100 100
3.4%
2000 2010 202019901980 oculus prime

SAMPLE
In short, Kenya’s population is mid-sized and the proportion that is urban is
significantly lower than SSA and her peer countries
Total Population vs. % Urban, 2015
= Total Population, Millions25
0
5
10
15
20
25
30
35
40
45
50
55
60
65
70
80555 10 3530 60 7525 12570 13515 85 1205045200 6540 1901101009590 145 160 195185155 180175170165115105 130 140 150
SSA Average Africa 11
South Africa
Senegal
Tanzania
Nigeria
Mauritius
Zambia
Kenya
Malawi
Botswana
% Urban, 2015
2015 Total Population (Millions)
Ghana
Ethiopia
oculus prime

SAMPLE
Busia experiences significant gender imbalances at the onset of adulthood.
There are around 25% more adult women than men. The men leave and do not
come back.
Busia’s Population Age Sturcture, 2010
Female (Kenya)
Male (Kenya)
Female
Male
Age Groups, years
oculus prime
5--9 15--19 35--3925--2920--24 30--340--4
+22%
+24%
10--14
-3%
0%
+1%
0%
+28%
75--7965--6955--5950--5445--4940--44
+24%
+28%+26%
+20%
+33%
+27%
+28%
+22%+29%
+28%
80+70--7460--64

Education
oculus prime
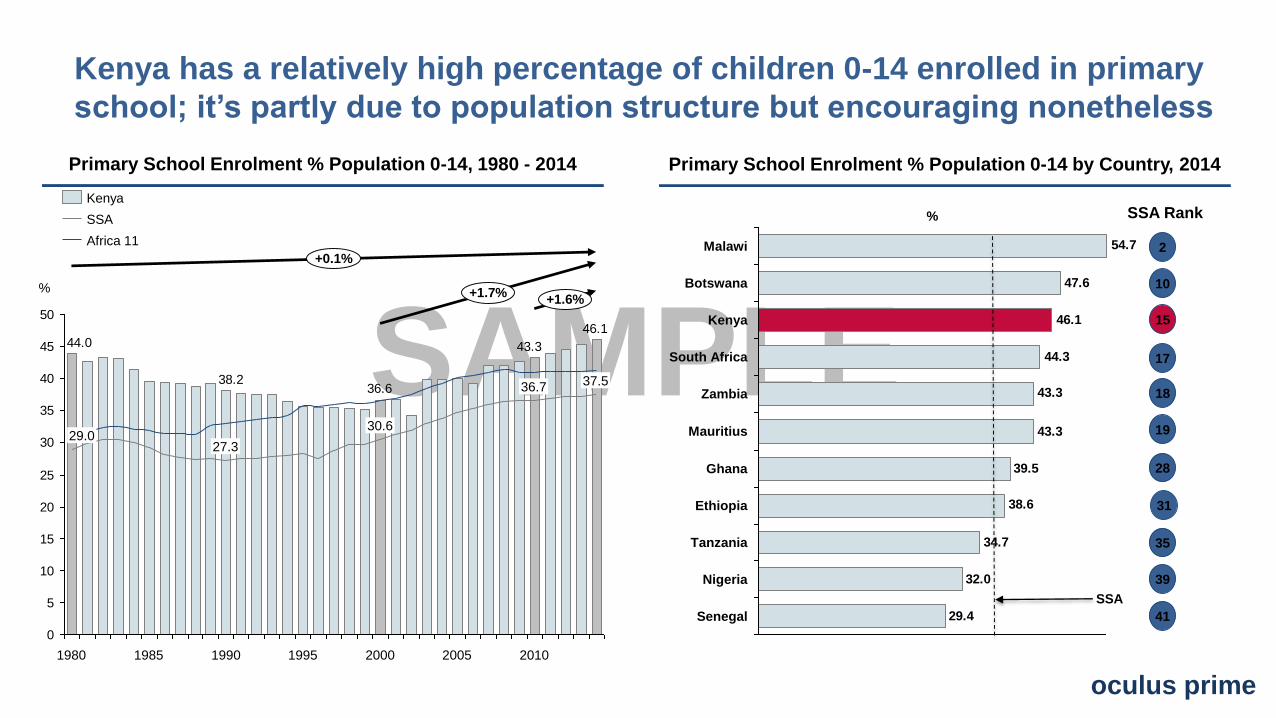
SAMPLE46.1
43.3
36.638.2
44.0
0
5
10
15
20
25
30
35
40
45
50
37.5
2010
%+1.6%
+1.7%
+0.1%
1980
27.3
20001985
30.6
20051995
36.7
1990
29.0
Kenya has a relatively high percentage of children 0-14 enrolled in primary
school; it’s partly due to population structure but encouraging nonetheless
Primary School Enrolment % Population 0-14, 1980 - 2014 Primary School Enrolment % Population 0-14 by Country, 2014
29.4
32.0
34.7
38.6
39.5
43.3
43.3
44.3
46.1
47.6
54.7
Tanzania
Ethiopia
Senegal
%
Nigeria
Ghana
Mauritius
Zambia
Kenya
South Africa
Botswana
Malawi 2
19
28
31
35
39
41
10
15
17
18
SSA Rank
SSA
Africa 11
Kenya
SSA
oculus prime

SAMPLE
Enrolment indices are up and student-teacher ratios are down which is promising,
but the downward trend of spending on education bears watching
Students per Teacher
5052
5757
29
323231
0
5
10
15
20
25
30
35
40
45
50
55
60
-12.3%
-6.5%
201420122011 2013
103.5105.0106.4106.7
88.288.188.188.0
58.254.3
50.547.8 48.3
33.932.0
73.671.6
69.467.0
0
10
20
30
40
50
60
70
80
90
100
110
2011 20132012 2014
38.5
Student-Teacher Ratio, 2011 - 2014 Education Budget, 2011 - 2014 GER & NER Indices, 2011 - 2014
16.417.217.820.2
73.4
68.571.3
0
5
10
15
20
25
30
35
40
45
50
55
60
65
70
75
20132011 2014
60.3
-19%
-15%
2012
% %
Secondary
Primary
Teachers Pay, % MoE Budget
MoE Budget % Total Budget
Pre-primary GER
Primary GER
Secondary GER
Primary NER
Secondary NER
oculus prime

SAMPLE
Boys in Kenya still have better access to education at universities and
technical institutions but overall Kenyan education enjoys gender parity
:
%
Primary School, 2014
50.8%Girls 49.2% Boys
44.8% Boys
55.2%Girls
Girls 48.0%52.0% Boys
60.6%
Girls39.4%
Boys
Boys51.4%Girls 48.6%
Boys
Girls
58.5%
41.5%
Secondary School, 2014 University, 2014
Teacher Training, 2014 Total, 2014Teachnical Institutions, 2014
oculus prime

SAMPLE
There were about as many people enrolled in pre-employment education as there
were wage earners in 2011 but pre-employment educational enrolment grew 2.6x
faster than wage employment between 2011 and 2014
Millions
Pre-Employment Educational Enrolment, 2011 - 2014 Wage Employment by Industry, 2011 - 2014
2.5
2.0
1.5
0.0
1.0
3.0
0.5
+11.5%
20142013
2.32
xxx
2011
2.31
2.12
0.15
University
Technical Insitutions
Teacher training
Secondary School
2.94
0.04
2012
0.13
0.360.250.22
2.10
1.77
1.91
0.100.03
0.44
0.030.15
0.04
2011 2012 2013 2014
1.8
2.2
1.2
0.6
0.4
2.4
1.4
1.6
0.8
0.0
1.0
0.2
2.0
Manufacturing
+4.4%
Utilities
Total
ICT
2.37
Business Services
Government
Personal Services
Trade Services
Transportation
Construction
Mining
Agriculture
2.152.08
2.28
Millions
oculus prime

Health
oculus prime

SAMPLE77.7
72.073.6
82.0
0
5
10
15
20
25
30
35
40
45
50
55
60
65
70
75
80
85
% Years of Life Lost
2010
-12%
20052000
In 2012, 72% of years of life lost (YLL) in Kenya were due to treatable and/or preventable
communicable diseases, highlighting the severity of Kenya’s basic health challenges
Kenya’s Years of Life Lost – Communicable Disease, 2000 - 2012 Years of Life Lost – Communicable Disease by Country, 2012
11
62
63
66
67
68
69
72
73
75
76
Ethiopia
Tanzania
Nigeria
Senegal
Mauritius
Zambia
% Years of Life Lost
Kenya
Botswana
South Africa
Ghana
Malawi 4
32
27
36
38
43
46
13
16
7
35
SSA Rank
SSA
Kenya
SSA Average
Africa 11
oculus prime
World Average
32%
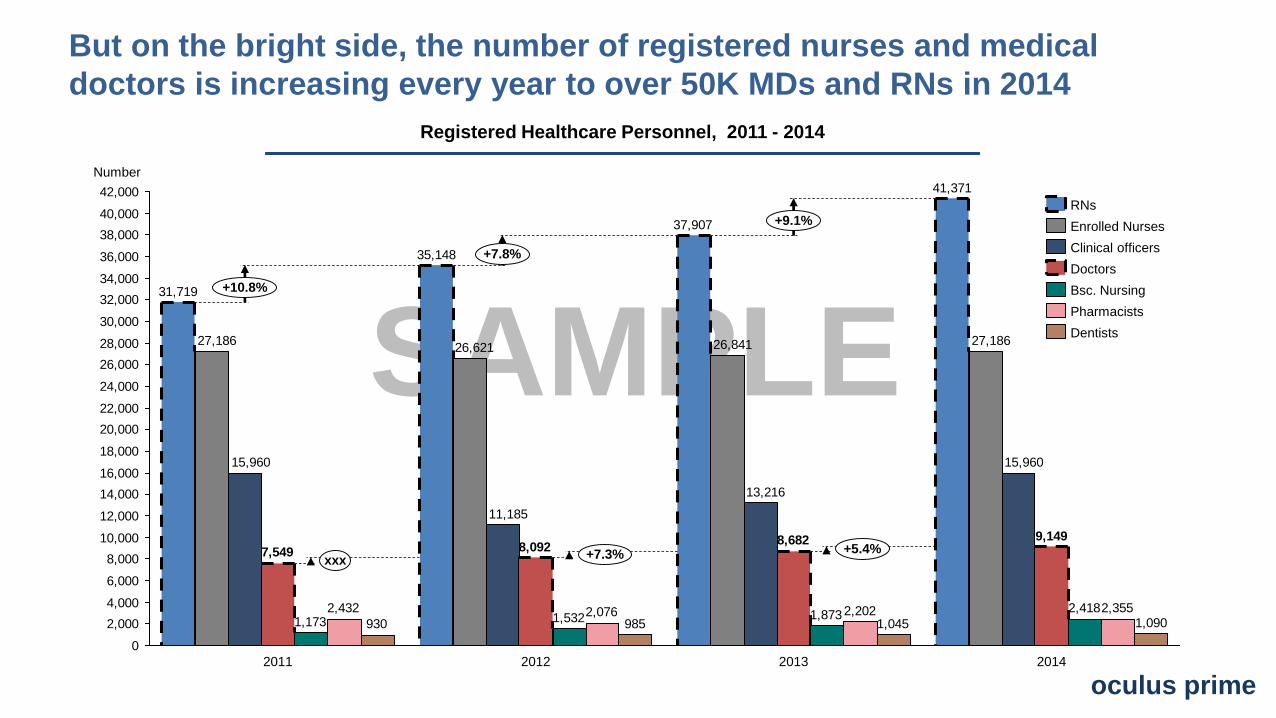
SAMPLE31,719
41,371
37,907
35,148
27,18626,84126,62127,186
15,960
13,216
11,185
15,960
8,0928,682 9,149
7,549
2,4181,8731,5321,173
2,3552,2022,0762,4321,0901,045985930
0
2,000
4,000
6,000
8,000
10,000
12,000
14,000
16,000
18,000
20,000
22,000
24,000
26,000
28,000
30,000
32,000
34,000
36,000
38,000
40,000
42,000
+10.8%
2014
xxx
2012
+7.8%
20132011
+9.1%
+7.3% +5.4%
But on the bright side, the number of registered nurses and medical
doctors is increasing every year to over 50K MDs and RNs in 2014
Number
Bsc. Nursing
Doctors
Dentists
Pharmacists
Enrolled Nurses
RNs
Clinical officers
oculus prime
Registered Healthcare Personnel, 2011 - 2014

SAMPLE
With ~70% of all registered healthcare personnel, nursing remains the
backbone of healthcare engagement in Kenya
% of Total Medics
% Breakdown of Healthcare Personnel, 2011 - 2014
13.1% 14.4%
41.6%41.3%41.0%36.5%
27.3%29.2%31.1%
31.3%
16.0%18.4%
9.2%9.5%9.4%8.7%
1.1%1.1%1.2%1.1%
0%
5%
10%
15%
20%
25%
30%
35%
40%
45%
50%
55%
60%
65%
70%
75%
80%
85%
90%
95%
100%
2014
2.0% 2.4%
2013
2.4%2.4%
2012
1.8%
2.4%
1.3%
2011
2.8%
Enrolled Nurses
Bsc. Nursing
Dentists
Pharmacists
RNs
Clinical officers
Doctors
21212019
3
568
6
96
91
86
37
3228
25
0
10
20
30
40
50
60
70
80
90
100
2013 20142012
4 54 3
83
2
3
2011
2
Enrolled Nurses
Bsc Nursing
Clinical officers
Pharmacists
RNs
Dentists
Doctors
Number per 100,000 people
Healthcare Personnel per 100,000 people, 2011 - 2014
oculus prime

Personal Wealth
oculus prime

SAMPLE
180.0
97.071.054.0
498.5453.2
0
100
200
300
400
500
600
700
800
900
1,000
1,100
1,200
USD
1,120.0+6.0%
2015
+13.2%
603.5
2000
+8.4%
285.0
20102005
270.0
120.0
960.1
Debt wealth of the average Kenyan adult has grown strongly this century and
especially strongly this decade but still lags SSA by a very wide margin
Kenya’s Individual Debt Wealth, 2000 - 2015 Individual Debt Wealth by Country, 2015
4
20
40
118
118
142
180
313
798
4,923
5,664
USD
Ethiopia
Senegal
Malawi
Mauritius
Kenya
Zambia
Nigeria
Tanzania
Ghana
Botswana
South Africa
1
18
19
20
32
40
46
2
15
11
6
SSA Rank
Sub Saharan Average
Kenya SSA Average Africa 11
oculus prime
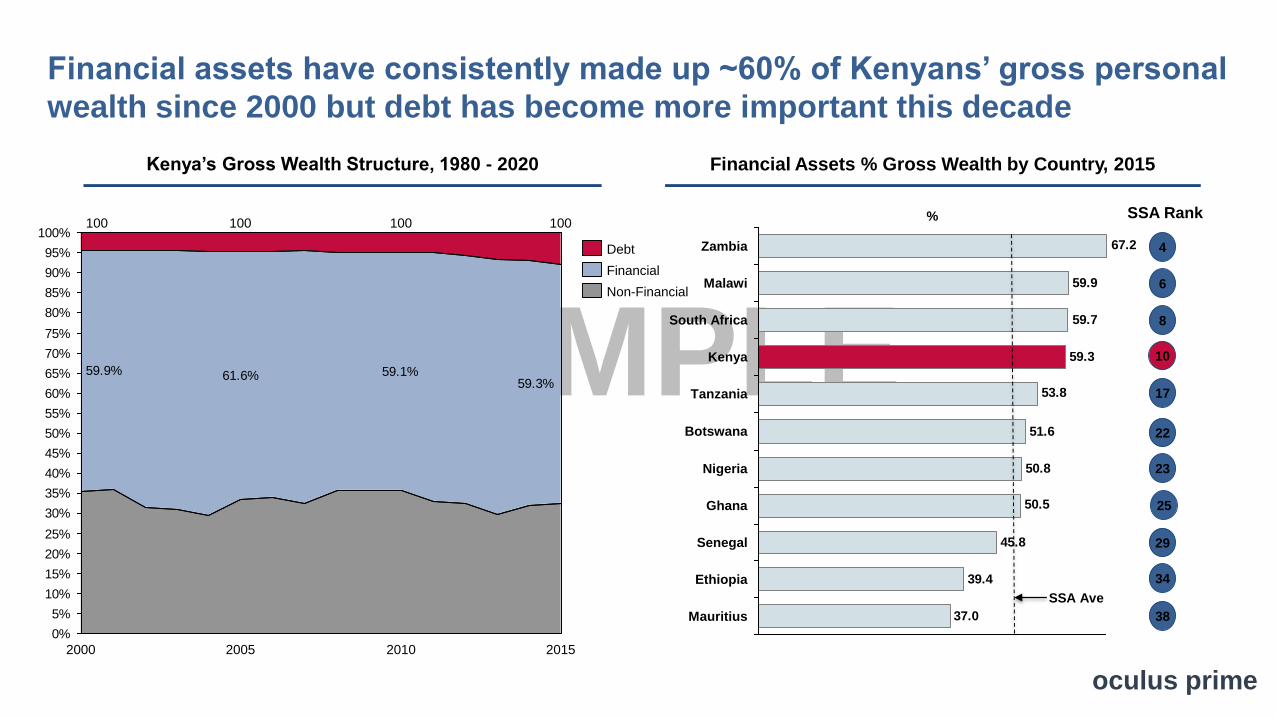
SAMPLE
Financial assets have consistently made up ~60% of Kenyans’ gross personal
wealth since 2000 but debt has become more important this decade
Kenya’s Gross Wealth Structure, 1980 - 2020 Financial Assets % Gross Wealth by Country, 2015
37.0
39.4
45.8
50.5
50.8
51.6
53.8
59.3
59.7
59.9
67.2
Ethiopia
%
Mauritius
Ghana
Malawi
South Africa
Kenya
Tanzania
Senegal
Nigeria
Zambia
Botswana
4
34
22
25
29
17
38
6
10
23
8
SSA Rank
SSA Ave
61.6%59.3%
59.1%59.9%
0%
5%
10%
15%
20%
25%
30%
35%
40%
45%
50%
55%
60%
65%
70%
75%
80%
85%
90%
95%
100%
2000
100
20152010
100
2005
100 100
Financial
Debt
Non-Financial
oculus prime

SAMPLE84.2%
99.9% 99.6% 96.9%
47.5%
97.1% 95.9%
72.6%
99.4% 97.7%
71.0%
14.7%
47.5%
4.1%
24.3%21.0%
7.3%0.2%4.8% 0.2%0.2%
Zambia
2.3%
100100
Senegal
100
2.9%
100100%
World
0.7%
100
TanzaniaSouth Africa
0.6%
Ethiopia
100100 100
Ghana
0.1%1.1% 3.1%
100100
Kenya
100
Malawi Mauritius Nigeria
2.7%0.4%
100
Botswana
If we define “middle class” as $10,000+ (at PPP in Kenya = $22,663) then
3.1% of Kenyan adults are middle class…
Net Wealth Bands by Country, 2015
<10K
1M+
10K-100K
100K-1M
oculus prime

SAMPLE
Which means about 671,367 Kenyan adults are middle class; assuming a fertility
rate of 3.9, then perhaps 4 million Kenyans or ~8.7% of Kenyans are “middle class”
Net Wealth Bands by Country, 2015
Adults, Millions
14.0
6.3
44.9
7.8
7.6
0.7
23.1
<10K
xxx
10K-100K 1M+100K-1M
Mauritius
Ghana
Zambia
Malawi
Kenya
Tanzania
Senegal
Botswana
South Africa
Ethiopia
0.0
Nigeria
oculus prime

Financial Inclusion
oculus prime
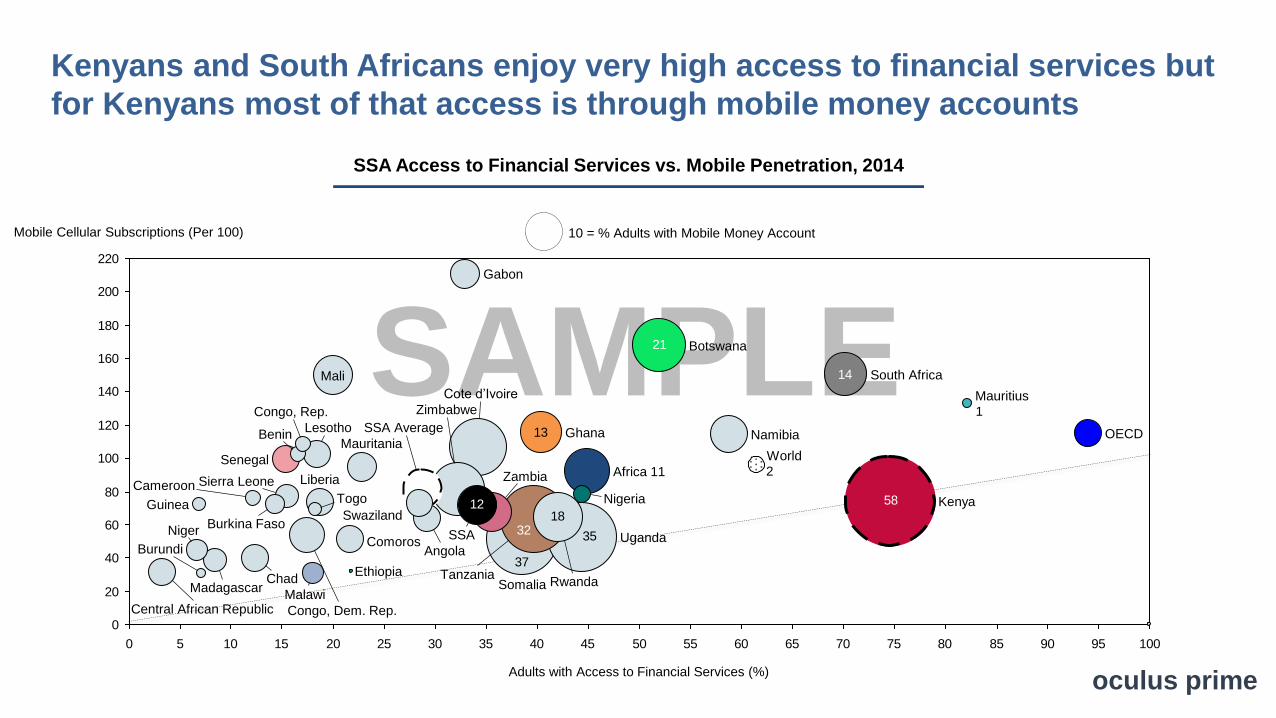
SAMPLE
Kenyans and South Africans enjoy very high access to financial services but
for Kenyans most of that access is through mobile money accounts
oculus prime
SSA Access to Financial Services vs. Mobile Penetration, 2014
10 = % Adults with Mobile Money Account
2
13
35
14
37
1
58
21
12
3218
0
20
40
60
80
100
120
140
160
180
200
220
0 5 10 15 20 25 30 35 40 45 50 55 60 65 70 75 80 85 90 95 100
Gabon
Burundi
Congo, Dem. Rep.Central African Republic
Benin
Mobile Cellular Subscriptions (Per 100)
Adults with Access to Financial Services (%)
SSA
OECD
World
NigeriaTogo
Tanzania
Swaziland
South Africa
Somalia
Sierra Leone
Senegal
Uganda
Zimbabwe
Zambia
SSA Average
Mauritania
RwandaMalawi
Madagascar
Liberia
Lesotho
Niger
Namibia
Mauritius
Mali
KenyaGuinea
Ghana
CameroonAfrica 11
Botswana
Cote d’Ivoire
Burkina Faso
Ethiopia
Comoros
Chad
Angola
Congo, Rep.

SAMPLE
0
5
10
15
20
25
30
35
40
45
50
55
60
5 150 10 45 9535 90 1008575 8040 55 65302520 50 60 70
SSA Average
Nigeria
Ghana
Uganda
World
Zambia
Tanzania
South Africa
Somalia
Africa 11
Senegal
Adults with a Mobile Financial Account (%)
Namibia
Zimbabwe
SSA
MauritiusMalawi
Rwanda
Ethiopia
Cote d’Ivoire
Botswana
Adults with Access to Financial Services (%)
Kenya
Gabon
In East Africa more than half of all adults with access to financial services
get it through a mobile platform; in Kenya fully 78% are “mobile dependent”
Access to Financial Services vs. Mobile Financial Penetration, 2014
oculus prime
More than ½ of all Access toFinancial Services is Mobile
0.1
1.1
5.2
20.5
21.2
32.1
34.0
39.9
40.1
78.2
81.3
Ethiopia
%
Nigeria
Malawi
Mauritius
South Africa
Ghana
Zambia
Tanzania
Botswana
Kenya
Senegal
2
22
30
31
32Sub Saharan Average
16
20
14
15
13
4
Mobile Financial Account % Financial Account, 2014

Food Security
oculus prime

SAMPLE
0
5
10
15
20
25
30
35
40
45
50
2010
-1.1%
28.8
-2.4%
20052000 2015
35.9
19951990
% Population
-2.0%
25.5
39.4
Food inadequacy in Kenya has decreased with increasing rapidity since 1991, but
in 2015 nearly 1/3rd of Kenya’s population still experienced food inadequacy
Kenya’s Prevalence of Food Inadequacy, 1991- 2015 Prevalence of Food Inadequacy by Country, 2015
5.4
9.8
11.8
16.7
28.1
32.1
35.9
39.7
41.3
54.6
Botswana
South Africa
Ghana
% Population
<5%
Mauritius
Nigeria
Senegal
Malawi
Kenya
Tanzania
Ethiopia
Zambia 3
19
27
32
33
38
39
10
16
8
13
SSA Rank
SSA Average
Africa 11
Kenya
oculus prime

SAMPLE
And increasing reliance on imports for cereals is concerning
Cereal Imports Dependency Ratio, 1992 - 2011
% SSA Rank 2011
42
5
34
23
43
41
1
17
27
19
34.30
20.60
24.70
-10
0
10
20
30
40
50
60
70
80
90
100
1992 1993 1994 1995 1996 1997 1998 1999 2000 2001 2002 2003 2004 2005 2006 2007 2008 2009 2010 2011 2012
Senegal
Tanzania
Zambia
Nigeria
Ghana
Mauritius
Africa 11
Malawi
Kenya
Botswana
Ethiopia12.00
South Africa
oculus prime
33

Cost of Living
oculus prime

SAMPLE
0.69
0.39
0.45
0.52
0.59
0.62
0.62
0.63
0.68
0.80
0.83
1.46
USD
Zambia
Africa 11
Malawi
Nigeria
Kenya
Tanzania
S. Africa
Mauritius
Ethiopia
Ghana
Botswana
Senegal
The cost of living: Apart from domestic beer, the cost of dining in Kenya
is average or below average relative to her peers Value Restaurant Mid-range (3 Course Meal) “McMeal” Domestic Beer, 0.5L
Cappuccino (Regular) Coke/Pepsi, 0.33LImported Beer, 0.33L
4.42
2.71
3.00
3.82
4.16
4.29
4.76
5.39
5.55
5.96
6.00
Africa 11
USD
Nigeria
Kenya
Malawi
Ethiopia
xxx
Mauritius
S. Africa
Senegal
Ghana
Botswana
Tanzania
Zambia
29.7
20.0
23.6
23.8
24.1
26.6
27.8
32.4
32.6
41.6
50.0
USD
Africa 11
Zambia
Kenya
Malawi
Ethiopia
Mauritius
Senegal
Botswana
Tanzania
Nigeria
Ghana
S. Africa
xxx
6.36
2.98
3.59
4.29
5.00
5.55
7.00
7.53
8.20
8.32
Kenya
Malawi
Botswana
Senegal
USD
xxx
Mauritius
Ethiopia
Ghana
Africa 11
S. Africa
Zambia
Nigeria
Tanzania
12.66
1.60
1.00
1.19
1.25
1.31
1.35
1.51
1.52
1.85
1.96
2.15
2.50
Africa 11
Malawi
Botswana
USD
Kenya
Ethiopia
S. Africa
Tanzania
Nigeria
Zambia
Ghana
Mauritius
Senegal
2.22
1.33
1.49
1.74
2.00
2.01
2.42
2.44
2.50
2.59
2.91
3.00
Botswana
S. Africa
Tanzania
Africa 11
USD
Mauritius
Ethiopia
Zambia
Nigeria
Kenya
Senegal
Malawi
Ghana
2.08
0.95
1.17
1.74
1.81
1.97
1.97
2.08
2.30
2.61
2.98
3.30
USD
Africa 11
Ethiopia
S. Africa
Zambia
Botswana
Tanzania
Malawi
Senegal
Nigeria
Kenya
Ghana
Mauritius
0.53
0.29
0.36
0.44
0.46
0.47
0.50
0.50
0.54
0.56
0.69
1.01
USD
Africa 11
Zambia
Nigeria
Malawi
S. Africa
Kenya
Mauritius
Ethiopia
Ghana
Botswana
Senegal
Tanzania
Bottled Water, 0.33L
oculus prime

And there is much much more..........
Andrew L. Owiti
oculus prime, Ltd+254 (0) 708 377 699
+1 703 981 4201
oculus prime