an economic analysis of six dairy digester systems in ...€¦ · this study examined the economic...
TRANSCRIPT

E n e r g y R e s e a r c h a n d D e v e l o p m e n t D i v i s i o n F I N A L P R O J E C T R E P O R T
AN ECONOMIC ANALYSIS OF SIX DAIRY DIGESTER SYSTEMS IN CALIFORNIA Volume 2
MARCH 2013 CE C-500-2014-001-V2
Prepared for: California Energy Commission Prepared by: Summers Consulting, LLC
PREPARED BY: Primary Author(s): Sean Hurley Matthew Summers Summers Consulting, LLC PO Box 5742 Auburn, CA 95604 Contract Number: PIR-08-041 Prepared for: California Energy Commission Abolghasem Edalati Contract Manager Linda Spiegel Office Manager Energy Generation Research Office Laurie ten Hope Deputy Director ENERGY RESEARCH AND DEVELOPMENT DIVISION Robert P. Oglesby Executive Director
DISCLAIMER This report was prepared as the result of work sponsored by the California Energy Commission. It does not necessarily represent the views of the Energy Commission, its employees or the State of California. The Energy Commission, the State of California, its employees, contractors and subcontractors make no warranty, express or implied, and assume no legal liability for the information in this report; nor does any party represent that the uses of this information will not infringe upon privately owned rights. This report has not been approved or disapproved by the California Energy Commission nor has the California Energy Commission passed upon the accuracy or adequacy of the information in this report.

ACKNOWLEDGEMENTS
The following entities were critical in developing and reviewing the information in this report.
• The six cooperating dairy facilities and their owners and digester operations staff who supplied the information essential for completing this research and evaluation effort
• Project Advisory Committee who helped develop the study methodology and reviewed the results including members from the following agencies:
o California Energy Commission o California Department of Food and Agriculture o California State Water Quality Control Board o Cal Recycle o California Air Resources Board o Central Valley Regional Water Quality Control Board o San Joaquin Valley Air Pollution Control District
University of California Cooperative Extension
i
PREFACE
The California Energy Commission Energy Research and Development Division supports public interest energy research and development that will help improve the quality of life in California by bringing environmentally safe, affordable, and reliable energy services and products to the marketplace.
The Energy Research and Development Division conducts public interest research, development, and demonstration (RD&D) projects to benefit California.
The Energy Research and Development Division strives to conduct the most promising public interest energy research by partnering with RD&D entities, including individuals, businesses, utilities, and public or private research institutions.
Energy Research and Development Division funding efforts are focused on the following RD&D program areas:
• Buildings End-Use Energy Efficiency
• Energy Innovations Small Grants
• Energy-Related Environmental Research
• Energy Systems Integration
• Environmentally Preferred Advanced Generation
• Industrial/Agricultural/Water End-Use Energy Efficiency
• Renewable Energy Technologies
• Transportation
An Economic Analysis of Six Dairy Digester Systems in California is the final report for the Energy, Economic, and Environmental Performance of Dairy Bio-power and Bio-methane Systems project (contract number PIR-08-041) conducted by Summers Consulting, LLC. The information from this project contributes to Energy Research and Development Division’s Renewable Energy Technologies Program.
For more information about the Energy Research and Development Division, please visit the Energy Commission’s website at www.energy.ca.gov/research/ or contact the Energy Commission at 916-327-1551.
ii
ABSTRACT
This study examined the economic feasibility of six operating dairy methane digester systems producing power and heat in California. The feasibility of these operations was determined by following a standard protocol developed for analyzing these renewable energy production systems. The key indicator for feasibility was net income, defined as revenue minus operating, maintenance and amortized capital costs. The analysis also examined other metrics of feasibility including simple payback period and return on investment. Calculations were made for each facility to see what flat utility rate would provide a 10 percent return on investment. The analysis was done for scenarios with and without government grants that were supplied to subsidize the owner’s capital outlay for the systems.
The study showed that these systems had power revenues ranging from $0.058-$0.109 per kilowatt hour through a variety of net metering and purchase agreements with power utilities. Additional income from heat utilization added $0.009-$0.082 to the total value derived per kilowatt hour produced for the three facilities that were able to displace other heat sources like propane or natural gas. Total capital costs ranged from $4,300-$11,600 per installed kilowatt lowered to $2,400-$3,600 per installed kilowatt with subsidies received by the facility. The 20-year capital production payback ranged from $0.046-$0.273 per kilowatt hour. Operations and maintenance costs for the systems ranged from $0.032-$0.064 per kilowatt hour. Simple payback ranged from 4.4 to 50.8 years for the total capital outlay and 2.6 to 29.4 years for the subsidized capital outlay for the five systems that had positive net revenue. Only one facility had a positive net income for a 20-year payback without grants. This study showed that there were great cost challenges to overcome for many California dairy digester projects to become feasible without subsidies under the currently available rate structures. Keywords: anaerobic digester, cogeneration, economic feasibility, renewable energy, power purchase agreement, net metering, utility rates, enterprise budget
Please use the following citation for this report:
Summers, Matthew; Sean Hurley. (Summers Consulting, LLC). 2013. An Economic Analysis of Six Dairy Digester Systems in California. California Energy Commission. Publication number: CEC-500-2014-001-V2.
iii
TABLE OF CONTENTS
Acknowledgements ................................................................................................................................... i
PREFACE ................................................................................................................................................... ii
ABSTRACT .............................................................................................................................................. iii
TABLE OF CONTENTS ......................................................................................................................... iv
LIST OF FIGURES .................................................................................................................................... v
LIST OF TABLES .................................................................................................................................... vi
EXECUTIVE SUMMARY ........................................................................................................................ 1
Introduction ........................................................................................................................................ 1
Project Purpose ................................................................................................................................... 1
Project Results ..................................................................................................................................... 1
Project Benefits ................................................................................................................................... 6
CHAPTER 1: Introduction ...................................................................................................................... 9
CHAPTER 2: Methodology .................................................................................................................. 11
2.1 Protocols Used .......................................................................................................................... 11
2.2 Data Collection ......................................................................................................................... 14
2.3 Enterprise Budget and The Unit of Measurement for The Anaerobic Digester Operations ............................................................................................................................................. 14
2.4 Limitations of The Study ......................................................................................................... 15
CHAPTER 3: Dairy 1 Results ............................................................................................................... 17
3.1 Background Information on Dairy 1 ..................................................................................... 17
3.2 Revenue from The Dairy 1’s Digester ................................................................................... 17
3.3 Capital and Operating Cost of Dairy 1’s Anaerobic Digester ............................................ 18
2.4 Economic Analysis of Dairy 1’s Digester Operation ........................................................... 19
CHAPTER 4: Dairy 2 Results ............................................................................................................... 21
4.1 Background Information on Dairy 2 ..................................................................................... 21
4.2 Revenue from Dairy 2’s Digester ........................................................................................... 21
4.3 Capital and Operating Cost of Dairy 2’s Anaerobic Digester ............................................ 25
iv

4.4 Economic Analysis of Dairy 2’s Digester Operation ........................................................... 26
CHAPTER 5: Dairy 3 Results ............................................................................................................... 29
5.1 Background Information on Dairy 3 ..................................................................................... 29
5.2 Revenue from Dairy 3’s Digester ........................................................................................... 29
5.3 Capital and Operating Cost of Dairy 3’s Anaerobic Digester ............................................ 33
5.4 Economic Analysis of Dairy 3’s Digester Operation ........................................................... 34
CHAPTER 6: Dairy 4 Results ............................................................................................................... 36
6.1 Background Information on Dairy 4 ..................................................................................... 36
6.2 Revenue from Dairy 4’s Digester ........................................................................................... 36
6.3 Capital and Operating Cost of Dairy 4’s Anaerobic Digester ............................................ 37
6.4 Economic Analysis of Dairy 4’s Digester Operation ........................................................... 38
CHAPTER 7: Dairy 5 Results ............................................................................................................... 40
7.1 Background Information on Dairy 5 ..................................................................................... 40
7.2 Revenue from Dairy 5’s Digester ........................................................................................... 40
7.3 Capital and Operating Cost of Dairy 5’s Anaerobic Digester ............................................ 41
7.4 Economic Analysis of Dairy 5’s Digester Operation ........................................................... 43
CHAPTER 8: Dairy 6 Results ............................................................................................................... 44
8.1 Background Information for Dairy 6 ..................................................................................... 44
8.2 Revenue from Dairy 6’s Digester ........................................................................................... 44
8.3 Capital and Operating Cost for Dairy 6’s Anaerobic Digester .......................................... 48
8.4 Economic Analysis of Dairy 6’s Digester Operation ........................................................... 49
CHAPTER 9: Summary, Conclusions, and Recommendations ..................................................... 52
REFERENCES .......................................................................................................................................... 58
APPENDIX A: Set of Initial Questions for the Economic Analysis ............................................ A-1
LIST OF FIGURES
Figure 1: Energy Charges That Dairy 2 Pays For Power It Uses Differentiated By Season and Time-of-Use for January 2011 Through December 2012 .................................................................... 23 Figure 2: Historical Electricity Rates That Dairy Has Received for the Electricity It Generated for the Differing Seasons and Time-of-Use (2009 to 2012) ....................................................................... 31
v
Figure 3: Dairy 5’s Revenue Generation by Month for Electricity Production ............................... 41
LIST OF TABLES
Table ES.1: Summary of Major Revenue Components for the Dairies ............................................... 2 Table ES.2: Summary of the Capital Cost Results for Each of the Dairy Digesters .......................... 3 Table ES.3: Summary of the Operating and Maintenance Cost Results for Each of the Dairy Digesters ...................................................................................................................................................... 4 Table ES.4: Key Metrics on Feasibility of Each Digester System ......................................................... 4 Table ES.5: Current Returns on Investment and the Flat Rates Necessary to Provide Each Digester a 10% and 20% Return on Investment ..................................................................................... 5 Table 1: Dairy 1’s Yearly Capital Costs Based on Differing Payback Assumptions ....................... 19 Table 2: Dairy 1’s Net Present Value Based on Differing Payback Assumptions ........................... 20 Table 3: Amount of Revenue Generated by Dairy 2’s Digester by Season and Rate ..................... 24 Table 4: Dairy 2’s Yearly Capital Costs Based on Differing Payback Assumptions ....................... 26 Table 5: Dairy 2’s Yearly Net Income Above Operating and Overhead Costs on Differing Payback Assumptions ............................................................................................................................. 27 Table 6: Dairy 2’s Net Present Value With and Without the Grants ................................................ 28 Table 7: Prices Dairy 3 Receives for Its Electricity During Different Periods of the Day and Seasons 2011 .............................................................................................................................................. 31 Table 8: Amount of Revenue Generated by Dairy 3’s Digester by Season and Rate for Energy Charges Avoided ..................................................................................................................................... 32 Table 9: Amount of Revenue Generated by Dairy 3’s Digester by Season and Rate For Energy Charges Avoided ..................................................................................................................................... 33 Table 10: Dairy 3’s Yearly Capital Costs Based on Differing Payback Assumptions ..................... 34 Table 11: Dairy 4’s Yearly Capital Costs Based on Differing Payback Assumptions ..................... 37 Table 12: Dairy 5’s Yearly Capital Costs Based on Differing Payback Assumptions ..................... 42 Table 13: Dairy 5’s Net Income Above Operating and Capital Cost With and Without Grants .. 43 Table 14: Prices Dairy 6 Receives for Its Electricity During Different Periods of the Day and Seasons ....................................................................................................................................................... 46 Table 15: Amount of Revenue Generated by Dairy 6’s Digester by Season and Rate ................... 47 Table 16: Dairy 6’s Yearly Capital Costs Based on Differing Payback Assumptions ..................... 48 Table 17: Dairy 6’s Yearly Net Income Above Operating and Overhead Costs on Differing Payback Assumptions ............................................................................................................................. 50 Table 18: Summary of Major Revenue Components for the Dairies ................................................ 52 Table 19: Summary of the Capital Cost Results for Each of the Dairy Digesters ............................ 54 Table 20: Summary of the Operating and Maintenance Cost Results for Each of the Dairy Digesters .................................................................................................................................................... 54 Table 21: Key Metrics on Feasibility of Each Digester System .......................................................... 55 Table 22: Current Returns on Investment and the Flat Rates Necessary to Provide Each Digester a 10% and 20% Return on Investment................................................................................................... 56
vi

EXECUTIVE SUMMARY
Introduction California is the largest dairy producing state in the United States. The California Department of Food and Agriculture reported that dairy producers in the state produced over 41,428 million pounds of milk in 2011. With this production of milk comes a vast amount of dairy manure that contains a large quantity of nutrients that can be used by dairy producers to grow their own feed crops. Dairy producers need to store much of the manure produced by the cows so it can be applied to the land at appropriate times of the year due to the cycle of producing crops. Much of this storage is accomplished by utilizing lagoons. Dairy manure that is stored in lagoons usually undergoes anaerobic digestion that creates methane, which is a greenhouse gas. Methane gets released into the atmosphere unless it is captured. There are strict air regulations enforced by the California Air Resource Board in the Central Valley of California where a vast majority of the dairy industry is located.
Engineers have developed different types of systems including methane digesters to capture a portion of this methane production and turn it into resources like usable gas, electricity and heat. In recent years dairy producers in California have been investigating if it is feasible to operate methane digesters that allow them to convert methane into a renewable resource. Dairy producers must be able to compensate for the cost of implementing and maintaining the system for it to be cost-effective for them to invest in a system that will allow them to generate electricity from the methane produced. A few studies have been done on the feasibility of methane digesters but it is still unclear whether these digesters are economically feasible.
Project Purpose The purpose of this study was to better understand the economic aspects of implementing and operating a methane digester.
Project Results Six dairies were chosen based on their willingness to share information regarding their methane digester operations. Three of the dairies had a covered lagoon system for capturing methane gas. Two of the systems were a complete mix system, one in the ground and the other in steel tanks above ground. One system utilized a plug flow system. Each of these dairies was selling the electricity generated from the anaerobic digester systems to the local public utility. A few of the dairies were able to capture the heat from the engine that offset some of their propane usage.
A set of protocols (known as the ERG protocols in this summary) developed for the United States Environmental Protection Agency (EPA) AgSTAR program were utilized to analyze the six dairy digesters. This protocol made recommendations on how to define the anaerobic digester, the boundaries of the digester (i.e., what were the actual revenue and costs that can only be attributed to the digester operation), the assumptions for handling operating and capital costs, how to estimate revenue and the metrics to be used (in this case net income). The protocol defined net income as the direct or indirect revenue from the operation minus the operating and maintenance costs and the amortized capital costs. Net income was the primary metric of
1
feasibility in the protocol, but net present value, simple payback period, and return on investment were also examined for each facility. The analysis for this project deviated from the protocol when it came to estimating operating costs, maintenance costs and revenues.
Data collection for this study followed a four-part process. A survey instrument was used to elicit important information regarding the operation and cost of the digester. The second part of the data collection process was a visit to each of the dairy operations. Electrical billing statements were acquired from the operators when possible, which were utilized in the estimate of the revenue received from electricity generation. The third phase of data collection involved visiting utility websites to collect information regarding the rate schedules under which each digester operated. The fourth part of the process for data collection was to do a search for previous studies on the dairy digesters. Enterprise budgets were developed to estimate revenues, operating and maintenance costs and capital costs from this information.
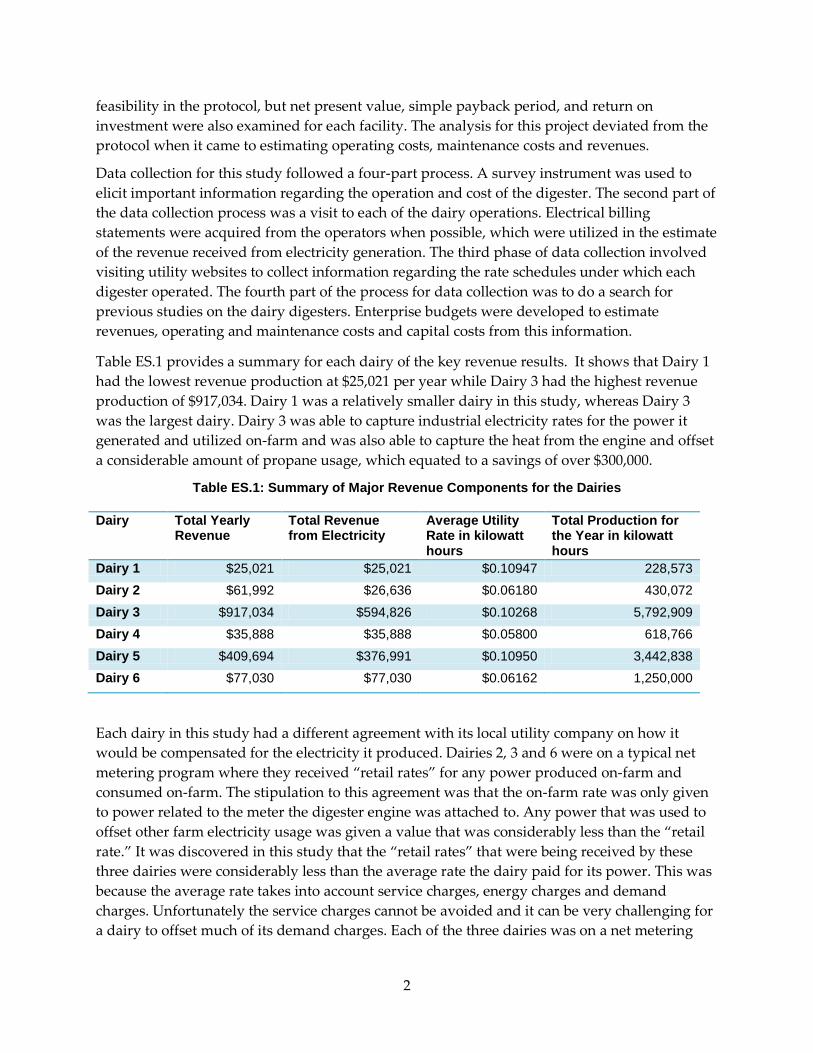
Table ES.1 provides a summary for each dairy of the key revenue results. It shows that Dairy 1 had the lowest revenue production at $25,021 per year while Dairy 3 had the highest revenue production of $917,034. Dairy 1 was a relatively smaller dairy in this study, whereas Dairy 3 was the largest dairy. Dairy 3 was able to capture industrial electricity rates for the power it generated and utilized on-farm and was also able to capture the heat from the engine and offset a considerable amount of propane usage, which equated to a savings of over $300,000.
Table ES.1: Summary of Major Revenue Components for the Dairies
Dairy Total Yearly Revenue
Total Revenue from Electricity
Average Utility Rate in kilowatt hours
Total Production for the Year in kilowatt hours
Dairy 1 $25,021 $25,021 $0.10947 228,573 Dairy 2 $61,992 $26,636 $0.06180 430,072 Dairy 3 $917,034 $594,826 $0.10268 5,792,909 Dairy 4 $35,888 $35,888 $0.05800 618,766 Dairy 5 $409,694 $376,991 $0.10950 3,442,838 Dairy 6 $77,030 $77,030 $0.06162 1,250,000
Each dairy in this study had a different agreement with its local utility company on how it would be compensated for the electricity it produced. Dairies 2, 3 and 6 were on a typical net metering program where they received “retail rates” for any power produced on-farm and consumed on-farm. The stipulation to this agreement was that the on-farm rate was only given to power related to the meter the digester engine was attached to. Any power that was used to offset other farm electricity usage was given a value that was considerably less than the “retail rate.” It was discovered in this study that the “retail rates” that were being received by these three dairies were considerably less than the average rate the dairy paid for its power. This was because the average rate takes into account service charges, energy charges and demand charges. Unfortunately the service charges cannot be avoided and it can be very challenging for a dairy to offset much of its demand charges. Each of the three dairies was on a net metering
2

contract, but they each were on very different electricity rate schedules that caused them to have different realized rates. Of the three dairies on net metering contracts, Dairy 3 had the largest average rate of $0.10268 per kilowatt hour (kWh). The other two dairies realized much lower average rates of approximately $0.06200 per kWh.
One of the dairies was on a hybrid net-metering and power purchase agreement contract. Dairy 1 had a contract with its local utility to purchase any excess electricity from the digester generator at a rate of $0.05800 per kWh. Any power that was produced and consumed on-farm would receive the “retail rate.” Since this dairy did not sell much excess power to the utility it managed an average utility rate of $0.10947. Dairies 4 and 5 were each on straight power purchase agreements. Dairy 4 received a rate of $0.05800 per kWh, while Dairy 5 negotiated a power rate of $0.10950 per kWh.
Table ES.2 presents the key capital and operating cost results for each of the dairy digesters. The total capital costs for the digesters in this study ranged from a low of $625,000 to $4,020,000 in nominal terms. The total capital cost the dairies actually encountered ranged from $213,000 to $2,400,000 when grant funding was taken into consideration. The numbers in the table implied that the dairy producers paid for between 30 percent and 75 percent of the actual capital cost for the digesters. At a rate of 5.35 percent the yearly capital cost for the digester ranged from $82,322 up to $529,494 if the capital were paid back over 10 years and $51,651 to $332,217 over 10 years. This 20-year payback equated to a wide range of cost: $0.047 to $0.273 per kWh of production from the digester systems.
Table ES.2: Summary of the Capital Cost Results for Each of the Dairy Digesters
Dairy Installed Capacity In kW
Total Capital Costs
Capital Costs with Subsidy
Total Capital Costs in Terms of Installed kW Capacity
Capital Costs with Subsidy in Terms of Installed kW Capacity
Yearly Capital Payback for 10 Years
Yearly Capital Payback for 20 Years
Capital Payback for 20 years per kWh Production
Dairy 1 65 $ 754,870 $ 234,414 $11,613 $3,606 $ 99,428 $ 62,383 $0.273
Dairy 2 75 $ 625,000 $ 213,000 $8,333 $2,840 $ 82,322 $ 51,651 $0.120
Dairy 3 750 $3,200,000 $2,400,000 $4,267 $3,200 $421,488 $264,451 $0.046
Dairy 4 212 $1,700,000 $ 500,000 $8,019 $2,358 $223,915 $140,490 $0.227
Dairy 5 710 $4,020,000 $1,738,000 $5,662 $2,448 $529,494 $332,217 $0.096
Dairy 6 190 $1,097,000 $ 634,506 $5,774 $3,340 $144,491 $ 90,657 $0.073
Operating and maintenance costs ranged from a low of $7,782 to a high of $186,087 as shown in Table ES.3. Examining these operating costs per kWh of production showed that the costs ranged from $0.03212 to $0.06464 per kWh. Dairy 3 was the most successful digester operation and had the lowest cost per kWh of production. It was found that the operation cost to capital cost ratio ranged from 1.03 percent to 5.82 percent. The two dairies that had the highest percentages were the ones that had been operating their digesters the longest. The lower
3

percentages were associated with the newer digesters. It should be expected over time that the newer digester systems will have higher relative operating and maintenance costs based on the protocol and the experience of the older digesters.
Table ES.3: Summary of the Operating and Maintenance Cost Results for Each of the Dairy Digesters
Dairy Observed Yearly Operating and Maintenance Costs
Yearly Operating and Maintenance Cost in
Terms of kWh Production
Operating and Maintenance Costs in Terms of Total Capital
Costs Dairy 1 $ 7,782 $ 0.03404 1.03% Dairy 2 $ 13,220 $ 0.03704 2.12% Dairy 3 $186,087 $ 0.03212 5.82% Dairy 4 $ 39,997 $ 0.06464 2.40% Dairy 5 $138,800 $ 0.04032 3.45% Dairy 6 $ 55,440 $ 0.04435 5.10%
Table ES.4 provides key metrics used to understand the feasibility of the digester operations. One of the striking results was that if the dairies had to pay back the total cost of the digester, three of them would take over 20 years, which was the purported life of the digester. The best digester operation could be paid back in as little as 4.38 years. Only two digesters would take longer than twenty years to be paid back if given subsidies. The most feasible digester operation was able to pay back the full subsidized capital cost in 2.62 years. One digester system had a payback period that does not exist because under the current prices and production the digester could not meet its current operating and maintenance costs due to the electricity produced by the digester.
Table ES.4: Key Metrics on Feasibility of Each Digester System
Dairy Simple Payback Period for Total Capital Outlay
Simple Payback Period for
Subsidized Capital Outlay
Net Income with a 10 Year Payback Period Without
Grants*
Net Income with a 20 Year Payback Period Without
Grants*
Dairy 1 43+ 13.6 $ (42,480) $ (42,480) Dairy 2 12.81 4.37 $ (33,550) $ (2,879) Dairy 3 4.38 2.62 $ 309,460 $ 466,496 Dairy 4 Never Never $ (228,004) $ (144,579) Dairy 5 15.77 6.82 $ (274,600) $ (77,323) Dairy 6 50.81 29.39 $ (122,901) $ (69,067) * Numbers in parenthesis represent negative values.
Excluding grant money showed that only one operation out of the six could be considered feasible in terms of a positive net income value. The other five operations would not be able to cover the total operating and amortized capital costs for a 10 or 20 year investment horizon.
4

Three of the dairies were considered feasible given the grant money they received for operating. Two of the dairy digester operations (Dairy 4 and Dairy 6) were considered infeasible based on how they were being operated, although it was possible they could be considered feasible in the future if the environment changed.
Table ES.5 provides information on the current return on investment and the flat rates necessary for each dairy digester to obtain a 10 percent and 20 percent return on investment. Dairy 3 had the highest returns on investment. Dairy 3 would receive a 9.67 percent return on its investment in a 10-year investment horizon, which would increase to 14.58 percent for a 20-year time horizon. Dairy 4 had the worst returns on its investment at -13.41 percent for a 10- year time horizon. For a twenty year time horizon, this would increase to -8.50 percent.
Table ES.5: Current Returns on Investment and the Flat Rates Necessary to Provide Each Digester a 10% and 20% Return on Investment
Dairy Return on Investment for 10 Year Horizon
Return on Investment for 20 Year Horizon
Flat Utility Rate Needed to Provide a 10% Return on Investment in 20 Years
Flat Utility Rate Needed to Provide a 20% Return on Investment in 20 Years
Dairy 1 -5.62% 0.00% $ 0.29674 $ 0.43629 Dairy 2 -5.37% 0.00% $ 0.17010 $ 0.28564 Dairy 3 9.67% 14.58% $ 0.07739 $ 0.13263 Dairy 4 -13.41% -8.50% $ 0.55640 $ 0.84150 Dairy 5 -6.83% -1.92% $ 0.24076 $ 0.36084 Dairy 6 -11.23% -6.30% $ 0.13777 $ 0.19686
An analysis in this study examined what flat rates would be necessary to achieve a 10 percent and a 20 percent return on investment for a 20-year time horizon. Dairy 3 was the most feasible digester operation and was able to achieve a 10 percent return on investment with a flat electricity rate of $0.07739 per kWh. It would need a flat rate of $0.13263 per kWh to get a 20 percent return on investment in twenty years. The dairy that would need the highest rates was Dairy 4. It would need to receive $0.55640 per kWh to obtain a 10 percent return on investment. This would increase to $0.84150 per kWh to obtain a 20 percent return.
One of the major findings of this study was that the dairies that were examined did not have a uniform contract. Each dairy’s contract was unique to the dairy. These contracts ranged from a simple flat rate for the power it produced to a complex net metering program based on time-of-use pricing. This implied that each dairy received very different rates for the power that it produced. Dairies utilizing a time-of-use net metering program faced different prices during the day and different parts of the year, which had implications on both the operation and the design of the digester. These implications were not necessarily taken into account in the design of the digester or its operation. Some of these digesters were therefore not necessarily designed to be as profitable as they could have been.
5

Another finding of this study was that it was very complex to figure out how much a dairy was making in terms of revenue from operating its digester. It could be extremely difficult to estimate the revenue that was generated from electricity since revenue from most of the digesters studied was from realized cost savings. Dairy 4 and Dairy 5 were the easiest to estimate because each received one single rate for its power production and the power was sold directly to the grid. This was a very different scenario than Dairy 2, whose revenue stream was all from avoided costs.
One important finding was that digester revenue should not be examined from the average electricity rate. Consideration must be taken regarding the different value of the electricity in different parts of the day and the year when designing these operations. If differential pricing is occurring the design of the digester must take this into account, or else the digester may not be designed to maximize profits.
The study showed that there were great cost challenges to overcome for many California dairy digester projects to become feasible without subsidy under the currently available rate structures. Most of the dairies in this study were able to meet their operating and maintenance costs but they were not able to pay back all the capital costs in a reasonable investment time horizon. Either capital costs for building them needed to decrease or revenue generation through higher utility rates needed to increase for these digesters to become economically feasible. It was found that some of the digesters were not necessarily built to optimize profitability. This came from not fully understanding the way revenue would be generated from the digester operation because of the complexity of utility rates and net-metering time-of-use contracts.
The feasible operation without grant funding had several attributes that made it feasible:
• There was a high value to the power it generated due to the industrial cost of its electricity.
• The facility had a high demand for power; so much so that it was able to capture “retail rates” for most of the power it generated.
• There was a large demand for the heat that came off the digester engine.
• Management’s attention to the digester as an enterprise in and of itself.
The authors believed that these were the key attributes that would ensure that a digester operation would be economically feasible in California.
It was recommended that if California wants a steady supply of power from dairies in the future it should move to a compensation method that involves a flat utility rate for power produced. Otherwise, those digesters that are built where there is differential pricing need to take into consideration that power production may be most profitable during peak rates and they should not necessarily be operating continuously.
Project Benefits This study examined the economic aspects of implementing and operating methane digesters to produce power and heat at six dairy farms in California. The manure of dairy cows contains
6

high amounts of methane, which is a greenhouse gas that contributes to climate change. The findings in this study could be used to help facilitate greater use of methane digesters, which could reduce the greenhouse gases produced by dairy farms and also provide an additional source of electricity.
7


CHAPTER 1: Introduction In 2011, the California dairy industry produced approximately 41,428 million pounds of milk from over 1.7 million dairy cows (CDFA, 2012). In order to produce this large quantity of milk, a vast amount of dairy manure, on the order of magnitude of billions of gallons, was generated in a single year. This manure carries a large amount of nutrients that dairy producers can and do utilize to grow crops. Due to the nature of cropping, the capacity of the local land base, and the regulations that currently exist in California, most dairy producers need to store this manure for a time period before applying it to their crops.
Meyer et al. (2011) conducted a survey of dairy producers in Glenn and Tulare counties. They found that over ninety-five percent had storage or treatment ponds for their dairy waste. The storage ponds that are utilized by California producers typically cause some form of anaerobic digestion to occur unless the producer has taken on the expense of mitigating this effect. One of the byproducts of this anaerobic process is the production of methane which is considered a greenhouse gas. In the Central Valley of California where a vast majority of the dairy industry is located, there are strict air regulations that are enforced by the California Air Resource Board. While other parts of the state are not under as strict of air quality regulations in the Central Valley, there are potentially future restrictions that may occur from AB 32, the Global Warming Solutions Act of 2006. The purpose of AB 32 is to reduce greenhouse gas production in California.
The methane produced by anaerobic digestion is viewed as a negative externality due to its reported link with climate change. While methane is considered a greenhouse gas, Nigel and Sneeringer in their 2011 study entitled “Climate Change Policy and the Adoption of Methane Digesters on Livestock Operation” cite a 2007 Intergovernmental Panel on Climate Change report that implies burning a ton of methane equates to eliminating twenty-four tons of carbon dioxide that would have gone into the atmosphere. The typical dairy in California is not set-up to burn methane coming from storage ponds because the cost of capturing methane can be quite expensive.
Outside of the regulatory process, one way to induce dairy producers to burn the methane coming from their manure management practices is to allow them to capture the energy potential that is embodied in the methane gas. This energy content can be released by diverting methane going into the atmosphere and burning it in an engine that generates electricity. For a dairy producer to invest in a system that will allow him to generate electricity from the methane produced, he must be able to compensate for the cost of implementing and maintaining the system. Unfortunately, even though a few studies have been done on the feasibility of methane digesters, it is still unclear in the academic and grey literature whether these digesters are feasible. This is primarily due to the fact that there is no uniform system for anaerobic digestion. Even though the technology has been around for at least forty years, no particular system has risen to the top.
9
The purpose of this study is to better understand the economic aspects of implementing and operating a methane digester. Six dairies have been chosen based on their willingness to share information regarding their methane digester operations. Three of the dairies have a covered lagoon system for capturing methane gas. Two of the systems are a complete mix system where one is in the ground and the other is in steel tanks above ground. One system utilizes a plug flow system. Each of these dairies is selling the electricity generated from the anaerobic digester systems to the local public utility. A few of the dairies are able to capture the heat from the engine that offsets some of their propane usage.
10
CHAPTER 2: Methodology 2.1 Protocols Used The Eastern Research Group, Inc. (ERG) developed a set of protocols for the United States EPA AgSTAR program which provides guidance for quantifying and reporting economic and physical performance indicators for anaerobic digestion systems (Eastern Research Group, Inc., 2011). These protocols were established to provide uniformity on how digester’s performance were analyzed and reported so that different systems could be compared. Unless otherwise stated, these protocols were followed in this analysis.
In the ERG protocol, the first major guideline is to define the anaerobic digester as an independent enterprise from the rest of the dairy operation. In this case, the single metric it suggests utilizing is annual net income, whether a profit or a loss, for the digester system. Net income in this case is defined as the direct or indirect revenue from the operation minus the operating and maintenance costs and the amortized capital costs. Other studies (Stringfellow et al., 2011; Bishop and Shumway, 2009; Stokes, Rajagopalan, and Stefanou, 2008; Leuer, Hyde, and Richard, 2008; Lazarus and Rudstrom, 2007) that have examined economic viability have used net present value (NPV), simple payback period (SPP), and internal rate of return (IRR). This study will also report these metrics for comparison purposes but will utilize pertinent information developed in ERG’s protocol. It will also calculate the return on investment (ROI).
For this study the simple payback period is defined as the capital costs divided by the net returns over operating costs, where net returns over operating costs is defined as direct or indirect revenue minus operating and maintenance costs. This simple payback period was calculated for the total capital costs and the capital costs minus the grants received to establish the digester. The simple payback period tells you how long it will take the operation to payback the original investment. A major issue with this metric is that it does not take into account the time value of money, i.e., a dollar in the future is typically worth less than a dollar today.
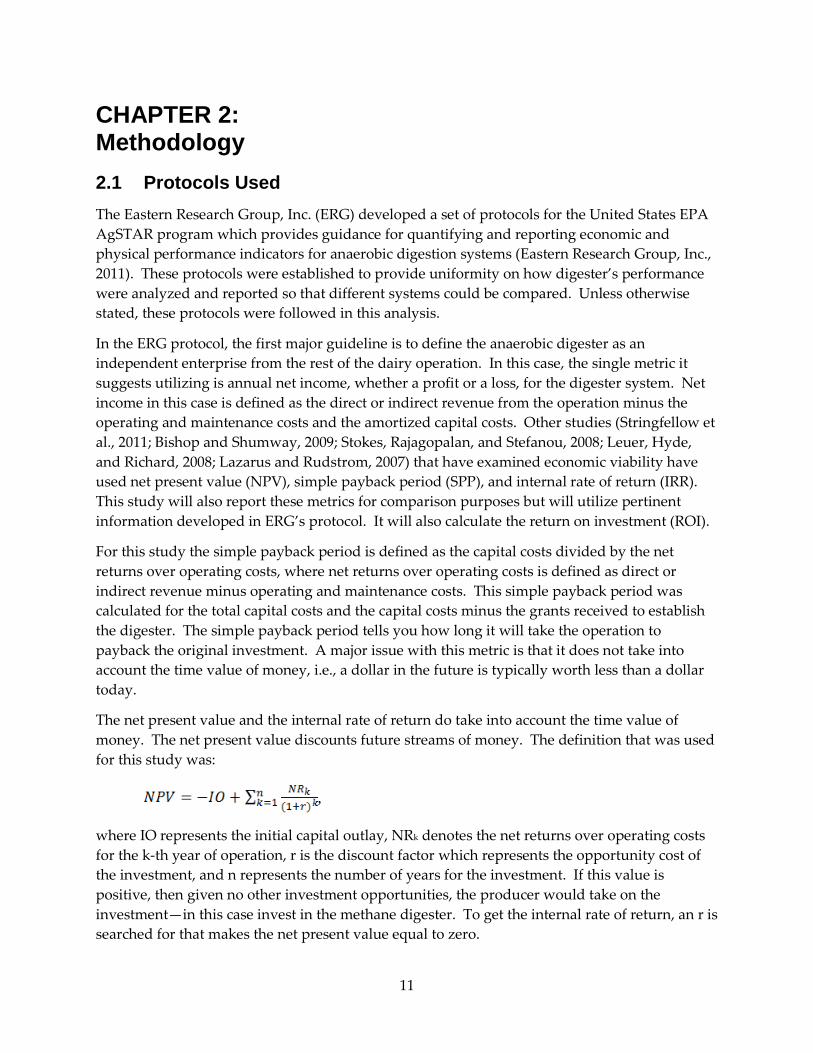
The net present value and the internal rate of return do take into account the time value of money. The net present value discounts future streams of money. The definition that was used for this study was:
,
where IO represents the initial capital outlay, NRk denotes the net returns over operating costs for the k-th year of operation, r is the discount factor which represents the opportunity cost of the investment, and n represents the number of years for the investment. If this value is positive, then given no other investment opportunities, the producer would take on the investment—in this case invest in the methane digester. To get the internal rate of return, an r is searched for that makes the net present value equal to zero.
11

The return on investment was another metric that was utilized in this study. This metric measures the return normalized by the initial capital investment. To get the return on investment, the net income was divided by the total initial capital outlay. The amortized cost used in this calculation was based on a twenty year payback period. This metric was also examined to see what rates would be necessary to incur a ten and twenty percent return on investment.
The next recommendation of the protocol is to set-up the boundary conditions of the anaerobic digester. The purpose of this recommendation is to ensure that the revenues and costs being accounted for are all directly related to the operation of the digester. If the dairy had the revenue or cost before operating the digester, the protocol recommends not accounting for it in the accounting of the digester. The key to setting up the boundary conditions is to account for only those costs and revenues that occur because they are dependent on the digester operation. If the cost or revenue can be separated from the digester operation, the protocol recommends not including it. Under the protocol, some cost and/or revenues are considered subjective. The protocol does recommend that solid separation is a separate enterprise from anaerobic digestion and this report follows that recommendation except for one dairy.
The ERG protocol has three major assumptions for handling the capital cost portion for the anaerobic digester in their recommendations. The first assumption is that all capital costs should be accounted for whether the money to pay for the expenditures came from internal funding or external funding. Each of the dairies received a considerable amount of grant money to set-up their systems. The protocol recommends using the borrowing rate of capital for calculating the annual capital cost. This rate applies to whether the money was borrowed or not. For this study, this rate is assumed to be 5.35 percent for all dairies to remain consistent across the analyses. This rate was used for all dairies because it represents the rate that one of the dairies actually borrowed money at to fund its project. It should be noted that most of the dairies in this study were able to self-finance their projects.
The second assumption pertinent to the capital cost is that these costs will be recovered in uniform yearly payments over the expected life of the system. To calculate this value, the payment function in Microsoft Excel was utilized. This function requires an interest rate, the number of periods for payment, and the amount of money that needs to be paid back. The function also asks for the future value that the loan should be at the end of the payments. In this case, it is assumed that the loan will be fully paid for, which makes this value zero. Finally, this function has an optional variable regarding when the payments start. It is assumed that payments are being made at the end of the period rather than the beginning. It should be noted that since the payments are on a yearly basis, this would tend to overestimate the interest paid on the loan because the loan would typically get paid back on a monthly basis. The difference between monthly payback versus yearly payback is not too different and should not greatly affect the final decision on whether the operation is feasible.
The third assumption the protocol discusses regarding capital costs is in relationship to the useful life of the digester components. The protocol allows for the use of a ten year or twenty year useful life. While it recommends that twenty years is appropriate for some structural
12

components, ten years is a more realistic number for other components like lagoon covers. In this study, the more conservative capital recovery of ten years will be used as the basis of analysis. To use a useful life of twenty years, the protocol calls for reconditioning or replacement of parts with less than a twenty year useful life. This replacement cost is supposed to be factored into the operating and maintenance costs of the digester. The purpose for choosing a ten year capital recovery for all components is due to the great uncertainty that the California regulatory environment places on producers in the state. Another argument for using a ten year horizon is that these digesters are still very experimental in nature and should require a faster payoff for the risk involved. A third reason for using a ten year investment horizon is that the longest revenue contract given out to the digesters in this study is ten years.
In terms of annual operating costs, the ERG protocol recommends using a three percent rate on total capital costs unless better information can be obtained. ERG provides two primary reasons for using this three percent rate. First, the record keeping typically done by owners is not sufficient enough to make a good estimate. Records may be adequate when it comes to major maintenance items like oil changes, but are much sparser in terms of the general labor for upkeep. This fact was found to be true with some of the dairies in this study. The second reason for using a three percent rate is that the newness of the digester usually causes the operation and maintenance costs to be skewed on the lower side. This occurs because as time goes by, maintenance costs tend to increase. Another issue that was discovered in this study is that since these digesters are still in their experimental stages, operation and maintenance costs may not be uniform throughout the evaluation period. For the dairies that had adequate record keeping, their maintenance and operation costs were used.
The ERG protocol recognizes the potential challenge that occurs when trying to estimate the annual revenue coming from the digester. While estimation can be simple when there is a direct purchase of all power from the farm, it becomes exceedingly more complex for revenue that comes in the form of avoided electricity costs. The dairies in this study fell under both of these scenarios. When the dairies are on a simple power purchase agreement where they sell all electricity to the grid, the protocol requires the sum of all electricity payments. Two of the dairies fell under this revenue system. Under more complex revenue scenarios where net metering is occurring, the protocol suggests examining the electricity bills for a period prior to the start-up of the digester and comparing them with the electricity bills of a year’s time when the digester is operating. Unfortunately for this study, there were some major changes occurring at the dairies making this suggestion not optimal.
Instead of comparing utility bills, rate schedules were analyzed and mapped to the electrical bills to create a revenue model for each of the dairies utilizing a net metering contract. There were four dairies that were utilizing some form of net metering. This provided a much more accurate estimate of the revenue because it took into account the actual amount the dairy was receiving based on how it was operating the digester. A spreadsheet model developed in Excel was developed for making these estimates which takes into account how much the generator is operating in different time periods. This model takes into account that the average electricity cost for the dairy is an overstatement of the amount the dairy receives for producing its power.
13
2.2 Data Collection Data collection followed a four part process. First a survey instrument was developed (see Appendix A) to elicit important information regarding the operation and cost of the digester. The survey was broken up into five major categories. The first category inquired about how the dairy operated before the digester was put into production. The second set of questions in the survey focused on the capital costs and engineering designs of the digester. The third category of questions examined the characteristics of the digester system. Operation and maintenance questions made up the fourth category of questions on the survey. The final set of question on the survey focused on the revenue sources. This survey was provided to each of the dairy operators to fill out.
The second part of the data collection process was a visit to each of the dairy operations. This visit was to tour the facilities and see how the digester operated. Information and answers given on the survey were reviewed with the digester operators. When possible, electrical billing statements were acquired from the operators to be utilized in the estimate of the revenue received from electricity generation.
The third phase of data collection came in the form of visiting all the utility websites to collect information regarding the rate schedules that each digester operated under. Out of all six dairies, not one had an identical rate schedule. These rate schedules were matched with the dairies and mapped to their billing statements when possible. These rate schedules were programmed into Microsoft Excel to estimate the amount of revenue being received. Due to the differences in each rate schedule and how the contracting with the utility worked for each dairy, a specific revenue estimator needed to be built for each dairy.
The fourth part of the process for data collection was to do a search for previous studies that have been done regarding the dairy digesters. Since most of these operations are still in their infancy with the technology and received considerable grant funding, there have been studies conducted for some of the operation. One of the dairies in particular had a study running concurrently with this one to examine the economics of the digester system. Most of these studies were used to assist in the acquisition of the capital costs.
2.3 Enterprise Budget and The Unit of Measurement for The Anaerobic Digester Operations To examine the feasibility of the methane digester, the ERG protocol recommends examining the net income that the digester produces. The tool that is utilized in analyzing this net income of the anaerobic digesters in this study is the enterprise budget. An enterprise budget is a tool that allows individuals to make optimal decisions for an operation. It is a budget that allocates all revenue and expenses on a per unit basis, where the per unit basis represents the decision that the producer can make. The expenses are usually categorized as operating expenses and overhead expenses. The operating expenses only exist when the operation is producing, while the overhead expenses exist whether there is production or not.
14
The per unit basis of an enterprise budget should be based on the major decision that can be made by the operator of the operation when it comes to generating revenue. In the case of each anaerobic digester operation, there are two major decisions they must make regarding operating the digester. The first decision is on how many kilowatts of power they want to generate in any given time. The other decision is how much time the generator will operate at a given kilowatt level. Since the revenue and expenses are more easily allocated on a time basis, it is preferable to design the enterprise budgets around time as the base for operating the generator.
Past work on enterprise budgets have examined the anaerobic digester on a per cow basis. Digesters were designed and operated on the idea that continuous steady output was profit maximizing. It can be argued that this unit of measurement for the anaerobic digester enterprise budgets can potentially lead to problems with operating and designing the digester (Hurley, 2012). The number of cows on an operation can provide a general scale to the size of the digester, but it does not allow for making optimal operating decisions. This is especially true for many of the dairies in this study because they receive different prices depending on the time of day and season they operate the digester. Even if the dairies are not on a direct differential pricing scheme, if they are net metering their power, then they will receive different prices for the electricity they produce which depends on whether the power was net metered or not. These differing prices lead to important design considerations that can affect the profitability of the digester, e.g., storage capacity of the gas and the size of the generator. Since many of the dairies in this study receive different prices for the power they generate, there is potentially incentive for the generator to operate at higher kW during higher prices that it can receive for its power and lower kW during lower prices.
While the enterprise budget has a basis of time, another major decision that needs to be made is the amount of kW that will be generated at any particular time. When there are multiple values for electricity, the profit maximizing decision would call for allocating the gas produced by the digester to its highest value first. Hence, there may be scenarios where the dairy should operate the engine at less than full capacity at certain times of the day so that it can operate at other times of the day at full capacity.
2.4 Limitations of The Study There are a few major limitations to this study that need to be understood. First, most of the operations that were studied are still very much in the experimental stages of the technology. Two of the dairies started operation of their digesters in 2004, two came on-line in 2008, and two were operational in 2009. During the three years of this study, changes have occurred at each dairy in order to improve the operation. Some of the changes have been substantial including one dairy that added a second engine to utilize more of its gas production. Even more recently, it added a third engine. Also, since these operations were first adopters, some of the start-up costs that were incurred were not necessarily as low as they could be.
Another limitation to this study is that many of the costs utilized are continuously changing because the digesters are still very much in experimental stages. Hence, the cost numbers may
15
not be very indicative of costs to others for applying the same technology. Some of the costs used in the study are based on best estimates by the producers.
A caveat that should be observed is that these dairy operations are not necessarily at a point where they have a consistent operating and maintenance costs because they are still in their experimental modes. It was not feasible in this study due to the current record keeping to ascertain how the changes expressly affected the operation.
A major assumption is that prices and costs will change at the same rate and direction. No attempt was made to take into account inflation for either the revenues or the costs. Nor was any attempt made to forecast future energy prices. It is assumed that prices and costs will move uniformly together.
16
CHAPTER 3: Dairy 1 Results 3.1 Background Information on Dairy 1 Dairy 1 started operating its anaerobic digester in July, 2008. The operation utilizes a covered earthen lagoon digester which is located next to the free stall dairy barns that house the cows. Currently, the dairy has 600 milking cows with another 50 dry cows and another 300 heifers which feed the digester. The methane gas from the digester feeds a 65 kW engine generator system. The system has been designed to utilize biogas. Dairy manure is collected daily from the dairy’s flush manure management system and fed through a screen separator to remove solids inappropriate for the digester. Gas production appears to be lower in the winter months due to colder temperatures affecting the digester. The effluent from the digester is used for the manure management system and to irrigate crops. The digester utilizes a hydrogen sulfide gas scrubber unit to handle the issue of hydrogen sulfide production. The dairy has had issues with moisture getting on the cover and getting into the gas line. The system is set-up to flare any excess gas that the engine cannot utilize. The system takes heat away from the engine and dispels it through a radiator system. Currently, the excess heat from the engine is not being utilized on the farm. In the early operation of the digester system, the engine needed to be rebuilt and kept the system down for approximately ten months.
3.2 Revenue from The Dairy 1’s Digester Dairy 1 is located in the Sacramento Metropolitan Utility District (SMUD). The dairy has multiple meters on farm. The digester engine is attached to a meter that falls under the AG Rate Schedule. Under this schedule, Dairy 1 is charged the Small Agricultural Services ASN rate. This rate has been set-up for producers who have a demand of 30 kW or less of power on their meter. This rate schedule has a fixed charge of $9.90 per month in the summer and winter months. In the summer, the dairy must pay $0.1198 per kWh that it uses, while the winter month cost is $0.1095 per kWh. The summer season pricing runs from May 1 through October 31, while the winter season is defined from November 1 through April 30. The dairy currently has an agreement with SMUD that is a hybrid net metering plan with a power purchase agreement. It allows the dairy to sell all excess power to the utility district at a flat rate of $0.058 per kWh. All electricity that is produced on-farm and consumed on farm receives the “retail” cost of electricity. In the case of Dairy 1, it is receiving $0.1198 per kWh in the summer season and $0.1095 per kWh for on-farm produced electricity in terms of avoided costs. While the dairy has the option to be on time base pricing plan, the pricing schedule does not appear to be worthwhile to switch.
The engine observation period was for the period of August 2009 to December 2011. In this time period, it appears that the dairy was encountering a steep learning curve for operating the digester. In November 2010, the engine had a major issue that caused it to be down for ten months allowing no power to be generated. The most consistent time period for power production was between November 2009 and October 2010. In this period, the dairy produced
17

228,573 kWh of electricity. The value of this electricity is $25,021 for the year. Most of this electricity is being valued at the on-farm electricity rate. This equates to an average rate of $0.10947 per kWh. In this time period, the engine used approximately 5,253,888 cubic feet of biogas in the engine and another 7,898,802 went to the flare. If all the biogas could have been utilized, the total electrical production of the engine would have met its maximum capacity of 569,400 kWh of electricity. If the dairy had a larger engine it could produce slightly higher electricity. At maximum engine capacity, the digester could make approximately $44,789 per year from electricity. This assumes that approximately 353,400 kWh are sold to SMUD at a rate of $0.058 per kWh. At this theoretical maximum output of the engine, the average utility rate would reduce to $0.07866 per kWh.
3.3 Capital and Operating Cost of Dairy 1’s Anaerobic Digester When the digester was originally conceived, the projected cost to build the digester was $451,000. To get the digester fully operational, the final major capital costs were approximately $744,870. The dairy had to rebuild the engine after an initial 10,000 hours of operation which cost approximately $10,000. Since this has not been done since, the cost can be considered an additional capital cost bringing the total capital cost up to $754,870.
The cost of developing and putting in the digester can be broken-up into five main areas for Dairy 1’s digester system. The first area is the general cost of the digesters. This includes items like excavation, soil testing, piping, and lagoon lining and cover. The dairy estimates that this portion of the cost came to approximately $386,000 with the vast majority of this cost coming from the lagoon liner and cover as well as soil testing. The second major area of cost was for the power generation unit and the accompanying system components. This set of costs was estimated at $199,000. The engine generator itself was the largest expense in this area at approximately $67,500. The next set of major costs was considered start-up costs. These costs were approximately $99,000 with a majority of it, $60,000, being allocated to engineering cost. The final two areas of cost were the hydrogen sulfide filter and the general labor to put the whole system in. The filter was estimated to cost $30,000, while the labor was estimated to cost $28,000. To offset, these capital costs, the dairy received several grants from various sources including the USDA, the NRCS, the Dairy Power Production Program, and SMUD. These grants totaled $520,456. This brings Dairy 1’s total capital outlay to $234,414.
Several scenarios were investigated for estimating Dairy 1’s yearly capital costs for the digester. It was assumed that the interest rate to payback the loans was 5.35 percent and that it could be paid back over ten, fifteen, or twenty years. These capital costs were examined for the total capital cost and the offset capital costs of the digester due to the grants. Table 1 shows that if Dairy 1 had to pay back the full capital cost in a ten year horizon, it would cost $99,248 per year. If the costs could be amortized over twenty years, then the yearly capital cost would drop to $62,383. Given the large amount of grants the dairy received for the digester, the capital cost for ten years is $30,876 and for twenty years is $19,372.
18

Table 1: Dairy 1’s Yearly Capital Costs Based on Differing Payback Assumptions
Total Years For Capital Payback Dairy 1’s Capital Costs with Grants
Dairy 1’s Capital Costs without Grants
10 Years $30,876 $99,428 15 Years $23,121 $74,457 20 Years $19,372 $62,383
Given the learning curve that the dairy has undergone to operate the digester, it is challenging to estimate the true operating and maintenance cost of the operation. Records show that from the beginning of operation to the end of 2011, $12,070 was spent on various items with a bulk of the money going to engine upkeep. In the time period where there was continuous production, i.e., November 2009 to October 2010, the dairy had a maintenance expense of $5,442 for engine upkeep and other related expenses. The engine upkeep is primarily done by an individual who does not work for the dairy as an employee. While these costs represent primarily the engine upkeep, there are also general operating costs for the digester. The dairy estimates that it spends two hours per week to maintain the digester system in the dry weather months of the year. In the wet winter season this labor increases to six hours per week. The cost of this labor is valued at $15 per hour, bringing the total cost of labor to $2,340 per year. Summing this amount with the engine upkeep provides an estimated annual operating and maintenance costs of $7,782. This equates to $0.03404 per kWh operation and maintenance cost and represents 1.03 percent of the total capital costs. This amount is quite a bit lower than the ERG recommendation of using 3 percent of the capital outlay. If the dairy’s operating and maintenance cost were closer to the recommendation, then Dairy 1 would be spending approximately $22,646 per year.
2.4 Economic Analysis of Dairy 1’s Digester Operation
As mentioned above, the observation periods for the digester were done under a time period where the dairy will still attempting to learn how to operate it. This information cannot be considered a normal operating period. Based on the actual production data from November 2009 to October 2010, the simple payback period would be over 43 years to pay back the total initial capital outlay. When grants are factored in, the payback period reduces to 13.6 years. Assuming that the dairy can get up to 95 percent of its maximum capacity of the engine and it has an operating cost of 3 percent of initial capital outlay, it would have a net revenue above operating and maintenance cost of $19,903. This would imply that the simple payback period for the full capital outlay would be slightly less than 38 years. This reduces to 11.8 years when the dairy pays back the initial capital outlay minus the grant funding.
Examining the net income above operating and capital cost, assuming the dairy could produce at 95 percent of maximum capacity and has an operating cost of 3 percent of initial capital outlay, shows that with no grants Dairy 1 would make a negative net income for ten, fifteen, and twenty year payback periods. In the best case scenario with no grants, the ten year payback net income is negative $42,480. When the grants are factored in, the net income for a ten year payback is negative $10,972. This net income increases to $531 per year if the money can be paid
19

back over a twenty year time horizon. Given a discount rate of 5.35 percent, the dairies net present value of the digester is strongly negative when no grants are obtained for the capital costs (see Table 2). When grants are factored in, the net present value has a range of negative $8,420 to a positive $134,802 depending on whether the investment has a ten year or twenty year time horizon. Without the grant money, the internal rate of return is negative for the investment under a best case scenario, i.e., net revenue above operating and maintenance cost of $19,903. With the grant money under this base case scenario, the internal rate of return for the digester in a ten year time horizon is 4.58 percent. This rate increases to 9.42 percent and 11.20 percent for a fifteen and twenty year time horizon respectively.
Table 2: Dairy 1’s Net Present Value Based on Differing Payback Assumptions
Total Years Dairy 1’s Net Present Value with Grants
Dairy 1’s Net Present Value without Grants
10 Years -$8,420 -$502,446 15 Years $66,767 -$427,259 20 Years $124,706 -$369,320
For a twenty year time horizon, the return on investment given Dairy 1’ actual production data is -5.62 percent for the digester given the dairy received no grants. Given a ten year horizon, the return on investment is 0 percent. Factoring grants into the calculation of return on investment over twenty years shows a return of -1 percent for the digester. If Dairy 1 could get a flat rate from the local utility for all the power that it produces and it can produce at 95 percent of the engine capacity, then it would need an electricity rate of $0.29674 per kWh to achieve a 10 percent return on investment. This assumes that Dairy 1 is paying back the full capital costs over twenty years and is incurring the ERG recommended 3 percent operating cost. To get a 20 percent return on investment, the rate would need to be $0.43629 per kWh.
20

CHAPTER 4: Dairy 2 Results 4.1 Background Information on Dairy 2 Dairy 2 is located on the North Coast region of California. The main operation has approximately 310 cows that are milked twice daily. Another 50 dry cows are part of the operation but are not milked. The dairy also operates an on-site cheese plant. The dairy began operating an anaerobic methane digester in 2009 based on an ambient heat covered lagoon design. The digester system is built around a flush style manure management system. The lagoon has a carrying capacity of approximately 2.5 million gallons of effluent. The dairy also feeds the lagoon wastewater from the on-site cheese plant. The effluent that is generated from the anaerobic digestion process is primarily recycled for irrigation purposes. A screw press solids separator collects the fibrous solids, which gets composted and used for bedding and fertilizer.
The generator adopted by the dairy is a gas engine capable of producing 80kW of electrical power under ideal conditions. The generator takes gas from the digester that has been filtered through a system that removes hydrogen sulfide. A system has been put into place where excess gas beyond the storage capacity of the lagoon is flared, which rarely if ever happens. Except for scheduled and unscheduled down-time, the engine is running continuously at full level given the gas input. Hot water is generated by exhaust heat on the engine and is used to off-set propane costs for heating water on the operation. The generator is interconnected with the meter that the cheese plant is attached to allowing for the highest level of on-farm usage as possible.
4.2 Revenue from Dairy 2’s Digester The dairy currently is operating under a time-of-use net metering agreement with PG&E. This means that it gets four different prices for its electricity during the day in a particular season. These four different prices are related to whether it is peak or non-peak pricing and also whether the power is used on-farm or is “net metered” to PG&E. These prices are also different by season. The dairy’s current electrical rates from PG&E currently has summer pricing and winter pricing of electricity implying that it faces a total of eight different prices during the year.
Revenue from a digester under a net metering contract is not like typical revenue received from an enterprise. In the case of Dairy 2’s digester, the revenue is in the form of avoided costs from the purchases of electricity and propane. This makes it a challenge to immediately see how much revenue is being brought into Dairy 2’s operation from the digester because the dairy is not receiving a direct check for the power that it is producing. Since this dairy has an upper end to its propane and electricity costs, it has a potential limit on the amount of revenue it can generate from the digester. This is due to the stipulation in the net metering contract which requires the dairy to forfeit any excess power generated that cannot be used to offset other electricity demand from other meters associated with the dairy. It is possible that sizing a
21

digester based on the number of cows may cause power to be produced that has no value if the cost of electricity on the total operation is not higher than the amount of revenue that can be generated by the digester. This does not appear to be an issue for this operation.
Dairy 2 receives two main sources of revenue from the digester—avoided electricity costs and avoided propane costs for heating water for the dairy and cheese operations. The electricity avoided costs can be broken down into two areas, demand charges and electricity charges. A typical bill for the dairy shows a third cost component known as the service charge, but this charge does not show up as an avoided cost to running the anaerobic digester. The service charge is the cost of having the meter for the operation. Since the cost exists for the purposes of the cheese plant, this cost cannot be avoided by running the anaerobic digester. Hence, based on the spirit of the ERG protocol, it should not be counted in the revenue stream of running the digester. Most, if not all feasibility studies on anaerobic digesters, do not take this fact into consideration.
One of the revenue sources for the anaerobic digester at Dairy 2 is from electricity. The dairy is on a time-of-use net metering contract with PG&E. The time-of-use portion of the contract implies that the dairy gets a different rate depending on the time of day that power is used or generated. This is represented in Figure 1 which shows the rate that Dairy 2 receives for its energy production from January 2011 to December 2012. This rate is only for the energy charges and does not take into account the service or demand charges.
The net metering portion of the contract allows Dairy 2 to sell its excess power to PG&E. Technically the dairy is banking the value rather than strictly selling it to PG&E. The revenue generated from these sales allows Dairy 2 to offset a portion of their power purchase costs from any part of their operation they designate in their contract. Since there is currently no cost to adding a meter to the contract for the purposes of net metering, it makes the best sense to put all the meters on the contract that are allowed by PG&E. The portion that can be offset is the generation portion of the bill. This implies that net metered power can have a much lower value than power that is produced and consumed on-farm.
All the other components of the bill cannot be offset by net metered power. Subtracting approximately $0.03 per kWh provides the value of the net metered power in all seasons and times-of-use except for the peak period for summer. In the peak period for summer, another $0.017 per kWh needs to be subtracted from the rate. If any excess value from the net metered power exists after accounting for the allowable amount of charges, then the excess value can be forfeited to the utility company. Hence, under a time-of-use net metering contract, the dairy receives many different prices for its power generation.
22
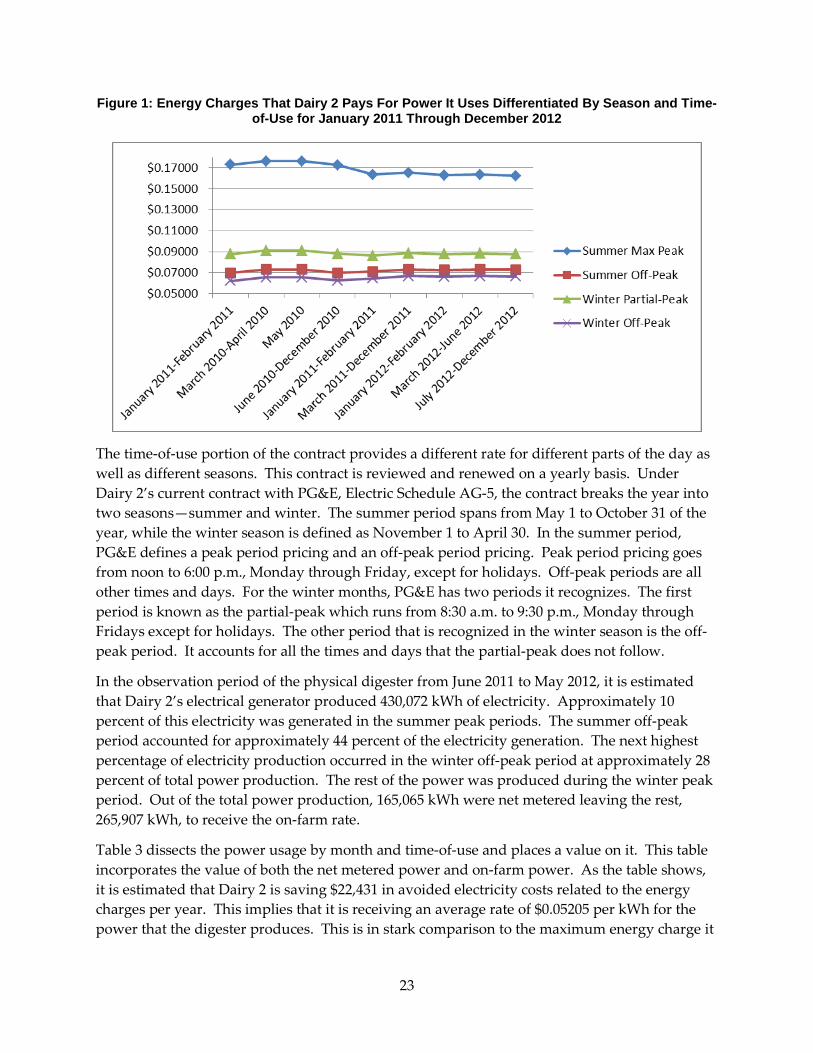
Figure 1: Energy Charges That Dairy 2 Pays For Power It Uses Differentiated By Season and Time-of-Use for January 2011 Through December 2012
The time-of-use portion of the contract provides a different rate for different parts of the day as well as different seasons. This contract is reviewed and renewed on a yearly basis. Under Dairy 2’s current contract with PG&E, Electric Schedule AG-5, the contract breaks the year into two seasons—summer and winter. The summer period spans from May 1 to October 31 of the year, while the winter season is defined as November 1 to April 30. In the summer period, PG&E defines a peak period pricing and an off-peak period pricing. Peak period pricing goes from noon to 6:00 p.m., Monday through Friday, except for holidays. Off-peak periods are all other times and days. For the winter months, PG&E has two periods it recognizes. The first period is known as the partial-peak which runs from 8:30 a.m. to 9:30 p.m., Monday through Fridays except for holidays. The other period that is recognized in the winter season is the off-peak period. It accounts for all the times and days that the partial-peak does not follow.
In the observation period of the physical digester from June 2011 to May 2012, it is estimated that Dairy 2’s electrical generator produced 430,072 kWh of electricity. Approximately 10 percent of this electricity was generated in the summer peak periods. The summer off-peak period accounted for approximately 44 percent of the electricity generation. The next highest percentage of electricity production occurred in the winter off-peak period at approximately 28 percent of total power production. The rest of the power was produced during the winter peak period. Out of the total power production, 165,065 kWh were net metered leaving the rest, 265,907 kWh, to receive the on-farm rate.
Table 3 dissects the power usage by month and time-of-use and places a value on it. This table incorporates the value of both the net metered power and on-farm power. As the table shows, it is estimated that Dairy 2 is saving $22,431 in avoided electricity costs related to the energy charges per year. This implies that it is receiving an average rate of $0.05205 per kWh for the power that the digester produces. This is in stark comparison to the maximum energy charge it
23

receives in its peak period of over $0.17 per kWh. This is due to the fact that over 90 percent of the power produced is not at this highest rate. Examining the monthly revenues shows that the maximum revenue was received in September 2011, while the lowest amount came in April 2012.
Table 3: Amount of Revenue Generated by Dairy 2’s Digester by Season and Rate
Peak Summer Off-Peak Summer
Partial-Peak Winter
Off-Peak Winter
Month June 2011 $517 $857 July 2011 $566 $1,075 August 2011 $951 $1,686 September 2011 $1,231 $2,191 October 2011 $813 $1,608 November 2011 $1,058 $1,110 December 2011 $1,223 $1,282 January 2012 $713 $677 February 2012 $427 $486 March 2012 $853 $870 April 2012 $400 $452 May 2012 $506 $879 Total $4,583 $8,297 $4,674 $4,878 Grand Total $22,431
The second avoided cost regarding electricity is the demand charges. These charges can represent a major component of the electricity bill. The demand charges are based upon the maximum amount of kilowatts that are needed at any given time for the particular meter, i.e., these charges are based upon the maximum load demand the operation needs from the meter. The way PG&E calculates the demand charges for Dairy 2 is that it takes the maximum amount of kW that are demanded in any 15 minute interval during the month. They multiply this maximum amount by the particular demand charge which is based on the season. In the period of observation the demand charges for the peak period were between $7.02 per kW to $7.49 per kW. PG&E also charges a monthly demand charge for maximum demand for the month in each summer billing period. This rate has fluctuated from $10.75 to $11.83 per kW. In the winter season, this charge drops to a range of $4.09 to $4.65 per kW and is charged only on the maximum demand that occurs in the billing cycle. The only way Dairy 2 is able to avoid these costs is by operating their generator continuously during the period of operation. This is not too difficult for the summer peak periods when the window is only six hours, but it can be more challenging in the off-peak period of the summer. Based on the production data and records provided by Dairy 2, it is estimated that the operation is saving approximately $4,205 per year in demand charges. A majority of this savings comes from the peak period at a yearly value of $2,621. Taking the total amount of savings from demand charges and dividing it by total kWh produced by the generator gives a rate of $0.00976 per kWh. Summing the avoided energy charges and the demand charges gives a total value of electricity production of $26,636 per year. This brings the total rate received by Dairy 2 for its electricity production to be $0.0618 per kWh.
24
Outside of electricity generation, another source of indirect income comes from the avoided costs spent on propane to heat water for washing purposes. To estimate the amount of propane that is being offset, the amount of heat from the heat monitoring device put on the boiler was utilized. It is estimated that Dairy 2’s electric engine provided 1.407 billion BTU’s of heat to the boiler during the observation period. Utilizing a conversion factor of 91,500 BTU’s are equivalent to 1 gallon of propane, the dairy saved 15,372 gallons of propane. Propane costs are highly volatile in the region the dairy is located. The dairy estimates in the summer months that it pays approximately $3.00 per gallon, while in the winter season the value is closer to $1.60 per gallon. At an average cost of $2.30 per gallon of propane, it is saving $35,356 per year in propane expense. Summing this amount with the avoided electricity costs gives a savings from operating the digester at $61,992.
4.3 Capital and Operating Cost of Dairy 2’s Anaerobic Digester The total capital cost to build the anaerobic digester system around the existing dairy was approximately $625,000. A large percentage of this cost, $200,000, was used to upgrade the current lagoon and to add another lagoon. The pond cover and liner cost approximately $80,000. The engine cost approximately $100,000 and another $65,000 for the electrical interconnection to the grid. The other major expense for building the digester was the engineering and design costs at $60,000. A few of the minor costs going into the development of the digester were adding the necessary pipeline ($15,000), gas scrubber ($10,000), and the permits ($5,000). The rest of the costs were from various other sources. Approximately two-thirds of the capital cost of the digester was funded by grants, while the rest was funded by cash from the operation.
Table 4 provides the annual payment that would need to occur to payback the initial capital costs $625,000 at an interest rate of 5.35 percent for multiple payback periods. In this table three payback periods were examined—ten years, fifteen years, and twenty years. It has been assumed that there will be no need to upgrade any of the major equipment. Dairy 2 expects that it may need to upgrade its engine and lagoon cover after ten years at a current estimated cost of $90,000. This table also examines the actual capital costs that the dairy incurred given that the dairy received $412,000 in grants. Technically, Dairy 2 paid for the leftover digester cost from part of the equity built-up in the farm and did not take out a loan for the digester. Given an initial capital cost of $625,000 without grants, an interest rate of 5.35 percent, and a payback period of ten years, the dairy could expect to pay a yearly capital cost of $82,322. This amount of money represents the total yearly capital cost that it would have had to pay if the dairy had to borrow money for the complete capital cost. Since the dairy received sizable grant funding, the actual yearly capital cost that it incurred for a ten year payback would be $28,055. If the digesters and all of its components could last a full twenty years, then the total yearly capital costs for the digester would be $51,651. Dairy 2’s portion of this cost would be $17,603.
25

Table 4: Dairy 2’s Yearly Capital Costs Based on Differing Payback Assumptions
Total Years For Capital Payback With No Upgrades
Dairy 2’s Capital Costs with Grants Cost
Dairy 2’s Capital Costs Without Grants
10 Years $28,055 $82,322 15 Years $21,009 $61,647 20 Years $17,603 $51,651 There are several operational costs that Dairy 2 identified to keep their digester generating power. The current major expenses for operating are the oil and filter change, general upkeep and repairs to the engine, operational and maintenance time, the maintenance contract with Martin Machinery, changing the carbon filters, and replacement of the engine heads. The dairy estimates that the operation needs to conduct filter and oil replacements for the engine on a monthly basis. The dairy estimates this cost to be $175 a month which is equated to a $2,100 yearly cost. It is estimated that 6 hours a month are required for general maintenance and upkeep of the anaerobic digester system. The hourly cost for this labor is approximately $40 which gives a total yearly cost of $2,880. Some of the engine upkeep is outsourced to a local individual. It is estimated that this cost comes to $170 per month. This equates to a yearly cost of $2,040. Dairy 2 has a three year general maintenance contract with the machinery provider. This was a required cost when the engine was installed and will not be renewed once the contract has expired. This cost is not considered in the operation and maintenance cost. Another major cost is related to replacement of the heads on the engine. It was initially estimated that this will need to occur every 20,000 hours. After 22,000 hours of operation, the heads still appear to be in good shape. The dairy believes they can get approximately 35,000 hours out of them. Utilizing a replacement time of 4 years and an estimated cost of $12,000, the yearly cost comes to $3,000. The last major expense is related to changing the carbon filter. This cost was estimated from an estimated $3,000 cost that needs to be incurred every 1.5 years making the yearly cost $2,000. Miscellaneous expenses are estimated at $1,200 per year. Summing all these operational costs provides a total yearly operational and maintenance cost of $13,220. This represents approximately 2.12 percent of total capital costs. Given the kWh production, the operating and maintenance cost is $0.03074 per kWh. If Dairy 2’s costs were closer to what the ERG protocol suggests, the annual operating and maintenance cost should be $18,750, which equates to $0.04360 per kWh. If the machinery contract was added into the dairy’s expenses for operation, the yearly cost would be $16,553.
4.4 Economic Analysis of Dairy 2’s Digester Operation Given yearly gross revenue of $61,992 and corresponding operating cost of $13,220, the estimated net revenue above operating cost is $48,772. Given the full capital cost of $625,000, the simple payback period for the digester given receiving no grant is 12.81 years. With the grants, the payback period is reduced to 4.37 years. If the dairy’s operating cost were closer to the ERG protocol, then the simple payback period would be 14.45 years for the full capital cost, and 4.93 years for the incurred capital costs.
26
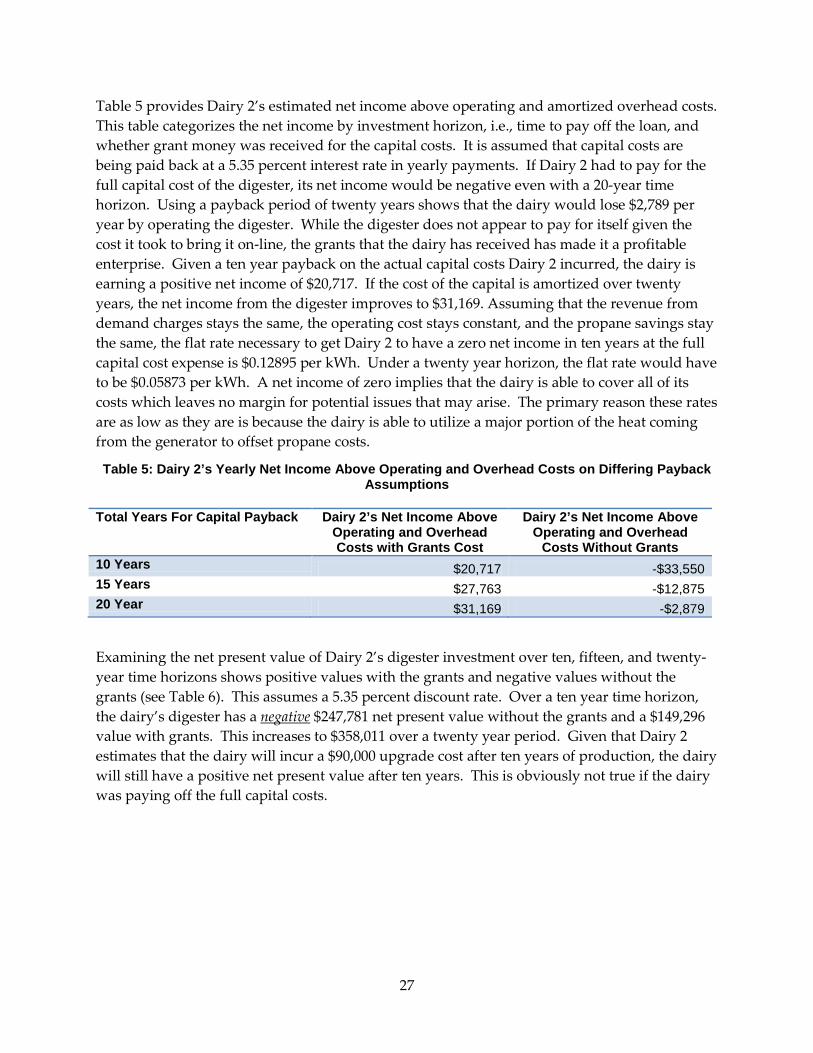
Table 5 provides Dairy 2’s estimated net income above operating and amortized overhead costs. This table categorizes the net income by investment horizon, i.e., time to pay off the loan, and whether grant money was received for the capital costs. It is assumed that capital costs are being paid back at a 5.35 percent interest rate in yearly payments. If Dairy 2 had to pay for the full capital cost of the digester, its net income would be negative even with a 20-year time horizon. Using a payback period of twenty years shows that the dairy would lose $2,789 per year by operating the digester. While the digester does not appear to pay for itself given the cost it took to bring it on-line, the grants that the dairy has received has made it a profitable enterprise. Given a ten year payback on the actual capital costs Dairy 2 incurred, the dairy is earning a positive net income of $20,717. If the cost of the capital is amortized over twenty years, the net income from the digester improves to $31,169. Assuming that the revenue from demand charges stays the same, the operating cost stays constant, and the propane savings stay the same, the flat rate necessary to get Dairy 2 to have a zero net income in ten years at the full capital cost expense is $0.12895 per kWh. Under a twenty year horizon, the flat rate would have to be $0.05873 per kWh. A net income of zero implies that the dairy is able to cover all of its costs which leaves no margin for potential issues that may arise. The primary reason these rates are as low as they are is because the dairy is able to utilize a major portion of the heat coming from the generator to offset propane costs.
Table 5: Dairy 2’s Yearly Net Income Above Operating and Overhead Costs on Differing Payback Assumptions
Total Years For Capital Payback Dairy 2’s Net Income Above Operating and Overhead Costs with Grants Cost
Dairy 2’s Net Income Above Operating and Overhead
Costs Without Grants 10 Years $20,717 -$33,550 15 Years $27,763 -$12,875 20 Year $31,169 -$2,879
Examining the net present value of Dairy 2’s digester investment over ten, fifteen, and twenty-year time horizons shows positive values with the grants and negative values without the grants (see Table 6). This assumes a 5.35 percent discount rate. Over a ten year time horizon, the dairy’s digester has a negative $247,781 net present value without the grants and a $149,296 value with grants. This increases to $358,011 over a twenty year period. Given that Dairy 2 estimates that the dairy will incur a $90,000 upgrade cost after ten years of production, the dairy will still have a positive net present value after ten years. This is obviously not true if the dairy was paying off the full capital costs.
27
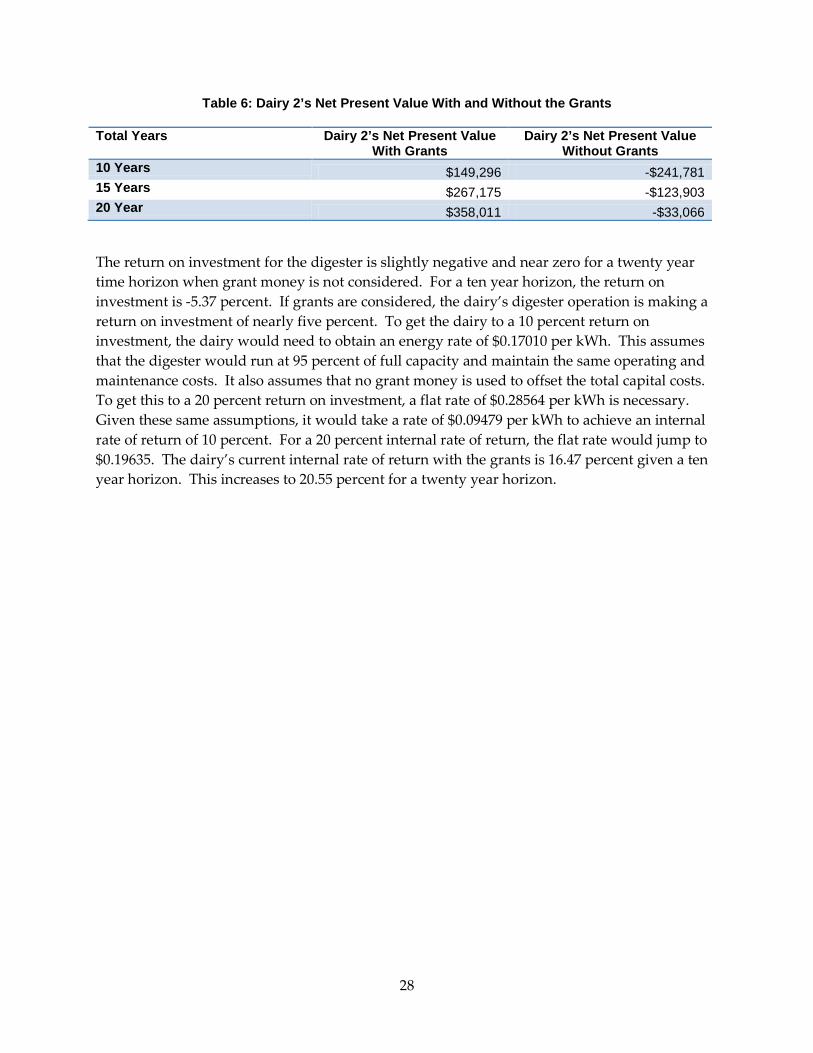
Table 6: Dairy 2’s Net Present Value With and Without the Grants
Total Years Dairy 2’s Net Present Value With Grants
Dairy 2’s Net Present Value Without Grants
10 Years $149,296 -$241,781 15 Years $267,175 -$123,903 20 Year $358,011 -$33,066
The return on investment for the digester is slightly negative and near zero for a twenty year time horizon when grant money is not considered. For a ten year horizon, the return on investment is -5.37 percent. If grants are considered, the dairy’s digester operation is making a return on investment of nearly five percent. To get the dairy to a 10 percent return on investment, the dairy would need to obtain an energy rate of $0.17010 per kWh. This assumes that the digester would run at 95 percent of full capacity and maintain the same operating and maintenance costs. It also assumes that no grant money is used to offset the total capital costs. To get this to a 20 percent return on investment, a flat rate of $0.28564 per kWh is necessary. Given these same assumptions, it would take a rate of $0.09479 per kWh to achieve an internal rate of return of 10 percent. For a 20 percent internal rate of return, the flat rate would jump to $0.19635. The dairy’s current internal rate of return with the grants is 16.47 percent given a ten year horizon. This increases to 20.55 percent for a twenty year horizon.
28
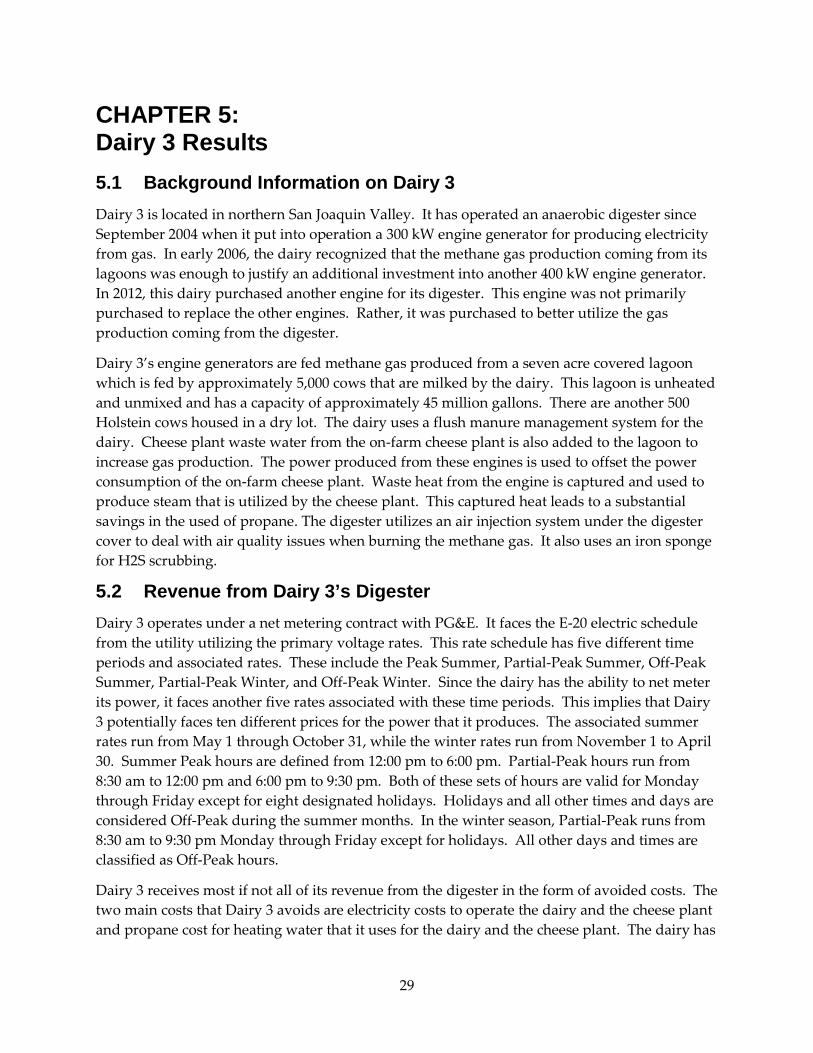
CHAPTER 5: Dairy 3 Results 5.1 Background Information on Dairy 3 Dairy 3 is located in northern San Joaquin Valley. It has operated an anaerobic digester since September 2004 when it put into operation a 300 kW engine generator for producing electricity from gas. In early 2006, the dairy recognized that the methane gas production coming from its lagoons was enough to justify an additional investment into another 400 kW engine generator. In 2012, this dairy purchased another engine for its digester. This engine was not primarily purchased to replace the other engines. Rather, it was purchased to better utilize the gas production coming from the digester.
Dairy 3’s engine generators are fed methane gas produced from a seven acre covered lagoon which is fed by approximately 5,000 cows that are milked by the dairy. This lagoon is unheated and unmixed and has a capacity of approximately 45 million gallons. There are another 500 Holstein cows housed in a dry lot. The dairy uses a flush manure management system for the dairy. Cheese plant waste water from the on-farm cheese plant is also added to the lagoon to increase gas production. The power produced from these engines is used to offset the power consumption of the on-farm cheese plant. Waste heat from the engine is captured and used to produce steam that is utilized by the cheese plant. This captured heat leads to a substantial savings in the used of propane. The digester utilizes an air injection system under the digester cover to deal with air quality issues when burning the methane gas. It also uses an iron sponge for H2S scrubbing.
5.2 Revenue from Dairy 3’s Digester Dairy 3 operates under a net metering contract with PG&E. It faces the E-20 electric schedule from the utility utilizing the primary voltage rates. This rate schedule has five different time periods and associated rates. These include the Peak Summer, Partial-Peak Summer, Off-Peak Summer, Partial-Peak Winter, and Off-Peak Winter. Since the dairy has the ability to net meter its power, it faces another five rates associated with these time periods. This implies that Dairy 3 potentially faces ten different prices for the power that it produces. The associated summer rates run from May 1 through October 31, while the winter rates run from November 1 to April 30. Summer Peak hours are defined from 12:00 pm to 6:00 pm. Partial-Peak hours run from 8:30 am to 12:00 pm and 6:00 pm to 9:30 pm. Both of these sets of hours are valid for Monday through Friday except for eight designated holidays. Holidays and all other times and days are considered Off-Peak during the summer months. In the winter season, Partial-Peak runs from 8:30 am to 9:30 pm Monday through Friday except for holidays. All other days and times are classified as Off-Peak hours.
Dairy 3 receives most if not all of its revenue from the digester in the form of avoided costs. The two main costs that Dairy 3 avoids are electricity costs to operate the dairy and the cheese plant and propane cost for heating water that it uses for the dairy and the cheese plant. The dairy has
29

placed the electrical engines from the digester on the same meter as the cheese plant. The dairy has a large electrical load and need for heat because of this facility. This allows the dairy to receive “retail rates” for most of the power and heat it produces. Dairy 3 has three major charges on its bill. These are the service charges (Customer/Meter Charge Rates), the demand charges, and the energy charges. Since the service charges exist whether the dairy produces power or not, it is not a cost that the dairy can avoid. The only way for the dairy to avoid this cost is to be self-sufficient on the power that it produces for the meter.
The demand charges are charged on a per kW basis. These charges are for the maximum demand that the dairy has for power in any 15-minute time interval during the billing cycle depending on the time-of-use. To avoid these charges, the digester engines need to be operational continuously throughout the billing cycle. Maintenance and unforeseen events make this very difficult to achieve. With the two engines, Dairy 3 does have the ability to potentially garner some of these costs as revenue if it brings one engine down for service/maintenance while the other one is operating and targets the times strategically. The dairy has found it challenging to capture all of these costs due to the nature of operating a digester, but has managed to recapture a portion of the demand charges.
The energy charges are based on the kWh. The two main charges are made up of generation charges and distribution charges. The other charges are for transmission rate adjustments, public purpose programs, nuclear decommissioning, competition transition charge, energy cost recovery amount, DWR bond, and new system generation charge. These second set of charges are subtracted from the generation and distribution charges when the power is net metered. Due to the size of the electrical load the dairy’s electrical generators are on, it appears that no power is charged at the net metered rate based on its net metering contract. Hence, for all practical purposes it is always receiving the on-farm rate.
Figure 2 provides a brief historical look at Dairy 3’s electrical rates by season and time-of-use over the last three years. The figure shows that the dairy has faced changing prices for the electricity it generates over this three year period; in this period there were 11 different rate changes. In 2009 all rates were increasing. In 2010, the summer max peak rate started a decline. From its maximum to its minimum, the price dropped over $0.03 per kWh. For the summer period all prices have declined from January 2009 to December 2012. The winter prices have increased slightly from January 2009 to December 2012. This highlights the potential risk associated with operating a digester—electricity prices do not always have to increase.
30
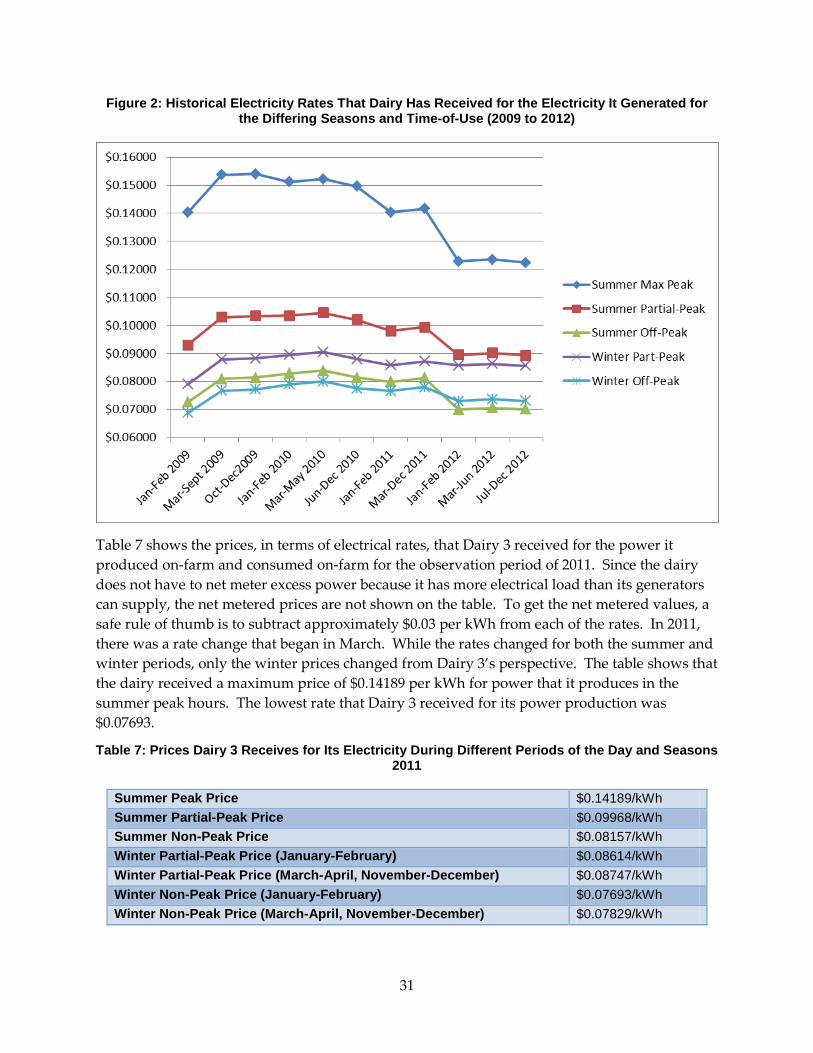
Figure 2: Historical Electricity Rates That Dairy Has Received for the Electricity It Generated for the Differing Seasons and Time-of-Use (2009 to 2012)
Table 7 shows the prices, in terms of electrical rates, that Dairy 3 received for the power it produced on-farm and consumed on-farm for the observation period of 2011. Since the dairy does not have to net meter excess power because it has more electrical load than its generators can supply, the net metered prices are not shown on the table. To get the net metered values, a safe rule of thumb is to subtract approximately $0.03 per kWh from each of the rates. In 2011, there was a rate change that began in March. While the rates changed for both the summer and winter periods, only the winter prices changed from Dairy 3’s perspective. The table shows that the dairy received a maximum price of $0.14189 per kWh for power that it produces in the summer peak hours. The lowest rate that Dairy 3 received for its power production was $0.07693.
Table 7: Prices Dairy 3 Receives for Its Electricity During Different Periods of the Day and Seasons 2011
Summer Peak Price $0.14189/kWh Summer Partial-Peak Price $0.09968/kWh Summer Non-Peak Price $0.08157/kWh Winter Partial-Peak Price (January-February) $0.08614/kWh Winter Partial-Peak Price (March-April, November-December) $0.08747/kWh Winter Non-Peak Price (January-February) $0.07693/kWh Winter Non-Peak Price (March-April, November-December) $0.07829/kWh
31

In 2011, the dairy produced 5,792,909 kWh of electricity which represents nearly 85 percent of its theoretical maximum. Out of this total, 9.05 percent was produced during summer peak hours, 10.58 percent was produced during the partial peak summer hours, 32.55 percent was generated during the off-peak hours of summer, 17.89 percent came from partial peak winter hours, and 29.94 percent was produced during the winter off-peak hours. Applying the time-of-use seasonal rates shows that Dairy 3 earned $514,401 for the electricity generated. The average rate per kWh given the dairy’s total production in 2011 was $0.08880 per kWh. A categorization of the revenue by month and time-of-use is presented in Table 8. This table shows that the largest amount of revenue was made during the off-peak summer period. The winter off-peak period was the second largest revenue producer at $134,981. Even though rates are lower in the off-peak periods, the amount of power generation that occurs in these periods is much higher than the others.
Table 8: Amount of Revenue Generated by Dairy 3’s Digester by Season and Rate for Energy Charges Avoided
Peak Summer
Partial-Peak Summer
Off-Peak Summer
Partial-Peak Winter
Off-Peak Winter
Month January 2011 $15,163 $23,307 February 2011 $15,063 $21,505 March 2011 $16,649 $23,103 April 2011 $13,846 $22,774 May 2011 $12,022 $9,867 $24,931 June 2011 $11,085 $9,325 $23,462 July 2011 $12,661 $10,137 $27,654 August 2011 $13,127 $10,930 $25,464 September 2011 $13,177 $10,733 $24,916 October 2011 $12,278 $10,090 $27,363 November 2011 $14,281 $20,280 December 2011 $15,195 $24,012 Total $74,350 $61,082 $153,790 $90,198 $134,981 Grand Total $514,401 The other source of revenue for Dairy 3 that came from electricity production was avoided demand charges. Demand charges are charged for the maximum amount of kW used in any increment in the time-of-use period and season. In the summer season, there are demand charges for the maximum amount of kW demanded during peak times, during partial-peak periods, and for the total month. In the winter season, the dairy is charged for the maximum kW demand during the partial peak period and the total month. These costs represent the amount of money the dairy saved by reducing its recorded overall demand for kW. Table 9 provides a view of the amount of money that is saved by month during different time-of-use periods and seasons. It is estimated that Dairy 3 was able to save $80,425 in demand charges. Factoring in the demand charges that were avoided along with the electricity charges avoided, the dairy received an average rate of $0.10268 per kWh for the power it produced in 2011.
32
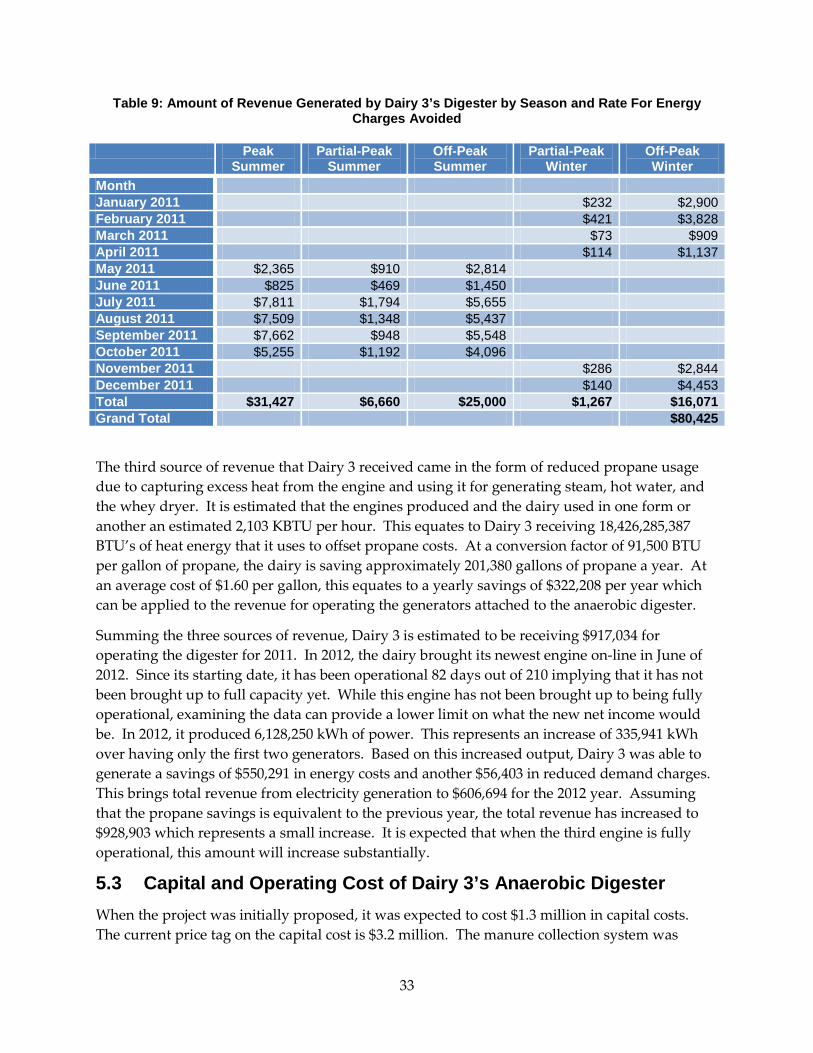
Table 9: Amount of Revenue Generated by Dairy 3’s Digester by Season and Rate For Energy Charges Avoided
Peak Summer
Partial-Peak Summer
Off-Peak Summer
Partial-Peak Winter
Off-Peak Winter
Month January 2011 $232 $2,900 February 2011 $421 $3,828 March 2011 $73 $909 April 2011 $114 $1,137 May 2011 $2,365 $910 $2,814 June 2011 $825 $469 $1,450 July 2011 $7,811 $1,794 $5,655 August 2011 $7,509 $1,348 $5,437 September 2011 $7,662 $948 $5,548 October 2011 $5,255 $1,192 $4,096 November 2011 $286 $2,844 December 2011 $140 $4,453 Total $31,427 $6,660 $25,000 $1,267 $16,071 Grand Total $80,425
The third source of revenue that Dairy 3 received came in the form of reduced propane usage due to capturing excess heat from the engine and using it for generating steam, hot water, and the whey dryer. It is estimated that the engines produced and the dairy used in one form or another an estimated 2,103 KBTU per hour. This equates to Dairy 3 receiving 18,426,285,387 BTU’s of heat energy that it uses to offset propane costs. At a conversion factor of 91,500 BTU per gallon of propane, the dairy is saving approximately 201,380 gallons of propane a year. At an average cost of $1.60 per gallon, this equates to a yearly savings of $322,208 per year which can be applied to the revenue for operating the generators attached to the anaerobic digester.
Summing the three sources of revenue, Dairy 3 is estimated to be receiving $917,034 for operating the digester for 2011. In 2012, the dairy brought its newest engine on-line in June of 2012. Since its starting date, it has been operational 82 days out of 210 implying that it has not been brought up to full capacity yet. While this engine has not been brought up to being fully operational, examining the data can provide a lower limit on what the new net income would be. In 2012, it produced 6,128,250 kWh of power. This represents an increase of 335,941 kWh over having only the first two generators. Based on this increased output, Dairy 3 was able to generate a savings of $550,291 in energy costs and another $56,403 in reduced demand charges. This brings total revenue from electricity generation to $606,694 for the 2012 year. Assuming that the propane savings is equivalent to the previous year, the total revenue has increased to $928,903 which represents a small increase. It is expected that when the third engine is fully operational, this amount will increase substantially.
5.3 Capital and Operating Cost of Dairy 3’s Anaerobic Digester When the project was initially proposed, it was expected to cost $1.3 million in capital costs. The current price tag on the capital cost is $3.2 million. The manure collection system was
33
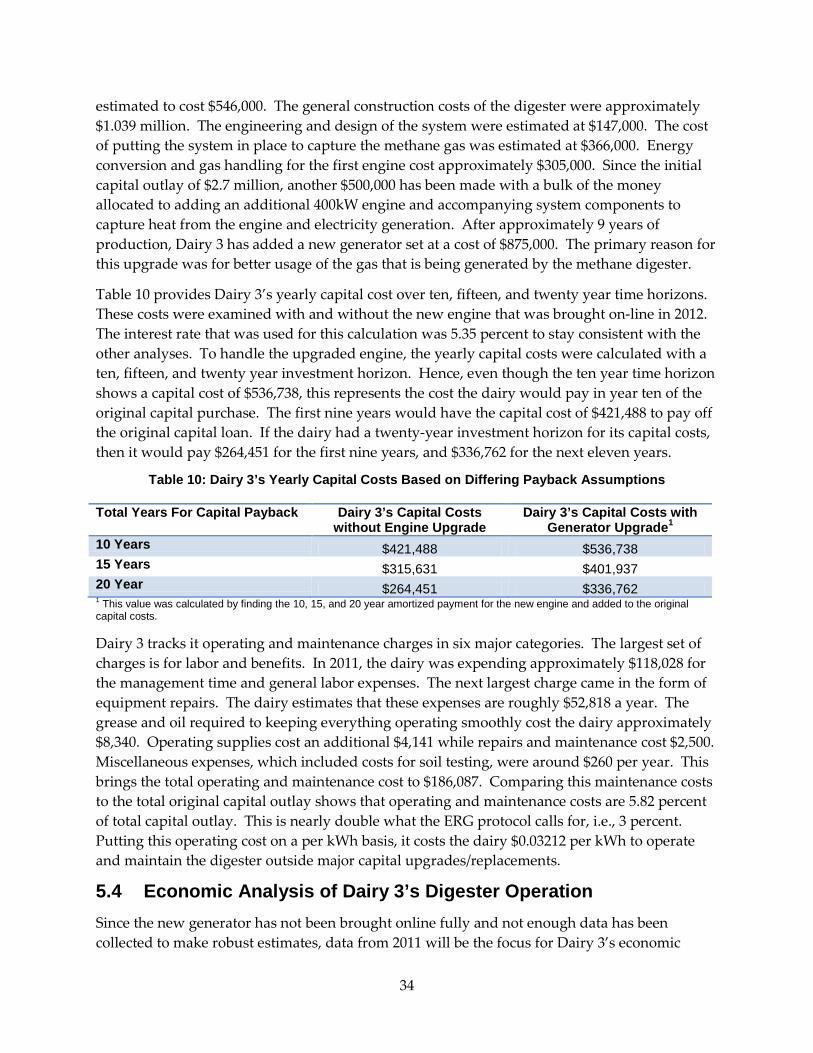
estimated to cost $546,000. The general construction costs of the digester were approximately $1.039 million. The engineering and design of the system were estimated at $147,000. The cost of putting the system in place to capture the methane gas was estimated at $366,000. Energy conversion and gas handling for the first engine cost approximately $305,000. Since the initial capital outlay of $2.7 million, another $500,000 has been made with a bulk of the money allocated to adding an additional 400kW engine and accompanying system components to capture heat from the engine and electricity generation. After approximately 9 years of production, Dairy 3 has added a new generator set at a cost of $875,000. The primary reason for this upgrade was for better usage of the gas that is being generated by the methane digester.
Table 10 provides Dairy 3’s yearly capital cost over ten, fifteen, and twenty year time horizons. These costs were examined with and without the new engine that was brought on-line in 2012. The interest rate that was used for this calculation was 5.35 percent to stay consistent with the other analyses. To handle the upgraded engine, the yearly capital costs were calculated with a ten, fifteen, and twenty year investment horizon. Hence, even though the ten year time horizon shows a capital cost of $536,738, this represents the cost the dairy would pay in year ten of the original capital purchase. The first nine years would have the capital cost of $421,488 to pay off the original capital loan. If the dairy had a twenty-year investment horizon for its capital costs, then it would pay $264,451 for the first nine years, and $336,762 for the next eleven years.
Table 10: Dairy 3’s Yearly Capital Costs Based on Differing Payback Assumptions
Total Years For Capital Payback Dairy 3’s Capital Costs without Engine Upgrade
Dairy 3’s Capital Costs with Generator Upgrade1
10 Years $421,488 $536,738 15 Years $315,631 $401,937 20 Year $264,451 $336,762 1 This value was calculated by finding the 10, 15, and 20 year amortized payment for the new engine and added to the original capital costs.
Dairy 3 tracks it operating and maintenance charges in six major categories. The largest set of charges is for labor and benefits. In 2011, the dairy was expending approximately $118,028 for the management time and general labor expenses. The next largest charge came in the form of equipment repairs. The dairy estimates that these expenses are roughly $52,818 a year. The grease and oil required to keeping everything operating smoothly cost the dairy approximately $8,340. Operating supplies cost an additional $4,141 while repairs and maintenance cost $2,500. Miscellaneous expenses, which included costs for soil testing, were around $260 per year. This brings the total operating and maintenance cost to $186,087. Comparing this maintenance costs to the total original capital outlay shows that operating and maintenance costs are 5.82 percent of total capital outlay. This is nearly double what the ERG protocol calls for, i.e., 3 percent. Putting this operating cost on a per kWh basis, it costs the dairy $0.03212 per kWh to operate and maintain the digester outside major capital upgrades/replacements.
5.4 Economic Analysis of Dairy 3’s Digester Operation Since the new generator has not been brought online fully and not enough data has been collected to make robust estimates, data from 2011 will be the focus for Dairy 3’s economic
34

analysis. Dairy 3’s dairy digester is bringing in net revenue above operating cost of $730,947. This implies that with a $3.2 million original capital cost, the dairy has a simple payback period of 4.38 years. Adding the capital cost of the newest engine only increases the simple payback to 5.57 years. Following the ERG protocol to examine net income, it is estimated that Dairy 3 is making a yearly net income above operating and capital costs of $309,460 for a ten year payback cycle on its capital costs. When pushing the capital payback period to a twenty year time horizon, the dairy is making a net income of $466,496 per year. For a fifteen year payback, this value declines to $415,316. Under all three of these scenarios, Dairy 3’s digester is profitable and able to cover both its fixed and overhead costs.
Examining the net present value confirms that Dairy 3 has made a wise investment decision. Given a 5.35 percent discount rate, its net present value is $5.36 million over a twenty year investment horizon. This decreases to $4.00 million when evaluating the net present value at a fifteen year time horizon. Shrinking the time horizon to ten years provides a net present value of $2.23 million. Focusing on the internal rate of return measure, Dairy 3 is achieving an 18.74 percent internal rate of return over a ten year time horizon. At a twenty year time horizon, it has achieved a 22.44 percent internal rate of return. The dairy is currently receiving a ten year return on investment of 9.67 percent. For a twenty year investment horizon, the return on investment is 14.58 percent. If the dairy could get a fixed rate for its electrical power that it produced which covered its energy cost and its demand charges, it would need a utility rate of $0.07739 per kWh to receive a 10 percent return on its investment and a utility rate of $0.13263 per kWh to receive a 20 percent return on its investment. This assumes that Dairy 3 has a twenty year payback on its capital costs and it continues to get the same value from its propane savings.
Dairy 3 was able to receive grants of over $800,000 to assist in getting its digester operating. One of their grants was from the California Dairy Power Production Program, while another was from the California Self-generation Incentive Program. Given that this money reduces the initial capital costs, Dairy 3’s simple payback period, net present values, and internal rate of return considerably improve. Dairy 3 provides evidence that a methane digester can be a feasible investment for a large scale dairy that also has a large electrical load attached to it and a high need for usage of the heat coming from the engine. In the case of Dairy 3, it stems from the cheese plant.
35

CHAPTER 6: Dairy 4 Results 6.1 Background Information on Dairy 4 Dairy 4 is located in the Central Valley near Sacramento. It has been operating a methane digester since April 2009, utilizing manure from approximately 850 milking cows and 200 dry cows which feeds the digester system. The dairy utilizes a flush manure management system which takes dairy waste from the freestall barns to a collection pond. Waste from the milking parlor can be diverted into the digester. The digester is an in-ground complete mix covered lagoon digester system that utilizes captured heat from the engine to heat the digester. The digester has six internal mixers that run intermittently.
The engine generator for the digester can generate 212 kW utilizing biogas. The engine is rated at 225 kW on natural gas. The system has an H2S scrubber and a biogas chiller for vapor removal. The system is set-up with a flare to handle any excess biogas that cannot be stored and burned. The system is designed to handle other feed stocks other than dairy manure, but this attribute has not been utilized during the period of operation. Digested manure is reused for flushing the manure and is used for irrigation of crops. The digester has a flare to burn any excess methane gas the engine generator cannot handle.
6.2 Revenue from Dairy 4’s Digester
Dairy 4 has a ten year power purchase agreement with Sacramento Metropolitan Utility District (SMUD). The dairy sells all the power it generates directly to SMUD for $0.058 per kWh. SMUD has acquired the rights from the dairy to sell any renewable energy credits. The period of observation for the technical details of the digester was between January 2010 and December 2011. In this time period, the dairy produced 618,766 kWh of electricity in 2010. In 2011, the digester had technical issues that caused it to be down for four months at the end of the year. This caused the engine to only produce 169,004 kWh of electricity in 2011. Given the flat rate that Dairy 4 receives for the power that is produced by the dairy, it is estimated that it received $35,888 in revenue for 2010 and $9,082 in 2011. In 2010, there were several months where the dairy had methane going to the flare. For the rest of the months, it appears that the operation was able to utilize all the gas that was produced by the digester. If the dairy could have burned the gas that was flared in 2010, it is estimated that the engines from the digester could produce an additional 189,464 kWh of electricity. This would have brought in an additional $10,989. This value, added with the actual amount that was generated in 2010, gives a total revenue of $46,877. Under the gas production ability of 2010, this represents the maximum amount of revenue the dairy can achieve from its electricity production. If the dairy could operate the generator at 212 kW continuously through the year 95 percent of the time, the digester would have the ability to produce 1,764,264 kWh. This equates to a maximum achievable revenue of $102,327. This represents the future maximum revenue if the dairy has the ability to increase its gas production; possibly by adding other feed stocks. The dairy also sell its solids it gets from
36
the solid separator. Following the ERG protocol, these have not been factored into the estimation of revenue.
6.3 Capital and Operating Cost of Dairy 4’s Anaerobic Digester
The digester is estimated to cost $1.7 million fully installed. The engineering costs to develop the digester system were estimated at $100,000. The engine alone cost $200,000, while the electrical interconnection fee was $100,000. The gas scrubber cost approximately $60,000. Most of the cost to the digester, $1.2 million, went to the labor and components to put the digester in. Some of the major components were the lagoon cover and liner, the mixing system for the digester, and the concrete work to replace the existing clay lagoon. To offset the costs of the lagoon system, Dairy 4 received grants worth $1.2 million. The dairy received $500,000 from the USDA Rural Energy for America Program. The Natural Resources Conservation Services of the USDA provided another $250,000. The utility district that the dairy is affiliated with provided an additional $250,000 grant. The California Energy Commission provided $200,000 to the project. The leftover expense to putting the digester in was financed with a 5.35 percent APR bank loan.
Table 11 provides the amortized payments of the capital cost utilizing a 5.35 percent interest rate for differing payback periods. The payments are assumed to occur on a yearly basis. If the dairy had to pay the full capital cost over a ten-year time horizon, the payment would be $223,915 per year. Stretching the payback period over a twenty year time horizon reduces this payment to $140,940 per year. Since the dairy received $1.2 million in grants, it only needed to repay $500,000. The estimated payment over a ten-year payback time horizon is $65,857 per year. This decreases to $41,321 per year if the payments occur over a twenty-year time horizon.
Table 11: Dairy 4’s Yearly Capital Costs Based on Differing Payback Assumptions
Total Years For Capital Payback Dairy 4’s Capital Costs with Grants
Dairy 4’s Capital Costs without Grants
10 Years $65,857 $223,915 15 Years $49,317 $167,679 20 Years $41,321 $140,490
The annual operational and maintenance costs for the dairy based on information provided is estimated at $39,997, which represents 2.4 percent of the total capital costs. In terms of kWh, the operating cost is $0.06464 per kWh assuming that the dairy produced 618,766 kWh of electricity. If the dairy could get closer to its maximum production of 1,764,264 kWh, then this operating and maintenance cost would be $0.02267 per kWh. These costs may be higher due to the digester system repairs that occurred at the end of 2011 which occurred after data collection. If the dairy was closer to the ERG protocol, this cost would be $51,000. This would increase the operation and maintenance cost to $0.08242 per kWh for its actual production amount in 2010 and to $0.02891 per kWh if it could produce closer to the engine’s maximum capacity.
The owner estimates that it takes one-half hour a day to do general maintenance to the digester system. He also estimates another fifty-two hours a year are needed to keep the separator
37
cleaned. Charging a rate of $15 per hour for the time to clean the separator and $40 per hour for the general maintenance that is done by the owner, the total labor cost for the year is estimated at $8,080. The oil for the engine gets changed once a month at an estimated cost of $5,400 per year. It is estimated that the general tune-up costs of the engine and parts is approximately $8,000 per year. This covers the cost of spark plugs, oil filters, air filters, etc. It is estimated that the replacement of the heads on the engine will come to an annual cost of $3,000. The electrical costs for running the motors for the digester, the biogas chiller, and the solid separator is $15,497 per year based on a kWh price of approximately $0.11.
6.4 Economic Analysis of Dairy 4’s Digester Operation
Examining the net revenue above operating cost shows that at 2010 production levels the Dairy 4 is not covering all of its operating cost. The dairy appears to be losing $4,089 a year by operating. This implies that there is no simple payback period that exists for this operation under the current circumstances. If the dairy could have operated at total gas production, it would have net revenue above operating costs under $6,900. This implies that the simple payback period would be well over 200 years to pay back the full capital costs. To pay back just the money that was borrowed for the capital costs, it would take over 72 years. At current electricity rate, the dairy will never be able to pay off any of its capital expense. This information suggests that the digester should shut down its operation at the current electricity rate it is getting. If the operating costs are closer to $51,000 that the REG protocol recommends, the dairy would be losing over $10,000 per year by operating the digester. If the dairy could get the digester up to the electrical engines peak capacity at 95 percent operational days, this would vastly change the outcome. Under this scenario, the dairy would earn a revenue of $102,327 and net revenue above operating costs of $62,350. At this amount, the simple payback period is over twenty-seven years to payback the total capital costs. The simple payback period drops to eight years for the capital costs minus the grants.
It is straightforward to see that the net income above operating and capital costs is negative for any payback period for the amount that the dairy is bringing in for revenue. Given no grants, this ranges from negative $144,579 for a twenty year payback to negative $228,004 for a ten year payback period. If the dairy could produce at the maximum capacity of the engine, which was discussed above, then the net income is negative still for all scenarios under twenty years for the full capital costs. With the grants factored in, the dairy receives a yearly negative net income of $3,057 if the loan has to be paid back in ten years. For a fifteen year payback period for the loan, the net income in this situation turns to a positive $13,033 per year. Pushing the payments out to twenty years gives a net income of $21,030. Based on the digester’s current ability to produce gas, the rate that would make Dairy 4’s current production capabilities give a net income of zero with a twenty year payback is $0.26075 per kWh. The rate necessary to provide a zero net income for the capital costs minus the grant funding would be $0.11748 per kWh.
The net present value for digester is severely negative for the current operation under all scenarios with a twenty year time horizon or less even at maximum gas production. The utility rate that is necessary to get the digester to have a zero net present value over a twenty year time horizon and paying back the total capital cost is $0.29166 per kWh. Taking into account the
38

capital costs that the dairy actually incurred due to the grants, the rate necessary for a zero net present value over a twenty year horizon is $0.13139 per kWh. The return on investment for a ten year time horizon is -13.41 percent. Increasing this time horizon to twenty years gives a return on investment of -8.5 percent. To get a 10 percent return on investment, a utility rate of $0.55640 per kWh is necessary. This utility rate increases to $0.84150 per kWh to get a 20 percent return on investment. This assumes that the total capital costs are paid back in a twenty-year time horizon.
39
CHAPTER 7: Dairy 5 Results 7.1 Background Information on Dairy 5 Dairy 5 operates its anaerobic digester in Modesto, CA. 1 This digester was installed in 2008. The operation has approximately 1,200 milking cows with another 300 hundred cows and calves near the location of the digester. The dairy operates two heated complete mix above ground digesters used to power a 710 kW generator engine. The engine has the ability to operate at 610 kW based on the methane gas efficiency. The engine is setup to run on a lean burn. Dairy 5 uses a biological treatment system for reducing the presence of hydrogen sulfide. This system oxidizes the sulfide and changes into sulfur. Engine heat is recovered and used on the farm to offset propane costs.
The digesters are fed from a flush style manure management system that collects manure from the freestall dairy barns. The flush water system uses approximately 1.2 million gallons of recycled and fresh water. The digester has a recirculating mixing system that allows it to handle multiple feedstocks. The digester is also fed some of the whey by-product that is leftover from their cheese making operation. During this study, the digester was also fed sudan grass and waste silage. The targeted total solid content entering the digester is 10 percent. The digester has been designed to operate in the mesophilic range and can hold approximately ten hours of biogas in storage before needing to flare excess amounts. The targeted temperature for this system is 100 degrees Fahrenheit. To meet the strict air quality restrictions for Dairy 5’s air district, it utilizes multiple technological systems. In order to handle the nitrogen oxide emissions, the dairy employs a selective catalytic reduction system.
7.2 Revenue from Dairy 5’s Digester The observational period for the electricity generation is from August 2009 to January 2011. In December 2010, there was a data collection malfunction, so electricity data is missing for this month. In this time period, the dairy produced at least 4,884,844 kWh of electricity. Examining the period from December 2009 to November 2010 shows a total production of 3,442,838 kWh of electricity. In this period, the dairy sent some of its gas to the flare. This gas represented approximately 45,233 kWh of electricity. This period represents a full year’s worth of operational data and will be used as the representative year for revenue.
Dairy 5 operates in the Modesto Irrigation District. It has a contract with this utility to sell all the electricity it produces at $0.1095 per kWh, i.e., it has a simple power purchase agreement. All power that is produced is sold; none is directly used on the farm. Any power consumption on the farm is bought from the utility provider and is not siphoned from the generator before it is sold. The total value of its electricity in the observational period is at least $534,890. Utilizing
1 The cost information was gathered from Stringfellow et al. (2011), which had a concurrent study to this research project
40
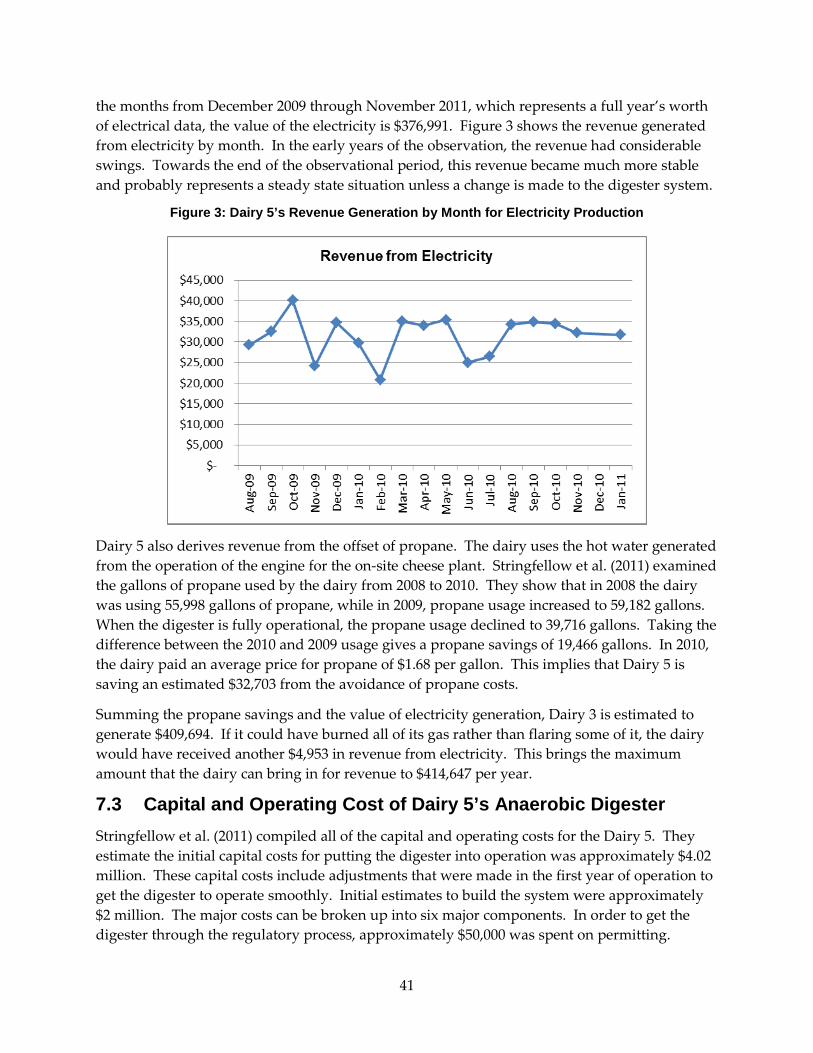
the months from December 2009 through November 2011, which represents a full year’s worth of electrical data, the value of the electricity is $376,991. Figure 3 shows the revenue generated from electricity by month. In the early years of the observation, the revenue had considerable swings. Towards the end of the observational period, this revenue became much more stable and probably represents a steady state situation unless a change is made to the digester system.
Figure 3: Dairy 5’s Revenue Generation by Month for Electricity Production
Dairy 5 also derives revenue from the offset of propane. The dairy uses the hot water generated from the operation of the engine for the on-site cheese plant. Stringfellow et al. (2011) examined the gallons of propane used by the dairy from 2008 to 2010. They show that in 2008 the dairy was using 55,998 gallons of propane, while in 2009, propane usage increased to 59,182 gallons. When the digester is fully operational, the propane usage declined to 39,716 gallons. Taking the difference between the 2010 and 2009 usage gives a propane savings of 19,466 gallons. In 2010, the dairy paid an average price for propane of $1.68 per gallon. This implies that Dairy 5 is saving an estimated $32,703 from the avoidance of propane costs.
Summing the propane savings and the value of electricity generation, Dairy 3 is estimated to generate $409,694. If it could have burned all of its gas rather than flaring some of it, the dairy would have received another $4,953 in revenue from electricity. This brings the maximum amount that the dairy can bring in for revenue to $414,647 per year.
7.3 Capital and Operating Cost of Dairy 5’s Anaerobic Digester
Stringfellow et al. (2011) compiled all of the capital and operating costs for the Dairy 5. They estimate the initial capital costs for putting the digester into operation was approximately $4.02 million. These capital costs include adjustments that were made in the first year of operation to get the digester to operate smoothly. Initial estimates to build the system were approximately $2 million. The major costs can be broken up into six major components. In order to get the digester through the regulatory process, approximately $50,000 was spent on permitting.
41

Professional services for the digester were estimated at $86,000. The lion share of the cost was for the digester and its necessary components with an estimated cost of $2.841 million. In order for the system to be a combined heat and power system (CHP), it is estimated that $780,000 were expended. The dairy sells its electricity to the Modesto Irrigation District. In order to have this ability, it is estimated that it cost $75,000 for the utility interface between the dairy and the irrigation district. One of the major components for handling an emission issue was for the selective catalytic reduction system. It is estimated that this system cost $186,000 to make it operational. To offset some of these capital costs, the dairy was able to secure several grants worth $2.282 million. This left the dairy with an out-of-pocket cost of $1.738 million to be financed from internal and external funding.
Assuming that Dairy 5 secured a loan of 5.35 percent for paying back the total capital cost of the digester given fixed yearly payments, the dairy would incur a yearly expense of $529,494 if the money was paid back over a ten year period (See Table 12). If the dairy extended the payments over a twenty year period, the expense would drop to $332,217 per year. Given that Dairy 5 received nearly $2.3 million in grant funding, its capital payments for a ten year payback are $228,921. If the dairy pushed the payments to a twenty year time horizon, the yearly capital payment cost is $143,630.
Table 12: Dairy 5’s Yearly Capital Costs Based on Differing Payback Assumptions
Total Years For Capital Payback Dairy 5’s Capital Costs with Grants
Dairy 5’s Capital Costs without Grants
10 Years $228,921 $529,494 15 Years $171,427 $396,512 20 Years $143,630 $332,217
As with the capital costs, Stringfellow et al. (2011) created an estimate of the operating and maintenance costs for the dairy’s digester. They broke-up the operating costs into eight different areas. The first operating cost they estimated was the daily operational and maintenance costs which were estimated at $30,000 per year. The estimation for generator maintenance came to $37,000 per year. Since the dairy must sell all the electricity it produces, it must directly incur the electricity costs for operating the digester. This was estimated to be $25,000 per year. Cleaning out the digester and mechanical repairs were estimated at $5,000 and $3,500 per year respectively. Yearly repairs to the engine are expected to be approximately $25,000. The catalyst replacement was estimated at $13,300 per year. Stringfellow et al. estimated that the covers for the digesters have a useful life of ten years. Hence, they placed a cost of $16,000 per year for replacement. Since this cost is expected to occur in ten years, but is really unknown, it will be left out of the operating and maintenance estimate. Summing seven out of the eight components, provides an operational and maintenance cost to $138,800. This amount represents 3.45 percent of the initial capital costs. In terms of kilowatt hour production, the yearly operating and maintenance costs come to $0.04032 per kWh based on 3,442,838 kWh of electricity production.
42
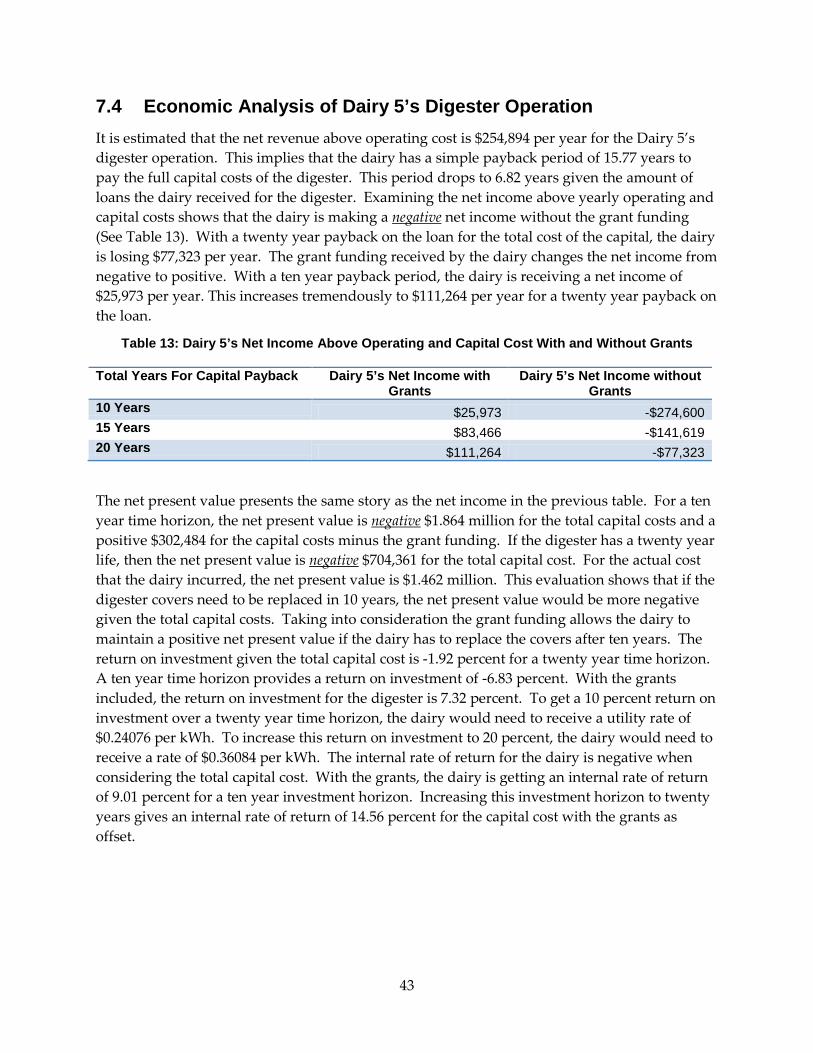
7.4 Economic Analysis of Dairy 5’s Digester Operation
It is estimated that the net revenue above operating cost is $254,894 per year for the Dairy 5’s digester operation. This implies that the dairy has a simple payback period of 15.77 years to pay the full capital costs of the digester. This period drops to 6.82 years given the amount of loans the dairy received for the digester. Examining the net income above yearly operating and capital costs shows that the dairy is making a negative net income without the grant funding (See Table 13). With a twenty year payback on the loan for the total cost of the capital, the dairy is losing $77,323 per year. The grant funding received by the dairy changes the net income from negative to positive. With a ten year payback period, the dairy is receiving a net income of $25,973 per year. This increases tremendously to $111,264 per year for a twenty year payback on the loan.
Table 13: Dairy 5’s Net Income Above Operating and Capital Cost With and Without Grants
Total Years For Capital Payback Dairy 5’s Net Income with Grants
Dairy 5’s Net Income without Grants
10 Years $25,973 -$274,600 15 Years $83,466 -$141,619 20 Years $111,264 -$77,323
The net present value presents the same story as the net income in the previous table. For a ten year time horizon, the net present value is negative $1.864 million for the total capital costs and a positive $302,484 for the capital costs minus the grant funding. If the digester has a twenty year life, then the net present value is negative $704,361 for the total capital cost. For the actual cost that the dairy incurred, the net present value is $1.462 million. This evaluation shows that if the digester covers need to be replaced in 10 years, the net present value would be more negative given the total capital costs. Taking into consideration the grant funding allows the dairy to maintain a positive net present value if the dairy has to replace the covers after ten years. The return on investment given the total capital cost is -1.92 percent for a twenty year time horizon. A ten year time horizon provides a return on investment of -6.83 percent. With the grants included, the return on investment for the digester is 7.32 percent. To get a 10 percent return on investment over a twenty year time horizon, the dairy would need to receive a utility rate of $0.24076 per kWh. To increase this return on investment to 20 percent, the dairy would need to receive a rate of $0.36084 per kWh. The internal rate of return for the dairy is negative when considering the total capital cost. With the grants, the dairy is getting an internal rate of return of 9.01 percent for a ten year investment horizon. Increasing this investment horizon to twenty years gives an internal rate of return of 14.56 percent for the capital cost with the grants as offset.
43
CHAPTER 8: Dairy 6 Results 8.1 Background Information for Dairy 6 Dairy 6 is located in the Mojave Desert region of California north of the Los Angeles Basin. At the time of this study, it had approximately 2,100 cows that were lactating and being milked daily. The dairy also had an estimated 350 dry cows. When the digester was originally built, the dairy added around 300 cows to its herd. The dairy has been operating a plug-flow digester system since 2004. The digester has been designed to hold 70,758 cubic feet of effluent at any given time. It has the ability to utilize food grease, blood waste, and whey in addition to the manure from cows. The digester is designed to maintain mesophilic conditions. The current manure management system being utilized is a dry lot scrape system where manure is sucked up by a vacuum truck and delivered to the digester. The previous system before the digester was put in was a flush system. Due to the location, the dairy has issues with sand getting into the manure stream that is vacuumed. To handle this issue, the dairy utilizes a cyclonic sand separator. Once the effluent has been digested, it is sent to a nearby lagoon where it is mixed with fresh water and used for irrigation purposes of the farm.
The dairy has adopted a 220 kW natural gas engine generator that can generate approximately 180 kW of electricity from biogas. Gas that is produced by the digester is directly piped to the generator and does not utilize any scrubbing technology for the gas. If excess gas is produced, a flare system is utilized to deal with it. Hot water that is generated from the engine is either recirculated to the digester to keep its heat up or sent to a radiator. Currently, the hot water is not being utilized to offset any other heating costs required by the dairy. The generator has been hooked up to the meter that has much of the load for the dairy. This has allowed the dairy to capture higher “retail rates” for most of the electricity it generates from the digester system.
8.2 Revenue from Dairy 6’s Digester Dairy 6 is currently operating under a time-of-use net metering contract with Southern California Edison. This contract is much more complex than a simple power purchase agreement. It has many different pricings for the electricity produced that are dependent upon the time of day, the season, and whether the power is net metered or not. If this power is net metered, then the dairy gets one set of pricing if the power is used to offset power that was supplied through the meter that the digester is attached to, and another set of prices if the power is used to offset other meters. The dairy also participates in the Agricultural and Pumping Interruptible Program that is offered by the utility company. Southern California Edison has a summer season and a winter season pricing. All of this implies that Dairy 6 faces ten different prices that it receives for its power.
Under a time-of-use net metering contract the revenue that is received from operating the digester comes in the form of reduced electricity bills. The dairy has three ways it can avoid costs through the production of electricity. The first way is direct offset of power that is produced and utilized on-farm. The upper limit on this is the load that exists on the meter that
44
is attached to the generator. The second offset comes from power that is net metered but is utilized to offset costs that the dairy incurred on the meter when the generator was not meeting the load on the meter. This offset is limited to the amount of power that is demanded by the meter that the generator is attached to. The third offset comes from power that is net metered and the value is allocated to other meters on Dairy 6’s operation that are not associated with the generator meter. The offset associated with this is limited to the amount of cost generated by the meters that are not associated with the generator.
Since Dairy 6’s revenue comes from avoided cost from electricity, it is important to understand how the utility company charges for electricity and what electricity costs can actually be avoided. The dairy currently operates under Southern California Edison’s Time-of-Use Agricultural and Pumping Rate Option B, which is denoted by TOU-PA-B. Rate Option B has two seasons, each with its own set of prices. The summer season spans from June 1 at 12:00 a.m. to October 1 at 12:00 a.m. The winter season runs from October 1 at 12:00 a.m. to June 1 at 12:00 a.m. In the summer season, there are three different rates charged depending upon the time of day and the day of the week. The most expensive rate period, known as the on-peak period, is defined between noon and 6 p.m. on Monday through Friday. The mid-peak period is from 8:00 a.m. to noon and 6:00 p.m. to 11:00 p.m., Monday through Friday. The off-peak period, which has the lowest energy rate, is all the other days and times not covered by the other two rate periods. The winter season has two rates that are defined by the day of the week and the time of day. The most expensive rate in the winter time is the mid-peak rate, which is defined as power that is consumed from 8:00 a.m. to 9:00 p.m. Monday through Friday. The non-peak period is all other times and days of the week. On the eight official holidays, the dairy receives the off-peak rate no matter the time of day. The dairy also operates under the Agricultural and Pumping Interruptible Program. This program allows the dairy to receive a year-round credit for allowing temporary service interruptions to the dairy operation.
The dairy’s electrical bill has three major types of charges. The first charge is a flat fee known as the customer charge. This charge exists just to have the meter. Since this charge would exist whether the dairy had the digester or not, this charge cannot be considered a cost that can be avoided which implies that it cannot show up as revenue. The second main charge is related to the maximum demand the dairy has for electricity. These charges are based on the maximum amount of kW that is demanded by the dairy on the meter that the digester is attached to. Unless the dairy is able to run the digester twenty-four hours a day, seven days a week, the costs are not completely avoidable. With keen management though, there is a possibility to capture a portion of these costs by making sure that the digester is: a) brought down for maintenance at the lowest load points for the dairy on the particular meter the digester is attached to, and b) making sure that the output of the generator is equal to or exceeds the load on the meter. The third set of costs on Dairy 6’s bill is the energy costs. These costs are categorized into delivery cost and generating costs. Based on the net metering portion of the contract the dairy has with the utility some or all of these costs can be avoided. If the power is produced on-farm and utilized on-farm without going through the meter, then these costs are completely avoidable. If the power is produced on-farm and is net metered but there is power that was purchased through the digester meter (this occurs when the digester is down or it
45
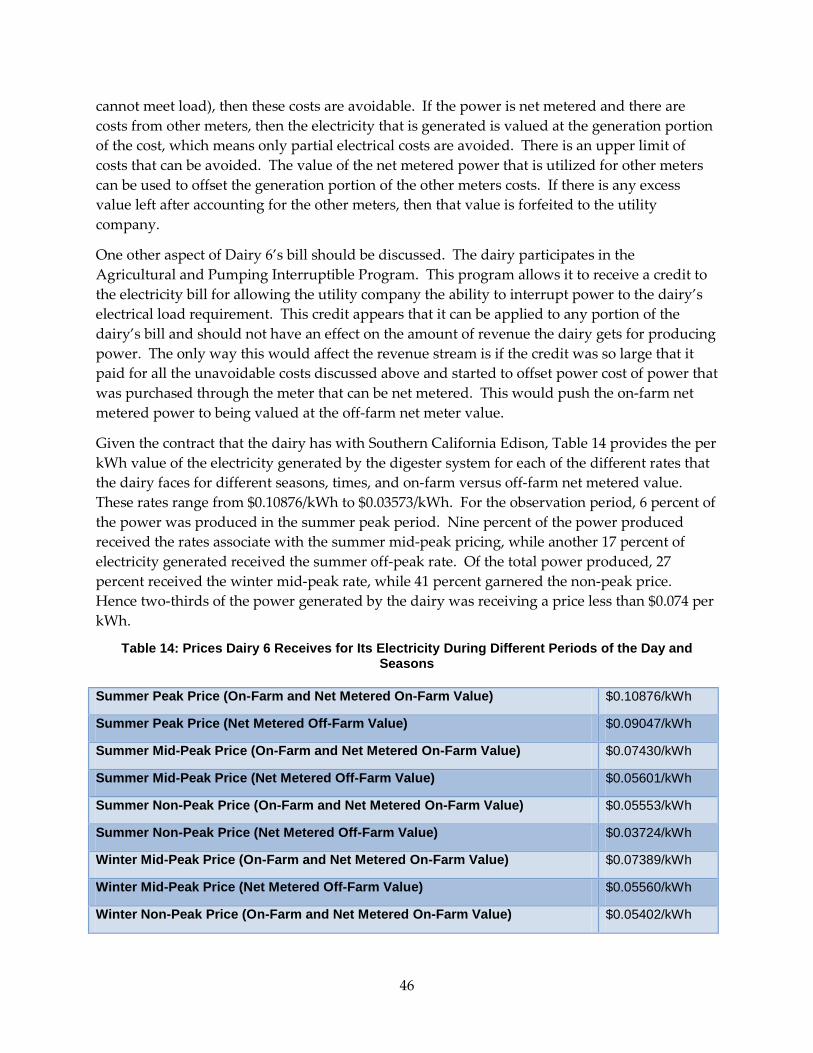
cannot meet load), then these costs are avoidable. If the power is net metered and there are costs from other meters, then the electricity that is generated is valued at the generation portion of the cost, which means only partial electrical costs are avoided. There is an upper limit of costs that can be avoided. The value of the net metered power that is utilized for other meters can be used to offset the generation portion of the other meters costs. If there is any excess value left after accounting for the other meters, then that value is forfeited to the utility company.
One other aspect of Dairy 6’s bill should be discussed. The dairy participates in the Agricultural and Pumping Interruptible Program. This program allows it to receive a credit to the electricity bill for allowing the utility company the ability to interrupt power to the dairy’s electrical load requirement. This credit appears that it can be applied to any portion of the dairy’s bill and should not have an effect on the amount of revenue the dairy gets for producing power. The only way this would affect the revenue stream is if the credit was so large that it paid for all the unavoidable costs discussed above and started to offset power cost of power that was purchased through the meter that can be net metered. This would push the on-farm net metered power to being valued at the off-farm net meter value.
Given the contract that the dairy has with Southern California Edison, Table 14 provides the per kWh value of the electricity generated by the digester system for each of the different rates that the dairy faces for different seasons, times, and on-farm versus off-farm net metered value. These rates range from $0.10876/kWh to $0.03573/kWh. For the observation period, 6 percent of the power was produced in the summer peak period. Nine percent of the power produced received the rates associate with the summer mid-peak pricing, while another 17 percent of electricity generated received the summer off-peak rate. Of the total power produced, 27 percent received the winter mid-peak rate, while 41 percent garnered the non-peak price. Hence two-thirds of the power generated by the dairy was receiving a price less than $0.074 per kWh.
Table 14: Prices Dairy 6 Receives for Its Electricity During Different Periods of the Day and Seasons
Summer Peak Price (On-Farm and Net Metered On-Farm Value) $0.10876/kWh
Summer Peak Price (Net Metered Off-Farm Value) $0.09047/kWh
Summer Mid-Peak Price (On-Farm and Net Metered On-Farm Value) $0.07430/kWh
Summer Mid-Peak Price (Net Metered Off-Farm Value) $0.05601/kWh
Summer Non-Peak Price (On-Farm and Net Metered On-Farm Value) $0.05553/kWh
Summer Non-Peak Price (Net Metered Off-Farm Value) $0.03724/kWh
Winter Mid-Peak Price (On-Farm and Net Metered On-Farm Value) $0.07389/kWh
Winter Mid-Peak Price (Net Metered Off-Farm Value) $0.05560/kWh
Winter Non-Peak Price (On-Farm and Net Metered On-Farm Value) $0.05402/kWh
46

Winter Non-Peak Price (Net Metered Off-Farm Value) $0.03573/kWh
In the period of observation, Dairy 6 produced approximately 1.25 million kWh of electricity. This represents approximately two-thirds of the actual capacity that the generator could produce. Taking the production data and coupling it with the rate schedule, it is estimated that the dairy generated $77,030 during the period of observation which represents a full year’s worth of electricity production. Table 15 shows how this amount is split-up across month, seasons, and rate schedule.
Table 15: Amount of Revenue Generated by Dairy 6’s Digester by Season and Rate
Peak Summer
Mid-Peak Summer
Off-Peak Summer
Mid-Peak Winter
Off-Peak Winter
Month June 2011 $2,382 $2,596 $3,276 July 2011 $2,165 $2,307 $3,443 August 2011 $849 $1,039 $1,491 September 2011 $2,115 $2,398 $3,437 October 2011 $3,123 $3,726 November 2011 $3,431 $3,686 December 2011 $2,916 $3,431 January 2012 February 2012 $3,422 $3,871 March 2012 $3,193 $3,270 April 2012 $2,728 $3,010 May 2012 $2,372 $2,704 Total $7,512 $8,340 $11,647 $23,561 $25,970 Grand Total $77,030
Out of the $77,030 in total revenue, approximately 10 percent was generated during the peak summer months. Just under a third of the total revenue generation occurred during the off-peak winter months. Approximately 36 percent of revenue generation occurred in the summer month, leaving the bulk of revenue generated in the winter months. When you take the total revenue earned and divide it by the amount of electricity that was generated during this time period, the average rate received was $0.061618 per kWh.
The second avoided cost regarding electricity is the demand charges. These charges can represent a major component of the electricity bill. The demand charges are based upon the maximum amount of kilowatts that are needed at any given time for the particular meter, i.e., these charges are based upon the maximum load demand the operation needs from the meter. The way Southern California Edison calculates the demand charges for Dairy 6 is that it takes the maximum amount of kW that are demanded in any 15 minute interval during the month. The utility company multiplies this maximum amount by the particular demand charge which is based on the season. The demand charge for both summer and winter is $7.83 per kW for the period of observation. The only way the dairy is able to completely avoid these costs is by operating their generator 24 hours a day, 7 days a week during the billing cycle. In no month did the dairy operate continuously. In Dairy 6’s best month, the dairy was able to keep the
47
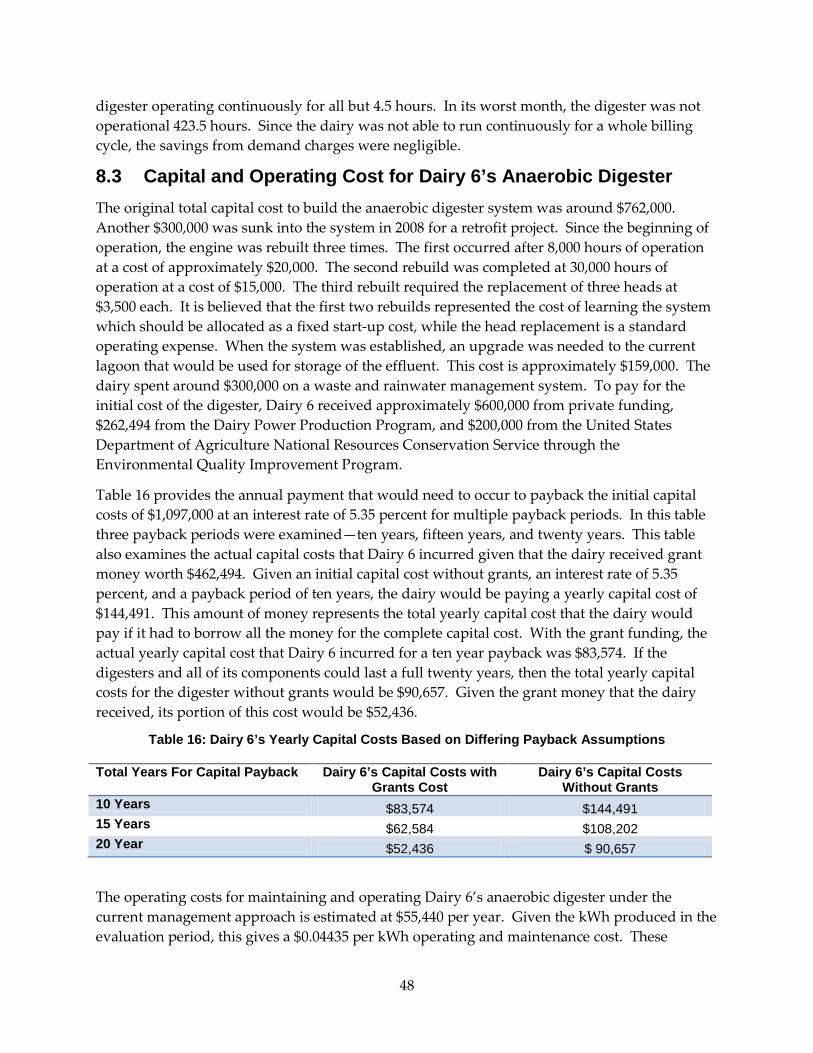
digester operating continuously for all but 4.5 hours. In its worst month, the digester was not operational 423.5 hours. Since the dairy was not able to run continuously for a whole billing cycle, the savings from demand charges were negligible.
8.3 Capital and Operating Cost for Dairy 6’s Anaerobic Digester The original total capital cost to build the anaerobic digester system was around $762,000. Another $300,000 was sunk into the system in 2008 for a retrofit project. Since the beginning of operation, the engine was rebuilt three times. The first occurred after 8,000 hours of operation at a cost of approximately $20,000. The second rebuild was completed at 30,000 hours of operation at a cost of $15,000. The third rebuilt required the replacement of three heads at $3,500 each. It is believed that the first two rebuilds represented the cost of learning the system which should be allocated as a fixed start-up cost, while the head replacement is a standard operating expense. When the system was established, an upgrade was needed to the current lagoon that would be used for storage of the effluent. This cost is approximately $159,000. The dairy spent around $300,000 on a waste and rainwater management system. To pay for the initial cost of the digester, Dairy 6 received approximately $600,000 from private funding, $262,494 from the Dairy Power Production Program, and $200,000 from the United States Department of Agriculture National Resources Conservation Service through the Environmental Quality Improvement Program.
Table 16 provides the annual payment that would need to occur to payback the initial capital costs of $1,097,000 at an interest rate of 5.35 percent for multiple payback periods. In this table three payback periods were examined—ten years, fifteen years, and twenty years. This table also examines the actual capital costs that Dairy 6 incurred given that the dairy received grant money worth $462,494. Given an initial capital cost without grants, an interest rate of 5.35 percent, and a payback period of ten years, the dairy would be paying a yearly capital cost of $144,491. This amount of money represents the total yearly capital cost that the dairy would pay if it had to borrow all the money for the complete capital cost. With the grant funding, the actual yearly capital cost that Dairy 6 incurred for a ten year payback was $83,574. If the digesters and all of its components could last a full twenty years, then the total yearly capital costs for the digester without grants would be $90,657. Given the grant money that the dairy received, its portion of this cost would be $52,436.
Table 16: Dairy 6’s Yearly Capital Costs Based on Differing Payback Assumptions
Total Years For Capital Payback Dairy 6’s Capital Costs with Grants Cost
Dairy 6’s Capital Costs Without Grants
10 Years $83,574 $144,491 15 Years $62,584 $108,202 20 Year $52,436 $ 90,657
The operating costs for maintaining and operating Dairy 6’s anaerobic digester under the current management approach is estimated at $55,440 per year. Given the kWh produced in the evaluation period, this gives a $0.04435 per kWh operating and maintenance cost. These
48
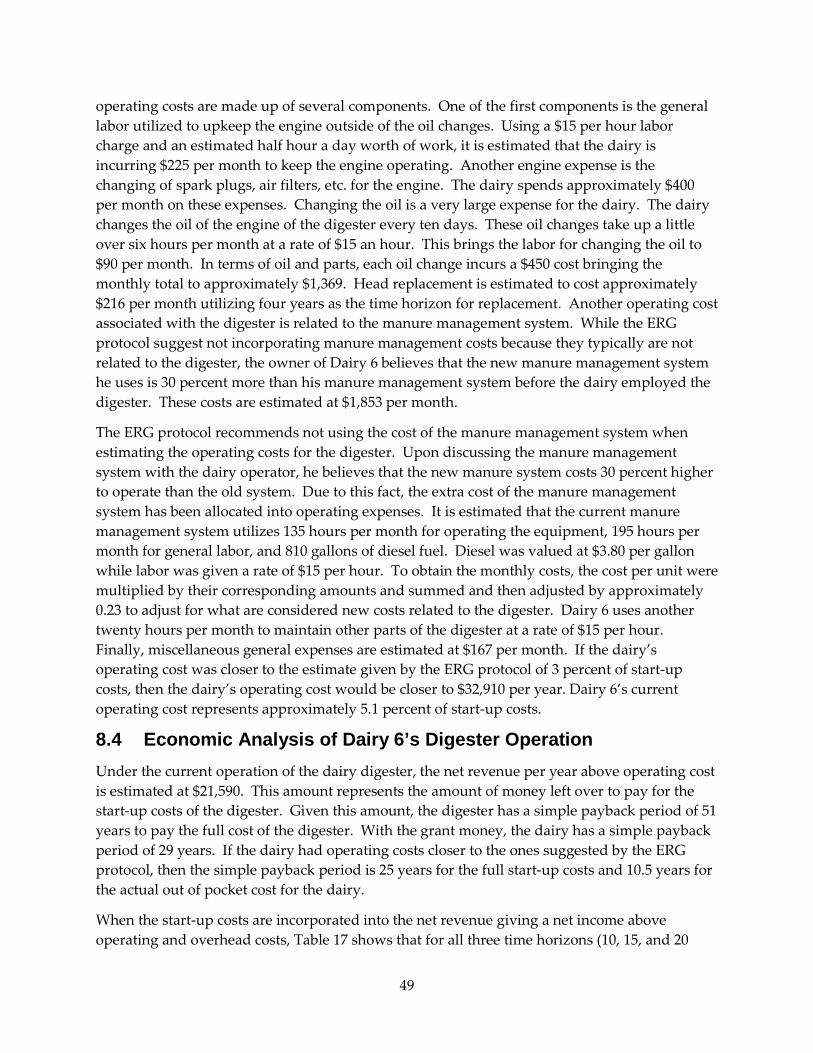
operating costs are made up of several components. One of the first components is the general labor utilized to upkeep the engine outside of the oil changes. Using a $15 per hour labor charge and an estimated half hour a day worth of work, it is estimated that the dairy is incurring $225 per month to keep the engine operating. Another engine expense is the changing of spark plugs, air filters, etc. for the engine. The dairy spends approximately $400 per month on these expenses. Changing the oil is a very large expense for the dairy. The dairy changes the oil of the engine of the digester every ten days. These oil changes take up a little over six hours per month at a rate of $15 an hour. This brings the labor for changing the oil to $90 per month. In terms of oil and parts, each oil change incurs a $450 cost bringing the monthly total to approximately $1,369. Head replacement is estimated to cost approximately $216 per month utilizing four years as the time horizon for replacement. Another operating cost associated with the digester is related to the manure management system. While the ERG protocol suggest not incorporating manure management costs because they typically are not related to the digester, the owner of Dairy 6 believes that the new manure management system he uses is 30 percent more than his manure management system before the dairy employed the digester. These costs are estimated at $1,853 per month.
The ERG protocol recommends not using the cost of the manure management system when estimating the operating costs for the digester. Upon discussing the manure management system with the dairy operator, he believes that the new manure system costs 30 percent higher to operate than the old system. Due to this fact, the extra cost of the manure management system has been allocated into operating expenses. It is estimated that the current manure management system utilizes 135 hours per month for operating the equipment, 195 hours per month for general labor, and 810 gallons of diesel fuel. Diesel was valued at $3.80 per gallon while labor was given a rate of $15 per hour. To obtain the monthly costs, the cost per unit were multiplied by their corresponding amounts and summed and then adjusted by approximately 0.23 to adjust for what are considered new costs related to the digester. Dairy 6 uses another twenty hours per month to maintain other parts of the digester at a rate of $15 per hour. Finally, miscellaneous general expenses are estimated at $167 per month. If the dairy’s operating cost was closer to the estimate given by the ERG protocol of 3 percent of start-up costs, then the dairy’s operating cost would be closer to $32,910 per year. Dairy 6’s current operating cost represents approximately 5.1 percent of start-up costs.
8.4 Economic Analysis of Dairy 6’s Digester Operation Under the current operation of the dairy digester, the net revenue per year above operating cost is estimated at $21,590. This amount represents the amount of money left over to pay for the start-up costs of the digester. Given this amount, the digester has a simple payback period of 51 years to pay the full cost of the digester. With the grant money, the dairy has a simple payback period of 29 years. If the dairy had operating costs closer to the ones suggested by the ERG protocol, then the simple payback period is 25 years for the full start-up costs and 10.5 years for the actual out of pocket cost for the dairy.
When the start-up costs are incorporated into the net revenue giving a net income above operating and overhead costs, Table 17 shows that for all three time horizons (10, 15, and 20
49

years) with both grant money factored in and taken out that Dairy 6 is facing negative income. This measure shows whether the dairy will be able to pay for all its operating costs and overhead over the life of the digester. With no grants, the digester is losing considerable amount of money each year given a 5.35 percent interest cost. Hence, if Dairy 6 had to take out a loan for the total cost of its digester, it would not be able to pay it back in twenty years. Even with the grant money that the dairy received, the net income above the operating and overhead cost is still negative. In order for net income to be positive, the dairy would need approximately $375,000 more in grant money to have a net income above zero over a twenty year time horizon. It should be noted that these results are based upon the evaluation period and the current management practice. During this period, the digester engine was only producing at two-thirds of its capacity. If the digester engine could be brought up closer to full capacity, the simple payback period with the grants would be closer to 10 years and the net income would be positive after 15 years.
Table 17: Dairy 6’s Yearly Net Income Above Operating and Overhead Costs on Differing Payback Assumptions
Total Years For Capital Payback Dairy 6’s Net Income Above Operating and Overhead Costs with Grants Cost
Dairy 6’s Net Income Above Operating and Overhead
Costs Without Grants 10 Years -$61,984 -$122,901 15 Years -$40,995 -$86,613 20 Year -$30,846 -$69,067
For a twenty year investment horizon and a discount rate of 5.35 percent, the net present value of the system is negative $793,309 given the total start-up costs. Factoring the grant money that was received for the system, the net present value improves considerably but is still very negative at minus $354,302. If the dairy can get its operating costs down to the ERG protocol value of 3 percent of start-up costs, then his net present value would improve to negative $95,517 for the cost the dairy incurred on the digester.
An analysis was conducted to see what rates would provide Dairy 6 an internal rate of return between 10 percent and 20 percent to capital costs given the current cost structure for a ten and twenty year investment horizon. Four major assumptions were made to calculate these values. The first assumption assumed that the dairy could keep its generator running at full capacity for 95 percent of the time. This would imply that Dairy 6 could produce 1,856,638 kWh of electricity. A second assumption was that the dairy would receive a flat rate for its power production rather than the current rates it is receiving because of time-of-use and season of the year. The third assumption is that the dairy continues to have the same operating costs as it currently does. The fourth major assumption is that the full capital costs of establishing the digester must be recovered. This implies that the dairy does not receive any grants to start the operation. Given a ten year investment horizon, Dairy 6 would need to receive a flat rate of $0.12619 per kWh to receive a 10 percent internal rate of return. To receive a 20 percent internal rate of return in ten years, an electricity purchase rate of $0.17079 per kWh is necessary. If the dairy had a twenty year investment horizon, then the dairy would need to receive $0.09926 per
50

kWh to receive a 10 percent internal rate of return, and a rate of $0.15120 per kWh to obtain a 20 percent internal rate of return.
Examining a ten year time horizon shows that Dairy 6 is receiving -11.23 percent its return on investment. Over a twenty year time horizon, this return on investment is -6.3 percent. To obtain a 20 percent return on investment for the dairy, it would need to receive a flat rate of $0.1481 per kWh given the subsidies. If the dairy would like to earn a 10 percent return on its capital investment for the total cost of the digester given a twenty year payback for its capital costs at 5.35 percent, it would need a utility rate of $0.13777 per kWh. To obtain a 20 percent return on investment with these same parameters, the dairy would need a flat utility rate of $0.19686 per kWh.
51

CHAPTER 9: Summary, Conclusions, and Recommendations The primary purpose of the economic analysis was to examine the economic feasibility of six digesters operating in California. The feasibility of these operations was conducted following a protocol developed by the Eastern Research Group, Inc., which was developed for the USDA AgSTAR program. The key indicator for feasibility was net income, where net income is defined as the revenue minus the operating, maintenance, and amortized capital costs. The analysis also examined other metrics of feasibility including simple payback period, net present value, and return on investment. Calculations were made for each facility to see what flat utility rate would provide a 10 percent and a 20 percent return on investment.
Table 18 provides a summary for each dairy of the key revenue results. It shows that Dairy 1 had the lowest revenue production at $25,021 per year. This is in contrast to Dairy 3 who had a revenue production of $917,034. It should be noted that Dairy 1 was a relatively smaller dairy that utilized only the electricity from the digester to offset current electrical usage. Dairy 3 was the largest dairy in the study. All the power it produced was utilized on-farm and was able to receive industrial electricity prices. This particular dairy was able to do this because it had an on-site cheese plant that was tied to the electrical meter of the digester. Dairy 3 was also able to capture the heat from the engine and offset a considerable amount of propane usage for both the dairy and the cheese plant. The propane saving was over $300,000.
Table 18: Summary of Major Revenue Components for the Dairies
Dairy Total Yearly Revenue
Total Revenue from Electricity
Average Utility Rate in kWh
Total Production for the Year in kWh
Dairy 1 $25,021 $25,021 $0.10947 228,573 Dairy 2 $61,992 $26,636 $0.06180 430,072 Dairy 3 $917,034 $594,826 $0.10268 5,792,909 Dairy 4 $35,888 $35,888 $0.05800 618,766 Dairy 5 $409,694 $376,991 $0.10950 3,442,838 Dairy 6 $77,030 $77,030 $0.06162 1,250,000
Each dairy in this study had a different agreement with its local utility company on how it would be compensated for the electricity it produced. Three of the dairies (Dairies 2, 3, and 6) were on a typical net metering program where they received “retail rates” for any power produced on-farm and consumed on-farm. The stipulation to this agreement was that the on-farm rate was only given to power related to the meter the digester engine was attached to. Any power that was used to offset other farm electricity usage was given a value that was considerably less than the “retail rate”. It was discovered in this study that the “retail rates” that were being received by these three dairies were considerably less than the average rate the dairy pays for its power. This was because the average rate takes into account service charges,
52

energy charges, and demand charges. Unfortunately, the service charges cannot be avoided and it can be very challenging for a dairy to offset much of its demand charges. Even though each of the three dairies was on a net metering contract, they each were on very different electricity rate schedules which caused them to have different realized rates. Out of all three dairies on net metering contracts, Dairy 3 had the largest average rate of $0.10268 per kWh. The other two dairies realized much lower average rates of approximately $0.06200 per kWh.
While three of the dairies were on net metering contracts, one of the dairies was on a hybrid net-metering and power purchase agreement contract. Dairy 1 had a contract with its local utility to purchase any excess electricity from the digester generator at a rate of $0.05800 per kWh. Any power that was produced and consumed on-farm would receive the “retail rate”. Since this dairy did not sell much excess power to the utility it managed an average utility rate of $0.10947. This was primarily because it sold very little power to the utility in the observation period. If the dairy was able to utilize all of the gas that its digester produces, then the average rate it would receive would be closer to $0.07000 per kWh. Dairies 4 and 5 were each on straight power purchase agreements. This means that the utility would purchase all of the electricity that was produced by the dairies. For Dairy 4, the rate that was being given was $0.05800 per kWh. For Dairy 5, it negotiated a power rate of $0.10950 per kWh.
Table 19 presents the key capital and operating costs results for each of the dairy digesters. The total capital costs for the digesters in this study ranged from a low of $625,000 to $4,020,000 in nominal terms. All six digesters examined in this study received considerable amounts of grants to offset the initial capital costs. When taking into consideration the grant funding, the total capital cost that the dairies actually encountered ranged from $213,000 to $2,400,000. The numbers in the table imply that the dairy producers paid for between 30 percent and 75 percent of the actual capital cost for the digesters. At a rate of 5.35 percent, the yearly capital cost for the digester ranged from $82,322 up to $529,494 if the capital were paid back over ten years and 51,651 to 332,217 over twenty years. This twenty year payback equates to a wide range of cost, $0.047 to $0.273 per kilowatt hour of production, from the digester systems.
53
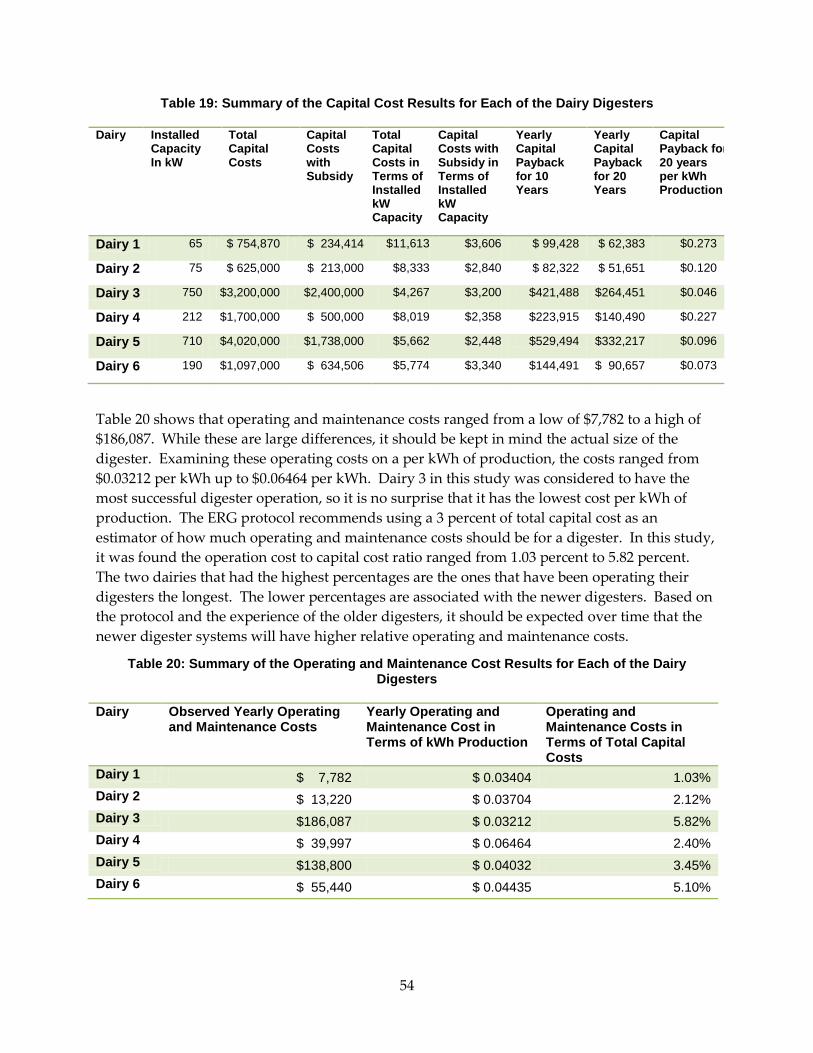
Table 19: Summary of the Capital Cost Results for Each of the Dairy Digesters
Dairy Installed Capacity In kW
Total Capital Costs
Capital Costs with Subsidy
Total Capital Costs in Terms of Installed kW Capacity
Capital Costs with Subsidy in Terms of Installed kW Capacity
Yearly Capital Payback for 10 Years
Yearly Capital Payback for 20 Years
Capital Payback for 20 years per kWh Production
Dairy 1 65 $ 754,870 $ 234,414 $11,613 $3,606 $ 99,428 $ 62,383 $0.273
Dairy 2 75 $ 625,000 $ 213,000 $8,333 $2,840 $ 82,322 $ 51,651 $0.120
Dairy 3 750 $3,200,000 $2,400,000 $4,267 $3,200 $421,488 $264,451 $0.046
Dairy 4 212 $1,700,000 $ 500,000 $8,019 $2,358 $223,915 $140,490 $0.227
Dairy 5 710 $4,020,000 $1,738,000 $5,662 $2,448 $529,494 $332,217 $0.096
Dairy 6 190 $1,097,000 $ 634,506 $5,774 $3,340 $144,491 $ 90,657 $0.073
Table 20 shows that operating and maintenance costs ranged from a low of $7,782 to a high of $186,087. While these are large differences, it should be kept in mind the actual size of the digester. Examining these operating costs on a per kWh of production, the costs ranged from $0.03212 per kWh up to $0.06464 per kWh. Dairy 3 in this study was considered to have the most successful digester operation, so it is no surprise that it has the lowest cost per kWh of production. The ERG protocol recommends using a 3 percent of total capital cost as an estimator of how much operating and maintenance costs should be for a digester. In this study, it was found the operation cost to capital cost ratio ranged from 1.03 percent to 5.82 percent. The two dairies that had the highest percentages are the ones that have been operating their digesters the longest. The lower percentages are associated with the newer digesters. Based on the protocol and the experience of the older digesters, it should be expected over time that the newer digester systems will have higher relative operating and maintenance costs.
Table 20: Summary of the Operating and Maintenance Cost Results for Each of the Dairy Digesters
Dairy Observed Yearly Operating and Maintenance Costs
Yearly Operating and Maintenance Cost in Terms of kWh Production
Operating and Maintenance Costs in Terms of Total Capital Costs
Dairy 1 $ 7,782 $ 0.03404 1.03% Dairy 2 $ 13,220 $ 0.03704 2.12% Dairy 3 $186,087 $ 0.03212 5.82% Dairy 4 $ 39,997 $ 0.06464 2.40% Dairy 5 $138,800 $ 0.04032 3.45% Dairy 6 $ 55,440 $ 0.04435 5.10%
54
Table 21 provides some of the key metrics used to understand the feasibility of the digester operations. It should be noted that this feasibility was primarily examined based on the total capital costs rather than the subsidized cost. One of the striking results is that if the dairies had to pay back the total cost of the digester, three of them would take over twenty years which is the purported life of the digester. The best digester operation can be paid back in as little as 4.38 years. With the subsidies that the dairies received, only two digesters will take longer than twenty years to be paid back. The most feasible digester operation is able to pay back the full subsidized capital cost back in 2.62 years. One digester system has a payback period that does not exist. This is because under the current prices and production, the digester cannot meet its current operating and maintenance costs due to the electricity produced by the digester.
Table 21: Key Metrics on Feasibility of Each Digester System
Dairy Simple Payback Period for Total Capital Outlay
Simple Payback Period for Subsidized Capital Outlay
Net Income with a 10 Year Payback Period Without Grants*
Net Income with a 20 Year Payback Period Without Grants*
Dairy 1 43+ 13.6 $ (42,480) $ (42,480) Dairy 2 12.81 4.37 $ (33,550) $ (2,879) Dairy 3 4.38 2.62 $ 309,460 $ 466,496 Dairy 4 Never Never $ (228,004) $ (144,579) Dairy 5 15.77 6.82 $ (274,600) $ (77,323) Dairy 6 50.81 29.39 $ (122,901) $ (69,067) * Numbers in parenthesis represent negative values.
Excluding this grant money showed that only one operation out of the six could be considered feasible. This is seen in the positive value for net income. The other five operations were not able to cover the total operating and amortized capital costs for a ten year investment horizon. As expected the numbers improve for a twenty year time horizon, but not enough to make any of the other five dairy digester operations feasible. It should be emphasized that major capital replacements of the engine were not factored into the estimation of operating and maintenance costs. Hence, even though two of these dairies appear to be close to feasible, it is only if they can get their engine and other major capital expenses to last for twenty years.
The operation that was feasible without grant funding and able to pay its capital cost back in ten years, i.e., Dairy 3, had several attributes that made it feasible. First, it had a high value to the power it generated due to the industrial cost of its electricity. Second, the facility had a high demand for power due to an on-farm cheese plant. This demand was so great that the electricity generated from the digester was completely absorbed internally by the dairy and its cheese plant. This allowed it to receive the highest utility rates possible rather than having to net meter the power and end up with a lower rate. The third attribute that made this digester feasible was a large demand for the heat that came off the digester engine. This heat was used to offset propane costs that were incurred on the dairy. A fourth attribute of this digester operation was management’s attention to the digester as an enterprise in and of itself.
55
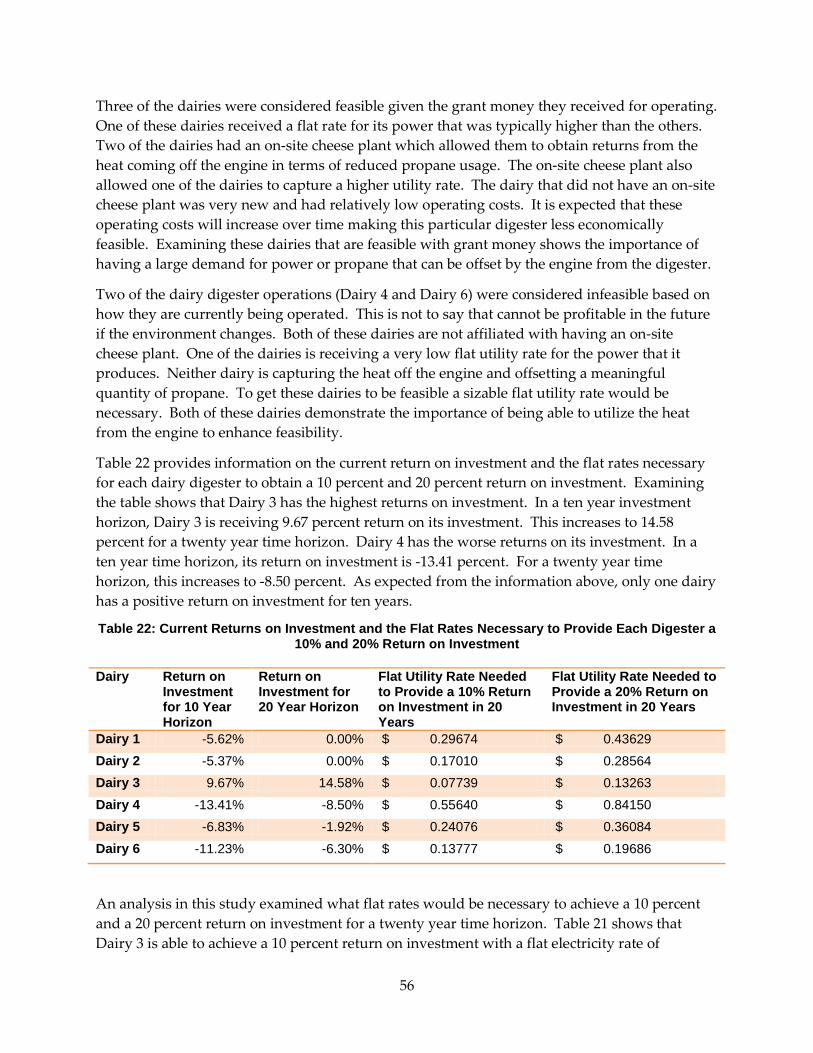
Three of the dairies were considered feasible given the grant money they received for operating. One of these dairies received a flat rate for its power that was typically higher than the others. Two of the dairies had an on-site cheese plant which allowed them to obtain returns from the heat coming off the engine in terms of reduced propane usage. The on-site cheese plant also allowed one of the dairies to capture a higher utility rate. The dairy that did not have an on-site cheese plant was very new and had relatively low operating costs. It is expected that these operating costs will increase over time making this particular digester less economically feasible. Examining these dairies that are feasible with grant money shows the importance of having a large demand for power or propane that can be offset by the engine from the digester.
Two of the dairy digester operations (Dairy 4 and Dairy 6) were considered infeasible based on how they are currently being operated. This is not to say that cannot be profitable in the future if the environment changes. Both of these dairies are not affiliated with having an on-site cheese plant. One of the dairies is receiving a very low flat utility rate for the power that it produces. Neither dairy is capturing the heat off the engine and offsetting a meaningful quantity of propane. To get these dairies to be feasible a sizable flat utility rate would be necessary. Both of these dairies demonstrate the importance of being able to utilize the heat from the engine to enhance feasibility.
Table 22 provides information on the current return on investment and the flat rates necessary for each dairy digester to obtain a 10 percent and 20 percent return on investment. Examining the table shows that Dairy 3 has the highest returns on investment. In a ten year investment horizon, Dairy 3 is receiving 9.67 percent return on its investment. This increases to 14.58 percent for a twenty year time horizon. Dairy 4 has the worse returns on its investment. In a ten year time horizon, its return on investment is -13.41 percent. For a twenty year time horizon, this increases to -8.50 percent. As expected from the information above, only one dairy has a positive return on investment for ten years.
Table 22: Current Returns on Investment and the Flat Rates Necessary to Provide Each Digester a 10% and 20% Return on Investment
Dairy Return on Investment for 10 Year Horizon
Return on Investment for 20 Year Horizon
Flat Utility Rate Needed to Provide a 10% Return on Investment in 20 Years
Flat Utility Rate Needed to Provide a 20% Return on Investment in 20 Years
Dairy 1 -5.62% 0.00% $ 0.29674 $ 0.43629 Dairy 2 -5.37% 0.00% $ 0.17010 $ 0.28564 Dairy 3 9.67% 14.58% $ 0.07739 $ 0.13263 Dairy 4 -13.41% -8.50% $ 0.55640 $ 0.84150 Dairy 5 -6.83% -1.92% $ 0.24076 $ 0.36084 Dairy 6 -11.23% -6.30% $ 0.13777 $ 0.19686
An analysis in this study examined what flat rates would be necessary to achieve a 10 percent and a 20 percent return on investment for a twenty year time horizon. Table 21 shows that Dairy 3 is able to achieve a 10 percent return on investment with a flat electricity rate of
56
$0.07739 per kWh. To get a 20 percent return on investment in twenty years, it would need a flat rate of $0.13263 per kWh. The dairy that needs the highest rates is Dairy 4. To obtain a 10 percent return on investment, it would need to receive $0.55640 per kWh. This increases to $0.84150 per kWh to obtain a 20 percent return.
One of the major findings in this study is that the dairies that were examined did not have a uniform contract. Each dairy’s contract was unique to the dairy. These contracts ranged from a simple flat rate for the power it produced to a complex net metering program that is based on time-of-use pricing. This implies that each dairy received very different rates for the power that it produced. Dairies utilizing a time-of-use net metering program faced different prices during the day and different parts of the year. This fact has implications on both the operation and design of the digester. These implications were not necessarily taken into account in the design of the digester or its operation. Hence, some of these digesters were not necessarily designed to be as profitable as they could have been.
Another finding of this study was that it is very complex to figure out how much a dairy is making in terms of revenue from operating its digester. Since revenue from most of the digesters studied is from realized cost savings, it can be extremely difficult to estimate the revenue that is generated from electricity. Dairy 4 and Dairy 5 were the easiest to estimate because each received one single rate for its power production and the power was directly sold to the grid. This is a very different scenario than Dairy 2, where its revenue stream is all from avoided costs.
One finding that is important from this study is that digester revenue should not be examined from the average electricity rate. When designing these operations, consideration must be taken regarding the different value of the electricity in different parts of the day and the year. If differential pricing is occurring, then the design of the digester must take this into account. Otherwise, the digester may not be designed to maximize profits.
This study has shown how complex the economic side of operating a feasible anaerobic digester to produce electricity. It was found that each digester was uniquely built to fit around the dairies. Unfortunately, a set of them were not necessarily designed to maximize their potential profits.
While this study was able to get at some of the operation and maintenance costs, it is in no way a strength of the report. Since many of the systems analyzed are still very new, the costs do not represent a long-term steady-state operating and maintenance costs. In terms of revenue, this report extends beyond anything presented in the grey and academic literature. Billing statements were examined and paired up with rate schedules. These rate schedules were incorporated into the revenue projection and marginal revenue was examined rather than average revenue.
57
REFERENCES
Bishop, Clark P. and C. Richard Shumway, 2009. “The Economics of Dairy Anaerobic Digestion with Coproduct Marketing.” Applied Economic Perspective and Policy (Fall 2009) 31(3): 394-410.
California Department of Food and Agriculture, California Agricultural Statistical Review 2011-2012, 1220 N Street, Sacramento, CA, 2012.
Eastern Research Group, Inc., Protocol for Quantifying and Reporting the Performance of Anaerobic Digestion Systems for Livestock Manures, A report prepared for U.S. Environmental Protection Agency AgSTAR Program, 110 Hartwell Avenue, Lexington, MA 02421, http://www.epa.gov/agstar/documents/protocol.pdf, March 2011.
Key, Nigel and Stacy Sneeringer. Climate Change Policy and the Adoption of Methane Digesters on Livestock Operations, ERR-111, U.S. Department of Agriculture, Economic Research Service, February 2011.
Lazarus, William F. and Margaretha Rudstrom, 2007. “The Economics of Anaerobic Digester Operation on a Minnesota Dairy Farm.” Review of Agricultural Economics 29(2): 349–364.
Legislative Council of California, Assembly Bill No. 32, http://www.leginfo.ca.gov/pub/05-06/bill/asm/ab_0001-0050/ab_32_bill_20060927_chaptered.pdf, September 2006.
Leuer, Elizabeth R., Jeffrey Hyde, and Tom L. Richard, 2008. “Investing in Methane Digesters on Pennsylvania Dairy Farms: Implications of Scale Economies and Environmental Programs.” Agricultural and Resource Economics Review 37/2 (October 2008) 188–203.
Meyer, D., P.L. Price, H.A. Rossow, N. Silva-del-Rio, B.M. Karle, P.H. Robinson, E.J. DePeters, J.G. Fadel, Survey of dairy housing and manure management practices in California, Journal of Dairy Science, Volume 94, Issue 9, September 2011, Pages 4744-4750.
Stokes, Jeffrey, Rekha M. Rajagopalan, and Spiro E. Stefanou, 2008. “Investment in a Methane Digester: An Application of Capital Budgeting and Real Options,” Review of Agricultural Economics, 30: 664-676.
Stringfellow, William, Mary Kay Camarillo, Jeremy Hanlon, Michael Jue, and Chelsea Spier, Fiscalini Farms Biomass Energy Project Final Report 2011, Subcontract to Fiscalini Farms LP for work under the Assistance Agreement DE-EE0001895 “Measurement and Evaluation of a Dairy Anaerobic Digestion/Power Generation System” from the United States Department of Energy National Energy Technology Laboratory, October 2011.
58
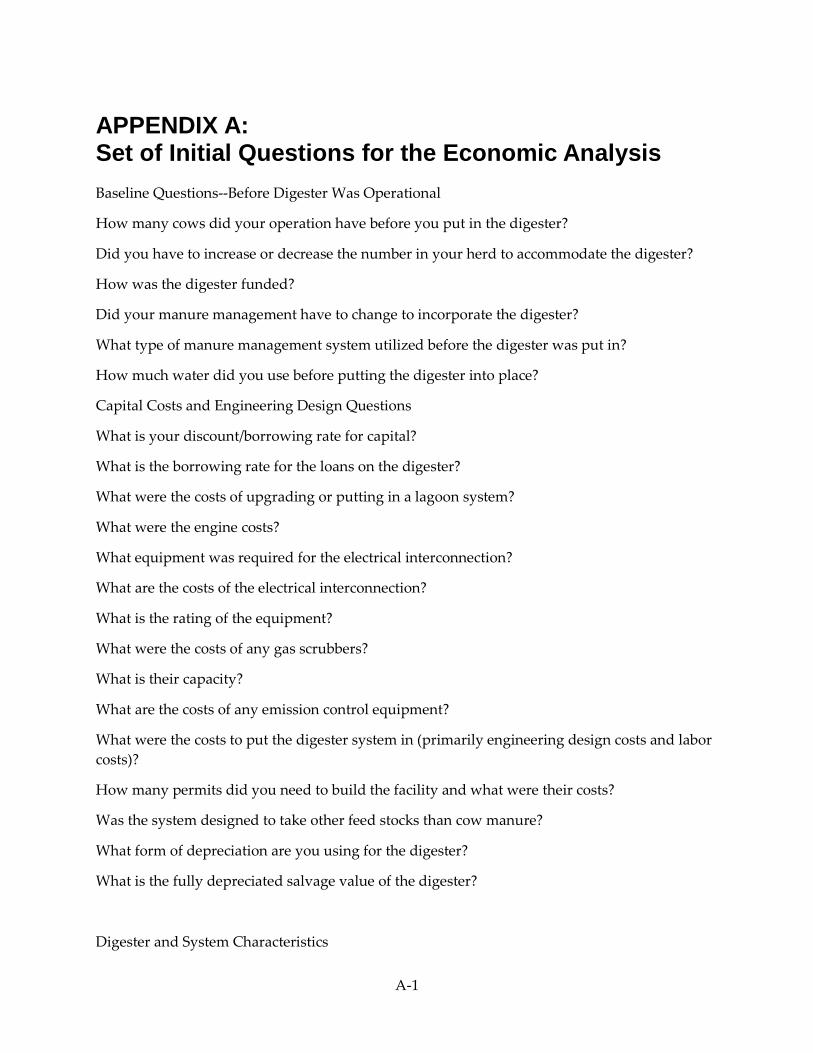
APPENDIX A: Set of Initial Questions for the Economic Analysis Baseline Questions--Before Digester Was Operational
How many cows did your operation have before you put in the digester?
Did you have to increase or decrease the number in your herd to accommodate the digester?
How was the digester funded?
Did your manure management have to change to incorporate the digester?
What type of manure management system utilized before the digester was put in?
How much water did you use before putting the digester into place?
Capital Costs and Engineering Design Questions
What is your discount/borrowing rate for capital?
What is the borrowing rate for the loans on the digester?
What were the costs of upgrading or putting in a lagoon system?
What were the engine costs?
What equipment was required for the electrical interconnection?
What are the costs of the electrical interconnection?
What is the rating of the equipment?
What were the costs of any gas scrubbers?
What is their capacity?
What are the costs of any emission control equipment?
What were the costs to put the digester system in (primarily engineering design costs and labor costs)?
How many permits did you need to build the facility and what were their costs?
Was the system designed to take other feed stocks than cow manure?
What form of depreciation are you using for the digester?
What is the fully depreciated salvage value of the digester?
Digester and System Characteristics
A-1

What type of digester has been adopted?
What is the capacity of the digester?
What is the engine electrical output rating?
Was the digester designed to handle any other inputs besides manure?
On average, how many cows are lactating and how many cows are dry?
Type of manure management system currently being utilized?
Are there any other inputs besides dairy manure utilized in the digestion system?
What is done with the effluent?
How much water do you currently use since the digester has become operational?
Operation and Maintenance Questions
What are the monthly and yearly operating and maintenance costs?
What is the maintenance cycle for your capital investments (e.g., piping, generator set etc.)?
How many hours and what types of labor are used for maintenance of the digester system (including hours by system owner/manager and hours by laborers?
What part of the system requires the most maintenance/labor?
What ongoing service contracts do you have to maintain specialty equipment (for example, engines, switchgear, sulfur removal systems, etc.)?
How often is gas being flared?
What minor or major upgrades have you made to the digester system?
Revenue Sources
How much do you get for selling your gas/electricity to the grid?
How much cost is offset due to using the power or the gas from the digester system?
What products do you get from the anaerobic digester that you either sell or use on your farm?
Is there income from any other sources outside of the digester but are related to the digester?
Does the effluent have value to your operation?
Have you tried to record or sell any carbon credits for your digester system? What has been your experience with this?
What type of contracts do you have to sell either the gas or the electricity from the digester?
A-2