an economic analysis of flu vaccination
TRANSCRIPT

AN ECONOMIC ANALYSIS OF FLU VACCINATION Ben Franklin and Dean Hochlaf JULY 2018
www.ilcuk.org.uk

The International Longevity Centre - UK (ILC-UK) is an independent, non-partisan think-tank dedicated to addressing issues of longevity, ageing and population change. It develops ideas, undertakes research and creates a forum for debate.
The ILC-UK is a registered charity (no. 1080496) incorporated with limited liability in England and Wales (company no. 3798902).
ILC–UK11 Tufton StreetLondonSW1P 3QBTel: +44 (0) 20 7340 0440
E-mail: [email protected]
AcknowledgementsThis report was supported by an educational grant from Seqirus. The authors would also like to thank all those who attended a roundtable event in the House of Lords in May 2018 to provide their input and feedback. The approach, contents and findings of the final report are solely the responsibility of the report’s authors.

I 3 I An economic analysis of flu vaccination
Contents
Introduction..........................................................................................................................................4
Chapter 1: Influenza today - assessing the current situation in England.......................................6
Chapter 2: Past approaches to cost-benefit analysis.....................................................................11
Chapter 3: Method..............................................................................................................................13
Chapter 4: Results..............................................................................................................................17
Conclusion .........................................................................................................................................21

I 4 I An economic analysis of flu vaccination
Introduction
BackgroundSeasonal influenza remains a potent public health concern around the globe. Those with underlying health conditions are exposed to serious and even fatal consequences if they catch the flu. The flu continues to impose a serious burden on health services, as well as resulting in “productivity losses” due to poor health and premature mortality1.
Given the rapidly ageing population of the UK and growing pressures on the National Health Service, tackling influenza is an important challenge, especially during the winter months when flu and other related health conditions are most prevalent. Vaccinations are recognised as a crucial defence against flu outbreaks, helping to protect individuals directly and by creating herd immunity2. However, all health systems face financial constraints, and understanding the costs and benefits of vaccination comes into consideration by those implementing health policy.
MethodThis report’s critical contribution is to outline our findings from a new economic model of the costs and benefits from flu vaccination in England using actual recent efficacy data. More specifically, we create a conservative, static model which provides a partial cost-benefit analysis of vaccination under various scenarios. But while it is conservative in its approach, in that it is likely to underestimate the number of flu cases averted, the model accounts for the wider societal costs of flu that are not always explored in such analyses – such as sick days and premature death (including amongst children and those over 65). The model allows us to produce a cost-benefit analysis under different plausible scenarios for vaccine efficacy, the vaccination rate and the cost of the vaccine as it applies to various risk groups. We also produce estimates of vaccination costs per death averted to enable comparison with the wider literature.
Key findings
Efficacy is crucial
• Our findings underscore the importance of 1) raising efficacy among older age groups in particular and 2) better evidence on actual efficacy values, particularly for older people and those with underlying health conditions.
o In 2016/17, at the central estimate for efficacy, the vaccine was thought ineffective among the over 65s, so the costs of delivering vaccination outweigh the economic benefits in our model.
o But at the estimated upper bound of efficacy in 2016/17, benefits outweighed costs since there was a significant increase in averted hospitalisation costs and productivity gains from reduced mortality.
o Our results using the 2015/16 central estimate for efficacy also show the costs of delivering the vaccine outweighing the economic benefits, but at the upper bound of efficacy the benefits significantly outweigh the costs (approx. +£50 million).
o All of this underlines the fact that efficacy rates are notoriously variable and hard to measure with huge ranges based on the underlying confidence intervals used.
o Typical efficacy rates range from 30-70% for a given flu season. So we envisage an optimistic but plausible scenario whereby efficacy rises to over 65% and coverage increases to 75% for each risk/age group. This implies significant improvements to efficacy among older groups and significant improvements to coverage amongst working age and children. In this scenario, the benefits significantly outweigh costs (approx. +£90 million).
1WHO Influenza Factsheet, January 2018 - http://www.who.int/mediacentre/factsheets/fs211/en/2Sadarangani, M. 26 April 2016, “Herd immunity: How does it work?” Oxford Vaccine Group - https://www.ovg.ox.ac.uk/news/herd-immunity-how-does-it-work

I 5 I An economic analysis of flu vaccination
Human capital costs of flu are the largest component
• In the wider literature there is an obvious focus on the direct healthcare costs associated with the flu, but we find the greatest economic benefits from flu vaccination are driven by the prevention of premature mortality and the associated lost economic productivity.
o Across all scenarios, the greatest economic benefit from vaccination is derived from reducing the human capital costs of premature mortality. Averted human capital costs ranged from £90 million in scenario 1 (central estimate) to £270 million in scenario 3.
o In addition, while previous attempts to measure human capital costs ignore the impact of premature death amongst the over 65s, we account for lost productivity among this age group through the expected provision of informal care during retirement. In this regard, we find substantial potential cost savings when the vaccine is well matched.
Implications
• Public policy should focus on increasing coverage rates among young people (0-15) where efficacy and incidence is higher. While we do not model herd effects, taking a more conservative approach, this would seem to be the most efficient approach to improving overall benefits, relative to costs. We note that the Government has been incrementally introducing a childhood flu vaccine programme which will ultimately target all children between 2-11 years of age3.
• The efficacy of the vaccine among the over 65s is a significant issue. High levels of demand for the vaccine amongst this age group combined with recent low efficacy rates means that the costs of delivering the vaccine outweigh the benefits in our model. More research and innovation is needed to specifically explore vaccination efficacy for this age group.
• Overall the cost-benefit analysis is also highly sensitive to vaccine administration costs. If the health service can take advantage of economies of scale to reduce the unit cost for delivering the vaccine (critically without it affecting the efficacy), this would also support improving the potential benefits, relative to the costs. We note that the costs of delivering a vaccine through a pharmacy is £2 cheaper than through a GP – this suggests there may be opportunities to find further reductions in the cost of delivery.
• The wider societal costs of premature death from flu, such as lost years of work and care, account for the largest component of total costs. Any consideration of the benefits of preventative approaches should factor these costs in. This point does not just relate to public policy, but also to employers who might be considering offering vaccinations to their workforce.
The remainder of this report is structured into five sections:
1. Influenza today - assessing the current situation in England.
2. Past approaches to cost-benefit analysis
3. Methods
4. Results
5. Conclusion
To note: Due to limitations on data, this report exclusively looks at the situation in England.
3See for instance: Paul Cosford (2018) Flu and flu vaccines: Expert interview, Public Health England: https://publichealthmatters.blog.gov.uk/2018/01/11/flu-and-flu-vaccines-expert-interview/

I 6 I An economic analysis of flu vaccination
Chapter 1: Influenza today: assessing the current situation in England
About this chapterThis section explores recent empirical trends associated with influenza in the UK. Using available evidence, we chart some of the challenges faced by society in the face of this seasonal illness, as well as documenting the key areas where flu outbreaks have tangible economic costs.
An ageing populationDuring the winter of 2016/17, Public Health England (PHE) reported “moderate levels of influenza activity” but noted that the adverse impact of the flu was mainly felt by older adults4. According to National Population Estimates, the number of people aged over-65 in England has risen by over 26% between 2000 and 2016. This represents over 2 million additional people in a major risk group likely to be worst affected by the flu.
Such a significant increase in the population of a major risk group raises concerns regarding the ability of the health service to cope with exacerbated demand in the event of increased flu cases. To appreciate where the strain is coming from, we have identified four key areas which are likely to generate costs to the health budget and wider society because of the flu.
GP visitsData collected weekly by the Royal College of General Practitioners helps us identify the proportion of the relevant population which reports flu-like illness. During the winter of 2016/17 the proportion of cases reported among older people peaks at just over 25 cases for every 100,000 people in this age group. This coincided with a high incidence rate among those aged 15-64 and rising cases in those aged under 15.
Figure1: National incidence rate 2016/17 of influenza-like illness
0
5
10
15
20
25
30
41 42 43 44 45 46 47 48 49 50 51 52 1 2 3 4 5 6 7 8 9 10
Inci
denc
e ra
te p
er 1
00,0
00 p
eopl
e
Week
< 15 years 15-64 years 65+ years
Source: RCGP Research and Surveillance Centre
Documented cases, such as those above, capture the number of individuals using GP services in the event of a flu-like illness. As the gatekeepers to the broader health service, GPs play a valuable role in the provision of local health care. Not only are there economic costs associated with increased use of GP services, there are also opportunity costs in the sense that the capacity for GPs to treat other patients is reduced.
GP visits serve as an important indicator of how prevalent influenza is in society, and given the viral nature of the disease, more cases mean greater risk. Sudden spikes in influenza cases can put additional strains on public health services, especially during the winter when vulnerable groups are already exposed to numerous other risks, and when the NHS is generally seen as “struggling to cope with demand”5.
4 Public Health England (2017) “Surveillance of influenza and other respiratory viruses in the UK: Winter 2016 to 2017”5The British Medical Association (2017) “NHS pressures” briefing note.

I 7 I An economic analysis of flu vaccination
HospitalisationThe prevalence of influenza, especially among risk groups can lead to serious health complications. Hospitalisation because of the flu can generate significant costs to the health service, while also jeopardising the wellbeing of the vulnerable.
Figures on finished consultant episodes (FCE) to treat influenza-induced hospitalisations confirm that the vast majority of hospital cases are among older adults. Over 1,800 individuals hospitalised were aged between 80 and 84 - higher than any other age group. Hospitalisation numbers among teenagers is extremely low before rising to a consistent level during early adulthood.
Figure 2: Influenza due to identified virus - finished consultant episodes 2016-17
0 200 400 600 800
1000 1200 1400 1600 1800 2000
Age
0
Age
1-4
Age
5-9
Age
10-
14
Age
15
Age
16
Age
17
Age
18
Age
19
Age
20-
24
Age
25-
29
Age
30-
34
Age
35-
39
Age
40-
44
Age
45-
49
Age
50-
54
Age
55-
59
Age
60-
64
Age
65-
69
Age
70-
74
Age
75-
79
Age
80-
84
Age
85-
89
Age
90+
Fini
shed
con
sulta
nt e
piso
de
Source: Hospital Episode Statistics
For older adults hospitalised with the flu, the risks of mortality become even greater. In addition, increased demand for hospital beds and resources exerts pressure elsewhere within hospitals, straining the service further during winter months when demand is especially high. Evidence from the 2017/18 winter season suggests that “hospitals are effectively consistently full in terms of acute beds”6 emphasizing that seasonal influenza is contributing to the diminishing capacity of hospitals to treat patients.
ProductivityEither through workforce absences, or more tragically death, influenza can have an adverse impact on productivity within the economy. The infectious nature and severity of symptoms means those afflicted by the illness are discouraged from attending the workplace, and at any rate are extremely unlikely to fulfill their role adequately while suffering from the flu.
Deaths occur less frequently but can spike depending on the incidence rate of the flu and the efficacy of the vaccine. 2011 was a particularly bad year as over 450 people officially died from the flu. Another spike in deaths was recorded in 2016. Yet this data is only likely to account for a small proportion of total influenza related deaths, since often the death may be linked to influenza but this is not recorded as the ultimate primary cause. For this reason, we take a different approach to measuring influenza mortality in the model described later in this report.
6Kershaw, M. (2018) “NHS Winter Crisis: when a plan is not a plan” The Kings Fund

I 8 I An economic analysis of flu vaccination
Figure 3: Influenza as underlying cause of death
0!
50
100
150
200
250
300
350
400
2001
2002
2003
2004
2005
2006
2007
2008
2009
2010
2011
2012
2013
2014
2015
2016
Dea
ths
Under 65 Over 65
Source: Mortality team, Life Events and Population Sources Division, ONS
Premature death has adverse consequences. As well as the loss of life having a devastating impact on family and friends, it also eliminates all the economic potential of an individual, either through formal participation in the labour force, or other economic contributions such as provision of care.
Protecting people from potentially fatal illness is a vital task for the health service, not just to provide a better quality of life for individuals, especially those at risk, but also to insulate the health service from the numerous costs associated with influenza outbreaks.
The vaccineThe government recommends vaccination to protect against seasonal influenza for a number of groups including: small children, older adults, pregnant women, health care workers and those with underlying health conditions.
Comparative data suggests the UK performs strongly when it comes to vaccinating older adults. Just over 71% over those aged over 65 were vaccinated in 2015, the second highest proportion across all OECD countries. In the UK, people aged over 65 are entitled to a free vaccination, which may have helped boost coverage for this age group.
Among people aged 18-64 in a clinical risk group, the vaccination levels were lower. In 2016/17 it was estimated that 48.1% of people at risk, below the age of 65, had been vaccinated, an increase from the previous year when 45.1% of individuals had been vaccinated7. From the data, this implies that there remained over 6.2 million at risk individuals who had not been vaccinated during the 2016/17 flu season.
Figure 4: Influenza vaccination rate proportion of 65+ (2015)
0
10
20
30
40
50
60
70
80
90
LVA
SVN
SVK
LTU
HU
NN
OR
DEU IS
LLU
XD
NK
FIN
ITA
SWE
PRT
FRA
CH
LIR
LES
PC
AN ISR
NLD
NZL USA
GBR
KOR
%
Source: OECD
7Public Health England (2017) “Seasonal influenza vaccine uptake in GP patients: winter season 2016 to 2017”

I 9 I An economic analysis of flu vaccination
EfficacyUnfortunately, the efficacy of flu vaccination remains a big issue. With a new vaccine required each year, and the presence of different influenza strains, the efficacy of the flu vaccine can be precarious. During the 2016/17 flu season, PHE estimated that the central estimate of vaccine efficacy among the over 65’s implied it had no real impact on preventing cases of influenza.
Estimates among other risk groups were higher, especially among children below the age of 17, where the efficacy rate was above 65% in the same year. In the previous year, the central estimate for this group was 57.6%, but for the over 65s there was some protection, as the vaccine was estimated to have an efficacy level of just under 30%.
This raises the prospect that vaccination programmes, and the resources allocated to them, could potentially fail to live up to the expected benefits. Ensuring that the vaccine is effective is therefore as crucial as overall take up. Low efficacy rates are unlikely to generate the level of herd immunity across society to bring large cost-benefits.
Evidence on efficacy examined by the Centres for Disease Control and Prevention in the United States dramatically illustrates the variability of vaccination efficacy over time. Their reported estimates, based on observational studies using medically attended laboratory-confirmed flu as the outcome, show starkly the challenge between 2005 and 2018.
Figure 5: Seasonal flu vaccine effectiveness
10
21
52
37 41
56 60
47 49
52
19
48
40
36
0
10
20
30
40
50
60
70
2004
-05
2005
-06
2006
-07
2007
-08
2008
-09
2009
-10
2010
-11
2011
-12
2012
-13
2013
-14
2014
-15
2015
-16
2016
-17
2017
-18
Flu season
%
Source: CDC (2018) Seasonal Influenza Vaccine Effectiveness, 2005-2018, Accessed via: https://www.cdc.gov/flu/professionals/vaccination/effectiveness-studies.htm
Delving deeper: Examining efficacyEfficacy remains a significant challenge when it comes to analysing the effectiveness of vaccination. A systematic review found that the seasonal variations in efficacy were great, and that although “moderate protection” was afforded by vaccination, there were some seasons where protection was altogether absent. However, it was noted that young children seemed to benefit most from higher rates of efficacy.8
Wider evidence suggests that the effectiveness of the vaccine “remains moderate to poor” for those more vulnerable to serious complications, and it is suggested that “strong evidence” is lacking for these groups9. Specific evidence on vaccine efficacy for older adults is of particularly “poor quality”, especially when it comes to determining the impact of vaccination on those most at risk of complications such as pneumonia, hospitalisation and influenza-related mortality in the face of the illness10.
Since vaccine efficacy requires further study, it is important to incorporate a range of different potential efficacy rates into any cost-benefit analysis. Changing efficacy rates across flu seasons makes it
8Osterholm, M.T., Kelley, N.S., Sommer, A. and Belongia, E.A., 2012. Efficacy and effectiveness of influenza vaccines: a systematic review and meta-analysis. The Lancet infectious diseases, 12(1), pp.36-44.9Michiels, B., Govaerts, F., Remmen, R., Vermeire, E. and Coenen, S., 2011. A systematic review of the evidence on the effectiveness and risks of inactivated influenza vaccines in different target groups. Vaccine, 29(49), pp.9159-9170.10Jefferson, T., Di Pietrantonj, C., Al Ansary, L.A., Ferroni, E., Thorning, S. and Thomas, R.E., 2010. Vaccines for preventing influenza in the elderly. The Cochrane Library.

I 10 I An economic analysis of flu vaccination
more difficult to capture the true extent of vaccine effectiveness, and ultimately means the benefits of vaccination can significantly fluctuate annually.

I 11 I An economic analysis of flu vaccination
Chapter 2: Past approaches to cost-benefit analysis
This section explores recent attempts in the literature to model a cost-benefit analysis of flu vaccination. There are a number of approaches taken within the literature, each with its own strengths and weaknesses.
Model design: static vs dynamicCost-benefit analysis models generally sit within two camps. The first are static models which explore the direct effects of vaccination within their target groups. They are based on a decision tree approach making them clear and logical. Given the poor availability of good clinical data on vaccination efficacy, they form a useful tool for coping with this uncertainty. Moreover, since the main outcomes of the vaccination occur over a single season and only once during this time (i.e. influenza or no influenza), “decision trees…are likely to be sufficient to capture the majority of health outcomes”11. But the downside is that static approaches do not attempt to model the herd impacts of vaccination which could be significant. For this reason, WHO guidelines suggest that a static model can be used as a conservative approach12.
A good example of the static approach is Preaud et al (2014) which assesses the annual public health benefits of flu vaccination across Europe. They find significant benefits of raising vaccination coverage rates to 75% across the continent though they do not look at these benefits relative to the costs of providing additional vaccinations13. Nevertheless, the model adopts a simple and transparent strategy for exploring the effects of different vaccination rates on public health and economic outcomes.
The second set of models are known as dynamic transmission. They explicitly model the direct effects of vaccination for different risk groups as well as the herd effects of vaccination. This requires good data on how the population interact which can be difficult to identify and uncertain. Baguelin et al. adopt this approach to estimate the impact of vaccination in England under different scenarios where the incidence rates and efficacy rates change14. The results indicate that vaccination would yield greater monetary benefits relative to costs, providing that the incidence of flu was above a certain threshold and the vaccine is sufficiently well matched (efficacy sufficiently high). Such studies illuminate the potential ways in which vaccination can limit the spread of the flu and the subsequent potential cost savings, but still face problems with data limitation around efficacy rates, as well as influenza-related mortality rates.
Demonstrating economic benefits
While measuring the cost of providing the vaccine is relatively simple, there are different approaches to evaluating the costs and benefits of the vaccine itself. Many researchers adopt the cost per quality-adjusted life year (QALY). It combines the effects of health interventions on mortality and morbidity into a single measure. Benefit thresholds are set by different health bodies, but in England it is between £20,000-30,000 per QALY gained15. But there are a number of potential problems with this approach for our purposes. Due to a lack of detailed reliable data on influenza-related mortality rates by age, it is difficult to construct reliable estimates for the number of years of life remaining. Moreover, since those deaths may well be within clinical risk groups, the future number of years spent in good health will be different from the rest of the population who are of the same age. Moreover the QALY calculation is highly sensitive to the monetary value assigned to a year in good health, which can resemble a
11Shields GE, Elvidge J,Davies LM. A systematic review of economic evaluations of seasonal influenza vaccination for the elderly population in the European Union. BMJ Open 2017;7:e014847. doi:10.1136/bmjopen-2016-01484712Cited by Shields et al (2017) 13Preaud E, Durand L, Macabeo B, Farkas N, Sloesen B, Palache A, Shupo F, Samson SI; Vaccines Europe influenza working group. 2014. Annual public health and economic benefits of seasonal influenza vaccination: a European estimate. BMC Public Health 14:813.14Baguelin, M., Jit, M., Miller, E. and Edmunds, W.J., 2012. Health and economic impact of the seasonal influenza vaccination programme in England. Vaccine, 30(23), pp.3459-3462.15 NICE (2017) NICE gets go-ahead to fast-track more drug approvals https://www.nice.org.uk/news/article/nice-gets-go-ahead-to-fast-track-more-drug-approvals

I 12 I An economic analysis of flu vaccination
somewhat arbitrary value in the literature16 and the cost effectiveness threshold itself is much debated17. Finally, there are other costs and benefits from averting flu that are often not captured through QALY measures – such as averted hospitalisations and GP visits as well as averted productivity costs through sick days.
An alternative approach is to directly calculate all the savings made by averting influenza in the different domains – both to the health service and wider society – and to compare this with the overall costs of providing the vaccine. This is known as a partial cost-benefit analysis. While not as neat as a QALY measure, the advantage is that it can take into account a whole host of different cost savings which can be compared with the costs of an intervention. And by disaggregating the cost savings into their component parts, it is possible to identify the channels through which averting flu makes the biggest economic impact.
Our modelWe loosely base our modelling approach on Preaud et al (2014) which is a static model of vaccination effectiveness and apply this to England. This means our approach errs on the conservative side – in other words it is more likely to underestimate the cost savings from vaccination. We use the static approach for its simplicity and transparency. This makes it both easy to explain as well as simple to change the underlying parameters of the model (such as vaccination coverage and efficacy rates) and explore their outcomes. The Preaud paper analyses the cost savings of raising vaccination coverage, but omits two crucial elements that we choose to include. First we include the human capital costs of flu – that is the cost of premature death using a standard economic approach. We do this for children, working age adults and older people. Second we include the cost of providing the vaccine itself. This is important because, all else remaining equal, raising vaccination coverage will boost the number of averted cases but it will also increase the number of vaccinations required, therefore raising the cost of provision.
It should be noted that any cost-benefit analysis will not be able to capture all the economic/societal costs of flu. For instance, there is evidence of knock-on effects from flu vaccination to generate health gains in areas that are outside of the scope of this study – such as potential reductions in cardiovascular mortality and combined cardiovascular events18. Moreover, the human and emotional costs of losing a loved one due to flu are undeniably significant but largely immeasurable in economic terms.
In summary, our model is a conservative exploration of the cost-benefit of flu vaccination which includes a range of direct and wider societal costs while allowing for the exploration of different efficacy and vaccination coverage scenarios. Finally, we provide headline estimates of the cost of vaccination per death averted to allow for easy comparison with the wider literature.
16See for instance HMT Green Book which assigns £60,000 for every year quality of life year. There are obvious problems with such a blanket approach. For example, the human capital costs of premature death during working life are likely to be greater than among retirees, but this is not accounted for with this single monetary value. 17See for instance Claxton K, Martin S, Soares M, Rice N, Spackman E, Hinde S, Devlin N, Smith P, Sculpher M. (2015) Methods for the Estimation of the NICE Cost Effectiveness Threshold, Health Technology Assessment Volume: 19, Issue: 1418Clar C, Oseni Z, Flowers N, KeshtkarJahromi M, Rees K (2015). Influenza vaccines for preventing cardiovascular disease. Cochrane Database Syst Rev 2015;5: CD005050

I 13 I An economic analysis of flu vaccination
Chapter 3: Method
This section outlines our methodology and results.
The model The model and approach used has been adapted from research assessing the public health and economic benefits of influenza vaccination across Europe19. We estimate the averted cases possible due to vaccination of at risk individuals, using the following formula:
ªr 1
6
=
X XrV E Ir r
V – The vaccinated coverage rate
E – The efficacy rate
I – The incidence rate
r – The risk groups
This model allows us to estimate the averted cases possible through vaccination, depending on coverage, efficacy and incidence.
The risk groupsThe focus of this study is exclusively on the main risk groups in England, individuals who are either more likely to be exposed to influenza, or those who face severe complications should they catch the flu. We define risk groups as those which are eligible to receive a free vaccination on the NHS. These groups include:• Older adults • Healthcare workers• Pregnant women• Working age adults with underlying health conditions• Eligible children (0-15)Population data for these groups was attained through Public Health England (PHE) who monitor risk groups20.
Coverage rates Vaccination uptake rates were also acquired from PHE21. Using survey data from GP practices, we use the most comprehensive data available on the populations of risk groups and the extent of vaccine coverage.
Risk group Vaccine Coverage %
65 + 70.5%
Healthcare workers 63.2%
Pregnant women (risk) 58.7%
Pregnant women (non-risk) 43.3%
16-64-years 49.4%
Children 38.3%
19Preaud, E., Durand, L., Macabeo, B., Farkas, N., Sloesen, B., Palache, A., Shupo, F. and Samson, S.I., 2014. Annual public health and eco-nomic benefits of seasonal influenza vaccination: a European estimate. BMC public health, 14(1), p.813.20Public Health England (2017) “Seasonal influenza vaccine uptake in GP patients: winter season 2016 to 2017”21ibid

I 14 I An economic analysis of flu vaccination
While vaccination rates change from year to year, this evidence allows us to gauge how common vaccination is within at-risk populations. Although it is possible for individuals to pay for the private provision of flu vaccinations, and thus increase coverage beyond the rates used in this report, this evidence best reflects the provision of vaccination by GP practices, and therefore the NHS. Therefore, these estimates are more relevant to our over-arching cost-benefit analysis of vaccination to wider society and health providers, rather than to individuals.
Efficacy rates
Efficacy rates are taken from PHE estimates22,23, measured against confirmed influenza cases in a clinical setting. Vaccine efficacy is adjusted to reflect the age, gender and strain of influenza.
The flu season in 2016-17 was noticeable for the general poor efficacy of the vaccine. For older adults, the vaccine was evaluated to be ineffective in the central estimate, while only 40.6% of working age adults were protected by the vaccine. Only children responded with relatively high levels of efficacy. During the 2015-16 flu season, efficacy rates were higher among older and working age adults, but slightly lower among children.
Age group 2015-16 2016-17
2-17 years 57.6 (25.1, 76.0) 65.8 (30.3, 83.2)
18-64 years 55.4 (34.4, 69.6) 40.6 (19.0, 56.3)
>64 years 29.1 (-31.4, 61.8) -6.3 (-94.5, 42.0)
All age 52.4 (41, 61.6) 39.8 (23.1, 52.8)
Source: Public Health England (all efficacy figures are %)
The figures in brackets above represent confidence intervals, for the lower and upper bound efficacy rate estimates.
These efficacy rates represent the best available data, and are the results of clinical testing. The sample patients who would have been tested may not reflect the risk groups that we are examining in this report.
Incidence rates The incidence rate of influenza-like illness is taken from Preaud et al24. who present findings from a systematic review of randomised control trials.
As such, we take a general approach to hold these clinically proven incidence rates constant throughout our study. Children face significantly higher levels of incidence than working age people and older people.
Risk group Incidence rate %
65 + 4.91%
Healthcare workers 3.64%
Pregnant women (risk) 3.64%
Pregnant women (non-risk) 3.64%
16-64-years 3.64%
Children 19.1%
The scenariosAny attempt to estimate averted cases because of vaccination will be extremely sensitive to changes in coverage, efficacy and incidence. To explore the costs and benefits of vaccination, we have developed three distinct scenarios, with the aim of highlighting which areas can be targeted to improve health outcomes and economic efficiency. The scenarios are outlined below:
22Public Health England (2016) “Influenza vaccine effectiveness in adults and children in primary care in the UK: provisional end-of-season results 2015-16”23Public Health England (2017) Influenza vaccine effectiveness (VE) in adults and children in primary care in the United Kingdom (UK): provisional end-of- season results 2016-1724Preaud, E., Durand, L., Macabeo, B., Farkas, N., Sloesen, B., Palache, A., Shupo, F. and Samson, S.I., 2014. Annual public health and eco-nomic benefits of seasonal influenza vaccination: a European estimate. BMC public health, 14(1), p.813.

I 15 I An economic analysis of flu vaccination
Scenario 1 – Averted cases are calculated using the latest estimated coverage rates for each risk group. Efficacy rates are those calculated by PHE during the 2016/17 flu season. This scenario could be described as atypical due to negligible efficacy rates among older adults.
Scenario 2 – Averted cases are calculated using the latest estimated coverage rates for each risk group. Efficacy rates are those calculated by PHE during the 2015/16 flu season. This scenario better represents “typical” efficacy rates among older adults, yet they remain low relative to other groups.
Scenario 3 – We assume a higher coverage and efficacy rate. The coverage rate now represents 75% of the risk population, the level recommended by the European Council. Efficacy rates are now based on the highest observed rates from any group over the two years’ worth of data (which was 65.8%) from across the available data. This scenario represents an ideal scenario where both coverage and efficacy are plausible.
To estimate the cost savings, we examine four key areas where we expect direct costs savings, through averting flu cases. These are:
• GP visits
• Hospitalisations
• Sick days
• Human capital costs
The methods for estimating each domain are set out below.
The cost savingsHospitalisations
Estimating the number of hospitalisations from flu is not straightforward. While influenza is recorded in the diagnosis code for hospital admissions, this does not capture the full extent of flu-related hospitalisations. For instance, Cromer et al (2014) find that around 2% of admissions for acute respiratory illness are explained by influenza. Therefore, to estimate total flu hospitalisations, we combine data from the Hospital Episode Statistics25 on influenza confirmed admissions and 2% of relevant respiratory illnesses26.
Finally, to examine the effect of vaccination on hospitalisations, we first estimate the proportion of people with the flu who were admitted to hospital, and used this proportion to calculate the number of averted hospitalisations due to vaccination under different efficacy and vaccination coverage scenarios.
To calculate the overall cost of hospitalisation, we combine data on the average cost of a hospital bed day (£222) and the average length of time the relevant inpatients are treated for (9 days for influenza confirmed admissions and 3 days for relevant respiratory illness)27.
GP visits
We take a similar approach to estimating flu-related GP consultations and associated costs. Cromer et al find that around 10% of GP consultations for acute respiratory illness are influenza related. We therefore combine data from the Royal College of GPs on influenza-like-illness (ILI) and relevant acute respiratory illness. We assume 30% of people reporting ILI actually have the flu. This is consistent with the finding from a swabbing programme in 2015/16 that around 30% of people reporting ILI tested positive to the flu28. We scale the RCGP data to national level using ONS Population Estimates for England. The RCGP data allows comparisons across age groups but not risk groups.
To examine the effect of vaccination on GP consultations, we first estimate the proportion of individuals with the flu who went to their GP, and used this proportion to calculate the number of averted GP consultations due to vaccination under different efficacy and vaccination coverage scenarios.
The unit cost of visiting a GP for an appointment averaging just over 9 minutes is £3629. As this reflects the average time spent with a GP we used this costing, coupled with the number of averted GP 25Hospital Episode Statistics (2017) “Hospital Admitted Patient Care Activity, 2016-17” 26As per Cromer et al (2014) patients were included in the analysis if they had an acute respiratory illness code (ICD-10 codes J0*, J1*, J2*, J3*, J40*, J41*, J42*, J43*, J44*, J47*)27For cost of a bed day we use the figures quoted in: National Institute for Health and Care Excellence (2015) “Costing statement: Implement-ing the NICE guideline on transition between inpatient hospital settings and community or care home settings for adults with social care needs (NG27)”. For average number of bed days per diagnosed illness we use the HES dataset. 28RCGP RSC Annual Report 2015/1629Curtis, L. and Burns, A. (2016) “Unit Costs of Health and Social Care 2016” PSSRU

I 16 I An economic analysis of flu vaccination
visits, to determine the total averted costs associated with reduced GP visits because of vaccination across our scenarios.
Sick days
Workforce absences because of flu can generate large productivity costs, which we estimate in our analysis. Praeud et al. (2014)30 estimated that the average number of days lost during sickness was four days. We use this figure, as well as the 2017 average employment rate and average daily wage taken from the ONS, and apply it to the number of averted cases among adults of a working age and pregnant women. We assume that healthcare workers would be at full employment rate, as their presence as a risk group is determined by their position in the labour market.
As employment rates or average wages were not available for each risk group individually, we chose to use national averages. While these may overstate the employment rate among those with underlying health conditions, it is the best available data that reflects employment prospects in England.
The cost of premature death
We attempt to put a cost on the years of lost productivity due to premature death. For this we use the human capital cost approach, which is the most commonly used measure in the health economics literature. We then seek to understand the lives saved and therefore economic impact of the flu vaccine.
First, we need to know the actual number of premature deaths due to flu in any given year. For this, we use flu mortality rates per 100,000 people as per the EuroMOMO network which creates a pooled analysis of influenza-attributed mortality across Europe for 2016-1731. Consistent with the wider literature, we assume anyone who dies from flu dies prematurely. By combining this with population data from ONS, we can estimate the possible number of flu related deaths in England.
We first focus our efforts on calculating the economic cost of premature death amongst the working age population – those aged 16 to 64. Because we do not have available data on the age distribution of influenza related premature death within this broad age group, we assume it is the same as the distribution of death in hospital for acute respiratory illness as reported by Cromer et al (2014)32. For those who die aged 16 to 44 we therefore assume they would have spent another twenty years in the labour market, while for those who die age 45 to 64 we assume they would have spent five more years in the labour market. We also assume that their employment rate would have matched the rest of the working age population and that they would have earned an average weekly wage if they were employed. We use data from ONS Labour Market Statistics with regards to the employment rate and average weekly earnings. We assume zero real wage growth over their remaining working life and calculate the present value of lost earnings from premature death. We take a similar approach regarding premature death among children, but assume that they would have worked for 40 years adjusting for the employment rate.
As an extension to previous analysis, we also explore lost output amongst the over 65s. Past human capital approaches have ignored the potential economic costs of premature death amongst the over 65s. But some of these individuals will be in work and they can contribute to productivity in other ways, such as by providing care for children and other family members. The ONS recently put an economic value on informal care of £56bn in 2014 for the UK. Of this total figure, those aged over 70 accounted for the largest proportion (35.5% or £19.9bn) of total output33. Using this data and combining it with population estimates, we can put a figure on the average annual amount an older person provides by way of care per annum £2,905. We assume that if they had not died from flu they would have provided an average of 2.6 years’ worth of care during their remaining lifetime34. Again, we assume zero inflation and calculate the value of lost caregiving in present value terms.
30Preaud, E., Durand, L., Macabeo, B., Farkas, N., Sloesen, B., Palache, A., Shupo, F. and Samson, S.I., 2014. Annual public health and eco-nomic benefits of seasonal influenza vaccination: a European estimate. BMC public health, 14(1), p.813.31EuroMOMO (2018) Winter season 2016/17 mortality summary report from:the Euromomo network http://www.euromomo.eu/methods/pdf/winter_season_summary_2016_17.pdf32Cromer D, van Hoek AJ, Jit M, Edmunds WJ, Fleming D, Miller E. The burden of influenza in England by age and clinical risk group: a statisti-cal analysis to inform vaccine policy. J Infect. 2014;68(4):363-71. http://dx.doi.org/10.1016/j.jinf.2013.11.013 PMID:24291062 33ONS (2016) Home produced “adultcare” services: https://www.ons.gov.uk/economy/nationalaccounts/satelliteaccounts/compendium/house-holdsatelliteaccounts/2005to2014/chapter3homeproducedadultcareservices#gross-value-added-of-informal-adult-care 34This is the average amount a person aged 65+ will provide in their remaining lifetime. See ONS (2017), Unpaid carers provide social care worth £57 billion: https://www.ons.gov.uk/peoplepopulationandcommunity/healthandsocialcare/healthandlifeexpectancies/articles/unpaidcar-ersprovidesocialcareworth57billion/2017-07-10

I 17 I An economic analysis of flu vaccination
Chapter 4: Results
Averted flu casesThe primary aim of our model is to estimate the number of averted cases due to vaccination. The table below highlights the number of averted cases given the coverage rates, efficacy levels and incidence rates used in our different scenarios.
In scenario 1, our central estimate suggests over 180,000 averted cases. Since efficacy was zero among the over 65s, there are no directly averted cases among this group in the central scenario. At the upper bound, the number of averted cases rises to just over 385,000.
In scenario 2, better efficacy among older people results in over 100,000 averted cases in this risk group, although it remains at 0 for the lower bound estimate. Our central estimate shows that over 288,000 cases were averted because of vaccination.
Scenario 3 only includes one central estimate with higher efficacy and coverage, but shows almost 500,000 cases among older adults and children could be averted in ideal circumstances, and over 626,000 averted cases altogether.
Averted cases Scenario 1 Scenario 2 Scenario 3
65 + 0(0 – 147,388)
102,119(0 - 216,871)
245,647
Healthcare workers 9,244(4326 - 12,818)
12,591(7,786 – 15,846)
17,778
Pregnant women (risk) 592(277 – 822)
807(499 – 1,016)
1,227
Pregnant women (non-risk) 3,830(1,792 – 5,311)
5,216(3,226 – 6,565)
10,751
16-64-years 41,247(19,302 – 57,197)
56,181(34,745 – 70,709)
101,491
Children 127,824(58,861 – 161,626)
111,894(48,759 – 138,037)
249,913
Total 182,732(84,560 – 385,164)
288,811(95,017 – 449,048)
626,810
(Note: values in parenthesis represent the lower and upper bound estimates, based on efficacy rates. We do not include lower or upper bound estimates in scenario 3)
Averted deathsThe major human cost of influenza is death. Older people bear the brunt of the mortality risk, in part because of the additional complications influenza can cause among this risk group.
In scenario 1, only the upper bound estimate suggests that deaths were averted thanks to the flu vaccine amongst older people, again because of the low efficacy among older adults. At the upper bound, 5,678 lives were saved because of flu vaccination.
In scenario 2, we see the potential to save lives in the central estimate rises considerably. Over 4,000 lives were saved, and this rises to above 8,000 in our upper bound estimate. Again, over 65s make up the majority of lives saved because of flu vaccination.
In scenario 3, over 8,800 averted deaths among older adults, alongside 400 averted deaths of individuals of working age with underlying health conditions, and 118 children.

I 18 I An economic analysis of flu vaccination
Averted deaths Scenario 1 Scenario 2 Scenario 3
65 + 0(0 – 5,301)
3,672(0 – 7,800)
8,834
Healthcare workers 36(17 – 50)
49(30 – 62)
70
Pregnant women (risk) 2(1 – 3)
3(1 – 4)
4
Pregnant women (non-risk) 15(7 – 20)
20
(12 – 25)
42
16-64-years 162(76 – 225)
221
(137 – 279)
400
Children 60(27 – 76)
53(23 – 65)
118
Total 277(129 – 5,678)
4,021(205 – 8,237)
9,872
The cost of the vaccineTo estimate a cost-benefit analysis of vaccination, we must know the cost of delivering vaccination. For this, we refer to evidence from Atkins et al. (2018)35, who conducted an examination into the costs of vaccine provision by the NHS across GP practices and pharmacies in London. It was estimated in 2014-15 that the cost of a vaccine dose was £17.13 by GP delivery, and £14.78 if delivered through pharmacies.
As our data on vaccination coverage comes from GP practices, we use the former cost estimate. Although this data comes from a robust academic study, we must acknowledge that these costs are likely to be very sensitive to changes in supply and demand. Increasing vaccination coverage for example, may result in economies of scale which reduce the average cost per vaccine. Furthermore, the lower cost of delivery in non-GP settings implies that cost reductions are possible, which again will heavily influence the outcome of any cost-benefit analysis. Below outlines the total cost of vaccinating risk groups given current and ideal coverage rates.
Vaccination costs Current coverage 75% Coverage
65+ £122,430,638 £130,245,359
Healthcare workers £10,714,975 £12,715,556
Pregnant women – (risk) £687,230 £878,062
Pregnant women – (non-risk) £4,439,596 £7,689,832
16-64-years £47,810,662 £72,587,038
Children £17,422,558 £34,063,360
Total £203,505,661 £258,179,210
Cost-benefit analysis Scenario 1 represents an atypical year. The central estimate of efficacy among older adults in 2016/17 was effectively zero, yet coverage was high, meaning there was a large cost to providing a vaccine with no cost-benefits for this age group. However, at the upper bound estimate for efficacy, scenario 1 our model shows that benefits outweigh costs.
Scenario 2, where efficacy rates among older adults is higher, vaccination produces greater economic benefits, although again it is only at the upper bound were benefits outweigh costs within out model. Nevertheless, in the central estimate, over 4,000 lives were saved.35Atkins, K., van Hoek, A.J., Watson, C., Baguelin, M., Choga, L., Patel, A., Raj, T., Jit, M. and Griffiths, U., 2016. Seasonal influenza vaccination delivery through community pharmacists in England: evaluation of the London pilot. BMJ open, 6(2), p.e 009739.

I 19 I An economic analysis of flu vaccination
Scenario 3 shows an ideal, but plausible scenario where higher coverage rates and improved efficacy rates among all risk groups generate a significant surplus of over £80 million. While there remains a net cost of providing the vaccine to older adults, it is significantly lower than the other central estimates.
Net cost savings (vaccine costs – economic/societal benefits)
Scenario 1 Scenario 2 Scenario 3
65 + £-122,430,638
(£-122,430,638 - £-59,950,469)
£-79,140,807
(£-122,430,638 - £-30,495,532)
£-26,111,745
Healthcare workers £2,357,992(£-4,597,083- £7,413,302)
£7,091,308
(£297,229 - £111,695,862)
£12,427,510
Pregnant women (risk) £402,284
(£-177,358- £823,599)
£796,764
(£230,538- £1,180,509)
£1,378,026
Pregnant women (non-risk)
£2,598,810
(£-1,145,760- £5,320,559)
£5,147,199(£1,489,308 - £7,626,244)
£12,068,379
16-64-years £-7,778,814
(£-29,076,546 -£7,701,481)
£6,715,475
(£-14,089.253 – £20,815,363)
£25,913,775
Children £31,676,870
(£5,187,057 – £44,660,610)
£25,390,393
(£1,236,263 - £35,385,013)
£61,863,927
Total £-93,173,493
(£-152,240,331 - £5,969,084)
£-33,999,675
(£-133,266,553 – £46,207.424)
£87,539,872
Breakdown of cost savings due to vaccinationBreaking down the cost savings into individual areas, we can identify where the greatest savings are made.
Across all scenarios, wider societal costs associated with premature death represents the biggest economic benefits to vaccination. Even when efficacy among older adults is negligible in scenario 1, over £89 million can be saved in human capital costs, in the central estimate. In scenario 3, the human capital costs averted through vaccination amount to over £250 million, emphasizing the significance of achieving both higher efficacy rates and higher coverage rates for wider economic productivity.
Averted sick day costs, which are only associated with those of working age, are significant. In all three scenarios, the central estimate shows averted costs upwards of £10 million. This reaches as high as £28 million in scenario 3, which represents a large boon for economic production in England.
The averted hospitalisation costs (central estimate) of scenario 1 is just under £2 million but the difference between the lower and upper bounds of vaccination efficacy are enormous (upwards of £25 million saved at the upper bound for scenario 1). This is because the majority of hospitalisation costs are a result of older adults with influenza where the efficacy range was highest. In addition to the monetary costs saved, there will also be additional resources, such as hospital beds and medical care that could be diverted to other areas should hospitalisations be reduced.
The cost savings from GP consultation are also extremely sensitive to underlying efficacy assumptions, although overall, the cost savings from averting GP consultations represent the smallest proportion of the total averted costs.
I 20 I An economic analysis of flu vaccination
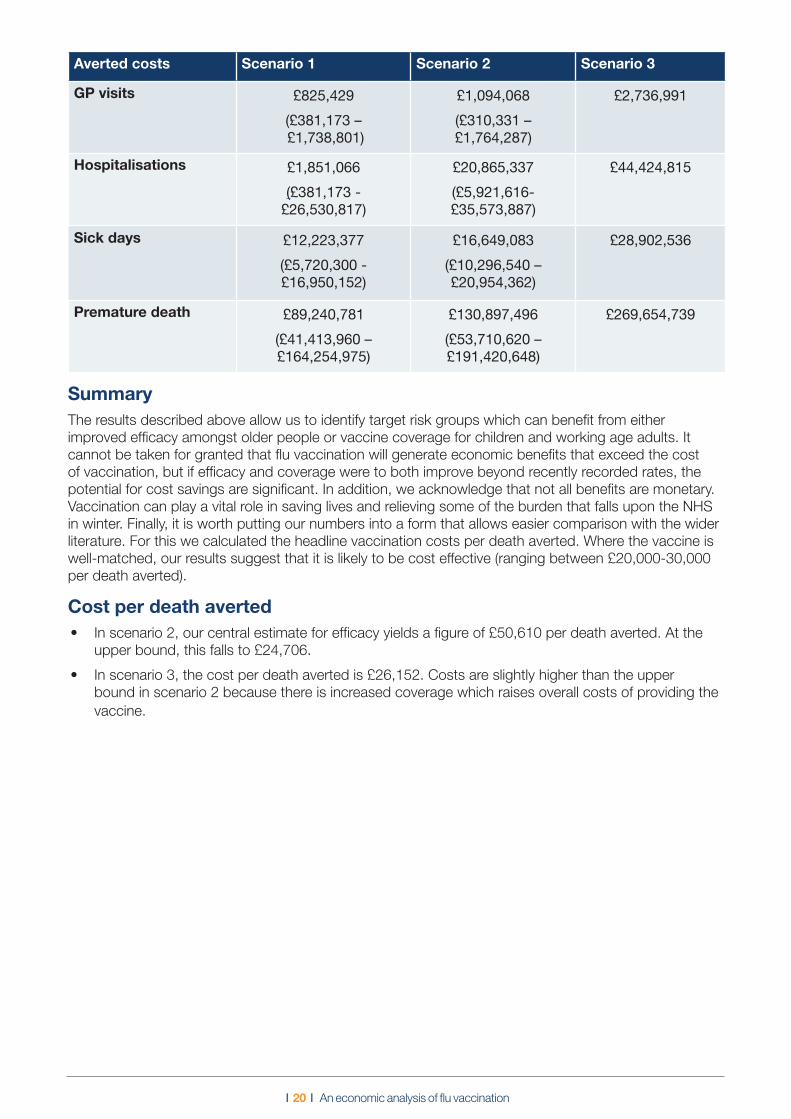
Averted costs Scenario 1 Scenario 2 Scenario 3
GP visits £825,429(£381,173 – £1,738,801)
£1,094,068(£310,331 – £1,764,287)
£2,736,991
Hospitalisations £1,851,066(£381,173 -
£26,530,817)
£20,865,337(£5,921,616- £35,573,887)
£44,424,815
Sick days £12,223,377(£5,720,300 - £16,950,152)
£16,649,083(£10,296,540 – £20,954,362)
£28,902,536
Premature death £89,240,781(£41,413,960 – £164,254,975)
£130,897,496(£53,710,620 – £191,420,648)
£269,654,739
SummaryThe results described above allow us to identify target risk groups which can benefit from either improved efficacy amongst older people or vaccine coverage for children and working age adults. It cannot be taken for granted that flu vaccination will generate economic benefits that exceed the cost of vaccination, but if efficacy and coverage were to both improve beyond recently recorded rates, the potential for cost savings are significant. In addition, we acknowledge that not all benefits are monetary. Vaccination can play a vital role in saving lives and relieving some of the burden that falls upon the NHS in winter. Finally, it is worth putting our numbers into a form that allows easier comparison with the wider literature. For this we calculated the headline vaccination costs per death averted. Where the vaccine is well-matched, our results suggest that it is likely to be cost effective (ranging between £20,000-30,000 per death averted).
Cost per death averted• In scenario 2, our central estimate for efficacy yields a figure of £50,610 per death averted. At the
upper bound, this falls to £24,706.
• In scenario 3, the cost per death averted is £26,152. Costs are slightly higher than the upper bound in scenario 2 because there is increased coverage which raises overall costs of providing the vaccine.

I 21 I An economic analysis of flu vaccination
Conclusion
This report has outlined the findings from our economic model of flu vaccination cost-benefit analysis. It is worth stressing that we have taken a conservative approach to modelling the cost savings from vaccination by applying a static model to the data. The model accounts for a range of direct and wider societal cost savings while allowing for the simple exploration of different efficacy and vaccination coverage scenarios. The model may therefore underestimate the overall cost savings, but it powerfully demonstrates the economic and wider societal impact of different efficacy and vaccination coverage scenarios.
There are clear limitations in any attempt to measure the cost savings from flu vaccination. In particular, there are significant data challenges at each stage with the most problematic being the level of efficacy itself. It is worth reiterating that we have poor evidence on vaccination efficacy among people who are most at risk of complications if they become infected with the flu. This is particularly the case with regard to older people. There are also challenges associated with data on the number of flu GP visits, hospitalisations and mortality. Death due to influenza is rarely recorded on a death certificate even though it may have been a contributing factor. A hospital episode due to pneumonia may have been triggered by flu but it will not be coded in this way in hospital statistics. All of these limitations mean that the outputs of any cost-benefit analysis (or cost effectiveness study) of flu vaccination must be handled with care. What ultimately matters, is less the results of our cost-benefit analysis and more the insights it provides into ways to improve the overall efficiency of vaccine delivery. In this regard, the model helps to underline four key conclusions:
• Public policy should focus on increasing coverage rates among young people (0-15) where efficacy and incidence is higher. While we do not model herd effects, taking a more conservative approach, this would seem to be the most efficient approach to improving overall benefits, relative to costs. We note that the Government has been incrementally introducing a childhood flu vaccine programme which will ultimately target all children between 2-11 years of age36.
• The efficacy of the vaccine among the over 65s is a significant issue. High levels of demand for the vaccine amongst this age group combined with recent low efficacy rates means that the costs of delivering the vaccine outweigh the benefits in our model. More research and innovation is needed to specifically explore vaccination efficacy for this age group.
• Overall the cost-benefit analysis is also highly sensitive to vaccine administration costs. If the health service can take advantage of economies of scale to reduce the unit cost for delivering the vaccine (critically without it affecting the efficacy), this would also support improving the potential benefits, relative to the costs. We note that the costs of delivering a vaccine through a pharmacy is £2 cheaper than through a GP – this suggests there may be opportunities to find further reductions in the cost of delivery.
• The wider societal costs of premature death from flu, such as lost years of work and care, account for the largest component of total costs. Any consideration of the benefits of preventative approaches should factor these costs in. This point does not just relate to public policy, but also to employers who might be considering offering vaccinations to their workforce.
Possible extensionsWhile this report has focused on the effects of different efficacy and vaccination coverage rates, the model also allows us to explore the cost-benefit of vaccination under different scenarios for incidence and the unit cost of delivering the vaccine. Possible extensions might include exploring possible cost savings in a pandemic where incidence is significantly higher, or in a situation where unit costs are lowered through innovation or economies of scale.
36See for instance: Paul Cosford (2018) Flu and flu vaccines: Expert interview, Public Health England: https://publichealthmatters.blog.gov.uk/2018/01/11/flu-and-flu-vaccines-expert-interview/

ILC–UK11 Tufton StreetLondonSW1P 3QBTel : +44 (0) 20 7340 0440www.ilcuk.org.uk
Published in July 2018 © ILC-UK 2018Registered Charity Number: 1080496.