an ebiquity company how to use the new power point template steps for creating a better presentation
TRANSCRIPT

an Ebiquity company
How to use the new Power Point templateSteps for creating a better presentation

2
Colours to clearly define sections of a presentationColours
• Colours are provided to split lengthy presentations into sections (pitch and audit presentations, advertising intelligence reports, company overviews etc.)
• Not all presentations will require sections - if this is the case, please use the base Navy template.
• Colours do not represent certain parts of the business. The deck has been created to suit all styles of presentation under the new Ebiquity brand. Colours can represent any topic and should be used to show the start of, and contents of a new section.
Navy Blush Lime Sky
Rose Plum Pea Sea

3
Each new section should follow a title slide when not using the base templateTitle slides
Always use the lineThe line is not part
of the template and should be resized to
sit flush with the longest line of copy

4
How to add and slide and change logo colourAdding a new slide in Power Point 2003
1. Right click on the slide you want the new slide to follow.
2. Insert new slide (a new slide will appear) or shortcut ‘Ctrl M’
3. Once the slide is inserted it will have the navy base logo (right hand side)
4. To change this, right click, select slide design and on the right hand viewing window you will see slides matching the different section colours.
5. Right click on the colour of your choice, then click:
Apply to selected slides
This changes only the slide you’ve selected. You can change the whole presentation by clicking ‘Apply to all slides’

5
New slides and changing colours
Adding a new slide in Power Point 2007
1. Right click on the slide you want the new slide to follow
2. Insert new slide or shortcut ‘Ctrl M’ (a new slide will appear)
3. Once the slide is inserted it will have the navy base logo (right hand side)
4. To change this, right click, select layout and you will see the full list of layouts and different logo colours
5. Pick your colour and template

6
White space is IMPORTANT. Do not use the full width of the slide. Spacing in PowerPoint
300px300px
300px
300px
Always leave 300px around a chart, image or graph as shown.

7
Exclamation Images are available for highlighting and making additional commentsEmphasis
• Copy and paste these images into a slide to make additional observation, high-light a key point or summarise a chart or graph.
• Always use the exclamation mark that matches the colour of your slide.
HighlightAn example of how to highlight a key point.

8
How the rack will look with new brandingExample rack
-8.6
10.5 point stretch
-8
87.7
11.3 point stretch
LOWER QUALITY HIGHER QUALITY
LOWER COST NORM HIGHER COST
NORM
76 78 80 82 83 84 85 86 88 90 92 94 96-5 -3 -2 -1 0 +1 +3 +4 +7 +9-9
LOWER QUALITY
LOWER COST HIGHER COST
HIGHER QUALITYNORM
NORM
The above can be copied and pasted into new presentations if required.
86.6
-8.9

9
A template for building charts, tables and graphsImporting charts from Excel
For 2003 and 2007 PowerPoint users, colour palettes have been added into a central Excel file for users who build charts in Excel and import them into Power Point.
•Excel templates are downloadable from
\\thomson-intermedia.net\Share\Company Share\Templates\Ebiquity rebrand
I.T have made the X drive available when you open a new document for ease of use.
Use the colour guide to add colours that will visually match the slide templates and follow the guidelines provided.
10
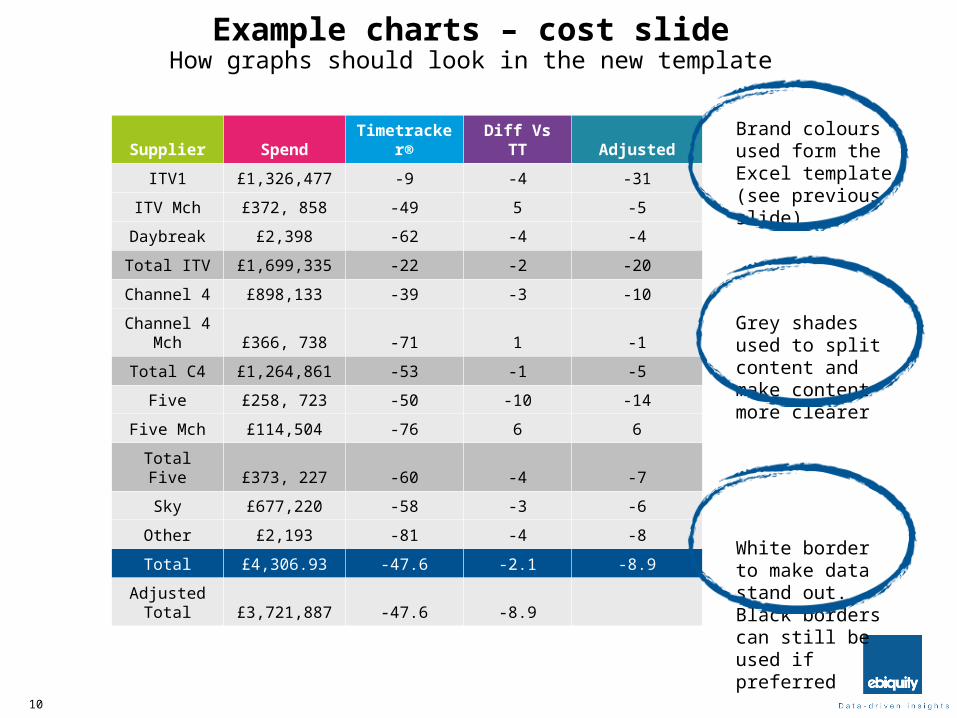
How graphs should look in the new templateExample charts – cost slide
Brand colours used form the Excel template (see previous slide)
Grey shades used to split content and make content more clearer
White border to make data stand out. Black borders can still be used if preferred
Supplier Spend Timetracker® Diff Vs TT Adjusted
ITV1 £1,326,477 -9 -4 -31
ITV Mch £372, 858 -49 5 -5
Daybreak £2,398 -62 -4 -4
Total ITV £1,699,335 -22 -2 -20
Channel 4 £898,133 -39 -3 -10
Channel 4 Mch £366, 738 -71 1 -1
Total C4 £1,264,861 -53 -1 -5
Five £258, 723 -50 -10 -14
Five Mch £114,504 -76 6 6
Total Five £373, 227 -60 -4 -7
Sky £677,220 -58 -3 -6
Other £2,193 -81 -4 -8
Total £4,306.93 -47.6 -2.1 -8.9
Adjusted Total £3,721,887 -47.6 -8.9
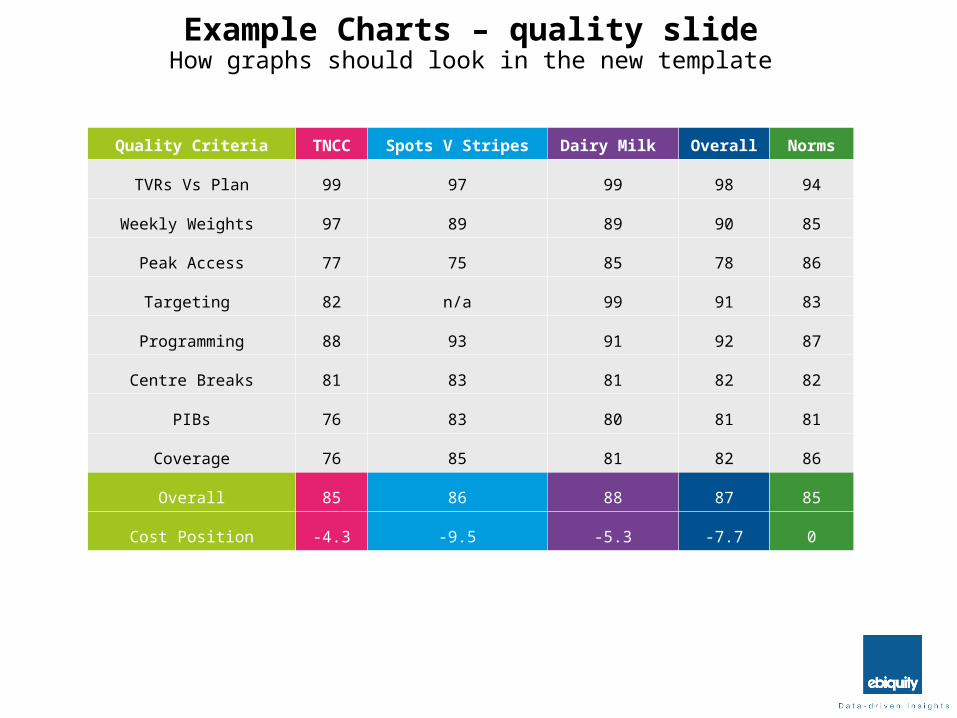
Example Charts – quality slideHow graphs should look in the new template
Quality Criteria TNCC Spots V Stripes Dairy Milk Overall Norms
TVRs Vs Plan 99 97 99 98 94
Weekly Weights 97 89 89 90 85
Peak Access 77 75 85 78 86
Targeting 82 n/a 99 91 83
Programming 88 93 91 92 87
Centre Breaks 81 83 81 82 82
PIBs 76 83 80 81 81
Coverage 76 85 81 82 86
Overall 85 86 88 87 85
Cost Position -4.3 -9.5 -5.3 -7.7 0

12
3 ways to ensure data is removed…Data Protection
1. Automatically compress the PowerPoint document, converting the Charts into Pictures. The method for doing this differs dependent on which version of Office you have:
a) If you have Office 2003 please compress your documents by sending them to the Office File Compression e-mail address, [email protected] where it will be automatically compressed.
b) If you have Office 2007 please compress your documents by raising a Service Desk Request. Please include a link to the documents you need compressed in your e-mail to the Service Desk e-mail address, [email protected], and they will compress it for you and then send you back a link to the compressed versions of the documents. Please do not send the actual documents that need to be compressed to the Service Desk e-mail address.
2. Converting the document to a PDF using the CutePDF Writer which should be available in your printer options. If it is not available then please raise a Service Desk Request so that they can install if for you.
3. Convert each individual image from a chart into a picture, either by: Copy, Paste Special (selecting “Enhanced Metafile”) Right click on the chart, Save as Picture and then insert the picture to replace your chart.
PowerPoint presentations should never be sent to clients with data embedded or attached!

an Ebiquity company
Head OfficeThe Registry, Royal Mint Court
LONDON, EC3N 4QNtel. +44 (0) 20 7650 9600 fax. +44 (0) 20 7650 9650 web. ebiquity.com twitter. Twitter.com/ebiquityglobal blog. Ebiquity.com/opinion
You may wish to change contact details to reflect your local office addresses, phone number and website