an early evaluation of italian high speed projects -...
TRANSCRIPT

15
Ricerche
TeMA
03.11
TeMA Vol 4 No 3 settembre 2011
Paolo Beria, Raffaele GrimaldiDiAP – Politecnico di Milano, Via Bonardi 3, 20133, Milano - Italiae-mail: [email protected]
L’Italia ha affrontato, negli ultimi 15 anni, un eccezionale sforzofinanziario per costruire circa 1 000 km di linee ferroviarie ad altavelocità. Ulteriori estensioni sono attualmente in costruzione o sonostate pianificate, in particolare sulle principali relazioni internaziona-li. Questa rete è comunemente considerata fondamentale nella vi-sione europea di un sistema di trasporto continentale.Questo articolo analizza il passato ed il futuro di questa rete, laddovepossibile da un punto di vista quantitativo. La prima parte dell’arti-colo ripercorre la storia del progetto Alta Velocità, soffermandosi inparticolare sulle questioni relative alla regolazione degli investimen-ti ed alle vicende finanziarie nelle prime fasi ed alle questioni attualirelative alla regolazione dei servizi ferroviari.Nella seconda parte l’analisi dell’offerta, dei guadagni di tempopermessi, della domanda e dei costi permette di sviluppare unavalutazione ex post – semplificata ma indipendente - dei progettirealizzati, sottolineandone i successi e le potenzialità ancorainespresse, ma anche le significative criticità.L’ultima parte dell’articolo analizza i piani di espansione futura, con-frontando i costi, la domanda esistente e quella attesa. Tale analisipermette di derivare alcune indicazioni di politica dei trasporti estrategie di riduzione dei costi, al fine di controllare la spesa pubbli-ca in un periodo di crisi, senza abbandonare l’idea di una reteferroviaria moderna ed efficace.
Italy has undergone, in the last 15 years, an exceptional publicfinancial effort to build approximately 1,000 km of high speed raillines. Further extensions are under construction or planned,especially in the most important international relations. This networkis widely considered as fundamental to comply the European visionof a continental-wide transport system.The paper analyses the past and the future of such network, wherepossible from a quantitative point of view. The first part of thearticle reviews the history of the Alta Velocità scheme, particularlyfocusing on the issues related to the economic regulation of theinvestments and the financial troubles at first and then on thepresent issues related to the regulation of rail services.The analysis of the supply, the time gains, the demand and thecosts allows to build a simple but independent evaluation of thepast projects from an ex-post perspective, pointing out thesuccesses, but also important critical issues.The second part of the paper analyses the future expansion planslooking at the costs, the existing and expected demand and derivessome policy indications and cost reduction strategies capable bothto control public expenditure in a period of crisis and not to abandonthe idea of a modern and effective rail network.
JEL classification: D61, L92, R42.Keywords: railways, high speed train, TAV, Italy, cost benefitanalysis, ex-post, evaluation, assessment, demand.
Introduction: the Italian High Speed project
History of projects
The Italian High Speed Railway (in Italian “Alta Velocità”)was conceived in 1990 as a new system, substantiallyindependent from the rest of the network, to provide fastlinks among the cities of Turin, Milan, Bologna, Florence,Rome and Naples (RFI 2007), along the “backbone” line ofthe country. Soon, the former model inspired to the wellknown French system, turned into something different,namely a new high performance doubling of the existingnetwork, but completely integrated with it trough numerousinterconnections and despite the different voltage. In 1996,according to this new vision, the name of the plannedsystem was changed into AV/AC (acronym of High Speed/High Capacity, in Italian “Alta Velocità/Alta Capacità”). Itconceived the new lines as high capacity fast doublings,capable to host heavy freight trains thanks to low slopes,together with high speed passengers trains. This radicalchange was official ly inspired by environmentaliststakeholders, aiming at making the rail mode attractive alsoto freight, thanks to higher speed and performance, andthus helping modal shift.Works of the first phase lasted more than a decade andwere recently completed in the main parts. To date, theItalian high speed network is made of the sections listed inTable 1 and represented in Figure 1. The full Turin – Salernoaxis, excluding only Florence and Bologna urban sections,has been completed on December 2009.Table 1 clearly points out one of the main differences inthe current network, homogeneous only in appearance.The Florence – Rome line is much older and was essentiallya fast doubling of a conventional line, still using the normalItalian voltage of 3kV DC. The rest of the line Turin – Naplesis the core of the project conceived in the Nineties and
Trimestrale del LaboratorioTerritorio Mobilità e Ambiente - TeMALab
http://www.tema.unina.itISSN 1970-9870Vol 4 - No 3 - settembre 2011 - pagg. 15-28
Dipartimento di Pianificazione e Scienza del TerritorioUniversità degli Studi di Napoli Federico II
© Copyright dell’autore
An Early Evaluationof Italian High Speed Projects
Una prima valutazionedell’Alta Velocità in Italia

16
Ricerche
TeMA
03.11
TeMA Vol 4 No 3 settembre 2011
adopts the French standards of 25kV AC. It requires specifichigh speed rolling stock. The two end sections of the Milan– Venice line, not yet existing as a whole, adopt the same3 kV DC standard and must be seen again as a fast doublingdue to capacity reasons, not usedby high speed trains only. Finally, theVerona – Bologna line must bementioned. It was doubled andupgraded in the same period andopened in 2009 as an high perfor-mance traditional l ine and iscurrently used by the High Speedservices to Rome by multi-power fasttrains.Currently, high speed programmescount numerous new lines to bebuilt (see Figure 1). The main onewill connect Milan to Venice, linkingnumerous mid-sized cities at shortdistance. Other lines will connectMilan to Genoa, Naples to Bari andNaples to southern regions.However, the largest and mostexpensive projects underway aim atconnecting Italy to neighbourcountries trough the Alps: the Frejusline (Turin – Lyon), the Brenner line(Verona – Munich), the Trieste –Divaca line. Not all the mentionedprojects are already fully defined andfinanced.In the period between the firstprojects and now, the functionalmodel changed again. While all newlines, except the Brenner, wereoriginally presented as High Speed
Italian high speed network operating sections (June 2011) (Table 1).
lines, the lack of significant passenger traffic turned themto high capacity lines, supposed to host both heavy freighttrains and fast passengers trains. This is particularly true forthe expensive Alpine crossings. Finally, during 2011, the
High speed infrastructure in Italy (June 2009, source RFI website www.rfi.it.)(Figure 1).

17
Ricerche
TeMA
03.11
TeMA Vol 4 No 3 settembre 2011
scarcity of public funds suggested a new wave of designcharacteristics, defined by policy makers as “frugaleinfrastructures”1. In this case the lacking lines, with scarcetraffic compared to the capacity of a full new line, shouldbe built progressively and preferring selective doublings ortechnological upgrades (ResPublica 2010).Shifting from infrastructures to passenger services, since2009 a new commercial product has been introduced bythe monopolist Trenitalia, named “le Frecce” (“the Arrows”).In the following years the network has been widened andfine-tuned. Currently, Frecciarossa is the brand for full highspeed products using the Turin – Naples line; Frecciargentothe one for other high speed services linking Rome withthe other important cities and only partially using the HSnetwork (Bolzano, Verona, Venice, Udine, Bari, ReggioCalabria); Frecciabianca the one for the other top-gradeservices not using the high speed lines, because not existingyet (mainly Turin – Milan – Venice, Genova – Rome andMilan – Bari) or because of different commercial choices.Not yet operative, a private newcomer – NTV – is expectedto offer services in open access regime since 2012 on themain line Turin – Milan – Rome – Naples.
The governance and the regulatory context of Italianrailways
Italian railways apply the European directives concerningunbundling of network and services. Both the service branchTrenitalia and the infrastructure branch RFI are owned bythe same public holding, Ferrovie dello Stato2.Looking at the network, it remains an unregulated legalmonopoly, as the whole national network, including thenew High Speed lines, has been directly franchised (thatis, without competitive tendering) as a legal monopoly toRFI – Rete Ferroviaria Italiana, the network manager of theState-owned holding FS3, for 60 years since 2001. Suchnatural monopoly is not subject to any regulatory mechanismconcerning efficiency: the subsidies and the investmentsare ruled by a Programme Contract; tolls are decided bythe Ministry of Transport, but using only the relevantinformation and the costs of RFI itself.Looking at passengers services, Trenitalia remains by farthe dominant operator. In 2003 Italy implemented theEuropean Directives on rail competition (2001/12/CE, 2001/13/CE and 2001/14/CE) into the Decreto Legislativo n. 188
High speed (Frecciarossa, on the left) and medium-high speed (Frecciargento, on the right) services in Italy (source: FS2010) (Figure 2).

18
Ricerche
TeMA
03.11
TeMA Vol 4 No 3 settembre 2011
of 8 July 2003. It states that long distance passengerservices ought to be opened to competition in the market.As a result, two newcomers (Arenaways and NTV) rose tocompete with Trenitalia. The first started operating on theMilan Turin, but already closed due to normative barriersimposed. The latter is expected to start on high speedservices. A regulatory body for services only has beencreated recently (2009) inside the Ministry of Transport,with the name of Ufficio per la regolazione dei servizi ferro-viari (URSF).The relative openness of the 2003 decree (in particular,the easiness to obtain the licence and the slots. Beria et al.2010) is perceived as a threat by the incumbent that actuallysucceeded in partially blocking the competition by meansof rising more restrictive entrance barriers or by the increasein the costs of the network. In particular, the 2012 FinancialLaw4 requires high speed users, including the newcomers,to pay an extra train access charge to cross finance socialservices.
The regulation of investments
In the initial intentions of the Nineties, the new HS lineshould have been built through Project Financing by a newmixed society, called TAV SpA, with a 60% of private capitalto be completely repaid. However in 1998 the State hadalready to buy back the whole shares of TAV, due to theunavailability of private shareholders to provide entitledcapitals (RFI 2007). The process of re-nationalisation of TAVSpA lasted from 2000 to 2007 and ended with the coverageof 13 billion Euros of debt by the State balance (Beria andPonti 2009). Today TAV SpA is no more operative as aproject financing subject.In the meantime, the costs of the Turin – Salerno axis rosefrom expected 10.7 billion € in 1992 to actual 32.0 billion €in 2006, meaning a doubling of costs in real terms (RFI2007)5. Moreover the lines cost reached, on average, 32M€/km, compared to 10 M€/km in France and 9 M€/km inSpain. This extraordinarily high costs have been analysed ina public consultation to the Parliament by RFI in 2007 (andreported by the Corte dei Conti 2009, pag. 19). Theypointed out the following causes of extra-costs:– Direct award to General Contractors (4.0-6.0 M€/km);– Project specificities due to orography and seismic of
Italian land (6.7-7.0 M€/km);– Environmental and landscape compatibility (5.0-6.0 M€/
km);– Land use issues and urbanisation (1.5-2.0 M€/km);– Technology innovation and newer safety rules (1.5-2.0
M€/km).While the latter issues cannot be commented withoutentering into the details of the design choices, the firstone – the direct awarding to General Contractor – reveals
a severe governance process that could have been avoidedand that makes the Italian case different to any otherexample in Europe.According to the CEO of Ferrovie dello Stato, in fact, thechoice to award the construction of an entire line withouta competitive tendering process to select the bestcontractor, caused an extra-cost of 14 to 20%, quantifiedin 4 to 6 millions Euro per km of line. Moreover, a problemof overdesign seems to exist and also the cost ofcompensations rose significantly to gain the acceptance oflocal authorities to new lines.Eventually, the totality of costs associated to the HighSpeed project up to now have been totally paid by thestate budget as capital expenditure. Moreover, such efforthas been done on the basis of extremely weak evaluationsand without public and detailed estimations of expecteddemand. In the following we will try an independentassessment of the results.
Ex-post analysis of the existing Turin – Salerno line
In this section we carry out an early ex-post evaluation ofthe existing high speed network in Italy, one year and ahalf after the full start of the new services on December2009, progressively activated since 2006. We evaluate thesections of the line through a standard and simplified cost-benefit benchmark, as suggested by de Rus and Nombela(2007) and de Rus and Nash (2007), presented in thefollowing.As studies on traffic elasticity suggest (for example, Litman2010), demand usually needs at least five years in order tofully respond to reductions in travel t ime. So, acomprehensive and robust enough ex-post evaluationshould be done only after such a time. However, the numberof frequencies supplied on the lines looks now quite stableafter the first years of operations and we think that it isalready possible to draw some early considerations and tolearn some lessons, in order to improve the planning ofnew lines.
A review of the (few) data available
Only a few data are nowadays available on High Speeddemand in Italy. This fact is understandable from theviewpoint of the railway undertaking Trenitalia, this being acommercially sensitive information and considering that newoperators are willing to enter the market in the near futu-re. However, it seems that more transparency from thepublic side on the basic data and outcomes of one of thelargest public works undertaken in the last decade, wouldbenefit the public debate especially about planning newlines. To make a comparison, full data on air routes
19
Ricerche
TeMA
03.11
TeMA Vol 4 No 3 settembre 2011
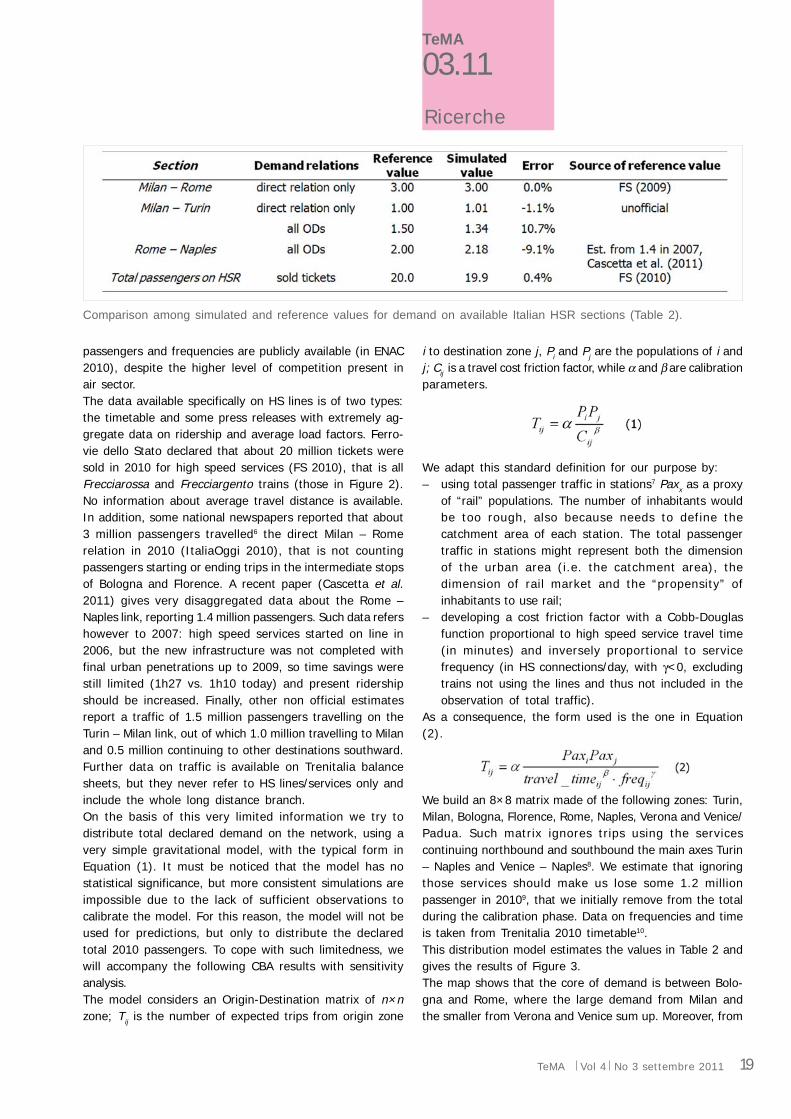
passengers and frequencies are publicly available (in ENAC2010), despite the higher level of competition present inair sector.The data available specifically on HS lines is of two types:the timetable and some press releases with extremely ag-gregate data on ridership and average load factors. Ferro-vie dello Stato declared that about 20 million tickets weresold in 2010 for high speed services (FS 2010), that is allFrecciarossa and Frecciargento trains (those in Figure 2).No information about average travel distance is available.In addition, some national newspapers reported that about3 million passengers travelled6 the direct Milan – Romerelation in 2010 (ItaliaOggi 2010), that is not countingpassengers starting or ending trips in the intermediate stopsof Bologna and Florence. A recent paper (Cascetta et al.2011) gives very disaggregated data about the Rome –Naples link, reporting 1.4 million passengers. Such data refershowever to 2007: high speed services started on line in2006, but the new infrastructure was not completed withfinal urban penetrations up to 2009, so time savings werestill limited (1h27 vs. 1h10 today) and present ridershipshould be increased. Finally, other non official estimatesreport a traffic of 1.5 million passengers travelling on theTurin – Milan link, out of which 1.0 million travelling to Milanand 0.5 million continuing to other destinations southward.Further data on traffic is available on Trenitalia balancesheets, but they never refer to HS lines/services only andinclude the whole long distance branch.On the basis of this very limited information we try todistribute total declared demand on the network, using avery simple gravitational model, with the typical form inEquation (1). It must be noticed that the model has nostatistical significance, but more consistent simulations areimpossible due to the lack of sufficient observations tocalibrate the model. For this reason, the model will not beused for predictions, but only to distribute the declaredtotal 2010 passengers. To cope with such limitedness, wewill accompany the following CBA results with sensitivityanalysis.The model considers an Origin-Destination matrix of n×nzone; Tij is the number of expected trips from origin zone
i to destination zone j, Pi and Pj are the populations of i andj; Cij is a travel cost friction factor, while α and β are calibrationparameters.
We adapt this standard definition for our purpose by:– using total passenger traffic in stations7 Paxx as a proxy
of “rail” populations. The number of inhabitants wouldbe too rough, also because needs to define thecatchment area of each station. The total passengertraffic in stations might represent both the dimensionof the urban area (i.e. the catchment area), thedimension of rail market and the “propensity” ofinhabitants to use rail;
– developing a cost friction factor with a Cobb-Douglasfunction proportional to high speed service travel time(in minutes) and inversely proportional to servicefrequency (in HS connections/day, with γ<0, excludingtrains not using the lines and thus not included in theobservation of total traffic).
As a consequence, the form used is the one in Equation(2).
We build an 8×8 matrix made of the following zones: Turin,Milan, Bologna, Florence, Rome, Naples, Verona and Venice/Padua. Such matrix ignores trips using the servicescontinuing northbound and southbound the main axes Turin– Naples and Venice – Naples8. We estimate that ignoringthose services should make us lose some 1.2 millionpassenger in 20109, that we initially remove from the totalduring the calibration phase. Data on frequencies and timeis taken from Trenitalia 2010 timetable10.This distribution model estimates the values in Table 2 andgives the results of Figure 3.The map shows that the core of demand is between Bolo-gna and Rome, where the large demand from Milan andthe smaller from Verona and Venice sum up. Moreover, from
Comparison among simulated and reference values for demand on available Italian HSR sections (Table 2).
20
Ricerche
TeMA
03.11
TeMA Vol 4 No 3 settembre 2011
Bologna to Florence nearly all links are classified as HS andjust a handful of regional connections still exist. To thecontrary, Turin – Milan and Rome – Naples have a very limiteddemand because of competition from car, but also fromregional trains. In conclusion, only the line Milan – Romehas a significant demand, while the rest is scarcely used,even when a new line exist (Turin and Naples).
A stylised Cost Benefit Analysis to assess the socio-economiceffects
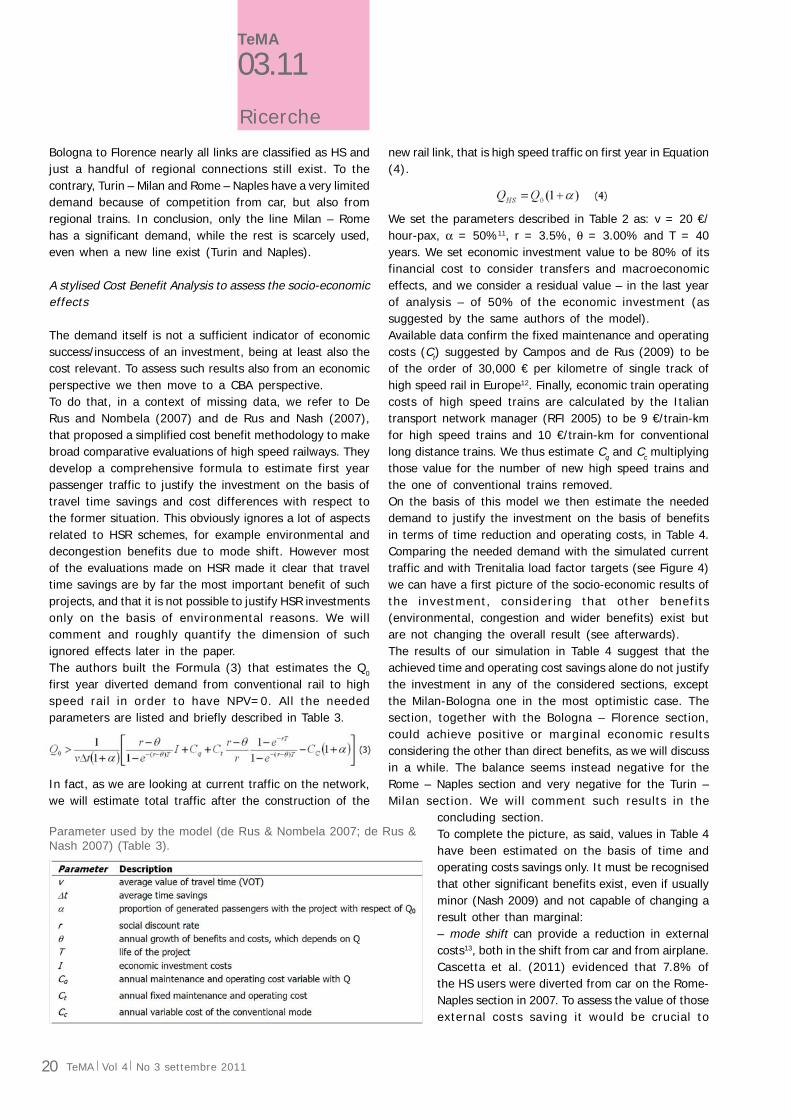
The demand itself is not a sufficient indicator of economicsuccess/insuccess of an investment, being at least also thecost relevant. To assess such results also from an economicperspective we then move to a CBA perspective.To do that, in a context of missing data, we refer to DeRus and Nombela (2007) and de Rus and Nash (2007),that proposed a simplified cost benefit methodology to makebroad comparative evaluations of high speed railways. Theydevelop a comprehensive formula to estimate first yearpassenger traffic to justify the investment on the basis oftravel time savings and cost differences with respect tothe former situation. This obviously ignores a lot of aspectsrelated to HSR schemes, for example environmental anddecongestion benefits due to mode shift. However mostof the evaluations made on HSR made it clear that traveltime savings are by far the most important benefit of suchprojects, and that it is not possible to justify HSR investmentsonly on the basis of environmental reasons. We willcomment and roughly quantify the dimension of suchignored effects later in the paper.The authors built the Formula (3) that estimates the Q0
first year diverted demand from conventional rail to highspeed rail in order to have NPV=0. All the neededparameters are listed and briefly described in Table 3.
In fact, as we are looking at current traffic on the network,we will estimate total traffic after the construction of the
Parameter used by the model (de Rus & Nombela 2007; de Rus &Nash 2007) (Table 3).
new rail link, that is high speed traffic on first year in Equation(4).
We set the parameters described in Table 2 as: v = 20 €/hour-pax, α = 50%11, r = 3.5%, θ = 3.00% and T = 40years. We set economic investment value to be 80% of itsfinancial cost to consider transfers and macroeconomiceffects, and we consider a residual value – in the last yearof analysis – of 50% of the economic investment (assuggested by the same authors of the model).Available data confirm the fixed maintenance and operatingcosts (Ct) suggested by Campos and de Rus (2009) to beof the order of 30,000 € per kilometre of single track ofhigh speed rail in Europe12. Finally, economic train operatingcosts of high speed trains are calculated by the Italiantransport network manager (RFI 2005) to be 9 €/train-kmfor high speed trains and 10 €/train-km for conventionallong distance trains. We thus estimate Cq and Cc multiplyingthose value for the number of new high speed trains andthe one of conventional trains removed.On the basis of this model we then estimate the neededdemand to justify the investment on the basis of benefitsin terms of time reduction and operating costs, in Table 4.Comparing the needed demand with the simulated currenttraffic and with Trenitalia load factor targets (see Figure 4)we can have a first picture of the socio-economic results ofthe investment, considering that other benefits(environmental, congestion and wider benefits) exist butare not changing the overall result (see afterwards).The results of our simulation in Table 4 suggest that theachieved time and operating cost savings alone do not justifythe investment in any of the considered sections, exceptthe Milan-Bologna one in the most optimistic case. Thesection, together with the Bologna – Florence section,could achieve positive or marginal economic resultsconsidering the other than direct benefits, as we will discussin a while. The balance seems instead negative for theRome – Naples section and very negative for the Turin –Milan section. We will comment such results in the
concluding section.To complete the picture, as said, values in Table 4have been estimated on the basis of time andoperating costs savings only. It must be recognisedthat other significant benefits exist, even if usuallyminor (Nash 2009) and not capable of changing aresult other than marginal:– mode shift can provide a reduction in externalcosts13, both in the shift from car and from airplane.Cascetta et al. (2011) evidenced that 7.8% ofthe HS users were diverted from car on the Rome-Naples section in 2007. To assess the value of thoseexternal costs saving it would be crucial to

21
Ricerche
TeMA
03.11
TeMA Vol 4 No 3 settembre 2011
Representation of estimated traffic on high speed services “Frecciarossa”and “Frecciargento” in Italy 2010. Small points represent stops of“Frecciargento” services outside the High Speed network, that have not beenmodelled as single destinations. Source: our elaboration on WikimediaCommons map (Figure 3).
Comparison among simulated demand and estimated demand needed to justify the investment, per section (Table 4).
understand which part of those divertedusers used to travel during peak hours,when the non internalised part of externalcosts is significant due to congestion (Nash2009). Assuming the Rome – Naples as abenchmarking, the amount of demandshifted from car for all pairs (especially thelonger) is however irrelevant compared tothe overall highway traffic: no more than2,000 cars/day on the most crowdedsection. Data on air traffic shows adecrease of 1.3 million passengers a year(i.e., 647 million passenger-km. Ourelaborations on ENAC 2007 and 2010) oncity pairs linked to HSR, with respect tothe national trend (that showed a +5.31%increase 2007-2010). Considering 1.1€cent/pax-km (Nash 2009) of noninternalised external cost by plane, itmeans a benefit of 7 M€ per year, i.e. 214M€ of total actualised14 benefit. If wecompare this indicative value with the totaleconomic cost of the HSR of 17,700 M€,plus the external costs of high speed trainoperations and of the construction of thenew lines, we understand that the benefitdue to air pollution reduction is notsignificant.– the shift of high speed trains to thenew line releases new capacity for freightand regional trains on the existing lines. Ifthose were close to saturation, this couldbe a benefit. According to the last Italiantransport plan (MTN 2001), in the late

22
Ricerche
TeMA
03.11
TeMA Vol 4 No 3 settembre 2011
Grafical comparison among simulated demand, 2010 demand according to Trenitaliatargets (Trenitalia 2007) and estimated demand needed to justify the investment, persection (Figure 4).
Comparison of high speed services supplied by Trenitalia (“Frecciarossa” and“Frecciargento”) in 2010 and 2011 (Table 5).
Nineties the Milan – Bologna line was close to saturationbetween Piacenza and Bologna; also the Florence – Bo-logna line and the western part of the Turin – Milan(between Turin and Santhià) experienced high trafficlevels. Urban nodes represented the most acute capacityproblems: however new HS lines did not solve thoseproblems and even worsen them by generating newtraffic.
– wider economic benefits due to generated demand areusually not considered in traditional cost benefitanalyses. Nash (2009) outlines that «leisure trips maybenefit the destination by bringing in tourist spending,commuter and business trips reflect expansion orrelocation of jobs or homes or additional economicactivity». However there is still debate on whether thesechanges really are additional economic activity or whetherit is simply relocated. Those benefits are usuallysignificant for projects connecting depressed areas toeconomic centres and when the reduction in generalisedtravel costs is large. Typically, infrastructures generatesignificant wider economic effects indeveloping economies. Europeandetailed calculations are rare. Theestimated value of those benefits forthe first section (London – WestMidlands) of the planned British HighSpeed 2, a project costing 17,800M€, is 4,000 M€15 (DfT 2011). Rulesof thumb suggest values of 10 to20% of direct benefits in the bestcases (Nash 2009, but also the WorldBank).
Final ly, the used value ofexpected traffic growth θ of 3%per year may appear as ratheroptimistic. However, one mustconsider that in the first yearsof operation traffic is expectedto grow at faster rates, as thecomparison of the supply in2010 and 2011 in Table 5suggests. This may be due tosome facts:– people needs time to changetheir behaviour (Litman 2010)as a response to a reduction intravel times, in particular whenit comes to change residenceor workplace;– a new open-access trainoperating company (NTV) isexpected to enter the marketin 2012, with a significant
increasing in the supply of services. In particular it willbe interesting to observe if competition with the publicincumbent Trenitalia will generate a reduction in averagefares and more complex yield management with morelow price offers. The combination of new supply andreduced fares should anyway attract new demand toHS services.
Comments on the ex-post analysis
A first comment can be spent on the demand.The lines in operation, from Turin to Naples – Salerno, arethe core of Italian long distance traffic, connecting themost important urban areas with the exception of West-East line from Turin to Venice. For this reason, one canexpect that this line will be the most used even if thenetwork will increase. Moreover, the distances involved arethose suggested as the most suitable for HS trains.However, only the central section of the line, from Milan toRome, has a significant amount of demand. The two marginal

23
Ricerche
TeMA
03.11
TeMA Vol 4 No 3 settembre 2011
sections, connecting the large cities of Turin and Napleswith the mainline (but also Verona, even if not at 300 km/h) have much less travelers and trains far from the linecapacity.We try to suggest possible explanations for suchdisappointing outcomes: the Turin-Milan relation seems tobe made of significant relations among intermediate originsand destinations (e.g. Vercelli-Milan, Novara-Turin, etc.),which cannot be served by high speed trains, but wouldhave benefited from faster inter-city services16.Probably, if the line would have been designed and builtwith lower standards (similar to those of the Florence-Romein Table 1) the balance would have been much better,with slightly lower benefits for the direct Milan-Turin relation,but significant benefits for other origins and destinationson the line.
Main planned AV/AC projects (MIT 2010). Some projects don’t have high speed (AV) characteristics and are classifiedas high capacity (AC). Figures in parenthesis are considered as second phases of projects (Table 6).
The Rome-Naples relation probably suffers from the factthat the two big metropolitan areas experience very hightravel times to the respective central stations, so that afast connection between city centres marginally benefitsthe connections among the big peripheral areas.Concerning the socio-economic assessment, even if demandresults quite good (near to the major European HS lines)and benefits are high due to important time savings, thesocio-economic result is not satisfying. In all the sections,except Milan – Bologna, the demand is no more than halfof the needed one to justify the public cost. The mainindication, especially for the central section, is then on thecost side: if the line would have had the expected costand not the double or more, or if costs would have been inline with European average, the whole line from Milan toRome would have been positive.
Comparison among current and expected passenger rail traffic (in trains/day) - as forecast by the official documents(our elaboration on sources). Forecasted values for the Brennero and Frejus base tunnels refer to the complete newline. For the Frejus, the secondary souce elaborates the complex official estimations (Table 7).
24
Ricerche
TeMA
03.11
TeMA Vol 4 No 3 settembre 2011
Ex-ante considerations on planned extensions
A long list of projects related to the High Speed/HighCapacity network expansion are at stake in Italy, alreadydepicted in Figure 1. In the following we will refer to themajor projects included in the last public document releasedby the Italian Ministry of Transport – the StrategicInfrastructure Program (MIT 2010) – which can beconsidered the most recent planning document, even ifnot giving any reference to actual and forecasted demandand lacks of cost-benefit considerations.
Expected demand, cost and performance
In absence of detailed data necessary to carry a full CBA,we will present in this section a first benchmark of thecosts, of the present demand and of the official estimationson expected traffic for the main projects underconsideration (Table 6). Among them, the Brennero basetunnel is part of the Verona – Munich high speed line, andthe Frejus base tunnel is part of the Turin – Lyon highspeed line. The Treviglio – Brescia – Verona – Padova is thecentral part of the Milan – Venice high speed line, whoseextreme parts (Milan – Treviglio and Padua – Venice) havebeen already built with no high speed standard (see Table1).Similarly to the existing lines, also the new links are supposedto be interested by both passenger and freight traffic17.Three of them, the Brennero, the Frejus and the ThirdGiovi pass, are mainly freight lines.
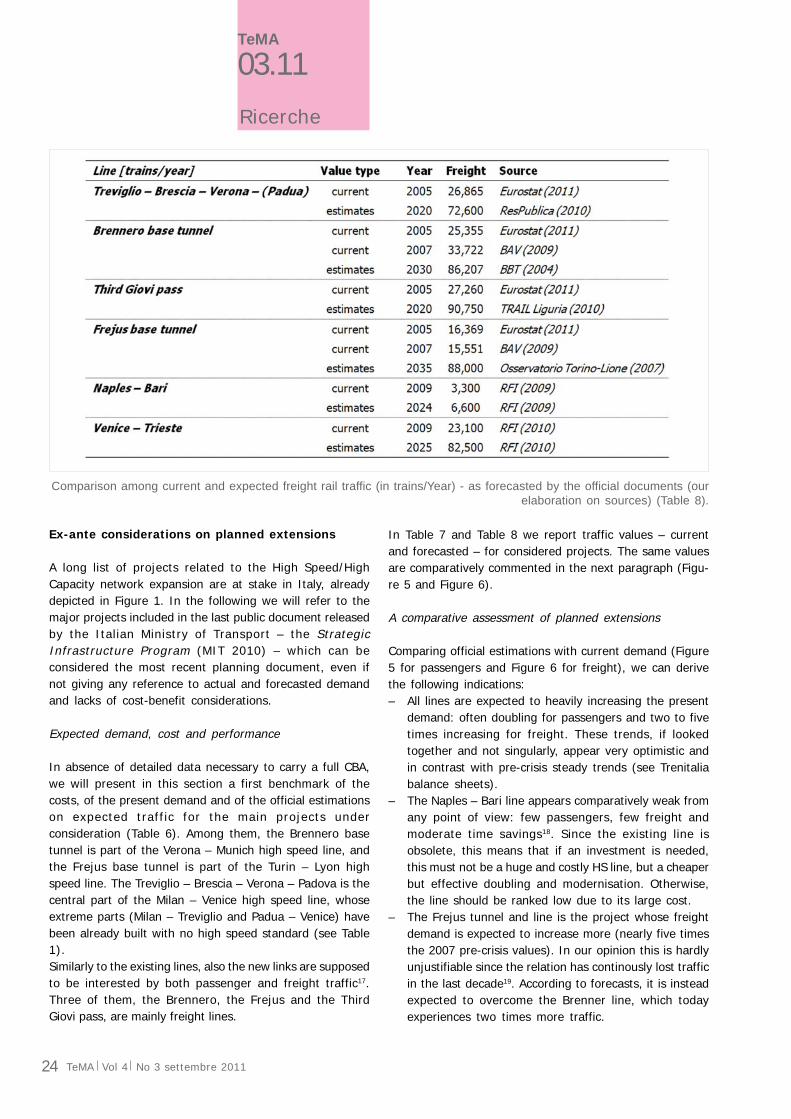
Comparison among current and expected freight rail traffic (in trains/Year) - as forecasted by the official documents (ourelaboration on sources) (Table 8).
In Table 7 and Table 8 we report traffic values – currentand forecasted – for considered projects. The same valuesare comparatively commented in the next paragraph (Figu-re 5 and Figure 6).
A comparative assessment of planned extensions
Comparing official estimations with current demand (Figure5 for passengers and Figure 6 for freight), we can derivethe following indications:– All lines are expected to heavily increasing the present
demand: often doubling for passengers and two to fivetimes increasing for freight. These trends, if lookedtogether and not singularly, appear very optimistic andin contrast with pre-crisis steady trends (see Trenitaliabalance sheets).
– The Naples – Bari line appears comparatively weak fromany point of view: few passengers, few freight andmoderate time savings18. Since the existing line isobsolete, this means that if an investment is needed,this must not be a huge and costly HS line, but a cheaperbut effective doubling and modernisation. Otherwise,the line should be ranked low due to its large cost.
– The Frejus tunnel and line is the project whose freightdemand is expected to increase more (nearly five timesthe 2007 pre-crisis values). In our opinion this is hardlyunjustifiable since the relation has continously lost trafficin the last decade19. According to forecasts, it is insteadexpected to overcome the Brenner line, which todayexperiences two times more traffic.

25
Ricerche
TeMA
03.11
TeMA Vol 4 No 3 settembre 2011
– Very high demand is expected on the Milan – Veniceand this is realistic. However, the lessons learnt fromthe Milan – Turin line should not be forgotten: thepresence of many medium sizes cities and Venice notbeing a big and dense metropolis20 suggest that averagetrip distances should be low (100-200 km) and demandshould not be concentrated but spread among manyOD couples. Thus, the pure speed is probably notneeded like from Milan to Rome and the investmentshould focus on increasing capacity, reliability andfrequency of intercity trains, following the German orSwiss examples.
– The Brenner is the only project in which a saturation ofthe concurrent mode – the motorway – seems possible,while the others expect a future saturation of existingrail.
– The Brenner and the Frejus lines have opposite capacityproblems: the first one has a capacity problem on longdistance freight trains and the latter on regional trainsnear Turin. The two projects should take into accountthis, preferring a doubling of the line around Turin beforethe doubling of the pass line; the opposite is true forthe Brenner.
– A huge freight traffic in expected on the Third Giovipass, but one must take into consideration the capacityand the performances of the Genoa port. Moreover,the present line is actually a 5 tracks connection,characterised by strong slopes (up to 35‰) but with a
capacity of 450 trains/day and a potentiality of700 (Gronda di Genova2009), the double ofexisting demand.
Concluding remarks
Summary of results
In the paper we facedtwo issues: to evaluateex-post the demandand the results of thenew Italian HS l inesbetween Turin – Milan– Rome – Naples andVerona – Bologna, andto provide a comparisonof future extensions.For the first question,we built a simpledistribution model toreconstruct the OD
matrix starting from the very limited demand data available.We estimated the flows on the sections of the line and ingeneral on the HS trains classified with the commercial nameof “Frecciarossa” and “Frecciargento”. The most usedsections are the central ones between Milan to Rome, withflows ranging from 6 to 12 Mpax/year in 2010. The otherHS sections to Turin and Naples have much less demand,below any expectation and far below the capacity of theline, used exclusively for HS trains.These results on demand, partially positive, partially negati-ve, translate into a variable judgement from the socio-economic viewpoint: it is marginally positive for the Milan –Bologna line and potentially marginally positive for theexpensive Bologna – Florence tunnel.Instead, neither the environmental benefits of shift fromair (approx 250M€ overall in 40 years), the possible widereconomic benefits (no more than 10 to 20% more, in themost optimistic case), the reduction of congestions (verysmall and concentrated around urban areas only) and theexpansion of capacity (that was already sufficient), canchange the result of non-core sections, namely the Turin –Milan, the Rome – Naples. In all cases, the socio-economicbenefits – although benefits are sometimes very high –have been dramatically reduced especially by the investmentcost, that have been overwhelmingly high compared tosimilar European lines and substantially underestimated.Future extensions, with the relevant exception of Milan –Venice doubling, appears to be more and more marginal
Graphical comparison among current and expected passenger rail traffic (in trains/day) - asforecasted by the official documents - on the planned new line (our elaboration on sources)(Figure 5).

26
Ricerche
TeMA
03.11
TeMA Vol 4 No 3 settembre 2011
compared to the Milan – Rome line. All forecasts appear tobe extremely optimistic, foreseeing doublings of demandon all lines. Being their expected costs similar or higher thanexisting lines, the socio-economic result cannot be better.
Policy indications
The analysis allows us to suggest some policy indications:– Some priorities between new lines are needed: the
whole cost cannot be paid at once and the best projectsmust be chosen, being their forecasts already verydifferent. The demand already gives an indication onwhich lines must be preferred, but an extensive andcomparative CBA is needed.
– Radical cost reduction strategies must be applied. Costsare too high compared to European standards. Arelevant part of such extra-cost is due to non competitiveawarding for construction. A problem of overdesignseems also to exist.
– In particular, the model of High Speed lines must beovercome, since passenger demand on those lines isless and less and potential time savings are not changingbehaviours substantially. Similarly, also the mixed-model
Graphical comparison among current and expected freight rail traffic (in trains/year) - as forecastedby the official documents - on the planned new lines (our elaboration on sources) (Figure 6).
of High Speed / HighCapacity, peculiar ofthe Italian network, didnot work anddetermined highercosts. Those lines thatare expected to hostmainly freight traffic(the three mountainpasses) should bedesigned for freighttraffic only. The Milan– Venice line should beconceived as a highcapaci ty l ine, withgood standards, butwithout ignoring thefact that 250 or 300km/h of design speedwill change averagetravel times of justfew minutes. Minorlines with no capacityproblems (Naples –Bari) must beupgraded, but at thelowest possible cost,finding the best tradeoff between timesavings and public
expenditure.– An interesting strategy is that of dividing the project
into functional sections and analysing them with aphasing approach: a line can be built progressively,and the characteristics of extensions can be changedaccording to how demand responded. In this wayone can obtain the same benefits at lower and dilutedcost and, more important, reducing the risk ofoverinvestment (see Debernardi et al. 2011).
– Much attention must be spent on nodes, i.e. the placeof the network where true capacity problems existand where capacity and speed improvements give thebetter payoff.

27
Ricerche
TeMA
03.11
TeMA Vol 4 No 3 settembre 2011
Notes1 Sole 24 Ore, “Opere più frugali per coinvolgere i privati”.
2 Ferrovie dello Stato turned his name to Ferrovie dello StatoItaliane in mid 2011.
3 Concession Act: Decreto Ministeriale n. 138T del 31 ottobre2000, Ministero dei Trasporti e della Navigazione.
4 D.L. “Disposizioni urgenti per la stabilizzazione finanziaria”, 12luglio 2011, art. 21.4.
5 10.7 billion Euro1994 is equal to 15.5 billion Euro2006 (RFI 2007).
6 Actually the number refers to total year projections made onthe basis of tickets sold up to October 2010.
7 Data are taken from station managers websites,www.grandistazioni.it and www.centostazioni.it. We sum allpassengers using stations where high speed services start ineach city. Turin Porta Susa station is managed directly by RFIand no data is available: we hypothesize a value of 15 millionpassengers.
8 Some trains continue northbound of Verona (1 train couple toBrescia, and 2 couples up to Bolzano), northbound of Venice (1train couple up to Udine) and southbound of Naples (1 traincouple to Reggio Calabria and 4 couples to Bari/Lecce).
9 With the hypothesis that average load factor on those peripheralsections is 200 passengers/train for trains to Reggio Calabriaand Bari, and 150 passengers/train for trains to Brescia, Bolzanoand Udine. Average High Speed load factor in 2007 was 215(FS, 2007), but in this case the trains always continue to Romeserving also some intermediate cities.
10 See Table 5 for part of the used values.
11 This average value is confirmed by FS (2009) for the Milan -Rome relation, where a +50-60% of new demand is reported,and by Cascetta et al. (2011), where 30.8% of the 2007 high
speed traffic between Rome and Naples is generated or divertedfrom other non rail modes (i.e. +44.5% of existing demand).
12 RFI estimates for the planned Naples – Bari line unit costs of56,000 M€ per kilometer of double track line.
13 Reduction in greenhouse gases due to HSR introduction is quitecontroversial in general, even more in countries with high oildependence for electric energy production like Italy or Britain(Nash, 2009).
14 Hypotesizing a traffic growth of 2%, a social discount rate of3.5% and an horizon of 40 years.
15 However in Britain projects have to pass the cost-benefit testwithout considering wider benefits.
16 This is reflected also in the current supply on the relation, thatis still made of 38 regional, 20 conventional long distance andonly 20 high speed services (Source: Trenitalia websitewww.trenitalia.com, visited on September 2011. Simulated day:12/10/2011).
17 Despite initial declarations, no freight traffic is using the existinghigh speed network.
18 Comparing current timetables with forecasts (RFI 2009) timesavings are less than 1h in total.
19 Overall freight traffic (both on the road and on the rail) amongFrance and Italy decreased from 51 Mtons in 2000 to 48.1Mtons in 2007, before dropping to 38.2 Mtons in 2009.Considering only relations more strictly related to the project(namely Frejus/Moncenisio, Monte Bianco and Monginevro),values are 36.6 in 2000, 28.1 in 2007 and 20.7 in 2009 (BAV2009).
20 Venice has 271k inhabitants and Padua 214k inhabitants.
References
BAV (2009), AlpInfo 1990-2009 data, Bundesamt für Verkehr [in German, “Federal Office of Transport”], website: www.bav.admin.ch
BBT (2002), Simulazione d’esercizio. Rapporto 2002. [in Italian and German, “Operating simulation. Report 2002”] Brenner BasisTunnel.
Beria P., de Rus G., Quinet E., Schulz C. (2010), A comparison of rail liberalisation levels across four European countries, SelectedProceedings of the 12th WCTR Conference, Lisbon (PT). http://www.wctr2010.info/WCTR_Selected/default.htm.
Beria P., Ponti M. (2009), Regulation of investments on transport infrastructures in Italy, 2nd Annual Conference of Competitionand Regulation in Network Industries, Brussels, Belgium, November 20, 2009. Available at: http://www.jcrni.org/extranet/index.php
Cascetta E., Papola A., Pagliara F., Marzano V. (2010), “Analysis of mobility impacts of the high speed Rome–Naples rail link usingwithinday dynamic mode service choice models”, Journal of Transport Geography, 19, 635–643.
Corte dei Conti (2009), Relazione sul risultato del controllo eseguito sulla gestione finanziaria di Rete Ferroviaria Italiana (R.F.I.)S.p.A. per l’esercizio 2007. Delibera 44-09.
Debernardi A., Grimaldi R., Beria P. (2011), Cost benefit analysis to assess modular investment: the case of the New Turin-LyonRailway, presented at “Contemporary Issues in CBA in the Transport Sector”, Workshop on March 16, 2011. Centre forTransport Studies (KTH), Stockholm (Sweden)
DfT (2011), Economic Case for HS2: The Y Network and London – West Midlands, Department for Transport, UK.
de Rus G., Nash C. A. (2007), “In what circumstances is investment in HSR worthwhile?”, ITS Working Paper 590, February 2007,Institute for Transport Studies, University of Leeds (UK).
de Rus G., Nombela G. (2007), “In Investment in High Speed Rail Socially Profitable?”, Journal of Transport Economics and Policy,41 (1), 3-23.

28
Ricerche
TeMA
03.11
TeMA Vol 4 No 3 settembre 2011
ENAC (2007), Dati di traffico 2010, [in Italian], Direzione Sviluppo Aeroporti, Ente Nazionale Aviazione Civile.
ENAC (2010), Dati di traffico 2007, [in Italian], Direzione Sviluppo Aeroporti, Ente Nazionale Aviazione Civile.
Eurostat (2011), Traffic flow of trains on the rail network (number of trains, 2005 data), website: ec.europa.eu/eurostat
FS (2007), Piano industriale 2007-2011, Roma.
FS (2009), “Alta Velocità: crescono i viaggiatori, prosegue lo sconto sui biglietti”, FSNews, 29th january 2009, website:www.fsnews.it, Ferrovie dello Stato SpA, Roma (Italy).
FS (2010), “Alta Velocità 2010: in crescita viaggiatori e gradimento del servizio”, FSNews, 10th december 2010, website:www.fsnews.it, Ferrovie dello Stato SpA, Roma (Italy).
Gronda di Genova (2009). Dibattito pubblico. 1° incontro tematico. La Gronda e gli scenari di traffico e della mobilità. Minutes ofthe Public Debate, Genova, March 7th 2009.
ItaliaOggi (2010), “FS, il boom dell’alta velocità”, p. 14, 27th October 2010.
MIT (2010), Programma infrastrutture strategiche, [in Italian, “Strategic Infrastructures Program”], Ministero delle Infrastrutturee dei Trasporti.
MTN (2001), Piano Generale dei Trasporti e della Logistica, [in Italian, “General Plan of Transport and Logistics”], Ministero deiTrasporti e della Navigazione.
Nash C. A. (2009), When to Invest in High-Speed Rail Links and Networks?, Discussion Paper No. 2009-16 December 2009, JointTransport Research Centre, International Transport Forum, OECD.
Osservatorio Torino-Lione (2007), Scenari di traffico. Arco alpino, [in Italian and French, “Traffic sceneries. Alps”], Quaderno02. Osservatorio collegamento ferroviario Torino-Lione [Observatory Turin-Lyon rail link], Presidenza del Consiglio deiMinistri.
ResPublica (2010), Strumenti innovativi per il finanziamento delle infrastrutture di trasporto, ResPublica, Milano.
RFI (2005), Metodologia per la valutazione economica degli investimenti: l’analisi costi-benefici. [in Italian], Rete FerroviariaItaliana, Ferrovie dello Stato.
RFI (2007), Rete AV/AC. Analisi dei costi, [in Italian], presentation, Rete Ferroviaria Italiana, Ferrovie dello Stato.
RFI (2009), Itinerario Napoli-Bari. Analisi economico-sociale degli investimenti programmati. Progetto Preliminare delle fasiprioritarie. Rete Ferroviaria Italiana. Direzione strategia e pianificazione. Ferrovie dello Stato.
RFI (2010), Nuova linea AV/AC Venezia – Trieste. Tratta Ronchi-Trieste. Progetto Preliminare. Studio di impatto ambientale,sintesi non tecnica. Rete Ferroviaria Italiana. Direzione tecnica – U.O. Ambiente e archeologia. Ferrovie dello Stato.
TRAIL Liguria (2010), Tratta Milano-Genova “Terzo Valico dei Giovi”, website: www.trail.liguria.it.
Image sources
The images at page 15 and 21 are elaborations of the authors on Wikimedia Commons Map. The image at page 16 is fromwww.rfi.it. The image at page 17 is from bibliographic reference FS 2010. The graph at page 22 is from bibliographic referenceTrenitalia 2007. The table at page 20 is from bibliographic reference Rus and Nombela 2007, de Rus and Nash 2007.