an audit of aerodynamic loss in a double entry turbine under full and partial admission
TRANSCRIPT

International Journal of Heat and Fluid Flow 33 (2012) 70–80
Contents lists available at SciVerse ScienceDirect
International Journal of Heat and Fluid Flow
journal homepage: www.elsevier .com/ locate / i jhf f
An audit of aerodynamic loss in a double entry turbine under full andpartial admission
Peter Newton a, Colin Copeland a, Ricardo Martinez-Botas a,⇑, Martin Seiler b
a Department of Mechanical Engineering, Imperial College London, London, UKb ABB Turbo Systems Ltd., Baden, Switzerland
a r t i c l e i n f o a b s t r a c t
Article history:Received 31 March 2011Received in revised form 4 October 2011Accepted 4 October 2011Available online 14 November 2011
Keywords:Double-entryTurbochargerTurbineEntropy productionCFD
0142-727X/$ - see front matter � 2011 Elsevier Inc. Adoi:10.1016/j.ijheatfluidflow.2011.10.001
⇑ Corresponding author. Tel.: +44 0207 594 47241.E-mail addresses: [email protected]
imperial.ac.uk (C. Copeland), [email protected] ([email protected] (M. Seiler).
The current study investigates the sources of loss inside a mixed flow, double entry turbocharger turbineunder steady inlet conditions in both full and partial admission. Under normal on-engine operation, it islikely that both limbs in a double entry device will be fed by exhaust pulsations which are out of phasemeaning that the turbine will spend most or all of the time with unbalanced flow through each limb. Inthe extreme case one limb will be flowing whilst the other is stagnant, this is the partial admission con-dition. Even under steady state inlet conditions, unequal admission is an important effect to study on theway to fully understanding pulsed operation of a double entry device.
This paper presents 3D computational analyses of the flow inside a double entry turbine under both fulland partial admission. The computational results are compared to experimental results of Copeland(2009) and Copeland et al. (2010). The distribution of loss within the turbine is evaluated for each com-putational condition by means of entropy production. In the full admission case the most significant areaof loss was found to be in the tip region. Under the partial admission condition the flow regime is verydifferent. In this case the rotor wheel was found to be acting in a fully unsteady manner, with the flowbeing unable to reach a fully developed state throughout the flowing section of the volute. The most sig-nificant area of entropy generation in the partial admission case was associated with interaction of theflows in each sector of the volute, this occurred in the interspace between the nozzle exit and the rotorpassage inlet.
� 2011 Elsevier Inc. All rights reserved.
1. Introduction
In an exhaust turbocharger system it is desirable to transfer asmuch of the gas energy from the point of the engine exhaust valveto the turbine wheel as possible, with minimum dissipation. Aseach cylinder exhausts this leads to a highly unsteady flow drivingthe turbine wheel, a problem inherent in coupling a roto-dynamicdevice to a positive displacement one.
A problem with pulse turbocharging is encountered when twoor more engine cylinders have overlapping exhaust pulses. Notonly can this damp the high energy pressure pulses but moreimportantly can have an adverse effect on the exhaust manifoldwave dynamics. This leads to the dual entry turbine which allowstwo separate flows to enter the turbine wheel, whilst keeping themisolated as far as possible. Watson and Janota (1982) find that opti-mal performance is obtained when three cylinders, whose firingsequences are evenly spaced (i.e. 240 crank angle degrees on a four
ll rights reserved.
(P. Newton), c.copeland@R. Martinez-Botas), martin.a.
stroke engine or 120 crank angle degrees on a two stroke engine),are connected to each turbine entry. This makes the dual entry tur-bine ideal for an in-line six cylinder engine although they are usedunder many other configurations. Turbochargers with up to fourentries to a single turbine wheel can be found on engines with alarger number of cylinders: however, in this case it is more com-mon that two dual entry turbochargers would be employed in-stead. Whichever configuration is used it is important that themanifold is tuned such that the pressure reflections to and fromthe turbine do not interfere detrimentally with the operation ofthe engine.
Dual entry turbines are commonly found in two different for-mations: the twin-entry volute, where each entry supplies thewhole 360� of the turbine periphery but only half of the span;the double-entry volute, where each entry supplies a 180� sectionof the turbine wheel. With any multiple entry turbine fitted toan engine it is likely that, at any point in time, each entry willnot be at exactly the same condition of pressure and mass flow rateas the next. This gives rise to an unequal flow condition at the tur-bine wheel. The extreme case, where one entry is flowing whilstthe other entry is stagnant, is referred to as the partial admissioncondition. During real world operation a dual entry turbine will

Nomenclature
k thermal conductivity (W/m K)_Q rate of heat input (W/kg)RP ratio of pressures between the inner and outer limbss specific entropy (J/kg K)T temperature (K)t time (s)dij identity matrixk bulk visocity (Pa s)l dynamic viscosity (Pa s)q density (kg/m3)r entropy generation rate per unit volume (W/K m3)
sij shear stress tensor (Pa)
Subscripti, j Cartesian componentst turbulence quantity
Superscript0 fluctuating Component� derivative w.r.t time– average component
P. Newton et al. / International Journal of Heat and Fluid Flow 33 (2012) 70–80 71
spend the majority of its time under some condition of unequalflow through each limb. This suggests that, even though the un-equal admission effect can be analysed in a steady manner, thisis an important feature to study in order to begin to understandthe fully unsteady performance of a multiple entry turbochargerturbine. This may not only be a consideration for the turbinedesigners, where current methodology is to design for full admis-sion performance, but this can also help in turbocharger-enginematching and simulation. Here again it is commonplace to basethe turbocharger performance upon the full admission perfor-mance of the turbine without considering the partial and unequaloperation, which, in the extreme case can differ significantly to theequivalent full admission condition. Copeland (2009), showed howto use the steady partial and unequal admission turbine perfor-mance to obtain a full quasi-steady analysis of a turbine acting un-der pulsed operation. The current study deals with the flow insidea double entry device, shown in Fig. 1.
In the past two decades most of the research concerning dualentry turbocharger turbines has looked at the twin entry turbinewith the exception of Copeland et al. (2008, 2010, 2011) and Cope-land (2009) who carried out an extensive research programmeassessing the performance of a double entry turbine in both steadyand unsteady conditions. All other published research regardingthe double entry turbine was carried out before 1980 (Benson1974; Benson and Scrimshaw 1965; Mizumachi et al., 1979; Pisch-inger and Wunsche, 1977; Wallace and Blair, 1965; Wallace et al.,1969; Wallace and Miles, 1970). In steady testing Copeland et al.(2008, 2010, 2011) and Copeland (2009) find a considerable de-cline in performance when the turbine is operated in unequaladmission, this corroborates with previous researchers. In the ex-treme, partial admission condition, the performance deficit wasfound to be upwards of 30% points in turbine efficiency. In themost recent publication of Copeland et al. (2010) an effort was
Fig. 1. Double entry volute configuration.
made to explain some of their experimental findings on unequaladmission using a computational analysis of the whole turbine sys-tem. Although some understanding of the partial admission flowwas gained from this analysis, the model was not considered re-fined enough to justify a more detailed investigation of the flowfield.
As far as the authors are aware the previous study by Copelandet al. (2010) is the only published 3D computational analysis of adouble entry turbine. The current study aims to carry out a morerefined computational analysis to assess the main areas of loss ina double entry turbine in both full and partial admission and hencegain a deeper understanding of the differences between the twoflow regimes.
2. Entropy production
The main aim of this paper is to show the division of losses in-side the turbine and to explore how this changes when the turbineis operated in a condition of partial admission. Traditionally thedifferent losses are classified by a series of total pressure loss coef-ficients. These have been used in the past simply because they areeasy to calculate from cascade data although, as Denton (1993)points out, this does not necessarily mean that this is the most con-venient form. He concludes that the most rational measure of lossgeneration in an adiabatic machine is in entropy creation. Entropyis a useful concept in the design of fluid machinery where, in anadiabatic device, the creation of entropy relates directly to thedestruction of useful work and hence to a loss in efficiency.
The use of entropy generation rate is particularly advantageousin a Computational Fluid Dynamics (CFD) simulation where pointwise entropy generation can be calculated directly, demonstratedby several researchers (Copeland et al., 2010; Kock and Herwig,2005; Moore and Moore, 1983a,b; Pullan et al., 2005; Sciubba,1997). Sciubba (1997) outlines the superiority of this method overtraditional loss correlations for identifying regions of loss inside aturbo machine. Perhaps more pertinent to the current investiga-tion Pullan et al. (2005) used the method of entropy generationrate to show different areas of loss inside a turbine passage. Cope-land et al. (2010) also used the idea of entropy generation rate todemonstrate areas of loss generation in a double entry turbinesystem.
Greitzer et al. (2004) derive an analytical expression for the en-tropy production rate per unit mass in a fluid system:
DsDt¼
_QT� 1
qT@qi
@xiþ sij
qT@ui
@xið1Þ
The first term on the right hand side of Eq. (1) represents thechange in entropy of the system due to an internal heat source,such as combustion, with a heat rate _Q , this term can be ignored

72 P. Newton et al. / International Journal of Heat and Fluid Flow 33 (2012) 70–80
in the current analysis. The second term represents the entropychange due to heat flux, where qi is the ith component of the heatflux vector, q. This may be modelled as the product of thermal con-ductivity and the temperature gradient:
qi ¼ k@T@xi
ð2Þ
The final term on the right hand side represents the dissipationof mechanical energy into entropy where sij is the viscous stresstensor:
sij ¼ l @ui
@xi
� �þ @uj
@xi¼ dijkr � u ð3Þ
In order to implement Eq. (1) directly, in a turbulent flow, thetime and length scales of the very smallest eddies would have tobe modelled explicitly (a direct numerical simulation), whichwould be highly impractical and require very large computingtimes. In reality the effects of these very small turbulent eddiesare accounted for in the turbulence model. Moore and Moore(1983a) extended this analytical equation for application with aneddy viscosity turbulence model. In their analysis they neglectthe effect of internal heating sources and first develop an expres-sion for entropy generation per unit volume, applying the Reynoldsdecomposition for temperature and velocity:
Tr ¼ kT
@T@xi
!2
þ @T 0
@xi
� �224
35þ �sij
@ui
@xjþ s0ij
@u0i@xj
ð4Þ
For the current model, the system was adiabatic and the effectof thermal diffusion was assumed to be negligible compared to thegeneration of entropy through turbulent viscous dissipation. Thisallowed the entropy generation term associated with heat fluxon the right hand side of Eq. (4) to be neglected. Finally, Mooreand Moore (1983a) use the eddy viscosity to model the turbulentviscous dissipation:
s0ij@u0i@xj¼ lt
l�sij@ui
@xjð5Þ
The equation for entropy generation rate per unit volume, usedin this study, is finally given by:
r ¼ 1T
sij@ui
@xjþ lt
lsij@ui
@xj
� �ð6Þ
All variables in Eq. (6) can be readily obtained in most standardCFD packages. This quantity can be integrated over a control vol-ume in order to evaluate the instantaneous entropy production.
3. Computational analysis
The computational analyses were run using the 3D, viscous, Na-vier–Stokes solver Ansys CFX 12.1. This is a general purpose, com-mercial CFD code although the pre- and post processors containmany functions specifically intended for the analysis of turboma-chines, which lends it particularly to the current application. Thecomputational analyses were separated into two distinct parts:Single passage analyses were used to simulate the full admissioncondition; a full turbine model was required to model the partialadmission condition.
3.1. Mesh sensitivity
In order to test the sensitivity to of the predicted flow field tomesh refinement, five different grids were tested for the turbinerotor domain, ranging between 15,000 elements and 1.8 millionelements per passage. In prediction of turbine performance, mesh
density had negligible effect as both mass flow and efficiency werepredicted similarly by all the different meshes. A comparison of thepredicted and measured turbine performance is given in the Sec-tion 4.1 for the final mesh. Although a good prediction of the tur-bine performance is encouraging, this does not necessarilyguarantee a good prediction of the flow field.
The flow prediction by each mesh was further analysed byexamination of the velocity field downstream of the trailing edgeof the rotor blade. This was done mainly in a qualitative sense,by looking at contours of velocity. It was clear that the lower den-sity meshes, below 100,000 elements per rotor passage, were un-able to resolve some of the more detailed aspects of the flowwhich were predicted by the higher density meshes, even thoughthe overall performance prediction was very similar. Beyond a ro-tor mesh density of around 400,000 elements per rotor passage theprediction of various details in the trailing edge velocity field wasmore consistent and almost no change was observed in the pre-dicted flow field when the mesh density was increased beyond950,000 elements per rotor passage, although this does not neces-sarily guarantee a grid independent solution. The final mesh cho-sen contained 990,000 nodes per rotor passage and wascomposed entirely of hexahedral elements. Each nozzle passagewas also composed fully of hexahedral elements and contained100,000 nodes. The choice of mesh was made based on both themesh sensitivity analysis and a practical limit on the maximumgrid size for the computational resources available, since the samemesh was used in both the full admission (single passage) analysesand the partial admission analysis which necessitated modelling ofthe whole turbine system including 12 rotor passages and 24 noz-zle passages and the full volute and exit duct.
The computations were run on the high performance computer(HPC) at Imperial College: this is a centrally based PC cluster allow-ing vast parallel computations. The partial admission case, whichconsisted of over 14 million mesh nodes in total, was run on 3HPC nodes, each with 8 CPUs and a RAM availability of 16 GB. Evenwith this capacity computation times for this case were on the or-der of a week in total in order to model two complete rotations ofthe turbine wheel.
3.2. Full admission analysis
In order to model the full admission condition, rotational peri-odicity was exploited so that a single turbine passage could beused to model the whole geometry: this allows a significant savingof computational effort. The flow domain consisted of a 30� sectorcontaining two nozzle passages and a single rotor passage. An inletblock was added upstream of the nozzle domain and an exit ductdownstream of the rotor passage in order to allow full develop-ment of the pressure and velocity fields.
In a single passage model it is important to model the inletboundary conditions correctly: the direction of the flow at the inletto the nozzle must emulate the conditions at the exit to the volute,which is not modelled explicitly. A free vortex flow was assumed,with a swirl coefficient of 0.9, as proposed by Japiske and Baines(1994), in order to specify the flow direction. Using experimentaldata the flow velocity at the entrance to the volute was calculated,the meridional velocity component was evaluated by assuming aconstant mass flow into the rotor wheel around the periphery ofthe volute. Table 1 outlines the settings for the single passagemodel.
3.3. Partial admission
Unequal admission in a double entry turbine creates an unstea-dy effect within each turbine passage as the wheel rotates betweenthe two sectors of the volute, which are at different pressures.

Table 1Single passage model settings.
Analysis type Steady state
Inlet Total pressure and static temperature. Flowdirection assuming a free vortex flow with aswirl coefficient of 0.9 (Japiske and Baines,1994)
Outlet Area averaged static pressureNozzle rotor interface Stage interfaceWalls Smooth, adiabaticTurbulence model k–e with scalable wall functions
Table 2Partial Admission Model Settings.
Analysis type Transient, 1� of rotor rotation per time-stepInner limb inlet Total pressure and total temperature, flow direction
normal to volute inlet planeOuter limb inlet Wall boundary conditionOutlet Area averaged static pressureNozzle rotor
interfaceTransient rotor stator interface
Walls Smooth, adiabaticTurbulence
modelk–e with scalable wall functions
P. Newton et al. / International Journal of Heat and Fluid Flow 33 (2012) 70–80 73
Since this is an important effect to model, adopting a single pas-sage analysis would not be acceptable to capture this behaviour.Perhaps the greatest discrepancy would be in the assumption thatthe flow in each passage would be exactly the same. It was alsoapparent from the work of Copeland et al. (2010) that the periph-eral flow around the rotor wheel contributes significantly to thebehaviour of the turbine as a whole under partial admission. Con-sidering this a model of the turbine system was constructed incor-porating the full volute, 24 nozzle passages, 12 rotor passages andan exit duct, this is shown in Fig. 2.
To capture the unsteady effect in each rotor passage a transientsimulation was carried out. A transient rotor–stator interface wasapplied such that the rotor was explicitly rotated by 1� per timestep so that each rotor pitch was traversed by 30 individual timesteps. This was small enough that the solution converged within10 iterations to an RMS residual value of 10e�05 in each time step.Two full rotations of the turbine wheel were modelled, which cor-responded to 720 individual time steps, this allowed the solutionto reach periodic convergence. The parameters for the partialadmission case are outlined in Table 2.
3.4. Division of the passage
Losses in a turbomachine are traditionally classified into differ-ent areas such as tip leakage loss, windage loss, and secondary flowloss. As many authors have outlined before (Baines et al., 2003;Denton, 1993), on a real turbomachine the division between eachof these types of loss becomes blurred and it is impossible to deter-mine whether a particular area of loss should be attributed to oneor the other. Because of this, the division of the passage into differ-ent areas of loss generation was somewhat arbitrary although
Fig. 2. Full turbine domain for the partial admission case with the inner (flowing)and outer (non-flowing) limbs marked, the rotor and nozzle blades can be seen inred and have also been marked along with the exit plane.
some thought was given to the fluid dynamic processes withinthe rotor blade passage. The stator domain was taken as a singlecontrol volume whilst the rotor blade domain was divided into se-ven further volumes.
Fig. 3A shows the division of the rotor blade passage from ablade to blade perspective. The Interspace area consisted of every-thing between the exit of the stator domain and the leading edge ofthe rotor blade. The Pressure Side (PS), Suction Side (SS) and Exitareas were further divided into Tip and Passage sections. The Tiparea included everything above 75% of blade span, this was foundto incorporate the majority of the tip leakage vortex for most casesand the Passage area included everything below this. This can beseen in Fig. 3B which shows the division of the passage in a merid-ional orientation.
4. Results
4.1. Single passage
4.1.1. Comparison with experimental dataThe single passage analysis was conducted at 90% of design
speed, which corresponded to a shaft speed of 52,000 rpm. Thepressure ratio ranged between 1.3 and 3, which equated to velocityratios between 1.05 and 0.53 respectively. The computational re-sults were compared to the full admission experimental resultsof Copeland (2009) for both pressure ratio against mass flow rateand efficiency against velocity ratio. The comparisons are shownin Figs. 4 and 5. In these figures the mass flow rate and efficiencyfigures have been normalised by the corresponding values for theexperimental peak efficiency case.
Below an isentropic velocity ratio of around 0.85 the computa-tional analysis predicts the efficiency of the turbine to be generallyhigher than the experimental case. This discrepancy is around 5%for the peak efficiency point. At values of velocity ratio higher thanthis, the CFD model predicts a sharper deterioration in efficiencythan is seen in the experimental data, this effect was also seen inthe analysis by Copeland et al. (2010). At a velocity ratio of 1.05the CFD analysis under predicts the experimentally measured effi-ciency by around 10%, this does however correspond to an area ofsteep decline in efficiency with isentropic velocity ratio. Overall theprediction of turbine efficiency by the CFD model shows a satisfac-tory agreement with the experimental data, especially at lowervalues of velocity ratio.
It is worth noting that the largest discrepancies between theexperimental and computational results are seen in the lowerpower region of the turbine performance line, this is the area ofgreatest uncertainty in the experimental results which can be ashigh as ±5% in terms of normalised efficiency (Copeland, 2009).Some discrepancy between the computational and experimentalresults would be expected however, due to simplifications inherentin the CFD model. Perhaps the largest simplification in the compu-tational analysis is that the single passage model does not accountfor the volute and any loss associated with it. In addition, the CFDanalysis does not model the windage losses on the back face of the

Fig. 3. (A) Division of rotor blade passage in the blade-to-blade orientation, the Suction Side (SS), Pressure Side (PS) and exit areas are further divided into passage and tipareas. (B) Division of the rotor and stator domains in the meridional sense, the leading and trailing edges of the rotor and stator blades have been marked. The tip area (tip andexit tip) incorporate everything above 75% of span.
0.5
0.6
0.7
0.8
0.9
1
1.1
0.5 0.7 0.9 1.1
Nor
mal
ised
Tot
al to
Sta
tic
Effic
ienc
y
Velocity Ratio
Experimental results
Computational Results
Fig. 4. Comparison of CFD data with experimental data for full admission efficiency.
0
0.2
0.4
0.6
0.8
1
1.2
1.4
1.6
1.8
1 1.5 2 2.5 3
Nor
mal
ised
Mas
s Fl
ow
Pressure Ratio
Experimental results
Computational Results
Fig. 5. Comparison of CFD data with experimental data for full admission mass flowrate.
74 P. Newton et al. / International Journal of Heat and Fluid Flow 33 (2012) 70–80
rotor and it assumes an aerodynamically smooth surface for all so-lid boundaries, on the actual turbine there are tool paths caused bythe manufacture of the turbine wheel. It is also clear that the CFDmodel is based on approximations of fluid behaviour, the most sig-nificant being the turbulence model. Although the k–e model usedhere is one of the most prominent and well validated turbulencemodels it is evident that it will not predict the turbulent effectsfully in all flow situations.
The predicted mass flow characteristic follows the experimentaldata very well. At the lowest pressure ratio there is roughly a 3%discrepancy, whilst at the higher pressure ratio this is less than 1%.
4.1.2. Distribution of lossesFig. 6 shows the distribution of normalised entropy generation
per unit shaft work against velocity ratio for the single passagecomputational analysis. The normalisation value was taken asthe entropy generation rate per unit shaft work within the rotorand stator in the peak efficiency case. At peak efficiency (operatingpoint A in Fig. 6, velocity ratio 0.63, pressure ratio 2.1) the losseswithin the turbine are dominated by tip effects (SS Tip, PS Tipand Exit tip) with the largest contribution coming from the tip sec-tion on the suction side (SS Tip). At this operating condition theincidence angle entering the rotor passage is about �12�. This isa favourable degree of incidence and results in a fairly orderly flowfield that follows the blade curvature on both the pressure and suc-tion sides of the blade. A strong tip leakage vortex is evident on the
suction side of the blade leading to higher losses in this area. In thelowest velocity ratio case (operating point B in Fig. 6, velocity ratio0.53, pressure ratio 3.0) the distribution of losses remains similarto those at peak efficiency apart from a noticeable increase inlosses in the SS Passage section. This is due to a slightly positiveincidence angle (+11�) as the flow impinges on the leading edgeof the blade. This leads to a separation of the flow on the suctionside of the leading edge of the blade, leading to increased lossesin this area. At the highest velocity ratio (operating point C inFig. 6, velocity ratio 1.05, pressure ratio 1.3) the losses are distrib-uted quite differently to the peak efficiency case (operating point Ain Fig. 6). In this case the incidence angle is �72�: this represents ahighly adverse condition. The flow here impinges on the suctionsurface of the blade and accelerates around the leading edge caus-ing a large region of separation on the pressure surface of the bladeand very large associated losses throughout the passage: this tendsto dominate the flow through the rest of the blade passage.
4.2. Partial admission
4.2.1. Comparison with experimental dataThe computational analysis of the partial admission case was
carried out with exactly the same conditions as measured byexperiment. The inlet total pressure to the inner (flowing) limb

Nor
mal
ised
Ent
ropy
Gen
erat
ion
per u
nit S
haft
Wor
k
0
1
2
3
4
5
6
7
8
B
0.6
Exit Tip
Exiit Passage
SS Tip
PS Tip
SS Passage
PS Passage
Interspace
Stator
A
0.7
Isentropic Velocity Ratio0.8 0.9 1
C
Fig. 6. Division of losses in the turbine system for a single passage model, relativeto the shaft work of the turbine. Operating point A shows the peak efficiency case(pressure ratio 2.1, velocity ratio 0.63), this also corresponds to point A in Fig. 10,operating point B shows the highest pressure ratio case (pressure ratio 3.0, velocityratio 0.53) and C shows the lowest pressure ratio case (pressure ratio 1.3, velocityratio 1.05).
0.5
0.6
0.7
0.8
0.9
1
1.1
0.5 1 1.5 2
Nor
mal
ised
Effi
cien
cy
PRInner/PROuter (RP)
Experimental Data
CFD results of Copeland et al.
CFD Results
Fig. 7. Comparison of partial admission CFD efficiency with experimental data andthe previous results of Copeland et al. (2010), the results for direct comparison withthe current CFD case have been circled.
0.8
0.85
0.9
0.95
1
1.05
1.1
0.5 1 1.5 2
Nor
mal
ised
Effe
ctiv
e A
rea
PRInner/PROuter (RP)
Experimental Data
CFD results of Copeland et al.
CFD Results
Fig. 8. Comparison of partial admission CFD effective area with experimental dataand the previous computational data of Copeland et al. (2010), the results for directcomparison with the current CFD case have been circled. This figure shows only theeffective area calculated for the inner limb, in the experimental data and the CFDresults of Copeland et al. the pressure ratio across the inner limb was held at around2.0 whilst the ratio of inlet pressures was varied by adjusting the pressure ratioacross the outer limb, in the partial admission case the outer limb was closed suchthat no mass could flow.
P. Newton et al. / International Journal of Heat and Fluid Flow 33 (2012) 70–80 75
was 199,537 Pa with a total temperature of 320.7 K. The exit staticpressure was 100,783 Pa and the turbine speed 49,431 rpm. Thiscorresponds to a velocity ratio of 0.657 and pressure ratio of 1.97across the flowing limb.
Figs. 7 and 8 show a comparison between the current CFD anal-ysis, the experimental data and the previous computational analy-sis of Copeland et al. (2010) for efficiency and effective arearespectively. The effective area is the hypothetical throat areawhich would be needed to pass the turbine mass flow if a nozzlewas acting isentropically over the same pressure ratio as the tur-bine. This parameter shows the turbine swallowing capacity andwas used by Copeland et al. in plots of unequal admission insteadof mass flow. The abscissa on both of these figures shows the ratioof pressures between the two entries in the double entry turbine. Avalue of unity represents the full admission condition and as thisvalue moves away from unity the turbine experiences a higher de-gree of unequal admission. It is worth noting that Fig. 8 representsonly the effective area of the inner (flowing) limb. In the experi-mental results and the previous CFD results of Copeland et al.(2010) the pressure ratio across this limb was held constant atapproximately 2.0 whilst the pressure ratio in the outer limb wasvaried to observe the effect of different degrees of unequal admis-sion, in the partial admission case the outer limb was closed suchthat no mass was able to flow through it. All of the data points havebeen normalised by the equivalent value in the experimental equaladmission, peak efficiency case. A direct comparison can be madebetween the current CFD results and the right-most data points(circled) in both the experimental data and the previous CFDresults of Copeland et al. since these represent exactly the samepartial admission condition modelled in this study.
From Fig. 7 it seems that the current CFD model predicts thenormalised efficiency of the turbine to be around 22% higher thanwas measured on the experimental case, although the currentcomputational analysis does fit quite well with the trend predictedby the CFD model of Copeland et al. (2010). Given the fact thatmesh density seemed to impart little influence on the predictionof turbine performance in the single passage analysis, it is notsurprising that the current CFD analysis aligns well with the modelof Copeland et al. despite the current mesh being an order of
magnitude larger. It is worthwhile to note however, that the pre-diction of the ratio of pressures between the two limbs matchesthe experimental values more closely in the current case comparedto the previous analysis of Copeland et al. The current computa-tional analysis predicts the ratio of pressures between the innerlimb and the outer limb to be 1.777, this compares well to theexperimentally measured value of 1.745, the CFD analysis of Cope-land et al. predicted 1.864.
Although it was not shown that this mesh should necessarilygive a grid independent solution, the high spatial refinement maybe expected to ensure that the flow field is predicted with a rea-sonable degree of accuracy. Unfortunately no experimental dataexists to enable validation of the predicted flow field. From the sin-gle passage analysis however the current mesh obtained a fairagreement with the experimental data in terms of turbine perfor-mance. Considering this one may assume that the performance ofthe turbine in the partial admission case should also be reasonablywell predicted; this leads to a question of the origin of the discrep-ancy seen in Fig. 7, which is much larger than any discrepancy inthe single passage analysis.

0.0
0.5
1.0
1.5
2.0
2.5
360270180900
Nor
mal
ised
Ent
ropy
Gen
erat
ion
Position (degrees)Exit Tip
Exit PassageSS Tip
PS Tip
SS PassagePS Passage
Interspace
Stator
E F
Flowing Entry Non-Flowing Entry
Direction of Rotation
D
Fig. 9. Distribution of entropy generation against position in the partial admissioncase at a single instance in time, the sections corresponding to the flowing and non-flowing sections have been marked, the rotation direction is shown. Operatingpoints D–F relate to Fig. 10. The angular position of the turbine can be seenphysically in Fig. 11.
A D E F
Nor
mal
ised
Ent
ropy
Gen
erat
ion
Operating Point
Exit Tip
Exit Passage
SS Tip
PS Tip
SS Passage
PS Passage
Interspace
Stator
0
0.2
0.4
0.6
0.8
1
1.2
1.4
1.6
1.8
2
Fig. 10. Distribution of entropy generation within a single turbine passage atdifferent operating points of the turbine: including the full admission peakefficiency case (A, see Fig. 6) and at three points through the flowing sector in thepartial admission case (D–F, see Fig. 9).
76 P. Newton et al. / International Journal of Heat and Fluid Flow 33 (2012) 70–80
In order to understand the incongruity between the computa-tional and experimental results it is necessary to look at the differ-ences between the two. The most obvious effect is that of windageon the back face of the rotor wheel. Using a correlation given byJapiske and Baines (1994) an approximate value of torque exertedon the rotor wheel due to windage was calculated. In this case itwas found that windage would have less than a 0.5% effect onthe shaft power output of the turbine. Clearly this cannot accountfor the large disparity between the computational and experimen-tal results.
Perhaps a more significant effect is in the calculation of turbinetorque. Using the maximum experimental uncertainty in torquemeasurement given by Copeland (2009) this leads to a discrepancyin the measured power output of the turbine of less than 1%, thisvalue however, is based upon the measurement of a constant tor-que. The CFD model predicts a time dependant cyclic torque curvewith a period equivalent to one rotor blade pitch of rotation (30�)with amplitude of 10% of the mean average torque. This is due to amomentary large torque experienced by each blade as it movesfrom the stagnant region of the volute to the flowing region, wherea jet of fluid from the first nozzle passage in the flowing sector im-pinges on rotor blade. This effect was also evident in the analysis ofCopeland et al. (2010). In the experimental case a single torquemeasurement was taken from the dynamometer which was as-sumed to be the average turbine torque: it is not clear that this va-lue will correspond to the mean average value used to calculate theturbine efficiency in the CFD analysis. Although this is not neces-sarily an error it does introduce an uncertainty of up to ±10% inthe predicted torque. Unfortunately, to resolve this cyclic torquebehaviour in the experimental case is unfeasible due to the veryhigh frequency nature of these pulsations, nearly 10 kHz at this ro-tor speed. Consequently it is difficult to quantify this effect withthe current experimental data set.
Fig. 8 shows a closer comparison between the CFD analysis andthe experimental data for the isentropic throat area, the discrep-ancy is on the order of 3% in this case. Again the current CFD modelaligns well with the trend predicted by Copeland et al. but with abetter prediction of the ratio of pressures between the two limbs.
4.2.2. Passage lossesFig. 9 shows the distribution of entropy generation within the
nozzle and rotor wheel for the partial admission case. The resultsare plotted against the angular position to show how the loss dis-tribution changes around the periphery of the rotor wheel. This fig-ure represents a snapshot of the loss distribution in the turbinetaken at a single instance in time. In the stator this gives a resolu-tion of 15� since there are 24 nozzle vanes, however in the rotorthere are 12 blade passages giving a resolution of 30�. This is equiv-alent to calculating the loss distribution in a single rotor blade pas-sage at 12 instances in time, each 30� of rotation apart. Thenormalisation value was taken as the total entropy production inthe nozzle and rotor for 1 passage in the full admission, peak effi-ciency case (operating point A in Fig. 6).
Integration of the total entropy production in the flowing andnon-flowing sections in Fig. 9 reveals that the total entropy gener-ation in the non-flowing sector of the volute is about 8% higherthan that in the flowing sector. The loss in the non-flowing sectoris primarily due to the dissipation of mechanical energy associatedwith turning the rotor wheel through the stagnant region of thevolute, this must be taken from the useful work developed in theflowing section of the turbine. This sharply demonstrates whythe efficiency of the double entry turbine drops so much underthe partial admission condition and suggests that minimisationof energy dissipation in the non-flowing sector could have asignificant impact on the performance of this double entry turbineunder partial admission conditions. However, significant entropy
generation in the non-flowing sector is not the only adverse effectof partial admission. Although the conditions driving the turbine inthe flowing sector of the volute are very near to those driving theturbine at peak efficiency, it is clear that the loss distribution isvery different from the equivalent full admission case.
Fig. 10 shows a breakdown of the losses at four different oper-ating points, including the full admission, peak efficiency case (A),

Fig. 11. Contour of normalised entropy generation rate at 50% span, the numbers correspond to the same features seen in Fig. 12, the angles correspond to those in Fig. 9. Theinner (flowing) and outer (non-flowing) limbs have been marked.
P. Newton et al. / International Journal of Heat and Fluid Flow 33 (2012) 70–80 77
and three points throughout the flowing sector of the volute in thepartial admission case (D–F). Operating point A is indicated inFig. 6, points D–F can be seen in Fig. 9. The same normalisation va-lue was used in Figs. 9 and 10.
At the start of the flowing section (operating point F in Figs. 9and 10) there is a large contribution from the pressure side andsuction side passage sections (PS Passage and SS Passage) and alsothe Interspace region. This is a clear departure from the full admis-sion peak efficiency case which sees very little entropy generationin these areas. As the wheel rotates, moving from operating pointsF to E and then to D, the entropy production in these areas dimin-ishes, moving towards a loss distribution which resembles moreclosely that of the full admission peak efficiency case although itdoes not seem to reach full development before returning to thenon-flowing sector. Even at the end of the flowing sector (operat-ing point D) the passage losses are 17% higher than those in the fulladmission case although the breakdown of losses is similar.
In the non-flowing entry the loss distribution shows an evenlarger departure from any full admission case for the whole section(see Fig. 9) this is due to the turbine wheel acting in a whole differ-ent regime. In the non-flowing entry the turbine is acting more likea very inefficient compressor as it is being driven through the flowinstead of extracting useful work from the fluid.
Fig. 11 shows a contour plot of entropy generation within thevolute, nozzle and rotor wheel at 50% of blade span. The normali-sation value was chosen based on optimum visualisation of regionsof high entropy production. This plot can be used to explain someof the features seen in Fig. 9 although in order to examine the flowfield in the partial admission case more fully it is also useful to sur-vey the vorticity. Vorticity is a useful concept because in one senseit relates directly to the flow field, showing the local rate of rota-tion of the fluid, but it also acts as an indication to the creationof turbulence. Ultimately turbulence will lead to the dissipationof mechanical energy, which is the primary interest of this study.Fig. 12 shows contours of vorticity magnitude at 20%, 50% and80% of blade span. In this figure the constant span plots have beenunwrapped such that the whole 360� of the nozzle ring and turbinewheel have been represented in a linear blade to blade plot, theflowing and non-flowing entries have been shown. Although mostof the following commentary refers to the 50% span plot it is clear
that many of these features are also directly evident in the plots at20% and 80% of blade span.
On examination of the flow field in the non-flowing section ofthe rotor wheel it becomes clear that there are several major ef-fects causing loss generation. In the first nozzle passage of thenon-flowing section (Feature 1 in Fig. 12) there is an intense regionof vorticity. This is due to leakage from the adjoining higher pres-sure limb through a gap between the volute tongue and the con-necting stator blade leading to a region of circulating flow withinthe nozzle passage. Evidence of this effect is also visible inFig. 11 which shows significant entropy generation in the first noz-zle of the non-flowing section (Feature 1), and in Fig. 9 whichshows a spike in the entropy generation within the stator at thestart of the non-flowing section. Although this seems a small effect,Fig. 9 shows the generation of entropy in this area to be a signifi-cant contributor to the overall entropy generation within the tur-bine. A similar phenomenon is observed in the last nozzle of thenon-flowing sector.
Downstream of this nozzle blade there is a shear layer wherethe high velocity fluid from the adjoining limb mixes with the low-er velocity fluid in the non-flowing region (Feature 2 in Figs. 11 and12). This effect is perhaps the most significant contribution to thehigh entropy generation seen in the Interspace region in the non-flowing section in Fig. 9 and seems to be one of the most significantareas of mechanical energy dissipation in the whole turbine.
Referring to Fig. 9, the next most significant loss in the non-flowing section comes from within the blade passage (PS Passageand SS Passage). The contribution of these areas is seen to increaseas the rotor wheel moves through the non-flowing section (movingin the direction of rotation in Fig. 9). This can be primarily attrib-uted to the development of strong vortices on the leading and trail-ing edges of the rotor blade (Features 3 and 4 in Figs. 11 and 12). Asthe rotor passage first enters the non-flowing section of the voluteit is evident that the fluid within the passage has considerablemomentum and does not stop flowing instantaneously, this helpsto delay the development of these vortices however, by the timethe rotor passage has reached the 4th or 5th nozzle in the non-flowing section, the flow within the rotor passage has slowed con-siderably. Referring to the vortex on the leading edge of the blade(Feature 3), as the rotor continues to turn, the slow moving fluid in
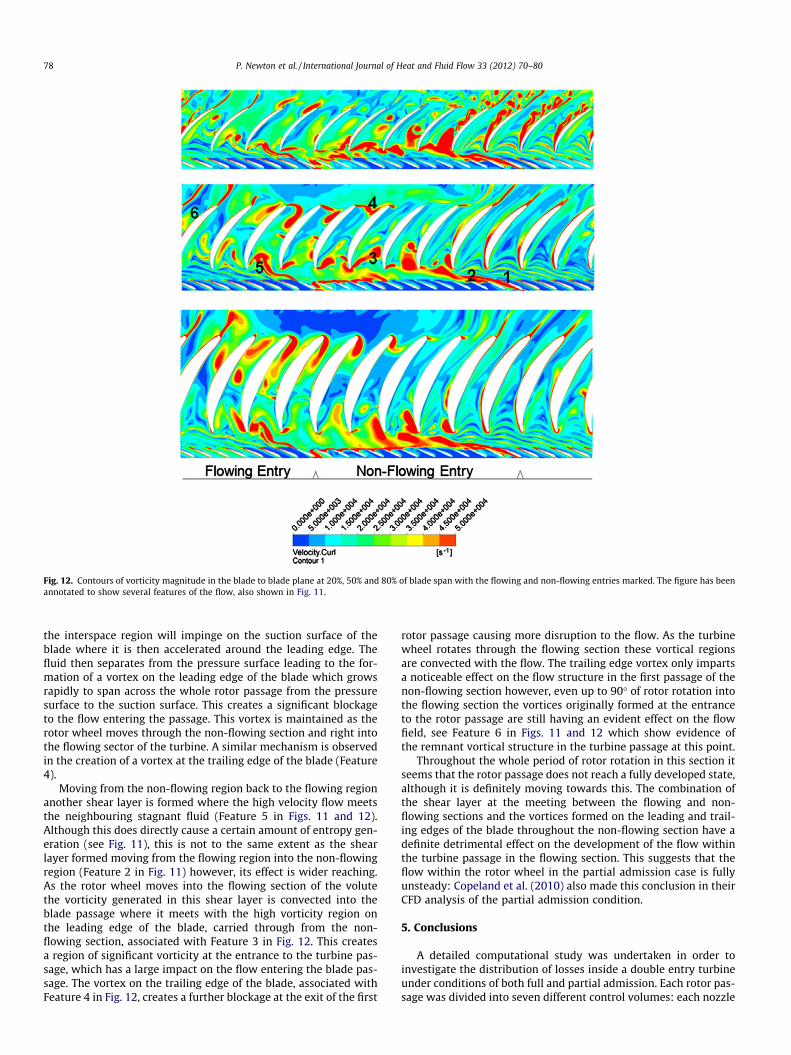
Fig. 12. Contours of vorticity magnitude in the blade to blade plane at 20%, 50% and 80% of blade span with the flowing and non-flowing entries marked. The figure has beenannotated to show several features of the flow, also shown in Fig. 11.
78 P. Newton et al. / International Journal of Heat and Fluid Flow 33 (2012) 70–80
the interspace region will impinge on the suction surface of theblade where it is then accelerated around the leading edge. Thefluid then separates from the pressure surface leading to the for-mation of a vortex on the leading edge of the blade which growsrapidly to span across the whole rotor passage from the pressuresurface to the suction surface. This creates a significant blockageto the flow entering the passage. This vortex is maintained as therotor wheel moves through the non-flowing section and right intothe flowing sector of the turbine. A similar mechanism is observedin the creation of a vortex at the trailing edge of the blade (Feature4).
Moving from the non-flowing region back to the flowing regionanother shear layer is formed where the high velocity flow meetsthe neighbouring stagnant fluid (Feature 5 in Figs. 11 and 12).Although this does directly cause a certain amount of entropy gen-eration (see Fig. 11), this is not to the same extent as the shearlayer formed moving from the flowing region into the non-flowingregion (Feature 2 in Fig. 11) however, its effect is wider reaching.As the rotor wheel moves into the flowing section of the volutethe vorticity generated in this shear layer is convected into theblade passage where it meets with the high vorticity region onthe leading edge of the blade, carried through from the non-flowing section, associated with Feature 3 in Fig. 12. This createsa region of significant vorticity at the entrance to the turbine pas-sage, which has a large impact on the flow entering the blade pas-sage. The vortex on the trailing edge of the blade, associated withFeature 4 in Fig. 12, creates a further blockage at the exit of the first
rotor passage causing more disruption to the flow. As the turbinewheel rotates through the flowing section these vortical regionsare convected with the flow. The trailing edge vortex only impartsa noticeable effect on the flow structure in the first passage of thenon-flowing section however, even up to 90� of rotor rotation intothe flowing section the vortices originally formed at the entranceto the rotor passage are still having an evident effect on the flowfield, see Feature 6 in Figs. 11 and 12 which show evidence ofthe remnant vortical structure in the turbine passage at this point.
Throughout the whole period of rotor rotation in this section itseems that the rotor passage does not reach a fully developed state,although it is definitely moving towards this. The combination ofthe shear layer at the meeting between the flowing and non-flowing sections and the vortices formed on the leading and trail-ing edges of the blade throughout the non-flowing section have adefinite detrimental effect on the development of the flow withinthe turbine passage in the flowing section. This suggests that theflow within the rotor wheel in the partial admission case is fullyunsteady: Copeland et al. (2010) also made this conclusion in theirCFD analysis of the partial admission condition.
5. Conclusions
A detailed computational study was undertaken in order toinvestigate the distribution of losses inside a double entry turbineunder conditions of both full and partial admission. Each rotor pas-sage was divided into seven different control volumes: each nozzle

P. Newton et al. / International Journal of Heat and Fluid Flow 33 (2012) 70–80 79
blade was taken as a single control volume. The concept of entropygeneration rate was used to calculate the magnitude of loss withineach control volume.
Ten conditions of full admission were simulated at 90% speedusing a single passage turbine model. The prediction of turbineefficiency by the single passage model exhibited a reasonableagreement with the experimental data, the peak efficiency waspredicted within 5% of the measured value. The CFD model did pre-dict a steeper decline in efficiency with increasing velocity ratiothan was measured on the experiment, leading to larger discrepan-cies in the lower power region of the performance curve. The pre-diction of mass flow by the CFD analysis was very good, beingwithin 3% of the measured experimental values presented byCopeland (2009) for the whole range of data and significantly clo-ser at conditions of higher power.
For the peak efficiency case the main area of loss generationwas associated with the tip leakage loss. This is a parameter thatturbine designers already endeavour to minimise. Although furtherreduction in the tip gap clearance may be possible, especially onthe experimental turbine used in this study, this is can be difficultto achieve on a production exhaust turbocharger whilst maintain-ing the necessary mechanical integrity of the turbine. For the high-er velocity ratio conditions (lower pressure ratio) the mostsignificant loss was found to result from a large separation onthe pressure side of the blade due to a highly negative incidenceangle in this case. The opposite was true of the high pressure ratio(low velocity ratio) case which saw a positive incidence angle, thisled to a separation on the suction side of the blade though not assevere.
In order to allow simulation of the partial admission condition afull turbine model was created incorporating the volute, 24 nozzlepassages, 12 rotor passages and an exit duct. This contained over14 million mesh nodes in total. A single partial admission condi-tion was simulated, the boundary values were taken directly fromexperimental measurements. Good agreement was found with theexperimental results in the prediction of the isentropic flow area.This result aligned well with the previous computational resultsof Copeland et al. (2010). The prediction of turbine efficiency didnot match the experimental data as closely but again did align wellwith the CFD analyses of Copeland et al. Although some differencewould be expected between the computational and experimentalresults, further research would be required to fully account for thisdiscrepancy.
An entropy audit was carried out using the same control vol-umes in each blade passage as those defined for the full admissioncase. This made it possible to compare the distribution of losseswithin the turbine in the full and partial admission cases and toidentify the main areas leading to increased losses in the partialadmission case. It was found that the generation of entropy inthe non-flowing sector of the turbine was similar in magnitudeto the generation of entropy in the flowing sector of the turbine.This will have a significant effect on the turbine efficiency sincethe power associated with generating this entropy in the non-flow-ing section will be taken from the useful shaft work developed inthe flowing section of the turbine. Minimisation of these lossescould have a significant effect on the turbine performance, evenif the efficiency of the turbine in the flowing section of the volutewere compromised. The loss distribution in the partial admissioncase was very different to that seen in any full admission case forboth the flowing and non-flowing sectors.
An analysis of the flow field within the partially admitted tur-bine was undertaken in order to identify the sources of theselosses. One of the most significant areas of entropy generation inthe whole turbine was associated with the shear layer formedbetween the flowing and the non-flowing regions. This was evidentat both tongues although the effect was most severe where the
turbine wheel moves from the flowing section into the non-flow-ing section. By itself this area represents a meaningful portion ofthe overall entropy generation within the turbine system. This im-plies that the turbine nozzle ring should be an area of concern infuture turbocharger design, for example by experimentation withdifferent nozzle–rotor gaps or different nozzle stagger angles.
Another important area of entropy generation in the non-flow-ing section is at the leading and trailing edges of the blade pressuresurface where vortices are formed as the rotor wheel is driventhrough the stagnant fluid. Not only does the shearing of the fluid,associated with these vortical structures, cause a significantamount of entropy generation but they also have a wider effectas they are carried through to the flowing section of the turbine.Here they impact on the passage flow structure, blocking the flowentering and exiting the passage.
As the rotor moves through the flowing region these vorticalstructures are convected through the passage. It is evident thatthe passage flow is moving towards a fully developed statealthough it is clear that this is not reached before the rotor wheelmoves back to the non-flowing section. This shows that the rotorwheel in a partially admitted double entry turbine is operating ina fully unsteady regime, even though the conditions driving theturbine are time invariant.
Although this work has served to increase the understanding ofthe partially admitted double entry turbine it could be extended tolook at different conditions of unequal admission. The ultimate aimhowever, would be to apply the techniques used in this study to acomputational analysis of a double entry turbine under pulsedoperation.
References
Baines, N.C. et al., 2003. Axial and Radial Turbines. Concepts ETI, Inc. ISBN0933283121.
Benson, R., 1974. Nonsteady flow in a turbocharger nozzleless radial gas turbine. In:SAE National Combined Farm, Construction and Industrial Machinery andPowerplant Meetings, September 9–12. SAE Paper 740739.
Benson, R.S., Scrimshaw, K.H., 1965. An experimental investigation of non-steadyflow in a radial gas turbine. In: IMechE Conference Proceedings 1964–1970, vol.180, pp. 74–85.
Copeland, C.D., 2009. The Evaluation of Steady and Pulsating Flow Performance of aDouble-entry Turbocharger Turbine, PhD Thesis, Imperial College London.
Copeland, C.D., Martinez-Botas, R.F., Seiler, M., 2008. Unsteady performance of adouble entry turbocharger turbine with a comparison to steady flow conditions.In: Proc. ASME Turbo Expo 2008 GT2008-50827. pp. 1579–1588.
Copeland, C.D., Newton, P., Martinez-Botas, R.F., Seiler, M., 2010. Unequal admissionin a double-entry turbocharger turbine. In: Proc. ASME Turbo Expo 2010GT2010-22212.
Copeland, C.D., Martinez-Botas, R.F., Seiler, M., 2011. Comparison between steadyand unsteady double-entry turbine performance using the quasi-steadyassumption. J. Turbomachin. 133 (3).
Denton, J.D., 1993. The 1993 IGTI scholar lecture: loss mechanisms inturbomachines. J. Turbomachin. 115 (4), 621–657.
Greitzer, E., Tan, C., Graf, M., 2004. Internal flow: concepts and applications.Cambridge University Press ISBN 0521343933.
Japiske, D., Baines, N.C., 1994. Introduction to Turbomachinery. Concepts ETI Inc.ISBN 0-933283-10-5.
Kock, F., Herwig, H., 2005. Entropy production calculation for turbulent shear flowsand their implementation in CFD codes. Int. J. Heat Fluid Flow 26 (4), 672–680.
Mizumachi, N., Yoshiki, H., Endoh, T., 1979. Study on Performance of Radial Turbineunder Unsteady Flow Conditions. Report of the Institute of Industrial Sciencethe University of Tokyo, vol. 28(1).
Moore, J., Moore, J.G., 1983a. Entropy production rates from viscous flowcalculations part i – a turbulent boundary layer flow. In: Proc. ASMEInternational Gas Turbine Conference and Expo 1983 83-GT-70. Phoenix, AZ,USA.
Moore, J., Moore, J.G., 1983b, Entropy production rates from viscous flowcalculations part ii – flow in a rectangular elbow. In Proc. ASME InternationalGas Turbine Conference and Expo 1983 83-GT-71. Phoenix, AZ, USA.
Pischinger, F., Wunsche, A., 1977, The characteristic behavior of radial turbines andits influence on the turbocharging process. In: Proc. International Congress onCombustion Engines, Tokyo, Japan.
Pullan, G., Denton, J., Curtis, E., 2005. Improving the performance of a turbine withlow aspect ratio stators by aft-loading. In: Proc. ASME Turbo Expo 2005,GT2005-68548.
Sciubba, E., 1997. Calculating entropy with CFD. ASME Mech. Eng. 119(10), 86–88.

80 P. Newton et al. / International Journal of Heat and Fluid Flow 33 (2012) 70–80
Wallace, F.J., Blair, G.P., 1965. Pulsating-flow performance of inward radial-flowturbines. In: Proc. ASME Meeting GTP-21, February 28–March 4.
Wallace, F.J., Miles, J., 1970. Performance of inward radial flow turbines underunsteady flow conditions with full and partial admission. In: Proc. IMechE1847–1982 vol 185, 185 77/71, pp 1091–1106.
Wallace, F.J., Adgey, J.M., Blair, G.P., 1969. Performance of inward radial flowturbines under non-steady flow conditions. In: Proc. IMechE 1847–1982, vol.184, pp. 183–195.
Watson, N., Janota, M.S., 1982. Turbocharging the Internal Combustion Engine. TheMacMillan Press Ltd., p. 275 ISBN 0 333 24290 4.