an attractive niche - jamie anderson · zopa introduction the bursting of the dot-com bubble in the...
TRANSCRIPT
Zopa.com
This case study was written by Martin Kupp and Jamie Anderson of the European School of Management and Technology. esmt cases are written solely as the basis for class discussion, and are not intended as endorsements, sources of primary data, or to represent either effective or ineffective handling of a management situation. Copyright © European School of Management and Technology, 2006
2006-case-20

Zopa
Introduction The bursting of the dot-com bubble in the fall of 2001 marked a turning point in attitudes towards the implications of the Internet for business, and many people concluded that the web phenomenon had been over hyped. But the year 2006 saw a strong return of attention by companies, the media and consumers for new Internet-enabled business ideas. Far from having "crashed", the web seemed more important than ever, with exciting new applications and sites popping up with surprising regularity. One of the new Internet firms grabbing headline attention was Zopa, a UK-based peer-to-peer online brokerage that coupled British residents who wanted to lend with those who wanted to borrow. Lenders proffered money not to individuals but to a pool of people grouped together because of similar creditworthiness. Launched in March 2005, Zopa started with just 300 members, but within just a few months had grown to more than 25,000 users. By November 2006 about 120,000 people had signed up, and more than £100,000 was being lent every day. Since Zopa was not technically a bank and didn't lend money itself, the capital requirements to run the business were relatively small. Zopa’s CEO James Alexander pondered the meteoric growth of his fledgling company. Some banking industry analysts believed that Zopa could do to retail lending what Skype, an Internet-enabled peer-to-peer communication technology, had done to the telecom industry by disinter-mediating incumbents. But what was so unique about this fledgling online venture? How might Zopa challenge the global giants of the retail financial services industry? And what might be the response of the established retail and online banks? The UK Financial Service Industry The financial services market in the UK had evolved significantly since the 1980s. The main banks had undergone a substantial degree of consolidation, and supermarkets such as Tesco and Sainsbury’s, as well as Internet banks had entered the market for financial services. Although the traditional high street banks still held a majority share of the banking market, other organizations were gaining increasing shares. While historically most people had been loyal to one bank, British people were becoming increasingly willing to switch banks, or hold several accounts with different institutions. While older people still tended to stick with high street banks, both Internet and supermarket banks continued to win over young customers, by offering new technology, accessibility, competitive rates and customer service. The banking and payment system could be divided into five distinct groups:
traditional high street banks •
•
•
•
•
former building societies online banks credit card companies retailers providing financial services
Traditionally the banking and payment system in the UK was managed through the network of high street banks, which competed with each other. Customers would typically select one bank with which they would open appropriate banking accounts (for example, a current account, or a savings account). Visiting the nearest branch of that bank was an important part of the transaction process – whether paying in cheques or withdrawing cash – so that accessibility was of key importance. But the advent of other forms of banking and payment systems had reduced the role of the bank network significantly, leading to a process of consolidation and branch closures. The industry had become highly concentrated by 2005, with the top five players accounting for almost 70% of market share.
2006-case-20
2 © 2006 esmt, Berlin, Germany

Zopa
Figure 1 - Retail Banks Corporate Overview 2005 Companies AV. sales growth % Market share % Royal Bank of Scotland 15.9 20.0 Barclays Plc 7.7 17.0 HBOS Plc 16.2 14.0 HSBC Bank Plc 9.2 9.0 Lloyds TSB 0.8 8.0 Source: Euromonitor The Royal Bank of Scotland (RBS) was the largest UK retail bank by 2005, with 2,274 branches that offered its almost 14 million personal customers approximately seventy different services across a range of deposit accounts, credit cards, investment products, personal loans, mortgages and insurance. Similarly to high street banks such as Barclays, Lloyds and HSBC, approximately 55% of RBS’s customers were over the age of 45. Some 59% of RBS customers were in the ABC1 segments, and more than 60% were Internet users. In 2005 RBS Retail Banking had a net income of £5.43 billion. As with many UK retail banks, RBS had strategically repositioned to focus upon advisory services, and in 2005 introduced a new ‘Customer Service Review’ that enabled its branch staff to run a comprehensive financial health check tailored to a customer’s individual circumstances. To complement this advisory approach, RBS had added nearly 800 people to its branch networks, including more than 200 specially trained Financial Planning Managers, and launched a range of new investment products to provide its customers with more choice. The bank had also continued its branch refurbishment program aimed at making its locations more attractive, and increased the number of branches open on Saturdays. RBS had the largest ATM network in the country, and also offered online and telephone banking. UK banks such as RBS were more profitable than the European average and were well capitalised, but faced a tough competitive environment. Net interest income as a percentage of the average balance sheet total had decreased considerably since the mid-1980s, but despite this trend net interest income still accounted for around 60% of the total income of the large UK-owned banks and remained important for the overall profitability of the industry (see Exhibit A for a breakdown of bank profit by product type). Major changes in customer behavior patterns, the growing importance of the capital markets for both investment and funding purposes, and a significant presence of independent financial advisors (IFAs) in products such as mortgages (around 55% of UK mortgages were intermediated in 2005), asset management and insurance had made diversification into ‘non-traditional’ banking products challenging. Many banks in the UK had struggled to boost their insurance and asset management cross selling, and given that fewer than 5% of current accounts and life insurance policies were ‘churned’ every year this also made increased cross-sell ratios on basic ‘bread-and-butter’ products difficult. With increased commoditisation of mass-market retail banking, declining customer inertia and an overall trend towards product simplification, one of the major decisions UK retail banks had to deal with was to what extent they should use price driven strategies in order to boost client acquisition/cross-sell. (See Appendices B and C for the profit breakdown for UK banks by product type). In a tough competitive environment, industry spending on advertising had grown strongly – spending on personal loan advertising alone totalled more than £200 million in 2005, with about half of this spent on direct mail. The former building societies competed directly with the established retail banks and catered largely to clients in the 35-49 age group. This group was dominated by married couples and families, which were also fairly affluent, with annual incomes in excess of £30,000, and the sector tended not to attract the 18-24 age group. Although originating
2006-case-20
3 © 2006 esmt, Berlin, Germany

Zopa
primarily as mortgage lenders, the former building societies had extended their remit, either through mergers and acquisitions or by repositioning their product offering, to encompass the range of banking and payment services offered by traditional high street banks. Online banks were already very popular among the younger age groups, and were well placed to attract the much sought-after graduate market away from the traditional providers. Approximately 60% of UK adults had access to the Internet by end 2005, which equated to more than 28 million people. Almost half (45%) of all Internet users had a financial account that was accessed online. But the predominant group making frequent use of online banking services was those aged 25-45, who were more comfortable with new technology and felt less need for one-to-one contact. Heavy Internet users tended to be more affluent, and were also more likely than average to have at least one investment product in addition to a deposit or savings account. There were still very few online bankers among the over 50s, although their number was growing. Furthermore, online banking was dominated by male customers, who were more likely to be cohabiting or separated with children aged 10 years and under. The annual income in this group ranged from £30,000 to £75,000. For profiles of UK Internet users see Exhibit C, and for data on online purchase of financial services products see Exhibit D. Founded in 1998 the wholly owned subsidiary of insurer Prudential plc, UK-based Egg was the UK’s largest online bank with more than 3.7 million customers, some 2,700 employees, and a 2005 net income of £84 million. The company had established a strong brand and targeted young (25-45), well-educated, tech-savvy consumers. Egg was the first standalone Internet bank to be launched in the UK and consequently benefited from first-mover advantage (its main standalone rivals Smile, Cahoot and Intelligent Finance were launched in October 1999, June 2000 and September 2000 respectively). The bank initially pushed ahead with loss-leader savings rates and these rates helped it establish a large customer base. Since the company used a branchless distribution model, advertising played a key role in establishing a brand identity in the market. This was typical of the online, direct banking and specialist loan companies who represented ten of the top twenty advertising spenders on personal loan promotions in the UK in 2005. Just three of Egg’s main competitors, Loans.co.uk, Lombard Direct and Direct Line Financial Services, had spent a combined £65 million on advertising in the UK during 2004-2005. Although Egg no longer provided market-leading rates on its savings accounts by end 2005, it was again pursuing a loss-leader strategy with its credit card business, providing 0% interest for the first six months. The company relied on net interest from savings accounts, personal loans and credit cards for the bulk of its income, but was also looking to grow commission income by cross-selling an expanding spectrum of investments, mortgages and insurance. Users could apply for the Egg Card (which about 80% of the site's users held), a credit card that paid cash back on purchases of retail products available on the site. In 2003 Egg had attempted to penalize customers for using the telephone to contact customer service, but soon realized that the extra support was necessary and as of end 2005 provided a 24-hour telephone service facility for all customers. Credit card companies tended to have a slightly older customer age profile than their online counterparts, at 25-49 years. These customers were often cohabiting or divorced, and tended to have children aged 15 years or younger. They had the lowest income levels compared with the other four banking types, with annual salaries ranging between £13,500 and £50,000. Competition in the credit-card segment had become increasingly intense, and some retail financial services firms, such as online bank Egg, had introduced limited 0% interest offers on credit cards to protect or gain market share. Supermarkets such as Tesco and Sainsbury were relatively new entrants to the banking market, effectively combining the accessibility of a high street bank with the convenience of an online service. The supermarkets’ position was also enhanced by the significant degree of loyalty that existed among their customer base, and they typically offered a limited range of credit-card, loan and term deposit products, although some companies had also moved into mortgages. Supermarkets appealed to a mature market, with customers typically in the 40-59 age group
2006-case-20
4 © 2006 esmt, Berlin, Germany
Zopa
and married, with either a mortgaged property or one that was owned outright. Their incomes ranged between £25,000 and £100,000, and were more likely to be at the upper end of the scale. Consumer Behavior Savings in the UK had increased consistently since the mid-1990s, reflecting overall improvements in the country’s economic climate, rising employment levels, and higher personal and disposable incomes. Savings and investment levels tend to be highest amongst the elderly population and lowest amongst the very young and families with children. The most common uses for savings in the UK included home improvements, cars and holidays. There were many different types of savings accounts available in the UK, offering varying interest rates and varying penalties for instant withdrawal. Interest was usually calculated as a percentage of the amount in the account, and was calculated on a daily basis. The most popular type of account was the current account, which attracted very little interest but offered instant access, and usually allowed people to draw cheques or withdraw cash using an ATM. Salaries were usually paid directly into a current account. Exhibit E shows savings product ownership across different consumer segments.
In terms of bank lending (excluding mortgages), overdrafts were the most popular form of short-term borrowing due mainly to greater flexibility; once an overdraft had been agreed it could be used by the account holder at any time, and there were no set times to repay the money. The downside was that a bank overdraft was typically more expensive than a personal loan if regularly used, and could be very expensive if the account holder exceeded the agreed limit. Many current account holders who made regular/monthly contributions to their account were given an authorized overdraft up to a certain limit, usually between £500 and £2,000, depending on income and other factors.
Credit cards were by far the most popular source of credit, with 29% of people having a balance outstanding on their credit card which was more than three times the proportion who had a personal loan (8%). While most individuals used credit cards as a source of short-term borrowing, some did have large balances which they regularly transferred to new cards in order to take advantage of low or 0% introductory rates. They therefore competed with personal loans. According to the Association for Payment Clearing Services (APACS) there were 20 million personal debit cardholders and 30.6 million credit cardholders in the UK, in 2004, with the average adult holding 3.6 cards (1.6 debit and 2.0 credit cards). Average spending levels on each plastic card in the UK increased by 21.8% between 2000 and 2005, although this level flattened to only 2% growth during first-half 2006, reflecting increasing consumer nervousness about borrowing. APACS reported that 73% of all credit card purchases in 2005 were made by people who repaid their balance in full each month.
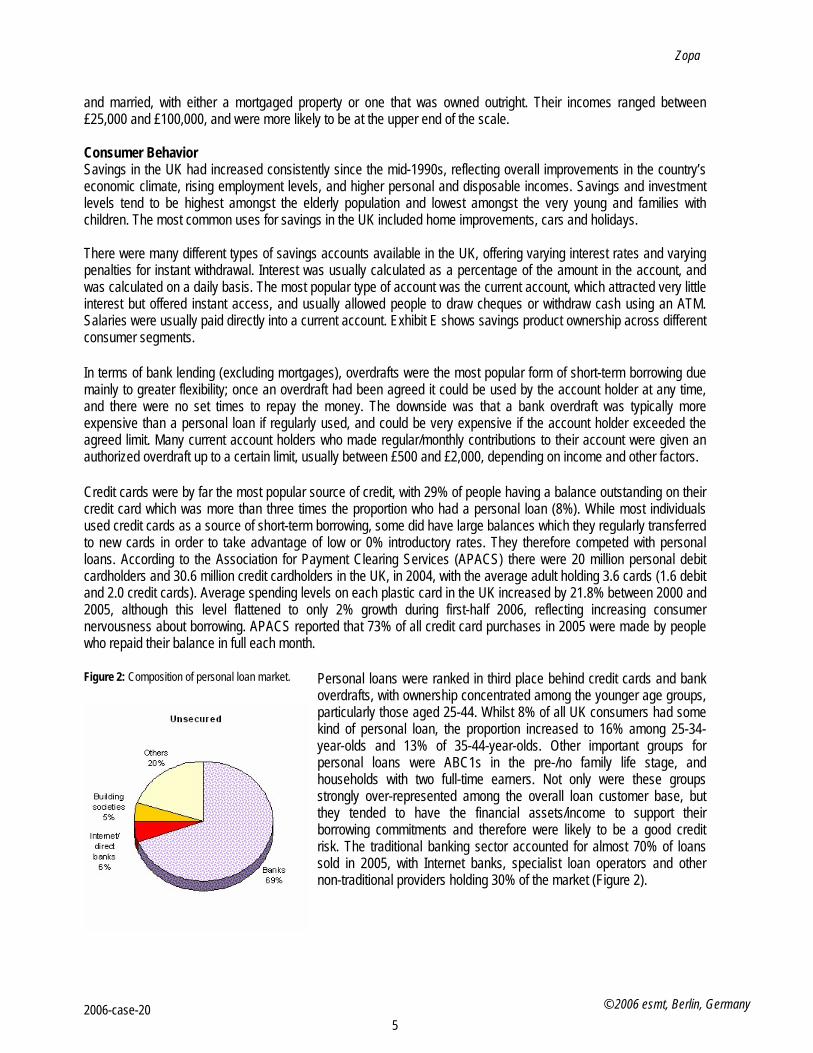
Figure 2: Composition of personal loan market. Personal loans were ranked in third place behind credit cards and bank overdrafts, with ownership concentrated among the younger age groups, particularly those aged 25-44. Whilst 8% of all UK consumers had some kind of personal loan, the proportion increased to 16% among 25-34-year-olds and 13% of 35-44-year-olds. Other important groups for personal loans were ABC1s in the pre-/no family life stage, and households with two full-time earners. Not only were these groups strongly over-represented among the overall loan customer base, but they tended to have the financial assets/income to support their borrowing commitments and therefore were likely to be a good credit risk. The traditional banking sector accounted for almost 70% of loans sold in 2005, with Internet banks, specialist loan operators and other non-traditional providers holding 30% of the market (Figure 2).
2006-case-20
5 © 2006 esmt, Berlin, Germany

More than 65% of the traditional banks’ personal loan customers were over the age of 35, while more than 50% of the non-traditional providers’ customers were under 35. Exhibit F shows the penetration of different lending products by customer segment. UK consumers had become increasingly price sensitive when selecting financial services products, with a 2006 survey by the Financial Services Authority (FSA) revealing that almost two in five people had based their choice of credit card or savings account on the rate of interest charged or paid. Another trend had been the growing willingness of UK consumers to utilize the services of several providers, with almost 40% of consumers holding financial services products with three or more different institutions. According to a report on evolving consumer attitudes towards retail banking by market research company Mintel in mid-2006:
“Convenience is no longer an issue for most consumers when it comes to arranging financial products; what matters more than convenience is price. Put simply, customers will not want to do business with providers that do not offer competitive products. Consumers are now more informed and empowered than they have ever been in the past, and they have access to a wealth of resources, such as the Internet, that enable them to judge whether or not they are getting a good deal. The lesson for providers is either that they need to improve the competitiveness of their products, or face losing customers to other providers. Even current account providers, who have previously relied on customer inertia to maintain a large customer base, will have to fight to hang onto their customers. Although only a small proportion of consumers have switched their current account provider, this proportion is expected to grow over the next five years. Players in the retail banking industry will have no choice but to cater to this new, demanding breed of consumer, because if they do not, someone else will.” Source: Mintel, Retail Banking Overview - UK - October 2005
As of September end 2006, seasonally adjusted net lending to UK individuals for the year totalled £1.13 trillion, of which £939.5 billion was secured on dwellings and £190.8 billion was unsecured. Average borrowing on credit cards totaled £6,904 million per month up until end September 2006, while ending on personal loans and overdrafts averaged £2,518 million per month over the same period. The Birth of Zopa Zopa was co-founded by CEO Richard Duvall, chief financial officer James Alexander and ‘business architect’ David Nicholson. Duvall passed away after a battle with cancer in October 2006, and Alexander took over at the helm of the company. All were involved with Egg, the online bank. Alexander had been strategy director at Egg after joining in 2000, and previously had written the business plan for Smile, another online bank owned by the Co-operative. The founders were also joined at Zopa by Sarah Matthews, previously Egg’s brand development director. The company received funding from Benchmark Capital (also backed eBay), Bessemer Venture Partners (also backed Skype), Wellington Partners and private investors. £6 million was raised in October 2004 for UK activities, US$15m in February 2006 for US activities, and US$5m in May 2006 for ongoing UK activities. Zopa stands for ‘Zone of Possible Agreement’ which is a term from business theory. It refers to the overlap between one person’s bottom line (the lowest they’re prepared to receive for something they are offering) and another person’s top line (the most they’re prepared to pay for something). In practice, this approach underpins negotiations about the majority types of products and services. The idea for Zopa was born from market research conducted by the company’s founding team that showed there was a potential market of "freeformers" to be tapped in the retail financial services industry. “Freeformers” were defined as self-employed, project-based or freelance workers who were not in standard “full-time” employment. Consequently, their incomes and lifestyles could be irregular, although they may still have been assessed as credit worthy. These individuals were identified as being either underserved by, or non-consumers of, the services offered by existing financial services institutions. Examples of “freeformers” included consultants and entrepreneurs. Zopa’s consumer research indicated a large number of freeformers in the United Kingdom - possibly as many as 6 million “freeformers” of a total UK population of around 60 million. In the words of Zopa co-founder Richard Duvall: “it’s a group that’s growing really quickly. I think in 10 or 15 years time most people will work this way. It’s happening right across the developed world. We’ve been doing some research in the US and we think there are some 30 or 40
2006-case-20

Zopa
million people there with these attitudes and behaviours”. The management of Zopa believed that this emerging consumer group represented a significant opportunity for an innovative financial services provider. In the words of James Alexander: “they're people who are not understood by banks, which value stability in people's lives and income over everything else." Zopa’s management also believed that the considerable growth in Internet usage and online banking in the UK in recent years demonstrated consumers’ increasing confidence in using the Web for financial services. The vision of creating Zopa was to leverage the Internet to create a finance option for “freeformers” beyond traditional banks, and to provide a virtual community that was more in alignment with the independent culture and lifestyle of this growing social group. The Zopa Operating Model People joined Zopa online as either borrowers or lenders. Once registered, lenders could loan money to a pool of people grouped together because of similar creditworthiness. Zopa assessed the credit scores of borrowers using the same Equifax-based Credit ratings as used by UK retail banks and lenders, and only offered services to borrowers who achieved an A*-, A-, B- or C- rating. The company also engaged an identity checking agency to verify the identity of all lenders and borrowers. The company’s own team of underwriters individually assessed each borrowers ability to repay, and borrowers were then entered into Zopa’s own market making system which included A*, A, B and C lending pools. Zopa had applied for patents in the UK for software elements of its proprietary marketplace matching platform, but recognized that the broader concept of ‘P2P lending’ could not in itself be protected from imitation. Two other peer-to-peer lending sites (donjoy.net and prosper.com) had already been established in Korea and the United States.
By late 2006 the average borrower took a loan of £5,000 and the average lender deposited £3,000 per transaction. Repeat lenders tended to increase their deposit amounts steadily after joining, with many increasing their lending up to Zopa’s £10,000 limit. Only 0.05 percent of Zopa's loans had turned into uncollectible debts (see Exhibit G for Zopa’s bad debt rates across its different markets). Zopa CEO James Alexander believed that Zopa had partly achieved such low default rates by injecting a social aspect into lending. Zopa members were able to see the usernames of other members on the site whenever they lent or borrowed. While this did not typically include the member’s full name (unless they had chosen a username that matched their real name) or their address, other members could see generic details such as age, marital status, location and loan purpose. Lenders could see how much had been borrowed, at what rate and term, and track repayments. Borrowers were able to communicate with lenders, with messages typically being used to explain more about what they wanted a loan for, or just to say “thank you” after receiving credit. For example, one member ‘Pushkin’ left this message: “I am waiting for the pay out from the Halifax for the miss-selling of an endowment complaint that has been upheld. I want to do some work on my house before Christmas”. "If I borrow from real people," Alexander said, "I'm more likely to pay back than if I borrow from a faceless bank."
Lenders offered loans into a particular market that was defined by the credit rating of borrowers (Market A, Market B etc), and the term of the loan (12 months, 24 months etc) When lenders placed their money in a Zopa market, their money was lent in separate contracts of £10 each to at least 50 borrowers. The lenders offers, together with those of all the other lenders in a market, were ranked, firstly by the rate lenders had set (lowest to highest) and secondly by the time the offer was placed in the market (earliest to latest). When a borrower made a borrowing request in a market, the money was taken from each lender in rank order until the full amount had been matched. The interest rate charged to the borrower for all the loan contracts would be the average rate at which the lenders were supplying the money, so each lender received the rate they asked for.
The main benefit for borrowers was that they could borrow relatively cheaply over shorter periods for small amounts. This was the reverse of banks, where lending typically became progressively cheaper for larger amounts over longer periods. The average interest rate on a Zopa loan in 2006 was a little less than 7 percent – cheaper than the credit
2006-case-20
7 © 2006 esmt, Berlin, Germany

Zopa
card and loan rates offered by most banks. For Zopa lenders, higher returns were possible than through traditional savings accounts if there were no bad debts - typically in the range of 20 to 30% higher than putting money in a bank term deposit account. Lenders could choose the balance of risk against return they required. While waiting for their money to be lent out, lenders earned 3.75% interest on the balance of their membership account. See Exhibits H and I for Zopa’s lending and borrowing rates compared to competitors.
Zopa – How it Works
1. Zopa looks at the credit scores of people looking to borrow and determines whether they're an A*-, A-, B- or C-rated borrower. If they're none of these, then Zopa's not for them.
2. Lenders make lending offers – 'I'd like to lend this much to A-rated borrowers for this long and at this rate.' 3. Borrowers review the rates offered to them, and accept the ones they like. If they are dissatisfied with the
offered rates on any particular day, they can come back on subsequent days to see if rates have changed. 4. To reduce any risk, Zopa lenders only lend small chunks to individual borrowers. A lender lending £500 or
more would have their money spread across at least 50 borrowers. 5. Borrowers enter into legally binding contracts with their lenders. 6. Borrowers repay monthly by direct debit. If repayments are defaulted, a collections agency uses the same
recovery process that the high street banks use.
Zopa charged borrowers a fee of 0.5% of their loan amount and lenders a 0.5% annual service fee. So, a borrower taking out a loan of £2,000 would be charged a £10 fee. This was added to the loan amount, bringing the total borrowed up to £2,010. But with the fee deducted up front, the borrower would get £2,000 paid into their bank account. A lender lending £1,000 at 7% would earn £70 of interest each year if the money was always lent out and paid back. They would pay a fee of 0.5%, or £5, in total. Zopa deducted the fee from the holding account balance on a monthly basis, once the lender had received the monthly repayments from their borrowers. Zopa also earned money through selling payment protection insurance to borrowers who wanted it, and through referring people who could not borrow at Zopa (due to a poor credit rating) to other loan providers.
If a borrower repaid more quickly than the original contract period, the lender paid no additional fee on the portion of the loan that had been repaid early. If a borrower defaulted, a collections agency would undertake to recover any money outstanding, and the lender would not be charged a service fee for the amount defaulted. Should the agency be unable to collect the outstanding loan after 120 days, the lender agreed under the conditions of Zopa membership to sell the debt to the collections agency for a price that would be agreed at the time, but which would not be less than 10% of the amount then outstanding. The agency would pay a fixed percentage of the outstanding amount to Zopa which the company would pass back to the lender. The borrower would not be able to borrow again and would have their Zopa membership suspended. Furthermore, Zopa would pass their details back to a credit referencing agency. This approach to loan default was no different to that taken by existing retail banks – Zopa borrowers who failed to pay were pursued through the same mechanism as banks and received a black mark against their credit histories. Exhibit G provides estimated default rates for Zopa’s various lending markets.
Zopa’s customer research revealed that many of its lenders and borrowers were united by a desire to distance themselves from conventional institutions. Indeed, non-institutional lending and borrowing was already present in the United Kingdom, with a 2006 survey of consumers by the FSA revealing that 11 per cent of respondents regularly borrowed money from family, friends, or someone else in the community. Of those people with informal loans, 16 per cent also had a personal loan from a bank or building society, 11 per cent had a student loan and seven per cent had a car loan, indicating that they were not necessarily borrowing informally because they were unable to access any other type of credit (although they may have been unable to access additional credit). Said James Alexander: ‘I spend a lot of time talking to members and have found enormous goodwill towards the idea, which is really like lending to family members or within a community’. But he added that some of the lenders were simply entrepreneurs
2006-case-20
8 © 2006 esmt, Berlin, Germany

Zopa
who had the funds, understood portfolio diversification and risk and were lending on Zopa alongside other investments. And an increasing number of borrowers were being attracted to Zopa primarily because of the company’s market leading lending rates. In addition to its commercial elements, Zopa’s website provided a user blog, lender and borrower profile pages and community chat rooms for members. Some Zopa members had even met off-line at pubs and cafes in their local communities. The launch of Zopa was quite different from other dot-coms at the turn of the millennium. Many companies at that time invested large amounts in offline media such as TV and print to rapidly grow awareness and to explain their proposition to customers. Instead Zopa had followed a different communications strategy, which relied on word-of-mouth and PR with some online marketing activities where the cost of customer acquisition could be controlled. The launch of such a model and the history of its founders, made it relatively easy to gain the attention of relevant newspapers and magazines such as The Guardian, The Financial Times, The Economist and The Institute of Directors house magazine. Besides press PR activities, the main marketing activities that Zopa used were search engine promotion and affiliate marketing. In late 2006 Zopa had also allied itself with a number of partner institutions to promote its community lending activities, including the Notting Hill Housing Association, Jalebi (a UK-based membership association of 1 million Hindus) and the networking website LinkedIn.
As of end November 2006 Zopa had 40 employees – 10 management staff, 7 sales and marketing personnel, 14 IT and operations personnel, 3 risk and fraud personnel, and 6 underwriters.
Looking to the future. James Alexander had been delighted with the progress of his fledgling company since Zopa’s launch in 2005. The company had attracted the attention of media from around the world, and while not all coverage had been favourable most had pointed out the fact that Zopa rates for the best-rated ‘A category’ borrowers were better than any commercial loan offered by a bank, and for lenders rates were better than any savings account. Member numbers continued to grow strongly, and the total value of loans brokered by Zopa increased daily. The company had also announced plans to launch a US service in 2007. But as with any conscientious CEO, there were several questions that played on the mind of Alexander. Was Zopa on a path to disrupt the retail banking industry, as some industry observers had speculated, or might it about to be overtaken as others rushed into the new peer-to-peer lending market? How might Zopa maintain its first-mover advantage? And how might the established retail and online banks respond to this new challenge?
2006-case-20
9 © 2006 esmt, Berlin, Germany

Zopa
Exhibit A - UK retail banks: Profit breakdown by product type, 2005
E
S
2
Mortage23%
Consumer credit4%
Credit card12%
SME loan3%
Current Account13%
Time deposits13%
LT savings32%
Source: JP Morgan Calculations Based on company data
xhibit B - European retail banks: Profit breakdown by product type, 2005
ource: JP Morgan Calculations Based on company data
006-case-20 10
© 2006 esmt, Berlin, Germany

Zopa
Exhibit C: Different Internet user types, by gender, age and socio-economic group, July 2006 Non-surfer* Surfer** Browser*** Intender**** Buyer*****
% % % % %
All 41 4 7 8 40
Men 36 3 7 8 45
Women 46 4 7 8 35
15-24 27 3 12 10 49
25-34 27 4 6 8 55
35-44 25 4 8 9 54
45-54 33 4 8 9 45
55-64 50 4 6 9 30
65+ 80 3 3 3 10
AB 23 4 7 9 58
C1 30 4 9 9 49
C2 48 4 6 8 34
D 61 4 7 6 21
E 81 3 5 3 7
Source: MORI/Mintel
* Non-surfers do not use the Internet.
** Surfers are described as those that have no interest in purchasing or browsing online but simply use the Internet for other purposes such as email or games.
*** Browsers are those that simply browse for information.
**** Intenders are those that browse for information with the intention of buying off-line.
***** Buyers actively purchase goods and services online.
2006-case-20
11 © 2006 esmt, Berlin, Germany

Zopa
Exhibit D: Websites browsed and purchased from, by type of financial product, 2002-05
Nov-02 Oct-03 Aug-05 % % % Browsed within last three months: General insurance (eg home, motor, travel) 14 20 24 Bank accounts 16 24 23 Mortgages 6 9 5 Investments 5 7 5 Personal loans 4 7 4 Pensions and life insurance 2 4 3 Purchased within last three months: General insurance (eg home, motor, travel) 4 7 9 Bank accounts 5 6 4 Investments 1 2 2 Mortgages 1 1 1 Personal loans 1 1 1 Pensions and life insurance 1 1 1
Source: MORI/Mintel
Exhibit E: Savings product ownership, by gender, age, socio-economic group and region, November 2005
Any savings Savings or term deposit account
Cash ISA* Stocks and shares ISA**
Other National Savings & Investments product
Post Office Savings Account
% % % % % % All 66 54 25 15 14 9 Men 65 54 25 16 13 7 Women 67 54 25 14 15 11 Age: 18-24 55 42 17 2 5 9 25-34 61 51 18 10 8 8 35-44 64 54 21 13 13 10 45-54 64 57 22 19 13 7 55-64 73 58 39 26 20 9 65+ 74 57 33 18 21 11 Socio-economic group: AB 80 70 40 30 22 10 C1 73 61 30 19 18 8 C2 63 50 21 13 13 9 D 54 45 17 6 6 5 E 49 35 10 2 5 13 Source: NOP/Mintel *An Individual Savings Account (ISA) is a financial product available in the UK, designed for the purpose of investment and savings with a favorable tax status. ** A Stocks and shares ISA provides favorable tax status and has money invested in qualifying investments consisting of any combination of stock market equity investments, public debt securities such as government or corporate bonds, or cash "awaiting investment".
2006-case-20
12 © 2006 esmt, Berlin, Germany

Zopa
Exhibit F: Proportion of adults owing money on lending products, by gender, age, socio-economic group and working status, October 2005
Credit or store card
Bank overdraft
Personal loan* Car finance Student loan** Other** Any
% % % % % % % All 32 11 9 6 4 6 44 Men 34 12 10 7 4 4 46 Women 30 10 7 5 5 8 43 18-24 24 16 8 3 17 3 44 25-34 43 16 16 6 10 6 61 35-44 48 17 13 13 2 12 64 45-54 37 10 8 9 - 8 49 55-64 25 6 5 4 - 5 34 65+ 12 1 1 1 - 2 15 AB 38 9 7 8 6 4 48 C1 35 13 11 8 8 5 49 C2 35 11 9 6 2 7 48 D 30 11 9 6 1 8 42 E 16 6 5 1 1 9 27 Source: NOP/Mintel Exhibit G: Zopa’s Estimated Bad Debt Rates Market Best Estimate
Market A* 12 mths 0.5%
Market A* 24 mths 0.5%
Market A* 36 mths 0.5%
Market A 12 mths 1.4%
Market A 24 mths 1.4%
Market A 36 mths 1.1%
Market B 12 mths 2.8%
Market B 24 mths 2.4%
Market B 36 mths 2.0%
Market C 12 mths 8.5%
Market C 24 mths 7.3%
Market C 36 mths 5.8%
2006-case-20
13 © 2006 esmt, Berlin, Germany

Zopa
Exhibit H: Repayment terms for selected loans of £3,000 over 36 months, by APR, October 2005
APR* Monthly repayment
Total repayment
% £ £ Zopa 5.2 90 3,240 Northern Rock** 5.6 91 3,259 Nationwide 6.7 92 3,310 Virgin** 6.9 92 3,320 smile 6.9 92 3,320 Furness Building Society 7.2 93 3,333 MBNA (Platinum Loan) 7.9 93 3,366 cahoot (fixed-rate loan) 8.9 95 3,412 Skipton Building Society** 8.9 95 3,412 Yorkshire Bank 8.9 95 3,412 Liverpool Victoria 9.9 96 3,459 British Gas 10.9 97 3,505 Sainsbury's Bank 12.9 100 3,597 Marks & Spencer 12.9 100 3,597 Egg** 12.9 100 3,597 RAC 13.5 101 3,625 Halifax 13.9 103 3,723 Capital One 13.9 101 3,644 Alliance & Leicester 13.9 101 3,644 Britannia 13.9 101 3,644 HSBC 14.9 102 3,690 Lloyds TSB (Direct) 14.9 102 3,690 Norwich Union 14.9 102 3,690 NatWest 15.4 103 3,713 Abbey 17.7 106 3,819 Barclays 18.9 108 3,880
* refers to set APR or advertised/typical APR offered; although some providers only have one set loan rate, others offer different rates based on credit rating; only those with a good or excellent credit rating (estimated to account for up to 25% of consumers) will be eligible for the best (ie lowest) rates; a typical APR is the rate that over 66% of successful applicants receive ** no redemption penalties charged
Source: moneysupermarket.com
2006-case-20
14 © 2006 esmt, Berlin, Germany

Zopa
Exhibit I: Lending Returns at Zopa compared to returns from select competitor savings accounts, November 2006 Provider Product Rate
AER Zopa Average return on lending** 6.75% ICICI Bank HiSave Savings account 5.45% Anglo Irish Bank Easy Access Deposit Account 5.3% Citibank Flexible Saver 5.29% Capital One Base Beater Savings Account 5.05% Mansfield Building Society eSaver 5.1%
Bardford and Bingley eSavings 5.1% Cahoot Savings Account 5% ING direct Savings Account 4.75% Fist Direct eSavings 4.75% Halifax Web saver 4.75% EGG Egg Online Savings 4.75% HSBC Online Account 4.75% Direct Line Direct Access 4.3% Royal Bank of Scotland Direct Saver 3.7%
Source: moneysupermarket and Zopa (10:00 on 17/10/06); Bank rates AER gross (before tax) which is what the interest would be if interest was paid and compounded each year. The quoted rate typically only applied if borrowers did not withdraw money; Zopa rate is gross (before tax) and after bad debt (to date). Money in a Zopa holding account that had not been loaned earned a rate of return of 3.75%.
Exhibit J: The Zopa Website
2006-case-20
15 © 2006 esmt, Berlin, Germany

Zopa
Sources: Association of Payment and Clearing Services (APACS) http://www.apac.org.ukBritish Banking Association http://www.bba.org.ukBusiness Insights, The UK Banking Industry Insights, 2004. Egg Company Website http:// www.egg.com Economist Intelligence Unit: United Kingdom: Financial services profile, May 12, 2006. Euromonitor International, The Market for Consumer Lifestyles in the UK, May 2006. Financial Services Authority, Levels of Financial Capability in the UK – Results of a Baseline Survey, March 2006. Financial Times (2005) “Lending exchange bypasses high street banks.” Paul J Davies, August 22nd 2005. Financial Times. Institute of Directors. Profile – Richard Duvall. Director. Pp 51-52. Mintel, Current Accounts – UK, June 2006. Mintel, Internet Quarterly UK, September 2006. Mintel, Personal Loans UK, June 2006. Mintel, retail Banking Overview, October 2005. Money Supermarket Website http://www.moneysupermarket.comNew Media Age (2005) Personal Lender, Dominic Dudley, 18th August 2005. Zopa Company Website, http://www.zopa.com
2006-case-20
16 © 2006 esmt, Berlin, Germany