an assessment of the social and economic …an assessment of the social and economic importance of...
TRANSCRIPT
An Assessment of the Social and Economic Importance
Of Menhaden (Brevoortia tyrannus) (Latrobe, 1802)
In Chesapeake Bay Region
2011
JAMES E. KIRKLEY, Principal Investigator and Author
Virginia Institute of Marine Science
College of William and Mary
School of Marine Science
Department of Fisheries
Gloucester Point, VA 23062
VIMS Marine Resource Report No. 2011-14


An Assessment of the Social and Economic Importance
Of Menhaden (Brevoortia tyrannus) (Latrobe, 1802)
In Chesapeake Bay Region
2011
JAMES E KIRKLEY, Principal Investigator and Author
Virginia Institute of Marine Science
College of William and Mary
School of Marine Science
Department of Fisheries
Gloucester Point, VA 23062
Co-Authors:
Todd Hartman, Department of Government & Justice Studies,
Appalachian State University
Tanga McDaniel, Department of Economics, Appalachian State University
Kenneth (Ted) McConnell, College of Agriculture & Natural Resources, Department of
Agricultural & Resource Economics, University of Maryland
John Whitehead, Department of Economics, Appalachian State University
Contributors:
Robert Hicks, Department of Economics, College of William & Mary
Edward Houde, Chesapeake Biological Laboratory
Douglas Lipton, College of Agriculture & Natural Resources, Department of
Agricultural & Resource Economics, University of Maryland
Thomas Murray, Marine Advisory Services, Virginia Institute of Marine Science/
College of William & Mary
John Ward, NOAA Fisheries (retired)
VIMS Marine Resource Report No. 2011-14
TOC | 1
Table of Contents
Executive Summary ..................................................................................................... i
1.0 Introduction .......................................................................................................... 1
1.1 Introduction: The Fishery and Issues .............................................................................1
1.2 Management and Resource Conditions of Menhaden ....................................................3
1.3 Study Background ........................................................................................................4
1.4 Organization of Report .................................................................................................4
2.0 Overview of the Menhaden Resource and Fishery.................................................. 5
2.1 Menhaden: Basic Biological Characteristics ...................................................................5
2.2 Menhaden and the Reduction Fishery: An Historical Perspective ...................................5
2.3 Menhaden and the Atlantic Coastal States .................................................................. 12
2.4 Management and Regulation of the Atlantic Menhaden Fishery .................................. 16
3.0 OMEGA Protein: The Company ............................................................................ 18
3.1 An Overview .............................................................................................................. 18
3.2 OMEGA Protein: Reedville, VA .................................................................................... 18 3.2.1 Reedville Profile .......................................................................................................................... 19
3.2.1.1 Geographic Description ....................................................................................................... 19 3.2.1.2 Importance of Fishing ......................................................................................................... 20
3.2.1.2.1 Historic Fishing ............................................................................................................ 20 3.2.1.2.2 Modern fishing ............................................................................................................ 20
3.2.1.3 Social Interactions ............................................................................................................... 21 3.2.1.4 Demography ........................................................................................................................ 21
3.2.1.4.1 Education ..................................................................................................................... 22 3.2.1.4.2 Employment ................................................................................................................ 22 3.2.1.4.3 Income ......................................................................................................................... 23 3.2.1.4.4 Housing ........................................................................................................................ 23
3.3 OMEGA Protein: 2008 Reduction Activities ................................................................. 23 3.3.1 An Economic Assessment (Impact) Model.................................................................................. 24 3.3.2 The Economic Contribution of OMEGA Reduction Activities...................................................... 24
4.0 Community Descriptions ..................................................................................... 26
4.1 Maryland Coastal Counties ......................................................................................... 26 4.1.2 Eastern Shore .............................................................................................................................. 26
4.1.2.1 Cecil County ........................................................................................................................ 26 4.1.2.1.1 Location ....................................................................................................................... 26 4.1.2.1.2 Transportation ............................................................................................................. 26 4.1.2.1.3 Demography ................................................................................................................ 27 4.1.2.1.4 Education ..................................................................................................................... 28 4.1.2.1.5 Employment ................................................................................................................ 28

TOC | 2
4.1.2.1.6 Income ......................................................................................................................... 29 4.1.2.1.7 Housing ........................................................................................................................ 29
4.1.2.2 Dorchester County .............................................................................................................. 29 4.1.2.2.1 Location ....................................................................................................................... 30 4.1.2.2.2 Transportation ............................................................................................................. 30 4.1.2.2.3 Demography ................................................................................................................ 30 4.1.2.2.4 Education ..................................................................................................................... 31 4.1.2.2.5 Employment ................................................................................................................ 31 4.1.2.2.6 Income ......................................................................................................................... 32 4.1.2.2.6 Housing ........................................................................................................................ 32
4.1.2.3 Kent County ......................................................................................................................... 32 4.1.2.3.1 Location ....................................................................................................................... 33 4.1.2.3.2 Transportation ............................................................................................................. 33 4.1.2.3.3 Demography ................................................................................................................ 33 4.1.2.3.4 Education ..................................................................................................................... 34 4.1.2.3.5 Employment ................................................................................................................ 34 4.1.2.3.6 Income ......................................................................................................................... 34 4.1.2.3.7 Housing ........................................................................................................................ 35
4.1.2.4 Queen Anne’s County ......................................................................................................... 35 4.1.2.4.1 Location ....................................................................................................................... 35 4.1.2.4.2 Transportation ............................................................................................................. 36 4.1.2.4.3 Demography ................................................................................................................ 36 4.1.2.4.4 Education ..................................................................................................................... 36 4.1.2.4.5 Employment ................................................................................................................ 37 4.1.2.4.6 Income ......................................................................................................................... 37 4.1.2.4.7 Housing ........................................................................................................................ 37
4.1.2.5 Somerset County ................................................................................................................. 38 4.1.2.5.1 Location ....................................................................................................................... 38 4.1.2.5.2 Transportation ............................................................................................................. 38 4.1.2.5.3 Demographics.............................................................................................................. 39 4.1.2.5.4 Education ..................................................................................................................... 39 4.1.2.5.5 Employment ................................................................................................................ 39 4.1.2.5.6 Income ......................................................................................................................... 40 4.1.2.5.7 Housing ........................................................................................................................ 40
4.1.2.6 Talbot County ...................................................................................................................... 40 4.1.2.6.1 Location ....................................................................................................................... 41 4.1.2.6.2 Transportation ............................................................................................................. 41 4.1.2.6.3 Demographics.............................................................................................................. 41 4.1.2.6.4 Education ..................................................................................................................... 42 4.1.2.6.5 Employment ................................................................................................................ 42 4.1.2.6.6 Income ......................................................................................................................... 42 4.1.2.6.7 Housing ........................................................................................................................ 43
4.1.2.7 Wicomico County ................................................................................................................ 43 4.1.2.7.1 Location ....................................................................................................................... 43 4.1.2.7.2 Transportation ............................................................................................................. 44 4.1.2.7.3 Demographics.............................................................................................................. 44 4.1.2.7.3 Education ..................................................................................................................... 45 4.1.2.7.3 Employment ................................................................................................................ 45 4.1.2.7.4 Income ......................................................................................................................... 46 4.1.2.7.5 Housing ........................................................................................................................ 46
4.1.2.8 Worcester County ............................................................................................................... 46 4.1.2.8.1 Location ....................................................................................................................... 47 4.1.2.8.2 Transportation ............................................................................................................. 47

TOC | 3
4.1.2.8.3 Demographics.............................................................................................................. 47 4.1.2.8.4 Education ..................................................................................................................... 48 4.1.2.8.5 Employment ................................................................................................................ 48 4.1.2.8.6 Income ......................................................................................................................... 49 4.1.2.8.5 Housing ........................................................................................................................ 49
4.1.3 Western Shore ............................................................................................................................ 50 4.1.3.1 Anne Arundel ...................................................................................................................... 50
4.1.3.1.1 Location ....................................................................................................................... 50 4.1.3.1.2 Transportation ............................................................................................................. 50 4.1.3.1.3 Demographics.............................................................................................................. 50 4.1.3.1.4 Education ..................................................................................................................... 51 4.1.3.1.5 Employment ................................................................................................................ 52 4.1.3.1.6 Income ......................................................................................................................... 53 4.1.3.1.7 Housing ........................................................................................................................ 53
4.1.3.2 City of Baltimore ................................................................................................................. 53 4.1.3.2.1 Location ....................................................................................................................... 54 4.1.3.2.2 Transportation ............................................................................................................. 54 4.1.3.2.3 Demographics.............................................................................................................. 54 4.1.3.2.4 Education ..................................................................................................................... 55 4.1.3.2.5 Employment ................................................................................................................ 55 4.1.3.2.6 Income ......................................................................................................................... 56 4.1.3.2.7 Housing ........................................................................................................................ 57
4.1.3.3 Baltimore County ................................................................................................................ 57 4.1.3.3.1 Location ....................................................................................................................... 58 4.1.3.3.2 Transportation ............................................................................................................. 58 4.1.3.3.3 Demographics.............................................................................................................. 58 4.1.3.3.4 Education ..................................................................................................................... 59 4.1.3.3.5 Employment ................................................................................................................ 59 4.1.3.3.6 Income ......................................................................................................................... 60 4.1.3.3.7 Housing ........................................................................................................................ 61
4.1.3.4 Calvert County ..................................................................................................................... 61 4.1.3.4.1 Location ....................................................................................................................... 62 4.1.3.4.2 Transportation ............................................................................................................. 62 4.1.3.4.3 Demographics.............................................................................................................. 62 4.1.3.4.4 Education ..................................................................................................................... 63 4.1.3.4.5 Employment ................................................................................................................ 63 4.1.3.4.6 Income ......................................................................................................................... 64 4.1.3.4.7 Housing ........................................................................................................................ 64
4.1.3.5 Charles County .................................................................................................................... 65 4.1.3.5.1 Location ....................................................................................................................... 65 4.1.3.5.2 Transportation ............................................................................................................. 65 4.1.3.5.3 Demographics.............................................................................................................. 65 4.1.3.5.4 Education ..................................................................................................................... 66 4.1.3.5.5 Employment ................................................................................................................ 67 4.1.3.5.6 Income ......................................................................................................................... 67 4.1.3.5.7 Housing ........................................................................................................................ 68
4.1.3.6 Harford County.................................................................................................................... 68 4.1.3.6.1 Location ....................................................................................................................... 69 4.1.3.6.2 Transportation ............................................................................................................. 69 4.1.3.6.3 Demographics.............................................................................................................. 69 4.1.3.6.4 Education ..................................................................................................................... 70 4.1.3.6.5 Employment ................................................................................................................ 70 4.1.3.6.4 Income ......................................................................................................................... 71

TOC | 4
4.1.3.6.5 Housing ........................................................................................................................ 71 4.1.3.7 St. Mary’s County ................................................................................................................ 72
4.1.3.7.1 Location ....................................................................................................................... 72 4.1.3.7.2 Transportation ............................................................................................................. 72 4.1.3.7.3 Demographics.............................................................................................................. 72 4.1.3.7.4 Education ..................................................................................................................... 73 4.1.3.7.5 Employment ................................................................................................................ 73 4.1.3.7.6 Income ......................................................................................................................... 74 4.1.3.7.7 Housing ........................................................................................................................ 75
4.2 Virginia Coastal Counties ............................................................................................ 76 4.2.1 Eastern Shore .............................................................................................................................. 76
4.2.1.1 Accomack County ................................................................................................................ 76 4.2.1.1.1 Location ....................................................................................................................... 76 4.2.1.1.2 Transportation ............................................................................................................. 77 4.2.1.1.3 Demography ................................................................................................................ 77 4.2.1.1.4 Education ..................................................................................................................... 77 4.2.1.1.5 Employment ................................................................................................................ 78 4.2.1.1.6 Income ......................................................................................................................... 78 4.2.1.1.7 Housing ........................................................................................................................ 78
4.2.1.2 Northampton County .......................................................................................................... 79 4.2.1.2.1 Location ....................................................................................................................... 79 4.2.1.2.2 Transportation ............................................................................................................. 79 4.2.1.2.3 Demography ................................................................................................................ 80 4.2.1.2.4 Education ..................................................................................................................... 80 4.2.1.2.5 Employment ................................................................................................................ 80 4.2.1.2.6 Income ......................................................................................................................... 81 4.2.1.2.7 Housing ........................................................................................................................ 81
4.2.2 Western Chesapeake Bay Counties ............................................................................................ 82 4.2.2.1 Essex County ....................................................................................................................... 82
4.2.2.1.1 Location ....................................................................................................................... 82 4.2.2.1.2 Transportation ............................................................................................................. 82 4.2.2.1.3 Demography ................................................................................................................ 82 4.2.2.1.4 Education ..................................................................................................................... 83 4.2.2.1.5 Employment ................................................................................................................ 83 4.2.2.1.6 Income ......................................................................................................................... 83 4.2.2.1.7 Housing ........................................................................................................................ 84
4.2.2.2 Gloucester County............................................................................................................... 84 4.2.2.2.1 Location ....................................................................................................................... 84 4.2.2.2.2 Transportation ............................................................................................................. 85 4.2.2.2.3 Demography ................................................................................................................ 85 4.2.2.2.4 Education ..................................................................................................................... 85 4.2.2.2.5 Employment ................................................................................................................ 85 4.2.2.2.6 Income ......................................................................................................................... 86 4.2.2.2.7 Housing ........................................................................................................................ 86
4.2.2.3 Hampton ............................................................................................................................. 87 4.2.2.3.1 Location ....................................................................................................................... 87 4.2.2.3.2 Transportation ............................................................................................................. 87 4.2.2.3.2 Demographics.............................................................................................................. 87 4.2.2.3.2 Education ..................................................................................................................... 88 4.2.2.3.3 Employment ................................................................................................................ 88 4.2.2.3.4 Income ......................................................................................................................... 89 4.2.2.3.5 Housing ........................................................................................................................ 89

TOC | 5
4.2.2.4 Isle of Wight County ............................................................................................................ 89 4.2.2.4.1 Location ....................................................................................................................... 90 4.2.2.4.2 Transportation ............................................................................................................. 90 4.2.2.4.3 Demographics.............................................................................................................. 90 4.2.2.4.4 Education ..................................................................................................................... 91 4.2.2.4.5 Employment ................................................................................................................ 91 4.2.2.4.6 Income ......................................................................................................................... 91 4.2.2.4.7 Housing ........................................................................................................................ 92
4.2.2.5 James City County ............................................................................................................... 92 4.2.2.5.1 Location ....................................................................................................................... 92 4.2.2.5.2 Transportation ............................................................................................................. 92 4.2.2.5.3 Demographics.............................................................................................................. 93 4.2.2.5.4 Education ..................................................................................................................... 93 4.2.2.5.5 Economics ................................................................................................................... 93 4.2.2.5.6 Income ......................................................................................................................... 94 4.2.2.5.7 Housing ........................................................................................................................ 94
4.2.2.6 King George County ............................................................................................................ 94 4.2.2.6.1 Location ....................................................................................................................... 95 4.2.2.6.2 Transportation ............................................................................................................. 95 4.2.2.6.3 Demography ................................................................................................................ 95 4.2.2.6.4 Education ..................................................................................................................... 96 4.2.2.6.5 Employment ................................................................................................................ 96 4.2.2.6.6 Income ......................................................................................................................... 96 4.2.2.6.7 Housing ........................................................................................................................ 96
4.2.2.7 Lancaster County ................................................................................................................. 97 4.2.2.7.1 Location ....................................................................................................................... 97 4.2.2.7.2 Transportation ............................................................................................................. 97 4.2.2.7.3 Demographics.............................................................................................................. 97 4.2.2.7.4 Education ..................................................................................................................... 98 4.2.2.7.5 Employment ................................................................................................................ 98 4.2.2.7.6 Income ......................................................................................................................... 99 4.2.2.7.7 Housing ........................................................................................................................ 99
4.2.2.8 Mathews County ................................................................................................................. 99 4.2.2.8.1 Location ..................................................................................................................... 100 4.2.2.8.2 Transportation ........................................................................................................... 100 4.2.2.8.3 Demographics............................................................................................................ 100 4.2.2.8.4 Education ................................................................................................................... 101 4.2.2.8.5 Employment .............................................................................................................. 101 4.2.2.8.6 Income ....................................................................................................................... 101 4.2.2.8.7 Housing ...................................................................................................................... 102
4.2.2.9 Middlesex County ............................................................................................................. 102 4.2.2.9.1 Location ..................................................................................................................... 102 4.2.2.9.2 Transportation ........................................................................................................... 102 4.2.2.9.3 Demographics............................................................................................................ 103 4.2.2.9.4 Education ................................................................................................................... 103 4.2.2.9.5 Employment .............................................................................................................. 103 4.2.2.9.6 Income ....................................................................................................................... 104 4.2.2.9.7 Housing ...................................................................................................................... 104
4.2.2.10 City of Newport News ..................................................................................................... 104 4.2.2.10.1 Location ................................................................................................................... 105 4.2.2.10.2 Transportation ......................................................................................................... 105 4.2.2.10.3 Demographics.......................................................................................................... 105 4.2.2.10.3 Education................................................................................................................. 106

TOC | 6
4.2.2.10.4 Employment ............................................................................................................ 106 4.2.2.10.5 Income ..................................................................................................................... 107 4.2.2.10.5 Housing .................................................................................................................... 107
4.2.2.11 City of Norfolk ................................................................................................................. 108 4.2.2.11.1 Location ................................................................................................................... 108 4.2.2.11.2 Transportation ......................................................................................................... 108 4.2.2.11.3 Demographics.......................................................................................................... 108 4.2.2.11.4 Education................................................................................................................. 109 4.2.2.11.5 Employment ............................................................................................................ 109 4.2.2.11.6 Income ..................................................................................................................... 110 4.2.2.11.7 Housing .................................................................................................................... 110
4.2.2.12 Northumberland County ................................................................................................. 111 4.2.2.12.1 Location ................................................................................................................... 111 4.2.2.12.2 Transportation ......................................................................................................... 111 4.2.2.12.3 Demographics.......................................................................................................... 112 4.2.2.12.4 Education................................................................................................................. 112 4.2.2.12.5 Employment ............................................................................................................ 112 4.2.2.12.6 Income ..................................................................................................................... 113 4.2.2.12.7 Housing .................................................................................................................... 113
4.2.2.13 City of Poquoson ............................................................................................................. 113 4.2.2.13.1 Location ................................................................................................................... 114 4.2.2.13.2 Transportation ......................................................................................................... 114 4.2.2.13.3 Demographics.......................................................................................................... 114 4.2.2.13.4 Education................................................................................................................. 115 4.2.2.13.5 Employment ............................................................................................................ 115 4.2.2.13.6 Income ..................................................................................................................... 115 4.2.2.13.7 Housing .................................................................................................................... 116
4.2.2.14 City of Portsmouth .......................................................................................................... 116 4.2.2.14.1 Location ................................................................................................................... 116 4.2.2.14.2 Transportation ......................................................................................................... 116 4.2.2.14.3 Demography ............................................................................................................ 116 4.2.2.14.4 Education................................................................................................................. 117 4.2.2.14.5 Employment ............................................................................................................ 118 4.2.2.14.6 Income ..................................................................................................................... 118 4.2.2.14.7 Housing .................................................................................................................... 119
4.2.2.15 Prince William County ..................................................................................................... 119 4.2.2.15.1 Location ................................................................................................................... 119 4.2.2.15.2 Transportation ......................................................................................................... 120 4.2.2.15.3 Demographics.......................................................................................................... 120 4.2.2.15.4 Education................................................................................................................. 121 4.2.2.15.5 Employment ............................................................................................................ 121 4.2.2.15.6 Income ..................................................................................................................... 122 4.2.2.15.7 Housing .................................................................................................................... 122 4.2.2.16 Richmond County ....................................................................................................... 123 4.2.2.16.1 Location ................................................................................................................... 123 4.2.2.16.2 Transportation ......................................................................................................... 123 4.2.2.16.3 Demography ............................................................................................................ 123 4.2.2.16.4 Education................................................................................................................. 124 4.2.2.16.5 Employment ............................................................................................................ 124 4.2.2.16.6 Income ..................................................................................................................... 124 4.2.2.16.7 Housing .................................................................................................................... 125
4.2.2.17 Stafford County ............................................................................................................... 125 4.2.2.17.1 Location ................................................................................................................... 125

TOC | 7
4.2.2.17.2 Transportation ......................................................................................................... 126 4.2.2.17.3 Demographics.......................................................................................................... 126 4.2.2.17.4 Education................................................................................................................. 127 4.2.2.17.5 Employment ............................................................................................................ 127 4.2.2.17.6 Income ..................................................................................................................... 128 4.2.2.17.7 Housing .................................................................................................................... 128
4.2.2.18 City of Suffolk .................................................................................................................. 128 4.2.2.18.1 Location ................................................................................................................... 129 4.2.2.18.2 Transportation ......................................................................................................... 129 4.2.2.18.3 Demographics.......................................................................................................... 129 4.2.2.18.4 Education................................................................................................................. 130 4.2.2.18.5 Employment ............................................................................................................ 130 4.2.2.18.6 Income ..................................................................................................................... 131 4.2.2.18.7 Housing .................................................................................................................... 132
4.2.2.19 Surry County.................................................................................................................... 132 4.2.2.19.1 Location ................................................................................................................... 132 4.2.2.19.2 Transportation ......................................................................................................... 132 4.2.2.19.3 Demography ............................................................................................................ 133 4.2.2.19.4 Education................................................................................................................. 133 4.2.2.19.5 Employment ............................................................................................................ 133 4.2.2.19.6 Income ..................................................................................................................... 134 4.2.2.19.7 Housing .................................................................................................................... 134
4.2.2.20 City of Virginia Beach ...................................................................................................... 134 4.2.2.20.1 Location ................................................................................................................... 135 4.2.2.20.2 Transportation ......................................................................................................... 135 4.2.2.20.3 Demography ............................................................................................................ 135 4.2.2.20.4 Education................................................................................................................. 136 4.2.2.20.5 Employment ............................................................................................................ 136 4.2.2.20.6 Income ..................................................................................................................... 137 4.2.2.20.7 Housing .................................................................................................................... 138
4.2.2.21 Westmoreland County .................................................................................................... 138 4.2.2.21.1 Location ................................................................................................................... 138 4.2.2.21.2 Transportation ......................................................................................................... 139 4.2.2.21.3 Demographics.......................................................................................................... 139 4.2.2.21.4 Education................................................................................................................. 139 4.2.2.21.5 Employment ............................................................................................................ 139 4.2.2.21.6 Income ..................................................................................................................... 140 4.2.2.21.7 Housing .................................................................................................................... 140
4.2.2.22 City of Williamsburg ........................................................................................................ 141 4.2.2.22.1 Location ................................................................................................................... 141 4.2.2.22.2 Transportation ......................................................................................................... 141 4.2.2.22.3 Demographics.......................................................................................................... 141 4.2.2.22.4 Education................................................................................................................. 142 4.2.2.22.5 Employment ............................................................................................................ 142 4.2.2.22.6 Income ..................................................................................................................... 143 4.2.2.22.7 Housing .................................................................................................................... 143
4.2.2.23 York County ..................................................................................................................... 143 4.2.2.23.1 Location ................................................................................................................... 144 4.2.2.23.2 Transportation ......................................................................................................... 144 4.2.2.23.3 Demographics.......................................................................................................... 144 4.2.2.23.4 Employment ............................................................................................................ 145 4.2.2.23.5 Income ..................................................................................................................... 145 4.2.2.23.6 Housing .................................................................................................................... 146

TOC | 8
5.0 Economic Impact Assessment ............................................................................ 147
5.1 The Economic Impact Assessment Framework .......................................................... 147
5.2 The Economic Impacts of the Reduction Fishery ........................................................ 150
5.3 Impacts of Shuttering the Reduction Operations and Reducing the Bay Quota ........... 151 5.3.1 Economic Impacts of Varying Bay Quota Levels: No Change in Cost ........................................ 153 5.3.2 Economic Impacts of Varying Bay Quota Levels: Change in Cost ............................................. 154 5.3.3 Economic Impacts of Fishery Wide Quotas .............................................................................. 155 5.3.4 Impact Assessment via the Input/Output Model ..................................................................... 156
5.4 Economic Impacts and the Recreational Fisheries of the Bay ..................................... 159 5.4.1 The Relationship between Recreational Catch/Abundance and Menhaden .................. 159 5.4.2 The Economic Impacts of Recreational Angling ........................................................................ 161
5.5 Review of Impact Assessment ................................................................................... 167
6.0 Valuation Survey Methodology ......................................................................... 169
6.1 Multi-Mode Chesapeake Bay Menhaden Survey: Data Collection Report ................... 169 6.1.1 Mail Survey ............................................................................................................................... 169 6.1.2 Telephone Survey ..................................................................................................................... 169 6.1.3 Internet Survey ......................................................................................................................... 170
6.2 Survey Questionnaires and Data Summary ................................................................ 171 Appendix A: VIMS 2010 Codebook/Telephone Survey ...................................................................... 171 Appendix B: Mail Survey (Version 1) .................................................................................................. 184 Appendix C: Zoomerang Internet Survey ........................................................................................... 193
7.0 Estimating Willingness to Pay for Policies Related to Menhaden Harvests ......... 214
8.0 Summary and Conclusions ................................................................................ 222
8.1 The Beginning and Purpose of Study ......................................................................... 222
8.2 Study Methodology .................................................................................................. 223
8.3 Overview of Results .................................................................................................. 224
Reference ............................................................................................................... 227

Page | i
Executive Summary
Recreational anglers and various conservation associations have long been concerned
about the harvesting of menhaden in Chesapeake Bay. Their concerns include the fact that
menhaden are filter feeders, whose overharvest could affect water quality, and that menhaden are
forage fish for various recreationally important predators, such as striped bass, weakfish1,
speckled trout, bluefish, as well as various marine mammals and seabirds. Equally important is
the fact that the reduction fishery solely operated by OMEGA Protein is also believed to be vital
to the social and economic wellbeing of Northumberland County, and in particular, Reedville,
VA. In addition, the bait fisheries have recently increased their harvest of menhaden in response
to reductions in the supply of herring for use as bait in the lobster and other fisheries. These competing concerns have fueled a debate about menhaden harvesting that has
resulted in every coastal state of the Northwest Atlantic having some type of regulation that
either limits or prohibits the harvesting of menhaden by purse seine or for reduction purposes in
their coastal waters. Massachusetts, Virginia, New York, and North Carolina are the only states
that presently permit harvesting for reduction or by purse seine. None of these concerns have,
however, been quantified in terms of their economic impacts or economic, social, or ecological
values. As a consequence, the Virginia Marine Resources Commission requested a study be done
by the Virginia Institute of Marine Science of the social and economic importance of the fishery
to Chesapeake Bay region. The emphasis of the study was to document how reallocating the
Bay quota might affect the social wellbeing and economies of the region and to determine the
economic value of menhaden in the region. That is, does the menhaden resource generate more
benefits from the fishery or from the ecological services it provides to the various Bay resources? The county profiles and limited interviews with employees of OMEGA Protein indicate
that the menhaden fishery, dominated by the reduction industry, is a key component of the multi-
cultural, ethnic, and racial communities bordering Chesapeake Bay. This is particularly true for
Northumberland County and Reedville, Virginia where OMEGA Protein is headquartered. Of
the 519 full and part time jobs generated by OMEGA Protein, 347 contributed to the local
Northumberland County economy. In the event of a closure, the loss of the reduction industry
alone would generate a 14.3% and 8.1% decline in total county output and employment;
respectively. In addition, a financial simulator model was developed to conduct an assessment of
different Bay-wide quotas affect on sales, income, and employment in the Maryland and Virginia
region. This model found that a zero Bay quota with constant costs results in losses of $10
million as compared to a $7.3 million profit if costs are allowed to decline with quota reductions.
Restricting coastal ocean quotas from a high of 141.1 to 50.0 thousand metric tons further
reduces sales from $59.5 to $21.2 million and profits from $14.2 to 2.3 million. This latter result
assumes that overall costs would rise 75% as a result of the exclusively offshore operations while
allowing operating cost or expenditures for fuel, repair and maintenance, and food to decline
with declines in production levels.
1Reportedly the age-structure of weakfish in the Bay has contracted (primarily ages 0-3) this species does
not exert much predation pressure on menhaden.

Page | ii
Using these results in an input/output model, a commercial Bay quota of 75.0 thousand
metric tons was not found to have a large impact on either the regional economy or on the
economy of Virginia (Tables 5.9, 5.10, and Table 5.11). The regional output is reduced from
$88.2 to $81.9 million, income is reduced from $22.8 to $21.1 million, and employment declines
from 519 to 482 jobs. A zero Bay quota, without additional landings from the coastal ocean to
compensate for the reduction, reduces total output to $35.0 million, employment to 206 jobs, and
income to $9.0 million. Similarly, recreational angling for striped bass, bluefish, weakfish, and
spotted sea trout that depends in part on menhaden as their prey did generate considerable
economic activity. Anglers made a total of 2.9 million trips targeting those four species. In
2008, $332.1 million in total sales or output, $122.3 million in income, and nearly 3,500 jobs
were generated for the region. Obviously, an important component of this assessment is the effect of a reallocation of
the commercial Bay menhaden quota on the recreational game fish catch, sales or output,
income, and jobs. While a statistically significant increase of 0.05 in per pound of recreationally
caught striped bass exists for each billion fish increase in menhaden, no statistically significant
relationship was found between numbers of recreationally caught game fish and menhaden
abundance. This latter effect of menhaden abundance on individual game fish species catch
could not be assessed because of the inadequacy of the available information and data. It is
possible that such an effect could exist, but the combination of species might confound the
results when analyzed in the aggregate. In short, no empirical evidence exists that a reduction in
or the elimination of the menhaden reduction industry in the Bay or coastal waters would result
in an increase in the economic impacts derived from the recreational fishing for game fish
species that depend on menhaden as a prey item. The benefit-cost assessment of the social and economic importance of the menhaden
resource was developed using a contingent valuation analysis based on an extensive survey of
stakeholders in Virginia and Maryland. This resulted in estimates of the economic value to
regional stakeholders from retaining or reducing the current Bay-wide commercial quota. The
contingent valuation analysis indicated that the decrease in the menhaden industrial catch is
valued at $28 in net benefits per household, while its maintenance is valued at $50 per
household; a net gain in net benefits of $110.0 million for maintaining the status quo. The result
that society preferred to maintain the status quo instead of having a strong preference to reduce
the allowable Bay quota was unexpected. Possible reasons for the preferences include a growing
sympathy with watermen, an ailing economy and desire by individuals to prevent additional
unemployment, and an inadequate understanding of the potential ecological goods and services
of menhaden. There are various reasons to interpret these economic value results cautiously. First, the
estimates themselves are not exact due to uncertainty that is not easily quantified. Second, our
valuation of the scenarios assumes that preferences are independent. However, in controversial
and contentious cases of resource allocation, preferences may evolve such that not only does one
side of the issue value its own management program, but it may also incur ‗negative‘ value if the
opposing side gets its way. The proportion of these individuals is probably quite small relative
to the total number of interested individuals. Third, the strength of the results rests on the
scientific evidence. We have presented the survey respondents with the best evidence we could
provide. Weaknesses in this evidence will undermine the economic assessment of preferences.

Page | 1
1.0 Introduction
1.1 Introduction: The Fishery and Issues
Atlantic menhaden (Brevoortia tyrannus) (Latrobe, 1802) has been the subject of
controversy and debate for nearly 200 years. The Pilgrims supposedly used menhaden as
fertilizer for their crops, a practice taught to them by Indians of the Chesapeake region. The
industry emerged and developed early in New England in the early 19th
century; this occurred
because menhaden oil was found to be a valuable alternative to whale oil for lubricants, as fuel
for lamps, and in manufacturing soap and paint. By the early 1900s, menhaden was used as a
component of fertilizer and animal feed, and in the manufacturing of paints and other substances
such as fingernail polish and perfume (Lanier, 1985).
Initially, menhaden were caught in weirs and in haul seines worked from the shore, and
to a lesser extent, by gill nets worked from canoes and small ships (Frye, 1978). According to
Frye, Rhode Islanders were the first to use the purse seine, the dominant current day gear for
menhaden, to catch menhaden. It was not widely used until the 1870s, when the first purse boat
was developed. Today‘s fishery, while still based on the purse seine, is even more technically
efficient. A hydraulic power block is used to pull the net; the purse boats are now aluminum
rather than wood and motorized rather than powered by oar; nylon has replaced the heavier and
less durable natural fiber nets; pumps are now used to transfer the catch from the net into the fish
hold; and spotter planes are used to sight the schools of menhaden.
Controversy about the harvesting of menhaden of some type has documented since the
1880s. In 1888, Assemblyman Cromwell introduced a bill to prohibit fishing using menhaden
nets in Raritan Bay, New York (The New York Times, 1888). Opposition to the fishing of
menhaden with nets was based on concerns about bycatch of bluefish and weakfish, depletion of
important prey for various game fish, and the fact that menhaden were not used for human food
but mostly for fertilizer. In 1889, Governor Ames of Massachusetts imposed a ban on the
seining of menhaden in Massachusetts‘s waters, and especially in Buzzard‘s Bay. Opposition
was primarily by recreational anglers and focused on the perceived value of menhaden to water
quality and the abundance and biomass of various game fish.
Today, the arguments are much the same but with some new additions: (1) anglers and
environmental groups are concerned that an important source of filtration of water has been
diminished with the harvesting of menhaden (i.e., menhaden are believed to be important to
water quality because they are filter feeders on excess microscopic algae); (2) menhaden are
important prey for major game fish, seabirds, and marine mammals in the Bay, and reductions in
the abundance and biomass of menhaden could have negative ramifications for the abundance
and health of various game fish, seabirds, and marine mammals; (3) menhaden are harvested for
manufacturing products, which do not necessarily require menhaden or any fish (e.g., feed for
livestock), and thus, are more valuable in the services they provide to the Bay ecosystem than
they are in terms of meal and oil; and (4) the reduction plants generate undesirable odors.
Bait and reduction are the two primary fisheries for Atlantic menhaden. Atlantic
menhaden are harvested in the Northwest Atlantic, primarily between Rhode Island and North
Page | 2
Carolina. Yellowfin menhaden (Brevoortia smithi) are also harvested in the northwest Atlantic,
but available landings data from the National Marine Fisheries Service does not differentiate the
two species. In 2007, landings of menhaden—both bait and reduction fisheries--were reported
for twelve Northwest Atlantic coastal states: (1) Virginia, (2) New Jersey, (3) Maryland, (4)
Massachusetts, (5) North Carolina, (6) New York, (7) Connecticut, (8) Maine, (9) Florida East
Coast, and (10) Rhode Island, (11) Delaware, and (12) New Hampshire. Of the fourteen
Northwest Atlantic coastal states—Maine through Florida, nine either prohibit the use of purse
seines to catch menhaden or the harvesting of menhaden by purse seines for reduction purposes.
Virginia and North Carolina allow the harvesting of menhaden by purse seine for reduction
purposes. The North Carolina fishery ceased operations in 2004, and Virginia in conjunction
with the Atlantic States Marine Fisheries Commission imposes an overall cap or quota on
landings and has seasonal and spatial limits, along with limits on by catch. The present cap on
harvests from Chesapeake Bay is 109,020 metric tons. The seasonal limits are May 1 to the
Saturday following the third Friday of November. In 2010, the allowable cap was increased to
122.7 thousand metric tons because of under harvesting in 2009. The current management
regime allows under-harvest in one year to be credited to the next year.
The commercial reduction fishery is located in Reedville, Virginia where2 OMEGA
Protein is the sole harvester and processor of menhaden into meal and oil. While bait fisheries
for menhaden exist in several states, purse seines are prohibited unless the harvesting is primarily
for baitfish; e.g., Rhode Island, Maine, New York, New Jersey, Virginia, and North Carolina.
The fact that only one company processes menhaden for meal and oil has been a point of
contention by those opposed to the reduction fishery. Many incorrectly view OMEGA as a
monopoly; there are substitutes available for menhaden (e.g., other species and various plants,
such as soybeans). OMEGA falls more in line with what is referred to as monopolistically
competitive; that is, they can differentiate their product, but there are substitutes available.
The commercial menhaden fishery is viewed as being highly important to the economy of
Reedville, Virginia. During calendar year 2008, OMEGA employed up to 317 individuals in
Reedville.3 The company employs approximately 127 full-time, year-round employees. The
Reedville facility had total sales of approximately $60.0 million in 2008. The latest information
available indicates that the population of Reedville is 2,140 individuals, and mean income per
household is $39.3 thousand. In 2008, the population of Northumberland County was
approximately 12.9 thousand individuals. The median household income for Northumberland
was $47.2 thousand in 2008. Private nonfarm employment was approximately 2.0 thousand
individuals in 2007.4 The North Carolina Economic Intelligence System estimates that the per
capita income in Northumberland County equaled $27.5 thousand in 2008, and that the total
employment for 2008 equaled 5.6 thousand individuals.
OMEGA Protein employed up to 317 individuals in 2008. Mean monthly income per
employee ranged from $2.2 thousand in February to a high of $5.6 thousand in 2008. Mean
2 Reedville is located in Northumberland County, Virginia.
3 All information on employment and statistics related directly to operations of OMEGA Protein were
provided by OMEGA Protein. 4 Summary statistics for Northumberland County were obtained from the U.S. Census Bureau, State and
County Quick Facts and are based on the most recent data available.

Page | 3
annual income equaled $44.3 thousand, which is considerably higher than the per capita income
for all of Northumberland County; i.e., $27.5 thousand. The major sources of employment for
Northumberland County are manufacturing, which includes OMEGA Protein‘s processing
activities, retail trade, and construction.5 A report done during the 1990s, ―The Economy and
Demographics of Northumberland County, Virginia‖ listed tourism as the county‘s fastest
growing industry. Based on the detailed North American Industry Classification of industries,
seafood packaging and preparation, which includes OMEGA Protein, generated the largest
employment for Northumberland County in 2008.
1.2 Management and Resource Conditions of Menhaden
Presently, the menhaden fishery is managed under the purview of the Atlantic States
Marine Fisheries Commission (ASMFC) with each state implementing its own regulations
consistent with realizing the goals and objectives of ASMFC. The first Fishery Management
Plan (FMP) was developed in 1981. Since then, there have been several revisions and addenda.
An error in the assessment was identified which resulted in a change in overfishing status. The
latest stock assessment by the ASMFC concluded the stock is not overfished but it experienced
overfishing in 2008 (ASMFC, 2010). Addendum V seeks to consider revision of the
management plan‘s biological reference points and proposes new thresholds and targets.
Addendum IV extended the overall cap of 109.0 thousand metric tons through 2013. Of all
states between Maine and Florida, except Virginia, management and regulations are established
by respective state resource agencies. In Virginia, management and regulation of menhaden is
under the control of the General Assembly, and the regulations are listed in the Code of Virginia,
which has been a contentious issue for many years. All states between Maine and Florida,
except Massachusetts, New York, Virginia, and North Carolina, either prohibit the use of purse
seines or prohibit the harvesting of menhaden for reduction purposes.
The latest stock assessment by the ASMFC concludes the stock is not overfished and
overfishing is not occurring relative to the current reference points (ASMFC, 2010). This
assessment, however, was based on a 2008 benchmark. A January 2011 ―Quick Guide to
ASMFC Species Stock Status,‖ based on a 2009 benchmark assessment declared overfishing to
be occurring. Uncertainties in the assessment, however, do not preclude the possibility that
overfishing may have occurred in 2008. The stock assessment report also indicates that the
determination of overfishing requires development of new reference points. The Stock
Assessment Panel recommended that alternative reference points be considered and chosen on
the basis of providing better protection for spawning stock biomass (SSB) or population
fecundity relative to the unfished level. Addendum V proposes some alternative reference points
for fishing mortality relative to spawning stock biomass.
Regardless of whether or not the resource is being overfished or overfishing is occurring,
there is an issue about whether or not the ecosystem services of menhaden have declined over
time. That is, has the continued harvesting of menhaden affected water quality and populations
of predators, such as certain species of finfish, marine mammals, and seabirds? A recent study
by Lynch et al. (2010) indicates that menhaden have little, if any, impact on water quality. The
importance of menhaden to major predators has not been scientifically established, but it is well
5 Data on employment by industry obtained from the Virginia Employment Commission.

Page | 4
known that menhaden constitute a large proportion of the diet of predators, which include
important game fish, seabirds, and marine mammals.
1.3 Study Background
In 2007, the Virginia Marine Resources Commission (VMRC) and the Secretary of
Natural Resources expressed concern about the social and economic importance of menhaden to
Maryland and Virginia. The VMRC, subsequently, commissioned a study, funded with the
approval of the Recreational Fishing Advisory Board and the Commercial Fishing Advisory
Board, to estimate and assess the social and economic importance of menhaden to Chesapeake
Bay region. One major question the VMRC wanted answered was ―what would be the changes in
the social structure and economies of the region in response to different regulatory regimes?‖
Another major question, and possibly the more important one, was ―what is the economic value
of menhaden?‖ That is, what is the benefit to society from the menhaden resource?
Alternatively, ―are menhaden worth more to society in the water than on the boat?‖ The major
focus of the impact and valuation assessment was the Virginia reduction fishery, and not any of
the various state, coastal, or bait fisheries.
In this report, we present estimates of the social and economic impacts and the economic
valuation of the current reduction fishery as well as changes in the allowable harvest levels of the
reduction fishery. The social ramifications, while highly important, are primarily limited to
descriptions of the basic social and economic structures of the various coastal counties potential
affected by the menhaden fishery. In depth-interviews, of the employees of OMEGA, however,
were conducted in an effort to assess how they would be affected by changes in the regulations
for the reduction fishery; and these are presented in this report. We also present estimates of the
economic value of menhaden to stakeholders in Maryland and Virginia. These values were
based on data obtained from a three-tier survey, which included a telephone survey, an Internet
survey, and a mail survey. The survey focused on obtaining data on the dollar amounts
individuals would be willing to annually pay for different levels of commercial harvest of
menhaden for reduction purposes.
1.4 Organization of Report
The report is organized as follows: (1) chapter 2 provides a discussion and overview of
the fishery, management regime, and issues related to the fishery; (2) chapter 3 presents a
discussion on the social and economic structure of the various counties, which might be affected
by the fishery or resource; (3) chapter 4 presents the economic impacts associated with different
allowable levels of total catch for the reduction fishery; (4) chapter 5 presents the economic
valuations associated with different allowable levels of total catch; and (5) chapter 6 presents the
summary and conclusions.

Page | 5
2.0 Overview of the Menhaden Resource and Fishery
2.1 Menhaden: Basic Biological Characteristics
The life history of Atlantic menhaden (Brevoortia tyrannus) is well described in
numerous scientific documents (e.g., the 2006 stock assessment prepared by members of the
Atlantic Menhaden Technical Committee of the Atlantic States Marine Fisheries Commission).
Atlantic menhaden are found in near shore and inland tidal waters from Nova Scotia, Canada to
Florida (ASMFC, 2006). They are in the Clupeidae family that includes herrings and sardines,
which are viewed as filter feeders and either primary (i.e., eat phytoplankton) or secondary (i.e.,
eat zooplankton) consumers or both (Ahrenholz, 1991). They are also viewed as very important
prey for numerous other species of fish, seabirds, and various marine mammals.
Menhaden typically migrate northward in the early spring and southward in the fall. Not
all menhaden migrate equal distances. Over summer, the coastwide stock is stratified by latitude
and age; older fish migrate farther distances such that they are more abundant in northerly
habitats Some spawning does occur year round, but peak spawning usually occurs off the coast
of North Carolina between October and March. Menhaden are generally sexually mature by age
3 or late age 2, virtually all are mature at Age 2, and are relatively prolific spawners (ASMFC,
2006). Menhaden are viewed as being comprised of a single coastwide stock. Full (100%)
recruitment to the fishery occurs at approximately age 2.
Adult menhaden are filter feeders, which feed on phytoplankton and zooplankton. Their
role in affecting water quality because of the filtration properties remains uncertain. In fact, a
recent study by Lynch et al. (2010) indicates that the population of menhaden may have little
effect on water quality. Relative to 2008, the stock has been declared as not being overfished but
overfishing was occurring (ASMFC, 2010). A more recent benchmark assessment based on
2009 does indicate, however, that overfishing is occurring. The assessment completed in 2010
indicates that the abundance of menhaden was the lowest it had ever been relative to 1955—
109.0 billion in 1955 vs. 18.2 billion fish in 2008. A major concern is that while fecundity is
believed to be high enough to sustain the resource, the number of young fish surviving is low.
The coastwide recruitment level of menhaden has been depressed for 20 years. Young-of-the-
year juveniles are the major prey of the fish and bird predators. Historically, Chesapeake Bay
supplied more than 65% of the coastwide recruits to the population. So, the very low
recruitments for 20+ years may have impacted the coastwide stock‘s abundance and its
fecundity. Because of concerns about the status of the resource, new threshold and biological
reference points are being established.
2.2 Menhaden and the Reduction Fishery: An Historical Perspective6
George Brown Goode (1880) wrote one of the earliest descriptions of the menhaden
fishery ―A History of the Menhaden with an Account of the Agricultural Uses of Fish.‖ The
story of the fishery began in 1621, so it is said, when an Indian named Tisquantum (Squanto)
6 Although menhaden are harvested for both bait and reduction, the emphasis of this study and report is on
the reduction fishery.

Page | 6
advised the colonists in Plymouth on how to use menhaden as fertilizer for their crops.7 As
noted by Frye (1978), this advice, however, may have more of a prank to make the colonists look
silly than being actual useful advice to help agricultural production.
Despite widespread use of menhaden as both bait and fertilizer, menhaden have not
always been exclusively harvested for fertilizer, bait, meal, and oil. As noted by Frye (1978),
menhaden were also harvested for human consumption. According to Frye, Catesby referred to
menhaden as an ―excellent sweet fish,‖ and so excessive in fat that butter is not necessary to fry
them. William Byrd commended menhaden as food for a gourmet. In the latter 1800s,
menhaden were regularly sold as food fish in the Washington, DC fish markets. Menhaden were
also salted and shipped in large quantities to the West Indies and Guianas during the 18th
and 19th
centuries to feed plantation workers. In the 1870s, the American Sardine Company of New
Jersey was canning and shipping sardines around the world and was given a medal of merit at
Vienna in 1873. In the 1940s, menhaden were being canned as sardines and processed into fish
cakes for shipment to the Soviet Union and Great Britain. At one time, the US Bureau of
Commercial Fisheries had a marketing program to encourage the consumption of menhaden as
food (Figure 1).
Figure 1:
Menhaden Marketing Poster: US Bureau of Commercial Fisheries
7 Much of the discussion in this section is based on material in John Frye‘s text ―The Men All Singing: The
Story of Menhaden Fishing.‖

Page | 7
In the early 1880s, exploitation of the resource substantially increased. The primary
reason for increased exploitation appears to be related to the use of menhaden to produce fish oil
(Frye, 1978). In 1824, an individual named Barker developed a portable device for reducing
menhaden to oil. Subsequently, John Tallman constructed the first factory to cook fish by steam,
and then a second factory in 1841. In 1826, the first purse seine vessel was constructed, which
eventually displaced most of the other types of vessels and gears used to harvest menhaden. By
1879, there were approximately 56 factories, 279 vessels, and 3,337 fishermen landing and
processing nearly 800 million fish.
In 1955, there were 23 reduction plants operating along the Atlantic coast (Smith, 1991).
There were 150 vessels, which landed 641,400 metric tons of menhaden (Table 2.1). In 1960, 20
plants and 160 vessels landed and processed 529,800 metric tons of menhaden. Prior to 1997,
there were two companies (AMPRO or American Protein and OMEGA Protein) processing
menhaden in Virginia and one company operating in North Carolina. The North Carolina
company ceased operations in 2004. In 2008, there was one plant, OMEGA Protein, harvesting
and processing Atlantic menhaden for reduction. OMEGA bought out AMPRO and shuttered
AMPRO operations in 1997. The current OMEGA plant is based in Reedville, Virginia
(Northumberland County) and operates 10 purse seine vessels. In 2008, approximately 141,100
metric tons were landed and processed; reduction landings of menhaden equaled 143,800 metric
tons in 2009 (The Atlantic Menhaden Review Team, 2010).

Page | 8
Table 2.1. Reduction Plants, Purse Seine Vessels, and Landings (1,000 mt), Atlantic Coasta
Year Plants Vessels Landings (1,000 mt)
1955 23 150 641.4
1956 24 149 712.1
1957 25 144 602.8
1958 22 130 510.0
1959 23 144 659.1
1960 20 115 529.8
1961 20 117 575.9
1962 19 112 537.7
1963 17 112 348.9
1964 18 111 269.2
1965 18 84 273.4
1966 17 76 219.6
1967 20 64 183.5
1968 18 59 234.8
1969 17 51 161.6
1970 15 54 258.4
1971 14 51 250.3
1972 11 51 365.9
1973 11 58 346.9
1974 10 63 292.2
1975 12 61 250.2
1976 11 62 340.5
1977 12 64 341.1
1978 12 53 344.1
1979 12 54 375.7
1980 11 51 401.5
1981 11 57 381.3
1982 11 47 382.4
1983 10 41 418.6
1984 8 38 326.3
1985 6 24 306.7
1986 5 16 238.0
1987 6 23 327.0
1988 6 30 309.3
aSource of Data: Smith, J.W. (1991). The Atlantic and Gulf Purse Seine Fisheries: Origins,
Harvesting Technologies, Biostatistical Monitoring, Recent Trends in Fisheries Statistics, and
Forecasting. Marine Fisheries Review.

Page | 9
Menhaden are not currently harvested only for reduction. There appears to be a growing
menhaden fishery for bait.8 This has occurred, in part, to rising prices and reduced supplies of
Atlantic sea herring, which has been the primary bait for the American lobster fishery.
Menhaden are used as bait in both the American lobster and blue crab fisheries. In 2008, 46.8
thousand metric tons of menhaden were harvested for bait; in 2009, landings of menhaden for
bait declined to 37.9 thousand metric tons (Table 2.2).
Table 2.2. Menhaden Landings for Bait, by Regiona (1000’s of Metric Tons)
Year New England Mid-Atlantic Chesapeake Bay South Atlantic Total
1985 6.15 1.82 16.42 2.27 26.66
1986 13.75 1.33 10.46 2.44 27.98
1987 13.28 1.29 13.50 2.56 30.63
1988 19.73 1.21 12.43 2.88 36.25
1989 9.54 1.58 16.48 3.41 31.02
1990 11.19 4.49 11.06 4.07 30.80
1991 14.47 7.98 10.40 3.39 36.23
1992 12.44 13.04 10.45 3.10 39.03
1993 11.64 13.40 15.65 2.10 42.80
1994 0.43 17.81 17.72 3.17 39.14
1995 4.08 17.18 19.55 1.57 42.39
1996 0.04 16.20 18.49 0.58 35.31
1997 0.14 17.60 17.13 1.66 36.53
1998 0.21 15.34 22.49 1.33 39.37
1999 0.15 12.78 21.94 1.32 36.20
2000 0.19 14.50 19.65 0.97 35.30
2001 0.08 12.18 22.67 1.37 36.31
2002 0.69 11.50 23.73 1.14 37.06
2003 0.12 8.00 24.93 0.79 33.85
2004 0.03 9.60 25.33 0.50 35.47
2005 1.02 8.18 28.97 0.66 38.83
2006 1.56 9.89 14.50 0.51 26.45
2007 2.61 17.10 22.54 0.55 42.80
2008 7.78 17.55 21.15 0.31 46.79
2009 3.71 15.00 18.17 0.99 37.87
aSource of Data: Atlantic States Marine Fisheries Commission (2010). 2010 Review of the
Fishery Management Plan and State Compliance for the 2009 Atlantic Menhaden Fishery.
8 It should be acknowledged that monitoring of bait landings has greatly improved over time, so the trend
given by the data could be tracking quality/coverage of sampling as much as changes in bait landings.

Page | 10
In 1950, total reported landings for reduction and bait of menhaden equaled 317.6
thousand metric tons (Table 2.3). Landings increased to an all time high between 1950 and 2009
of 697.4 thousand metric tons in 1956. In 2009, total reported landings equaled 183.8 thousand
metric tons. During the 1950s, average annual landings equaled 535.1 thousand metric tons.
Average annual landings were below 350.0 thousand metric tons for all decades after the 1950s.
Between 2000 and 2009, average annual landings equaled 204.9 metric tons. For the past 30
years, there has been a generally downward trend in total landings of menhaden (Figure 2) which
it should be remember has been concurrent with the decline in fishing effort.
Table 2.3. Total Landings (metric tons) of Menhaden, Atlantic Coastal States, 1950 – 2009
Year Metric
Tons
Virginia
Landings
Virginia’s
Share of
Landings
Average
Total 10
year
Average
VA 10
year
Average
VA 10 year
Share
1950 317,648.4 77,027.5 24.25
1951 348,861.8 57,604.1 16.51
1952 418,945.6 41,245.4 9.85
1953 571,092.3 72,609.9 12.71
1954 606,243.0 129,244.6 21.32
1955 629,043.9 142,166.1 22.60
1956 697,362.1 85,751.2 12.30
1957 602,193.6 120,408.7 20.00
1958 501,802.0 145,383.2 28.97
1959 658,122.4 187,019.0 28.42 535,131.5 105,846.0 19.7
1960 534,045.6 111,585.5 20.89
1961 587,065.3 133,857.0 22.80
1962 585,738.0 146,781.4 25.06
1963 384,697.7 115,994.7 30.15
1964 302,016.0 150,008.4 49.67
1965 318,992.6 159,490.7 50.00
1966 233,619.8 123,555.5 52.89
1967 210,296.0 99,912.4 47.51
1968 250,269.3 122,342.9 48.88
1969 177,051.3 80,828.9 45.65 358,379.2 124,435.7 39.4
1970 284,870.8 202,286.1 71.01
1971 266,192.2 178,783.0 67.16
1972 378,038.7 249,204.7 65.92
1973 369,109.7 224,967.2 60.95
1974 319,762.7 172,027.4 53.80
1975 275,189.1 143,238.4 52.05

Page | 11
(Continued)
Year Metric
Tons
Virginia
Landings
Virginia’s
Share of
Landings
Average
Total 10
year
Average
VA 10
year
Average
VA 10 year
Share
1976 363,636.4 199,927.7 54.98
1977 361,776.7 227,376.2 62.85
1978 333,988.8 190,879.7 57.15
1979 404,113.9 206,549.9 51.11 335,667.9 199,524.0 59.7
1980 429,722.3 243,682.3 56.71
1981 402,762.2 181,760.0 45.13
1982 401,521.3 271,537.2 67.63
1983 400,124.6 292,440.0 73.09
1984 307,779.7 220,373.3 71.60
1985 356,432.9 290,083.2 81.39
1986 249,856.6 202,156.6 80.91
1987 318,592.0 279,199.4 87.64
1988 296,756.7 249,730.7 84.15
1989 313,157.0 277,675.0 88.67 347,670.5 250,863.8 73.7
1990 362,590.5 319,588.5 88.14
1991 343,833.1 272,697.0 79.31
1992 311,927.1 260,739.7 83.59
1993 344,856.9 289,995.6 84.09
1994 286,443.1 232,817.6 81.28
1995 363,588.1 319,535.3 87.88
1996 305,787.6 265,034.8 86.67
1997 291,133.6 225,510.7 77.46
1998 275,425.1 230,757.4 83.78
1999 208,214.6 171,531.4 82.38 309,380.0 258,820.8 83.5
2000 208,871.3 166,529.5 79.73
2001 260,690.8 220,967.0 84.76
2002 210,918.6 165,536.3 78.48
2003 203,103.8 169,585.2 83.50
2004 214,088.9 181,347.1 84.71
2005 194,281.2 169,000.2 86.99
2006 182,732.5 168,279.6 92.09
2007 217,028.1 190,525.1 87.79
2008 173,567.4 160,294.0 92.35
2009 183,822.6 159,392.6 86.71 204,910.5 175,145.7 85.7

Page | 12
Figure 2. Total Landings (metric tons) of Atlantic Menhaden, 1950-2009
2.3 Menhaden and the Atlantic Coastal States
What are the Atlantic coastal states with menhaden fisheries? Between 1950 and 2009,
all 14 Atlantic coastal states had some level of landings (Table 2.4). In 1950, all states except
Georgia and New Hampshire had reported landings of menhaden. Between 1950 and 2009, only
five states landed menhaden in each year—Connecticut, Florida, New York, North Carolina, and
Virginia. Maryland and New Jersey had landings in nearly all years. Maryland had no reported
landings in 1995 and 1996, and New Jersey had no reported landings in 2008. Georgia had
landings in only one year—1982, and the level was 0.1 metric tons. New Hampshire had
landings in only ten years between 1950 and 2009. It is clear that Virginia stands out with the
highest level of landings among all the states. In 1950, Virginia landings accounted for 24.3% of
total Atlantic menhaden landings; in 2009, Virginia landings accounted for nearly 87.0% of total
landings; and over the entire period, 1950-2009, landings of menhaden in Virginia accounted for
53.3% of the total landings of Atlantic menhaden.

Page | 13
Table 2.4. Landings (metric tons) and Share of Total Landings by Coastal State.
State 1950-2009 Share of
Total 1950
Share of
Total 2009
Share of
Total
Connecticut 4,162.80 0.02 19.80 0.01 73.30 0.04
Delaware 1,692,800.00 8.10 68,882.10 21.69 31.80 0.02
Florida 466,470.90 2.23 9,642.90 3.04 23.90 0.01
Georgia 0.10 0.00 0.00 0.00 0.00 0.00
Maine 181,192.00 0.87 222.30 0.07 75.70 0.04
Maryland 137,878.30 0.66 497.80 0.16 4,337.40 2.36
Massachusetts 308,294.90 1.47 3,974.40 1.25 3,174.60 1.73
New
Hampshire 230.80 0.00 0.00 0.00 0.00 0.00
New Jersey 2,859,900.00 13.68 62,858.80 19.79 15,543.10 8.46
New York 652,507.30 3.12 37,426.50 11.78 157.50 0.09
North
Carolina 3,296,700.00 15.77 56,656.50 17.84 963.80 0.52
Rhode Island 149,426.00 0.71 3.70 0.00 48.90 0.03
South
Carolina 15,420.70 0.07 436.10 0.14 0.00 0.00
Virginia 11,146,000.00 53.30 77,027.50 24.25 159,392.60 86.71
Total 20,911,000.00 100.00 317,648.40 100.00 183,822.60 100.00
Data discrepancies, however, complicate the assessment of trends in landings of Atlantic
menhaden. First, more than one type of menhaden is harvested in the bait and reduction
fisheries. Occasionally, yellowfin menhaden may be caught, but the National Marine Fisheries
Service (NMFS) does not uniquely identify the two types of menhaden. Then, there are data
reporting discrepancies. NMFS, in its electronic data base available on line, indicates that in
2009, Virginia landings from 0 to 3 miles equaled 30,836,000 pounds of Atlantic menhaden;
319,979,000 pounds were landed from 3 – 200 miles. In their Fisheries of the US Report for
2009, NMFS reports total menhaden landings for Atlantic coastal states equaling 33,139,000 for
3 - 200 miles and 368,560,000 for 0 – 3 miles.
Landings data for the menhaden purse seine fishery, as well as several other fisheries, are
usually viewed as confidential. If it is possible to uniquely identify a company from the data,
then typically landings data are grouped into some other species grouping. A recent memo from
Joe Smith to NMFS personnel with special interest in menhaden (December 17, 2010), however,

Page | 14
reports that landings by the purse seine fleet in Reedville, VA equaled 473,030,000 standard
fish9 or 143,754 metric tons; landings in 2010 equaled 602,450,000 standard fish or 183,085
metric tons. Landings in 2010 represent a 27.4 % increase over the landings in 2009.10
In 1955, Atlantic purse seine landings equaled 641.4 thousand metric tons (Table
2.5). In 2009, purse seine landings equaled 143.8 thousand metric tons, which represents a
decline of 77.6 % relative to landings in 1955. Again, effort has declined considerably over this
time period as the infrastructure of the reduction operation has deteriorated along the coast. In
2008 and 2009, only one company was harvesting Atlantic menhaden via purse seine for
reduction purposes. The 2008 fishing year had the lowest effort level on record. While the total
landings have substantially declined, the landings per unit effort (LPUE) have substantially
increased. In 1955, LPUE equaled 233.4 metric tons per vessel week but increased to 479.3
metric tons per vessel week in 2009. How much of the increase is associated with changes in
resource conditions versus changes in technical efficiency is not known. Given that the 2010
stock assessment for menhaden indicates a substantial decline in the number of Atlantic
menhaden, it appears that gains in LPUE were driven mostly by improvements in technical
efficiency especially searching strategies, locating capability, and more careful allocation of
effort to raise efficiency (ASMFC, 2010).
9 1000 standard fish equals 670 lbs. This is then converted to kg and mt. NMFS.
10 There was a shift in effort by OMEGA to the Atlantic given the Deep Water Horizon spill in April 2010.
Through Sep 30, 2011, landings of gulf menhaden are 85% higher in 2011 than 2010

Page | 15
Table 2.5 Menhaden Landings, Atlantic Purse Seine Fishery, 1955-2009a
Year Fishing effort
vessel-weeks
Landings
(1000’s metric
tons)
Year Fishing effort
vessel-weeks
Landings
(1000’s metric
tons)
1955 2,748 641.4 1982 948 382.4
1956 2,878 712.1 1983 995 418.6
1957 2,775 602.8 1984 892 326.3
1958 2,343 510.0 1985 577 306.7
1959 2,847 659.1 1986 377 238.0
1960 2,097 529.8 1987 531 327.0
1961 2,371 575.9 1988 604 309.3
1962 2,351 537.7 1989 725 322.0
1963 2,331 346.9 1990 826 401.2
1964 1,807 269.2 1991 926 381.4
1965 1,805 273.4 1992 794 297.6
1966 1,386 219.6 1993 626 320.6
1967 1,316 193.5 1994 573 260.0
1968 1,209 234.8 1995 600 339.9
1969 995 161.6 1996 528 292.9
1970 906 259.4 1997 616 259.1
1971 897 250.3 1998 437 245.9
1972 973 365.9 1999 382 171.2
1973 1,099 346.9 2000 311 167.2
1974 1,145 292.2 2001 334 233.7
1975 1,218 250.2 2002 318 174.0
1976 1,163 340.5 2003 302 166.1
1977 1,239 341.1 2004 345 183.4
1978 1,210 344.1 2005 291 146.9
1979 1,198 375.7 2006 322 157.4
1980 1,158 401.5 2007 333 174.5
1981 1,133 381.3 2008 262 141.1
2009 300 143.8
aSource of Data: National Marine Fisheries Service, Sustainable Fisheries Branch,
Beaufort, NC. Forecast for the 2010 Gulf and Atlantic Menhaden Purse-Seine Fisheries.

Page | 16
2.4 Management and Regulation of the Atlantic Menhaden Fishery
The Atlantic States Marine Fisheries Commission (ASMFC) maintains a list of current
menhaden regulations by state (Table 2.6). The first Fishery Management Plan (FMP) for
Atlantic menhaden was developed in 1981. The original FMP did not provide or require any
specific management measures. In 1982, the Atlantic menhaden Management Board
recommended seasonal limits, but the proposed limits were never fully implemented (ASMFC,
2004). The FMP was revised in 1992, but the revisions focused primarily on data collection
activities and research needs. Amendment 1 was subsequently implemented in 2001 (ASMFC,
2001). This amendment developed a new overfishing definition and required all purse seiners to
report their catches. Since 2001, there have been four addenda to the FMP. Addendum III
established an annual harvest limit or cap of 109.0 thousand metric tons on reduction harvest
levels from Chesapeake Bay. Addendum IV, the most recent, extends the harvest cap through
2013. Addendum V (2011) is the subject of public hearings at the time of this report.
Each Atlantic coastal state has its own set of regulations for menhaden. Most of the
regulations prohibit the harvesting of menhaden either by purse seine or for reduction (Table
2.6). The states of Rhode Island and New Jersey explicitly prohibit the harvesting of menhaden
for reduction purposes. The states of New Hampshire, Connecticut, Delaware, Maryland, South
Carolina, Georgia, and Florida either prohibit purse-seine operations or mobile gear fisheries in
state waters. Massachusetts, Virginia, New York, and North Carolina permit the harvesting of
menhaden either by purse seine or for reduction purposes subject to spatial and temporal
restrictions. The Virginia reduction fishery is also subject to an annual quota of 109.0 thousand
metric tons from Chesapeake Bay.
Table 2.6. Atlantic Menhaden Regulations by Statea
Maine Reporting requirements cover all baitfish fisheries, including gillnets
and purse seines.
New Hampshire State law prohibits the use of mobile gear in state waters
Massachusetts No specific menhaden regulations. Purse seining prohibited in some
areas. Mandatory dealer reporting (SAFIS).
Rhode Island Menhaden harvest by purse seine for reduction (fish meal) purposes
is outlawed. Mandatory dealer reporting (SAFIS).
Connecticut Purse seines prohibited in state waters. Menhaden can be caught by
other gear and sold as bait.
New York Mandatory reporting for all commercial food fish license holders,
this includes all who harvest menhaden. Purse seines limited to
certain times/areas.
New Jersey Prohibited purse seining for reduction purposes in state waters.
Mandatory reporting for purse seine (bait) fishery. Bait fishery
subject to gear restrictions and closed seasons.
Delaware Purse-seine fishery prohibited since 1992. No specific regulation of
gillnetting for menhaden.
Maryland Purse-seine fishing prohibited; menhaden primarily harvested by pound
net

Page | 17
Potomac River
Fisheries
Commission
All trawling and purse nets are prohibited. Mandatory commercial
fishing reporting
Virginia Implemented reporting requirement for bait seine/snapper rigs in
2002. The reduction fishery landings in VA are reported via daily
catch records and CDFRs to the NMFS. Required cap on reduction
harvest from Chesapeake Bay.
North Carolina Mandatory commercial fishery reporting (trip ticket). Combination
of gear restrictions and seasonal and area closures
South Carolina Purse seines prohibited in state waters; mandatory dealer reporting;
requests de minimis status
Georgia Mandatory commercial fishery reporting (trip ticket); state waters
closed to purse seine fishing; requests de minimis status.
Florida Purse seines prohibited in state waters; primarily a cast net fishery;
mandatory commercial fishery reporting (trip-ticket).
aSource of Information: Atlantic States Marine Fisheries Commission. ―Managed
Species, State by State Regulations.‖

Page | 18
3.0 OMEGA Protein: The Company
3.1 An Overview
OMEGA Protein goes back to 1878 when John and Thomas Haynie established a fish
processing facility in Reedville, VA.11
Initially, the company was called the John
A. Haynie Company. In 1903, the company merged with Snow, Fallin Company. In 1913,
William Brusstar joined the company and it became known as Reedville Oil and Quano. In
1968, the company became Haynie Products, Inc., and in 1970, Haynie merged with Zapata Oil
and became known as Zapata Haynie Corporation.12
The company was renamed Zapata Protein,
and subsequently, changed its name in 1997 to OMEGA Protein.
In the early stages of the company, production focused on producing guano for fertilizer
and oil. Today, the company produces meal, oil, and solubles but their intended uses have
dramatically changed. Uses of menhaden based products include food items, health
supplements, fishmeal for use in livestock, poultry, and aquaculture production, a wide array of
industrial applications, and in animal nutrition. Menhaden oil is even used in various yogurts,
breakfast cereals, margarine, and shortenings.
Since 2005, OMEGA Protein has been the only company harvesting and processing
Atlantic menhaden for oil, meal, and soluble in the Northwest Atlantic region. In 2005,
reduction landings equaled 146.9 thousand metric tons; increased to 174.5 thousand metric tons
in 2007; and fell to 143.8 thousand metric tons in 2009 (Sustainable Fisheries Branch, NMFS,
2010).
Currently, OMEGA Protein maintains its corporate office in Houston, Texas. It is
incorporated in the state of Nevada. The company maintains operations in both the northwest
Atlantic and the Gulf of Mexico. It has processing facilities in Louisiana, Mississippi, and
Reedville, Virginia. In 2009, OMEGA Protein had operating revenues of $164.9 million, and an
operating loss of $4.3 million (Annual Report, 200913
). It had a net income loss of $6.2 million.
Between 2006 and 2008, the company had positive operating income and net income in all years.
During 2009, the company employed between 503 (December 2009, offseason) and 1,148
(August, peak season) individuals. In 2008 and 2009, the company had export sales of fishmeal
and fish oil of $81.0 million in each year. In 2008, total fish catch equaled 458.1 thousand tons,
and increased to 469.1 thousand tons in 2009. Its production of fishmeal, oil, and solubles
equaled, respectively, 178.7 and 180.1 thousand tons in 2008 and 2009. In 2008 and 2009, total
sales equaled, respectively, $177.4 and $164.9 million.
3.2 OMEGA Protein: Reedville, VA
The harvesting and processing activities conducted by the Reedville, Virginia facility are
at the center of the controversy about the harvesting of Atlantic menhaden from the Northwest
11
Much of the material in this section is based on information available from the OMEGA Protein web site
and John Frye‘s (1978) text ―The Men All Singing: The Story of Menhaden Fishing.‖ 12
George W. Bush started Zapata Oil for oil and natural gas exploration in 1952. 13
www.omegaproteininc.com/investors/annual-report.asox

Page | 19
Atlantic. Various individuals and associations have complained about odor from the plant; the
company is overfishing the menhaden resource and jeopardizing water quality of Chesapeake
Bay; major predators, particularly various game fish such as striped bass, bluefish, and spotted
sea trout, are being deprived of important prey species; the company is a monopoly; menhaden
are not directly consumed as human food; few states allow harvesting menhaden for reduction
purposes; and the products produced using menhaden could be produced from other raw
materials.
The validity of the various concerns and issues is uncertain. For example, Lynch et al.
(2010) concluded that menhaden had little, if any, effect on water quality. A textbook type
analysis of the sales and distribution of menhaden products, as well as the argument that other
products could be used to produce the same product, negates the argument that OMEGA Protein
is a monopoly. It is true that major predators do consume menhaden, but the dependence on
menhaden for the well being of the predator populations is unknown. Nevertheless, the
Commonwealth of Virginia‘s concern about the social and economic importance of menhaden to
the region resulted in their request for a study of the reduction fishery. Issues to be addressed
were as follows: (1) the economic importance of the reduction fishery and related activities to the
economy of Commonwealth and Maryland; (2) the communities or counties which might be
affected by reductions in the allowable harvest of menhaden from Chesapeake Bay; and (3) the
economic value of ecosystem services of menhaden vs. the value of the harvesting and reduction
activities.
3.2.1 REEDVILLE PROFILE
The harvesting and reduction activities are based in Reedville, which is located in
Northumberland County, Virginia. In the following section, we provide a brief profile of
Reedville, Virginia.14
3.2.1.1 Geographic Description
Reedville is located at the distal end of the Northern Neck, projecting into Chesapeake
Bay. While Cockrell‘s Creek is most associated with Reedville, the community is proximate to
the Wicomico River, and northerly portions of the community are adjacent to the Potomac River.
Reedville, like many fishing communities in Virginia, is unincorporated, and
unfortunately is not a census designated place making data availability limited from the U.S.
Census Bureau. Reedville, in general, focuses around Cockrell Creek, with a portion of the
community in the village of Fleeton, situated to the east of the creek, another portion to the west
of the creek in Fairport, and ―downtown‖ or Main Street Reedville projecting into the creek from
the north. Somewhat further north, toward Burgess (another unincorporated community in
Northumberland County), is Greenfield, which is also within the Reedville zip code. Also
recognized within Reedville are villages of Tibitha and Chesapeake Beach.
14
Information for this community profile was collected from interviews and community visits in the area in
2008. Additional information was gathered from existing published data and citations are provided. The profile of
Reedville, the geographic description, and the descriptions of the historic and modern menhaden fisheries was
prepared by Winnfred Ryan (formerly a VIMS employee).

Page | 20
The community of Reedville is predominantly a fishing and residential community. In
the last 10 or 15 years additional residential development has been, but no additional large
employment bases have developed in the locale.
3.2.1.2 Importance of Fishing
Fishing is important in Reedville. There is a crab processor that receives some fresh crab
in the area of Greenville; a crab house that handles soft crab; another fish house that handles
several types of fish; a seafood restaurant and a major bait provider on Main Street; on the
Fleeton side, there is a fish house that handles several types of fish and has associated a deli and
retail fish shop in addition to a major processor and a marina with the Smith Island Ferry, and
several crabbers with numerous pots located on their docks are observed in the area; and on the
Fairport side there is a now predominantly closed down fish factory, a marina with seafood
restaurant, and the Tangier Island Ferry. Otherwise for economic activity, there is some limited
retail shopping, with two small ―general store‖ type groceries, one located nearer Greenfield, and
one near Tibitha, a fabric and quilt store, a thrift shop, a boat dealer, a hardware store, an
exercise studio, and four restaurants (one an ice cream parlor), in addition to a bank and an
acupuncturist, which were observed in the locality.
3.2.1.2.1 Historic Fishing
Fishing has been an activity in the area since pre-Colonial days. Native Americans in
Virginia used weirs and spears, and Colonial era farmers took advantage of anadromous fish runs
to supplement farming (Wharton, 1957), even to feed the slaves that worked plantations along
the rivers of Virginia, including those of the Northern Neck. In the mid-1800s, Elijah Reed
brought menhaden fishing and processing to Cockrell‘s Creek. By 1912, there were eight plants
capitalized at two million dollars in and around Reedville on the creek with more than 60 fish
boats steaming forth weekdays in the summer (Frye, 1978). At that time there were 20 plants in
Virginia, and an additional eight were situated on Northern Neck, in adjacent counties to
Northumberland, but the greatest concentration on the entire Atlantic Coast was at Reedville
(Turrentine, 1913.).
Reflecting the history of fishing, on Main Street is the former millionaire‘s row of homes
now on the National Register of Historic Places, which is formally known on the register as the
Reedville Historic District. These homes were the homes of menhaden captains and factory
owners, which were built mainly in the late 1800s. Included among these is the Reedville
Fisherman‘s Museum, which is also home to two additional National Register properties, vessels
the Elva C, a deck boat, and the Claud W. Somers, a skipjack.15
Much of the museum‘s
emphasis is on the menhaden fishery, but other local fisheries, including pound net fishing and
crab pot fishing are also described and interpreted.
3.2.1.2.2 Modern fishing
The menhaden purse seine fleet for Virginia is associated with Reedville and the
menhaden processing company located in Fleeton. The industry consists of eleven vessels, and a
reduction plant that processes menhaden into oils and solids for various uses. The plant operates
15
http://www.nr.nps.gov/iwisapi/explorer.dll?IWS_SCHEMA=NRIS1&IWS_LOGIN=1&IWS_REPORT=
100000066

Page | 21
year round for the oil processing, but only from approximately March to December for fishing,
offloading, net mending, and other activities. While the menhaden purse seine fleet is important
to Reedville, as well as the county, as its largest employer, other menhaden fishing – using
snapper rigs, and pound nets for provision of bait- is also important.
At least two locations on Cockrell‘s Creek provide bait for local fishermen – one on Main
Street, and one in Fleeton. Menhaden is also important to the local crab fishery where it is used
by crabbers for bait, which is off-loaded in Greenfield. The Cockrell‘s Creek fish house
provides fish for two other processors in the area, one of which is within Northumberland
County, the other is in Westmoreland County. It is assumed that the fish would be used as bait or
other non-edible uses. The Main Street location is part of a multiple location bait provider and
trucking company that provides bait for fishermen from New Jersey to Florida and westward to
Louisiana.
The fish house - deli/restaurant on Cockrells Creek serves as a fisherman‘s hangout.
Watermen stop in for lunch, and discuss local fishing conditions. In part this is because it is one
of only a few locations open for lunch that is convenient for watermen offloading catch or in
need of fuel or bait. It also provides a location that watermen can interact with local residents to
discuss the season and menhaden availability. During one visit, for example, a patron asked one
waterman if he had ―provided lunch,‖ acknowledging the links between watermen and other
businesses.
3.2.1.3 Social Interactions
Social connections in this community for long-term residents are generally recognized as
having some association with fishing. The first person met in March of 2009 was a fisherman on
a menhaden vessel, who has a brother who is a pound netter, and whose parents own a seafood
restaurant. Similar interactions were revealed in a series of interviews of 20 employees at the
menhaden plant and other interviews around the community, with a substantial number of long
term residents (―born heres‖ as they are referred to in the local newspaper) have family members
past or present who work in fishing. In general, those with connections to fishing have a sense of
appreciation of fisheries and what it means to the community‘s history, traditions and economy.
Even the odor generated by the menhaden processing is referred to in a more positive light as
―the smell of money‖ (Garrity-Blake, 1994)
Not all local residents have connections to fisheries or are as appreciative, though.
Newcomers tend to want to change the situation, particularly with regard to the smell and/or the
visual aesthetics of the menhaden plant from the creek. The plant has undertaken efforts to
reduce odors, but even plant employees admit that on occasion the odor can be unpleasant in
Reedville.
3.2.1.4 Demography
16
The population of Reedville in 2000, as defined by zip code 22539, was 2315 people. The
population was slightly higher for females (52.1%) than males (47.9%). The median age of the
locality‘s population in 2000 was 55.5 years.
16
Demographic statistics were only available for 2000 at the time these profiles were being developed.
Page | 22
In 2000, the ethnic composition of Reedville consisted of 99.7% of the population self-
identifying a single race. Of those who self identified a single race, 80.7% identified white,
18.4% identified black or African American, and less than 1% for each of the other racial
categories 17
Hispanic or Latino people made up 1.3% of the locality‘s population in 2000.
In 2000, 98.2% of the population of Reedville was native born Americans. For the 1.8%
of the population that was foreign born, the most frequently reported regions of birth included
Europe (66.7%), Northern America (21.4%), and Latin America (11.9%). The most commonly
reported ancestries in 2000 were English (22.3%), other ancestries (19.6%), and United States or
American (16.3%).
In 2000, the average household size for Reedville was 2.14 persons, and the average
family size was 2.57 persons. For people 15 years of age and over, 64.3 % were married in 2000.
Single parent families with children comprised 7.2% of all families in the locality. Single person
households comprised 27.9% of all households in the county and nonfamily households
comprised 31.5% of all households in the county in 2000. Of the population 5 years of age and
over in 2000, 23.7% reported having a disability. The group most frequently reporting having a
disability (35.8%) is the segment of the population 65 years of age and over.
3.2.1.4.1 Education
In 2000, for the population of Reedville 25 years of age and over, 71.2% had high school
graduate or higher levels of education and 15.9% had a bachelor‘s degree or higher levels of
educational attainment. At that time 5.3% had graduate or professional degrees.
3.2.1.4.2 Employment
In 2000, 38.1% of the locality‘s population 16 years of age and over was in the labor
force, and 1.4% was unemployed. Of women 16 years of age and over, 33.3% were in the labor
force, and 33.3% were employed.
In Reedville, the most common occupation was management, professional, and related
occupations (27.3%). This was followed by service occupations (18.6%) and sales and office
occupations (17.1%). Farming, fishing, and forestry occupations were reported by 6.3% of the
county‘s workers. In 2000, 73.7% of the county‘s workers were private wage and salary
workers, 13.5% were government workers, 11.3% were self-employed in own not incorporated
business, and unpaid family workers were 1.5%.
The industries in which most workers most frequently participated in 2000 included
educational, health and social services (14%) professional, scientific, management,
administrative, and waste management services (12.4%), and manufacturing (11.9%).
Agriculture, forestry, fishing and hunting, and mining employed 6.2% of the locality‘s residents
who are workers in 2000.
17
American Indian and Alaska Native, Asian, Native Hawaiian and other Pacific Islander, and some other
race.

Page | 23
3.2.1.4.3 Income
The median household income in Reedville in 1999 was $39,310, and the median family
income was $44,811. In 1999, 27.7% of households in the locality had incomes under $25,000
and 15.9% of families had equivalent incomes. The per capita income at that time was $22,492.
The median earning of male full-time, year-round workers in 2000 were $31,739, and the median
earnings for female full-time, year-round workers synchronously were $22,750.
In 1999, 4.4% of families in the locality had income below the poverty level. Families
with a female householder, no husband present, were more likely to be in poverty, with 32% of
these families having incomes below the poverty level in 1999.
3.2.1.4.4 Housing
In 2000 there were 1,798 total housing units in the locality, of which 62.1% were
occupied. The median value for owner occupied units in 2000 was $143,900 and the median rent
was $509.
In 2000, housing stock in the county was mainly comprised of single unit detached
(87.3%), and mobile homes (10.2%). Homes in excess of 30 years of age in 2000 comprised
36.3% of the county‘s housing stock at that time.
3.3 OMEGA Protein: 2008 Reduction Activities
In this section, a brief overview of the underlying economic metrics associated with
reduction activities in 2008 is presented.18
Some information, although used to prepare this
report and analyses, is omitted from the report because of extreme confidentiality of data.
In 2008, the Reedville facility had total sales of meal, oil, and soluble equal to nearly
$60.0 million. The total payroll for vessel and plant employees was approximately $11.4
million, which was nearly evenly divided between plant and vessel employees. OMEGA Protein
also paid approximately $1.2 million in union dues on behalf of its employees. Total operating
expenditures, excluding payroll, equaled $18.9 million. In 2008, OMEGA Protein of Reedville
donated approximately $70,000 to charity.
In 2008, the company employed 159 individuals, of which 157 were full time seasonal
workers, to harvest menhaden. They employed 140 individuals of which 126 were full time year
round employees, to process and distribute menhaden-based products. The company provides
health care, paid holidays, and retirement programs for all employees. Plant employees also
receive paid life insurance and vacation days.
18
Detailed data on company operations in Reedville were provided directly by OMEGA in response to a
request for information about company operations. The request for information was made in early 2009 and asked
for information about 2008 activities. Reduction refers to the processing of menhaden by drying and milling to
produce meal and oil products for both animal and human consumption.
Page | 24
3.3.1 AN ECONOMIC ASSESSMENT (IMPACT) MODEL
The detailed information provided by OMEGA Protein was subsequently used to develop
an input/output or IO model. An IO model facilitates the estimation and assessment of the
economic impacts of economic activity (e.g., the sales, income, and employment generated in a
county, state, or region by OMEGA Protein operations). The model was initially developed using
IMPLAN, an off the shelf IO software package for developing impact models, based on 2006
multipliers and associated coefficients. The model was, subsequently, updated using IMPLAN
for 2008, which became available in late 2009. The 2008 IMPLAN reflects multipliers and
coefficients for 2008.
3.3.2 THE ECONOMIC CONTRIBUTION OF OMEGA REDUCTION ACTIVITIES
In 2008, OMEGA Protein of Reedville had approximately 141.1 thousand metric tons of
landings. They had total sales of nearly $60.0 million and expenditures (payroll and operating
expenses) of nearly $31.5 million. OMEGA employed up to 317 individuals (December of
2008) but uses an employment base of 299 individuals. Of the 299 employees, 280 were
residents of Virginia; one was a resident of Florida; one was a resident of Tennessee; one was a
resident of Maryland; and 16 were residents of North Carolina. Of the 280 Virginia residents,
217 were residents of Northumberland County, VA, and 55 were residents of Reedville, VA.
The economic impacts or contributions are measured in terms of total sales or output,
employment, and income generated by harvesting and processing activities of OMEGA Protein.
The metrics are defined as follows:
Output is the gross sales by businesses within the economic region affected by an activity.
Labor income includes employee compensation (wages and salaries) and proprietors‘ income
(income from self-employment).
Employment is specified on the basis of full-time and part-time jobs. There is significant
part-time and seasonal employment in commercial fishing and many other industries.
Impacts are measured in terms of direct, indirect, and induced impacts:
Direct effects express the economic impacts (for output, income or employment) in the sector
in which the expenditure was initially made. For example, the direct income multiplier for
the harvesting sector would show the total income generated among harvesting employees
and proprietors by demand for services from the harvesting sector. This direct impact would
result, for example, from expenditures made by commercial fishermen to suppliers of gear
and equipment.
Indirect effects measure the economic impacts in the specific sectors providing goods and
services to the directly affected sector. For directly affected harvesters, indirect effects
would include the purchases of products from manufacturers and purchases of accounting
services. These indirect impacts extend throughout the economy as each supplier purchases
from other suppliers in turn. For example, the accounting firms would need to purchase

Page | 25
office supplies and business equipment. Thus, the indirect output multiplier would represent
the total output generated in the various supplier sectors resulting from demand for goods or
services from the direct sector.
Induced effects are the economic activity generated by personal consumption
expenditures by employees in the directly and indirectly affected sectors, as fishermen,
accountants, and other directly and indirectly affected employees spend their paychecks.
These household purchases have additional ―indirect‖ and ―induced‖ effects as well, all of
which are defined as induced effects.
In terms of the economic contributions of OMEGA Protein to the economies of Maryland
and Virginia, OMEGA Protein generated $59.9 million in total direct sales and $88.2 million in
total output (direct + indirect + induced impacts) to the economies of Maryland and Virginia
(Table 3.1).19
The majority of the economic impacts were generated for the economy of Virginia.
Of the total output generated for Maryland and Virginia, 99.9 % of the total sales impact was
generated for the economy of Virginia. Total employment generated equaled 519 full and part-
time jobs, and total income equaled $22.8 million. We stress that despite the fact the total
impacts, particularly in employment and income terms, are relatively low, most of the direct
sector impacts occur in Northumberland County, Virginia. Of the 299 employees, 217
individuals are residents of Northumberland County, and 55 individuals are residents of
Reedville, VA. In addition, OMEGA paid nearly $185.0 thousand in property taxes to
Northumberland County in 2008.
Table 3.1 Economic Activity Generated by OMEGA Protein, 2008
Total impacts in VA Direct Indirect Induced Total
Employment (full- and part-time jobs) 299 114 106 519
Income (thousands) $12,562 $6,191 $3,988 $22,741
Output (thousands) $59,919 $15,750 $12,459 $88,127
Total impacts in MD
Employment (full- and part-time jobs) 0 0 0.2 0.2
Income (thousands) $0 $0 $9 $9
Output (thousands) $0 $0 $27 $27
Total impacts in VA and MD
Employment (full- and part-time jobs) 299 114 106 519
Income (thousands) $12,562 $6,191 $3,997 $22,750
Output (thousands) $59,919 $15,750 $12,486 $88,155
19
Although the Reedville facility has employees who are residents of other states, we attribute all direct
and indirect sector employment, sales, and income to the economy of Virginia. Employees who are residents from
other states may actually reside in Virginia but use a year round address of another state.

Page | 26
4.0 Community Descriptions
4.1 Maryland Coastal Counties
All Maryland counties adjacent to Chesapeake Bay and the Atlantic Ocean are considered
affected by the menhaden‘s ecosystem services, which include water quality effects. The City of
Baltimore is considered separately since the U. S. Bureau of Census, and the State of Maryland
consider it a county equivalent.20
In the descriptions below the counties will be divided by
eastern shore and western shore of Chesapeake Bay (with Worcester County included in the
Eastern Shore although it is truly the Atlantic county), then presented in alphabetical order.
4.1.2 EASTERN SHORE
4.1.2.1 Cecil County
Cecil County is a predominantly rural county in the Philadelphia-Camden-Vineland
Metropolitan Statistical Area. The county is midway between Baltimore and Philadelphia. Major
employers in the county include W. L. Gore with facilities to manufactures electronics and
medical devices, several medical providers, a medical products R&D firm, a company that
provides propellants and rocket motors, a home furnishings, a plastics R&D firm, a food
products distributor, a large plant nursery, a grocery, a producer of residential millwork, a
publisher and two truck terminals.21
There are eight incorporated towns in the county: Cecilton, Charlestown, Chesapeake
City, Elkton, North East, Perryville, Port Deposit, and Rising Sun. Elkton is the county seat. The
nearest city of substantial size is Newark, DE, which abuts the county on its eastern border. The
nearest large cities include Baltimore, MD which is approximately 50 miles from the county and
Philadelphia which is also approximately 50 miles from the county.
4.1.2.1.1 Location
Cecil County is in the northeastern corner of the state, on the state lines of Delaware and
Pennsylvania. Across the state line in Delaware is New Castle County, and across the state line
in Pennsylvania is Chester County. The county shares boundaries with the Maryland counties of
Kent County to the south of Cecil County, and with Harford County to the west and across the
Susquehanna River. Cecil County is located at the northern end of the main stem of Chesapeake
Bay and surrounds the widest portions of the Elk River and the North East River as well as being
situated on the east side of the Susquehanna as it opens into the Bay.
4.1.2.1.2 Transportation
Cecil County is well connected to the rest of the United States in terms of transportation.
Interstate 95, one of the major transportation linkages on the east coast of the United States, runs
20
The counties, in alphabetical order, included in these descriptions are Anne Arundel,
The City of Baltimore, Baltimore, Calvert, Cecil, Charles, Dorchester, Harford, Kent, Prince
George, Queen Anne‘s, Somerset, St. Mary‘s, Talbot, Wicomico, and Worchester.
21
http://www.choosemaryland.org/Resources/pdffiles/briefeconomicfacts/CecilBEF.pdf

Page | 27
through the county. Other highways in the county include U.S. Highways 1 and 301 and State
Highways 213 and 272. Rail service is available in the county. Cecil County has a privately
owned but publicly available general aviation airport in the county near Elkton. Major airports
with commercial service are available at Philadelphia International Airport approximately 40
miles away, and Baltimore-Washington Airport approximately 65 miles away.
4.1.2.1.3 Demography
The total population of Cecil County in 2000 was 85,951 according to the U.S. Bureau of
Census. The population was evenly split between males (49.6%) and females (50.4%). The
median age of the county‘s population in 2000 was 35.5 years. In 2006, the population of Cecil
County was estimated to be 99,506 people; with an estimated 49% of the population male and
51% of the population female. The median age remained 35.5 years.
In 2000, the ethnic composition of the county was comprised of 98.8% of the population
self-identifying a single race. Of those who self identified a single race, 93.4% identified white,
3.9% identified black or African American, and less than 1% for each of the other racial
categories (American Indian and Alaska Native, Asian, Native Hawaiian and other Pacific
Islander, some other race). Hispanic or Latino people made up 1.5% of the county‘s population
in 2000. In 2006, 98.6% of the population was estimated to be a single race. Of the single race
population, 91.7% was estimated to be white, 4.9% was estimated to be black or African
American, and 1.5% was estimated to be Asian. The remaining groups were estimated to be
below 1%. Hispanic or Latino people were estimated to comprise 2.1% of the county‘s
population in 2006.
In 2000, 98.2% of the population of Cecil County was native born Americans. For the
1.8% of the population that was foreign born, the most frequently reported regions of birth
included Europe (46.4%), Asia (24.8%), and Latin America (19%). In 2006, 97.8% of the
county‘s population was estimated to be native-born Americans. The most commonly reported
ancestries in 2000 were German (19.6%), Irish (17.9%), and English (14.5%).
In 2000, the average household size for Cecil County was 2.71 persons, and the average
family size was 3.12 persons. For people 15 years of age and over, 61.2% of males and 58.3% of
females were married. Single parent families with children comprised 12.2% of all families in
the county. Single person households comprised 19.9% of all households in the county and
nonfamily households comprised 5.4% of all households in the county in 2000. In 2006, the
average household size had increased slightly to 2.75 persons and the average family size had
also increased slightly to 3.26 persons. For persons 15 years of age and over, 55.5% of males
and 50.6% of females were married. Single parent families with children comprised 14.7% of all
families in the county in 2006. Single person households comprised 24.2% of all households and
nonfamily households comprised 28.3% of all households in the county in 2006.
Of the population 5 years of age and over in 2000, 18.3% reported having a disability.
The group most frequently reporting having a disability (39.1%) is the segment of the population
65 years of age and over. In 2006, the population 5 years of age and over reporting a disability
had declined to 15.5%.

Page | 28
4.1.2.1.4 Education
In 2000, for the population of Cecil County 25 years of age and over, 81.2% had high
school graduate or higher levels of education and 16.4% had a bachelor‘s degree or higher levels
of educational attainment. At that time 5.7% had graduate or professional degrees. In 2006,
87.3% of the population 25 years of age and over had high school graduate or higher levels of
education and 23% had bachelor‘s degree or higher levels of education. In 2006, 7.2% of the
population 25 years of age and over had graduate or professional degrees.
4.1.2.1.5 Employment
In 2000, 69.3% of the county‘s population 16 years of age and over was in the labor
force, and 2.8% were unemployed. Of women 16 years of age and over, 63.6% were in the labor
force, and 60.7% were employed. In 2007, 70.2% of the county‘s population 16 years of age and
over was in the labor force and 5.1% were unemployed. In 2006, 62.4% of women in the 16 and
over age cohort were in the labor force and 58.5% were employed.
The most common occupations for county workers included management, professional,
and related occupations (28.1%), sales and office occupations (26.4%), and production,
transportation, and material moving occupations (17.2%) in 2000. Farming, fishing and forestry
occupations were reported by 0.6% of the county‘s workers. In 2006, the most common
occupations for county workers included management, professional and related occupations
(33.2%), sales and office occupations (24.9%), and service occupations (15.1%). Farming,
fishing and forestry remained at 0.6% of the occupations of the county in 2006. In 2000, 78.9%
of the county‘s workers were private wage and salary workers, 15.1% were government workers,
5.8% were self-employed in own not incorporated business, and 0.2% were unpaid family
workers. In 2006, 80.8% of the county‘s workers were private wage and salary workers, 15%
were government workers, 4.1% were self-employed in own not incorporated business, and 0.1%
were unpaid family workers.
The industries in which most workers most frequently participated in 2000 included
educational, health and social services (17.6%), manufacturing (15.8%), and retail trade (11.8%).
Agriculture, forestry, fishing and hunting, and mining employed 2.4% of the county‘s workers in
2000. In 2006, the industries which were reported most frequently employing county workers
included educational serviced, and health care, and social assistance (20.4%, manufacturing
(11.3%) and professional, scientific, and management, and administrative and waste
management services (11%). Agriculture, forestry, fishing and hunting, and mining employed
2.7% of the county‘s workers in 2006.
Cecil County appears to have no fishing employment within the county according to the
Bureau of Labor Statistics. This means that there are no fin fishing, shell fishing or fish
processing establishments, which contribute to unemployment insurance. There may indeed be
people who participate in fishing activities who are self-employed or who work on vessels that
are individually incorporated but do not participate in contributing to unemployment insurance.

Page | 29
4.1.2.1.6 Income
The median household income in Cecil County in 1999 was $50,510, and the median
family income was $56,469. In 1999, 19.9% of households in the county had incomes under
$25,000 and 13% of families had equivalent incomes. The per capita income at that time was
$21,384. The median earning of male full-time, year-round workers in 2000 were $40,350, and
the median earnings for female full-time, year-round workers synchronously were $28,646. In
2005, the median household income in the county was $56,509, and the median family income
was $66,931. In 2005, 19.6% of households had incomes less than $25,000 and 12.5% of
families had equivalent incomes. The per capita income for the county had increased to $26,869.
Median earnings for male full-time year-round male workers in 2006 had increased to $51,056
and for female full-time year-round workers they had increased to $36,638.
In 1999, 5.4% of families in the county had income below the poverty level. Families
with a female householder, no husband present, were more likely to be in poverty, with 21.4% of
these families having incomes below the poverty level in 1999.
In 2006, 6.2% of all families had income below the poverty level in the previous 12
months. Families with a female householder, no husband present are more likely to be in
poverty, with 22.3 % estimated to have been in poverty in the previous 12 months. Especially
hard hit are those families with a female householder with a female householder, no husband
present, with related children under 5 years only, with 33.4% of these families reporting incomes
below the poverty level.
4.1.2.1.7 Housing
In 2000 there were 34,461 total housing units in the county, of which 90.6% were
occupied. Of the occupied units, 75% were owner occupied and 25% were renter occupied. The
vacancy rate was 9.4%. Assuming all vacation homes were vacant when the census was taken,
4.3% of units in the county were for seasonal, recreational or occasional use. The median value
for owner occupied units in 2000 was $132,300 and the median rent was $617. In 2006, there
were 39,758 total units in the county, of which 90.8% were occupied. Of the occupied units in
2006, 71.7% were owner occupied and 28.3% were renter occupied. The vacancy rate was 9.2%.
The median value of an owner occupied unit in 2006 had risen to $243,200, and the median rent
had increase to $789.
In 2000, housing stock in the county was mainly comprised of single unit detached
(70.3%), single unit attached (8.6%) and mobile homes (8.2%). This pattern is similar in 2006,
with 66.4% of the housing stock being single unit detached, 11% single unit attached, and 7%
mobile homes. Homes in excess of 30 years of age in 2000 comprised 39.2% of the county‘s
housing stock at that time.
4.1.2.2 Dorchester County
Dorchester County is a predominantly rural county, more recently considered a
Micropolitan Statistical Area by the U.S. Bureau of Census. Micropolitan areas are areas with a
central urban core of between 10,000 and 50,000 people, and the largest city in the statistical
area is designated the ―principal city‖.22
The county is designated the Cambridge Micropolitan
22
http://www.census.gov/population/www/estimates/aboutmetro.html

Page | 30
Statistical Area in the 2004 area map that is available online at the U.S. Bureau of Census‘
website.23
Major employers in the county include food processing including seafood and poultry
processing, a resort and conference center, discount retail, and printing. The county promotes
itself as having a low cost of living. There is a hospital in the county. There are several historical
museums in the county and art galleries are also within county boundaries for cultural
activities.24
The county has two island areas in the Chesapeake, which are somewhat isolated, Hooper
Island, which is actually an archipelago of three islands, and Bloodsworth Island, also an
archipelago, which is owned by the U. S. Navy.25
Hooper Island is accessible by a series of
bridges, but Bloodsworth Island is not, which may be fortunate, because it was a former bombing
and ordinance range with remaining ordinance and soil contamination.26
Municipalities within the county include Brookview, Cambridge, Church Creek, East
New Market, Eldorado, Galestown, Hurlock, Secretary, and Vienna. The nearest sizable city is
Salisbury, approximately 30 miles away from the middle of the county, and the nearest large city
Washington, DC approximately 85 miles away, but requiring use of Chesapeake Bay Bridge.
4.1.2.2.1 Location
Dorchester County is located approximately midway north south along the Eastern Shore
of Chesapeake Bay on the Delmarva Peninsula. It shares boundaries on its north with Talbot and
Caroline Counties. On the east, its boundary is concurrent with the state line of Delaware, and
Sussex County, DE. To the southeast, it shares boundaries with Wicomico and Somerset
Counties. Across the bay to the west are St. Mary‘s and Calvert Counties.
4.1.2.2.2 Transportation
The major highway in the county is U.S. 50 that provides access to Salisbury and Easton
then toward Annapolis and the Washington DC metropolitan area. There is a general aviation
public-use airport in the county, the Cambridge-Dorchester Airport. The Maryland 2005-2006
official Transportation Map shows a rail line in the county, but it is limited in extent and appears
to be a special purpose line.
4.1.2.2.3 Demography
The total population of the county in 2000 was 30,674 people. There slightly more
females (52.7%) than males (47.3%). The median age of the county‘s population was 52.7%.
The county‘s ethnic composition for the 99.1% of the population who self-identified a
single race included 69.4% white people, 28.4% black or African American people, and less than
1% each of the remaining groups (American Indian or Alaska Native, Asian, Native Hawaiian or
other Pacific Islander, or ―some other race‖).
23
http://ftp2.census.gov/geo/maps/metroarea/stcbsa_pg/Nov2004/cbsa2004_MD.pdf 24
http://www.dorchestereconomic.com/ 25
http://www.mde.state.md.us/assets/document/brownfields/USN_Bloodworth_Island_Archipelago.pdf 26
http://www.mde.state.md.us/assets/document/brownfields/USN_Bloodworth_Island_Archipelago.pdf

Page | 31
In 2000, 98% of the county‘s population was native born Americans. For the 2% of the
population that was foreign born, the most frequently reported regions of birth were Asia
(36.3%), Europe (28.6%), and Latin America (26.7%). The most frequently reported ancestries
for residents of the county included ―other ancestries‖ (29.3%), United States or American
(14.6%), and English (12.3%).
The average household size was 2.36 persons and the average family size was 2.86
persons in 2000. For the age cohort 15 years of age and over, 57.7% of males were married, and
49.3% of females were married. Single parent families comprised 15.1 % of all families in the
county. Single person households comprised 28.1% of all households in the county and
nonfamily households comprised 4.4% of all households in the county.
For the population age 5 and over, 22.9% had a disability. The age cohort that was most
likely to report having a disability (41%) was the group 65 years of age and over.
4.1.2.2.4 Education
The population of Dorchester County approached the national level of high school
graduates or higher level of educational attainment (80.4% for the national rate), but fell behind
with regard to higher education by having approximately half the national rate (24.4%) of
bachelor‘s degree or higher level of education. In 2000, 74.2% of Dorchester County‘s
population 25 years of age and over had a high school graduate or higher level of educational
attainment and 12% had a bachelor‘s degree or higher level of education. Graduate or
professional degrees were held by 5.2% of the county‘s population 25 years of age and over.
4.1.2.2.5 Employment
Of the 13,053 people in the county 16 years of age and over, 62.2% were in the labor
force and 3.6% were unemployed. For women 16 year of age and over 56.9% were in the labor
force and 53.1% were employed.
The most common occupations for employed workers residing in the county were sales
and office occupations (23.8%), management, professional, and related occupations (23.3%), and
production, transportation and material moving occupations (21.5%). Farming, fishing and
forestry occupations were reported by 2.5% of the county‘s workers. By class of worker, the
county‘s composition was 73.3% private wage and salary worker, 17% government worker,
9.5% self-employed workers in own not incorporated business, and 0.2% unpaid family workers.
The most frequently cited industries in which employed workers residing in the county
were participating included educational, health, and social services (19.7%), manufacturing
(19.6%), and retail trade (11.6%). Agriculture, forestry, fishing and hunting and mining
provided employment for 4.1% of the county‘s working population.
Fishing employment in the county is important from review of the data from the Bureau
of Labor Statistics.27
Dorchester County has the highest concentration of fishery employment in
Maryland for those counties with disclosed data. In 2001 there were 16 seafood processing
establishments, and undisclosed number of shellfish fishing establishments employing at least
27
http://www.bls.gov/data/home.htm

Page | 32
681 people, while in 2006 there were nine seafood processors and shellfish fishing
establishments employing 724 and 73 people respectively. In 2001 the total wages were in
excess of 14 million dollars for seafood processing alone, while in 2006 the total wages for
seafood processing were approximately $17 ½ million and total wages for shellfish fishing were
over $2 ½ million.
4.1.2.2.6 Income
The median household income in Dorchester County in 1999 was $34,077 and the
median family income at that time was $41,917. At that time, 36.5% of households in the county
had incomes under $25,000 and 26.7% of families had equivalent incomes. Per capita income
for the county was $18,929 in 1999. Median earnings for male full-time, year-round workers
were $29,014 and median earnings for female full-time year-round workers were $22,284.
In 1999, 10.1% of families in the county had income below the poverty level. Families
with a female householder, no husband present, were approximately three times more likely
(28.8%) to have income below the poverty level.
4.1.2.2.6 Housing
In Dorchester County in 2000, there were 14,681 housing units of which 86.5% were
occupied. Of the occupied units, 70.1% were owner occupied and 29.9% were renter occupied.
The vacancy rate was 13.5%. Assuming that seasonal and recreational units were vacant at the
time of the census questionnaires, 4.6% of the county‘s housing units are for seasonal,
recreational or occasional use. The median value of owner occupied units in the county was
$92,300, and the median rent was $456.
Housing stock in the county was predominantly single unit detached structures (72.8%)
and mobile homes (10.3%). Housing units in excess of 30 years old comprised 60% of the
county‘s housing stock.
4.1.2.3 Kent County
Kent County, across Chesapeake Bay from Baltimore, is a rural county in no
metropolitan or micropolitan area. The major employers in the area include medical services, a
college, a valve and coupling company, an asphalt paving/road construction company, a poultry
processor, a plant nursery, a nursing care facility, a chemical testing equipment company, and a
restaurant. The poultry processor, the plant nursery and the restaurant‘s inclusion in major
employers could be dependent upon seasonal employees.28
The county has one isolated area, Eastern Neck Island that is designated a National
Wildlife Refuge, but which appears to be under cultivation and has some minor development
(houses and/or barns) visible in the Google Earth aerial photos and the US Geological Survey
Digital Orthophoto Quadrangles.29
Eastern Neck Island is accessible via bridge with connection
to Rush Island then toward Rock Hall.
28
http://kentcounty.com/bus/pdf/facts07.pdf 29
http://terraserver-usa.com/image.aspx?T=1&S=11&Z=18&X=987&Y=10797&W=3

Page | 33
There are five municipalities within Kent County, Betterton, Chestertown, Galena,
Millington, and Rock Hall. The county seat is Chestertown. The nearest city of substantial size
is Dover, DE, approximately 35 miles away, and the nearest large cities are Baltimore, MD
approximately 85 miles away via roads (taking the Bay Bridge) and Philadelphia, PA
approximately 70 miles.
4.1.2.3.1 Location
Kent County is directly across the bay from Baltimore, or the second most northerly
county on the eastern shore of Chesapeake Bay. It shares boundaries with Cecil County, defined
by the Sassafras River to the north, and Queen Anne‘s County, defined by the Chester River to
the south. To the west of the county is Chesapeake Bay, and across the bay are Baltimore
County, the City of Baltimore, and Anne Arundel County. To the east is the state line with
Delaware where it abuts New Castle and Kent Counties, DE.
4.1.2.3.2 Transportation
The major highway in the county is US 301, found in the eastern section of the county. A
number of state highways, including 299, 444, and 213 provide additional access within the
county. The local public use airport is a small general aviation, grass airstrip known as Massey
Field. Rail service is available in the county, with lines running to Chestertown, and to
Millington.
4.1.2.3.3 Demography
The total population of the county in 2000 was 19,197 people. It was fairly evenly split
between males (47.9%) and females (52.1%). The median age of the population in the county
was 41.3 years.
The ethnicity of the population in terms of race for those who self-identified a single race
in 2000 was 79.6% white, 17.4% black or African American, and 1% ―some other race,‖ the
remaining categories comprised less than 1% each for American Indian and Alaska Native,
Native Hawaiian or other Pacific Islander, or Asian. Hispanic or Latino people comprised 2.8%
of the population in the county.
In 2000, 97.1% of the population in the county was native born Americans. For the 2.9%
of the population that was foreign born, the most common regions of birth included Latin
America (51.8%), Europe (28.3%) and Asia (8.5%). The most common ancestries for the
residents of Kent County included ―other ancestries‖ (22.8%), English (17.2%) and German
(15.7%).
The average household size in 2000 in Kent County was 2.33 persons, and the average
family size was 2.81 persons. For the population 15 years of age and over, 58.7% of males and
51% of females were married. Single parent families with children under 18 years of age
comprised 13.7% of families in the county. Single person households comprised 27.7 % of
households in the county, and nonfamily households comprised 5.1% of all households in the
county.

Page | 34
For people age five and over, 20.5% of the population had a disability. The most affected
group was the age cohort age 65 years and over which had 38.2% of the population reporting a
disability.
4.1.2.3.4 Education
The population of Kent County 25 years of age and over is generally well educated. In
2000, 78.8% of the population had a high school graduate or higher level of educational
attainment, and 21.7% had a bachelor‘s degree or higher level of education, which was roughly
comparable to the national rates of 80.4% high school graduate or higher level of education and
24.4% bachelor‘s degree or higher level of education. Graduate or professional degrees were
held by 9.1% of the population of Kent County in 2000.
4.1.2.3.5 Employment
The population 16 years of age and over in 2000 in Kent County totaled 15,657 people.
Of the people in the 16 years of age and over cohort, 62.2% were in the labor force, and 2.7%
were unemployed. For females 16 years of age and over, 57% were in the labor force and 54.9%
were employed.
The most frequently reported occupations for employed workers residing in the county
management, professional and related occupations (31.6%), sales and office occupations
(22.7%), and service occupations (18%). Farming, fishing and forestry occupations were
reported by 4% of the county workers. By class of worker, 73.1% of workers were private wage
and salary workers, 15% were government workers, 11.3% were self-employed workers in own
not incorporated business, and 0.6% were unpaid family workers.
The industries in which workers residing in the county most frequently were employed
included educational, health, and social services (24%), manufacturing (12.3%), and
construction (9.8%). Agriculture, forestry, fishing and hunting, and mining employed 6.3% of
the county‘s workers.
Fishing employment has and is currently occurring in Kent County. Although the
number of establishments is not disclosed by the Bureau of Labor Statistics, in 2002 there was
finfish fishing in the county, and in 2001 there was an undisclosed number of establishments and
then again in 2005 and 2006 a single establishment undertaking seafood processing.
4.1.2.3.6 Income
The median household income in 1999 in the county was $39,869 and the median family
income concurrently was $46,708. At that time, 30.8% of households in the county had incomes
under $25,000 and 21.9% of families had similar incomes. Per capita income in the county was
$21,573. Median earnings for male full-time, year-round workers were $31, 899 and median
earnings for female full-time, year-round workers were $24,513.
In 1999, 9.3% of families were found to have incomes below the poverty level. Families
with a female householder, no husband present, were much more likely to be in poverty, with
33.2% of these families having incomes below the poverty level.

Page | 35
4.1.2.3.7 Housing
There were 9,410 housing units in Kent County in 2000, of which 81.5% were occupied.
For those occupied units, 70.4% were owner occupied and 29.6% were renter occupied. The
vacancy rate was 18.5%. Assuming that all vacation or seasonal properties were vacant during
the census taking, 11.1% of the housing units in the county were for seasonal, recreational or
occasional use. The median value of owner occupied units in 2000 was $115,500 and the median
rent was $526.
Housing stock in the county is primarily single unit detached structures (77.9%). The
next highest percentage is mobile homes (4.4%). Units in excess of 30 years old comprise 53.7%
of the county‘s housing stock.
4.1.2.4 Queen Anne’s County
Queen Anne‘s County is across Chesapeake Bay from Annapolis, connected via the Bay
Bridge. This umbilical allows Queen Anne‘s County to be a part of the Baltimore-Towson
Metropolitan Statistical Area, with enhanced development in the areas nearer Annapolis and
increased interaction with the larger communities. The eastern portion of the county is still is in
agricultural uses, but Kent Island, the westernmost part of the county is the most developed.
Major employers, those employing over 100 persons, in the county according to the county‘s
office of economic development include a canned food firm which has peak employment
seasonally, two seafood restaurants, a custom guitar firm, a door and window firm, a mailing
service, a ―big box‖ store, a grocery store, and a printer.
Although Kent Island could be considered an isolated area of the county since it is an
island, the island is well connected to both the county and across the bay via U.S. Highway
50/301. Kent Narrows, where the island is separated from the county, is so narrow that it appears
built over in some aerial photos in locations, so determining that the island is separate is difficult
in places.
Municipalities in the county include Barclay, Centreville, Church Hill, Millington, Queen
Anne, Queenstown, Sudlersville and Templeville. The county seat is Centreville. The nearest
city of substantial size is Annapolis, approximately 15 miles away and the nearest large cities are
Baltimore, approximately 35 miles away from the western side of the county, and Washington,
DC, approximately 45 miles away from Kent Island.
4.1.2.4.1 Location
Queen Anne‘s County is located on the eastern shore of Chesapeake Bay across the bay
from Annapolis and Anne Arundel County. The county shares its southern border with Talbot
County and its northern border with Kent County. The county‘s eastern boundary is shared with
Caroline County on the southern section and the state line with Delaware on the northern section.
The Delaware County that abuts Queen Anne‘s County is Kent.

Page | 36
4.1.2.4.2 Transportation
The major highways in the county are U.S. Highways 50 and 301. U.S. 50 connects to
Annapolis and Washington to the west via the Bay Bridge and toward Salisbury and Ocean City
to the south and east. U. S. Highway 301 connects northerly toward corridors leading to
Wilmington, DE and Philadelphia, PA. A network of state highways includes State Highways
213, 309, 300 and 405 provide access within the county. Rail service is available in the county
for freight. There is a general aviation airport in the county with charter service at the Bay
Bridge Airport, and commercial air service is provided at the Baltimore/Washington Airport,
approximately 50 miles from the county seat.
4.1.2.4.3 Demography
The population of Queen Anne‘s County in 2000 totaled 40,563 persons. The population
was evenly split between males (49.8%) and females (50.2%). The median age of the county‘s
population was 38.8 years.
Nearly the entire population of the county (99.1%) is self-identified as a single race. For
those who identified a single race, the most frequently identified were white (89%), black or
African American (8.8%), and Asian (0.6%). Hispanic or Latino people comprised 1.1% of the
county‘s population.
In 2000, 97.6% of the county‘s population was comprised of native-born Americans. For
the remaining 2.4% of foreign-born people, the most common regions of birth included Europe
(32.8%), Asia (30%), and Latin America (24.4%). The most frequently reported ancestries for
residents of the county included German (19.9%), Irish (17.3%), and English (15.4%).
The average household size for Queen Anne‘s County in 2000 was 2.62 persons and the
average family size was 2.99 persons. For people 15 years of age and over, 64.3% of males and
62 % of females were married. Single parent families with children under 18 years of age
comprised 9.9% of all families in the county. Single person households comprised 19.4% of
households in the county and nonfamily households comprised 4.9% of all households in the
county.
For the population of the county 5 years of age and over in 2000, 17.2% reported having
a disability. The most affected segment of the population was the cohort 65 years of age and
over, which reported 33.5% having a disability.
4.1.2.4.4 Education
The population of Queen Anne‘s County was well educated in 2000 with 84.2% of the
county‘s population 25 years of age and over having a high school graduate or higher level of
education and 25.4% having a bachelor‘s degree or higher level of education. These levels were
slightly above the national rates of 80.4% high school graduate or higher level of education and
24.4% bachelor‘s degree of higher level of education. Graduate or professional degrees were
held by 9% of the county‘s population 25 years of age and over.

Page | 37
4.1.2.4.5 Employment
The total population in the county 16 years of age and over in 2000 was 31,417. Of that
population, 69.5% was in the labor force and 1.9% was unemployed. For females in the
appropriate age cohort, 63.2% were in the labor force, and 61.4% were employed.
The most frequently reported occupations for workers residing in the county included
management, professional and related occupations (36.3%), sales and office occupations, and
service occupations (13.8%). Farming, fishing, and forestry occupations were reported by 1.5%
of workers residing in the county. The composition of workers in the county by class of worker
was 70.4% private wage and salary workers, 20.3% government workers, 9.2% self-employed
workers in own not incorporated business and 0.2% unpaid family workers.
The industries that employed the greatest number of workers residing in the county
included educational, health, and social services (17.9%), construction (11.7%), and retail trade
(11.4%). Agriculture, forestry, fishing and hunting, and mining provided employment for 3.4%
of county residents.
Fishing employment in the county has increased slightly in terms of establishments since
200130
with a decline in the number of fish processing establishments from three to two, and an
increase to one each of finfish fishing and shellfish fishing establishments from none. In 2002,
the most recent year for which data is disclosed, there were 149 people employed in seafood
processing, with $4.36 million in total wages.
4.1.2.4.6 Income
The median household income in the county in 1999 was $57,037 and the median family
income was $63,713. At that time, 19% of households had incomes under $25,000 and 12.7% of
families had incomes under $25,000. The median earnings for male full-time, year-round
workers were $44,644, while synchronously female full-time, year round worker‘s median
earnings were $30,144. The per capita income for Queen Anne County was $26,364.
In 1999, 4.4% of the county‘s families were found to have income below the poverty
level. For families with a female householder, no husband present, there is a higher poverty rate,
with 17.4% of these families having income below the poverty level.
4.1.2.4.7 Housing
In 2000, there were 16,674 housing units in the county, of which 91.8% were occupied.
For those occupied units, 83.4% were owner occupied and 16.6% were renter occupied. The
vacancy rate was 8.2%. Assuming all seasonal and vacation homes were vacant during the
census taking, these units comprised 4.4% of all units in the county. The median value of owner
occupied housing units was $160,000, and the median rent was $622.
The housing stock in the county was predominantly single unit detached (83.2%), single
unit attached (5.5%), and mobile homes (5%). Units in excess of 30 years old comprised 30.4%
of the county‘s housing stock.
30
http://www.bls.gov/data/home.htm

Page | 38
4.1.2.5 Somerset County
Somerset County is the southernmost Maryland County on the eastern shore of
Chesapeake Bay. It is part of the Salisbury-Ocean Pines Metropolitan Statistical Area.
According to the county‘s economic development department, the major employers of the county
include a food services company, a hospital, a seafood processor, two poultry processors, a bank,
a correctional institution, a tool fabricator (paint applicators), and a college.31
Of interest for
review of the importance of Chesapeake Bay to the county is that half of the county‘s festivals
celebrate fish, fishing or water-based activities.32
Somerset County is home to what is considered the only occupied offshore island in
Chesapeake Bay for the State of Maryland, Smith Island. Smith Island has been and is currently
highly fishery dependent, and is only accessible to the mainland via ferries between Chrisfield
and Ewell for the eastern shore connection, and between Point Lookout and Ewell for the
western shore connection, one additional vessel provides services between Reedville, VA and
Ewell. There are three communities on Smith Island, one of which, Tylerton, is accessible only
by boat, the other two, Rhodes Point and Ewell, are connected to each other by roadway on the
island. While the island is currently highly fishery dependent, a recent article in the Washington
Post has described vacationers buying properties for sale by watermen, and that the watermen‘s
lifestyle is becoming a disappearing way of life. Although people are interested in buying homes
on the island, factors such as the lack of a major grocery store and the quality of the local
infrastructure has prohibited some from purchasing.33
There is no air service on Smith Island,
unlike on Tangier Island, VA.
There are two municipalities in Somerset County, Chrisfield, and Princess Anne; Princess
Anne is the county seat. The nearest substantial city is Salisbury, MD, which is approximately 15
miles away from the county seat. The nearest large cities are Baltimore, which is approximately
130 miles away, Washington, DC, also approximately 130 miles away, and Norfolk, VA,
approximately 120 miles away.
4.1.2.5.1 Location
Somerset County is the southernmost Maryland County located on the eastern shore of
Chesapeake Bay. It shares its northern boundary with Dorchester and Wicomico Counties. To
the east is Worcester County, MD, and to the south and west is the Virginia State line, with
Accomack County on the Virginia side. Across the bay from Somerset County is St. Mary‘s
County MD and Northumberland County, VA.
4.1.2.5.2 Transportation
The major highway in the county is U.S. Highway 13, which is the major connector north
south on the Delmarva Peninsula. State Highways in the county include 383, 667, and 413 that
provide linkages within the county to Deal Island and to Crisfield from Princess Anne and the
Pocomoke City area. There is a publicly owned jointly by the city of Crisfield and Somerset
31
http://www.somersetcountyedc.org/pages/living.htm 32
http://www.somersetcountyedc.org/pages/living.htm 33
http://www.washingtontimes.com/apps/pbcs.dll/article?AID=/20070811/METRO/108110043/1004
Page | 39
County general aviation airport near Crisfield. Rail service is available for freight within the
county.
4.1.2.5.3 Demographics
The total population of Somerset County in 2000 was 24,747 persons. Males slightly
(53.4%) outnumbered females (46.6%). The median age was 36.5 years.
For the 98.8% of the population that self-identified a single race, 56.4% identified white,
41.1% identified black or African American, and none of the remaining ethnic/racial categories
(American Indian and Alaska native, Asian, native Hawaiian and other Pacific Islander, or some
other race) comprised over 0.5% of the population. Hispanic or Latino people comprised 1.3% of
the county‘s population in 2000.
In 2000, 97.5% of the population was native born Americans. For the remaining 2.5% of
the population, the most common regions of birth included Africa (30.6%), Asia (30.5%), and
Latin America (26.8%). The most frequently reported ancestries for residents of the county
included ―other ancestries‖ (29.3%), English (11.7%), and United States or American (11.2%).
The average household size in the county was 2.37 persons, and the average family size
was 2.92 persons. For the population 15 years of age and over, 55.1% of males were married
and 44.5% of females were married. Single parent families with children comprised 15.5 % of
all families in the county. Single person households comprised 29.4% of all households in the
county and nonfamily households comprised 4.4% of households in the county.
For the population 5 years of age and over, 24.7% reported having a disability. The
segment of the population having the highest reports of having a disability (47.2%) was the
group age 65 years and over.
4.1.2.5.4 Education
The population of Somerset County had lower levels of educational attainment than the
national levels. For the population 25 years of age and over in the county, 69.5% had high
school graduate or higher level of education and 11.6% had a bachelor‘s degree or higher level
of education. For the national levels, 80.4% of the population 25 years of age and over had high
school graduate or higher levels of education and 24.4% had bachelor‘s degree or higher levels
of education. Graduate or professional degrees were held by 4.2% of the county‘s population 25
years of age and over.
4.1.2.5.5 Employment
In 2000, 20,646 people in the county were 16 years of age and over; 50.3% were in the
labor force, and 4.9% were unemployed. For females in the age cohort, 54% were in the labor
force, and 47.7% were employed.
The most common occupations for employed workers residing in the county included
management, professional and related occupations (24.8%), sales and service occupations
(23.5%), and service occupations (21.2%). Farming, fishing and forestry occupations comprised

Page | 40
3.8% of those reported. By class of worker, 62% were private wage and salary workers, 27.8%
were government workers, 9.4% were self-employed workers in own not incorporated business,
and 0.9% were unpaid family workers.
The industries which provided employment for the greatest proportions of workers
residing in the county include educational, health and social services (24.5%), retail trade
(12.4%), public administration (10.7%). Agriculture, forestry, fishing and hunting, and mining
provide employment for 5.5% of the county‘s workers.
Fishing establishments in the county are restricted to seafood processing according to the
Bureau of Labor Statistic .34
For 2001 to 2003, data were not disclosed on the number of
establishments within the county, but for 2004 there were four establishments, declining to three
in 2005 and finally to three in 2006. Data were not disclosed for wages or number of employees
of these establishments.
4.1.2.5.6 Income
The median household income in 1999 was $29,903, and the median family income at
that time was $37,643. In 1999, 41.6% of households in the county had income less than $25,000
and 30.8% of families had equivalent income. Per capita income for the county was $15,965.
Median earnings for male full-time, year-round workers were $27,496, and median earnings for
female full-time, year-round workers were $23,035.
In 1999, 15% of families in the county had incomes below the poverty level. Families
with a female householder, no husband present, were more severely affected, with 33.3% of
these families having incomes below the poverty level.
4.1.2.5.7 Housing
In 2000, there were 10,092 housing units in the county of which 82.8% were occupied.
For the occupied units, 69.6% were owner occupied and 30.4% were renter occupied. The
vacancy rate was 17.2%. Assuming all vacation and seasonal units were vacant during the
period of census taking, 7.6% of the county‘s housing units are determined to be for seasonal,
recreational, or occasional used. Median value for an owner occupied unit was $81,100 and the
median rent in Somerset County was $429.
Housing stock in the county is predominantly single unit detached structures (67.8%) and
mobile homes (17.1%). The reliance on mobile homes may be the highest observed in counties
surrounding Chesapeake Bay. Units in excess of 30 years old in 2000 comprised 47.7% of the
county‘s housing stock.
4.1.2.6 Talbot County
Talbot County is the central county on the Eastern Shore of Maryland. It is in the Easton
Micropolitan Area as designated by the U.S. Census Bureau in 2004. Major employers in the
county include a health care provider, two retirement community/healthcare providers, a building
34
http://data.bls.gov/PDQ/outside.jsp?survey=en

Page | 41
systems company, two printing firms, a hardware and home supply big box store, a packaging
firm, a temporary agency, a delivery company, a grocery, and a fast food restaurant.35
Tilghman Island and Oxford within the county have a substantial number of marinas, and
therefore a level of reliance on recreational activities associated with fishing and boating.
Neither area appears to be isolated in the sense of Smith or Tangier Islands, or as strongly
dependent upon fishing at first blush.
There are five municipalities in Talbot County, Easton, Oxford, Queen Anne, St.
Michaels, and Trappe. Easton is the county seat. The nearest substantial cities are Salisbury,
MD, approximately 50 miles from the county seat, and Dover, DE, also approximately 50 miles
from the county seat. The nearest large cities are Baltimore, MD, approximately 59 miles from
the county seat, using the Bay Bridge, and Washington, DC, approximately 73 miles away, also
via the Bay Bridge.
4.1.2.6.1 Location
Talbot County is roughly central located on a north-south line along the Eastern Shore of
Maryland. To the north of the county, across the Wye River, is Queen Anne‘s County and to the
east is Caroline County. To the south, across the Choptank River, is Dorchester County.
Chesapeake Bay is to the west and across the bay are Anne Arundle and Calvert County.
4.1.2.6.2 Transportation
The major highway in the county is U.S. Highway 50, which in the county runs primarily
north to south. State Highways in the county provide access east and west; these include State
Highways 33, 333, 331, and 309. Freight rail service is available in the county to Easton. There
is a publicly owned, county airport that has charter flights near Easton.
4.1.2.6.3 Demographics
The population of the county totaled 33,812 in 2000. There were slightly more females
(52.3%) than males (47.7%). The median age of the county‘s population was 43.3 years.
Nearly all the county‘s population (99.2%) is self-identified as a single race. For those
identifying a single race, 82% identified white, 15.4% identified black or African American, and
0.8% identified Asian. Hispanic or Latino people made up 1.8% of the county‘s population.
In 2000, 96.7% of the county‘s population was native born Americans. For the 3.3% of
the population that was foreign born, the most common regions of birth included Europe (41.1%,
Latin America (38.2%) and Asia (17.9%). The most frequently reported ancestries for residents
of the county included ―other ancestries‖ (21%), English (18.3%), and German (17.4%).
The average household size in Talbot County was 2.32 persons in 2000 and the average
family size in the county was 2.82 persons. For the population 15 years of age and over, 63% of
35
http://www.talbotcountymd.gov/uploads/File/Economic/Economic%20Analysis%20%2011%2030%2006
%20doc%202.pdf

Page | 42
males were married and 57.1% of females were married. Single parent families with children
under 18 years of age comprised 9.9% of all families in the county. Single person households
comprised 27.8% of households in the county and nonfamily households comprised 4.8% of all
households in the county.
For the population age 5 years and over, 19.3% had a disability. The cohort in the
population having the highest rates of reporting disability (35.7%) was the population 65 years of
age and over.
4.1.2.6.4 Education
For the population of Talbot County 25 years of age and over, 84.4% had a high school
graduate or higher level of education and 27.8% had a bachelor‘s degree or higher level of
education. Graduate or professional degrees were held by 10.8% of the county‘s population 25
years of age and over.
4.1.2.6.5 Employment
The total population of the county 16 years of age and over numbered 27,193, of which
61.7% were in the labor force, and 2.1% were unemployed. For females in the age cohort, 56%
were in the labor force and 53.7% were employed.
The most frequently reported occupations in Talbot County in 2000 included
management, professional, and related occupations (34.9%), sales and office occupations
(24.9%), and service occupations (16.6%). Farming, fishing, and forestry occupations were
reported by 1.7% of the workers residing in the county. Composition of workers by class was
72.6% private wage and salary workers, 14.2% government workers, 13% self employed
workers in own not incorporated business, and 0.1% unpaid family workers.
The most common industries in which workers residing in the county were employed
included educational, health, and social services (20.9%), retail trade (11.6%), and
manufacturing (10.1%). Agriculture, forestry, fishing and hunting and mining provide
employment for 3.5% of the county‘s workers.
Fishing establishments in the county recognized by the Bureau of Labor Statistics36
include shellfish fishing and seafood product preparation and packaging. For years 2001 and
2002, data are not disclosed on number of establishments, number of employees or wages for
either type of establishment. In 2003, it appears that the shellfish fishing establishment closed
and has remained so to the present. The processing establishment(s) were undisclosed until 2004
at which time two are listed in the data set. No data are disclosed on numbers of employees or
wages for these establishments.
4.1.2.6.6 Income
The median household income in 1999 was $43,532, and the median family income was
$53,214. In 1999, 27.6% of households and 16.5% of families had incomes under $25,000. Per
capita income for Talbot County was $28,164. Median earnings for male full-time, year-round
36
http://data.bls.gov/PDQ/outside.jsp?survey=en

Page | 43
workers were $33,757 and median earnings for female full-time, year-round workers were
$26,871.
In 1999, 5.3% of families had incomes below the poverty level. At that time families
with female householders, no husband present, had substantially higher rates, with 20.2% having
incomes below the poverty level.
4.1.2.6.7 Housing
In 2000, there were 16,500 housing units in the county, of which 86.7% were occupied.
For those occupied units, 71.6% were owner occupied, and 28.4% were renter occupied. The
vacancy rate was 13.3%. Assuming that all vacation and seasonal units were vacant during the
census-taking period, 7.8% of the county‘s housing units were for seasonal, recreational or
occasional use. The median value of owner occupied units was $149,200 and the median rent for
units in the county was $552.
Housing stock in the county is predominantly single unit detached (77%) and single unit
attached (5.2%). Structures in excess of 30 years old in 2000 comprised 46.1% of the county‘s
housing stock.
4.1.2.7 Wicomico County
Wicomico County is has the least shoreline on the bay of the eastern shore counties
directly on the bay, and is located second most southerly on the eastern shore of the bay. The
county does, however, have aquatic communication with the bay via the Nanticoke and
Wicomico Rivers. The county is part of the Salisbury Metropolitan Statistical Area, and
contains the central city, Salisbury of the metropolitan area. Major employers in the county
include two yacht companies, a poultry processor, a printer, a vitamin company, a cable
manufacturer, three electronics companies, a machining firm, a health care provider, a
commercial airport with two airlines, a telecommunications firm, a pharmaceutical company, a
plastics/vinyl company and a university).37
Wicomico County has no isolated areas within the county in terms of island areas that are
inaccessible other than by a single bridge or by ferry. Municipalities in the county include
Delmar, Fruitland, Hebron, Mardela Springs, Pittsville, Salisbury Sharptown, and Willards.
Salisbury is the county seat. The nearest substantial city is Dover, DE, approximately 56 miles
away, and the nearest large cities are Baltimore, MD, approximately 105 miles away,
Washington, DC, approximately 120 miles away, and Philadelphia, PA, and Norfolk,VA, both
approximately 130 miles away.
4.1.2.7.1 Location
Wicomico County is the second most southerly county on Maryland‘s eastern shore of
Chesapeake Bay. It shares its southern boundary with Somerset County, and its eastern boundary
with Worchester County. To the north and east, the county extends to the state line with
Delaware, and Sussex County, Delaware is on the opposing side of the state line. To the
37
http://www.swed.org/images/2007%20County%20Profile.pdf

Page | 44
northeast is Dorchester County. At the southwestern-most corner of the county, Chesapeake Bay
is intersected in the area of Tangier Sound at the confluence of the Nanticoke and Wicomico
Rivers. 4.1.2.7.2 Transportation
Major highways in the county include U.S. Highways 13 and 50. U.S. Highway 13
connects the Delmarva Peninsula north-south via Chesapeake Bay Bridge Tunnel south to
Norfolk, VA and north toward Wilmington DE and Interstate 95 to Philadelphia. U.S.50, via the
Bay Bridge allows westward travel toward Baltimore and Washington, DC. State Highways
providing access within the county include 349, 346, and 350. Rail service for freight is available
in the county. The airport in the county has commercial service with flights to major hubs in
Philadelphia, Washington, and Charlotte.38
4.1.2.7.3 Demographics
The total population of Wicomico County in 2000 was 84,644 people, and in 2006 it was
estimated to have risen to 91,987 people. In 2000, there were slightly more females (52.3%)
than males (47.7%), which persisted until 2006 with 52% of the population being female and
48% being male. The median age of the county‘s population in 2000 was 35.8 years and in 2006
was 36.6 years.
The ethnic composition of the community in terms of race in 2000 was that 98.7% of the
population self-identified a single race; 72.6% identified white, 23.3% identified black or
African American, 1.7% identified Asian, and 0.8% identified ―some other race.‖ In 2000, 2.2%
of the population was comprised of Hispanic or Latino people. The ethnic composition of the
population was similar with 71.5% of the population self-identified as white, 23.8% self-
identified as black or African-American, 2% self-identified as Asian, and 1.1% ―some other
race.‖ In 2006, Hispanic or Latino people comprised 3.1% of the population.
The average household size in 2000 was 2.53 persons and the average family size at that
time was 3 persons. In 2006, the average household and family sizes had declined slightly to
2.48 and 2.93 persons, respectively. In 2000, for the population 15 years of age and over, 54.4%
of males were married and 46.2% of females were married, while in 2006, for the same age
cohort, 47.8% of males were married and 40.2% of females were married. In 2000, single parent
families with children under 18 years of age comprised 16.5% of all families in the county; in
2006, single parent families with children under 18 years of age had increased to 21% of all
families in the county. Single person households comprised 24.8% of households and nonfamily
households comprised 7.2% of households in the county in 2000. In 2006, single person
households had increased to 34% of all households in the county and nonfamily households had
increased to 9.5% of all households in the county.
For the population five year of age and over in 2000, 18.5% had a disability, and the
segment of the population with the highest reporting of disabilities (40.5%) was the population
65 years of age and over. For the population five years of age and over in 2006, the reporting of
disabilities had decreased to 12.8%, and for the population 65 years of age and over, 31.7%
reporting having a disability.
38
http://www.swed.org/images/2007%20County%20Profile.pdf

Page | 45
4.1.2.7.3 Education
In 2000, 80.7% of the county‘s population 25 year of age and over had a high school
graduate or higher level of education and 21.9% had a bachelor‘s degree or higher level of
education. Graduate or professional degrees were held by 8.2% of the county‘s population in
this age cohort. In 2006, 82.2% of the population 25 years of age and over had a high school
graduate or higher level of education, and 25.6% had a bachelor‘s degree or higher level of
education. Graduate or professional degrees were held by 9% of Wicomico County‘s population
in this cohort.
4.1.2.7.3 Employment
The population 16 years of age and over in the county totaled 66,207 in 2000, of which
67.7% were in the labor force. At that time 3.7% of the population over 16 years of age was
unemployed. In 2000, 62.6% of females were in the labor force, and 59% were employed. In
2006, 73,103 persons in the county were 16 years of age and over and 67.6% were in the labor
force. At that time 4.3% were unemployed. In 2006, 61.9% of females were in the labor force,
and 58% were employed.
The most frequently reported occupations for Wicomico County‘s workers in 2000
included management, professional and related occupations (30.8%), sales and office
occupations (26.7%), and service occupations (17.2). Farming, fishing and forestry occupations
were reported by 0.9% of county workers. Private wage and salary workers comprised 75.7% of
workers in the county, government workers made up18.1%, self-employed workers in own not
incorporated business comprised 5.8%, and unpaid family workers comprised 0.3% in 2000. In
2006, the most common occupations included management, professional, and office occupations
(34.1%), sales and office occupations (27.8%), and production, transportation, and material
moving occupations (13.3%). Farming, fishing and forestry occupations were reported by 0.7%
of workers residing in the county. The distribution of workers by class was similar in 2006 with
76.7% private wage and salary workers, 18.3% government workers, 4.8% self-employed
workers in own not incorporated business, and 0.1% unpaid family workers.
The industries in which workers residing in Wicomico County in 2000 were employed
most frequently included educational, health and social services (24.1%), manufacturing
(14.5%), and retail trade (12.3%). Agriculture, forestry, fishing and hunting, and mining
provided employment for 2.2% of the county‘s resident workers in 2000. In 2006, the most
commonly reported industries for county workers included educational services, health care, and
social assistance (23.1%), retail trade (14.5%), and arts, entertainment, and recreation, and
accommodation and food services (11.3%). Agriculture, forestry, fishing and hunting, and
mining provide employment for 1.7% of the county‘s workers.
According to the Bureau of Labor Statistics,39
there were two establishments in fisheries,
one in finfish fishing and one in seafood product preparation and packaging, active in 2004 and
2005 for which data were disclosed. The finfish fishing establishment was still active in 2006.
39
http://data.bls.gov/PDQ/outside.jsp?survey=en

Page | 46
Data regarding numbers of employees and wages were not disclosed for the time period between
2001 and 2006.
4.1.2.7.4 Income
In 1999, the median household income was $39,035 and the median family income was
$47,129. At that time, 31.2% of households and 22.2% of families had incomes under $25,000.
Per capita income in the county was $19171 in 2000. Median earnings for male full-time, year
round workers in Wicomico County in 2000 were $32,481 and for female full-time, year-round
workers median earnings were $23,548. In 2006, the median household income was 47,540 and
the median family income was $58,498 in 2006 inflation-adjusted dollars. In 2006, 24.3% of
households and 16.4% of families had incomes below $25,000. Per capita income in 2006 was
$24,641. Median earnings for male full-time, year-round workers were $38,080, and median
earnings for female full-time year-round workers were $31,600.
In 1999, 8.7% of families in the county had incomes below the poverty level. Families
with a female householder, no husband present were more likely to be in poverty with 26.8% of
these families having income below the poverty level. In 2006, conditions for families in general
had improved slightly for families in general with 7.2% of families estimated to have incomes in
the previous year below the poverty level, but the situation had stayed stable for families with
female householders, no husband present, at 26.8% of the families still having incomes below
the poverty level.
4.1.2.7.5 Housing
In 2000 there were 34,401 housing units in Wicomico County, of which 93.7% were
occupied. For the occupied units, 66.5% were owner occupied and 33.5% were renter occupied.
The vacancy rate was 6.3%. Assuming all vacation and seasonal units were vacant at the time of
census taking, 0.8% of the units in the county are for seasonal, recreational or occasional use. In
2006, the number of housing units had increased to 39,390, and 90% were occupied. Of the
occupied units in 2006, 67.6% were owner occupied and 32.4% were renter occupied. The
median value of an owner occupied unit in 2000 was $94,500 and the median rent was $567; in
2006, the median value of an owner occupied unit increased to $165,400 and the median rent
increased to $843.
The housing stock in the county was predominantly composed of single unit detached
structures (72.9%) and mobile homes (7.7%) in 2000. In 2006, this remained the case, but there
was an increase in multiple unit structures in the 10 to 19 unit classification that nearly equaled
the percentage of mobile homes. Units in excess of 30 years old in 2000 comprised 43% of the
county‘s housing stock.
4.1.2.8 Worcester County
Worcester County is the sole county in Maryland that has Atlantic shoreline. It is the
easternmost of the eastern shore counties, and is among the two most southerly (the other is
Somerset). The county is within the Ocean Pines Micropolitan Area. Major employers, those
employing more than 100 people, included three hotels/restaurants, two health care providers, a

Page | 47
big box discount store, a candy products company, a manufacturer of plastic laboratory
equipment, and an electrical contractor.40
Although the barrier island area at Assateague and Ocean City can be considered isolated,
Assateague is reasonably unpopulated, and the highly populated area of Ocean City has two
major bridges, one off US Highway 50 and the other from State Highway 90. Additionally, just
beyond the state line into Delaware, Delaware State Highway 54 provides additional access to
the mainland for Fenwick Island that adjoins the Ocean City barrier island complex.
There are four municipalities within the county, Berlin, Ocean City, Pocomoke City, and
Snow Hill. Snow Hill is the county seat. The nearest cities of substantial size are Salisbury,
MD, approximately 18 miles from the county seat, and Dover, DE, approximately 75 miles from
the county seat. The nearest large cities are Norfolk, VA, approximately 115 miles away via
Chesapeake Bay Bridge-Tunnel ,Washington, DC, approximately 132 miles away via
Chesapeake Bay Bridge, and Philadelphia, PA approximately 150 miles away.
4.1.2.8.1 Location
Worcester County is the southeastern-most of the Eastern Shore counties. Unlike the
other Eastern Shore counties, it is not on Chesapeake Bay, but on the Atlantic Ocean. The
county extends from the Delaware to Virginia borders and on its western boundary shares
borders with Wicomico and Somerset Counties. The corresponding counties in Delaware and
Virginia are Sussex and Accomack, respectively. Although Worcester County is not on
Chesapeake Bay, it does have embayments as part of the local physical structures, including but
not exclusive to Chincoteague, Assateague, Assawoman, Isle of Wight and Sinepuxent Bays.
4.1.2.8.2 Transportation
Major highways in the county include U.S. Highways 13, 113, 50 and State Highway 90.
U.S. Highway 13 provides major access north south for the entire Delmarva Peninsula, and U.S.
Highway 50 connects the Eastern Shore with Washington DC metropolitan area. State
Highways 12, 365, 375, and 611 provide access within the county. Rail service for freight is
available in the county. A general aviation airport for small planes is available at Ocean City.
4.1.2.8.3 Demographics
The population of the county in 2000 totaled 46,543. The population was relatively
evenly split between males (48.8%) and females (51.2%). The median age of residents of the
county was 43 years.
The ethnic composition of the county‘s population for the 99% self-identifying a single
race was predominantly white people (81.2%), with a smaller population of black or African-
American people (16.7% and a small proportion (under 1% each) Asian, American Indian and
Alaska native, native Hawaiian or other Pacific islander, or peoples of some other race. Hispanic
and Latino people comprised 1.3% of the county‘s population in 2000.
40
http://www.co.worcester.md.us/econ/busclimate.htm

Page | 48
In 2000, 97.3% of the county‘s population was native born Americans. For the 2.7% of
the population that was foreign born, the most common regions of birth included Europe
(40.4%), Latin America (27.9%) and Asia (22.3%). The most frequently reported ancestries for
residents of the county included ―other ancestries‖ (20.8%), German (17.9%), and Irish (15.1%).
The average household size in the county in 2000 was 2.33 persons and the average
family size was 2.79 persons. For the population 15 years of age and over, 60.8% of male and
55.7% of females were married. Single parent families with children under 18 years of age
comprised 11.6% of families in the county. Single person households comprised 26.2% of all
households and nonfamily households comprised 5.7% of all households in the county.
For the population age 5 and over, 21% had a disability. The highest reporting of
disabilities (37.2%) came from the population 65 years of age and over.
4.1.2.8.4 Education
For the cohort 25 years of age and over, 81.7% had a high school graduate or higher level
of education, and 21.6% had a bachelor‘s degree or higher level of education. These rates are
slightly higher at the high school level, but slightly lower at the bachelor‘s degree level than the
national reporting (80.4 and 24.4% respectively).
Graduate or professional degrees were held by 7.1% of the county‘s population aged 25
and over.
4.1.2.8.5 Employment
The population in 2000 in Worcester County 16 years of age and over totaled 38,103, of
which 60.7% were in the labor force. At that time, 4.1% of the population 16 years of age and
over was unemployed. For the same age cohort, 54.8% of females were in the labor force and
51.2% were employed.
The most frequently reported occupations for workers residing in the county included
management, professional and related occupations (29.3%), sales and office occupations
(27.8%), and service occupations (21.2%). Farming, fishing and forestry occupations were
reported by 2.2% of the county‘s workers. By class of worker, the types of worker were
distributed as follows: private wage and salary workers 74.6%, government workers 16.2%, self-
employed workers in own not incorporated business 8.9%, and unpaid family workers 0.3%.

Page | 49
The industries in which workers residing in the county most commonly participated
included arts, entertainment, recreation, accommodation and food services (17.7%), educational,
health, and social services (17.2%), and retail trade (13.4%). Agriculture, forestry, fishing and
hunting, and mining employed 2.2% of the county‘s workers.
Employment in fisheries in the county according to the Bureau of Labor Statistics41
is
associated with establishments in ―other marine fishing,‖ with the number of establishments not
disclosed in 2002 and 2003, and a single establishment in 2004 and 2005; a maximum of seven
finfish fishing establishments in 2001 and 2003 (the number was not disclosed in 2002) which
declined to six in 2004 and 2005 and finally to five in 2006; five shellfish fishing establishments
in 2001 and 2002 , no disclosure of data in 2003, and two shellfish fishing establishments
remaining from 2004 through 2006; and finally numbers not disclosed of seafood product
preparation and packaging establishments for 2001 through 2003 and a single establishment in
2004 to none in 2005 through 2006. The maximum number of employees disclosed was in 2001
with 28 employees (21 in shellfish fishing and seven in finfish fishing). The maximum total
disclosed wages were $619 thousand in 2001.
4.1.2.8.6 Income
The median household income in 1999 was $40,650, and the median family income was
$47,293. At that time, 28.3% of households and 20.1% of families had incomes under $25,000.
Per capita income in Worcester County was $22,505. Median earnings for male full-time, year-
round workers were $31,735 and median earnings for female full-time, year-round workers were
$24,319.
In 1999, 7.2% of families in the county had incomes below the poverty level. Families
with a female householder, no husband present, were more likely to be in poverty with 26.1% of
these families having incomes below the poverty level.
4.1.2.8.5 Housing
In 2000 there were 47,360 total housing units, of which 41.6% were occupied. Of the
occupied units, 75% were owner occupied, and 25% were renter occupied. The vacancy rate was
58.4%. Assuming all vacation and other seasonal housing units were vacant during the period of
census taking, 38.1% of all housing units in the county are for seasonal, recreational or
occasional use. The median value of an owner occupied unit in the county was $121,500 and the
median rent was $574 in 2000.
Housing stock in the county is a mix of multiple and single unit structures with a slight
dominance of single unit detached structures (39.2%), but followed by 20 or more unit structures
providing 25.4% of the housing stock. Housing units in excess of 30 years in 2000 comprised
21.6% of the county‘s housing stock.
41
http://data.bls.gov/PDQ/outside.jsp?survey=en

Page | 50
4.1.3 WESTERN SHORE
4.1.3.1 Anne Arundel
Anne Arundel County is approximately midway north and south along Maryland‘s
western shore of Chesapeake Bay. It is the county that is home to Annapolis and the U.S. Naval
Academy, and is the location for the western terminus of the Bay Bridge. Much of the northern
two-thirds of the county are considered urban areas.42
Anne Arundel is part of the Baltimore-
Towson Metropolitan Area. Major employers in the county include three military installations
including the Naval Academy, the county school system, the regional airport, state government,
city government, a community college, the postal service, four government/military contractors,
an avionics communications firm, two healthcare companies, an airline and a
telecommunications firm.43
The county has no isolated areas insofar as there are no islands that are separate from the
mainland or other areas that are difficult to obtain transportation linkages.
The municipalities in the county include Annapolis and Highland Beach.
Annapolis is both the county seat and the state capitol. Nearby large cities include Baltimore and
Washington, DC, both approximately 30 miles away.
4.1.3.1.1 Location
Anne Arundel County is located along the middle section of Maryland‘s western shores
of Chesapeake Bay. Its northern boundaries are shared from east to west with Baltimore County,
the City of Baltimore, and Howard County. Its western boundary is shared with Prince George‘s
County. Its southern boundary is shared with Calvert County. To the east is Chesapeake Bay,
and across the bay are Kent, Queen Anne‘s, and Talbot Counties.
4.1.3.1.2 Transportation
Major highways in the county include Interstates 295, 97, 895 and U.S.50. These
highways provide major linkages between Washington, Baltimore and Annapolis. In addition
State Highways 258, 261 468 214 178 173, and 177 provide access within the county. Rail
service including Amtrak and MARC (service to Baltimore and Washington) is available in the
county. Three general aviation airports are located within the county, along its southern border.
The regional Baltimore/Washington Airport with international service is located in the northwest
corner of the county.
4.1.3.1.3 Demographics
In 2000, the total population of the county was 489,656 persons. The population was
evenly split between males (48.8%) and females (50.2%). The median age was 36 years. In
2006, the total population of the county had increased to an estimated 509,300 persons. The
population was still evenly split between males (49.6%) and females 50.4%). The median age
had increased slightly to 37.6 years.
42
http://www.msa.md.gov/msa/govpub/e/033000/033711/pdf/anne_ua.pdf 43
http://www.aaedc.org/top_employers.html,

Page | 51
The ethnic composition of Anne Arundel County in 2000 for those self-identifying a
single race (98.3% of the population) was predominantly white people (81.2%) with a smaller
proportion of black or African American people (13.6%), Asian people (2.3%), and a small
percentage of other races. In 2000, Hispanic or Latino people comprised 2.6 of the county‘s
population. In 2006, there was a slight shift in the ethnic composition of Anne Arundel County.
Although much of the county (97.6%) still self-identified a single race, and white people still
predominated (78.7%), the percentage of black or African American people had increased
slightly to 14.4%, the percentage of Asian people had increased to 3% and the percentage of
―some other race‖ had increased to 1.4%. In addition the percentage of Hispanic or Latino
people in the county had increased to 3.7% of the county‘s population.
In 2000, 95.3% of the county‘s population was native born Americans. For the
4.7% of the population that was foreign born, the most frequently reported areas of birth
included Asia (33.8%), Europe (27.4%), and Latin America (23.9%). In 2006, 93.9% of the
county‘s population was native born Americans. The regions of birth most commonly reported
for the foreign-born included Asia (41.4%), Latin America (25.1%) and Europe (23.1%). The
most common ancestries reported for residents of the county in 2000 included ―other ancestries‖
(22.9%), German (21.1%), and Irish (17.1%).
In 2000 the average household size was 2.65 persons and the average family size was
3.09 persons, in 2006 the average household size had decreased to 2.59 persons, but the average
family size was similar at 3.1 persons. For people 15 years of age and over, 59.6% of males and
56.1% of females were married in 2000; in 2006, these rates had declined to 53.5% for males and
52.8% for females. In 2000, single parent families with children under 18 years of age comprised
11.2% of families in the county. In 2006, single parent families with children under 18 years of
age comprised 12.1% of families in the county. In 2000, single person households comprised
21.2% of households and nonfamily households comprised 6% of all households in the county.
In 2006, single person households made up 24.5% of households and nonfamily households
comprised 30.9% of all households in the county.
In 2000, for the population 5 years of age and over, 15.5% of the population reported
having a disability, and the highest rate of reporting a disability (38%) was for the cohort 65
years of age and over. In 2006, 12.4% of the population 5 years of age and over reported having
a disability. The cohort most likely to report a disability remained the cohort aged 65 years and
over with a rate of 33.7%.
4.1.3.1.4 Education
The population of Anne Arundel County is well educated. In 2000, 86.4% of the
county‘s population 25 years of age and over had a high school graduate or higher level of
education, and 30.6% had a bachelor‘s degree of higher level of education. These rates were
high in comparison to the national levels of 80.4% having a high school graduate or higher level
of education and 24.4% having a bachelor‘s degree or higher level of education. At that time
11.5% of the county‘s population 25 years of age and over had graduate or professional degrees.
In 2006, 90.3% of the county‘s population 25 years of age and over had a high school or higher
level of education and 35.2% had a bachelor‘s degree or higher level of education. Again, these
are higher than the national rates, which were 84.1% having a high school level or higher of

Page | 52
education and 27% having a bachelor‘s degree or higher level of education. Graduate or
professional degrees were held by 14.8% of the county‘s population age 25 and over in 2006.
4.1.3.1.5 Employment
The population of the county, 16 years of age and over in 2000, numbered 379,394, of
which 71.1% were in the labor force. At that time 2.1% of the population 16 years of age and
over was unemployed. For females in the age cohort, 65.3% were in the labor force and 62%
were employed. In 2006, 400,985 people in the county were 16 years of age and over; 70.2% of
the cohort was in the labor force and 2.7% of the cohort was unemployed. For females in the age
cohort, 66.3% were in the labor force and 62.6% were employed.
The most frequent occupational categories reported for workers residing in the county
included management, professional and related occupations (40.5%), sales and office
occupations (28%), and service occupations (12.5%) in 2000. Farming, fishing and forestry
occupations accounted for 0.1% of those reported in the county in 2000. By class of worker, the
composition of workers in the county included 73.1% private wage and salary workers, 21.7%
government workers, 5% self-employed workers in own not incorporated business, and 0.2%
unpaid family workers in 2000. In 2006, the major occupations were management, professional,
and related occupations (43.1%), sales and office occupations (27.3%) and service occupations
(12.3%). Farming, forestry and fishing occupations were reported by 0.2% of workers residing
in the county. By class of worker, the composition of workers had shifted somewhat to 70.4%
private wage and salary workers, 23.7% government workers, 5.7% self-employed workers in
own not incorporated business, and 0.2% unpaid family workers.
The industries in which workers residing in the county were most often employed in 2000
included educational, health, and social services (17.1%), professional, scientific, management,
administrative, and waste management services (12.1%), and public administration (11.9%).
Agriculture, forestry, fishing and hunting, and mining employed 0.2% of the county‘s workers in
2000. In 2006, the industries which most frequently employed county workers included
educational services, health care, and social assistance (17.7%), professional, scientific,
management and administrative, and waste management services (14.3%), public administration
(13.2%). Agriculture, forestry, fishing and hunting, and mining provided employment for 0.3%
of county residents in 2006.
According to the Bureau of Labor Statistics,44
there are currently no establishments in
fishing currently in Anne Arundel County, although the data set consulted is based upon
unemployment insurance, so there may be people who are self employed in fishing and/or people
employed on vessels that are incorporated but do not pay into unemployment insurance who
were not included in the data set. In the recent past (2001 and 2002) there were an undisclosed
number of finfish fishing establishments and in 2001-2003 there were also an undisclosed
number of seafood product preparation and packaging establishments in the county. No data
were disclosed with regard to numbers of employees or wages for these establishments.
44
http://data.bls.gov/PDQ/outside.jsp?survey=en

Page | 53
4.1.3.1.6 Income
In 1999, the median household income was $61,768 and the median family income was
69,019. At that time of 13.9% of households and 9.4% of families had incomes under $25,000.
In 2006, the median household income was $76,160 and the median family income was $91,171
in 2006, adjusted for inflation dollars. In 2006, 11.4% of households and 6.1% of families had
income under $25,000. Per capita income in 2000 was $27,578, and in 2006 was $35,753.
Median earnings for male full-time, year-round workers were $43,747 in 2000 and $57,025 in
2006, whereas for female full-time, year-round workers median earnings were $32,348 in 2000
and $43,623 in 2006.
In 2000, 3.6% of families in the county had incomes below the poverty level, and 13.4%
of families with a female householder, no husband present, had incomes below the poverty level.
In 2006, 2.7% of families had incomes below the poverty level and 8.9% of families with a
female householder, no husband present, had incomes below the poverty level.
4.1.3.1.7 Housing
In 2000, there were 186,937 total housing units in the county, of which 95.6% were
occupied. Of the occupied units, 75.5% were owner occupied and 24.5% were renter occupied.
The vacancy rate was 4.4%. Assuming all vacation and seasonal units were vacant during the
census taking, 1.1% of the housing units in the county were for seasonal, recreational or
occasional use. In 2006 there were 201,602 housing units of which 93.7% were occupied.
Owner occupancy had increased to 77.6% and renter occupancy had decreased to 6.3%. In 2000
the median value of an owner occupied unit was $159,300, but in 2006 it had increased to
$379.200. In 2000 the median rent was $798, but in 2006 it had increased to $1,151.
Housing stock in the county in 2000 consisted primarily of single unit detached (64%)
and single unit attached (17.3%) structures. In 2006, similar results were found with a slight
decrease in the single unit detached and attached structures and a slight increase in multi-unit
structures, reflecting increased construction of multi-unit structures in the intervening years.
Structures in excess of 30 years old in 2000 comprised 39.7% of the county‘s housing stock.
4.1.3.2 City of Baltimore
The City of Baltimore became a county equivalent by adoption of the Maryland
Constitution in 1851.45
The city located two-thirds of the way north-south on Maryland‘s
western shores of Chesapeake Bay, on the Patapsco River providing an inland port for goods
coming from the Atlantic. The city is highly developed with high-density building on the harbor
and in the city boundaries and substantial transportation services including rail, subway, and bus
systems. The port is still important for provision of cargo to the Midwestern U.S., the regional
center for international commerce in the region is the World Trade Center in Baltimore which
houses the US headquarters for several major shipping lines. 46
Exports from Baltimore include
coal, corn, soybeans, lignite (a form of coal), coal coke, petroleum, and fuel oils; imports include
cars and small trucks, iron ore, petroleum products, gypsum, sugar, cement, aluminum ore, salt,
45
http://www.msa.md.gov/msa/mdmanual/01glance/html/county.html 46
http://www.msa.md.gov/msa/mdmanual/01glance/html/port.html

Page | 54
crude mineral substances, fertilizer and fertilizer materials, iron alloys, wood pulp and paper.47
Major employers in the city include ten medical care providers or medical research groups, a
university, an energy products firm, a telecommunications firm, a newspaper publisher, a large-
scale commercial bakery, and a specialty chemical firm.48
Considering the inland nature of the city and its location around the river, there are no
isolated areas. Transportation in the city is abundant, but may not be available to all city
residents dependent upon income.
4.1.3.2.1 Location
The City of Baltimore is located approximately one third of the way south on the western
side of Chesapeake Bay in Maryland. It is somewhat inland, on the Patapsco River with linkage
to the main stem of the bay. Wrapping around the county to the east, north and west of the city is
Baltimore County, to the south is Anne Arundel County.
4.1.3.2.2 Transportation
The City of Baltimore is along a major transportation corridor with Interstate 95 linking
the major east coast cities including Washington, DC, Baltimore, Philadelphia, New York, and
Boston. The proximity of Baltimore and Washington is such that additional highways have been
required to handle the traffic, including Interstate 195. Interstate 97 links Baltimore with
Annapolis, and Interstate 87 links Baltimore with Harrisburg, PA. Baltimore is the eastern
terminus for Interstate 70, which runs to the Rocky Mountains. Rail service is provided on
Amtrak, MARC (Maryland Rail Commuter Service) and for freight. In addition there is subway
and light rail service in the city, in addition to bus routes. The nearest commercial airport is the
Baltimore Washington International airport, in adjoining Anne Arundel County, and two
additional international airports, Dulles and Reagan National are available within 50 miles.
4.1.3.2.3 Demographics
In 2000 the total population of the city was 651,154 people. There were slightly more
females (53.4%) than males (46.6%). The median age was 35 years. In 2006, the total
population of the city had declined to 631,366 people. Females still outnumbered males (53.5%
to 46.5% respectively). The median age of the population of the city had increased slightly to
35.6 years.
In 2000, 98.5% of the population described their ethnicity in terms of a self-identified
single race. The racial composition of the city of Baltimore was roughly two thirds black or
African American people (64.3%), with approximately one third white people (31.6%) and a
small percentage (1.5% each) Asian and people who reported two or more races. Hispanic and
Latino people comprised 1.7% of the city‘s population in 2000. In 2006, 98.5% of the
population again self-identified as a single race. The composition of the city‘s population was
estimated to have remained at roughly two thirds black or African American (64.4%), but the
white population had declined slightly to 30.9%, and the Asian population had increased slightly
47
http://www.msa.md.gov/msa/mdmanual/01glance/html/port.html 48
http://www.baltimoredevelopment.com/info_employers.html
Page | 55
to 1.9%, and the group ―some other race‖ increased to 1.1%. People self-identifying two or more
races remained at 1.5%. Hispanic and Latino people had increased to 2.4% of the population.
In 2000, 95.4% of the population was native born Americans. For the 4.6% of the
population, the most common regions of birth include Latin America (34.4%), Asia (26.6%), and
Europe (24.3%). The most frequently reported ancestries in 2000 were ―other ancestries‖ (56%),
German (7.4%) and Irish (6%). In 2006, 93.3% of the population was native born Americans.
For the 6.1% of the population who were foreign born, the most common regions of birth include
Latin America (33.2%), Asia (24.2%), and Africa (20.3%).
The average household size in the city in 2000 was 2.42 persons and the average family
size was 3.16 persons. For the population 15 years of age and over, 35.9% of males and 28.8%
of females were married in 2000. Single parent families with children under 18 years of age
comprised 26.8% of families in the city in 2000. Single person households comprised 35% of
households and nonfamily households comprised 7.6% of households in the city in 2000. In
2006, the average household size was 2.57 persons and the average family size was 3.57 persons.
For the population 15 years of age and over, 29.7% of males and 24% of females were married in
2006. Single parent families with children under 18 years of age had declined slightly to 24.9%
of families in the city. Single person households comprised 39.8% of households in the city and
nonfamily households comprised 46.8% of households in the city.
In 2000, 27.2% of the city‘s population five years of age and over had a disability. The
segment of the population most likely to report having a disability (51.2%) was the cohort 65
years of age and over. In 2006, 19.2% of the city‘s population five years of age and over had a
disability. The cohort 65 years and over had a decline in disability reporting to 49.2% having a
disability.
4.1.3.2.4 Education
The population that is 25 years of age and over in the city of Baltimore have lower levels
of educational attainment than the national levels. In 2000, 68.4% of the population had a high
school level or higher level of education and 19.1% had a bachelor‘s degree or higher level of
education compared to the national overall rates of 80.4% having high school or higher levels of
education and 24.4% having bachelor‘s degrees or higher levels of education. In 2000, graduate
or professional degrees were held by 8.7% of the city‘s population 25 years of age and over. In
2006, 74.2% of the population 25 years of age and over had high school graduate or higher levels
of education and 23.3% of the cohort had a bachelor‘s degree or higher level or higher level of
education. The national levels of education were 84.1% having high school graduate or higher
levels of education and 27% having bachelor‘s degree or higher levels of education in 2006.
Graduate or professional degrees were held by 11.1% of the population 25 years of age and over
of the city in 2006.
4.1.3.2.5 Employment
The population of the city 16 years of age and over in 2000 totaled 507,534. Of these,
56.6% were in the labor force and 6% of the population 16 years of age and over were
unemployed. For females in the age cohort, 54.5% were in the labor force and 48.8% were
employed. In 2006, there were 494,336 people 16 years of age and over, of which 60.4% were

Page | 56
in the labor force and 6.4% were unemployed. For females in the age cohort, 58.7% were in the
labor force and 52.5% were employed.
In 2000, the most frequent occupations were management, professional and related
occupations (32.4%), sales and office occupations (27.1%), and service occupations (20%).
Farming, fishing, and forestry occupations were held by 0.1% of the workers residing in the city
in 2000. By class of the worker, the composition of the city‘s workers were 73.2% private wage
and salary workers, 22.3% government workers, 4.3% self-employed workers in own not
incorporated business and 0.2% unpaid family workers in 2000. In 2006, the most frequent
occupations were management, professional, and related occupations (34.1%), sales and office
occupations (26%), and service occupations (21.9%). Farming, fishing and forestry occupations
were held by 0.16% of the city‘s workers in 2006. The composition of classes of workers had
shifted somewhat in 2006 with 75.9% private wage and salary workers, 20.7% government
workers, 3.4% self-employed workers in own not incorporated business and 0.1% unpaid family
workers (totals 100.1% due to rounding.)
The industries in which workers residing in the county were employed most commonly in
2000 included educational, health and social services (26.8%), professional, scientific,
management, administrative, and waste management services (10.2%), and public administration
(9.3%). Farming, forestry, fishing and hunting, and mining provide employment for 0.1% of the
city‘s workers. In 2006, the most common industries in which the city‘s workers participated
included educational services, and health care, and social assistance (28.9%), professional,
scientific, and management, and administrative and waste management services (10.7%), and
retail trade (9.5%). Farming, forestry, fishing and hunting, and mining provide employment for
0.25% of the city‘s workers.
The City of Baltimore had a limited number of fishing establishments between 2001 and
2006 for which data could be disclosed according to the Bureau of Labor Statistics.49
At peak,
there were two shellfish fishing establishments and one seafood product preparation and
packaging establishment, which were functioning in 2006. No data was disclosed on number of
employees or wages for establishments in either category.
4.1.3.2.6 Income
The median household income for the City of Baltimore in 1999 was $30,078 and the
median family income was $35,438. At that time, 42.8% of households and 35.5% of families
had incomes under $25,000. The per capita income in 2000 was $16,978. In 2000, the median
earnings for male full-time, year-round workers were $31,767 and the median earnings for
female full-time, year-round workers were $26,832. The median household income for the city
of Baltimore in 2006 was $36,031, and the median family income was $43,889 in 2006 inflation-
adjusted dollars. In 2006, 34.6% of households and 25.8% of families had incomes under
$25,000 dollars. The per capita income in 2006 was $20,791. Median earnings for male full-
time, year-round workers had increased to $36,620 and the median earnings for female full-time,
year-round workers had increased to $32,203.
49
http://data.bls.gov/PDQ/outside.jsp?survey=en

Page | 57
In 1999, 18.8% of the families in the city had incomes below the poverty level. This is
perhaps the highest rate for any city/county equivalent around Chesapeake Bay. Families with a
female householder, no husband present, were nearly twice as likely to be in poverty in the city
with 31.5% having incomes below the poverty level in 1999. In 2006, 15.8% of all families had
incomes below the poverty level in the previous 12 months, and families with a female
householder, no husband present were about twice as likely (26.5%) to have income below the
poverty level, and even more likely to be in poverty if these families had children under 5 years
old only (47.4%).
4.1.3.2.7 Housing
In 2000 there were 300,477 housing units in the city of which 85.9% were occupied. Of
the occupied units, 50.3% were owner occupied, and 49.7% were renter occupied. The vacancy
rate was 14.1%. Assuming all vacation and seasonal housing units were vacant during the
census taking, 0.6% of all units in the city were for seasonal, recreational or occasional use. In
2006, there were 296,064 total housing units in the city of which 80.3% were occupied. Of the
occupied units, 50.7% were owner occupied, and 49.3% were renter occupied. The median
value of owner occupied units was $69,100 in 2000 and had increased to $126,400 in 2006. The
median rent was $498 in 2000, and had increased to $750 in 2006.
Housing stock in the city was predominantly single unit attached (51.8%), single unit
detached (13.4%), and multi-unit structures (10.3% 20 or more units) in 2000. The proportions
remained similar in 2006 with 53% of housing units being single unit attached, 13.9% single unit
detached, and 10.3% in 20 or more unit structures. Housing units in excess of 30 years old in
2000 comprised 85% of the city‘s housing stock.
4.1.3.3 Baltimore County
Baltimore County is the second most northerly county on the western shore of
Chesapeake Bay. Baltimore County is within the Baltimore-Towson Metropolitan Area, which is
a subsection of the Baltimore-Washington-Northern Virginia Combined Statistical Area. The
county wraps around the northern area of the City of Baltimore, and the southern half of the
county is largely urbanized and forms the city‘s suburban areas. Although much of the southern
portion of the county is urbanized, it has no municipalities, and, thus, only county level of
government. Unincorporated Towson is the county seat. In the county‘s information on its
economy, the economic development department notes that the county ―has become the largest
employment base in the region and the second largest in the State.‖ Among major employers in
the area (employers of over 2000 employees), included are the Social Security Administration
with nearly 10,000 employees, three hospitals, the centers for Medicare and Medicaid Services,
the headquarters of a retirement communities and some of the retirement communities, financial
and investment services, a health care provider, and a food products company which produces
spices and flavorings.50
There are three islands in the county that are isolated property and are only accessible by
boat, but are held as state park. They comprise Hart-Miller Island State Park, and include Hart,
Miller and Pleasant Islands. Hart-Miller Islands, now together as a diked property consisting of
50
http://www.co.ba.md.us/Agencies/economicdev/gateway/bizcommunities/employers.html

Page | 58
dredged material is managed for birds that prefer mudflats. Pleasure Island, nearer the shore is
wooded, and while it once was developed as an amusement park is now closed.51
4.1.3.3.1 Location
Baltimore County is located second most northerly along the western shore of
Chesapeake Bay. It shares its northeastern boundary with Harford County, and its northern
boundary is the state line with Pennsylvania. Across the state line is York, County, PA. To the
west are Carroll and Howard Counties, north and south respectively, and to the south of
Baltimore County is Anne Arundel County and the apparently embedded, but politically and
jurisdictionally distinct City of Baltimore. To the east is Chesapeake Bay, and across the bay is
Kent County.
4.1.3.3.2 Transportation
Major highways in the county include Interstates 95, 695, 195, 795 and 83. State
Highways 25, 130, 145, 146, and 147 among others provide circulation within the county.
Amtrak and MARC rail service is provided in the county in addition to freight rail services.
There are two general aviation airports in the county, both near the area of Essex.52
Commercial
air service is available in adjacent Anne Arundel County at the Baltimore Washington Airport.
4.1.3.3.3 Demographics
In 2000 the population of the county was 754,292 people. There were slightly more
females (52.6%) than males (47.4%). The median age of the county‘s population was 37.7 years.
In 2006, the population of the county had increased to an estimated level of 787,384 people.
Females in the estimate still were slightly more abundant than males (52.4% females, 47.6%
males). The median age of the population in 2006 had increased to 38.8 years.
In 2000, 98.6% of the population of Baltimore County self-identified as a single race. Of
these people, 74.4% were white, 20.1% were black or African American, and 3.2% were Asian.
People who identified their races as American Indian and Alaska native, native Hawaiian and
other pacific islander, or some other race comprised less than 1% each of the population.
Hispanic and Latino people comprised 1.8% of the population of the county at that time. In
2006, the racial composition of the county had shifted to a slightly more diverse population with
a higher percentage of black/African American, and Asian people. In 2006, for those who self-
identified a single race, 68.7% were white, 24.4 % were black or African American, and 4.2%
were Asian. As in 2000, people who self-identified as American Indian and Alaska native,
native Hawaiian and other pacific islander, or some other race comprised less than 1% each of
the population. Hispanic and Latino people comprised 2.7% of the population in 2006.
In 2000, nearly 93% of the county‘s population was native born Americans. For the
7.1% of the population that was foreign born, the most common regions of birth included Asia
(39.2%), Europe (30.6%), and Latin American (17.6%). In 2006, 91.3% of the county‘s
population was native born Americans. For the 8.7% of the population that was foreign born, the
most common regions of birth included Asia (40.3%), Europe (21.4%), and Latin America
51
http://www.dnr.state.md.us/naturalresource/summer2004/hartmiller.html 52
http://www.marylandregionalaviation.aero/content/mdpublicuseairports/index.html

Page | 59
(20.6%). The most frequently reported ancestries in 2000 included ―other ancestries‖ (27.5%),
German (22%), and Irish (14.6%).
In 2000, the average household size was 2.46 persons and the average family size was 3
persons. In 2006, the average household size remained at 2.46 persons but the average family
size had decreased slightly to an estimate of 2.99 persons. For people 15 years of age and over,
57.2% of males and 49.3% of females were married in 2000; in 2006, 52.4% of males were
married and 45.9% of females were married. In 2000, single parent households with children
under 18 years of age comprised 13.3% of families in the county, whereas in 2006, single parent
households with children under 18 years of age comprised 16.3% of families. Single person
households comprised 27.3% of households and nonfamily households comprised 6.1% of
households in 2000; in 2006, single person households comprised 27.5% of households and
nonfamily households comprised 34.4% of households in the county.
For people five years of age and over, 18.2% had a disability in 2000. At that time, the
population most likely to have a disability (38.1% reported having a disability) was the cohort 65
years of age and over. In 2006, 14% of the population five years of age and over reported having
a disability. For the cohort aged 65 and over, 39.5% reported having a disability.
4.1.3.3.4 Education
The population of Baltimore County, unlike the population of the adjoining City of
Baltimore is highly educated. In 2000, 84.3% of the county‘s population 25 years of age and
over had a high school graduate or higher level of education, and 30.6% had a bachelor‘s degree
or higher level of education. Compared to the national rates with 80.4% of the population having
a high school graduate or higher level of education and 24.4% of the population in that cohort
having a bachelor‘s degree or higher level in 2000, the county compares favorably. At that time
12.5% of Baltimore County‘s population held graduate or professional degrees. In 2006, for the
same age cohort, 88.1% of the county‘s population had a high school graduate or higher
education, and 34.3% had a bachelor‘s degree or higher level of education. This compares with
national rates or 84.1% for the high school graduate or higher level of education and 27% for
bachelor‘s degree or higher levels of education. In 2006, 14.5% of the county‘s population 25
years of age and over held graduate or professional degrees.
4.1.3.3.5 Employment
In 2000, the population 16 years of age an over totaled 595, 770, of which 66.5% were in
the labor force, and 2.8% were unemployed. For females in the age cohort, 61% were in the
labor force and 58.5% were employed. In 2006, the population 16 years of age and over totaled
633,025 of which 68.1% were in the labor force and 3.2% were unemployed. For females in the
age cohort, 63.6% were in the labor force and 60.4% were employed.
The most common occupations for workers residing in Baltimore County in 2000
included management, professional and related occupations (39.5%), sales and office
occupations (29%) and service occupations (13.2%). Farming fishing and forestry occupations
were reported by 0.1% of the county‘s workers. By class of worker, the composition of those
residing in the county in 2000 were predominantly private wage and salary workers (76.5%),
then government workers (18.4%), followed by self-employed workers in own not incorporated

Page | 60
business (4.9%), and unpaid family workers (0.2%). In 2006, the most common occupations
were management, professional and related occupations (41.6%), sales and office occupations
(26.4%), and service occupations (14.2%). Farming, fishing and forestry were estimated to be the
occupations for 0.1% of the county‘s workers in 2006. By class of worker, the county‘s
employment was even more dominantly wage and salary workers (77.6%), with slightly fewer
government workers (17.6%), self-employed workers in own not incorporated businesses (4.6%)
and unpaid family workers (0.1%).
The most frequently reported industries in which workers residing in the county were
employed in 2000 included educational, health and social services (22.9%), retail trade (11.3%)
and professional, scientific, management, administrative, and waste management services
(10.5%). In 2000, agriculture, forestry, fishing and hunting, and mining provided employment
for 0.2% of workers residing in the county. In 2006, the most frequently reported industries in
which workers residing in the county participated included educational services, and health care,
and social assistance (24.6%), professional, scientific, and management, and administrative and
waste management services (12.5%), and retail trade (10.6%). Agriculture, forestry, fishing and
hunting, and mining employment remained at 0.2% of the county‘s workers.
For the last three years for which there are data (2004 – 2006) there were active
establishments in finfish fishing (one), shellfish fishing (two in 2004, declining to one for 2005
and 2006), and seafood product preparation and packaging (two in 2004 increasing to 3 in 2005
and 2006) according to the Bureau of Labor Statistics;53
data were not disclosed for the prior
three years. Data were not disclosed for numbers of employees or wages during the time period
for these employment categories.
4.1.3.3.6 Income
The median household income in the county in 1999 was $50,667, and the median family
income was $59,998. At that time, 20.4% of households and 12.7% of families had income
under $25,000. The per capita income for the county was $26,167 in 2000. Median earnings for
male full-time, year-round workers were $41,048 and median earnings for female full-time, year
round workers were $31,426. In 2006, the median household income was $59,995 and the
median family income was $70,716 in 2006 inflation-adjusted dollars. In 2006, 16.8% of
households and 11.1% of families had income under $25,000 in the previous year. The per capita
income in 2006 was $31,086. Median earnings for male full-time, year-round workers in 2006
were $49,615 and median earnings for female full-time, year-round workers were $40,187.
In 1999, 4.5% of families residing in the county had incomes below the poverty level.
Families with a female householder, no husband present were approximately four times more
likely to be in poverty with 13.8% of these families having incomes below the poverty level in
1999. In 2006, 5.5% of families residing in the county had incomes below the poverty level in
the previous 12 months, which is one of the few areas where an increase in families below the
poverty level has been detected for Chesapeake Bay area. Families with a female householder,
no husband present, were in even more precarious situations with an increase to 16.8% of these
families having incomes below the poverty level.
53
http://data.bls.gov/PDQ/outside.jsp?survey=en

Page | 61
4.1.3.3.7 Housing
In 2000 there were 313,734 housing units in the county of which 95.6% were occupied.
Of the occupied units, 67.6% were owner occupied and 32.4% were renter occupied. The
vacancy rate was 4.4%. Assuming that all vacation and seasonal units were vacant during the
census taking, 0.5% of all units were for seasonal, recreational or occasional use. In 2006, there
were 326,023 housing units in the county of which 95.6% were occupied. Home ownership rates
had declined slightly, with owner occupied units making up 66.9% of the occupied units and
33.1% of units being renter occupied. The vacancy rate remained at 4.4%. The median value of
owner occupied units in 2000 was $127,300, but in 2006 it had increased to $253,600; the
median rent in 2000 was $670, and the median rent had increased to $924.
The housing stock in the county was comprised mainly of single unit detached (47%) and
single unit attached (24.5%) units in 2000. In 2006, these proportions were similar with 47.4%
single unit detached and 24.4% single unit attached structures in the county. Housing units in
excess of 30 years old in 2000 accounted for 54.9% of the county‘s housing stock.
4.1.3.4 Calvert County
Calvert County is located along the main stem of Chesapeake Bay, and is the second
most southerly county in Maryland on the main stem of the Bay, just north of St. Mary‘s County.
The county is part of the Baltimore-Towson Metropolitan Statistical Area within the
Washington-Baltimore-Northern Virginia Combined Statistical Area. The county is a peninsula,
separated from the more mainland counties of Prince George‘s and St. Mary‘s by the Patuxent
River. Although segments of the county are more rural in nature, three areas were recognized as
urbanized with populations of less than 50,000 in 2000.54
Major industries of the area include
defense contracting, information technology, tourism and administrative services according to
the county profile on the official website for Calvert County.55
There are no isolated islands in Calvert County, but the peninsula is a maximum of 9
miles wide at its widest point, so connections are slightly limited. A bridge connects the
Solomon‘s Island area at the southern portion of the county to St. Mary‘s county. Prior to that
construction in the 1970s, ferries connected the two counties, and the county now attributes
better roadway connections in part to its enhanced growth.56
There are two municipalities in Calvert County, Chesapeake Beach and North Beach,
both located on the northeast corner of the county. Additional ―town centers‖ have been
designated in the county‘s comprehensive plan, including Dunkirk, Owings, Huntingtown,
Prince Frederick, St. Leonard, Lusby and Solomons listed north to south.57
Prince Frederick is
the county seat.
54
http://www.msa.md.gov/msa/govpub/e/033000/033711/pdf/calv_ua.pdf 55
http://www.co.cal.md.us/visitors/profile/ 56
http://www.co.cal.md.us/visitors/profile/history 57
http://www.co.cal.md.us/visitors/profile/

Page | 62
4.1.3.4.1 Location
Calvert County is the second most southerly county on the main stem of Chesapeake
Bay, it is a peninsular area separated from Prince George‘s, Charles, and St. Mary‘s Counties to
the west by the Patuxent River. It shares its northern boundary with a portion of the southern
boundary of Anne Arundel County. Across the bay to the east are Dorchester and Talbot
counties.
4.1.3.4.2 Transportation
The major highways in Calvert County are State Highways 2 and 4. State Highway 2
connects with Highway 50/301 which links into the eastern shore. State Highway 4 connects
southward to St. Mary‘s County, and northward toward the Washington, DC area. State
Highways 260, 263, and 575 provide circulation within the county. The county does not have
rail service. Commercial airports are Dulles, Baltimore Washington International and Reagan
National. Calvert County does not have a public use general aviation airport, but one is available
each in adjoining counties, St. Mary‘s and Charles Counties, four in adjoining Prince George‘s,
and three in Anne Arundel County.
4.1.3.4.3 Demographics
The population of the county totaled 74,563 persons in 2000. The population was evenly
split between males (49.3%) and females (50.7%). The median age of the county‘s population in
2000 was 35.9 years. In 2006, the population had increased to 88,804 persons, with an
equivalent distribution of males and females. The median age had increased to 37.9 years.
The ethnic composition of the county was predominantly people of a single race (98.7%
self-identifying a single race) in 2000. White people comprised 83.9% of the county‘s
population, black or African American people comprised 13.1%, and the remaining racial
groups (American Indian or Alaska native, native Hawaiian or other Pacific Islander, Asian, and
some other race) made up a composite 1.7% of the population, with no one group comprising 1%
or more of the total county population. Hispanic or Latino people comprised 1.5% of the
county‘s population in 2000. In 2006, the county‘s population was still predominantly
comprised of people self-identifying a single race (97.7%), and still dominantly white with
83.3% of the population self-identifying as white. A shift had occurred among the minority
populations within the county, however; the black or African American population had declined
slightly to 12.1%, while the Asian population had increased slightly to 1.4% of the total county
population. Hispanic or Latino people had also increased in the county population to 2.1%.
In 2000, 97.8% of the county‘s population was comprised of native-born Americans. For
the 2.3% of the population that was foreign born, the most frequently reported regions of birth
included Europe (31.2%), Asia (29.1%) and Latin America (26%). In 2006, 97.9% of the
county‘s population was native born Americans. The 2006 data is based on sample information,
and the US Census Bureau determined the data cannot be displayed because the number of
sample cases is too small.58
58
http://factfinder.census.gov/servlet/ADPTable?_bm=y&-geo_id=05000US24009&-
qr_name=ACS_2006_EST_G00_DP2&-ds_name=ACS_2006_EST_G00_&-_lang=en&-redoLog=false&-_sse=on

Page | 63
The average household size was 2.61 persons and the average family size was 3.26
persons in 2000. In 2006, the average household size had increased to 2.9 persons and the
average family size had increased slightly to 3.28 persons. For people 15 years of age and over,
63.1% of males and 60.6% of females were married in 2000; in 2006, 58.5% of males and 53.5%
of females 15 years of age and over were married. Single parent families with children under 18
years of age comprised 10.3% of families in the county in 2000, and in 2006 single parent
families with children under 18 years of age comprised 12.4% of families in the county. Single
person households comprised 16.3% of households and nonfamily households comprised 4.2%
of households in the county in 2000. In 2006, single person households comprised 16.1% of
households and nonfamily households comprised 21.3% of households in the county.
In 2000, 15.9% of the county‘s population five years of age and over had a disability.
The age cohort most likely to have a disability (36.1%) was the group 65 years of age and over.
In 2006, 15% of the population five years of age and over had a disability; for those in the
population age 65 and over, 52.8% had a disability.
4.1.3.4.4 Education
In 2000, 86.9% of the county‘s population 25 years of age and over had a high school
graduate or higher level of education and 22.5% had a bachelor‘s degree or higher level of
education. This compares favorably with national rates of 80.4% of the population having a high
school graduate or higher level of education and slightly less favorably with the national rate of
college degree holders with 24.4% having a bachelor‘s degree or higher level of education.
Graduate or professional degrees were held by 8.3% of the county‘s population 25 years of age
and over in 2000. In 2006, 92% of the county‘s population 25 years of age and over had a high
school graduate or higher level of education and 27.6% had a bachelor‘s degree or higher level
of education. These both exceeded the national rates of 84.1% with high school graduate or
higher levels and 27% having bachelor‘s degrees or higher levels of education. In 2006,
graduate or professional degrees were held by 10% of the county‘s population 25 years of age
and over.
4.1.3.4.5 Employment
In 2000, there were 54,988 people in the county over 16 years of age of which 71.5%
participated in the labor force and 2.1% were unemployed. For females in this cohort, 65.6%
were in the labor force and 62.9% were employed at that time. In 2006, 69,919 people 16 years
of age and over in the county; 72.1% were in the labor force, and 2.3% were unemployed. For
females in this age cohort, 66.7% were in the labor force and 63.7% were employed.
The most frequently reported occupations in the county in 2000 included management,
professional and related occupations (36.8%), sales and office occupations (24.4%), and
construction, extraction and maintenance occupations (15%). Farming, fishing and forestry
occupations were reported by 0.2% of county workers in 2000. In 2006, the most common
occupations were management, professional and related occupations (40.5%), sales and office
occupations (24.2%), and service occupations (14.7%). Farming, fishing and forestry
occupations were reported by 0.1% of county workers in 2006. By class of worker, the
distribution of workers residing in the county in 2000 was 67.1% private wage and salary

Page | 64
workers, 26.5% government workers, 6.1% self-employed workers in own not incorporated
business, and 0.3% unpaid family workers. In 2006, the distribution by class of worker was
66.9% private wage and salary workers, 27.5% government workers, 4.7% self-employed
workers in own not incorporated business, and 0.9% unpaid family workers.
The industries in which workers residing in the county were most commonly employed
included educational, health, and social services (17%), public administration (14.9%), and
construction (13.7%) in 2000. Agriculture, forestry, fishing and hunting, and mining provide
employment for 0.7% of the county‘s workers. In 2006, the industries in which workers most
commonly were employed included educational services, and health care, and social assistance
(19%), public administration (14%), professional, scientific, and management, and
administrative and waste management services (12.2%) and construction (12.2%). Agriculture,
forestry, fishing and hunting, and mining employed 0.5% of the county‘s workers in 2006.
Fishing employment in Calvert County recognized by the Bureau of Labor Statistics
quarterly survey59
was restricted to seafood product preparation and packaging in 2001 and 2002.
For those years data was not available for numbers of establishments, numbers of employees, or
wages. No data was available for subsequent years.
4.1.3.4.6 Income
In 1999 the median household income for Calvert County was $65,945, and the median
family income was $71,545. In 2000, 12 % of households and 7.6% of families had income
below $25,000. Per capita income in 2000 was $25,410. At that time the median earnings for
male full-time, year round workers was $48,664 and the median earnings for female full-time
year round workers was $32,265. In 2006, the median household income was $84,891 and the
median family income was $91,175 in 2006 inflation-adjusted dollars. In 2006, 9.6% of
households and 5.2% of families had income below $25,000. Per capita income was $34,628 in
2006. Median earnings for male full-time year round workers were $57,002, and median
earnings for female full-time year round workers were $42,174.
In 1999, 3.1 % of families in the county had incomes below the poverty level, and 15.2%
of families with a female householder, no husband present, were found to be in poverty. In
2006, 1.5% of all families in the county had income below the poverty level in the previous 12
months, and 5.5% of families with a female householder, no husband present, had incomes
below the poverty level.
4.1.3.4.7 Housing
In 2000, there were 27,576 housing units in the county, of which 92.3% were occupied.
For the occupied units, 85.2% were owner occupied and 14.8% were renter occupied. The
vacancy rate was 7.7% in 2000. Assuming that all vacation and seasonal properties were vacant
at the time of census taking, 3.8% of units in the county were for seasonal, recreational or
occasional use. In 2006, there were 32,106 units in the county, of which 94.3% were occupied.
Of the occupied units, 84.9% were owner occupied and 15.1% were renter occupied. At that
time the vacancy rate was 5.7%. The median value of an owner occupied unit in 2000 was
59
http://data.bls.gov/PDQ/outside.jsp?survey=en

Page | 65
$169,200 which had increased to $394,700 in 2006, and the median rent in the county was $834
in 2000 which increased to $1,021 in 2006.
Housing stock in the county in 2000 consisted predominantly (88.7%) of single-family
detached units. In 2006, this dominance persisted at 87.5% of housing units. Housing units in
excess of 30 years old in 2000 comprised 21.5% of the county‘s housing stock.
4.1.3.5 Charles County
Charles County is the central county located along the Potomac River between
Chesapeake Bay and Washington, DC. The county is predominantly inland in nature so there are
no especially isolated areas in the county. The northern part of the county is more urbanized
while the southern portion, nearer the Potomac, is reasonably rural in character with substantial
woodlands and some agricultural uses as can be seen in the Google Earth aerial photography.
Major employers (over 100 employees) in the county include a development corporation, an
engineering consultant, a commercial printer, a fuel oil provider, a provider of concrete, block
and gravel, a building supply company, a construction firm, a naval base, a paving contractor, a
non-profit center for the disabled and a newspaper. 60
Municipalities within the county include La Plata, Port Tobacco and Indian Head. La
Plata is the county seat. The nearest large city is Washington, DC, approximately 35 miles from
the county seat.
4.1.3.5.1 Location
Charles County is located predominantly on the Potomac River, upstream from St.
Mary‘s County and separated from St. Mary‘s County in part by the Wicomico River. On the
northern border of Charles County is Prince George‘s County. To the east is the Patuxent River,
and across the river is Anne Arundel County.
4.1.3.5.2 Transportation
Major highways in the county include US 301 linking Virginia with Maryland via the
Potomac River Bridge, State Highway 5 which links St. Mary‘s county to Charles County, and
State Highway 210 which links Indian Head to Prince George‘s County. State Highways 224, 6,
234, 257, 227, provide the transportation network within the county. Rail service is available for
freight within the county, but passenger service is available in adjoining Prince George‘s County
for both Amtrak and MARC. There is a general aviation airport near Waldorf, and commercial
air services are available at Washington Dulles, approximately 60 miles away, Reagan National,
approximately 35 miles away, and Baltimore Washington International approximately 55 miles
away.
4.1.3.5.3 Demographics
In 2000, there were 120,546 people residing in Charles County. The population had
slightly more females (51.2%) than males (48.8%). The median age of the population at that
time was 34.6 years. In 2006, the population was estimated to have increased to 140,416 people.
60
http://www.ccbiz.org/employers.asp

Page | 66
The estimates remained slightly higher (51.3%) for females than for males (48.7%). The median
age was estimated at 35.2 years.
The ethnic composition of the county was approximately two thirds (68.5%) of the
people self identifying a single race as white people, and remaining third of the population
predominantly black or African American people (26.1%). Only Asian people made up a
component over 1% at 1.8%. Hispanic and Latino people comprised 2.3% of the county‘s
population in 2000. In 2006, the ethnic composition of the county had shifted fairly
substantially with the white population declining to 56.9% of the county‘s population, black and
African American people making up 36.2% of the population and Asian people making up 2.4%
of the county‘s population. In addition, people reporting two or more races increased from 2.1%
in 2000 to 3.3% in 2006. Hispanic or Latino people comprised 3.3% of the county‘s population
in 2006.
In 2000, 97.1% of the county‘s population was native born Americans. For the nearly
3% of the population which was foreign born, the most common regions of birth included Asia
(40.5%), Europe (28%) and Latin America (23%). In 2006, 96.4% of the county‘s population
was native born Americans. The population of foreign-born people was too small to present data
on regions of birth, and the census bureau withheld data. The most common ancestries in 2000
included ―other ancestries‖ (33.4%), German (13.9), and Irish (13.3%).
The average household size in 2000 was 2.86 persons and the average family size was
3.21 persons. For people 15 years of age and over, 59.8% of males and 55.3% of females were
married. Single parent families with children under 18 years of age comprised 14.9% of families
in the county in 2000. Single person households comprised 17.1% of households and nonfamily
households comprised 4.9% of all households in the county in 2000. In 2006, the average
household size was 2.85 persons and the average family size was 3.23 persons. For people 15
years of age and over, 54.6% of males and 49.6% of females were married in 2006. Single
parent families with children under 18 years of age comprised 19.4% of families in the county in
2006. Single person households comprised 18.9% of households and nonfamily households
comprised 23% of all households in the county.
In 2000, 16.7% of the population age five and over had a disability. The most affected
segment of the population was the cohort age 65 years and over which had 42.5% of its
population with a disability. In 2006, 11.6% of the population five years of age and over had a
disability. The age cohort 65 years and over had 38.7% reporting a disability in 2006.
4.1.3.5.4 Education
For Charles County‘s population 25 years of age and over in 2000, 85.8% of the
population had high school graduate or higher levels of education and 20% had a bachelor‘s
degree or higher level of education. At time, 6.8% of the age cohort held graduate or
professional degrees. In 2006, 89.2% of the county‘s population 25 years of age and over had a
high school graduate or higher level of education and 25% had a bachelor‘s degree or higher
level of education. In 2006, 8.1% of the county‘s population had a graduate or professional
degree.

Page | 67
4.1.3.5.5 Employment
In 2000, there were 89,512 people in the county 16 years of age and over, of which
72.6% were in the labor force and 2.4% were unemployed. For women in the age cohort, 67.5%
were in the labor force and 64.1% were employed. In 2006, there were 108,609 people 16 years
of age and over in the county, of which 73.5% were in the labor force and 3.7% were
unemployed. For females in the age cohort, 68.1% were in the labor force in 2006, and 63.9%
were employed.
In 2000, the most frequent occupations for workers residing in the county included
management, professional, and related occupations (35.7%), sales and office occupations
(28.3%), and service occupations (13.9%). Farming fishing and forestry occupations were
reported by 0.2% of the county‘s workers. By class of worker, the composition was 66.2%
private wage and salary workers, 29.2% government workers, 4.3% self-employed workers in
own not incorporated business, and 0.3% unpaid family workers in 2000. In 2006, the most
frequent occupations for workers in the county included management, professional and related
occupations (42.2%), sales and office occupations (25.5%), and service occupations (12.9%). In
2006, no one was found for farming, fishing or forestry occupations. By class of worker the
composition of the county was 65.8% private wage and salary workers, 30.5% government
workers, and 3.7% self-employed workers in own not incorporated business. There were no
unpaid family workers found in 2006.
The industries in which workers residing in the county were employed in 2000 most
commonly included public administration (18%), educational, health and social services
(16.1%), and retail trade (12%). Agriculture, forestry, fishing and hunting, and mining provide
employment for 0.8% of the county‘s workers in 2000. In 2006, the major industries were public
administration (18.7%), educational services, and health care, and social assistance (15.9%) and
professional, scientific, and management, and administrative and waste management services
(15.6%). Agriculture, forestry, fishing and hunting, and mining provide employment for 0.4% of
the county‘s workers in 2006.
According to the Bureau of Labor Statistics quarterly survey,61
the only fishing
establishments in Charles County were in seafood product preparation and packaging. Between
2001 and 2003 the number of establishments was not disclosed, and between 2004 and 2006
there was one establishment in the county. Data on numbers of employees and wages were not
disclosed for the years 2001 to 2006.
4.1.3.5.6 Income
The median household income in 1999 in Charles County was $62,199, and the median
family income was $67,602. At that time 12.7% of households and 9.1% of families had incomes
under $25,000. Per capita income in the county in 2000 was $24,285. Median earnings for male
full-time, year-round workers were $43,371 and median earnings for female full-time, year-
round workers were $34,231 in 2000. In 2006 the median household income in the previous year
was $80,179 and the median family income was $84,670 in 2006 inflation-adjusted dollars. At
that time 10.9% of households and 6.7% of families had incomes under $25,000. Per capita
61
http://data.bls.gov/PDQ/outside.jsp?survey=en

Page | 68
income was $33,849 in 2006. Median earnings for male full-time, year-round workers were
$54,445 and median earnings for female full-time, year-round workers were $44,516.
In 2000, 3.7% of families had incomes below the poverty level in 1999 in Charles
County. Families with a female householder, no husband present, had a substantially higher rate
of families in poverty with 13.5% of these families having incomes below the poverty level. In
2006, poverty had increased in Charles County, with 4.5% of families having income below the
poverty level in the previous 12 months; 15.9% of families with a female householder, no
husband present, had incomes below the poverty level.
4.1.3.5.7 Housing
In 2000, there were 43,903 housing units in the county, of which 94.9% were occupied.
Of the occupied units, 78.2% were owner occupied and 21.8% were renter occupied. The
vacancy rate was 5.1%. Assuming that vacation and seasonal units were vacant during the
census taking, 0.9% of all housing units are for seasonal, recreational or occasional use. In 2006,
there were 51,410 housing units, of which 94.7% were occupied. At that time 79.2% of the
occupied units were owner occupied and 20.8% were renter occupied. The vacancy rate was
5.3%. The median value of an owner occupied unit in 2000 was $153,000, which had increased
to $379,300 in 2006; the median rent in 2000 was $858, which increased to $1133 in 2006.
In 2000 the housing stock was predominantly single unit detached (71.1%) and single
unit attached (17.9%) structures. In 2006, single unit detached housing became even more
dominant in the county with 73% of the units being single unit detached structures, and next
most dominant are the single unit attached structures (12.2%). Houses in excess of 30 years old
in 2000 comprised 24.4% of the housing stock in the county.
4.1.3.6 Harford County
Harford County is the northernmost of the counties on the western shore of Chesapeake
Bay. The county does not have isolated areas in terms of islands or other areas limited by access.
It is situated to the west of the Susquehanna River at the river‘s confluence with the bay. The
county is part of the Baltimore-Towson Metropolitan Statistical Area within the Washington-
Baltimore-Northern Virginia Combined Statistical Area. The northern portion of the county is
largely agricultural in nature for its land use, as can be determined by the lack of trees, contour
plowing patterns, and lack of compact development of towns and cities in aerial photography
such as Google Earth. The southern part of the county is substantially more developed with
roads, cities, and the area of the Aberdeen Proving Ground military base. Major employers in the
county include the Aberdeen Proving Ground, the county‘s government and schools, government
contractors related to military and other governmental functions, health care, manufacturing and
distribution for snack foods, drug stores, a cosmetic store and a high end department store.62
The municipalities within the county include Aberdeen, Bel Air, and Havre de Grace.
Bel Air is the county seat. Nearby large cities include Baltimore, approximately 30 miles from
the county seat, Washington, DC, approximately 65 miles from the county seat, Philadelphia,
PA, approximately 70 miles from the county seat.
62
http://www.harfordbusiness.org/demographics.cfm#EmployerStats,

Page | 69
4.1.3.6.1 Location
Harford County is the most northerly of the western shore counties. It is situated to the
north and west of the confluence of the Susquehanna River and Chesapeake Bay. The county‘s
northern border is the state line with Pennsylvania, with Lancaster County on the PA side of the
border. To the east, across the Susquehanna River, is Cecil County. To the south and east is
Chesapeake Bay, and in addition to Cecil County across the bay is Kent County. To the west is
Baltimore County.
4.1.3.6.2 Transportation
The major highway in the county is Interstate 95, which links most of the east coast
cities. In addition, US Highways 1 and 40 roughly parallel Interstate 95, providing additional
access between Baltimore County and Cecil County. State Highways 23,146, and 138 provide
circulation within the county. Rail transportation is available in the county for both freight and
passenger service on MARC and Amtrak. There are three general aviation airports in the county,
including Fallston and Harford County airports and a seaplane base at Havre de Grace. The
nearest commercial airports are Baltimore Washington International (approximately 30 miles
away) and Philadelphia (approximately 78 miles away).
4.1.3.6.3 Demographics
The total population of Harford County numbered 218,590 in 2000. The population had
slightly more females (51%) than males (49%). The median age of the county‘s population was
36.2 years. In 2006, the population had increased to 241,402 people, with a slight increase in the
female (51.1%) to male (48.9%) population. The median age of the county‘s population in 2006
had increased to 37.2 years.
The ethnic composition of the county in 2000 for the population which self-identified as a
single race (98.5%) was primarily white people (86.8%), with 9.3% of the population black or
African American people, and 1.5% Asian people. Less than 1% of the population self-
identified as American Indian, Alaska native, native Hawaiian or other Pacific islander, or as
another race. Hispanic or Latino people comprised 1.9% of the county‘s population. In 2006,
the county had become more diverse, with the population composition of 83.2% white people,
12% black or African American people, and 1.8% Asian people. The remaining groups stayed at
less than 1% of the population for each racial category. Hispanic or Latino people comprised
2.4% of the population in 2006.
In 2000, 96.6% of the county‘s population was native born Americans. For the 3.4% of
the population that was foreign born, the most common regions of birth included Europe
(41.3%), Asia (32.7%), and Latin America (16.4%). In 2006, 94.7% of the county‘s population
was native born Americans. The sample sizes were too small for regions of birth for census
publication. In 2000, the most common ancestries reported by residents of the county included
German (26.5%), Irish, (18%), and ―other ancestries‖ (17.4%).
The average household size was 2.72 persons and the average family size was 3.14
persons in 2000. For people 15 years of age and over, 64.8% of males and 59.9% of females
were married in 2000; in 2006, 59.6% of males and 56% of females were married. In 2006, the

Page | 70
average household size was 2.64 persons and the average family size was 3.11 persons. Single
parent households with children under 18 years of age comprised 10.2% of families in 2000, and
10.3% of families in 2006. Single person households comprised 19.8% of households in 2000
and 22.9% of households in 2006. Nonfamily households comprised 4.1% of households in
2000 and 27.5% of households in 2006.
In 2000, 15.8% of the population of Harford County five years of age and over had a
disability. The group with the highest rates of reporting a disability (39.6%) was the cohort 65
years of age and over. In 2006, 12.1% of the county‘s population 5 years of age and over had a
disability, and for the age 65 and over cohort, 36% were estimated as having a disability.
4.1.3.6.4 Education
The population of Harford County is well educated, with higher rates of college degree
holders than the national rates of 24.4% in 2000 and 27% in 2006. For the population 25 years of
age, 86.7% had a high school graduate or higher level of education and 27.3% had a bachelor‘s
degree or higher level of education in 2000; in 2006, 90.5% had a high school graduate or higher
level of education, and 29.5% had a bachelor‘s degree or higher level of education. Graduate
and professional degree holders comprised 9.4% of the population 25 years of age and over in
2000, and 11.8% in 2006.
4.1.3.6.5 Employment
In 2000, there were 164,126 people in the county 16 years of age and over, of which
71.3% were in the labor force and 2.1% were unemployed. In 2006, there were 188,278 people
16 years of age and over, with 71.9% in the labor force and 2.4% were unemployed. Of females
16 years of age and over, 64.2% were in the labor force and 61.7% were employed in 2000; in
2006, 67% of females age 16 and over were in the labor force and 64% were employed.
The most frequently reported occupations for workers residing in the county included
management, professional and related occupations (38%), sales and office occupations (27.4%),
and service occupations (13%) in 2000. Farming fishing and forestry was reported by 0.1% of
county workers in 2000. The distribution of workers by class was 76.6% private wage and salary
workers, 18.8% government workers, 4.4% self-employed workers in own not incorporated
business, and 0.2% unpaid family workers in 2000. In 2006, the most frequently reported
occupations for workers in the county included management, professional and related
occupations (41.7%), sales and office occupations (26.4%), and service occupations (13%).
Farming, fishing and forestry occupations were reported by 0.1% of county workers in 2006. By
class of worker, the distribution in the county 77.6% were private wage and salary workers,
18.1% were government workers, 4% were self-employed in own not incorporated business, and
0.1% were unpaid family workers.
The industries in which workers residing in the county were most frequently employed
included educational, health and social services (19.8%), retail trade 12.6%, and professional,
scientific, management, administrative, and waste management services (9.2%) in 2000.
Agriculture, forestry, fishing and hunting and mining employed 0.5% of the county‘s workers in
2000. In 2006, the industries in which Harford County workers were most frequently employed
included educational services, and health care, and social assistance (19.6%), retail trade

Page | 71
(13.8%), and professional, scientific, and management, and administrative and waste
management services (10.8%).
According to the Bureau of Labor Statistics quarterly survey,63
no fishing establishments
were located in Harford County between 2001 and 2006. There may be fishing employment for
self-employed workers or those employed on vessels but not participating in unemployment
insurance, which would not come under this survey.
4.1.3.6.4 Income
In 1999, the median household income for the county was $57,234 and the median family
income was $63,868. In 1999, 15.7% of households and 9.9% of families had income under
$25,000. Per capita income in 2000 was $24,232. Median earnings for male full-time, year
round workers were $43,612, and median earnings for female full-time, year round workers were
$30,741 in 2000. In 2006, the median household income was $69,549 and the median family
income was $81,495 in 2006 inflation-adjusted dollars. In 2006, 11% of households and 6% of
families had income under $25,000. Per capita income was $30,946 in 2006. Median earnings
for male full-time, year round workers were $56,359 and $40,827 for female full-time, year
round workers in 2006.
In 1999, 3.6% of families had income below the poverty level and 16.8% of families with
a female householder, no husband present, had income below the poverty level. In 2005, 2.6% of
families and 13.7% of families with a female householder, no husband present, had income
below the poverty level.
4.1.3.6.5 Housing
In 2000, there were 83,146 housing units in Harford County, of which 95.8% were
occupied. For the occupied units, 78% were owner occupied and 22% were renter occupied.
The vacancy rate was 4.2%. Assuming that all vacation and seasonal housing units were vacant
during census taking, 0.4% of the county‘s housing units were for seasonal, recreational, or
occasional use. In 2006, the number of housing units in the county had increased to 90,285, of
which 95.4% were occupied. Of the occupied units in 2006, 81.9% were owner occupied and
18.1% were renter occupied, showing an increase in rates of home ownership. The vacancy rate
was 4.6% in 2006. The median value of an owner occupied unit in 2000 was $149,800, which
increased to $285,300 in 2006. The median rent for a unit in 2000 was $648, which increased to
$840 in 2006.
The housing stock in the county was predominantly single unit detached (61.6%), and
single unit attached (18.2%) in 2000. In 2006, the housing stock was similar, with 61.7% of the
stock single unit detached structures, and 17.8% single unit attached. Housing units in excess of
30 years old in 2000 comprised 32.5% of the county‘s housing stock.
63
http://data.bls.gov/PDQ/outside.jsp?survey=en,

Page | 72
4.1.3.7 St. Mary’s County
St. Mary‘s County is a peninsular area on the southern portion of the western shore of
Chesapeake Bay. The Potomac River to the southwest and the Patuxent River to the northeast
surround it. The county connects to the mainland along its northern boundary with Charles
County. The county is mainly rural in its central section with some urbanized area on the
northern border and substantial urbanization on the east central portion of the county near the
Patuxent Naval Air Station.64
Major employers in the county include the air base and related
defense contractors which employ on the order of 25,000 people,65
and the county‘s schools,
hospital, county government, a college, two grocery stores, two big box discount department
stores, an oil company, a veteran‘s home, a big box home improvement store, and school
providing training for merchant mariners.66
There is one area on the west side of the county that is somewhat isolated, but has
bridge connection to the mainland of the county, Saint George/Jimmy Island. The islands are
connected, and are inhabited. The islands project out into the area at the confluence of the
Potomac River and Chesapeake Bay, and with a single bridge may be at some risks in the
instance of storms.
There is only one municipality in St. Mary‘s County, Leonardtown, which is also the
county seat. The nearest large cities are Washington, DC, approximately 50 miles away and
Baltimore, approximately 80 miles away.
4.1.3.7.1 Location
St. Mary‘s County is the most southerly county on the western shore of Chesapeake Bay,
confluence of the Potomac River and the Patuxent Rivers with Chesapeake Bay. The county‘s
western boundary is the Potomac River, and across the river are Northumberland and
Westmoreland Counties, VA. To the east of the county is Chesapeake Bay, and across the bay
are Somerset and Dorchester Counties. To the northeast is Calvert County, across the Patuxent
River. To the north, the connection to the mainland is via Charles County.
4.1.3.7.2 Transportation
The major highways in the county include State Highways 5 and 235. State Highways 4,
244, 249, and 238 provide circulation within the county. Rail service is not available in the
county. General aviation services are available in the county, at St. Mary‘s County Regional
Airport near the center of the county. The nearest commercial airports are Dulles Airport,
approximately 80 miles away, Reagan National Airport, approximately 50 miles away, and
Baltimore Washington International Airport, approximately 80 miles away.
4.1.3.7.3 Demographics
The population of the county was 86,211 people in 2000. The population was evenly
distributed between males (50.5%) and females (49.5%). The median age of the population of
St. Mary‘s county was 34.2 years in 2000. In 2006, the total population of the county was 98,854
people. Males (49.7%) and females (50.3%) were estimated to be evenly distributed in the
64
http://www.msa.md.gov/msa/govpub/e/033000/033711/pdf/stma_ua.pdf 65
http://www.co.saint-marys.md.us/decd/documents/Document27-economicoverview3.pdf.pdf 66
http://www.co.saint-marys.md.us/decd/documents/Document27-economicoverview3.pdf.pdf

Page | 73
population. The median age of the county‘s population had increased slightly to 34.4 years in
2006.
The ethnic composition of the county in 2000 for those people who self-identified a
single race (89.3%) was 81.6% white people, 13.9% black or African American people, 1.8%
Asian people, 0.6% ―some other race,‖ 0.3% American Indian and Alaska native, 0.1% native
Hawaiian and other Pacific islander. Hispanic or Latino people comprised 2% of the county‘s
population in 2000. In 2006, the ethnic composition of the county was slightly more diverse for
those people self-identifying a single race (97.9%), with 80.9% of the population self-identifying
as white, 13.9% as black or African American, 2.1% as Asian, 0.5% some other race, 0.5%
American Indian and Alaska native, and 0% native Hawaiian and other Pacific Islander by the
survey estimates. Hispanic and Latino people had increased to 2.4% of the county‘s population
in 2006.
In 2000, 97.2% of the population in the county was native born Americans. For the 2.8%
of the population that was foreign born, the most common regions of birth included Asia
(47.9%), Europe (25.8%), and Latin America (16.9%). In 2006, 95.4% of the county‘s
population was native born Americans. The Census Bureau did not share regions of birth
because the case size was deemed too small for 2006. The most common ancestries for residents
of the county in 2000 included ―other ancestries‖ (23%), German (16.2%), and English (14.2%).
In 2000, the average household size was 2.72 persons, and the average family size was
3.17 persons. In 2006, the average household size was 2.65 persons and the average family size
was 3.06 persons. For the population 15 years of age and over, 59% of males and 56.6% of
females were married in 2000, and 54.9% of males and 55.5% females were married in 2006.
Single parent families with children under 18 years of age comprised 12.2% of families in 2000
and 14.1% of families in 2006. Single person households comprised 21.1% of households in
2000 and 21.6% of households in 2006. Nonfamily households comprised 5.4% of households
in 2000 and 21.5% of households in 2006.
In 2000, 15.3% of the county‘s population five years of age and over had a disability.
The segment of the population that has the highest reports of disability (37.5%) is the cohort 65
years of age and over. In 2006, 12.2% of the county‘s population five years of age and over had
a disability; for the age cohort 65 years and over, 40.6% had a disability.
4.1.3.7.4 Education
For the population of the county 25 years of age and over, 85.3% had a high school
graduate or higher level of education and 22.6% had a bachelor‘s degree or higher level in 2000;
86.5% had a high school graduate or higher level of education, and 24.4% had a bachelor‘s
degree or higher in 2006. Graduate or professional degrees were held by 8.2% of the population
25 years of age and older in 2000, and by 9.5% of the population in the cohort in 2006.
4.1.3.7.5 Employment
In 2000, there were 64,673 people in the county 16 years of age and over, of which
71.2% were in the labor force and 3.1% were unemployed. For females in the 16 and over age
cohort, 63.9% were in the labor force and 60.1% were employed in 2000. In 2006, it was
estimated that 77,153 people were 16 years of age and over in St Mary‘s county of which 70.3%

Page | 74
were in the labor force and 3.3% were unemployed. For females in the 16 years of age and over
cohort, 62.7% were in the labor force and 58.2% were employed.
The most common occupations for workers residing in the county included management,
professional, and related occupations (39.1%), sales and office occupations (23.5%), and
construction, extraction and maintenance occupations (14.3%) in 2000. At that time, farming,
fishing and forestry occupations comprised 0.7% of those reported for the county. By class of
worker, the composition of the county‘s residents was 64.8% private wage and salary workers,
28.8% government workers, 6% self-employed in own not incorporated business and 0.3%
unpaid family workers in 2000. In 2006, the most common occupations for county residents
included management, professional and related occupations (40.2%), sales and office
occupations (22%), and service occupations (15.9%). Farming fishing and forestry occupations
comprised 0.1% of those reported in 2006. By class of worker, the composition of county
residents in 2006 was 61.6% private wage and salary workers, 31.8% government workers, 6.4%
self-employed workers in own not incorporated business, and 0.1% unpaid family workers.
The industries in which St. Mary‘s workers were employed in 2000 most frequently
included educational, health, and social services (17.2%), public administration (16.4%), and
construction (12.7%). Agriculture, forestry, fishing and hunting, and mining employed 1.1% of
the county‘s workers in 2000. In 2006, the industries employing the highest percentages of the
county‘s workers included public administration (18.9%), professional, scientific, and
management, and administrative and waste management services (18%), and educational
services, health care, and social assistance (15.9%). Agriculture, forestry, fishing and hunting,
and mining employed 2.2% of the county‘s workers in 2006.
In St. Mary‘s County the Bureau of Labor Statistics quarterly survey67
recognized
establishments in shellfish fishing and seafood processing between 2001 and 2006. At peak there
were three shellfish fishing establishments and an undisclosed number of seafood product
preparation and packaging establishments from 2001 to 2003. The maximum number of
employees reported occurred in 2001 with five employees, declining to four in 2002 and 2003.
After 2003, data on employee numbers was no longer disclosed. The maximum annual wages
for the employees of shellfish fishing establishment was reported for 2003 at $21048, but the
maximum total wages were paid in 2001 at $79 thousand.
4.1.3.7.6 Income
In 1999 the median household income was $57,706 and the median family income was
$61,397. In 2006, the median household income had increased to $71,158 and the median
family income had increased to $78,838 in 2006 inflation-adjusted dollars. In 1999, 18.1% of
households and 12.3% of families had income under $25,000. In 2006, 14.1% of households and
9.4% of families had income under $25,000. The per capita income for the county was $22,662
in 2000 and increased to $31,194 in 2006. Median earnings for male full-time, year round
workers were $41,745, and for female full-time, year round workers median earnings were
$30,103 in 2000. In 2006, median earnings had increased to $54,157 for male full-time, year
round workers and $41,018 for female full-time, year round workers.
67
http://data.bls.gov/PDQ/outside.jsp?survey=en

Page | 75
In 1999, 5.2% of families in the county had incomes below the poverty level. Families
with a female householder, no husband present, had a reporting rate of 19.4% with income below
the poverty level. In 2005, 5.2% of families had income below the poverty level, stable from
2000; unfortunately, families with a female householder, no husband present, were in greater
difficulties than in 2000, with 23.3% estimated to have income below the poverty level.
4.1.3.7.7 Housing
In 2000 there were 34,081 housing units in the county, of which 89.9% were occupied.
For the occupied units, 71.8% were owner occupied, and 28.2% were renter occupied. The
vacancy rate was 10.1%, somewhat higher than the national rate of 9.1%. Assuming that all
vacation and seasonal units were vacant during census taking, 4.3% of units in the county were
for seasonal, recreational or occasional use. In 2006, there were 40,150 units in St. Mary‘s
County of which 90.5% were occupied. For the occupied units, 71.9% were owner occupied and
28.1% were renter occupied. The vacancy rate was 9.5%, now less than the national rate of
11.6%. The median value of owner occupied units in 2000 was $150,000 that increased to
$322,000 in 2006. The median rent for units in the county was $719 in 2000 that increased to
$896 in 2006.
Housing stock in the county was predominantly single unit detached structures (72.4%),
mobile homes (7.8%), and single unit attached structures (6.3%) in 2000. In 2006, the housing
stock was composed predominantly of single unit detached structures (74.5%), but construction
of multi-unit structures containing five to nine units increased these types of structures to a
secondary (5.8%) ranking. Mobile homes and single unit attached units followed at 5.2% each
of the housing stock in 2006. Housing units in excess of 30 years old in 2000 comprised 29.9%
of the housing stock.

Page | 76
4.2 Virginia Coastal Counties
All Virginia coastal counties are considered affected by menhaden‘s ecosystem services
since water quality is one of the potential effects. Virginia has a somewhat unique setting for
county and local government in which Independent Cities are considered county equivalents;
thus cities such as Newport News, Norfolk, Portsmouth, Virginia Beach and Williamsburg are
included in the counties listing. 68
The following county descriptions will be divided into the Eastern Shore Counties and
those on the western shore of Chesapeake Bay. The counties are described in alphabetical order
after this definition.
4.2.1 EASTERN SHORE
4.2.1.1 Accomack County
Accomack is the northerly of the two Virginia Eastern Shore Counties. It is isolated from
the rest of Virginia, except for Northampton County, by Chesapeake Bay. As part of the
Delmarva Peninsula which is known for agriculture and fishing as predominant economic
activities, Accomack follows suit, but has additional employment in tourism associated with
Assateague National Seashore and space and military activities at Wallops Island. Major
employers in the county include Eastern Shore Seafood, a clam processor, two chicken
processors, NASA Wallops Island, and the U. S. Navy AEGIS Center. 69
Tangier Island, a well-known location because of its remnant Shakespearian
pronunciations due to its isolation within Chesapeake Bay, is part of Accomack County. Its
isolation, while part of its retention of Shakespearian pronunciation has also made the
community vulnerable. A recent article tells that the ferry from the Eastern Shore may not be
available for at least part of summer 2008.70
In addition, Wikipedia 71
describes the isolation of
the island in its article, the island‘s reliance on a single doctor‘s services, and its dependency on
fishing and tourism as its economic bases. Review of ABC TV‘s ―World News‖,72
which
awarded the doctor its Person of the Week title on January 19, 2007, notes that the doctor arrives
via helicopter once per week, and travels via golf cart once on the island. The Wikipedia article
also notes that in the recent past two storms have flooded much of the island, and that homes
have been abandoned or were in the process of being raised to lessen flood damage.
4.2.1.1.1 Location
Accomack County is located on the eastern shore of Virginia between the Atlantic Ocean
and Chesapeake Bay. It is bounded on the north by the Virginia-Maryland state lines and on the
south by Northampton County. The county seat is Accomack.
68
These coastal counties include the following: Accomack, Essex, Gloucester,, Hampton, Isle of Wight,
James City, King and Queen, King George, Lancaster, Mathews, Middlesex, Newport News, Norfolk, Northampton,
Northumberland, Portsmouth, Poquoson, Prince William, Richmond, Stafford, Suffolk, Surry, Virginia Beach,
Westmoreland, Williamsburg, and York. 69
http://virginiascan.yesvirginia.org/Admin/CommunityProfiles/Profiles/JointCommunity14.pdf. 70
http://www.wvec.com/traffic/news/stories/wvec_top_030108_tangier_ferry.11d23545.html 71
http://en.wikipedia.org/wiki/Tangier_Island 72
http://abcnews.go.com/WNT/PersonOfWeek/story?id=2808883

Page | 77
The nearest sizable city is Salisbury, MD (approximately 50 mi from the center of the
county), while the nearest large cities are Washington, DC (approx. 170 mi) and Norfolk, VA
(roughly 80 mi). For the larger cities connections via bridge-tunnels are important because there
is no direct connection by land to Norfolk or a long trip around the north end of the Delmarva
Peninsula for Washington.
4.2.1.1.2 Transportation
Transportation is facilitated with the US. Highway 13. It runs north to south along the
Delmarva Peninsula. Three airport overlay districts are found in the county including a southerly
airport near Melfa and a northerly airport area at Wallops Island that is associated with the
NASA property and a small airstrip on Tangier Island. A rail line also serves Accomack County.
4.2.1.1.3 Demography
In 2000, the US Bureau of Census found that the total population of Accomack County
was 38,305. Slightly more women than men reside in the county, with 51.5% of the population
being female and 48.5% male. The median age of the county‘s population was 39.4 years.
Ethnic characteristics for the county include a majority white population for those who
self-identified as one race (63.4 %), with black or African-American people making up 31.6%;
Hispanics or Latinos of any race comprised 5.4% of the population. The remaining racial groups
comprised somewhat over 4% of the population, of which the most prevalent was ―some other
race‖ (3.6%).
Nearly 96% of the population was born native born in the US. Of the 4.2% of foreign
born, 83.4% were born in Latin America, 7.2% were born in Europe and 6.9% were born in Asia.
The most prevalent ancestries reported for the total population include other ancestries (32.1%),
United States or American (14.9%), and English (13.7%).
The average household size for the county was 2.45 people and the average family size
was 2.96 people in 2000. Somewhat over half of both the males (58.1%) and females (50.8%)
over the age of 15 are married. Single parent families with children under 18 make up 14.7% of
families in the county. Of the 15,270 households in the county, 27.7% are single person
households and non-family households comprise 1.4%.
Accomack County‘s population has a higher rate of disability than the national average,
with 21.4% reporting disabilities compared to the national average of 19.3%. Slightly over 40%
of the population over age 65 has a disability.
4.2.1.1.4 Education
Nearly 67.9% of the population over age 25 has a high school diploma or higher, and
13.5% have bachelor‘s degrees or higher levels of educational attainment. People with advanced
degrees including graduate and professional degrees comprise 5.4 % of the population over age
25.

Page | 78
4.2.1.1.5 Employment
Of the 30,048 residents of the county over the age of 16, 53.9% are in the labor force. Of
those in the labor force in 2000, 4.3% were unemployed. Over half of the women over the age of
16 of the county are participants in the labor force, and 49.5% were actively employed.
The major occupations of county residents include management, professional and related
occupations (24.2%), sales and office occupations (22.1%) and production, transportation, and
material moving occupations (20%). The least reported occupations were those in farming,
fishing and forestry occupations at 5.9%. Nearly 72% of workers were private wage and salary
workers, 18.2% were government workers, 9.6% were self-employed workers in own not
incorporated business, and 0.3 were unpaid family workers.
Of local industries, the most commonly occurring in the county were manufacturing
(17.7%), educational, health and social services (16.2%), and retail trade (11.8%). Agriculture,
forestry, fishing and hunting and mining (6.3%) were more common than those of wholesale
trade, transportation and warehousing and utilities, finance and insurance, and information.
According to the Bureau of Labor Statistics quarterly survey data,73
fishing employment
is reasonably concentrated in Accomack County with 10% of the fishing establishments of the
state in recent years, only exceeded by Northumberland County and equaled by Lancaster and
Gloucester Counties. The maximum number of establishments between 2001 and 2006 occurred
in 2001 with 15; 12 in processing, three in shellfish fishing and an undisclosed number in finfish
fishing. More recently the numbers of establishments have declined to eight processors, two
shell fishing establishments and one finfish-fishing establishment. At peak (in 2001), seafood
processing employed 285 people with total wages of nearly $5 million. In 2006, processing
employed 109 people with total wages of approximately $2.5 million. In 2001 and 2002 shell
fishing establishments employed five and four people respectively at $69 thousand and $61
thousand total wages; subsequent data was not disclosed.
4.2.1.1.6 Income
The median household income for Accomack County in 1999 was $30,250 whereas
median family income was 34,821 at that time. Nearly 41.5 % of the county‘s households had
incomes under 25,000 in 1999, while 32.8% of families in the county had incomes in the same
range. Per capita income for the county was 16,309. The median earnings for male full-
time, year-round workers were $27,078 compared to $19,590 for women full-time, year-round
workers.
Poverty status in 1999 was reported for 13% of all families in Accomack County, while
for female-headed households without a husband present, 32.6% were found to be below the
poverty level.
4.2.1.1.7 Housing
In 2000, there were 19550 total housing units in the county, dominated by single,
detached units (70.2%) and mobile homes (23.1%). Housing units in excess of 30 years old made
73
http://data.bls.gov/PDQ/outside.jsp?survey=en

Page | 79
up 48.4% of those in the county. Of the total housing, 78.3% were occupied, with 75.1% of the
occupied units being occupied by owners, and 24.9% occupied by renters. For single-family
occupied units, the median value in 2000 was $79,300. The median rent for units in Accomack
County in 2000 was $466.
4.2.1.2 Northampton County
Northampton County has the unfortunate distinction of being recognized as an area of
persistent poverty by the USDA Economic Research Service (Cook and Meisner 1994). It is the
only county with this recognition within the study area. The Economic Research Service
document suggests that persistent poverty is ―directly attributable to the composition and
characteristics of the population‖, but that the role of local economies in the persistence of
poverty is not as clear cut. It does appear that poverty counties are most likely to be counties
dependent on transfer payments and counties with higher percentages of the populations having
mental or physical disabilities, which are consistent factors for Northampton County.
Northampton County, as a distal point on the Delmarva Peninsula, has disadvantages in
accessing other areas because of geography. Although the Bridge- Tunnel exists, the fees are
sufficiently high that they inhibit development of homes for the Virginia Beach-Newport News
metropolitan area when there is still sufficient property available in those areas. Northampton
County‘s major employers include a concrete company, a tile manufacturer, a health care
provider and Chesapeake Bay Bridge Tunnel Authority.74
Islands on the east side of the county have largely been abandoned and are owned
by the Nature Conservancy or are part of wildlife refuges. The mobile nature of the barrier
islands was recognized and the homes on them abandoned.
4.2.1.2.1 Location
Northampton County is located on the southern tip of Virginia‘s Eastern Shore, which
comprises the southern section of the Delmarva Peninsula. It is bounded on the north by
Accomack County, and is otherwise surrounded by water with the Atlantic Ocean on the east and
northeast sides and Chesapeake Bay on the south and west. The county seat is Eastville.
Access to the county is available from the Norfolk/Virginia Beach area by Chesapeake
Bay Bridge-Tunnel a 20-mile long engineering feature that in some locations is only two lanes
wide. While the tunnel provides access to the larger communities it has a fee on its use of
$12.00 in one direction. Return trips within 24 hours have a lesser fee of $5.00.
4.2.1.2.2 Transportation
The major highway through Northampton County is US 13. One airport, Campbell Field,
a small grass runway general aviation airport is located in Weirwood, VA.75
Northampton
County has a rail line and a rail barge system exists for connections to the Hampton Roads area.
74
http://virginiascan.yesvirginia.org/Data_Center/Community_Profiles/EasternShore.aspx 75
http://www.campbellfieldairport.com

Page | 80
4.2.1.2.3 Demography
In 2000, the US Bureau of Census population for Northampton County was 13,093
people. Slightly more women than men lived in the county (53.2% compared to 46.8%). The
median age of the county‘s population was 42.4 years.
Ethnic characteristics for the county included a reasonably diverse racial mix in the
community with people self identifying as a single race with white comprising 53.3% of the
population, black or African American 43%, Asian 3.6%, and some other race 2.4%. Latino or
Hispanic people made up 3.5% of the county‘s population.
Native-born US citizens comprised 96.6% of the population. For the 3.4% of the
population who were reported as foreign born, nearly 70% were born in Latin America, 19.7%
were born in Europe, approximately 7% were born in North America and the remaining foreign
born residents were from Asia. The most commonly reported ancestries for the total population
of Northampton County were ―other ancestries‖ (38.3%), English (12.9%) and United States or
American (10.7%).
The average household size for the county in 2000 was 2.9 people, while the average
family size was 2.94 people. A higher proportion of the males (55.4%) in the county were
married than females (48.3%) for the population 15 years of age and over. Single parent families
with children under 18 made up 14.2% of families in the county. Of the 5,319 households in the
county 29.5% were single-person households, and 3.6% were nonfamily households.
People with disabilities were found to exist at a higher rate (25.8%) than US at large
(19.3%). Of the population over 65 years of age, 45.4 % reported having a disability.
4.2.1.2.4 Education
Of the population over 25 years of age, 67.4% had high school graduate or higher level of
educational attainment, 15.7% had levels listed as bachelor‘s degree or higher, and 5.2% had
graduate or professional degrees.
4.2.1.2.5 Employment
For the 10,412 people over the age of 16 who resided in Northampton County in 2000,
53.6% reported that they were in the labor force. Of the people over 16, 3.7% were unemployed.
Nearly half the women of the county (48.6%) were in the labor force and 44.8% were employed.
Page | 81
The most commonly reported occupations for county residents included management,
professional, and related occupations (27.1%), service occupations (20%), and sales and office
occupations (19.9 %). Farming, fishing and forestry comprised 6.6 of residents‘ reported
occupations. Of the employed population, private wage or salary workers comprised 69.5%, 20%
as government workers, 9.8% as self-employed in own not incorporated business and 0.7% as
unpaid family workers.
For industries in the county, the most commonly reported to in the 2000 census included
manufacturing (12.2%), retail trade (9.6%), and arts, entertainment, recreation, accommodation
and food services (8%). Agriculture, forestry, fishing and hunting, and mining made up 7.9%.
According to the Bureau of Labor Statistics,76
there have been establishments in finfish
fishing and seafood product preparation and packaging in Northampton County between 2001
and 2006. For the first three years data were not disclosed on the number of finfish fishing
establishments, but between 2004 and 2006 one has been reported with no data disclosed on
number of employees or wages. In 2001 there were four seafood processors in the county,
employing eight people with total wages of $168 thousand. In the subsequent year the number
of establishments declined to three at which level they have remained until 2006. The number of
employees in seafood processing increased to a maximum of 11 reported in 2002, declining to 10
in the subsequent year and reported again as 10 in 2006, with total wages in seafood product
preparation and packaging of $573 thousand.
4.2.1.2.6 Income
The median household income in 1999 for Northampton County was $28,276 and the
median family income for the same year was $35,034. Households with incomes lower than
$25,000 comprised 45.3%, and families with incomes under $25,000 comprised 34.9%. Per
capita income was $16,591. Median income for male full-time, year-round workers was $26,842
whereas the median income for female full-time, year-round workers was $21,839.
The Economic Research Service of USDA considers Northampton County as a non-
metro, non-specialized county dependent upon transfers, and a county of persistent poverty
(Cook and Meisner 1994). The U.S. Bureau of Census in 1999 reported that 15.8% of families
as in Poverty status, while it was 39.1% for families with a female householder, no husband
present.
4.2.1.2.7 Housing
Of the 6,547 housing units in the county, 81% were occupied. Of the occupied units,
68.7% were owner occupied and 31.3 were renter occupied. For the single family units that were
occupied, the median value was $78,700. The median rent for units in the county in 2000 was
$382.
The housing stock in the county consists predominantly of single unit detached houses
(78.1%) and mobile homes (13.6%). Homes in excess of 30 years old comprised 60.2% of the
county‘s housing stock and structures over 60 comprised 28.6%.
76
http://data.bls.gov/PDQ/outside.jsp?survey=en

Page | 82
4.2.2 WESTERN CHESAPEAKE BAY COUNTIES
4.2.2.1 Essex County
Essex County is the most northerly of the Middle Peninsula counties, at the mainland
edge of the peninsula. The county is rural in nature, and is outside the Richmond Metropolitan
Area, which includes adjoining Caroline and King and Queen Counties. The county has no
isolated areas in terms of islands that are inhabited.
Major employers include a concrete company, a manufacturer of automobile brakes, a
plastic molding company, the local hospital, and a big box store.77
Although predominantly
rural, Tappahannock, which is situated at the junction of Routes 17 and 360, serves as a regional
trade center with several shopping centers and restaurants.
4.2.2.1.1 Location
Essex County is in the northern area of the western shore of Virginia of Chesapeake Bay.
Its land area is bounded on the northeast by the Rappahannock River, on the south by Middlesex
County, on the southwest by King and Queen County and on the northwest by Caroline County.
The county seat is Tappahannock.
4.2.2.1.2 Transportation
The major highway in the county is US 17 that runs northwest-southeast, paralleling the
long axis of the county. US 360 runs through the county approximately perpendicular to US 17
and intersects US 17 in Tappahannock, nearly half way along the north-south axis of the county,
but to the east side of the county. There is one airport in the county, which is in transition. The
old Tappahannock airport will be converted to an industrial park and a new airport is being
constructed between Miller‘s Tavern and Bray‘s Fork, about 5 miles from the current airport.
The airport is due to open in fall of 2007. Essex County has no rail service.
4.2.2.1.3 Demography
In 2000, the population of Essex County totaled 9,989 people, of which slightly more
were female (52.6%) than male (47.4%). The median age of the county‘s population was 40.3
years.
The ethnic composition of the county consist of 98.76% of the population self-identifying
as a single race, and of those 58% were white, 39% were black or African-American, 5.5% were
some other race, and 3.6% were Asian. Hispanic or Latino people made up 1.6% of the county‘s
population.
A high percentage (98.6%) of the population of Essex County in 2000 was native born
Americans. Of those not born in the United States, 49.3% were born in Asia, 27.9% were born
in Europe, and 12.1% were born in Africa. Reported ancestries for the residents of the county
were most commonly ―other ancestries‖ (36.1%), United States or American (14.5%), and
English (13.8%).
77
http://virginiascan.yesvirginia.org/Admin/CommunityProfiles/Profiles/CityCounty51057.pdf

Page | 83
The average household size in Essex County in 2000 was 2.46 people, and the average
family size was 2.95 people. Slightly more males (59.2%) than females (52.5%) in the county
over the age of 15 were married. Single parent families with children under 18 made up 11% of
families in the county. Of the 3,981 households in the county 25.8% were single person
households and 4.6% were nonfamily households.
For people over 5 years of age, 22.4% reported having a disability. People over the age
of 65 reported the highest incidence of disability (41%).
4.2.2.1.4 Education
For the 7,052 people in the county over 25 years of age, 73.5% of the population had a
high school graduate or higher, 17.4% had Bachelor‘s degrees or higher, and 5.4% had graduate
or professional degree levels of educational attainment.
4.2.2.1.5 Employment
For the population over the age of 16, 63% were in the labor force. Of those in the
civilian labor force 3.2% were unemployed in 2000. Women over the age of 16 participated in
the labor force at a rate of 59.2%, and 2.3 % were unemployed.
The most frequently reported occupations for county residents in 2000 were management,
professional and related occupations (27.5%), sales and office occupations (25.1%) and
production, transportation and material moving occupations (19.4%). Farming, fishing and
forestry occupations were reported for 1.1% of the population. By class of worker, 72.6% were
private wage and salary workers, 19.9% were government workers, 7.3% were self-employed
workers in own not incorporated business, and 0.1% were unpaid family workers.
Industries in the county were most often reported as educational, health and social
services (19.7%), manufacturing (14.7%), retail trade (11.7%) and construction (11%).
Agriculture, forestry, fishing, hunting and mining made up 2.3%.
The Bureau of Labor Statistics78
recognizes limited employment in fisheries in Essex
County between 2001 and 2006. From 2001 to 2003 the number of seafood processors was not
disclosed, and a single processor was reported for 2004 through 2006. For the period from 2001
through 2006 data were not disclosed with regard to number of employees or wages.
Apparently, the Bureau of Labor Statistics found no finfish fishing or shellfish fishing
establishments in the county because no data were available. There may have been fishery
participants, but they may not have participated in unemployment insurance, which was the
baseline upon which the Bureau of Labor Statistics based its survey.
4.2.2.1.6 Income
Median household income for Essex County in 1999 was $37,395, while median family
income at that time was $43,588. Households with incomes under $25,000 comprised 31.9%,
and families with a similar income comprised 22.8%. Per capita income was $17,994. Median
78
http://data.bls.gov/PDQ/outside.jsp?survey=en

Page | 84
income for male full-time, year-round workers was $29,736, and for women full-time year-round
workers the median income as $22,253.
Poverty status in 1999 was reported for 7.7% of families, while for families with a female
householder, no husband present 25% were found to be in poverty.
4.2.2.1.7 Housing
In 2000 there were 4,926 housing units in the county; of these, 81.1% were occupied. For
the occupied units, 77.3% were owner occupied and 22.7% were renter occupied. The vacancy
rate for Essex County‘s housing units was 19.9%. Of these vacant units, 67.7% were units for
seasonal, recreational or occasional use. The median value for owner occupied single family
housing units in the county in 2000 was $98,700 and the median rent was $539.
The housing stock of the county consisted mainly of single-family, detached units
(76.1%) and mobile homes (15.5%). Housing units in excess of 30 years old comprised 42.4% of
the county‘s housing stock.
4.2.2.2 Gloucester County
Gloucester County is a bedroom community for the Hampton Roads area predominantly,
although it is almost split between being a bedroom community in its southern portion and being
more rural in nature in its northern areas. A long-term connection has existed between the
county and Hampton Roads, with a ferry in the past providing service for Gloucester County
residents to access jobs at the Newport News shipyard among other locations. The Virginia
Institute of Marine Science is now in the location formally occupied by the ferry terminal. In
1952, the Coleman Bridge opened connecting Yorktown and Gloucester Point, replacing the
ferry. In 1995 the bridge was reconstructed (due in part to damage to the bridge), with recent
trips across the bridge numbering approximately one million per month.79
The county is
considered part of the Virginia Beach-Norfolk-Newport News Metropolitan Area.
Major employers in the county include a peanut processor, two institutes of higher
education, an electrical utility, two health care providers (a hospital and a nursing home), a
newspaper, a telecommunications firm and a laser cartridge recycling firm.80
4.2.2.2.1 Location
Gloucester County is located on the south distal tip of the middle peninsula of Virginia.
It is bounded by the York River on the south and southwest, Chesapeake Bay on the east,
Mathews and Middlesex Counties on the northeast and north respectively and King and Queen
County on the northwest. The county seat is unincorporated Gloucester Courthouse. There are no
incorporated towns within Gloucester County. Connections to Newport News and Hampton,
roughly 15 miles away are available via the Coleman Bridge, a draw bridge which opens nearly
daily.
79
http://virginiadot.org/travel/hro-tunnel-default.asp#the_bridges 80
http://virginiascan.yesvirginia.org/Admin/CommunityProfiles/Profiles/CityCounty51073.pdf,

Page | 85
4.2.2.2.2 Transportation
The major highway in Gloucester County is U.S. Highway 17. State Highway 3 branches
off from U.S. Highway 17 in the area of Gloucester Courthouse providing linkage to Mathew
County. At the north end of the county, near Glenns, State Highway 33 links Gloucester County
to King and Queen County and further toward Interstate 64. Gloucester County does not have
rail lines or an airport within its boundaries.
4.2.2.2.3 Demography
In 2000, the U. S. Bureau of Census found that Gloucester County had a total population
of 34,780. The population was nearly evenly distributed between males (49.1%) and females
(50.9%). The median age of county residents was 38.0 years.
The ethnic composition of the county consisted of 97.6% of the population self-
identifying as a single race, of which 75.1% were white, 12.3% were black or African-American,
5.5% ―some other race,‖ and 3.6% were Asian. Hispanic or Latino people comprised 1.6% of
the county‘s population. Nearly all of Gloucester County‘s population (98.1%) is native born
American. For the limited number of people who identified themselves as foreign born, the
regions of birth most commonly stated were Europe (47.2%), Asia (34.9%), and Latin America
(14.4%). Most commonly reported ancestries included ―other ancestries‖ (19.6%), English
(17.4%), United States or American (16%) and German (13.3%).
The average household size was 2.62 people, and the average family size was 3.02
people. The county has a fairly high rate of marriage; for males 15 years of age and over 63.6%
were married and for females in the same age cohort, 61.5% were married. Single parent families
comprised 9.6% of all families in the county. Slightly over 20% of the households in the county
were single person households, and nonfamily households comprised 4.3 percent of households
in the county.
Among the population five years of age and over, 18.6% reported having a disability.
The highest rate of reported disability is among those 65 years of age and over who reported that
40.7% had a disability.
4.2.2.2.4 Education
Gloucester County‘s population has a slightly higher percentage of people with high
school or higher levels of educational attainment (81.7% for the county compared to the national
rate of 80.4%). Those with bachelor‘s degrees or higher made up 17.6% of the county‘s
population (less than the national rate of 24.4%) and 6.9% had graduate or professional degrees.
4.2.2.2.5 Employment
For those residents of the county 16 years of age and over, 66.8% were in the labor force.
Of those in the labor force, 2.6% were unemployed. Women over the age of 16 had 59.3%
participating in the labor force, and 56.5% were employed.
Occupations reported for county residents 16 years of age and over were most frequently
listed as management, professional and related occupations (31.3%), sales and office occupations

Page | 86
(23.6%), and construction, extraction, and maintenance occupations (15.9%). Farming, fishing,
and forestry occupations made up 1.5% of those reported. Private wage and salary workers
constituted 70.2% while government workers made up 22.8%, self employed workers in own not
incorporated business comprised 6.6%, and unpaid family workers made up 0.3% of workers in
the county in 2000.
For industries, the most commonly reported were educational, health and social services
(20.8%), retail trade (11.6%), and construction (11.4%). Agriculture, forestry fishing and
hunting, and mining comprised 2.3% of those reported.
Gloucester County has a reasonably high concentration of fishing establishments with
10% of the Commonwealth‘s combined finfish fishing, shellfish fishing and seafood product
preparation and packaging establishments according to the Bureau of Labor Statistics.81
Of the
11 establishments in the county in 2006, four each were reported as finfish fishing and seafood
product preparation and packaging, and three were reported as shellfish fishing. No data were
disclosed on numbers of employees or wages in finfish fishing or shellfish fishing, but for
seafood processing a maximum number of 63 were employed in 2004 and 2005 declining to 57
in 2006 with total wages of a high of $841 thousand in 2005 and $830 in 2006.
4.2.2.2.6 Income
Gloucester County resident‘s median household income for 1999 was $45,421, and for
families in the same time period, the median income was $51,426. Households with income
under $25,000 comprised 22.9% of those in the county, while families with income under
$25,000 comprised 16.5%. The county‘s per capita income was $19,990. The median income for
male full-time, year-round workers was $35,838 and the median income for female full-time,
year-round workers was $24,325.
Poverty status was reported to affect 6.8% of families in Gloucester County, and was
observed to be at a rate of 26% among families with a female householder, no husband present.
4.2.2.2.7 Housing
In 2000 there were 14,494 housing units in Gloucester County of which 90.6% were
occupied. Of the occupied housing units in the county, 81.4% were owner-occupied
(substantially higher than the national average of 66.2%), and 18.6% were renter-occupied. The
vacancy rate for Gloucester‘s housing units was 9.4%. Of the vacant units, 39.2% were reported
to be for seasonal, recreational or occasional use. The median value of occupied single family
houses in the county was $111,600, and the median rent for occupied units in the county was
$527.
The housing stock in the county is predominantly composed of single unit detached
homes (75.9%) and mobile homes (15.1%). Units in excess of 30 years old comprised 29.5% of
the county‘s housing stock.
81
http://data.bls.gov/PDQ/outside.jsp?survey=en

Page | 87
4.2.2.3 Hampton
Hampton is an independent city in the Hampton Roads area that has no isolated areas.
Independent cities in Virginia are considered to be county equivalents. The city is largely
urbanized with limited agriculture. Hampton is part of the Virginia Beach-Norfolk-Newport
News Metropolitan Statistical Area (MSA). Hampton has three loci of fish processing, one in the
downtown area with a fish house, a crab processor, a university extension office and a gear
provider, one on Sunset Creek with a fish house and scallop facility, and one in Phoebus with a
restaurant and docks for a scallop company.
Major employers include the military and military contractors, telecommunications,
telemarketing, a hospital, and two institutions of higher education. The city promotes its high
tech base and highly educated population, with its motto ―from the sea to the sky‖ alluding to the
presence of Langley field and Langley‘s NASA connections. Overall, commuters come into the
city but the number of net in-commuters is a small proportion of the over 34,000 persons who
live and work in the city.82
4.2.2.3.1 Location
Hampton is located on the peninsula between the York and James Rivers. The city is
bounded on the east by Chesapeake Bay, on the south by the junction between the James River
and Chesapeake Bay, on the west by the City of Newport News and to the north by York County.
Adjacent cities include Newport News, which shares a border with Hampton, and Norfolk, which
is accessed by the Hampton Roads Bridge -Tunnel.
4.2.2.3.2 Transportation
Hampton connects to other communities via Interstate Highways 64 and 664. In
addition, rail lines serve the city for freight and passenger service. Amtrak runs from Hampton to
Richmond and beyond with trips twice daily. The city does not have an airport within its
boundaries, but Patrick Henry Field in adjoining Newport News and Norfolk International
Airport provide air service for the area. In addition Langley Field, a military and NASA
installation have runways at the northeast edge of Hampton.
4.2.2.3.2 Demographics
The population of the City of Hampton in 2000 totaled 146,437 and was evenly
distributed between males and females (49.6% versus 50.9% respectively). According to recent
information from the 2006 American Community Survey of the U.S. Bureau of Census estimates
that the city‘s population has declined slightly to 145,017 and that there is a very slight increase
in percentage of females (50.7%) to males (49.3%). The median age for Hampton‘s population in
2000 was 34 years, and in 2006 it was 35.4 years.
The ethnic composition of Hampton in 2000 was quite evenly mixed between whites
(49.5%) and blacks or African-Americans (44.7%) for those self-identifying as a single race.
Those reporting ―some other race‖ comprised 5.5% of Hampton‘s population and Asian people
made up 3.6%. Hispanic or Latino people comprised 2.8% of the population. Similar results were
82
http://virginiascan.yesvirginia.org/Admin/CommunityProfiles/Profiles/CityCounty51650.pdf

Page | 88
found for 2006, with a decrease in people reporting some other race (1.4%), but increases in
those reporting Asian (4.4%), and Hispanic (3.4%) ethnicities. A preponderance of the
population reported being native born Americans (96.1%). Of the nearly 4% of the population
who reported being foreign born in 2000, the most common region of birth was Asia (37.3%),
Europe (27.2%), and Latin America (23.7%). The most frequently reported ancestries for
residents of the city were ―other ancestries‖ (48.9%), German (9%), English (7.8%), United
States or American (7.2%), and Irish (7.1%).
The average household size for Hampton in 2000 was 2.49 people, and the average
family size at that time was 3.02 people. Average household size increased very slightly to 2.59
persons, and average family sized to 3.2 persons in 2006. For the population 15 years of age and
over in the city in 2000, 55.7% of males and 47.3% of females were married. In 2006, this rate
had declined to 48.7% for males and 41.9% for females. In 2000, single parent households with
children under 18 years of age made up 1.8% of families in the city. At that time 26.5% of
households were single person households, and 6.3% of households were nonfamily households.
The disability status of people in the city five years of age and over was reported at
19.5% in 2000. In 2006 there was a decline to 14.3% of people 5 years of age and over reporting
having a disability. Disabilities were found to be reported at the highest rate among those in the
population age 65 and over (45.6%) in 2000.
4.2.2.3.2 Education
People in Hampton 25 years of age and over in 2000 had higher than the national rate of
high school graduation or completion of higher levels of education (85.5% for Hampton
compared to 80.4% nationally). Those with advanced educations of bachelor‘s degree or higher
(21.8%) fell below the national average (24.4%). Residents having graduate or professional
degrees comprised 8.3% of the city‘s population. In the 2006 survey, the high school graduates
or higher comprised 87.1% of the population while those with bachelor‘s degrees or higher
declined to 19.5%.
4.2.2.3.3 Employment
For the people of Hampton 16 years of age and over, 62.4% were in the labor force in
2000. At that time, 3.7% of those 16 years of age and over were unemployed. For females in
2000, over half (59.5%) were in the labor force and 53.3% were employed. In 2006, participation
in the labor force increased to 68.9%.
The most frequently listed occupations for residents of Hampton in 2000 included
management, professional and related occupations (32.1%), sales and office occupations
(27.8%), and service occupations (15.1%). Farming, fishing and forestry occupations comprised
0.3% of those reported. Private wage and salary workers comprised 73.4% of workers,
government workers comprised 22.8%, self-employed workers in own unincorporated business
constituted 3.7% and unpaid family workers comprised 0.1% of the workers by class.
Industries within the city in 2000 were most frequently reported as educational, health
and social services (20.4%), manufacturing (15.5%), and retail trade (13%). Agriculture,
forestry, fishing and hunting and mining comprised 0.3% of those reported.

Page | 89
Hampton is less concentrated in fisheries establishments than nearby Gloucester County,
which had six establishments in 2006.83
Of the six establishments, three were seafood product
preparation and packaging, two were shellfish fishing and one was finfish fishing. No data was
disclosed on numbers of employees for any of the types of establishments or wages, and no data
were available for finfish fishing from 2001 to 2005 or shellfish fishing 2001 or 2002.
4.2.2.3.4 Income
The median household income for residents of Hampton in 1999 was $39,532 whereas
for families at that time the median income was $46,110. In 2006, the median household income
had increased to $46,636 in 2006 inflation-adjusted dollars and median family income was
$57,037. Per capita income for Hampton in 1999 was $19,774. Median earnings for male full-
time, year-round workers were $31,666 in 2000, while for full-time, female, year-round workers
median earnings were $24,578.
Poverty status in 2000 was found to be the situation for 8.8% of families overall. For
families with a female householder, no husband present, poverty status was found to be the case
for 25.9%. In 2006 the rate of families found to be below the poverty level declined slightly to
7.1%.
4.2.2.3.5 Housing
In 2000, there were 57,311 housing units in the city of which 94.0% were occupied. The
proportion of owner-occupied housing units (58.6%) was somewhat less than the national
average (66.2%) and the proportion of renter occupied units was somewhat higher (41.4% versus
the national rate of 33.8%). The vacancy rate of housing units in the city in 2000 was 6%. In
2006 some construction in the city was apparent with an additional 2,276 estimated in the
community. The occupancy rate was down slightly to 91.7%, but a slightly higher proportion of
homes were owner-occupied (59.9%). For the vacant housing units in 2000, 11% were reported
to be for seasonal, recreational, or occasional use. The median value of single detached unit
occupied in 2000 was $91,100 and that value rose to $165,300 in 2006. Median rent in 2000 was
$603, which in 2006 increased to $806.
The housing stock in the city in 2000 was composed of single unit detached units as a
high proportion (64.1%), but multiple units comprised a higher proportion (26.9%) than that of
nearby rural areas. Mobile homes compose only a small proportion (1.8%) of the city‘s housing
stock. Housing units in excess of 30 years old in 2000 made up 52.6% of the city‘s housing.
4.2.2.4 Isle of Wight County
Isle of Wight County is a predominantly rural county with three areas of development,
near Smithfield, Windsor, and Lees Mill. The Lees Mill area is a small scale suburb of the small
independent City of Franklin, which adjoins the county. Despite its rural character, Isle of Wight,
by virtue of daily economic interactions, is considered part of the Virginia Beach-Norfolk-
Newport News Metropolitan Area. Isle of Wight has no islands as isolated areas.
83
Bureau of Labor Statistics; http://data.bls.gov/PDQ/outside.jsp?survey=en

Page | 90
Major employers in the county include a construction machinery company, two meat
processors (one of which also does packing), and a lumber and particleboard company. The two
meat processors have in excess of 1,500 employees each, as does the lumber and particleboard
firm that implies a reliance on manufacturing for the county of roughly 30,000 people.84
4.2.2.4.1 Location
Isle of Wight County is situated on the south side of the James River. It shares borders
with Suffolk County to the southeast, the City of Franklin to the south, and Surry County to the
northwest. Across the James River, and linked via the James River Bridge, is Newport News to
the northeast, and to the east approximately 15 miles is Norfolk and Portsmouth which are linked
by highways with bridges. The county seat is Isle of Wight.
4.2.2.4.2 Transportation
U.S Highway 17 links the north side of the county to Newport News, Suffolk and
Portsmouth. The southern section of the county is linked to Suffolk via U. S. Highway 58 and
U.S. Highway 460. A rail line serves the county, running from Petersburg to Suffolk. A small
airport is located in the adjoining city of Franklin for general aviation and additional air service
is available though Norfolk International Airport which is roughly 20 miles away.
4.2.2.4.3 Demographics
In 2000, the population of Isle of Wight County totaled 29,728 according to the U.S.
Bureau of Census. The population was evenly distributed between males (48.9%) and females
(51.1%). The median age for county residents in 2000 was 38.9 years.
Isle of Wight County‘s ethnographic make up is less diverse than neighboring cities, with
a higher predominance of people who self-identified as white (71.1%), and fewer people who
identified as black or African American (27.1%). A low percentage of people identified
themselves as Asian (0.3 %), American Indian or Alaska Native (0.3%), or some other race
(0.3%). Hispanic or Latino people comprised 0.9% of the population. Nearly all the residents of
the county (98.9%) were native born US citizens. Of the foreign born population, 39.7% listed
their region of birth as Europe, 25.7% were born in Asia, and 6.1% were born in Latin America.
The most frequently reported ancestries for county residents included ―other ancestries‖ (28.9%),
United States or American 1(3.7%), and English (13.1%).
The average household size for Isle of Wight County in 2000 was 2.61 people, and the
average family size was 2.99 people. A slightly higher than national level, 56.7% for males and
52.1% for females over the age of 15, was reported for the county at 63.6% for males and 59.5%
for females in the age cohort. Single parent families comprised 11.3% of all families in the
county. Single person households encompassed 20% of the county‘s households, and nonfamily
households comprised 2.6%.
84
http://virginiascan.yesvirginia.org/Admin/CommunityProfiles/Profiles/CityCounty51093.pdf

Page | 91
For the population of the county five years of age and over, 20% reported having a
disability. The reporting of a disability occurred at a higher rate (45.4%) among residents of the
county 65 years of age and over.
4.2.2.4.4 Education
For residents of the county 25 years of age and over, 76.2% had high school diploma or
higher levels and 17.5% had bachelor‘s degree or higher levels of attainment.
In 2000, 5.2% of Isle of Wight‘s population had graduate or professional degrees.
4.2.2.4.5 Employment
For the 14,851 county residents 16 years of age and over in 2000, 63.9% participated in
the labor force. At that time, 2.6% of the population in the appropriate age cohort was
unemployed. Females 16 years of age and over participated in the labor force at a rate of 56.5%,
and 54% were employed.
The residents of Isle of Wight most commonly reported their occupations as
management, professional and related (31.3%), sales and office occupations (12.1%), and
production, transportation, and material moving occupations (18.9%). Farming, fishing and
forestry occupations were listed by 0.9% of the county‘s population. Just over 77% of workers
were private wage and salary workers, 16.2% were government workers, 6.1% were self-
employed in own, not incorporated business, and 0.3% were unpaid family workers.
Most common industries in the county in 2000 were manufacturing (25.4%), educational,
health, and social service (16.3%), and retail trade (9.6%). Agriculture, forestry, fishing and
hunting, and mining comprised 2.8 % of the industry for the county.
The Bureau of Labor Statistics quarterly survey85
does not recognize any fishing
establishments (finfish fishing, shellfish fishing, or seafood product preparation and packaging)
in Isle of Wight between 2001 and 2006. There may have been some fishing occurring by self
employed individuals or others not participating in unemployment insurance upon which the
Bureau of Labor Statistics survey is based. 4.2.2.4.6 Income
The median household income in 1999 for the county was $45,387, and at that time
median household income was $52,597. Households earning less than $25,000 comprised 26.5%
of the county‘s households, and families with a similar income made up 18.5%. Per capita
income for Isle of Wight County was $20,235. Median earnings for male full-time, year-round
workers were $37,853 in 1999, and those of female full-time, year round workers were $22,990.
In 2000, 6.6% of families in the county were below the poverty level. Families with a
female householder, no husband present, were more likely to be below the poverty line with a
reported 25% in that situation.
85
http://data.bls.gov/PDQ/outside.jsp?survey=en

Page | 92
4.2.2.4.7 Housing
There were 12,066 housing units in the county in 2000, of which 93.8% were occupied.
Of those occupied units, 80.8% were owner-occupied and 19.2% were renter-occupied. The
median value of owner-occupied single detached housing units was $129,300. The median rent
for units in the county was $502.
The county‘s housing stock was comprised dominantly of single unit detached homes
(74.1%), and mobile homes (17.7%). Units in excess of 30 year of age composed 32.4% of units
in the county.
4.2.2.5 James City County
James City County is a mix of rural and urbanized/urbanizing areas. The areas near the
City of Williamsburg are either urbanized or urbanizing whereas portions of the county nearer
the York River are more rural in character. James City County is the home of Jamestown, which
is situated on Jamestown Island. The island is the only semi-isolated occupied land of the
county, which is connected via bridge, and is predominantly owned by State and Federal
landholders. James City County is part of the Virginia Beach-Norfolk-Newport News
Metropolitan Area.
Major employers in the county include a beer manufacturer, manufacturers of glass and
aluminum containers, a candle making company, a manufacturer of medical trays, a large
amusement park, resort management, timeshares, and warehousing and distribution for a big box
store.
4.2.2.5.1 Location
James City County is located just west of the City of Williamsburg. It is the location of
the first permanent settlement of the English in the New World, Jamestown. The county spans
the peninsula, from the James River in the south to the York River on the north. The county is
bounded on the northwest by New Kent County; on the southeast by York County,
Williamsburg, and Newport News; on the south by the James River, across which is Surry
County, and on the southwest by the Chickahominy River and Charles City County. The nearest
major cities are Newport News, which adjoins the city, Hampton, which is roughly 40 miles
from the center of the county, and Richmond, which is approximately 50 miles from the center of
the county. 4.2.2.5.2 Transportation
The major transportation route in James City County is Interstate 64, which provides
access to Richmond to the northwest and the Hampton Roads metropolitan area to the southeast.
State Highway 31 links the county via the Jamestown-Scotland Ferry to Surry County, and U. S.
60 connects the county to New Kent and Richmond, generally paralleling Interstate 64. In
addition, State Highway 199, which in some locations is a limited access highway, provides a
bypass of the City of Williamsburg. Amtrak service is available from Williamsburg or
Richmond and a rail line runs from Richmond to Hampton Roads,. General aviation is provided
by the Williamsburg-Jamestown airport, which is privately owned. Public air service is available
through the Richmond airport, which is approximately 50 miles away or the Williamsburg-
Newport New Airport approximately 25 miles from the center of the county.

Page | 93
4.2.2.5.3 Demographics
In 2000, the U.S. Bureau of Census found that the population of James City County
totaled 48,102 people. The population was fairly equally distributed between males (49.1%) and
females (51.6%). The median age of the county‘s residents was 40.8 years.
In terms of ethnic characteristics, James City County‘s diversity is lower than that of the
adjacent Hampton Roads cities, with 98.6% of the population self-identifying as a single race.
Of those reporting a single race 82% of the population self-identifying as white, 14.4% as black
or African-American, 1.5% Asian, and 1.4% ―some other race.‖ Hispanic and Latino people
comprised 1.7% of the population. A high percentage (95.9%) of the population consisted of
native-born Americans. For the slightly over 4% of the populations that was born outside of the
United States, the most frequently listed regions of birth included Europe (38.7%), Asia (29.7%)
and Latin America (17.3%). Ancestries of county residents most frequently reported included
―other ancestries‖ (24.2%), English (18.7%), German (15.7%) and Irish (13.7%).
The average household size for the county in 2000 was 2.47, persons and the average
family size was 2.86 persons. For the segment of the population 15 years and over in age, 66.3%
of males and 60.4% of women were married. Single parent families with children under 18 years
of age compose 9.5% of families in the county. Single person households comprise 21% and
nonfamily households comprise 4.8% of total county households.
People with disabilities made up 16.2% of county‘s population five years of age and over.
Although people 65 years of age and over had the highest rate of reporting disabilities (34.4%),
the rate of reporting of disabilities for this age cohort was lower than that of nearby counties.
4.2.2.5.4 Education
In general, the population of James City County is well educated. For the population 25
years of age and over in 2000, 89.3% had high school diploma or higher, and 41.5% had
bachelor‘s degree or higher levels of educational attainment. A substantial percentage (16.7%)
had graduate or professional degrees.
4.2.2.5.5 Economics
For those residents of the county 16 years of age and over in 2000, 60.5% were in the
labor force. At that time 2.1% were unemployed. Females in this age cohort participated in the
labor force at a rate of 53.9%, and 51.4% employed.
The most commonly cited occupations for county residents included management,
professional and related occupations (41.1%), sales and office occupations (25.3%) and service
occupations (15.7%). Farming, fishing and forestry occupations comprised 0.2% of those
reported. Private wage and salary workers comprised 70.7%, government workers 22.6%, self-
employed with own not incorporated business 6.4%, and unpaid family workers comprised 0.3%
of workers in the county.

Page | 94
The industries in which residents participated most commonly were educational, health
and social services (21.4%), arts, entertainment, recreation, accommodation, and food services
(15.5%), retail trade (11.3%) and manufacturing (10%). Agriculture, forestry, fishing and
hunting, and mining made up 0.4% of reported industries.
James City County had no fishing establishments (finfish fishing, shellfish fishing, or
seafood product preparation and packaging) between 2001 and 2006 according to the Bureau of
Labor Statistics quarterly survey.86
There may have been some fishing activity by those not
participating in unemployment insurance upon which the survey is based.
4.2.2.5.6 Income
In 1999, the median household income for James City County was $55,594 and the
median family income was $66,171. Households with income under $25,000 comprised 18.3%,
and households with the same income comprised 11.4%. Per capita income for the county in
1999 was $29,256. A substantial disparity between earnings of male full-time, year-round
workers ($43,339) and female full-time, year-round workers ($27,016) was reported by the U.S.
Bureau of Census.
In 1999, 4.1% of families in the county were found to be below the poverty level. For
those families with a female householder, no husband present, the rate increased to 17.7%.
4.2.2.5.7 Housing
In 2000 there were 20,772 housing units in James City County; 91.5% of those units were
occupied. Of the occupied units in the county, 77% were owner-occupied and 23% were renter-
occupied. The vacancy rate was 8.5% of which 20.8% of the vacant homes were for seasonal,
recreational or occasional use. The median value of occupied single unit homes was $167,300,
and the median rent in the county was $703.
The housing stock of James City County consists of single unit detached homes (66.9%),
single unit attached homes (12.2%), and mobile home (6.8%) for the most frequently reported
classes. Housing units in excess of 30 year old make up a small portion (15.3%) of the county‘s
housing stock.
4.2.2.6 King George County
King George County, situated on the south shore of the Potomac River, is mainly rural in
character with development focused around the Dahlgren area. The County is not part of a
metropolitan area, but adjoins counties that a part of the Richmond and the Washington-
Baltimore-Northern Virginia metropolitan areas. There are no isolated occupied islands in King
George County.
Major employers in the county include the military, a concrete company, two computer
programming companies, a nursing home, and a trucking company.87
Other than the military,
none of these companies employs in excess of 300 people.
86
http://data.bls.gov/PDQ/outside.jsp?survey=en 87
http://virginiascan.yesvirginia.org/Admin/CommunityProfiles/Profiles/CityCounty51099.pdf

Page | 95
4.2.2.6.1 Location
King George County is located on the proximal end of the Northern Neck, along the
Potomac River. The county is adjacent to Westmoreland County (to the southeast), Essex and
Caroline Counties to the south, and Stafford County to the West. Across the Potomac River
from King George County is Charles County, Maryland. The nearest city of substantial size is
Fredericksburg, approximately 12 miles west of the county line. Washington, DC is
approximately 60 miles away.
4.2.2.6.2 Transportation
The major highways in the county are U.S. 301 which connects via the Potomac River
toll bridge to Maryland to the northeast and Richmond and beyond to the west southwest and
State Highway 3 which runs from Culpeper and Fredericksburg to the tip of the Northern Neck at
Reedville and toward Mathews and Gloucester Counties on the Middle Peninsula. While the
county is not served by a rail line, rail service including Amtrak is available at Fredericksburg.
The county does not have an airport for general or public use, but Dahlgren Station, a military
installation, is shown to have air service on the Virginia Department of Transportation (VDOT)
map.88
4.2.2.6.3 Demography
In 2000, the total population of King George County was 16,803 according to the U.S.
Bureau of Census. The population was evenly split between men (50.2%) and women (49.8%).
The median age of residents of the county was 35.1 years.
The ethnic characteristics for the county‘s population was a dominantly white population
(77.7%), with 18.8% of the population self-identifying as black or African-American and 1% of
the population self-identifying as Asian for those members of the population identifying a single
race. Hispanic and Latino people comprised 1.8% of the population. Nearly all the population
(98.7%) was native-born Americans. For the limited population of foreign-born people, the most
commonly reported regions of birth included Europe (40.4%), Asia (29.8%) and Latin America
(22.2%). The most frequently reported ancestry for the residents of the county included ―other
ancestries‖ (27.1%), German (14.3%), English (13.2%), Irish (11.7%), and United States or
America (10.1%).
The average household size for the county was 2.7 people, and the average family size
was 3.12 people. For the population 15 years of age and over, 58.8% of males and 57.8% of
females were married. Single parent families with children under 18 years of age made up
10.9% of families in the county. Single person households comprised 20.4% and nonfamily
households comprised 4.8% of all households in the county.
People with disabilities comprised 18.1% of the population over the age of 5 years.
Senior citizens 65 years of age and over had the highest rate (46.8%) of reporting having a
disability.
88
http://www.virginiadot.org/travel/Resources/ct-vamap3.pdf

Page | 96
4.2.2.6.4 Education
Of the population 25 years of age and over in the county 80.4% had a high school
graduate or higher and 23.6% had a bachelor‘s degree or higher level of educational attainment,
rates roughly commensurate with the nation as a whole. Graduate and professional degrees were
held by 8.1% of the population in that age cohort.
4.2.2.6.5 Employment
In 2000, 69.1% of the county‘s population 16 years of age and over was in the labor
force, and 2.7% were unemployed. Females sixteen years of age and over participated in the
labor force at a rate of 59%, and 54.3% were employed.
The most frequently reported occupations of county residents were management,
professional, and related occupations (38%), sales and office occupations (24.3%), and
production, transportation, and material moving occupations (13.1%). Farming, fishing and
forestry occupations comprised 0.9% of those reported. By class of worker, the breakdown for
the county consisted of 63.4% private wage and salary workers, 30.7% government workers,
5.7% self-employed in own not incorporated business, and 0.2% unpaid family workers.
Industries most reported included public administration (21.3%), educational, health, and
social services (11.7%) and retail trade (11.7%). Agriculture, forestry, fishing and hunting and
mining was reported by 2% of the population.
King George County had no fishing establishments in finfish fishing, shellfish fishing or
seafood product preparation and packaging according to the Bureau of Labor Statistics89
between
2001 and 2006. There may have been some fishing activity in the county that was missed
undertaken by people who were self-employed or otherwise not participating in unemployment
insurance, which was the basis of the Bureau of Labor Statistics survey.
4.2.2.6.6 Income
The median household income in 1999 was $49,882, and the median family income at
that time was $55,160. Households with incomes under $25,000 comprised 19.2% of households
in the county and families with similar incomes comprised 14.3% of families. Per capita income
for the county in 1999 was $21,562. Male full-time, year-round workers had a median earning of
$38,600 and female full-time, year-round workers had a median earning of $26,350.
Poverty status was found for 4.4% of families in the county in 1999. A higher
percentage of families with female householder, no husband present (16.5%) were found to have
incomes below the poverty level.
4.2.2.6.7 Housing
In 2000, there were 6,820 housing units in King George County, of which 89.3% were
occupied. For the occupied units, 71.8% were owner-occupied, and 28.2% were renter-occupied.
The vacancy rate for units in the county was 9%, and of the vacant units 36.5% were for
89
http://data.bls.gov/PDQ/outside.jsp?survey=en

Page | 97
seasonal, recreational or occasional use. The median value of owner occupied single detached
units was $123,200 and the median rent was $622.
The housing stock in the county was comprised mainly of single unit detached homes
(73.9%) and mobile homes (12.7%). Roughly one third of the county‘s housing is 30 years of
age or over.
4.2.2.7 Lancaster County
Lancaster County is a mainly rural county situated at the end of the Northern Neck.
Development in the county is focused centrally around the town of Kilmarnock and in the
southern part of the county near the area of Irvington. Fleets Island (Windmill Point) is slightly
isolated, but connected by roadway and bridges to the remainder of the county. The county is not
part of a metropolitan area.
Major employers in the county include two banks, two health care providers (one hospital
and one nursing home), a resort, a newspaper publisher, and a seafood processor.90
Kilmarnock
serves as a local regional services and goods center, with shopping centers and restaurants.
Nearly half of the employment in the county in the third quarter of 2007 was within the services
sector.91
4.2.2.7.1 Location
Lancaster County is situated at the south side of the distal end of the Northern Neck. It is
bounded on the north by Northumberland County, on the east by Chesapeake Bay, on the south
by the Rappahannock River and Middlesex County, and on the west by Richmond County. The
county seat is Lancaster. The nearest sizable city is Fredericksburg which is approximately 75
miles to the northwest, and the nearest large cities are Newport News (also 75 miles) and
Washington, DC (120 miles).
4.2.2.7.2 Transportation
The major highway in the county is State Highway 3, which has four lanes for much of
its length. The Rappahannock River Bridge links the county to southern areas. There is no rail
service to the county. The nearest airport is at Tappahannock, approximately 30 miles away, and
connection to international flights is available in Washington, DC approximately 120 miles away
or Norfolk approximately 85 miles away.
4.2.2.7.3 Demographics
The population of Lancaster County in 2000 was found by the US Census Bureau to total
11,567. A slightly higher percentage of the population was female (53.5%) than male (46.5%).
The median age of the county‘s population was 49.8 years.
The ethnic composition of the county was 69.9% white, 28.9% black or African-
American, and less than 1% of other races for those self-identifying as a single race. Hispanic or
90
http://virginiascan.yesvirginia.org/Admin/CommunityProfiles/Profiles/CityCounty51103.pdf 91
p2, http://virginiascan.yesvirginia.org/Admin/CommunityProfiles/Profiles/CityCounty51103.pdf

Page | 98
Latino people made up 0.6% of the county‘s population. A high proportion (98.3%) of the
population was native-born Americans. For the small group of people born outside the United
States, 60.2% were born in Europe, 25.4% were born in Asia, and 11.4% were born in Northern
America. The most frequently reported ancestries for county residents included ―other
ancestries‖ (26.2%), English (17.9%), and United States or American (12.9%).
The average household size was 2.23 persons and the average family size was 2.71
persons. More males over the age of 15 (68.9%) were married than females of the same age
group (58.9%). Single parent families comprised 9.7 % of all families in the county. Single
person households made up 28% and nonfamily households made up 2.1% of all households.
People with disabilities comprised 21.6% of the population 5 years of age and over. The
most affected population is the age cohort 65 years of age and over for which 33.3% of the
cohort reported a disability.
4.2.2.7.4 Education
For the population 25 years of age and over, 74.4% had high school graduate or higher
levels and 24.5% had bachelor‘s degree or higher levels of educational attainment. Graduate or
professional degrees were held by 9.2% of the population 25 years of age and over.
4.2.2.7.5 Employment
For the population 16 years of age and over in 2000, 48.7% were in the labor force. For
females in the 16 years of age and over cohort, 43.4% participated in the labor force and 40.3%
were employed.
The most frequently cited occupations for the county included management, professional
and related occupations (27.6%), sales and office occupations (25.1%), and service occupations
(20.6%). Farming, fishing and forestry occupations comprised 1.9% of those in the county.
Private wage and salary workers comprised 71.9%, government workers 15.4, self-employed
workers in own not incorporated business 12.5%, and unpaid family workers 0.2% of workers in
the county.
Industries in which county residents most frequently participated included educational,
health, and social services (21.9%), retail trade (12.7%), and construction (9.7%). Agriculture,
forestry, fishing and hunting, and mining were participated in by 3% of the population.
Lancaster County has a concentration of fishing establishments with nine establishments
in 2006 and 11 in 2005 according to the Bureau of Labor Statistics.92
At the peak reported, 200.
4, there were a total of 13 fishing establishments, with four in finfish fishing, one in shellfish
fishing, and eight in seafood product preparation and packaging. In 2005, the number of seafood
processors declined to six, and in 2006 both finfish fishing declined (to three) and the sole
shellfish fishing establishment no longer appeared in the reporting. The maximum number of
employees in seafood product preparation and packaging was 136 in 2002 and 2003 and the
maximum total wages for the employees was over $1.7 million in both years. In 2006 seafood
product preparation and packaging employed 79 people with total wages of nearly $1.2 million.
92
http://data.bls.gov/PDQ/outside.jsp?survey=en

Page | 99
Finfish fishing had maximum employment of 17 people in 2006 with total wages of $429
thousand.
4.2.2.7.6 Income
The median household income in 1999 for the county was $33,239 and the median family
income at that time was $42,957. Households with incomes under $25,000 made up 36.2% of the
households in the county, and families with incomes under $25,000 comprised 26.6% of
families in the county. Per capita income for the county in 1999 was $24,663. Mean earnings for
male full-time, year round workers was $30,592, and mean earnings for female full-time, year
round workers was $23,039.
Poverty status was assessed for 9.9% of families in the county. Families with female
householders, no husband present, were three times more likely to be in poverty (31.2%).
4.2.2.7.7 Housing
In 2000 there were 6,498 housing units in the county; of these, 77% were occupied. For
the occupied units in the county, 83% were owner-occupied and 17% were renter-occupied. The
vacancy rate was 23%. Of the vacant houses, 70% were reported to be for seasonal, recreational
or occasional use. The median value of occupied single unit homes was $131,600 and median
rent in the county was $508.
Housing stock in Lancaster County is predominantly single unit detached structures
(85.8%) and mobile homes (8.9%). Structures in excess of 30 years old made up 44.5% of the
county‘s stock.
4.2.2.8 Mathews County
Mathews County is a rural county at the tip of the Middle Peninsula. In its own web
page, the county describes itself as having ―remained relatively undeveloped, retaining the slow-
paced, friendly charm of a country community.‖ In addition, ―Mathews County still does not
have any traffic signal lights. However, there are lights placed at either end of the swing span
bridge to Gwynn's Island that could be considered traffic lights by some‖.93
Gwynn‘s Island is
not isolated from the mainland – it is connected via the swing span bridge, and it is the only
inhabited island in the county. The spit from the southeast end of Gwynn‘s Island had separated
from the island between the 1982 date of the U. S. Geological Survey‘s (USGS) topographical
map and the 1992 aerial photography available at USGS as DOQ imagery.94
The county is
considered within the Virginia Beach-Norfolk-Newport News metropolitan area.
Major employers in the county include an embroidery company, a maker of ropes and
slings and similar textile materials, a seafood company, and a boat repair. None of the
establishments employ in excess of 100 people. A high proportion of commuters in the county
93
http://www.co.mathews.va.us/ 94
http://terraserver-usa.com/usgsentry.aspx?T=1&S=13&Z=18&X=242&Y=2593&W=3

Page | 100
are ―out-commuters‖ working outside the county, with 54.2% of commuters leaving the county
daily.95
4.2.2.8.1 Location
Mathews County is at the northern extremity of the Middle Peninsula. It is adjoined by
Gloucester County to the south and Middlesex County to the west. To the north is the
Rappahannock River, to the east is Chesapeake Bay and to the south is Mobjack Bay. The county
seat is unincorporated Mathews Courthouse. In general, Mathews County is rural and takes
pride in its pastoral serenity. The nearest Cities are Hampton and Newport News, which are
roughly 45 miles away.
4.2.2.8.2 Transportation
Mathews County connects to Gloucester County via State Highway 14. State Highway 3
connects Mathews and Lancaster County with access to the remainder of the Northern Neck.
Mathews County has neither airport nor rail service. The nearest airport is the Williamsburg-
Newport News Airport approximately 45 miles away.
4.2.2.8.3 Demographics
In 2000, the U.S Census Bureau found the population of Mathews County to total 9,207
people. The population was evenly split between males (48.2%) and females (51.8%). The
median age of the county‘s population was 46.2 years.
In terms of ethnic composition, the county is predominantly white (87.3%), with
11.3% of the population self-identifying as black or African-American, and very low (less than
1%) self-identifying in the other races or multiple races. Hispanic or Latino people made up
0.8% of the population. Nearly 98% of the population reported native born American status. Of
the limited population of foreign born people the most frequently reported regions of birth were
Europe (83.8%), Northern America (7.1%), and Latin America (6.6%). The most often reported
ancestries for residents of the county included United States or American (21.3%), other
ancestries (16.3%), and English (16%).
The average household size was 2.32 persons and the average family size was 2.75
persons in 2000. Married men over the age of 15 slightly outnumbered married women (66.2%
versus 61.1%) of the same age group. Single parent families with children under 18 years of age
comprised 6.5% of all families in the county. Single person households made up 24.8% of the
county‘s households, and nonfamily households comprised 3.4%.
People 5 years of age and over with disabilities comprised 18.1% of the population. The
age cohort with the highest percentage of reported disabilities was those people aged 65 and over
(42.1%).
95
http://virginiascan.yesvirginia.org/Admin/CommunityProfiles/Profiles/CityCounty51115.pdf

Page | 101
4.2.2.8.4 Education
For the population 25 years of age and over, 80.8% had high school graduate or higher
levels and 19.2% had bachelor‘s degree or higher levels of educational attainment. Graduate and
professional degrees were held by 8.2% of the county‘s population 25 years of age and over.
4.2.2.8.5 Employment
For those county residents 16 years of age and over, 56% were in the labor force, and
1.8% was unemployed. Females 16 years of age and over participated in the labor force at a rate
of 52.1%, and 50.3% were employed.
The most frequently reported occupations for county residents in the employed in the
labor force included management, professional, and related occupations (27.3%), sales and office
occupations (22.9%), and service occupations (17.1%). Farming, fishing, and forestry
occupations comprised 1.6% of those reported. Private wage and salary workers comprised
70.2%, government workers comprised 19.4%, and 10.5% were self-employed workers in own
not incorporated business. There were no unpaid family workers found in the county.
The industries in which county residents most frequently participated included
educational, health and social services (20.4% of employed workers), manufacturing (12.8%),
and retail trade (11.7%). Agriculture, forestry, fishing and hunting, and mining provide
employment for 1.9% of the workers in the county.
Mathews County has employment in fishing establishments in all three categories
recognized by the Bureau of Labor Statistics,96
finfish fishing, shellfish fishing and seafood
product preparation and packaging between 2001 and 2006. Numbers of establishments were
disclosed only for 2004-2006, and were reported as three in finfish fishing, one in shellfish
fishing, and two in seafood product preparation and packaging. No data were disclosed
regarding numbers of employees or wages for 2001 -2006.
4.2.2.8.6 Income
The median household income for Mathews County in 1999 was $43,222 and the
contemporaneous median family income was $50,653. Households with incomes under $25,000
comprised 26.8% of all households in the county, and families with similar incomes comprised
16.4% of all families. The per capita income for the county was $23,610. Median earnings for
male full-time, year round workers were $36,394 and median earnings for female full-time, year-
round workers were $23,434.
In 1999 4.3% of families were found to have incomes below the poverty level. More
severely affected were families with female householder, no husband present of whom 11.1%
were found to have income below the poverty level.
96
http://data.bls.gov/PDQ/outside.jsp?survey=en

Page | 102
4.2.2.8.7 Housing
In 2000, there were 5,333 housing units in the county of which 73.3% were occupied.
Owner-occupied units made up 84.7% of the occupied units, and renter-occupied units made up
15.3%. Over a quarter of the units of the county were vacant. Nearly three quarters of the vacant
units (72.8%) were for seasonal, recreational or occasional use. The median value of owner
occupied single detached units was $118,000 and the median rent for renter occupied units was
$506.
The county‘s housing stock consists largely of single unit, detached structures (86.6%)
and mobile homes (10%). Structures in excess of 30 year of age comprised 52% of the county‘s
housing stock.
4.2.2.9 Middlesex County
Middlesex County is a predominantly rural county with development focused mainly in
the areas of Urbanna, Saluda, Locklies, and Deltaville. There is one island in the county that is
not connected to the mainland via bridge, Parrott Island, but review of the aerial photography
from USGS shows that it appears to be uninhabited.97
Major employers in the county include two seafood companies, a wood chip and saw dust
company, a metal fabricator, a courier, a boat engine rebuilding company, and a bottled gas
company. None of the employers hire more than 100 people.98
4.2.2.9.1 Location
Middlesex County is located along the north side of the Middle Peninsula, with its long
axis paralleling the Rappahannock River. Sharing the county‘s northwest boundary is Essex
County. To the south and west are Mathews, Gloucester and King and Queen Counties from east
to west. Access to Lancaster and Richmond Counties, across the Rappahannock River is
available by bridges in Tappahannock and Mathews County. The county seat is Saluda.
4.2.2.9.2 Transportation
The major highway in the county is U.S. Highway 17, which runs generally along the
center of the county from southeast to northwest in the northern half of the county. From U.S.
Highway 17 south, the major highways are state highways 3 and 33. State Highway 3 connects
through to Lancaster County via the Rappahannock River Bridge, and State Highway 33
connects down to the southeastern tip of the county at Deltaville and Stingray Point. The USGS
map shows three airfields in Middlesex County, one in the area of Topping (Hummel Field, a
single runway airport owned by the county), one at Rosegill Farm, and one at Camp Nimcock.
From the USGS aerial photos, it appears that both the Camp Nimcock and Rosegill Farm
airstrips are grass-surfaced.99
There is no rail service in the county.
97
http://terraserver-usa.com/image.aspx?T=1&S=10&Z=18&X=1874&Y=20808&W=3 98
http://virginiascan.yesvirginia.org/Admin/CommunityProfiles/Profiles/CityCounty51119.pdf 99
http://terraserver-usa.com/image.aspx?T=1&S=14&Z=18&X=113&Y=1301&W=3

Page | 103
4.2.2.9.3 Demographics
The population of Middlesex County in 2000 totaled 9,932 people according to the U.S.
Census Bureau. The population was evenly split between males (48.1%) and females (51.9%).
The median age of county residents was 46.8 years.
The ethnic composition of the county is predominantly white (78.5%) with a small
proportion of black or African-American (20.1%) and a miniscule proportion of Asian (0.1%),
and other residents for those self-identifying a single race. Hispanic or Latino people made up a
small proportion of the population (0.6%). Native born American citizens comprised 97.9% of
the population. For the restricted number of foreign born residents of the county, the regions of
birth most commonly cited included Europe (62.5%), Asia (19.7%) and Latin America (13.5%).
The most frequently reported ancestries for county residents included other ancestries (23.2%),
English (18.8%), and United States or American (13.4%).
The average household size in 2000 in Middlesex County was 2.27 people, and the
average family size was slightly larger at 2.73 people. Of the Males in the county 15 years of age
and over 63.5% were married, whereas for females of the same age cohort, 57.1% were married.
Single parent families with children under 18 years of age comprised 9.4% of all families in the
county. One-person households made up 26% of the total households in the county, and
nonfamily households comprised 4.9%.
Disability status was assigned for people 5 years of age and over with a disability which
made up 23.1% of the population. The cohort of people reporting a disability at the highest rate
was the population 65 years of age and over (43.6%).
4.2.2.9.4 Education
The population of Middlesex County had a slightly lower level of educational attainment
than the nation at large. High school graduates or higher levels of educational attainment were
possessed by 73.7% of county residents as compared to 80.4% for the nation as a whole, and
18.9% held bachelor‘s degrees or higher levels compared to 24.4% for the nation. Graduate and
professional degrees were held by 6.3% of the county‘s residents. 4.2.2.9.5 Employment
Of the 8,216 people in the county 16 years of age and over, 54.2% were in the labor
force, and 2.1% were unemployed. Females participated in the labor force at a moderate rate
(46.8%), with 44.8% employed.
The most commonly reported occupations for county residents included management,
professional, and related occupations (30.1%), sales and office occupations (23.3%), and
construction, extraction, and maintenance occupations (15.4%). Farming, fishing and forestry
occupations comprised 2.1% of those reported. Nearly 70% of workers in the county were
private wage or salary workers, 21.6% were government workers, 11.1% were self-employed
workers in own not incorporated business, and 0.4% were unpaid family workers.

Page | 104
The county‘s residents participated most frequently in the following industries,
educational, health and social services (20.9%), construction (11.7%), and retail trade (11.5%).
Agriculture, forestry, fishing and hunting, and mining employed 2.9% of the local residents.
Middlesex County had fin fishing and seafood processing establishments between 2001
and 2006 according to the Bureau of Labor Statistics quarterly survey.100
Numbers of
establishments were not disclosed for either category in 2001 and 2002. In 2003 and 2004 there
were four seafood processors, which declined to three in 2005 and 2006. For the only year in
which data is disclosed, 2003, there were 69 employees in seafood product preparation and
packaging (seafood processing), with total wages over $1 million. In shellfish fishing, two
establishments were reported in 2004, declining to one in 2005 and 2006; no data were disclosed
on numbers of employees or wages for this sector.
4.2.2.9.6 Income
The median income for households in Middlesex County in 1999 was $36,875and the
median family income for the county at that time was $43,440. Households with income less
than $25,000 comprised 30.1% of all households in the county, while families with similar
income comprised 22.9% of families. Per capita income for the county was $22,708. Median
earnings for male full-time, year-round workers in the county were $30,842, and median
earnings for female full-time, year-round workers were substantially lower at $23,659.
Poverty status was assessed for 9.7% of families in 1999. Families with a female
householder, no husband present, were found to have incomes below the poverty level at a rate
of 29.6%.
4.2.2.9.7 Housing
In 2000, there were 6,362 housing units in the county, of which 66.9% were occupied.
For the occupied units, 83.1% were owner-occupied, and 16.9% were renter-occupied. Of the
vacant housing units, 84.5% were reported to be for seasonal, recreational or occasional use. The
median value of occupied single unit structures was $124,300, and the median rent for units in
the county was $544.
Housing stock is mainly comprised of single unit, detached structures (80.1%), and
mobile homes (15%). Structures over 30 years old made up 41.6% of those in the county.
4.2.2.10 City of Newport News
The City of Newport News is situated on the southern peninsula on the western shore of
Chesapeake Bay. The southern portion of the City is highly developed with a more open
character with single-family homes in the northern portion in general, although the western
segment of the northern area contains a military base and an industrial park. A large city park is
located in northern Newport News. Newport News‘ small boat harbor in the southeast portion of
the city is a locus of commercial fishing activity with shrimp, scallop, fish, and crab being
offloaded or processed. Substantial fish processing also occurs in the northern portion of the city
100
http://data.bls.gov/PDQ/outside.jsp?survey=en

Page | 105
in one of the industrial parks, with fish imported from Iceland. Islands in the city appear to be
associated with the military base and appear to be unpopulated. The city is part of the Virginia
Beach-Norfolk-Newport News metropolitan area.
Major employers in the city include a copier and laser printer firm, a newspaper, a
seafood processor, a rubber products manufacturer, a dairy processor, two ship building and
repairs (one of which employs in excess of 10,000 people), a paper box printing company, an
automobile component company, a distribution center for the military, two health care providers,
a plumbing services company, an industrial equipment services company, a soft drink bottler, a
catalog sales and distribution company, a research laboratory, and customer service and courier
branches for a major delivery service. Commuters in the area are highly mobile, but overall, the
net for Newport News is toward commuters who come into the city to work on a daily basis.101
4.2.2.10.1 Location
Newport News is situated on the south side of the tip of the area known as ―The
Peninsula‖ to Hampton Roads residents, which is located between the James and York Rivers.
Newport News‘s boundaries abut the City of Hampton and York County to the east, and James
City County on the north. The west side of the city is bounded by the James River, and across the
river is Isle of Wight County, and the Cities of Suffolk, Portsmouth, and Norfolk from northwest
to southeast respectively.
4.2.2.10.2 Transportation
The City of Newport News is well served for transportation. It serves as a freight hub for
one of the busiest harbors in the nation, and trailers are freighted in, and then transshipped via
trucks for delivery up and down the east coast. Multi-modal transport in the area has a long
history with the early rail service from the C&O railroad leading to a need for a shipyard to
provide vessels to send coal to more distant areas, both of which began shortly after the Civil
War under the auspices of Collis Potter Huntington.102
The major highways in Newport News
include Interstate 64 and Interstate 664, U.S. Highways 17, 258, and 60. Rail service continues
in the city, and Amtrak service is available in the city. Air service is available within the city at
the Newport News-Williamsburg International Airport, with regular commercial service.
4.2.2.10.3 Demographics
According to the U.S. Bureau of Census, the total population of the city was 180,150
people in 2000. The population was estimated to have declined to 178,281 people in a more
recent American Community Survey in 2006. Males and females were fairly evenly distributed
with 48.4 % of the population as males and 51.6% females in 2000. In 2006, the proportion had
shifted to slightly more females (52.6%) than males (47.4%). The median age of the population
in 2000 was 32 years, and in 2006 it was 33.5 years.
The city is reasonably ethnically diverse, with 53.8% of the population self-identifying as
a single race as white, 39.1% as black or African-American, and 2.3% as Asian in 2000, while in
2006 the population was estimated to be 50.6% white, 41.3% black or African-American, 2.6%
Asian for those who self-identified a single race. Hispanic and Latino people comprised 4.2% of
101
http://virginiascan.yesvirginia.org/Admin/CommunityProfiles/Profiles/CityCounty51700.pdf 102
http://www.nngov.com/library/nnhistory

Page | 106
the population in 2000, and 4.4% in 2006. Native born Americans comprised 95.2% of Newport
News‘s population in 2000, in 2006 the native born American population declined slightly to
94.2%. For the nearly 5% of the population that was foreign born in 2000, the most commonly
reported regions of birth included Asia (41.8%), Europe (30%) and Latin America (21.3%). The
most frequently listed ancestries reported in 2000 included other ancestries (46.7%), German
(9.6%), and English (8.3%).
The average household size in 2000 was 2.5 persons, and the average family size at that
time was 3.04 persons; in 2006 both the average household size and the average family size had
declined slightly (2.35 and 2.97, respectively). Married males 15 years of age and over
comprised 52.6% of all males in the city, and married females 15 years of age and over
comprised 46.7% of females in the city in 2000; in 2006, both had declined slightly to 50.2% of
males being married and 45% of females being married. Single parent families with children
comprised 20.6% of families in the city. Single person households comprised 26.9% of
households in the city and nonfamily households comprised 6% of the city‘s households.
People 5 years of age and over reporting a disability comprised 19.1% of the city‘s
population in 2000, and in 2006 those reporting disabilities declined to 15.5%. The age cohort
most frequently reporting having a disability (43.1%) was the segment of the population 65 years
of age and over; in 2006 41.0% of the same age cohort reported possessing a disability.
4.2.2.10.3 Education
In 2000, the Census Bureau found that 84.5% of Newport News‘s population 25 years of
age and over had a high school or higher level and 19.9% had a bachelor‘s degree or higher level
of educational attainment. Contemporaneously, 6.5% of the city‘s population had a graduate or
professional degree. In 2006 those with high school and higher levels of educational attainment
had increased to 87.8% of the population in the 25 years of age and over cohort and those with
bachelor‘s degree or higher level of education had increased to 23.3%. In 2000, those with
graduate and professional degrees had increased to 8.4%.
4.2.2.10.4 Employment
In 2000, 68.3% of the city‘s population 16 years of age and over participated in the labor
force and 3.45% were unemployed. Simultaneously, 61.8% of females participated in the labor
force and 56.2% were employed.
The most commonly reported occupations in the city were management, professional,
and related occupations (30.5%), sales and office occupations (17.6%), and service occupations
(17.6%). Farming, fishing, and forestry occupations comprised 0.3% of those reported. Private
wage and salary workers composed 74.7%, government workers made up 21%, self-employed
workers with own not incorporated business made up 4.2%, and unpaid family workers made up
0.2% of city workers.
The industries in which city residents participated most frequently were educational,
health, and social services (19.3%), manufacturing (15.3%), and retail trade (12.8%).
Agriculture, forestry, fishing and hunting, and mining employed 0.3% of the city‘s workers.

Page | 107
According to the Bureau of Labor Statistics quarterly survey,103
Newport News had one
finfish fishing establishment, between three and four shellfish fishing establishments and two
seafood product preparation and packaging establishments reported between 2004 and 2006.
The maximum number reported was a total of seven (one finfish fishing, four shellfish fishing,
and two seafood product preparation and packaging establishments) in 2005. The number of
employees disclosed was four in shellfish fishing in 2005 and 2006, with maximum total wages
of $289 thousand in 2006.
4.2.2.10.5 Income
The median household income for the city in 1999 was $36,597, and the median family
income at that time was $42,520. In the 2006 survey, the median household income had
increased to $44,226 and the median family income had increased to $53,631. Households with
incomes less than $25,000 comprised 32.1% of households in the city in 1999, whereas families
with a similar income at that time comprised 25.7% of families. In the 2006 survey, fewer
households (26.7%) had incomes under $25,000 (in 2006 inflation adjusted dollars) and families
with incomes under $25,000 decreased to 18.8%. The per capita income in 2000 was $17,843
and in 2006 the per capita income for the city had increased to $22,257. Median income for male
full-time year-round workers in 1999 was $31,275, and for female full-time, year-round workers
the median income was $22,310. Although both male and female full-time, year-round workers
saw an increase in median income, disparately men saw a greater increase to $42,810 whereas
women‘s median income increased to $28,978 in the 2006 survey.
Poverty status (income below the poverty level) was found for 11.3% of families
in 1999, and families with a female householder, no husband present, were found to be in
poverty at a higher rate (32.9%). According to the 2006 data, 9.2% of families had incomes
below the poverty level in the previous 12 months, and 24.1% of families with a female
householder, no husband present, were found to have been in poverty.
4.2.2.10.5 Housing
In 2000, there were 74,117 housing units in Newport News and 94% were occupied. Of
the occupied units, 52.4% were owner occupied in 2000, and 47.6% were renter occupied.
Vacant units comprised 6% of all units in the city. Of the vacant units in 2000, 6.1% of units
were for seasonal, recreational, or occasional use. In 2006, there were an additional 3,806 units,
totaling 77,923 units within the city, of which 93.3% were occupied. The proportion of owner
occupied units and renter occupied units was virtually the same as in 2000. The median value of
single unit, detached structures in 2000 was $96,400 and in 2006 the median value had increased
to $173,900. Median rent in Newport News in 2000 was $559, and in 2006 the median rent had
increased to$752.
The housing stock of the city in 2000 broke down to 50.7% of the units being single unit,
detached structure, with the largest proportion of the remaining units being multiunit structures.
Units in excess of 30 years of age comprised 43.2% of the city‘s housing stock.
103
http://data.bls.gov/PDQ/outside.jsp?survey=en

Page | 108
4.2.2.11 City of Norfolk
Norfolk is a community with long affiliation with the military. Within city limits are two
major bases, Naval Station Norfolk, the largest military base in the world, and Little Creek
Amphibious Base. The Norfolk Naval Shipyard is also within city limits. Norfolk is highly
developed with substantial housing, industry and commercial uses of land within city limits.
There are no occupied isolated islands within the City of Norfolk. The city is within the Virginia
Beach-Norfolk-Newport News metropolitan area.
Major employers within the city of Norfolk include a book publisher, a newspaper, a ship
building and repair company, a bank, two health care providers, one media and information
services company and two institutions of higher education. The population is quite mobile with
a high number of commuters into and out of the city, with a net of commuters into the city for
employment each day.104
4.2.2.11.1 Location
The City of Norfolk is located on the south side of the James River. It shares boundaries
with the cities of Suffolk to the west, Portsmouth and Chesapeake to the south, and Virginia
Beach to the east. Immediately north of the city is the waterway known as Hampton Roads, with
the confluence of the James and York Rivers and Chesapeake Bay. Across the James River from
Norfolk are the cities of Newport News and Hampton. The area is served by bridge-tunnels,
including the Hampton Roads, the Monitor-Merrimack and the Midtown Bridge Tunnels, which
were designed to permit both highway and marine transport.
4.2.2.11.2 Transportation
The City of Norfolk has substantial highway linkage to the adjoining communities and
the other major cities in the U. S. Interstate Highways serving the city include Interstates 64, 264,
and 564. Links to North Carolina are via State Highways 168 and 17, and connections east-west
to Virginia Beach and Emporia are via State Highway 58. The city has rail service, and a new
light rail line is scheduled for construction between Norfolk and Virginia Beach. The city is the
home of the Norfolk International terminal for freight service, with transshipment of a large
portion of goods distributed along the east coast. Norfolk International Airport provides
commercial air service for the surrounding regions. In addition to the commercial airport, there
are military facilities for aircraft at the Naval Station.
4.2.2.11.3 Demographics
The population of the city totaled 234,403 people in 2000 according to the U. S. Bureau
of Census. In 2006 the American Community Survey data showed the city‘s population was
estimated at 229,112, a decline of 2.26%. In both the 2000 and 2006 the U.S. Census Bureau
found that the population was generally evenly split with 51.1% males and 48.9% females. The
median age of Norfolk‘s population was 29.6 years in 2000, and 29.5 years in 2006.
The ethnic composition of Norfolk in 2000 by self-identified single race was 48.4%
white, 44.1% black or African-American, and 2.8% Asian people, and 2.5% of the population
104
http://virginiascan.yesvirginia.org/Admin/CommunityProfiles/Profiles/CityCounty51710.pdf

Page | 109
self-identified two or more races. In 2006, the city‘s racial mix was similar, with slightly higher
proportions of black or African American people (44.8%) and Asian people (3.1%). Hispanic
and Latino people made up 3.8% of the city‘s population in 2000, and rose to 4.4% of the
population in 2006. In 2000 95% of the city‘s population was comprised of native-born
Americans; for the 5% of the population that was foreign born, the most frequently reported
regions of birth included Asia (50.5%), Latin America (23.6%), and Europe (17.8%). The most
commonly reported ancestries for Norfolk‘s population in 2000 was ―other ancestries‖ (49.5%),
English (6.9%) and United States or American (5.2%).
The average household size for the city in 2000 was 2.45 persons, and the average family
size concurrently was 3.07. In 2006 the average household size was 2.36 persons, and the
average family size was 3.01 persons. In 2000, 41.7% of males 15 years of age and over were
married and 39.6% of females in the same age cohort were married, by 2006 the percentage of
married males had increased just less than 2% to 43.6% and the percentage of married females
was virtually unchanged at 39.6%. Single parent households with children present in 2000
comprised 23.2% of all families in the city. Single person households made up 30.2% of all
households in the city and nonfamily households comprised 9.17% of the city‘s households.
People with disabilities made up 23.2% of the city‘s population in 2000 5 years of age
and over, a higher proportion than the national comparison of 19.3% of the population 5 years of
age and over reporting a disability. The age cohort most likely to report having a disability was
the cohort 65 years of age and over (46.9%). In 2006 the level of people 5 years of age and over
who reported a disability declined to 15.3%.
4.2.2.11.4 Education
The residents of Norfolk in 2000 tended to be somewhat less educated than the nation. In
Norfolk 78.4% of the population 25 years of age and over had high school graduate or higher
levels of educational attainment, and 19.6% had bachelor‘s degrees or higher. The national
levels of educational attainment at that time disclosed 80.4% having high school graduate or
higher levels and 24.4% had bachelor‘s degree or higher level. In 2006 the city‘s population still
fell somewhat behind the national in terms of education with 83.2% of the city compared to
84.1% of the national population having high school or higher levels of educational attainment,
and 23.3% of the city‘s population having bachelor‘s degrees or higher while the national rate
was 27%. In 2000, 7.7% of the city‘s population 25 years of age and over had graduate or
professional degrees, and in 2006, 8.86% held graduate or professional degrees.
4.2.2.11.5 Employment
Of the population 16 year of age and over, 67.1% of the city‘s residents participated in
the labor force in 2000 and 4.7% were unemployed. The armed forces employed 14.8% of the
city‘s residents. Of females 16 years of age and over, 58.4% were in the labor force and 48.6%
were employed in 2000. In 2006, 69.1% of the total population 16 years of age and over was in
the labor force, and 4.16% were unemployed; of females in the same age cohort, 62.6% were in
the labor force and 54.9% were employed.
The most frequently reported occupations for residents of the city included management,
professional and related occupations (29.1%), sales and office occupations (27.7%), and service

Page | 110
occupations (19.1%) in 2000. Farming, fishing, and forestry occupations made up 0.2% of those
reported in the city. Private wage and salary workers composed 75.3%, government workers
comprised 20.6%, self-employed workers in own not incorporated business comprised 3.9%, and
unpaid family workers 0.2% of the city‘s workers.
Of the industries in which city workers participated, the most commonly identified
included education, health and social services (20.7%), retail trade (12.9%), and arts,
entertainment, recreation, accommodation, and food services (10.7%). Agriculture, forestry,
fishing and hunting, and mining provided employment for 0.2% of the city‘s working population.
Norfolk has somewhat limited employment in fishing according to the Bureau of Labor
Statistics,105
with two establishments in seafood product preparation and processing reported for
2004-2006, and numbers not disclosed between 2001-2003. Numbers of employees and wages
were not disclosed.
4.2.2.11.6 Income
In 1999 the median household income for Norfolk was $31,815 and the median family
income was $36,891. Per capita income in Norfolk in 2000 was $17,372. In 2006 the median
household income in Norfolk rose to $40,230 and the median family income had increased to
$44,127. Per capita income in 2006 increased to $21,886. In 1999, 38.8% of Norfolk‘s
households and 32.3% of families had income under $25,000. In the 2006 survey 29.5% of
households and 24.4% of Norfolk‘s families had equivalent income. Median earnings for male
full-time, year-round workers in the city in 1999 were $25,848 and median earnings for female
full-time year-round workers were $21,907.In 2006 median earnings had increased for both male
and female workers, but male full-time, year-round workers‘ median earnings were $35,047
while the median income for female full-time, year-round workers only increased to $28,780.
In 2000 15.5% of families in the city had incomes below the poverty level. Families with
a female householder, no husband present, were more likely to be in poverty with 37.1% of these
families having incomes below the poverty level. In 2006, 14.2% of all families in the city had
income below the poverty level in the previous 12 months, and 32.3% of families with a female
householder, no husband present, had income below the poverty level.
4.2.2.11.7 Housing
In 2000 there were 94,416 housing units in the city, of which 91.3% were occupied. Of
occupied units in 2000, 45.5% were owner occupied, and 54.5% were renter occupied. In 2006
there were 97,226 units in the city, of which 89.3% were occupied. Home ownership rates had
increased slightly with 47.6% of units being owner-occupied in 2006. Of the 8.7% of units that
were vacant in 2000, 5.8% were for seasonal, recreational or occasional use. The median value
of owner-occupied units in 2000 was $88,400 and the median rent was $538. In 2006, the
median value of owner-occupied units in Norfolk increased to $185,100 and median rent
increased to $752.
105
http://data.bls.gov/PDQ/outside.jsp?survey=en

Page | 111
In 2000 the housing stock of the city was comprised roughly of half single unit, detached
structures (47.9%) and half (51.1%) single unit attached or multi-unit structures. Structures in
excess of 30 years old comprised 68.3% of the city‘s housing stock.
4.2.2.12 Northumberland County
Northumberland County is a rural county with no incorporated towns. It is fairly remote,
being situated on the tip of the Northern Neck. Development is sparse, with villages in
Reedville, Heathsville, Burgess, Callao, Edwardsville, Lewisetta, Lottsburg , Ophelia, Walmsley
, and Wicomico Church. Of these, Heathsville is probably the largest. Fishing and agriculture
are very important to Northumberland County with all of its major employers being fish
companies, and much its land area being either forested or in agricultural use. There are no
inhabited isolated islands in the county, although the county provides ferry service to Accomack
County‘s Tangier Island and to St. Mary‘s County, MD, Smith Island. The county is not part of
any metropolitan area.
Major employers in the county include an oyster company, a seafood company that
handles mainly crab, and fish oil and fish meal processing firm. Of these the fish oil and fish-
meal processor is the largest with estimated employment of between 100 and 299 people.
Overall the county exports commuters to Richmond and Lancaster county for employment, with
nearly half (45.8%) of the county residents departing the county for employment elsewhere.
4.2.2.12.1 Location
Northumberland County is located on the north side of the tip of the Northern Neck of
Virginia, on the south side of the Potomac River. Counties with adjoining borders include
Lancaster County to the south, Richmond County to the southwest, and Westmoreland County to
the west and northwest. The state lines for Virginia and Maryland are found in the Potomac
River near the Virginia Shore, and St. Mary‘s County, MD is the adjoining Maryland
jurisdiction. The nearest city of substantial size is Fredericksburg, which is approximately 70
miles from the center of the county, and the nearest large cities are Newport News, VA, roughly
90 miles away or Washington, DC, which is approximately 110 miles distant.
4.2.2.12.2 Transportation
The major highway through the county is U. S. Highway 360 that runs roughly east-west
through the county. Connections to the south to Lancaster County are via State Highways 200
and 201. VDOT shows that there are no general aviation, commercial or military airports in the
county. An airport on the Northern Neck has been proposed, but is not constructed.106
The
nearest airport is in Tappahannock, nearly 40 miles away. There is a landing field for the spotter
airplanes supporting the menhaden fleet in Reedville, however. There are no rail lines serving the
county.
106
http://www.doav.state.va.us/Downloads/Studies/VATSP%20Update/VATSP%20Update%20Executive%
20Summary.pdf

Page | 112
4.2.2.12.3 Demographics
In 2000 the U.S. Census Bureau found that the population of the county totaled 12,259
people. There was slightly greater proportion of females (52.3%) than males (47.7%). The
median age of county residents was 50.1 years.
The ethnic composition in the county was somewhat diverse with 72.2% white, and
26.6% black or African American. Hispanic or Latino people made up 09% of the county‘s
population. A very high proportion of the population (98.4%) was native born Americans. Of
the 1.6% of the population that was foreign born, the most frequently reported areas of birth were
Europe (50%), Asia (20.1%), and Northern America (18%). The most frequently reported
ancestries for county residents included ―other ancestries‖ (27.9%), English (15.8%), and United
States or American (15.2%).
In 2000, the average household size for Northumberland County was 2.24 persons, and
the average family size was 2.7 persons. Males 15 years of age and over were more likely to be
married (70.1%) than females of the same age cohort (60.9%). Single parent families with
children under 18 years of age comprised 7% of all families in the county. Single person
households comprised 27.6% of households and nonfamily households comprised 3.4% of
households in the county.
People with a disability made up 23.7% of the population 5 years of age and over. The
age cohort reporting the highest percentage of people with a disability (39.4%) were residents 65
years of age and over.
4.2.2.12.4 Education
Of the population 25 years of age and over, 75.9% of the county‘s population had a high
school graduate or higher, and 21.7% had a bachelor‘s degree or higher level of education.
Graduate or professional degrees had been acquired by 9% of the county‘s population 25 years
of age and over.
4.2.2.12.5 Employment
In 2000, 49.8% of Northumberland County‘s population 16 years of age and over
participated in the labor force, of which 2% of that cohort was unemployed. At that time, 45.5%
of females 16 years of age and over participated in the labor force and of women in that cohort
were 44.5% employed.
The most commonly reported occupations in the county included management,
professional and related occupations (30%), sales and office occupations (23.3%) and service
occupations (16.4%). Farming, fishing, and forestry occupations were reported by 3.8% of the
county‘s workers. By class of worker, 67.3% of the county‘s workers were private wage and
salary workers, 19.3% were government workers, 12.8% were self-employed workers in own not
incorporated business, and 0.6% were unpaid family workers.

Page | 113
The industries employing workers residing in the county at the highest rates were
education, health and social services (20.8%), manufacturing (10%), and construction (9.7%). A
high proportion of county workers compared to most coastal counties (5.9%) participated in
agriculture, forestry, fishing and hunting, and mining industries.
Northumberland County has the highest concentration of fishing establishments on
Chesapeake Bay with 17 establishments according to the Bureau of Labor Statistics quarterly
survey.107
Between 2001 and 2003, data were not disclosed on the number of establishments in
any fishery sector, but from 2004 -2005 there were four (increasing to five in 2006) finfish
fishing establishments, two shellfish fishing establishments, and 10 seafood product preparation
and packaging establishments. No data were disclosed on employees or wages.
4.2.2.12.6 Income
The median household income for Northumberland County in 1999 was $38,129 and the
median family income at that time was $49,047. Households earning less than $25,000 in 1999
comprised 32.7% of households, and families with similar earnings comprised 19.2% of families.
Median earnings reported in the 2000 decennial census for male, full-time, year-round workers
were $30,151, and median earnings for female, full-time, year-round workers were $24,116.
In 1999, 8.1% of the county‘s families had incomes below the poverty level. Families
with a female householder, no husband present, were more likely (34.8%) to have incomes
below the poverty level.
4.2.2.12.7 Housing
In 2000 there were 8,057 housing units in Northumberland County, of which 67.9% were
occupied. Of the occupied units, 87.4% were owner occupied, and 12.9% were renter occupied.
Of the 32.1% of units in the county vacant in 2000, 72.5% were reported to be for seasonal,
recreational or occasional use. The median value of owner occupied units was $129,100 in 2000,
and the median rent was $478.
Housing stock in the county in 2000 was composed primarily of single unit, detached
structures (85.7%) and mobile homes (11.7%). Housing units in excess of 30 years old
comprised 45.1% of the county‘s housing stock.
4.2.2.13 City of Poquoson
The City of Poquoson is a small city in the Virginia Beach-Norfolk-Newport News
metropolitan area. It is locally known for crab fishing, and has a seafood festival each autumn.
The city in more recent times has become a bedroom community for the larger cities of Hampton
Roads, including Hampton, which it adjoins. The city shares legal services with York County,
such as police and jail. Although there are marshy islands off the east side of the city, none
appear occupied, and it appears that they are part of the Plum Tree National Wildlife Refuge.
Major employers in Poquoson include the city, a supermarket, the school system, and a
water treatment facility. Attesting to its bedroom community status nearly twice as many
107
http://data.bls.gov/PDQ/outside.jsp?survey=en

Page | 114
commuters leave the city for employment as stay within the community and come into the
community for employment; of the departing commuters, over 40% of commuters depart to
Hampton for employment and another 37% go to Newport News.108
4.2.2.13.1 Location
The City of Poquoson is situated along the south side of the York River. It shares
boundaries with York County to the northwest and Hampton to the south. The city is situated to
the north side of the tip of the Peninsula, and is surrounded to the north by the York River and to
the East by Chesapeake Bay.
4.2.2.13.2 Transportation
The City of Poquoson is slightly out of the way in Hampton Roads, and is not served by
interstate highways. Linkage to York County and Hampton is via State Highways 171 and 172.
The city has no airports, but air service is available at the nearby Newport New-Williamsburg
International Airport (approximately 5 miles away). Adjacent to the city is the NASA Langley
installation, a military airfield. The city has no rail service, but rail service is available in
Newport News, and Hampton, roughly 5 to 10 miles away, including Amtrak passenger service.
4.2.2.13.3 Demographics
The population of Poquoson totaled 11,566 people in 2000 according to the U. S. Bureau
of Census. The population was evenly split between males (50.1%) and females (49.9%). The
median age of city residents was 39.5 years.
The ethnic composition of the city for those who self-identified a single race is nearly
entirely white (96.3%), with small percentages of Asian (1.6%) and black or African-American
(0.7%), and other races. Hispanic or Latino people comprised 1.1% of the city‘s population.
Native born Americans comprised 97.1% of the city‘s population. For the 2.9% of the city‘s
foreign born residents the most commonly reported regions of birth included Asia (45.3%),
Europe (32.6%), and Latin America (15%). The most commonly reported ancestries for
residents of the city included English (24.1%), German (14.2%), and ―other ancestries‖ (13.2%).
The average household size in 2000 for the city was 2.75 persons, and the average family
size was 3.08 at that time. In 2000, 68.4% of males 15 years of age and over were married, and
67.2% of females in that age cohort were married. Single parent families with children under 18
years of age comprised 8.3% of all families in the city. Single person households comprised
15.7% of the households in the city, and nonfamily households comprised 2.9% of all city
households.
People with disabilities made up 14.6% of the population 5 years of age and over. People
age 65 and over were the most likely to report having a disability (41.5%).
108
http://virginiascan.yesvirginia.org/Admin/CommunityProfiles/Profiles/CityCounty51735.pdf

Page | 115
4.2.2.13.4 Education
The population of Poquoson 25 years of age and over has higher levels of educational
attainment than that of nearby areas and that of the nation as a whole. In 2000, 88.5% had high
school graduate or higher level of education and 31.6% had bachelor‘s degree or higher levels,
compared to the national breakdown of 80.4% having high school graduate or higher levels and
31.6% having bachelor‘s degree or higher levels. For the City of Poquoson‘s residents 25 years
of age and over, 13.9% had graduate or professional degrees.
4.2.2.13.5 Employment
In 2000, 66.8% of the population 16 years of age and over participated in the labor force,
and 2.1% was unemployed. At that time, 59 % of females in that age cohort participated in the
labor force and 57.5% were employed.
The most commonly reported occupations of city residents included management,
professional, and related occupations (44.1%), sales and office occupations (20.8%), and service
occupations (13.5%). Farming, fishing and forestry occupations comprised 1.5% of those
reported for employed city residents. For workers in the city, 67.7% were private wage and
salary workers, 25.3% government workers, 6.4% self-employed workers in own not
incorporated business, and 0.6% unpaid family workers.
The industries in which city residents most frequently were employed in 2000 included
educational, health, and social services (20.3%), public administration (12%), and manufacturing
(11.3%). Agriculture, forestry, fishing and hunting, and mining employed 1.3% of the city‘s
workers.
Between 2001 and 2006, the City of Poquoson potentially had establishments in all
aspects of fishing according to the Bureau of Labor Statistics quarterly survey.109
It is difficult to
be certain, however, because the number of seafood product preparation and packaging
establishments was not disclosed for 2001 and 2002, and no data was available for the remainder
of the period. There was one establishment each in finfish fishing and shellfish fishing reported
for 2005 and 2006, with a shellfish fishing establishment also reported for 2004. No data were
disclosed on numbers of employees or wages.
4.2.2.13.6 Income
Median household income in 1999 for the city was $60,920, and median family income at
that time was $65,460. Per capita income in 1999 was $25,336. Households with income less
than $25,000 comprised 14.2% of city households, and families with equivalent incomes
comprised 9.1% of families in the city.
The median earnings for male full-time, year-round workers were $45,284 in 1999, while
for female full-time, year-round workers were $28,310.
109
http://data.bls.gov/PDQ/outside.jsp?survey=en

Page | 116
In 1999, 3% of families in the city had income levels below the poverty level. At that
time 14.8% of families with a female householder, no husband present, had income below the
poverty level.
4.2.2.13.7 Housing
In 2000, there were 4300 housing units in the city of which 96.9% were occupied. Of the
occupied units, 84.1% were owner occupied, and 15.9% were renter occupied. The vacancy rate
was 3.1%. Of the vacant units, 17.2% were reported to be for seasonal, recreational or
occasional use. The median value of owner occupied units was $153,400, and the median rent in
the city was $697.
The city‘s housing stock was predominantly composed of single unit, detached structures
(83.2%), and mobile homes (5.4%). Housing units in excess of 30 years old comprised 36.6% of
the city‘s housing stock.
4.2.2.14 City of Portsmouth
The City of Portsmouth is one of the Hampton Roads cities within the Virginia Beach-
Norfolk-Newport News metropolitan statistical area. It is a historic port city and is home to the
Norfolk Naval Shipyard and the Portsmouth Naval Medical Center. Portsmouth, like adjoining
Norfolk, is substantially developed with a mix of residential, commercial, and industrial uses
with the highest levels of industrialization and urbanization along the Elizabeth River. No
isolated occupied islands are found in Portsmouth.
Major employers in the City of Portsmouth include a ship repair, a processed meat
producer, a sheet metal products manufacturer, a shipping terminal operator, three health care
providers, and two military/Federal government installations. Commuters in the city are a net
increase by day with the net of in-commuters coming from adjacent cities to work in
Portsmouth.110
4.2.2.14.1 Location
The City of Portsmouth is located just west of the city of Norfolk, along the James River.
It is across the James River from Newport News, and shares boundaries with the Cities of
Suffolk, Chesapeake, and Norfolk from west to east.
4.2.2.14.2 Transportation
Interstate Highways 64 and 264, and State Highway 164 link the City of Portsmouth to
other communities in the area, which is also a limited access highway. The Midtown Tunnel on
U. S. Highway 58 provides access across the Elizabeth River to Norfolk. Two rail lines serve the
city. While there is no air service within the city, Norfolk International Airport, approximately
12 miles distant, provides commercial service. 4.2.2.14.3 Demography
The population of the City of Portsmouth in 2000 totaled 100,565 people according to the
U.S. Bureau of Census. In 2006, the population had increased to 101,377 people according to the
110
http://virginiascan.yesvirginia.org/Admin/CommunityProfiles/Profiles/CityCounty51740.pdf

Page | 117
estimates of the American Community Survey. In 2000 the proportion of males to females was
48.3% to 51.7%, but in 2006 the balance had shifted slightly to 49% males and 51% females.
The median age of residents in the city in 2000 was 34.5 years, and in 2006 had increased to 35
years.
The ethnic composition of the city in 2000 for those reporting a single race was 45.8%
white, 50.6% black or African-American, and less than 1% each American Indian and Alaska
native, Asian, native Hawaiian or other Pacific Islander, or some other race. In 2006 of the
population that self-identified a single race the composition was 42.9% white, 51.9% black or
African American, 1.5% some other race, and 1.4% Asian with the remaining racial groups
comprising less than 1% each. In 2000, 1.7% of the city‘s population was Hispanic or Latino,
and in 2006 that segment of the population had increased to 2.3%. Native born Americans
comprised 98.4% of the city‘s population in 2000. For the limited foreign born population, the
most commonly reported regions of birth included Asia (35.9%), Latin America (29.2%), and
Europe (26.1%). The most frequently reported ancestries in the city in 2000 included ―other
ancestries‖ (49%), English (8%), and United States or American (7.1%).
The average household size in 2000 for Portsmouth was 2.51 persons and the average
family size at that time was 3.05 persons. In 2006, the average household size was estimated to
be 2.45 persons and the average family size was estimated to be 3.02 persons. Married males 15
years of age and over comprised 48% of the male population in 2000 while synchronously 42.2%
of females in that age cohort were married. In 2006 the percentage of males 15 years of age and
over who were married decreased to 44.4% of all males in that cohort in the city while the
marriage rate for females 15 years of age and over had increased to 42.5%. Single parent families
with children under 18 years of age in the city comprised 21.2% of families in the city. Single
person households comprised 27.5% of all households in the city and nonfamily households
comprised 5.8% of households within the city.
People with disabilities made up a higher proportion (25.3%) of the city‘s population 5
years of age and over than that of the nation (19.3%) in 2000. The age cohort most frequently
reporting having a disability in 2000 (51.1%) was the segment of the population 65 years of age
and over. In 2006, people with disabilities made up 18.5% of the population 5 years of age and
over compared to 15.1% for the nation.
4.2.2.14.4 Education
Of the population of the city 25 years of age and over, 75.2% had high school graduate or
higher levels and 13.8% had bachelor‘s degree or higher level of educational attainment. These
rates were lower than those of the nation (80.4% having high school graduate or higher levels,
and 24.4% having bachelor‘s degree or higher levels of education) in 2000. Graduate or
professional degrees were held by 4.7% of the city‘s population. In 2006, 77.9% of the city‘s
population 25 years of age and over had a high school graduate or higher level of education and
19.6% had a bachelor‘s degree or higher level of education. The nation as a whole had risen to
84.1% of the age cohort possessing high school graduate or level and 27.0% having bachelor‘s
degree or higher levels of education.

Page | 118
4.2.2.14.5 Employment
In 2000, 62.1% of the city‘s population 16years of age and over participated in the labor
force and 4.3% were unemployed. For females in the same age cohort in 2000, 56.2%
participated in the labor force and 50.3% were employed. In 2006, 65.3% of the city‘s population
16 years of age and over participated in the labor force, and 55.3% were employed. In 2006,
57.6% of females 16 years of age and over were in the labor force and 53.1% were employed.
The major occupations which were reported by workers in the city in 2000 included sales
and office occupations (27.8%), management, professional and related occupations (27.7%), and
service occupations (16.7%). Farming, fishing and forestry occupations were reported by 0.2%
of workers residing in the city. Private wage and salary workers comprised 69.3% of workers in
the city; government workers comprised 26.4%, self-employed workers in own not incorporated
business 4.2%, and unpaid family workers 0.1% of all workers in the city in 2000.
In 2000, the most frequently reported industries, which employed workers residing in the
city, included educational, health, and social services (20.7%), retail trade (11.9%), construction
(8.1%). Agriculture, forestry, fishing, hunting, and mining provide employment for 0.4% of the
city‘s workers.
According to the Bureau of Labor of Statistics quarterly survey,111
fishing employment is
not a major source of employment in the City of Portsmouth. In 2001 and 2002 there were
possibly establishments in finfish fishing, but numbers of establishments were not disclosed and
no data was available for any years on shellfish fishing or seafood product preparation and
packaging. Individuals may have worked in fishing activities in the city but may have been self
employed or otherwise not have paid into unemployment insurance upon which the survey was
based.
4.2.2.14.6 Income
Median household income in 1999 was $33,742, and median family income for
Portsmouth was $39,577. Per capita income in 1999 was $16,507. In 2006, median household
income for the city rose to $41,670 and median family income increased to $48,890. Per capita
income for the city rose to $20,506. In 1999, households with income under $25000 comprised
35.8% of households in the city and families with equivalent incomes comprised 28.6% of
families in the city at that time. In 2006, 27.5% of households in the city had incomes less than
$25,000 in the previous 12 months and 19.7% of families in the city had incomes less than
$25,000. Median earnings for male full-time, year-round workers were $30,122 and median
earnings for female full-time, year-round workers were $23,375 in 2000. In 2006, median
earnings for male full-time, year-round workers increased to $33,421 and median earnings for
female full-time, year-round workers increased to $30,531.
In 1999, 13.3% of families in the city had income below the poverty level, and 31.2% of
families with a female householder, no husband present, had income below the poverty level. In
2006, 10 % of all families in the city had income below the poverty level, and 28.9% of families
with female householder, no husband present, had income below the poverty level.
111
http://data.bls.gov/PDQ/outside.jsp?survey=en

Page | 119
4.2.2.14.7 Housing
In 2000, there were 41,605 housing units in the City of Portsmouth; 91.7% of the housing
units were occupied. In 2000, 58.6% of units were owner occupied, and 41.4% were renter
occupied. The vacancy rate was 8.3%. Of the vacant units, 4.5% were for seasonal recreational
or occasional use. In 2006, 42,668 units were estimated to be present in city, with 91.3%
estimated to be occupied but the American Community Survey. Owner and renter occupancy
proportions were virtually unchanged between 2000 and 2006. In 2000 the median value of
occupied single, detached units was $81,300 and median rent was $540. In 2006, the median
value of occupied single, detached units was $158,000 and the median rent was $776.
In 2006, the city‘s housing stock was comprised of approximately two thirds (62.7%)
single unit, detached structures, and the remaining one third (36.8%) single unit attached or
multi-unit structures. Structures in excess of 30 years old composed 65.9% of units in the city‘s
housing stock.
4.2.2.15 Prince William County
Prince William County is within the Washington-Baltimore metropolitan area. Within
the county are five incorporated areas, Dumfries, Haymarket, Manassas, Occoquan, and
Quantico. The county is promoting itself for biotechnology, information technology, and other
technological services for the military and government contracting in addition to private
industry.112
Overall, though, Prince William County‘s communities are suburbs of the
Washington metropolitan area with commuting into businesses nearer and within the central
city.113
There are no inhabited isolated islands in Prince William County.
Major employers in the county include a maker of rocket motors, a construction material
company, an aerospace electronics systems company, a custom deck and sunroom company, a
semiconductor company, two food distribution companies, an air transport company, two
telecommunications companies, a defense contractor, a private school, an institution of higher
education, two health care companies, an electric utility and a land development firm.114
4.2.2.15.1 Location
Prince William County is located in northern Virginia on the west side of the Potomac
River. The county shares boundaries with Fairfax County on the north east, Loudon County on
the north, Fauquier County on the northwest and west, and Stafford County on the south. Across
the Potomac River is Charles County, MD.
112
http://www.pwcecondev.org/default.asp?section=15&subsection=108&sidebar=off 113
p 3, http://virginiascan.yesvirginia.org/Admin/CommunityProfiles/Profiles/JointCommunity10.pdf 114
pp 4 & 5, http://virginiascan.yesvirginia.org/Admin/CommunityProfiles/Profiles/JointCommunity10.pdf

Page | 120
4.2.2.15.2 Transportation
The county is served by two Interstate Highways, Interstate 95 on the east side of the
county and Interstate 66 on the west side of the county. Between the two interstates are several
major state highways, including State Highway 234, the Prince William Parkway, and other
primary roads. The county does not have an airport, but the adjoining Quantico Marine
Reservation is listed as having a military airfield, the county participates in the Stafford Regional
Airport Authority, which owns and operates the airport in adjoining Stafford County115
and,
finally Dulles International Airport with commercial service is in adjoining Loudon County and
Fairfax County. Two rail lines serve the county, including passenger service.
4.2.2.15.3 Demographics
In 2000, the county‘s population totaled 280,813 according to the U.S. Bureau of Census.
The county was evenly distributed between males (49.9%) and females (50.1%).
In 2006, the county‘s population was estimated to be 357,503, and the distribution of
males and females approximately the same, with 50.1% males and 49.9% females. The high
growth rate of the population has precedent in the last 50 years, with the population more than
doubling between 1950 and 1960 and again between 1960 and 1970.116
The more typical rates
for1980 to the present are annualized at roughly 3 to 3.5%, which the past 6 years outstrips at
4.5%. The median age of residents of the county in 2000 was 31.9 years and in 2006 was 32.8
years.
The ethnic composition of the county in 2000 for residents reporting a single race was
predominantly a white population (68.9%) with 18.8% of the population being black or African-
American, 4.3% ―some other race,‖ and 3.8% Asian. In 2006, the population had become more
diverse, with a decrease in the white population to 59.7%, and an increase in ―some other race‖
to 10.9% and Asian people to 7.5%. Hispanic or Latino people comprised 9.7% of the
population in 2000, and had increased to 19.1% of the population in 2006. In 2000, 88.5% of the
county‘s population was native born Americans, but in 2006, 78.1% reported being native born.
For the foreign born the most commonly reported regions of birth in 2000 included Latin
America (46.6%), Asia (28.7%) and Europe (13.8%), while in 2006 the most commonly reported
regions of birth included Latin America (53.9%), Asia (30.1%), and Africa (9.7%). The most
frequently reported ancestries in 2000 included ―other ancestries‖ (37%), German (15.1%), and
Irish (12.8%).
The average household size in 2000 for the county was 2.94 persons, and the average
family size was 3.32 persons; these values were virtually the same (2.92 persons per household
and 3.29 persons per family) in 2006. Of the population 15 years of age an over 61.1% of males
and 59.7% of females in the county were married in 2000. In 2006, 57.6% of males 15 years of
age and over were married, and 56.5% of females in the same age cohort were married. Single
parent families with children under 18 years of age comprised 12.4% of families in the county in
2000. In 2006, single parent families with children under 18 years of age had increased to 15.5%
of the population. Single person households comprised 17% of households, and nonfamily
households comprised 5.4% of all households in the county in 2000. In 2006, single person
115
http://www.staffordairport.com/info.htm 116
http://www.pwcgov.org-001823.pdf

Page | 121
households had increased slightly to 17.7% of households and nonfamily households had
increased to 23.3% of households in the county.
People with disabilities comprised 12.7% of the county‘s population 5 years of age and
over in 2000. For those people with disabilities, the highest rate of reporting having a disability
occurred for the people 65 years of age and over (38.8%) in 2000. In 2006, 8% of the county‘s
population reported having a disability, and 31.5% people 65 years of age and over reported
having a disability.
4.2.2.15.4 Education
The population of the county 25 years of age and over is well educated, with above the
national rates of high school graduates and bachelor‘s degree and higher level of education
holders. In 2000, 88.8% of the county‘s population 25 years of age and over had high school
graduate or higher level and 31.5% had bachelor‘s degree of higher levels of education compared
to the national rates of 80.4% having high school graduate or higher levels and 24.4% having
bachelor‘s degree or higher level. In 2000, 11.2% of the population 25 years of age and over had
graduate or professional degrees. In 2006, the educational levels of the county‘s population
remained high, but showed some decline for high school graduates with 87.6% of the population
25 years of age and over having high school graduate or higher levels and 36.7% having
bachelor‘s degrees or higher. In 2006, 14% of the population in this age cohort had graduate or
professional degrees.
4.2.2.15.5 Employment
In 2000, 77.1% of the county‘s population 16 years of age and over participated in the
labor force and 2.2% of that age cohort were unemployed. At that time, 69.9% of the county‘s
female population participated in the labor force, and 66.6% were employed. In 2006, 76.6% of
the county‘s population 16 years of age and over participated in the labor force, and 2.8% of the
age cohort were unemployed. In 2006, 67.4% of the female population 16 years of age and over
participated in the labor force, and 63.9 % were employed.
For those employed residing in the county, the most commonly reported occupations in
2000 included management, professional, and related occupations (41.1%), sales and office
occupations (27.8%), and service occupations (13.5%). Farming, fishing and forestry
occupations were reported by 0.1% of the county‘s workers. Private wage and salary workers
comprised 71.6% of the county‘s workers, government workers comprised 23.9%, self-employed
workers in own not incorporated business made up 4.3%, and unpaid family workers 0.2%. In
2006, the same three occupational categories were most commonly reported. Farming, fishing,
and forestry occupations in 2006 comprised 0.2% of the occupations reported.
The county‘s resident worker were most frequently employed in the following industries
in 2000, educational, health and social services (15.5%), professional, scientific, management,
administrative and waste management services (15.3%), and public administration (13.2%).
Agriculture, forestry, fishing, hunting, and mining provide employment for 0.3% of the county‘s
resident workers in 2000. In 2006, the most commonly reported industries included professional,
scientific, and management and administrative and waste management services (20%),
educational services, health care, and social services (16.4%), and public administration (11.5%).

Page | 122
In 2006, agriculture, forestry, fishing and hunting, and mining industries employed 0.2% of the
county‘s resident workers.
Prince William County, according to the Bureau of Labor Statistics,117
has no
establishments or employment in fisheries in finfish fishing, shellfish fishing, or seafood product
preparation and packaging. There may have been individuals who worked in fishing who were
self employed or who otherwise were not participating in unemployment insurance upon which
the survey was based.
4.2.2.15.6 Income
In 1999, the median household income for Prince William County was $65,960, and at
that time the median family income was $71,622. Households with incomes under $25,000
comprised 10% of the county‘s households, and families with equivalent incomes comprised
7.9% of the county‘s families in 1999. Per capita income for the county in 1999 was $25641. In
2005, the median household income for the county was $80,783 and the median family income
was $86,995. Households with income under $25,000 in 2006 inflation adjusted dollars
comprised 6.7% of the county‘s households, and families with equivalent incomes comprised
5.8% of the county‘s families. Per capita income in 2005 was $33,319. Median earnings for
male full-time, year-round workers in 2000 were $45,595 and median earnings for female full-
time, year-round workers were $34,286. In 2006, median earnings for male full-time, year-round
workers had increased to $55,921 and median earnings for female full-time, year-round workers
had increased to $43,534.
In 2000, 3.3% of the county‘s families had incomes below the poverty level, and in 2006,
3.7% of all families in the county had income below the poverty level in the previous 12 months.
In 2000, 12.3% of families with a female householder, no husband present, had incomes below
the poverty level, while in 2006, 14% of families with a female householder, no husband present
were found to be in poverty in the previous year.
4.2.2.15.7 Housing
In 2000, there were 98,052 housing units in the county, of which 96.4% were occupied.
For those occupied units, 71.7% were owner occupied and 28.3% were renter occupied. The
vacancy rate was 3.6%. Of the vacant units in 2000, 6.4% were reported to be for seasonal,
recreational or occasional use. At that time the median value of owner occupied units was
$149,600 and the median rent was $862. In 2006, the number of housing units in the county had
increased to 130,862, of which 93.5% were occupied. At that time, 73.8% of units were owner
occupied and 26.2% were renter occupied. The median value for owner occupied units had
roughly tripled to $441,400 and the median rent had increased to $935.
The majority of the housing stock in the county in 2000 was single unit structures, with
single unit, detached structures comprising 53.9% and single unit, attached structures comprising
26.8% of the stock. In 2006, a similar composition was reported with 57% of the structures
identified as single unit detached and 23.6% identified as single unit attached structures. Housing
units in excess of 30 years old in the county comprised 20.6% of the stock.
117
http://data.bls.gov/PDQ/outside.jsp?survey=en

Page | 123
4.2.2.16 Richmond County
Richmond County is a rural county located on the Northern Neck of Virginia. County
lands are mainly agricultural or forested, with sparse development. The major town is the county
seat of Warsaw, which is the most highly developed area of the county. The county is not part of
any metropolitan area. No occupied isolated islands are found in the county.
Richmond County‘s major employers include two lumber companies, an electric
cooperative, a telecommunications company and a health care center. The county holds annual
festivals celebrating local arts and crafts and the county‘s agricultural heritage
Despite the rural nature of the county, and the reasonably small size of the major
employers, none of which employ in excess of 300 people, there is a net inflow of commuters.118
4.2.2.16.1 Location
Richmond County is located on the south side of the Northern Neck adjacent to the more
mainland portion of the state. The county is situated on the north side of the Rappahannock
River. The county shares boundaries wit Essex County on the southwest, Westmoreland County
on the north and west, Northumberland County on the northeast, and Lancaster County on the
southeast. The nearest city of substantial size is Fredericksburg, approximately 55 miles
northwest, and the nearest large city is Richmond, approximately 55 miles southwest.
4.2.2.16.2 Transportation
The major highways in the county are State Highways 3 and 360 that serve the Northern
Neck and connect to State Highway 17 in adjoining Essex County. There is no airport in the
county, but an airport is situated in adjacent Essex County, just outside Tappahannock.
Commercial airline service may be obtained in via the Richmond Airport in the City of
Richmond, approximately 50 miles away or in Washington, DC approximately 100 miles north.
No rail line is found in the county, but a rail line is available in Caroline County, approximately
35 miles west.
4.2.2.16.3 Demography
The population of Richmond County totaled 8,809 people in 2000. There were slightly
more males (56.1%) than females (43.9%) in the county at that time. The median age of the
population was 40.3 years.
The ethnic composition of the county is, by race, approximately two thirds white and one
third black or African American. Although there are a few people of other races, none of the
groups exceeds 1% of the population. Hispanic or Latino people comprised 2.1% of the
population. In 2000, 98.1% of the population of the county was native born Americans. For the
1.9% of the population that was foreign born, the most commonly reported regions of birth
included Latin America (53.3%), Europe (26.7%), and Asia (15.2%). The most frequently
reported ancestries for county residents included ―other ancestries‖ (21%), United States or
American (20.1%), and English (9.2%).
118
http://virginiascan.yesvirginia.org/Admin/CommunityProfiles/Profiles/CityCounty51159.pdf

Page | 124
The average household size for Richmond County was 2.4 persons and the average
family size was 2.93 persons. Of the population 15 years of age and over, 65.7% of males were
married and 51.1% of females were married in 2000. Single parent families with children under
18 comprised 12.6% of the families in the county. Single person households made up 28.1% of
the county‘s households, and nonfamily households comprised 2.9% of households.
Of the population 5 years of age and over, 22.4% had a disability. The highest incidence
of reporting a disability occurred among the population 65 years of age and over (46.1%).
4.2.2.16.4 Education
The population of Richmond County had substantially lower than the national levels of
educational attainment. In 2000, 60% of the county‘s population 25 years of age and over had a
high school graduate level of education compared to the national population‘s 80.4% with high
school graduate level. The county also had a lower percentage (9.9%) of bachelor‘s degree of
higher level of education compared to the national level (24.4%). At that time, 2.4% of the
population had graduate or professional degrees.
4.2.2.16.5 Employment
Of the population 16 years of age and over residing in the county, 45.8% participated in
the labor force and 2.3% were unemployed. For females 16 years of age and over, 51.4% were in
the labor force and 48.7% were employed.
The most commonly reported occupations for county residents included sales and office
occupations (29.1%), management, professional and related occupations (23.1%), and service
occupations (16.1%). Farming, fishing and forestry occupations were reported by 2.9% of the
county‘s residents. By class of worker, the county‘s working population was predominantly
private wage and salary workers (69.5%), with 21.6% government workers, 8.7% self-employed
in own not incorporated business, and 0.2% unpaid family workers.
The industries, which were the most common employers of worker residing in the county
included educational, health, and social services (17.2%), retail trade (13.8%), and construction
(9%). Agriculture, forestry, fishing and hunting, and mining provide employment for 4.6% of the
county‘s resident workers.
According to the Bureau of Labor Statistics quarterly survey,119
Richmond County had
employment in seafood product preparation and packaging between 2001 and 2005, with a single
establishment reported in 2004 and 2005. No data were disclosed for 2001 -2003, and no data
were disclosed regarding employees and wages.
4.2.2.16.6 Income
The median household income in 1999 in the county was $33,026 and the median family
income at that time was $42,143. Households with incomes under $25,000 comprised 37.7% of
the county‘s households, and families with equivalent incomes comprised 27.5% of the county‘s
families. Per capita income was $16,675. Median earnings for male full-time, year-round
119
http://data.bls.gov/PDQ/outside.jsp?survey=en
Page | 125
workers in 1999 were $30,722 and median earnings for female full-time, year-round workers
were $21,807.
In 1999, 11.9% of the county‘s families were found to have incomes below the poverty
level. Families with a female householder, no husband present, were almost three times more
likely to be in poverty with 32.8% of those families having income below the poverty level.
4.2.2.16.7 Housing
In 2000, there were 3,512 housing units in the county, of which 83.6% were occupied.
For those occupied units 77.4% were owner occupied and 22.6% were renter occupied. The
vacancy rate was 16.4%. Of the vacant units, 50% were for seasonal, recreational or occasional
use. The median value of owner occupied units was $86,700 and the median rent for units in the
county was $457.
The housing stock in the county is predominantly composed of single, detached units
(79.6%), and mobile homes (12.8%). Structures in excess of 30 years old comprised 48.2% of
the county‘s housing stock.
4.2.2.17 Stafford County
Stafford County is a metropolitan county within the Washington-Baltimore metropolitan
area. The county appears to be mainly a suburb of the Washington area, with over half its
commuters leaving the county toward areas nearer the central city of Washington, DC.120
Most
concentrated development appears to be focused in the south of the county nearest
Fredericksburg, and on the north end of the county near the Quantico Marine Base.121
There are
no isolated inhabited islands in the county.
Major employers in the county include a manufacturer of printed circuit boards, research
and development, Federal government and military, insurance, computer software, and grocery
distribution companies. The largest single employer in the county is the Quantico Marine Corps
base. The county appears to be mainly a suburb of the Washington area, with over half its
commuters leaving the county.122
4.2.2.17.1 Location
Stafford County is located between the Rappahannock and Potomac Rivers on the
mainland area of Virginia. It is approximately half way between Richmond and Washington,
DC. The county shares boundaries with Prince William County to the north, Fauquier and
Culpeper Counties to the west, Spotsylvania and Caroline Counties and the City of
Fredericksburg to the south, and King George County to the east. Across the Potomac River to
the east is Charles County, MD.
120
http://virginiascan.yesvirginia.org/Admin/CommunityProfiles/Profiles/CityCounty51179.pdf 121
http://www.co.stafford.va.us/Departments/Planning_&_Zoning/Maps_Available/asset_upload_file810_9
954.pdf 122
http://virginiascan.yesvirginia.org/Admin/CommunityProfiles/Profiles/CityCounty51179.pdf

Page | 126
4.2.2.17.2 Transportation
Interstate 95 is the major highway that serves the county, running generally north-south,
and linking the county to Fredericksburg, which adjoins the city to the south and further to
Richmond, and to the north to Washington, DC. State Highway 17 provides access to the west
toward Warrenton, and State Highway 3 provides access easterly to the Northern Neck. The
county has a general aviation airport,123
but major service is through Washington at Dulles or
Regan National, about 25 miles away. A rail line serves the county and passenger service via
Amtrak is also available.
4.2.2.17.3 Demographics
In 2000, the population of Stafford County totaled 92,446 people. The population was
evenly split between males (50.3%) and females (49.7%) at that time. The median age of the
county‘s population in 2000 was 33.1 years. In 2006, the county‘s population had increased to
120,170 and the proportions of males (50.4%) and females (49.6%) were similar to the
information from 2000. The median age had increased slightly in 2006 to 33.6 years.
The ethnic composition of the county in 2000 by race was predominantly white (82%),
with 12.1% of the population self-identifying as black, 1.6% self-identifying as Asian, and 1.2%
self-identifying ―some other race.‖ In addition, 2.5% of the population self-identified as two or
more races. Hispanic and Latino people comprised 3.6% of the county‘s population in 2000. In
2006, racial diversity in the county had increased, with 73.6% of the county self-identifying as
white, 16.9% self-identifying as black or African-American, 2.5% self-identifying as Asian, and
3.4% self-identifying as ―some other race.‖ Hispanic and Latino people made up 7.6% of the
county‘s residents in 2006. In 2000, 96% of the county‘s population was native born Americans.
The most frequently reported regions of birth for the 4% of the population that was foreign born
in 2000 were Asia (38.5%), Europe (28%), and Latin America (22.7%). In 2006, the foreign
born population had increased to 8% of the county‘s population, but regions of birth were not
presented in the American Community Survey data. The most frequently reported ancestries in
2000 included ―other ancestries‖ (25.2%), German (16.3%), and Irish (14.9%).
In 2000, the average household size was 3.01 persons, and the average family size in the
county was 3.32 persons. In 2006, the average household size had decreased slightly to 2.97
persons, and the average family size had increased slightly to 3.36 persons. In 2000, 63.6% of
males 15 years of age and over in the county were married and 64.2% of females in the same age
cohort were married. In 2006, 57.2% of males 15 years of age and over in the county were
married and 55.8% of females 15 years of age and over were married. Single parent families
with children under 18 made up 9.9% of families in the county in 2000, and in 2006 single parent
families with children under 18 made up 9.5 % of families. Single person households comprised
13.9% of households in the county in 2000 and nonfamily households comprised 4.8% of
households in the county. In 2006, single person households comprised 18% of households in the
county and nonfamily households comprised 21.8% of households in the county.
In 2000, 12.6% of the population 5 years of age and over had a disability. The population
65 years of age and over most frequently reported having a disability (42.2%). In 2006, 9.1% of
123
http://www.staffordairport.com/info.htm

Page | 127
the county‘s population had a disability, and 31.1% of the population 65 years of age and over
had a disability.
4.2.2.17.4 Education
In 2000, 88.6% of the county‘s population 25 years of age and over had high school
graduate or higher level of education and 29.6% had bachelor‘s degree or higher level of
education. This rate was somewhat higher than the national rates (80.4% of the national
population having high school or higher levels of education and 24.4% of the national population
possessing bachelor‘s degree or higher level of education). At that time 10.8% of the county‘s
population 25 years of age and over had graduate or professional degrees. In 2006, 91.4% of the
county‘s population 25 years of age and over had high school or higher levels of education, and
34.1% had bachelor‘s degree or higher levels of education. Again, this is somewhat higher than
the national rates of 84.1% of having high school or higher level of education and 27% of the
national population 25 years of age and over having bachelor‘s degree and higher levels of
education. In 2006, 13% of the population of the county had graduate or professional degrees.
4.2.2.17.5 Employment
In 2000, of the 50,424 people 16 years of age and over in the county, 76% participated in
the labor force and 2.1% were unemployed. At that time 67.6% of females 16 years of age and
over were in the labor force and 64.3% were employed. In 2006, 72.1% of the county‘s
population 16 years of age and over participated in the labor force, and 3.5% were unemployed.
In 2006, 65.6% of females 16 years of age and over in the county were in the labor force, and
61.5% were employed.
The most frequently reported occupations for working county residents in 2000 included
management, professional, and related occupations (41.1%), sales and office occupations
(25.7%), and service occupations (13.3%). Farming, fishing and forestry occupations were
reported by 0.1% of the employed county residents. In 2000, 67.6% of the county‘s workers
were private wage and salary workers, 27.7% were government workers, 4.5% were self-
employed workers in their own not incorporated business, and 0.2% were unpaid family workers.
In 2006, the management, professional and related occupations were reported by 40.3%, sales
and office occupations were reported by 27.0% and service occupations were reported by 12.8%
of the county‘s workers. Farming, fishing and forestry occupations were reported by .006% of
the county‘s workers.
In 2000, the most commonly reported industries in which employed county residents
worked included educational, health, and social services (16.8%), public administration (15.5%),
and professional, scientific, management, administrative and waste management services
(11.8%). Agriculture, forestry, fishing and hunting, and mining employed 0.3% of the county‘s
workers in 2000. In 2006, the industries employing the greatest number of the county‘s workers
included public administration (17.8%), professional, scientific, and management, and
administrative and waste management services (15.8%) and educational services, health care and
social assistance (14.7%). Agriculture, forestry, fishing and hunting and mining employed
0.06% of the county‘s workers.

Page | 128
Stafford County, according to the Bureau of Labor Statistics quarterly survey,124
had no
employment or establishments in finfish fishing, shellfish fishing, or seafood product preparation
and packaging between 2001 and 2006. There may have been individuals working in fishing who
were self employed or who otherwise did not contribute to unemployment insurance upon which
the Bureau of Labor Statistics survey is based.
4.2.2.17.6 Income
The median household income in the county in 1999 was $66,809 and the median family
income was $71,575. In 2006, the median household income had increased to $85,014 and the
median family income had increased to $93,625. Households with income under $25,000 in 1999
comprised 10.4% of the county‘s households, and families with similar income comprised 7% of
the county‘s families at that time. In 2006, 8.6% of the households in the county had income less
than $25,000 (in 2006 inflation-adjusted dollars), and 4.5% of families had equivalent income at
that time. Median earnings for male full-time, year-round workers in 2000 were $47,080 and
median earnings for female full-time, year-round workers were $31,469. In 2006, median
earnings increased to $62,199 for male full-time, year-round workers, and $41,905 for female
full-time, year-round workers. Per capita income in 1999 was $24,764, and in 2006, per capita
income for the county had increased to $31,860 (in 2006 inflation-adjusted dollars).
In 1999, the county had a low incidence of families in poverty. At that time, 2.4% of the
county‘s families had income below the poverty level. Unfortunately the rate was still higher for
families with a female householder, no husband present, at 11.9%. In 2006, 2.7% of all families
in the county had income below the poverty level in the previous 12 months, and 8.3% of
families with a female householder, no husband present, had income below the poverty level.
4.2.2.17.7 Housing
In 2000 there were 31,405 housing units in the county, of which 96.1% were occupied.
Of those occupied units, 80.6% were owner occupied and 19.4% were renter occupied. The
vacancy rate was 3.9%, and of the vacant units, 14.1% were for seasonal, recreational or
occasional use. In 2006, the number of housing units increased to 41,791, and 95% were
occupied; at that time 76.3% were owner occupied and 23.7% were renter occupied. The
median value of owner occupied units in 2000 was $156,400 and the median rent at that time
was $842; in 2006 the median value of owner occupied units increased to $396,800 and the
median rent had increased to $1183.
The housing stock in the county in 2000 was mainly composed of single unit
detached (76.2%) and single unit attached (11.3%) structures and mobile homes (4.6%).
Between 2000 and 2006, there was construction of apartments, in the main in excess of 10 units
in the structure. In 2006, 10 to 19 unit structures offered 3.6% of the housing stock. Structures in
excess of 30 years old in 2000 comprised 16% of the county‘s housing stock at that time.
4.2.2.18 City of Suffolk
Suffolk is the westerly city on the south side of Hampton Roads, and is part of the
Norfolk-Virginia Beach-Newport News metropolitan area. As an independent city, Suffolk is
124
http://data.bls.gov/PDQ/outside.jsp?survey=en

Page | 129
considered a county equivalent. Much of Suffolk is inland area with a short segment of the
county on the James River, however, the Nansemond River penetrates into the county.
Dumpling, Shackley and Wills Islands and another unnamed island are situated in the
Nansemond River, none of which appear to be densely developed, although Dumpling Island had
a pier and what appeared to be a structure in 1994.125
According to the Virginia Economic Development Partnership, major employers in the
city include food and beverage (tea and coffee) processing and distribution, shopping network
distribution, health care, and federal government (military) services and the city is building on
its technology infrastructure for modeling and simulation technologies.126
4.2.2.18.1 Location
The City of Suffolk is on the south side of the James River and extending southward to
the North Carolina border. The city‘s boundaries are shared with Isle of Wight and Southampton
Counties on the west and the cities of Chesapeake and Portsmouth to the east. The City of
Newport News is across the James River from Suffolk.
4.2.2.18.2 Transportation
Major highways in Suffolk include Interstate 664 which links to Newport News,
Portsmouth, Chesapeake, and Virginia Beach, U. S. Highway 58 which links to the east toward
Norfolk and westward toward Franklin and Emporia (and Interstate 95), U. S. Highway 13 which
connects to the Eastern Shore, and U. S. Highway 17 which runs from the North Carolina to
Fredericksburg and Warrenton. According to the Virginia Transportation Map127
three rail lines
serve the city. Two general aviation airports are also shown on the map, and commercial air
service is available at Norfolk International Airport and Newport News-Williamsburg
International Airport, both approximately 12 miles away.
4.2.2.18.3 Demographics
The population of the city in 2000 totaled 63,677 people. Females (52.2%) slightly
outnumbered males (47.8%). The median age of Suffolk‘s population in 2000 was 36 years. In
2006, the city‘s population had increased to an estimated 81,071 people, and the distribution of
females and males was similar (52.3% females, 47.7% males). The median age of the city‘s
population had declined slightly to 35.3 years.
The ethnic composition of the city in 2000 was fairly diverse, and included 53.8%
of the population self-identifying as white, 43.5% self-identifying as black or African American,
0.8% self-identifying as Asian, and 1.2% self-identified as two or more races. Hispanic and
Latino people comprised 1.3% of the population in 2000. In 2006, the racial composition of the
city had changed slightly with 54.8% of the population self-identifying as white, 40.5% self-
identifying as black or African-American, 2.3% self-identifying as ―some other race,‖ and 1.3%
self-identifying as Asian. Hispanic or Latino people in 2006 comprised 2.1% of the city‘s
population. In 2000, 98.1% of the city‘s population consisted of native-born Americans. For
125
http://terraserver-usa.com/image.aspx?T=1&S=10&Z=18&X=1804&Y=20388&W=3 126
http://virginiascan.yesvirginia.org/Admin/CommunityProfiles/Profiles/CityCounty51800.pdf 127
http://www.vdot.virginia.gov/travel/Resources/ct-vamap10.pdf

Page | 130
the nearly 2% of the population who were foreign born, the most frequently reported regions of
birth included Europe (36.3%), Asia (36.3%) and Latin America (17.5%). In 2000, the most
frequently cited ancestries for city residents included ―other ancestries‖ (42.9%), United States or
American (11.4%), and English (10.3%).
The average household size in Suffolk in 2000 was 2.69 people and the average family
size was 3.09 people. In 2006, the average household and family size for the city had declined
slightly to 2.63 persons and 3.01 persons respectively. In 2000, 59.5% of males 15 years of age
and over were married and 51.3% of females in the same age cohort were married. In 2006,
59.5% of males 15 years of age and over were married, and 53.6% of females in the age cohort
were married. Single parent families with children under 18 year of age comprised 15.9% of
families in the city in 2000, and 13.6% of families in 2006. Single person households comprised
20.1% of the city‘s households in 2000 and 18.6% of the city‘s households in 2006. Nonfamily
households comprised 3.7% of households in the city in 2000; by 2006, nonfamily households
had increased to 18.6% of the city‘s households.
In 2000, 23.1% of the city‘s population 5 years of age and over had a disability, and the
highest reporting of disability was in the age cohort 65 years of age and over for whom 48.5%
reported having a disability. In 2006, 19.8% of the city‘s population 5 years of age and over
reported having a disability and 41.7% of the population 65 years of age and over reported
having a disability.
4.2.2.18.4 Education
In 2000, 76.8% of the city‘s population 25 years of age and over had a high school
graduate or higher level of education, and 17.3% had a bachelor‘s degree or higher level of
education. These rates were somewhat lower than the national rates of 80.4% of the population
having a high school graduate level or higher level of education and 24.4% having bachelor‘s
degree or higher level of education. In 2000, 5.6% of the city‘s population 25 years of age and
over had graduate or professional degrees. In 2006, 83.3% of the city‘s population had a high
school graduate or higher level of education, and 24.9% had a bachelor‘s degree or higher level
of education. This lagged behind the national rates in which 84.1% of the population had high
school graduate or higher levels of education, and 27% of the population had bachelor‘s degrees
or higher levels of education. In 2006, 2.7% of the city‘s population was estimated to have
graduate or professional degrees.
4.2.2.18.5 Employment
In 2000, 63.6% of the city‘s 30,345 people 16 years of age and over were in the labor
force and 3% were unemployed. At that time, 56.2% of females 16 years of age and over were in
the labor force and 52.8% of females 16 years of age and over were employed. In 2006, 69.3%
of the city‘s population 16 years of age and over was in the labor force and 2.8% were
unemployed; 63.6% of females in the age cohort were in the labor force in 2006, and 59.8% were
employed.
The most frequently reported occupations for residents of the city in 2000 included
management, professional and related occupations (30.9%), sales and office occupations (25.3%)
and production, transportation and material moving occupations (18.5%). Farming fishing and

Page | 131
forestry occupations were reported by 0.4 % of the city‘s workers. The most frequent class of
worker reported was private wage and salary workers (72.9%), followed by government workers
(22%), self-employed workers in own not incorporated business (4.6%) and unpaid family
workers (0.4%). In 2006, the most frequently reported occupations were management,
professional and related occupations (34.2%), sales and office occupations (25%), and service
occupations (15.2%). Farming, fishing and forestry occupations comprised 1.7% of those
reported in 2006. Private wage and salary workers became more common in the city,
comprising 76.3% of the city‘s workers in 2006 with declines in government workers (20.5%),
self-employed workers in own not incorporated business (3.18%) and no unpaid family workers.
The industries that most commonly employed the city‘s workers in 2000 included
educational, health, and social services (19.7%), manufacturing (17.7%) and retail trade (11.5%).
Agriculture, forestry, fishing and hunting, and mining employed 0.9% of the city‘s workers in
2000. In 2006, the most commonly reported industries for the city‘s employed workers included
educational services, health care, and social assistance (21.2%), manufacturing (13.9%), and
retail trade (12.1%). Agriculture, forestry, fishing and hunting and mining employed 0.5% of the
city‘s workers in 2006.
Between 2001 and 2006, the City of Suffolk has had an increase in fishing employment
according to the Bureau of Labor Statistics quarterly survey. In 2001 there were apparently no
establishments in finfish fishing, shellfish fishing or seafood product preparation and packaging,
then in 2002 and 2003, while data are not disclosed for shellfish fishing there at least is the non
disclosed data notation for shellfish fishing in Suffolk. In 2004, one shellfish fishing
establishment is reported, and a report for a single establishment continues to 2006. In 2005 and
2006 a single establishment is reported for seafood product preparation and processing. No data
are disclosed on numbers of employees or wages.
4.2.2.18.6 Income
The median household income in the city in 1999 was $41,994, and the median family
income was $47342. In 2006, the median household income in the city had increased to $60,703
and the median family income had increased to $70,076 in 2006 inflation-adjusted dollars.
Households with income less than $25,000 in 2000 comprised 30.1% of the city‘s households,
and families with similar income comprised 23.2% of the city‘s families. In 2006 households
with income less than $25,000 in the previous 12 months comprised 18.3 % of the city‘s
households, and families with equivalent income comprised 13.5% of the city‘s families. Median
earnings for male full-time, year-round workers in 2000 were $35,852 and median earnings for
female full-time, year-round workers were $23,777. In 2006, median earnings for male full-
time, year-round workers had increased to $52,039, and median earnings for female full-time
year-round workers had increased to $34,568. Per capita income in 2000 was $18,836. Per
capita income increased to $26,806 in 2006.
In 2000, 10.8% of families were reported to have income below the poverty level.
Families with a female householder, no husband present were more likely to be in poverty, as
displayed by 35.4% of these families having income below the poverty level. In 2006, 7.3% of
all families were reported to have income below the poverty level, and 31.5% of families with a
female householder, no husband present, had income below the poverty level.

Page | 132
4.2.2.18.7 Housing
In 2000, there were 24,704 housing units in the City of Suffolk, of which 94.2% were
occupied. Of the occupied units, 72.2% were owner occupied and 27.8% were renter occupied.
The vacancy rate was 5.8% of all units. For those vacant units, 9% were for seasonal,
recreational or occasional use. In 2006 the total number of housing units had increased to
31,575, of which 95.9% were occupied. Of the occupied units in 2006, 72.1% were owner
occupied and 27.9% were renter occupied. The median value of owner occupied units in 2000
was $107,300 and the median rent was $506; in 2006 the median value of owner occupied units
had risen to $232,900 and the median rent had risen to $775.
The housing stock in the city in 2000 was mainly composed of single unit detached
structures (78.3%), and mobile homes (4.3%). The next most common type of units in 2000 was
duplexes (4.9%). In 2006, single unit detached structures comprised 75% of the city‘s housing
stock. Structures in excess of 30 years old comprised 40.5% of the city‘s housing stock.
4.2.2.19 Surry County
Surry County is a rural county in the Virginia-Norfolk-Newport News Metropolitan Area.
It is located just to the west of Isle of Wight County and south of Charles City and James City
Counties. The majority of the land uses in the county are forested and agricultural.
Development is concentrated around the towns of Surry, Dendron, and Claremont. Another
indicator of the rurality of the county is its celebration of its agricultural and forestry heritage,
the annual ―Pork, Peanut, and Pine Festival‖ which is held in July. There are no isolated
occupied islands within the county.
Major employers in the county include a meat processor, a lumber company, a millwork
company, an electric utility, and a construction firm. Overall the county‘s commuters have a net
export to adjoining counties and Newport News.128
4.2.2.19.1 Location
Surry County is located in Southeastern Virginia, along the south side of the James River.
It is to the west of Isle of Wight County, and to the east of Prince George County. To the south
of Surry County are Sussex and Southampton Counties, and to the north are Charles City and
James City Counties and the City of Williamsburg. Within the county are the towns of
Claremont, Dendron, and Surry. The town of Surry is the county seat.
4.2.2.19.2 Transportation
The major transportation routes in the county are State Highways 10, 40, and 31. State
Highway 10 Connects from the Hopewell-Petersburg area (Interstate 95) toward Norfolk) and
State Highway 40 connects southwesterly through Sussex County to Interstate 95 toward North
Carolina. State Highway 31 connects Williamsburg and Interstate 64 via the Scotland Ferry (a
free ferry) to the north, and Wakefield and U. S. Highway 58 to the south with connections into
North Carolina. There is no airport or landing field in Surry County, but there is an airport in
128
http://virginiascan.yesvirginia.org/Admin/CommunityProfiles/Profiles/CityCounty51181.pdf

Page | 133
Wakefield in adjoining Sussex County. The major commercial airports are in Norfolk or
Richmond between 25 and 30 miles away and somewhat limited commercial service is available
at the Newport News-Williamsburg Airport about 8 miles away. Rail service is not available in
the county, but it is available in surrounding counties.
4.2.2.19.3 Demography
The population in the county in 2000 totaled 6,829 people. The population was generally
evenly distributed between males (48.4%) and females (51.6%). The median age of the
population was 39.4 years.
The ethnic composition of county‘s population that self-identified a single race was
46.9% white, 51.6% black or African-American, and less than 1% for other races. Hispanic or
Latino people comprised 0.7% of the population. Nearly the entire population 99.5% was native
born Americans. For the extremely limited population that reported foreign birth, 75.8% were
born in Europe, 18.2% were born in Latin America and 6.1% were born in Asia. The most
commonly reported ancestries for county residents included ―other ancestries‖ (45.1%), United
States or American (10%), and English (9.4%).
The average household size in 2000 for Surry County was 2.61 people and the average
family size was 3.09 people. At that time, for the age cohort 15 years of age and over, 59.1% of
males were married, and 53.6% of females were married. Single parent families with children
under 18 years of age comprised 11.2% of all families. Single person households comprised
23.6% of households and nonfamily households comprised 3.2% of households in the county.
People with disabilities comprised 24.5% of the population years of age and over. The
age cohort most frequently reporting having a disability was the group 65 years of age and over,
of whom 51% reported having a disability.
4.2.2.19.4 Education
In 2000, 70.4% of the county‘s population 25 years of age and over had high school
graduate and higher level of education and 12.8% of the age cohort had bachelor‘s degree or
higher levels of education. At that time 3.6 % of the county‘s population 25 years of age and
over held graduate or professional degrees.
4.2.2.19.5 Employment
According to the 2000 census, of the 5,289 people in the county 16 years of age and over,
63.8% were in the labor force and 3.4% of those in the age cohort were unemployed. At that
time 58.1% of females in the age cohort were in the labor force and 55.4% were employed.
The most common occupations for employed residents of the county included
management, professional and related occupations (22.2%), sales and office occupations
(22.1%), and construction, extraction, and maintenance occupations (18.7%). Farming, fishing
and forestry occupations comprised 1.8% of those reported. By class of worker, the county‘s
workforce included private wage and salary workers (71.7%), government workers (21.8%),

Page | 134
self-employed workers in own not incorporated business (5.9%), and unpaid family workers
(0.5%).
The most frequently reported industries for county workers included manufacturing
(21.7%), educational, health, and social services (17.8%), and retail trade (9.4%). Agriculture,
forestry, fishing and hunting, and mining employed 5% of the county‘s workers.
In recent years (2003-2006) had no employment in finfish fishing, shellfish fishing or
seafood product preparation and packaging according to the Bureau of Labor Statistics.129
There
were an undisclosed number of finfish fishing establishments in 2001 and 2002, and numbers of
employees and wages were also not disclosed. There may have been some individuals
participating in fishing as self employed or in positions, which did not participate in
unemployment insurance upon which the Bureau of Labor Statistics survey is based.
4.2.2.19.6 Income
The median household income in Surry County in 1999 was $37,558 and the median
family income was $41,234. Households with income under $25,000 comprised 31.9% of
households in the county, and families with equivalent income comprised 25.3% of families in
the county in 1999. Median earnings for male full-time, year-round workers were $31,123 and
median earnings for female full-time, year-round workers were $21,143. The per capita income
for Surry County was $16,682.
In 1999, 9.7% of families in the county had incomes below the poverty level. At that time
30.4% of families with a female householder, no husband present had income below the poverty
level.
4.2.2.19.7 Housing
In 2000, there were 3,294 housing units in the county of which 79.5% were occupied.
For the occupied units, 77.2% were owner occupied, and 22.8% were renter occupied. The
vacancy rate was 20.5%. Of the vacant units, 66% were reported to be for seasonal, recreational,
or occasional use. The median value of owner occupied units in 2000 was $88,100, and the
median rent was $402.
In 2000, the housing stock in the county was comprised predominantly of single unit
detached structures (71.4%) and mobile homes (23.3%). Units in excess of 30 years old
comprised 43.6% of the county‘s housing stock.
4.2.2.20 City of Virginia Beach
The City of Virginia Beach is the largest city in Virginia in terms of land area (310 miles)
and the fastest growing city in the state. It is a focus of the Virginia Beach-Norfolk-Newport
News metropolitan area. The city is a resort destination, with two major performing arts venues,
38 miles of shoreline, museums, two major locations for accessing fishing (Lynnhaven and
Rudee Inlets) and numerous hotels. In addition there are military facilities and substantial
business interests in the city including medical specialists associated with Sentara Virginia Beach
129
http://data.bls.gov/PDQ/outside.jsp?survey=en

Page | 135
General Hospital. Lynnhaven Mall, located in the city, is reputed to be the largest shopping mall
between Washington DC and Atlanta, GA.130
Major employers in the city include a manufacturer of rubber gaskets and seals, a
company that makes voltage trays and power cables, a manufacturer of industrial pumps, a gas
control gauge company, a coated abrasive company, a maker of gears, a polymer company, an
electronic sensor company, a newspaper, a manufacturer of outdoor power tools, three defense
contractors, an insurance company, a tax preparer, a health care company, a telecommunications
company, an engineering/design/technical support company, and the customer service and
processing center for a major rental car company. Although there are several companies with
substantial employment in the city, the net flow of commuters is out of the city, with the vast
majority of commuter destinations being Norfolk.131
4.2.2.20.1 Location
Virginia Beach is the southeasterly-most local entity in the Commonwealth of Virginia.
Along its southern boundary is the state line of North Carolina, and along its eastern border is the
Atlantic Ocean. To the north of the city is the mouth of Chesapeake Bay, and to the west are the
cities of Norfolk and Chesapeake.
4.2.2.20.2 Transportation
Two Interstate Highways, 264 and 64 are within the city‘s boundaries. In addition,
several state and U. S. Highways are within city limits, including U. S. 60 and 58, and State
Highways 13, 165, 149, and 225. While there is not a public airport in the city, Oceana Naval
Air Station is located in city limits. The public airport is situated in Norfolk, approximately one
mile from the city‘s western boundary. Rail service between Norfolk and Virginia Beach exists
for freight service and there is currently an ongoing political process for developing light rail
connections between the two cities.
4.2.2.20.3 Demography
In 2000 the population of Virginia Beach totaled 425,527 people according to the U.S.
Census Bureau. The population was evenly split between males (49.5%) and females (50.5%).
The median age in 2000 was 32.7 years. In 2006, the population had increased to an estimated
435,619 people. The distribution of males (48.9%) and females (51.1%) had become a bit less
even. The median age in 2006 increased to 35.5 years.
The ethnic composition of city residents in 2000 who self-identified a single race was
predominantly white (71.44%), with 19% black or African American and 4.9% Asian people. In
2000, 4.2% of the population was comprised of Hispanic or Latino people. In 2006, the racial
composition of the city was 70.2% people who self-identified as white, 19.5% people who self-
identified as black or African American, 5.5% who self-identified as Asian, and 1.3% ―some
other race‖ for those who identified single race in excess of 1% of the population. In 2006,
Hispanic or Latino people comprised 5.1% of the city‘s population. In 2000, 93.4% of the
population was composed of native born Americans. For the 6.6% of the population that was
130
http://virginiascan.yesvirginia.org/Admin/CommunityProfiles/Profiles/CityCounty51810.pdf 131
http://virginiascan.yesvirginia.org/Admin/CommunityProfiles/Profiles/CityCounty51810.pdf

Page | 136
foreign born, the most frequently reported regions of birth included Asia (53.7%), Europe
(22.4%), and Latin America (16.7%). In 2006, 91.3% of the city‘s population was native born
American. For the 8.7% of the city‘s population that was foreign born, 50% reported their
region of birth as Asia, 22.7% reported their region of birth as Europe, and 21.3% reported their
region of birth as Latin America. The most frequently cited ancestries in 2000 included ―other
ancestries‖ (33.9%), German (13.7%), and Irish (12.4%).
In 2000 the average household size for the city was 2.7 persons and the average family
size was 3.14 persons. In 2006, the average household size was 2.62 persons and the average
family size was 3.12 persons. In 2000, 58.5% of males 15 years of age and over were married,
and 55.7% of females in the same age cohort were married. In 2006, 55.6% of males 15 years of
age and over were married, and 52.5% of females in the same age cohort were married. Single
parent families with children under 18 years of age comprised 13.9% of all families in 2000, and
13% of all families in 2006. Single person households comprised 20.3% of all households in the
city in 2000 and 23.7% of all households in 2006; nonfamily households comprised 7.2% of all
households in 2000 and 29.9% of all households in the city in 2006.
In 2000, 15.8% of the population over the age of 5 had a disability; the cohort most
affected was the segment of the population 65 years of age and over, of whom 39.7% reported
having a disability at that time. In 2006, 11.8% of the population 5 years of age and over
reported having a disability, and for the segment of the population 65 years of age and over
32.8% reported having a disability.
4.2.2.20.4 Education
In 2000, 90.4% of the population 25 years of age and over had high school graduate or
higher levels of education and 28.1% had bachelor‘s degrees or higher levels of education,
substantially better than the national rates of 80.4% having high school graduate or higher levels
of education and 24.4% having bachelor‘s degrees or higher levels of education. In 2000, 8.9%
of the city‘s population had graduate or professional degrees. In 2006, 92% of the city‘s
population had high school graduate or higher levels of education and 31.1% had bachelor‘s
degree or higher levels of education. These remained higher than the national rates, which also
improved to 84.1% for high school graduates or higher levels and 27% for bachelor‘s degree or
higher levels of education for the national population.
4.2.2.20.5 Employment
In 2000, of the 321,282 people in the city 16 years of age and over, 72.9% were in the
labor force, and 2.6% of the age cohort was unemployed. For females in the age cohort, 65.5%
were in the labor force in 2000, and 60% were employed. In 2006, 72.8% of the population 16
years of age and over was in the labor force, and 2.6% were unemployed. For females 16 years
of age and over in 2006, 66.1% were in the labor force and 62.3% were employed.
The most commonly reported occupations for employed workers in the city in 2000
included management, professional and related occupations (35.9%), sales and office
occupations (30.1%), and service occupations (14.9%). Farming, fishing and forestry
occupations were reported by 0.1% of workers. In 2006, the same three categories were the most
commonly reported occupations, but the percentages had changed slightly, with management

Page | 137
professional and related occupations comprising 38.7% of the reported occupations, sales and
office occupations comprising 27.2%, and service occupations comprising 15.6%. Farming,
fishing and forestry occupations continued to comprise 0.1% of the reported occupations. The
composition of workers in the city by class in 2000 consisted of mainly private wage and salary
workers (75.2%), with lesser percentages of government workers (19.4%), self-employed
workers in own not incorporated business (5.2%), and unpaid family workers (0.2%). In 2006,
by class of worker, the composition of workers included 73% private wage and salary workers,
21.9% government workers, 4.9% self-employed workers in own not incorporated business, and
0.1% unpaid family workers.
The industries in which workers in the city most frequently were employed in 2000
included educational, health and social service (20.5%), retail trade (13.7%), and professional,
scientific, management, administrative, and waste management services (10.9%). Agriculture,
forestry, fishing and hunting, and mining employed 0.2% of the city‘s workers in 2000. In 2006,
the industries which employed the most of the city‘s workers included educational services,
health care, and social assistance (21.3%), professional, scientific, and management and
administrative, and waste management services (11.9%), and retail trade (10.8%). Agriculture
forestry, fishing and hunting, and mining provide employment to 0.5% of the city‘s resident
population in 2006.
At the peak level of diversity between 2001 and 2006 in Virginia Beach, the Bureau of
Labor Statistics,132
reported one establishment each in other marine fishing, shellfish fishing, and
seafood product preparation and packaging and two establishments in finfish fishing (2005).
Subsequently in 2006 it appears that the establishments in other marine fishing and seafood
product preparation and packaging are no longer in business, but that an additional establishment
has been added in shellfish fishing. No data were disclosed on numbers of employees or wages
for the 2001-2006 time period.
4.2.2.20.6 Income
The median household income in 1999 for the City of Virginia Beach was $48,705 and
the median family income at that time was $53,242. In 2006, the median household income in
2006 inflation-adjusted dollars was $61,333 and the median family income was 69,468.
Households earning less than $25,000 in 2000 comprised 17.8% of households in the city, and
families with similar earnings comprised 13.8% of families in the city. In 2006, households with
equivalent incomes comprised 13.4% of all households in the city and families with similar
incomes comprised 9.4% of all families in the city. Median earnings for male full-time, year-
round workers in 2000 were $33,756 and $25,979 for female full-time, year-round workers. In
2006, the median earnings had increased to $ 44,349 for male full-time, year-round workers and
$32,651 for female year-round, full-time workers. Per capita income in 2000 was $22,365 and
per capita income in 2006 was $28,477.
In 2000, 5.1% of families in the city had income below the poverty level and 18.1% of
families with a female householder, no husband present, had income below the poverty level. In
2006, unlike most nearby cities which had improvement in the status of families, additional
132
http://data.bls.gov/PDQ/outside.jsp?survey=en

Page | 138
families fell below the poverty level with 5.4% of all families having income below the poverty
level, and 18.4% of families with a female householder, no husband present, having income
below the poverty level.
4.2.2.20.7 Housing
In 2000, there were 162,277 total housing units, of which 95.2% were occupied. For
those occupied units, 65.6% were owner occupied and 34.4% were renter occupied. The vacancy
rate in 2000 was 4.8%. Of the vacant units, 32.1% were reported to be for seasonal, recreational,
or occasional use. In 2006, the total number of units in the city had increased to 173,335, of
which 93.2% were occupied. At that time 69.6% of the occupied units were owner occupied,
and 30.4% were renter occupied. The median value of owner occupied units in 2000 was
$123,200 and the median rent was $734; in 2006, the median value of owner occupied units was
$260,300 and the median rent was $1,017.
Housing stock in the city is predominantly single unit structures. In 2000, the major type
of structure is single unit detached, and in 2006, single unit attached structures become second
most important in the city. Housing units in excess of 30 years old in 2000 comprised 25.3 % of
the city‘s housing stock.
4.2.2.21 Westmoreland County
Westmoreland County is a predominantly rural county in northeastern Virginia. It is not
within, but adjoins counties that are within the Washington-Baltimore-Northern Virginia
metropolitan area. Land uses in the county are mainly forested and agricultural, with
development most concentrated near Montross, Colonial Beach, and Potomac Beach. There may
be two structures on the island that separates Curritoman and Nomini Bays at the mouth of the
Nomini River.
The major employers in the county according to the Virginia Economic Development
Partnership include a seafood company, a lumber company and a nursery/winery. The county
has some medical services, but for hospital services, residents must leave the county; the nearest
hospital is approximately 25 miles away. Retail needs are met within the county in Colonial
Beach and Montross, but more selection is available in Richmond (65 miles) and Fredericksburg
(45 miles).133
4.2.2.21.1 Location
Westmoreland County is located on the inland segment of the Northern Neck between the
Rappahannock and Potomac Rivers. It shares borders with King George County on the west and
Northumberland County on the east. Across the Rappahannock River is Essex County, and
across the Potomac River is Charles County, MD. Incorporated towns in the county include
Colonial Beach and Montross. The county seat is Montross.
133
http://virginiascan.yesvirginia.org/Admin/CommunityProfiles/Profiles/CityCounty51193.pdf

Page | 139
4.2.2.21.2 Transportation
The major transportation route through the county is State Highway 3 that parallels the
long axis of the county; also within the county are State Highways 205, 202, and 612. Rail
service is not available in the county nor is there air service within the county. General aviation
airports are available at Tappahannock (approximately 20 miles), and Fredericksburg
(approximately 45 miles), and commercial service is available at Reagan National approximately
40 miles away or in Richmond approximately 45 miles away.
4.2.2.21.3 Demographics
The total population of the county in 2000 according to the U.S. Bureau of Census was
16,718 people. The population was generally evenly distributed between males (48%) and
females (52%). The median age of the county‘s population was 42.8 years.
The ethnic composition of the county‘s residents was 65.4% white people, 30.9% black
or African American people, 1.7% ―some other race,‖ and the remaining population less than 1%
Asian, Native Hawaiian or other Pacific Islander, or American Indian or Alaska Native. Hispanic
or Latino people comprised 3.5% of the county‘s population. The most commonly reported
ancestries in the county included ―other ancestries‖ (32.3%), English (13.1%) and United States
or American (11.8%).
The average household size in 2000 in the county was 2.43 persons and the average
family size was 2.91 persons. For the population 15 years of age and over, 58.1% of males were
married and 53.3% of females were married. Single parent families with children under 18 years
of age comprised 12.1% of all families in the county. Single person households comprised 26.9%
of all households in the county in 2000 and nonfamily households made up 4.9% of all
households in the county at that time.
People with a disability comprised 24.2% of the population 5 years of age and over in
Westmoreland County in 2000. At that time 45.2% of the age cohort 65 years of age and over
reported having a disability.
4.2.2.21.4 Education
The residents of Westmoreland County 25 years of age and over have substantially lower
levels of educational attainment than the national rates for both high school graduation and
higher levels and bachelor‘s degree and higher levels. In 2000, 69.3% of Westmoreland
County‘s population reported levels of educational attainment at the high school graduate or
higher level compared to 80.4% for the national rate, and 113.3% reported having bachelor‘s
degree or higher levels of educational attainment while the national rate at that time was 24.4%.
In 2000, 5.1% of the county‘s population had graduate or professional degrees.
4.2.2.21.5 Employment
In 2000, of the 13,301 people in the county 16 years of age and over, 56.2% were in the
labor force and 2.3% were unemployed. Of females 16 years of age and over, 51.1% were in the
labor force and 49.4% were employed.

Page | 140
The most frequently cited occupations for employed residents of the county included
management, professional and related occupations (26.5%), sales and office occupations
(25.8%), and service occupations (16.3%). Farming, fishing and forestry occupations were
reported by 1.9% of the workers in the county. By class of worker, 68.6% of the county‘s
workers were private wage and salary workers, 22.9% were government workers, and 8.5% were
self-employed workers in own not incorporated business. There were no unpaid family workers
in 2000.
The industries in which county residents were most commonly employed in 2000
included educational, health and social services (15%), construction (12.1%), and retail trade
(11.5%). Agriculture, forestry, fishing and hunting, and mining provide employment for 2.9% of
the employed population of the county in 2000.
According to the Bureau of Labor Statistics quarterly survey,134
Westmoreland County
had a high concentration of seafood product preparation and packaging establishments between
2001 and 2006, exceeded only by Accomack and Northumberland Counties. In 2001 there were
nine seafood product preparation and packaging establishments (seafood processors), but in the
following two years data were not disclosed regarding numbers of establishments. In 2004 and
2005, there were eight seafood processors in the county and in 2006 the number had declined to
six. The maximum number of employees in the county in seafood processing was 197 in 2001,
but the maximum total wages were in 2006 at over $4.1 million. From 2004-2006 there were
also two establishments, one each in finfish fishing and shellfish fishing in the county. No data
were disclosed regarding numbers of employees in finfish fishing and shellfish fishing or wages
for those categories.
4.2.2.21.6 Income
The median household income for Westmoreland County in 1999 was $35,797, and the
median family income was $41,357. Households with income under $25,000 comprised 36% of
all households in the county, and families with equivalent income comprised 29.7% of all
families in the county. Median earnings in 2000 for male full-time, year-round workers were
$31,333 and median earnings for female full-time, year-round workers were $22,221. Per capita
income in 2000 was $19,473.
In 1999, 11.2% of the families in the county had income below the poverty level. At that
time, 27.8% of families with a female householder, no husband present, had income below the
poverty level.
4.2.2.21.7 Housing
In 2000, there were 9,286 total housing units in the county, of which 73.7% were
occupied. For those occupied units, 79.2% were owner occupied and 20.8% were renter
occupied. The vacancy rate was 26.3%. Of the vacant units, 69.4% were reported to be for
seasonal, recreational or occasional use. The median value of owner occupied units in the county
was $95,300 and the median rent for units in the county was $537.
134
http://data.bls.gov/PDQ/outside.jsp?survey=en

Page | 141
Housing stock in the county was predominantly single unit detached structures (84.5%)
and mobile homes (10.7%). Units in excess of 30 years old in 2000 comprised 46.1% of the
county‘s housing stock.
4.2.2.22 City of Williamsburg
Williamsburg is within the Virginia Beach-Norfolk-Newport News Metropolitan
Statistical Area. It is the most inland city of the metropolitan area, and served as the colonial
capital of the commonwealth. The city is one of the three loci of the ―Historic Triangle‖
(Williamsburg, Jamestown, Yorktown), landmark communities that offer historic recreation and
museums of Colonial and Revolutionary Era lifeways. While Williamsburg is on tributary
creeks, it is primarily landlocked, so has no isolated occupied islands.
Williamsburg serves as the northerly hub community for the region and in general could
be referred to as a cultural center for metropolitan area. Williamsburg has several art galleries,
the College of William and Mary, and music and dance performances are regularly staged at the
college or other venues in the city. The city has shopping opportunities that bring in people from
surrounding counties for retail needs such as clothing and groceries. The city also serves as a hub
for medical and library access. Major employment in the city includes museums and hotels
related to the colonial area, research, education, and news. The city draws in commuters from
the surrounding area, with nearly six times as many commuters coming into the city as leaving
on a daily basis.135
4.2.2.22.1 Location
The City of Williamsburg is situated on what is locally known as ―The Peninsula,‖
between York and James City Counties. It is approximately five miles northeast of Newport
News and 45 miles southeast of Richmond.
4.2.2.22.2 Transportation
The major highways in this small city are State Highway 5 and US Highway 60. Circling
the city is State Highway 199, and immediately outside the city is Interstate 64 that provides
rapid access to the coastal communities of Norfolk and Virginia Beach, in addition to the bay
communities of Hampton and Newport News to the southeast, and in the opposite direction to
Richmond and Charlottesville to the northwest. There is a general aviation airport in the city, and
commercial service is available at the Newport News-Williamsburg International Airport
approximately 12 miles away. Rail service is available in the city, with twice-daily Amtrak
service.
4.2.2.22.3 Demographics
The total population of Williamsburg in 2000 according to the Census Bureau was 11,998
people. The population had slightly more females (55.1%) than males (44.9%). The median age
of the city‘s population was 22.6 years.
135
http://virginiascan.yesvirginia.org/Admin/CommunityProfiles/Profiles/CityCounty51830.pdf

Page | 142
For the population that self-identified a single race, the city‘s ethnic composition was
79.5% white, 13.3% black or African American, 4.6% Asian, and less than 1% each of the
remaining categories (―some other race,‖ American Indian and Alaska Native, and Native
Hawaiian and other Pacific Islander). Hispanic or Latino people comprise 2.5% of the city‘s
population. In 2000, 94.8% of the population was native born Americans. For those foreign born
people, the most frequently reported areas of birth included Asia (39.1%), Europe (33.8%), and
Northern America (9.8%) The most commonly reported ancestries for city residents included
―other ancestries‖ (20.1%), English (15%), and German (12.4%).
The average household size in 2000 in Williamsburg was 2.07 persons and the average
family size was 2.66 persons. In the city, 58.9% of males 15 years of age and over were married
and 50.1% of females in the same age cohort were married. Single parent families with children
comprised 13.9% of all families in the city. Single person households comprised 37.3% of all
households in the county, and nonfamily households made up 13.9% of all households in the city
in 2000.
In 2000, 14.5% of people 5 years of age and over reported having a disability. The
highest rate of reporting having a disability (35%) occurred among the population 65 years of
age and over.
4.2.2.22.4 Education
The population of Williamsburg is well educated. In 2000, 89.6% of the population had
high school graduate or higher levels of education, and 45% of the population had a bachelor‘s
degree or higher level of education. At that time 21.4% of the city‘s population had graduate or
professional degrees.
4.2.2.22.5 Employment
For the 10,951 people in the city 16 years of age and over in 2000, 67.5% were in the
labor force; 28% were unemployed. At that time, 62.7% of females 16 years of age and over
were in the labor force and 36.5% were employed.
The most common occupations for employed residents of Williamsburg included
management, professional and related occupations (41.7%), sales and office occupations
(28.1%), and service occupations (18%). Farming, fishing and forestry occupations were
reported by 0.2% of the city‘s workers. By class of worker, the composition of the city included
73.4% private wage and salary workers, 22.8% government workers, and 3.8% self-employed
workers in own not incorporated business. There were no unpaid family workers in the city in
2000.

Page | 143
The industries most frequently employing workers who resided in the city included
educational, health and social services (25.6%), arts, entertainment, recreation, accommodation
and food services (22.5%), and retail trade (13.2%). Agriculture, forestry, fishing and hunting,
and mining employed 0.2% of the city‘s worker in 2000.
The City of Williamsburg had no fishing establishments or employees in finfish fishing,
shellfish fishing or seafood product preparation and packaging according to the Bureau of Labor
Statistics136
between 2001 and 2006. There may have individuals working in fishing who were
self employed or otherwise not participating in unemployment insurance upon which the Bureau
of Labor Statistics survey is based who were unreported.
4.2.2.22.6 Income
The median household income in 1999 was $37,093 and the median family income was
$52,358. Households with income under $25,000 comprised 33.9% of all households in the city
in 1999, and families with equivalent incomes comprised 17.9% of families in the city at that
time. Median earnings for male full-time, year-round workers were $28,625, and median
earnings for female full-time, year-round workers were $26,840. The per capita income was
$18,483.
In 1999, 9.3% of families in the city had income below the poverty level. At that time,
37.6% of families with a female householder, no husband present, had income below the poverty
level.
4.2.2.22.7 Housing
In 2000, there were 3,880 total housing units in the city, of which 93.3% were occupied.
Of these occupied units, 44.3% were owner occupied, and 55.7% were renter occupied. The
vacancy rate was 6.7%; for the vacant units, 44.1% were reported to be for seasonal, recreational
or occasional use. The median value of owner occupied units in 2000 was $212,000, and the
median rent for units in the city was $615.
Housing stock in the city is nearly evenly divided between single unit detached structures
and multiple units. Units in excess of 30 years old comprised 47.4% of the city‘s housing stock.
4.2.2.23 York County
York County is in the area locally known as ―The Peninsula.‖ It serves mainly as suburb
of the cities of Newport News, Hampton and Williamsburg, but has businesses of its own. The
portion of York County nearest Williamsburg has been more developed as has the southern York
County mainly as residential uses, but that is changing with development of the Riverfront area
in Yorktown and other developments. In the southeastern area of the county is Seaford, an
unincorporated village that is home to some commercial fishing enterprises, mainly focused
upon the Atlantic sea scallop fishery. No occupied isolated islands are within York County.
Major employers in the county include a computer hardware company, a petroleum
refinery, a manufacturer of floor and roof trusses, a soft drink producer, the Department of
136
http://data.bls.gov/PDQ/outside.jsp?survey=en

Page | 144
Defense, an electrical utility, a discount store, local government, and the local school system. By
and large, though, the county‘s residents commute outward for work, mainly to Newport News
and Hampton.137
4.2.2.23.1 Location
York County is situated on the south side of the York River between the City of Hampton
and James City County. York County also shares boundaries with the City of Williamsburg to
the south of the county and the City of Newport News also along the south of the county. To the
east of the county is the City of Poquoson, which the county shares some political and policing
duties. To the north, across the York River is Gloucester County. The county seat is Yorktown.
4.2.2.23.2 Transportation
The major highways it the county include Interstate 64 (connecting Richmond to
Hampton and Norfolk), U.S. 17(connecting North Carolina to the Washington DC area), State
Highway 199 (which circle the south side of the City of Williamsburg), and State Highway 31
(connecting Wakefield and Williamsburg). The county has rail service, but passenger service is
available in adjoining Williamsburg. The county does not have general aviation or commercial
service, but general aviation is available in Williamsburg, and commercial service is available at
the Newport News-Williamsburg International Airport adjoining the county‘s south end and
more commercial services are available at Norfolk International Airport approximately 20 miles
away or Richmond International Airport approximately30 miles away.
4.2.2.23.3 Demographics
The population of York County in 2000 totaled 56,297 people according to the U.S
Bureau of Census. The population was evenly split between males (49.1%) and females
(50.9%). The median age of the population was 36.5 years.
The ethnic composition of the county in terms of race for those who self-identified a
single race in 2000 was 80% white people, 13.4% black or African American people, 3.2%
Asian people, and less than 1% each of the remaining categories (―some other race,‖ American
Indian and Alaska Native, and Native Hawaiian and other Pacific Islander). At that time, 2% of
the population self-identified as two or more races. Hispanic and Latino people comprised 2.7%
of the population. Native-born Americans comprised 94.8% of the county‘s population. For the
remaining 5.2% of the population that was foreign born, the most frequently reported regions of
birth included Asia (49%), Europe (31.9%), and Latin America (12.8). The most commonly
reported ancestries for residents of the county included ―other ancestries‖ (26.9%), English
(15.8%), and German (15.7%).
The average household size was 2.78 persons, and the average family size was 3.15
persons. In 2000, 68% of males 15 years of age and over in the county were married, and
synchronously 64.1% of females in the same cohort were married. Single parent families with
children under 18 years of age comprised 9% of all families in the county. Single person
households comprised 16.7% of all households in the county and nonfamily households
comprised 3.6% of all households in the county in 2000.
137
http://virginiascan.yesvirginia.org/Admin/CommunityProfiles/Profiles/CityCounty51199.pdf

Page | 145
For the segment of the population 5 years of age and over, 13.3% had a disability. The
age cohort most frequently reporting a disability (34.4%) was the segment of the population 65
years of age and over.
4.2.2.23.4 Employment
Of the 41,855 people in the county 16 years of age and over in 2000, 70.9% were in the
labor force, and 1.8% were unemployed. For females in the age cohort, 63.2% were in the labor
force and 59.3% were employed.
The most common occupation for employed workers residing in the county included
management, professional and related occupations (45.9%), sales and office occupations,
(24.3%), and service occupations (13.1%). Farming, fishing, and forestry occupations comprised
0.3% of those reported. Private wage and salary workers comprised 68.9% of workers in the
county, government workers comprised 25.9%, self-employed workers in own not incorporated
business made up 5% and unpaid family workers made up 0.2% of workers residing in the
county.
The most frequently reported industries in which workers residing in the county
participated included education, health and social services (21.2%), professional, scientific,
management, administrative, and waste management services (11.6%), and public administration
(10.9%). Agriculture, forestry, fishing and hunting, and mining employed 0.2% of the county‘s
workers in 2000.
According to the Bureau of Labor Statistics quarterly survey,138
between 2001 and 2006
there were two shellfish fishing establishments in 2004 and 2005, increasing to three in 2006,
one finfish fishing establishment in 2005, and one seafood product preparation and packaging
establishment from 2004-2006. Data was disclosed on shellfish fishing employees which totaled
10 in 2006, and for whom total wages were $565 thousand. Data were not disclosed for numbers
of employees or wages in the other categories.
4.2.2.23.5 Income
The median household income for York County in 1999 was $57,956, and the median
family income in 1999 was $64,892. Households with incomes under $25,000 comprised 13.7%
of all households in the county in 1999, and families with similar incomes comprised 9.1% of all
families in the county. Median earnings for male full-time, year-round workers residing in the
county were $42,948, and median earnings for female full-time, year-round workers were
$28,713 in 2000. Per capita income for the county was $24,560.
In 1999, 2.7% of families in the county had income below the poverty level. Families
with a female householder, no husband present, were more likely to be in poverty with 12.1% of
these families having income below the poverty level.
138
http://data.bls.gov/PDQ/outside.jsp?survey=en,

Page | 146
4.2.2.23.6 Housing
In 2000, there were 20,701 housing units in York County, of these units, 96.6% were
occupied. Of the occupied units, 75.8% were owner occupied, and 24.2% were renter occupied.
The vacancy rate was 3.4%. Of the vacant units, 10% were reported to be for seasonal,
recreational or occasional use. The median value of owner occupied units in 2000 was $152,700,
and the median rent was $708.
Housing stock in the county was predominantly single family detached units (77.1%) and
secondarily single unit attached units (15.1%). Structures in excess of 30 years old comprised
28.7% of the county‘s housing stock.

Page | 147
5.0 Economic Impact Assessment
5.1 The Economic Impact Assessment Framework
Presently, the reduction fishery, which is limited to OMEGA Protein, is allowed to
harvest 109,020 tons of menhaden from Chesapeake Bay. The fishery is also conducted in the
Atlantic coastal ocean. In the event of harvesting less than the allocated quota, the allowable
harvest may increase up to 122,740 tons in the next year, but only for that one year. Numerous
associations and individuals have argued that either the Bay quota should be reduced or the
reduction fishery prohibited from operations (e.g., the Recreational Fishing Alliance ―4000 RFA
Members Weigh in With ASMFC Seeking More Conservation for Menhaden!;‖ the Coastal
Conservation Association; Greenpeace; and Chesapeake Bay Foundation). Since the reduction
fishery is such an integral part of the economy of Northumberland County and Reedville, VA,
there is a need to assess the economic impacts of reducing the allowable quota or shuttering the
operation.
In this chapter, we examine the economic ramifications of reducing the quota on the
economies of Maryland and Virginia. We focus our examination on the state economies because
information for assessing the economic impact at the county level is extremely limited; it is even
more limited relative to the economy of Reedville. A major limitation is an inability to
adequately determine where products used to harvest and process menhaden were purchased or
originated (e.g., Virginia no longer has an operational oil refinery and the purchase of fuel
involves large leakages from the local economy). In addition, the regional purchase coefficients
(percentage of local demand met by local production) for fish for Northumberland county is
quite low as well as are many of the multipliers for items purchased for harvesting and
processing.
In order to assess the economic impacts for reductions in allowable landings, an
input/output or IO model was developed specifically to reflect economic activities of the
reduction fishery. An IO model facilitates the estimation and assessment of the economic
impacts of economic activity (e.g., the sales, income, and employment generated in a county,
state, or region by OMEGA Protein operations). The model was initially developed using
IMPLAN, an off the shelf IO software package for developing impact models, based on 2006
multipliers and associated coefficients. The model was, subsequently, updated using IMPLAN
for 2008, which became available in late 2009. The 2008 IMPLAN reflects multipliers and
coefficients for 2008.
The economic impacts or contributions are measured in terms of total sales or output,
employment, and income generated by harvesting and processing activities of OMEGA Protein.
The metrics are defined as follows:
Output is the gross sales by businesses within the economic region affected by an activity.
Labor income includes employee compensation (wages and salaries) and proprietors‘ income
(income from self-employment).

Page | 148
Employment is specified on the basis of full-time and part-time jobs. There is significant
part-time and seasonal employment in commercial fishing and many other industries.
Impacts are measured in terms of direct, indirect, and induced impacts:
Direct effects express the economic impacts (for output, income or employment) in the sector
in which the expenditure was initially made. For example, the direct income multiplier for
the harvesting sector would show the total income generated among harvesting employees
and proprietors by demand for services from the harvesting sector. This direct impact would
result, for example, from expenditures made by commercial fishermen to suppliers of gear
and equipment.
Indirect effects measure the economic impacts in the specific sectors providing goods and
services to the directly affected sector. For directly affected harvesters, indirect effects
would include the purchases of products from manufacturers and purchases of accounting
services. These indirect impacts extend throughout the economy as each supplier purchases
from other suppliers in turn. For example, the accounting firms would need to purchase
office supplies and business equipment. Thus, the indirect output multiplier would represent
the total output generated in the various supplier sectors resulting from demand for goods or
services from the direct sector.
Induced effects are the economic activity generated by personal consumption expenditures
by employees in the directly and indirectly affected sectors, as fishermen, accountants, and
other directly and indirectly affected employees spend their paychecks. These household
purchases have additional ―indirect‖ and ―induced‖ effects as well, all of which are defined
as induced effects.
IMPLAN, while having multipliers for fish harvesting and seafood processing and
preparation, does not have multipliers specific for the reduction fishery and production of meal,
oil, and solubles. OMEGA Protein, subsequently, provided detailed data on sales, production
activities, costs, earnings, and employment. This information was used, together with
information available from IMPLAN, to develop custom multipliers and an impact model to
facilitate the estimation and assessment of the economic contributions of menhaden to the
regional economy.
Since the information provided by OMEGA Protein is confidential, it cannot be presented
in detail in this report.139
We can, however, report baseline information provided by OMEGA,
which was used to develop the input/output model and to facilitate the assessment of the
economic impacts of the reduction fishery. All information pertains to production and related
sales activities in 2008. OMEGA provided detailed information on the following revenue and
cost categories, as well as payroll costs (Table 5.1).
139
Individuals interested in obtaining the detailed data should directly contact OMEGA Protein.

Page | 149
Table 5.1. Cost Categories for OMEGA Protein
Category
Ads and promotions
Boat/captain licenses
Environmental fees
Fuel and Lubricants
Business Fees
Insurance
Licenses and Permits
Orthodox union
Property Taxes (County)
Real Estate Rent
Repair and Maintenance
Security
Shipping
Supplies/office/food
Utilities and telephone
Vehicle operating costs
Payroll
Vessel
Plant
Health Care Benefits
Sales
Meal
Oil
Solubles
Baita
Other Productsa
aOMEGA Protein of Reedville, VA had no sales of bait and other menhaden products in
2008.
In 2008, OMEGA Protein employed up to 317 individuals (Table 5.2). Average monthly
wages ranged from $2,248.00 to $6,923.30. The total payroll equaled $11.3 million, which was
nearly evenly divided between vessel and plant payroll. The average payroll, annualized,
equaled $48.4 thousand in 2008. Total revenue equaled $59.9 million and total cost equaled
$31.4 million. Total gross profit equaled $28.5 million in 2008. Total landings of menhaden
equaled 141,100 tons of which approximately 85,000 metric tons were taken from Chesapeake
Bay.

Page | 150
Table 5.2. Employment and Payroll for OMEGA Protein, 2008
Month Employment Vessel
Payroll
Plant
Payroll
Union
Premiums
Average
Payroll Per
Individuala
January 116 552,981.00 250,122.00 97,418.00 6,923.30
February 105 2,880.00 233,131.00 81,090.00 2,247.72
March 99 3,190.00 309,853.00 98,996.00 3,162.05
April 140 11,568.00 405,247.00 98,996.00 2,977.25
May 138 1,433.00 391,025.00 98,996.00 2,843.90
June 288 587,670.00 465,993.00 106,341.00 3,658.55
July 299 600,528.00 541,589.00 86,515.00 3,819.79
August 300 925,800.00 740,527.00 98,050.00 5,554.42
September 307 708,162.00 718,743.00 99,380.00 4,647.90
October 304 729,369.00 501,593.00 99,680.00 4,049.22
November 304 782,794.00 416,951.00 99,090.00 3,946.53
December 317 677,103.00 779,957.00 99,090.00 4,596.40
TOTAL 5,583,478.00 5,754,731.00 1,163,642.00 48,427.04 aExcludes union premiums.
5.2 The Economic Impacts of the Reduction Fishery
In 2008, total landings of Atlantic menhaden from all Atlantic resource areas and
Chesapeake Bay equaled 141,100 metric tons of which 85,000 metric tons were harvested from
Chesapeake Bay. In 2008, vessel and plant operations generated total sales of $88.2 million,
income of $22.8 million, and 519 full and part time jobs for the economies of Maryland and
Virginia (Table 5.3). The majority of the impacts were generated for the Virginia economy
(Table 5.4), and to a large extent, most of the direct and indirect impacts occurred in
Northumberland County (Table 5.5).140
Table 5.3. Baseline Economic Impacts of OMEGA Operations in 2008
Total Direct Indirect Induced Total
Employment (full- and part-time jobs) 299 114 106 519
Income (thousands) $12,562 $6,191 $3,997 $22,750
Output (thousands) $59,919 $15,750 $12,486 $88,155
140
Although we present the impacts of the reduction fishery on the economy of Northumberland, we
caution that county level impacts are subject to more uncertainty than are the impacts for the state. This is because
the various IO coefficients tend to be less accurate at a more detailed level.

Page | 151
Table 5.4. Virginia Baseline Economic Impacts of OMEGA Operations in 2008
Virginia Total Direct Indirect Induced Total
Employment (full- and part-time jobs) 299 114 106 519
Income (thousands) $12,562 $6,191 $3,988 $22,741
Output (thousands) $59,919 $15,750 $12,459 $88,127
Table 5.5. Estimated Economic Impacts of OMEGA Operations, Northumberland
Total Direct Indirect Induced Total
Employment (full- and part-time jobs) 217 75 55 347
Income (thousands) $9,117 $4,487 $2,441 $16,045
Output (thousands) $59,919 $11,639 $7,066 $78,624
5.3 Impacts of Shuttering the Reduction Operations and Reducing the Bay
Quota
If the reduction fishery was prohibited, the economic impacts on the region, state, and
Northumberland County would equal those depicted in Tables 5.3 – 5.5. Total employment for
the region would decline by 519 jobs; income would decline by $22.8 million; and total output
for the regional economy would drop by $88.2 million. A large portion of these impacts would
occur directly in Northumberland County. Northumberland jobs would fall by 347; income
would decline by $16.0 million; and total output for Northumberland‘s economy would decline
by $78.6 million.
In 2008, the largest source of employment in Northumberland County was seafood
production preparation and packaging, which includes reduction operations. Out of 440
industries, commercial fishing ranked 22 in terms of number of jobs. Seafood product
preparation and packaging also generated the largest output and level of employee compensation
for Northumberland County. Average employee compensation for the county equaled
$26,512.00 in 2008, while the average compensation for individuals in the seafood product
preparation and packaging industry earned $50,544.00. Average employee compensation for the
reduction fishery equaled $42,013.00 in 2008.
In comparison, the total number of jobs in Northumberland County equal 4,277 in 2008.
Total output of the economy of the County was $551.7 million, and total employee compensation
equaled $113.4 million. A closure of the reduction operation would reduce total output, income
and employment, respectively, by 14.3 %,14.1% and 8.1 % relative to 2008 economic activity in
Northumberland County.
While it is relatively straightforward to estimate the economic impacts of a complete
prohibition on harvesting menhaden for reduction purchases, it is much more difficult to do so
for reductions in the allowable Bay-wide quota of 109,020 metric tons. Some information is

Page | 152
available, however, to do a limited assessment of reducing the allowable Bay harvest. In 2007,
08, and 09, OMEGA Protein harvested approximately 85,000 metric tons in each year from
Chesapeake Bay (ASMFC, 2008, 2009, and 2010). In 2006, the reduction fishery harvested only
65,000 metric tons of menhaden from the Bay; total landings in 2006 for reduction equaled 157.4
thousand metric tons. The harvest cap was not established, however, until the Fall of 2006.
Total landings by the reduction fishery for each year between 2007 and 2009 equaled,
respectively, 174.5, 141.1, and 143.8 thousand metric tons (NMFS, Sustainable Fisheries
Branch, 2010).
Given that the reduction fishery harvested only 85,000 metric tons from the Bay in each
year between 2007 and 2009, which was below the Bay-wide quota of 109,020 metric tons, in
each year between 2007 and 2009, a reduction of the quota to between 85,000 and 90,000 metric
tons would have little impact on the fishing and processing activities, at least, relative to
production levels of 2008. This may not be the case for 2011, however, with rising fuel prices.
Fuel cost was approximately 17.0 % of total revenues in 2008. In 2011, the price of number 2
diesel is approximately 8.0 % lower than it was in 2008, but 17 % higher than it was in 2010.
Diesel prices have already exceeded the high levels of 2008 in some regions of the nation.
An assessment of the economic ramifications of reducing the Bay quota is complicated
by numerous factors. First, the reduction fishery has not harvested in excess of 85,000 metric
tons from the Bay since the implementation of the Bay quota of 109,020 metric tons in 2006. In
2006, the reduction fleet harvested 92,400 metric tons from the coastal ocean and 65,000 metric
tons from the Bay for a total of 157,400 metric tons. There is considerable uncertainty as to how
the fleet would spatially alter their activities in response to reduced and binding quotas (those
that actually limit harvest levels). This complicates estimating changes in fuel and other costs.
Prices for meal, oil, and solubles are highly volatile and can quickly change in response to
availability and prices of substitute products, which, of course, would affect revenues from the
sale of menhaden-based products. As noted by OMEGA in its annual report, production and
processing production levels and sales are highly variable and fluctuate with yields, weather,
other factors, and global markets, many of which are beyond the control of the company.
Another concern is that if the quota were reduced and subsequently lowered production,
OMEGA Protein could reduce overall operations by taking vessels out of service, reducing the
number of employees, and taking other actions to control costs. We lack information to
determine their actual responses to binding quotas.
Using a combination of input/output and simulation models, we examine possible
production levels and net returns for different levels of quotas. We do not consider any quotas in
excess of 85,000 metric tons simply because the reduction fishery and processing facility
operated between 2006 and 2009 without harvesting in excess of 85,000 metric tons from the
Bay. Also, diesel fuel prices in 2008 were extremely high and the company still earned a gross
profit (sales less annual fixed and operating costs) at the Reedville facility. We consider two
baseline cases: (1) fixed and operating costs remain the same as 2008; and (2) fixed costs remain
the same as 2008 but operating costs change in response to binding levels of quota. The
assessment of the latter cast is based strictly on a simulation model in which variable costs
change in response to changes in landings. We also assume no change in the mix of meal, oil,
and soluble. All 2008 costs, sales, and earnings data were provided by OMEGA Protein.

Page | 153
5.3.1 ECONOMIC IMPACTS OF VARYING BAY QUOTA LEVELS: NO CHANGE IN COST
We initially examine the potential economic changes resulting from different levels of the
quota and assuming no change in fixed and operating costs. We also initially assume no change
in employment, but subsequently relax this assumption with the analysis via the input output
model. Also assumed is no change in the product mix; that is, as landings change, the percentage
of total production of each product would remain unchanged. Impacts are assessed relative to
activities in 2008. In 2008, the reduction fishery harvested 141.1 thousand metric tons of menhaden.
Approximately 85.0 thousand mt was harvested from the Bay, and 56.1 thousand mt was
harvested from the coastal ocean (ASMFC, 2010). Gross sales of meal, oil, and solubles equaled
$59.9 million; total fixed plus operating cost equaled $33.8 million; and gross profit equaled
$26.1 million. The company employed approximately 299 individuals. For the regional
economy (Maryland and Virginia), harvesting and processing activities at the Reedville facility
generated a total of 519 jobs; income of $22.8 million; and a total regional output of $88.2
million. We consider reducing the Bay quota from 109.0 thousand metric tons to 75.0 thousand
mt. We then consider quotas of 50.0 thousand mt, 25.0 thousand mt, and 0.0 mt. In all cases, we
assume the coastal ocean harvest will remain at its observed level of 56.1 thousand mt. For the
0.0 quota case, we also consider a coastal ocean harvest of 92.4 thousand mt, which equals the
coastal ocean harvest by the reduction fishery in 2006. We also impose the assumption that fuel,
food, and repair and maintenance costs will all increase by 25.0 %. A binding quota of 75.0 thousand metric tons with no change in landings from the coastal
ocean would reduce gross profit from $26.1 million to $21.9 million, relative to 2008 activities
(Table 5.6).141
A Bay quota of 50.0 thousand mt reduces gross profit to $11.3 million, and a Bay
quota of 25.0 thousand mt reduces gross profit to $0.6 million. If the company operated with a
0.0 Bay quota and no changes in their coastal ocean harvest or fixed and operating costs, they
would have a net loss of $10.0 million. Alternatively, if the company operated with a 0.0 Bay
quota but harvested their 2006 level of 92.4 thousand mt from the coastal ocean and experienced
a 25.0 % increase in fuel cost, repair and maintenance, and food costs, they would have a gross
profit of $1.5 million.
Table 5.6. Economic Impacts of Bay Quotas and No Changes in Costs
Coastal Ocean Harvest
Bay Quota (1,000’s of metric tons)
Total Landings (1,000’s of metric tons)
Total Sales
$ Millions
Gross Profit
$ Millions
56,100 85,000 141,100 59.9 26.1
56,100 75,000 131,100 55.7 21.9
56,100 50,000 106,100 45.1 11.3
56,100 25,000 81,100 34.4 0.6
56,100 0 56,100 23.8 (-10.0)
92,400 0 92,400 39.2 1.5a
aAssumes a 25.0 % increase in fuel, repair and maintenance, and food expenditures.
141
Estimates of revenues and gross profit are in terms of 2008 dollars.

Page | 154
5.3.2 ECONOMIC IMPACTS OF VARYING BAY QUOTA LEVELS: CHANGE IN COST
In this section, we consider the economic impacts allowing for changes in operating
costs, particularly fuel, repair and maintenance, and food expenditures. We allow these costs to
decline in response to a decline in the quota, but we also consider increases in the base cost of
these expenditure categories, which would likely occur as a result of the company harvesting
larger quantities of menhaden from the coastal ocean. Between 2006 and 2009, the total catch
per week of fishing effort in each year equaled, respectively, 488.8, 524.0, 538.5, and 479.3 tons.
In 2009, the reduction fishery had its lowest catch per week of fishing effort—479.3 tons. Its
total catch and its landings from the Bay and coastal ocean were similar to levels reported in
2008. Mean catch per week of fishing effort in 2008 equaled 538.5, which also coincided with a
low level of stock abundance. The 2008 catch per week of fishing effort was the highest for all
years between 2006 and 2009.
We examine the same level of Bay quotas on menhaden—75.0, 50.0, 25.0, and 0.0
thousand metric tons. We also assume that the reduction fishery will harvest the same quantity
of menhaden from the coastal ocean as reported in 2008—56.1 thousand mt. We also examine
the case of allowing the coastal ocean harvest to equal the highest observed level between 2006
and 2009—141.1 thousand metric tons but impose a 0.0 Bay quota. We assume fuel, repair and
maintenance, and food expenditures will increase in proportion to the increase in number of
weeks required to harvest the total reported landings in 2008—12.4 %.
A Bay quota of 75.0 thousand metric tons was estimated to yield a gross profit of $22.2
million with total sales of $55.7 million (Table 5.7). A quota of 50.0 thousand mt was estimated
to yield a gross profit of $17.2 million with total sales of $45.1 million. A 0.0 quota yielded a
gross profit of $7.3 million with total sales of $23.8 million. For additional comparison, we
assume that the 2008 catch of 141.8 thousand mt was harvested in the coastal ocean but allow the
cost of fuel, repair, and maintenance to increase by 50.0 %. Total sales remain at $59.9 million
but gross profit declines to $18.2 million relative to its reported level of $26.1 million in 2008.
Table 5.7. Economic Impacts of Bay Quotas and Allowing Costs to Change
Coastal Ocean Harvest
Bay Quota (1,000’s of metric tons)
Total Landings (1,000’s of metric
tons)
Total Sales
$ Millions
Gross Profit
$ Millions
56,100 85,000 141,100 59.9 26.1
56,100 75,000 131,100 55.7 22.2
56,100 50,000 106,100 45.1 17.2
56,100 25,000 81,100 34.4 12.3
56,100 0 56,100 23.8 7.3
141,100 0 141,100 59.9 18.2a
aAssumes a 50 % increase in fuel, repair and maintenance, and food expenditures.

Page | 155
5.3.3 ECONOMIC IMPACTS OF FISHERY WIDE QUOTAS
This study was not designed nor did it propose to examine an overall quota on the entire
reduction fishery; that is, it was not intended to examine the economic ramifications of imposing
a quota on either or both the coastal ocean and Bay fishery. The reduction fishery vessels
harvest menhaden as far north as northern New Jersey and as far south as Cape Hatteras. In June
of 2009, vessels were fishing off New Jersey, and in November, vessels were fishing as far south
as Ocracoke Inlet, North Carolina. The area fished depends on numerous factors, such as
availability, abundance, possible yields, market prices, production costs, vessel capability, and
weather. Obviously, the farther offshore or away from Virginia, the higher the production cost.
We consider a series of scenarios for analysis. In all cases, the Bay quota is assumed to
equal zero (i.e., no reduction landings are allowed from the Bay). Our baseline reference is 2008
operations, which includes landings from the Bay. In 2008, the coastal ocean harvest equaled
56.1 thousand metric tons, and the landings from the Bay equaled 85.0 thousand mt. Total sales
equaled $59.9 million, and gross profit (total sales less fixed plus operating costs) was $26.1
million. The Reedville facility operated 10 vessels; employed 299 individuals; and had an
annual payroll of $11.3 million (excludes health care benefits and union premiums). We cannot
account for differences in yields associated with landings from different areas, and thus, assume
the same level of yields as produced in 2008. We also cannot adequately incorporate cost
changes associated with fishing farther away from the Bay; we thus, impose the assumption that
costs or expenditures for fuel, repair and maintenance, and food will increase by 75.0 %. We do,
however, allow operating cost or expenditures for fuel, repair and maintenance, and food to
decline with declines in production levels.142
Under the scenario of taking 141.1 thousand metric tons from the coastal ocean and a
75.0 % increase in costs, gross profit declines from $26.1 million to $14.2 million (Table 5.8).
Total sales are assumed to be the same as reported in 2008. A quota of 100.0 thousand metric
tons reduces total sales and profit to, respectively, $42.5 and $8.8 million. A quota of 50.0
thousand mt allows sales of $21.2 million and a gross profit of $2.3 million.
Table 5.8. Economic Impacts of Coastal Ocean Quotas and Allowing Costs to Change
Coastal Ocean
Harvest
Bay Quota (1,000’s of metric tons)
Total Landings (1,000’s of metric tons)
Total Sales
$ Millions
Gross Profit
$ Millions
141,100 0 141,100 59.9 14.2
100,000 0 100,000 42.5 8.8
75,000 0 75,000 31.8 5.6
50,000 0 50,000 21.2 2.3
142
Total cost of production is typically viewed to be a function of output levels. We assume fixed
proportions or a strictly linear relationship.

Page | 156
5.3.4 IMPACT ASSESSMENT VIA THE INPUT/OUTPUT MODEL
In this section, we present an assessment of the economic impacts of different quotas
based on the input/output model developed for the fishery and processing facility. Impacts
reflect economic activity after imposing the quotas; losses or reductions can be determined via
differences between baseline and estimates contained in Tables 5.9 and 5.10. All data used to
develop the model were provided by OMEGA Protein. These results provide an assessment in
terms of total sales or output, employment, and income generated with each quota. Impacts from
the model are driven by total sales, and thus, we use the sales‘ estimates from the previous two
analyses. We stress, however, that IO models tend to overestimate losses associated with
reductions in economic activity.
A quota of 75.0 thousand metric tons does not have a large impact on either the regional
economy or on the economy of Virginia (Tables 5.9 and 5.10). The regional output is reduced
from $88.2 to $81.9 million; income is reduced from $22.8 to $21.1 million; and employment
declines from 519 to 482 jobs. A quota of 0.0, without additional landings from the coastal
ocean to compensate for the reduction, reduces total output to $35.0 million; employment to 206
jobs; and income to $9.0 million. The impacts are nearly the same for the Commonwealth of
Virginia and for Northumberland County (Table 5.11).

Page | 157
Table 5.9. Economic Impacts on Regional Economy of Bay Quotas (1,000’s of metric tons)
Quota 75,000
Total impacts in VA and MD Direct Indirect Induced Total
Employment (full- and part-time jobs) 278 106 99 482
Income (thousands) $11,677 $5,755 $3,716 $21,148
Output (thousands) $55,700 $14,641 $11,607 $81,948
Quota 50,000
Total impacts in VA and MD Direct Indirect Induced Total
Employment (full- and part-time jobs) 225 86 80 391
Income (thousands) $9,455 $4,660 $3,009 $17,124
Output (thousands) $45,100 $11,855 $9,398 $66,353
Quota 25000
Total impacts in VA and MD Direct Indirect Induced Total
Employment (full- and part-time jobs) 172 65 61 298
Income (thousands) $7,212 $3,554 $2,295 $13,061
Output (thousands) $34,400 $9,042 $7,168 $50,611
Quota 0
Total impacts in VA and MD Direct Indirect Induced Total
Employment (full- and part-time jobs) 119 45 42 206
Income (thousands) $4,990 $2,459 $1,588 $9,036
Output (thousands) $23,800 $6,256 $4,960 $35,015
0+
Total impacts in VA and MD Direct Indirect Induced Total
Employment (full- and part-time jobs) 196 74 70 339
Income (thousands) $8,218 $4,050 $2,615 $14,884
Output (thousands) $39,200 $10,304 $8,169 $57,673

Page | 158
Table 5.10. Economic Impacts on Virginia’s Economy of Bay Quotas
Quota 75000 Direct Indirect Induced Total
Employment (full- and part-time jobs) 278 106 99 482
Income (thousands) $11,677 $5,755 $3,707 $21,140
Output (thousands) $55,700 $14,641 $11,582 $81,923
Quota 50000 Direct Indirect Induced Total
Employment (full- and part-time jobs) 225 86 80 390
Income (thousands) $9,455 $4,660 $3,002 $17,117
Output (thousands) $45,100 $11,855 $9,378 $66,332
Quota 25000 Direct Indirect Induced Total
Employment (full- and part-time jobs) 172 65 61 298
Income (thousands) $7,212 $3,554 $2,289 $13,056
Output (thousands) $34,400 $9,042 $7,153 $50,595
Quota 0 Direct Indirect Induced Total
Employment (full- and part-time jobs) 119 45 42 206
Income (thousands) $4,990 $2,459 $1,584 $9,033
Output (thousands) $23,800 $6,256 $4,949 $35,005
Bay quota 0, 92,400.00 coastal ocean Direct Indirect Induced Total
Employment (full- and part-time jobs) 196 74 69 339
Income (thousands) $8,218 $4,050 $2,609 $14,878
Output (thousands) $39,200 $10,304 $8,151 $57,655
Table 5.11. Economic Impacts of 0.0 Quota on Northumberland’s Economy
0.0 Quota, 56,100 Coastal ocean harvest Direct Indirect Induced Total
Employment (full- and part-time jobs) 119 30 22 171
Income (thousands) $4,994 $1,784 $971 $7,749
Output (thousands) $23,823 $4,628 $2,809 $31,260

Page | 159
5.4 Economic Impacts and the Recreational Fisheries of the Bay
The harvesting of menhaden by the reduction fishery has been identified as a major
concern of recreational anglers. Menhaden is a forage species and heavily consumed by major
game fish species—striped bass, bluefish, spotted sea trout, and weakfish—of the Bay and
coastal ocean. The concern is that removals of menhaden by the reduction fishery will have a
detrimental effect on the experience or quality of recreational angling.
In numerous studies on recreational angling, the number of angling trips is usually
specified as a function of the expected quality or experience of the trip. The quality or
experience is typically perceived or measured in terms of number or size of fish caught (Kirkley
et al., 1998). The demand (D) for number of trips is typically specified to be a function of travel
and fishing cost per trip (C), expected catch of species (EC), and other variables (X) where X is a
vector of other variables believed to influence the demand for trips):
D = f(C,EC,X) + u
where u is an error term assumed to be normally distributed with a mean of 0.0 and a
constant variance. The model has been estimated using both a Tobit or censored regression
approach or a Poisson or negative binomial model.
Unfortunately, we lack sufficient information to estimate the demand for angler trips by
species. Obtaining this information would require a very time consuming and expensive survey
(the cost of such surveys typically exceed $200.0 k). Moreover, the number of restrictions
imposed on recreational fishing over time would seriously complicate the estimation and
assessment of the demand for angler trips relative to each of the four major game fish species.
We, subsequently, examine the possible relationships between recreational catch, in
terms of numbers of fish, and menhaden abundance, and the abundance of striped bass and
weakfish as functions of the abundance of menhaden. We also consider total angler trips as
available from the National Marine Fisheries Service recreational survey. The examination of
possible relationships between recreational catch or resource abundance of the recreational
species and the abundance of menhaden is accomplished with standard causality testing (i.e.,
does X or menhaden abundance cause Y or resource abundance or recreational catch). We close
this section with an analysis of the economic impacts of directed trips in 2008 for striped bass,
weakfish, bluefish, and spotted sea trout.
5.4.1 THE RELATIONSHIP BETWEEN RECREATIONAL CATCH/ABUNDANCE AND
MENHADEN
Much of the debate about the reduction fishery focuses on the potential ramifications of
removals of menhaden by the reduction fishery on recreational angling. In a 1999 study by
Kirkley et al., it was estimated that the economic value to Virginia anglers of harvesting one
more striped bass, bluefish, or sea trout equaled $56.00 if fishing from a boat and $14.00 if
fishing from shore. The economic value on a per trip basis equaled $92.19. If we consider the
estimated economic value per trip in 1999 and adjust it for 2008 constant dollar values and the

Page | 160
number of trips (2.9 million) taken by Maryland and Virginia anglers seeking the four species,
the economic value or net benefits enjoyed by Maryland and Virginia recreational anglers fishing
for striped bass, bluefish, weakfish, and spotted sea trout in 2008 is estimated to equal $349.5
million.143
In a study done by ECO Northwest (2009) on the economic value of sport fishing for
salmon in the Rogue River, it was estimated that the economic value or benefit to anglers fishing
steelhead was $299.00 per fish. It is, therefore, quite apparent the recreational angling generates
large economic benefits to society.
If removals by the reduction fishery do affect the angling experience, and subsequently,
the number of angler trips, the loss in benefits and contributions to the economy could be
substantial. We explore the potential causality between numbers of fish caught, abundance of the
various game fish, and the abundance of menhaden via causality analysis. In this case, we
specify fish catch (game fish species abundance or biomass) as a function of menhaden
abundance:
FCt = α0 + β1*FCt-1 + … + βn FCt-n + δ1 MENABt-1 +…‘+ δm MENABt-m + ut,
where FC is angler catch of species at time t, t-I refers to the t-ith preceding period,
MENAB refers to menhaden stock abundance in preceding time periods. The same specification
is used to examine the possible causal relationship between game fish abundance and menhaden
abundance. If the dependent variables (FCt) are non-stationary (non-constant mean), we take
first differences of all variables (e.g., FCt - FCt-1). The model is estimated by least squares and
the parameters, δ1 through δm, are subject to the statistical test that all equal zero. A conclusion
of not being able to reject the hypothesis implies that there is no causality between menhaden
abundance and the number of game fish caught (or there is no causality between game fish
abundance and the abundance of menhaden).
It was necessary to impose stationarity by taking first differences for all four species—
striped bass, bluefish, weakfish, and spotted sea trout. In all cases, we rejected causality between
game fish abundance and menhaden abundance and game fish catch (numbers) and menhaden
abundance.144
We were unable, however, to examine the relationship between game fish
abundance of bluefish and menhaden abundance and sea trout abundance and menhaden
abundance. The estimates of abundance for bluefish were not sufficiently current, and there
were no estimates of abundance for spotted sea trout.
Although the statistical tests rejected causality, that does not mean there is no relationship
between menhaden and the game fish species. Other models using different functional forms
and other information might indicate a possible relationship. Moreover, causality testing only
documents the possibility of a possible causal relationship between variables.
143
Economic value should not be confused with economic impact. Activities such as recreational angling
have economic value in that anglers would be willing to pay more for the opportunity to fish than they actually have
to pay; anglers receive benefits or value in excess of what they pay to go fishing. We measure the value of these
trade-offs in terms of income change. Value is reflected in peoples‘ willingness to make a trade-off, and the
willingness to make a trade-off is reflected in peoples‘ willingness to pay some amount of money for access to
recreational fishing. 144
We omit the estimates and results of the F-tests for causality because they all rejected the possibility of
causality. These results are available from the author of this report.

Page | 161
5.4.2 THE ECONOMIC IMPACTS OF RECREATIONAL ANGLING
In 2008, Maryland and Virginia anglers of the Bay made an estimated 2.9 million angling
trips directed at striped bass, bluefish, weakfish, and spotted sea trout (Table 5.12). Trips made
from private and rental boats dominated the total number of trips for each state. The estimated
number of directed angler trips for spotted sea trout in Maryland was 0.0; that does not mean,
however, that there were no trips in which spotted sea trout were caught. Often many trips are
taken by anglers in which no specific species was targeted.
In 2008, targeted trips for which a species was caught generated $332.1 million in total
regional sales, $122.3 million in total regional income, and 3,499 jobs for the regional economy
(Tables 5.13 – 5.14). The total output, income, and employment generated for the economy of
Virginia equaled, respectively,$193.8 million, $70.9 million, and 2.1 thousand jobs. Total
output, income, and employment generated by fishing for the Maryland economy in 2008
equaled, respectively, $138.3 million, $51.5 million, and 1.4 thousand jobs.
A simple linear regression of total angler trips against resource abundance of menhaden
suggests a possible causal relationship between angler trips and menhaden abundance for the
years 1981 through 2008.145
The adjusted R2, however, is extremely low—0.18. Moreover,
when the data are examined for causality between resource abundance and angler trips, we are
unable to reject the hypothesis of no causality (i.e., angler trips are not related to resource
abundance). In fact, the regression of angler trips against year provides results with a higher
adjusted R2 value (0.57). The general overall trend is a declining stock abundance for menhaden,
and a generally increasing trend in total angler trips for Maryland and Virginia.
We also find no evidence of a statistical relationship between angler catch, in terms of
numbers of fish, and menhaden abundance (Figures 5.1-5.2). One thing we cannot analyze is
what every angler knows—a school of breaking menhaden usually means there is either a school
of bluefish, striped bass, or some other species feeding on the menhaden. We lack any data to
estimate such a possible relationship, and incorporate such information into an impact
assessment.
145
Total angler trips equals the total number of all angling trips regardless of mode and species sought.
The estimation of species specific directed angler trips typically results in estimates with large errors because the
NMFS recreational survey was not originally designed to estimate direct trips. In recent years, however, NMFS has
given increasing attention to the estimated of directed trips by doing add-on surveys, which do attempt to provide
estimates of directed trips.

Page | 162
Table 5.12. Estimated Number of Directed Angler Trips Selected Game fish Species (NMFS)
Year State Species Mode Total directed effort (caught and/or targeted)
2008 Maryland Bluefish Private/Rental 405,985
2008 Maryland Bluefish Shore 236,774
2008 Maryland Bluefish Party/Charter 24,141
666,900
2008 Maryland Rockfish Private/Rental 783,863
2008 Maryland Rockfish Shore 287,468
2008 Maryland Rockfish Party/Charter 87,901
1,159,232
2008 Maryland Weakfish Private/Rental 12,338
2008 Maryland Weakfish Shore 7,481
19,819
2008 Virginia Bluefish Private/Rental 223,613
2008 Virginia Bluefish Shore 139,644
2008 Virginia Bluefish Party/Charter 1,251
364,508
2008 Virginia Speckled Trout Private/Rental 141,867
2008 Virginia Speckled Trout Shore 18,400
160,267
2008 Virginia Rockfish Private/Rental 386,308
2008 Virginia Rockfish Shore 53,083
2008 Virginia Rockfish Party/Charter 6,607
445,998
2008 Virginia Weakfish Private/Rental 99,357
2008 Virginia Weakfish Shore 17,085
2008 Virginia Weakfish Party/Charter 282
116,724
Virginia 1,087,497
Maryland 1,845,951
Total 2,933,448

Page | 163
Table 5 .13. Economic Impacts of Recreational Angling for Selected Species, Maryland
MARYLAND Direct
Impacts
Indirect
Impacts
Induced
Impacts Total
Rockfish
Employment (full- and part-time jobs) 633 110 286 1,029
Income ($ thousands) 21,939 5,342 11,139 38,420
Output ($ thousands) 54,409 15,517 33,195 103,120
Bluefish
Employment (full- and part-time jobs) 156 24 53 234
Income ($ thousands) 4,236 1,173 2,079 7,488
Output ($ thousands) 10,716 3,388 6,197 20,302
Sea trout/ weakfish
Employment (full- and part-time jobs) 98 16 40 154
Income ($ thousands) 3,192 793 1,570 5,554
Output ($ thousands) 7,883 2,286 4,680 14,848
All speciesaii
Employment (full- and part-time jobs) 62 150 380 1,417
Income ($ thousands) 29,366 7,308 14,788 51,462
Output ($ thousands) 73,007 21,191 44,072 138,270
aThe original data for Maryland did not distinguish among the four species. Impacts were
determined by allocating a total expenditure among the species. As a result, numbers include
impacts for speckled trout, which are not separated out in this table.

Page | 164
Table 5.14. Economic Impacts of Recreational Angling for Selected Species, Virginia
VIRGINIA Direct
Impacts
Indirect
Impacts
Induced
Impacts Total
Rockfish
Employment (full- and part-time jobs) 891 145 416 1,452
Income ($ thousands) 28,688 6,740 14,882 50,311
Output ($ thousands) 70,984 20,382 46,648 138,013
Bluefish
Employment (full- and part-time jobs) 195 27 86 308
Income ($ thousands) 5,764 1,275 3,077 10,116
Output ($ thousands) 13,277 3,710 9,641 26,627
Speckled trout
Employment (full- and part-time jobs) 62 10 26 98
Income ($ thousands) 1,801 471 933 3,205
Output ($ thousands) 4,600 1,422 2,925 8,947
Sea trout/ weakfish
Employment (full- and part-time jobs) 143 24 57 224
Income ($ thousands) 4,111 1,092 2,042 7,245
Output ($ thousands) 10,527 3,280 6,406 20,212
Four species
Employment (full- and part-time jobs) 1,291 206 585 2,082
Income ($ thousands) 40,365 9,578 20,934 70,877
Output ($ thousands) 99,388 28,793 65,619 193,800

Page | 165
Table 5.15. Economic Impacts of Recreational Angling for Selected Species, Region
VIRGINIA plus MARYLAND Direct
Impacts
Indirect
Impacts
Induced
Impacts Total
Rockfish
Employment (full- and part-time jobs) 1,523 255 702 2,480
Income ($ thousands) 50,627 12,082 26,021 88,730
Output ($ thousands) 125,393 35,899 79,842 241,134
Bluefish
Employment (full- and part-time jobs) 351 51 139 541
Income ($ thousands) 10,000 2,448 5,156 17,604
Output ($ thousands) 23,992 7,098 15,839 46,929
Speckled trout
Employment (full- and part-time jobs) 62 10 26 98
Income ($ thousands) 1,801 471 933 3,205
Output ($ thousands) 4,600 1,422 2,925 8,947
Sea trout/ weakfish
Employment (full- and part-time jobs) 241 40 97 379
Income ($ thousands) 7,303 1,884 3,613 12,800
Output ($ thousands) 18,409 5,565 11,086 35,060
Four species
Employment (full- and part-time jobs) 2,178 356 965 3,499
Income ($ thousands) 69,731 16,886 35,723 122,339
Output ($ thousands) 172,395 49,984 109,691 332,070

Page | 166
Figure 5.1. Menhaden Abundance (Numbers of Fish), 1983-2008
Figure 5.2. Number of Angler Trips, Maryland and Virginia, 1983-2008

Page | 167
Although it might be instructive to conduct a series of ―what if‖ type analyses, such
analyses, in the case of relating menhaden abundance to economic impacts, would not be very
informative. That is because there is inadequate information to draw strong conclusions about
the resource abundance and subsequent angler expenditures on each of the four recreational
species. Recreational angling for the four species did generate considerable economic activity
for the region in 2008--$332.1 million in total sales or output, $122.3 million in income, and
nearly 3,500 jobs. Anglers made a total of 2.9 million trips targeting those four species in
2008.
A remaining concern of recreational anglers is the possible inverse relationship between
menhaden and the weight of striped bass. A simple regression of mean weight per fish
between 1990 and resource abundance of menhaden supports a statistically significant
relationship. The adjusted R2 is relatively low (0.38) but significant. The results suggest that
as the abundance of menhaden increases by 1.0 billion fish, the mean weight of recreationally
harvested striped bass increases by 0.05 pounds per fish. This result, however, does not
characterize the entire data series (1990-2008); it primarily applies to the period 2000-2008.
5.5 Review of Impact Assessment
Chapter 5 provided an assessment of the potential economic impacts in terms of sales,
gross profit, employment, and income from imposing different levels of quotas on removals
from the Bay and coastal ocean by the reduction fishery. Despite OMEGA Protein providing
extensive data on costs and earnings of the Reedville facility, data were inadequate to provide a
detailed and precise assessment of how the company might changes operations in response to
different levels of quotas impose on the Bay and coastal ocean fisheries. Also, extreme
uncertainty characterizes many aspects of production and processing activities, such as
weather, market prices, costs, yields, and numerous other factors. For example, if a quota of
0.0 was imposed on the Bay fishery, would OMEGA fish more off New Jersey, more off North
Carolina, or some mix? Would the yields be better or worse than they are from the Bay
fishery? Because of these limitations, we provide an assessment of the potential economic
ramifications of different quotas imposing assumptions on costs, production activities, factory
utilization, and yields.
Under a worst case scenario in which fixed and operating cost remain the same as in
2008, a Bay quota of 23.5 thousand metric tons, but with a catch equal to 56.1 thousand mt
(reported landings of reduction fishery by coastal ocean in 2008), gross profit equals zero. The
same level of operation, but allowing expenditures on fuel, repair and maintenance to increase
by 50 % because of having to fish offshore, but also to decrease with respect to production
levels (i.e., total operating cost is a function of output levels), generates a gross profit of $6.1
million. In this latter situation, employment and payroll declines to 169 individuals and $6.4
million because of the reduction in landings and production of meal, oil, and solubles. Also,
fuel, repair and maintenance, and food expenditures decrease relative to 2008 reported levels.
We also consider a Bay quota of 0.0 and different levels of quotas for the coastal ocean. We
find that coastal ocean quotas of less than 50.0 thousand mt would create economic problems
for the reduction fishery.
In terms of economic activity generated by harvesting and production activities of
OMEGA Protein, Bay quotas would primarily affect the economies of Virginia and

Page | 168
Northumberland County. For example, a Bay quota of 75.0 thousand metric tons would reduce
Virginia employment by 37 jobs, output by $6.2 million, and income by $1.6 million. In 2008,
the economy of Virginia employed 4.8 million individuals, generated a total output of $695.7
billion, and a total income of $242.6 billion. A complete shuttering or the reduction fishery,
however, would have a significant impact on the economy of Northumberland. Total output
and income would each decline by 14.2 %, and total county employment would decrease by
8.1 %.
We were unable to adequately assess the possible changes in economic activity
generated from recreational angling in relation to changes in resource conditions of menhaden.
We were unable to determine any statistical relationship between either catch in numbers or
number of angler trips and the resource abundance of menhaden. We did find a relationship
between the mean weight of recreationally harvested striped bass and the abundance of
menhaden, but the explanatory power of the analysis was quite low and only generally
applicable to the years 2000-2008. Numerous other factors could also help explain the positive
relationship between the mean weight of recreationally harvested striped bass and the
abundance of menhaden.
Despite an inability to determine a relationship between angler trips or expenditures for
each of the species and resource abundance, the four fisheries are relatively important to the
economy of the region. The recreational fisheries for striped bass, spotted sea trout, bluefish,
and weakfish (sea trout) generated total sales of $332.1 million, $122.3 million in income, and
nearly 3,500 jobs for the region.
We stress, however, that while economic impacts are important for decision-making,
the primary consideration should be on net benefits or economic value. Value is reflected in
peoples‘ willingness to make a trade-off, and the willingness to make a trade-off is reflected in
peoples‘ willingness to pay some amount of money for a given state of the environment or for
some level of goods and services. In this study, the primary valuation focus is on determining
the value to society of menhaden. That is, does society receive a higher benefit from the
ecosystem services of menhaden or from the reduction fishery? Or is there some mix of the
two, which generates the maximum benefit to society. The next Chapter, VI, presents a survey
methodology used to obtain data necessary to estimate the economic value of menhaden, and
Chapter VII presents a discussion of the estimated economic value of menhaden.

Page | 169
6.0 Valuation Survey Methodology
6.1 Multi-Mode Chesapeake Bay Menhaden Survey: Data Collection
Report146
The Menhaden survey has 12 versions (3 scenarios and 4 tax amounts) distributed in
Maryland (MD) and Virginia (VA). The multi-mode survey contains three elements: telephone,
mail, and Internet surveys. Data collection followed the ―tailored design method‖ where the
budget allowed (Dillman, Smyth and Christian, 2009). Tasks completed include a review of the
survey instrument, adaptation of the instrument for mail, telephone and Internet surveys and
obtain survey samples. For each mode we will attempt to collect 1080 completed surveys with
approximately 30 cases in each of the 18 cells in each state. The samples were obtained from a
professional firm. We have coded and cleaned data from the survey responses. The data is
available as an MS EXCEL spreadsheet. Other formats are available upon request.
6.1.1 MAIL SURVEY
The mail survey was conducted between May and August 2010. 4319 surveys were
sent to randomly chosen households in Maryland and Virginia. Survey Sampling International
provided the addresses. For the first mailing in late June, 2500 surveys were sent to Maryland
residents and 1819 to Virginia residents. 88 surveys to Maryland and 78 to Virginia were
undeliverable. A second mailing was completed approximately 6 weeks later to all members of
the sample excluding those who responded to the first mailing and excluding undeliverable
addresses from the first mailing. Surveys returned with forwarding addresses from either
mailing were resent to the new address.
Of the 2412 surveys delivered in Maryland, 193 were completed and returned. Of the
1741 surveys delivered to Virginia, 233 were completed and returned. Using the total number
of surveys delivered, the response rates were 8% for Maryland, 13.38% for Virginia and
10.26% overall. The margin of sampling error is 3.8 for Maryland and 4.4 for Virginia.
6.1.2 TELEPHONE SURVEY
The Survey Research Laboratory147
conducted telephone interviews between June 1
and July 22, 2010. A list-assisted method of random digit dialing (RDD) was used to obtain
phone numbers in the sample from Maryland and Virginia. Within selected households,
individuals 18 years and over were chosen at random for participation. We made multiple
attempts at each contact number (as many as 5 attempts) in order increase response rates and
give potentially eligible respondents a reasonable opportunity to participate in the survey.
Moreover, households and individuals who were initially unwilling to participate in the survey
were contacted multiple times in an attempt to persuade them to participate. Calls were
staggered over times of day and days of the week to maximize the chance of making contact
with potential respondents.
146
John Whitehead (Economics), Tanga McDaniel (Economics), Todd Hartman (Government and
Justice Studies), Center for Economic Research and Policy Analysis, Appalachian State University, November 4,
2010.
147
Maintained by the Center for Economic Research & Policy Analysis at Appalachian State University

Page | 170
In total, interviewers called 19,044 numbers, each of which was given a final
disposition based upon standard definitions from the American Association for Public Opinion
Research (AAPOR). A total of 766 interviews were completed (including 57 partially
completed interviews, in which respondents answered at least 10 questions) across the general
population of Maryland and Virginia. By state, there were 323 completed surveys in Maryland
and 390 in Virginia, including 53 interviews for which the state of origin could not be
determined (e.g., respondent refused to identify state, partially completed interview, etc.).
Given these sample sizes, the margin of sampling error with simple random sampling for the
Maryland sample is ±5.45%, and the margin of sampling error for the Virginia sample is
±4.96%,. This means that in 95 out of every 100 samples drawn, estimated proportions based
on the entire sample will be no more than 5.45 or 4.96 percentage points away from their true
values in the population, respectively. It is important to remember that sampling fluctuations
are only one possible source of error in a survey estimate.
As there are several different methods for calculating these response rates, we used two
methods of determining levels of participation in this survey. The Cooperation Rate (AAPOR
Formula #4) was 35.9 percent and the Response Rate (AAPOR Formula #4) was 15.6 percent.
The response rate is based upon the number of complete interviews with reporting units
divided by the number of eligible reporting units in the sample. The cooperation rate is based
upon the proportion of all cases interviewed of all eligible units contacted. The response rate is
a very conservative estimate of participation, while the cooperation rate adjusts for the fact that
many phone numbers in the list are non-eligible.
6.1.3 INTERNET SURVEY
Zoomerang148
is an online survey research firm that has recruited 2 million U.S.
residents to complete online surveys in response to a survey incentive.149
Zoomerang invited a
random subsample of Virginia and Maryland residents to take the Menhaden online survey.
The survey opened on July 16, 2010 and closed on July 19, 2010 with 849 respondents
completing the survey.
148
www.zoomerang.com 149
http://www.zoomerang.com/resources/Panel_Profile_Book.pdf

Page | 171
6.2 Survey Questionnaires and Data Summary
APPENDIX A: VIMS 2010 CODEBOOK/TELEPHONE SURVEY
id Unique Respondent Identifier
mode Survey Mode
(1) Mail (2) Phone (3) Internet
=============================================
knowfish Prior Knowledge of Menhaden
=============================================
Menhaden ["MEN-HAY-DEN"] is a small fish that lives part of the year in Chesapeake Bay
and is part of one coastal stock ranging from Maine to Florida. Menhaden support the
largest commercial fishing industry of Chesapeake Bay. How much did you know about
menhaden before beginning this survey?
( 1 ) A lot
( 2 ) Some
( 3 ) A little
( 4 ) Nothing
( Missing ) Don't Know / Refused
=============================================
overfish Concern About Overfishing
=============================================
The most recent scientific assessment of the population indicates that Atlantic menhaden are
not overfished and overfishing is not occurring on a coast wide basis; however, scientific
knowledge supporting these complex issues is limited. How concerned are you about
overfishing of menhaden?
( 1 ) Very concerned
( 2 ) Somewhat concerned
( 3 ) Not too concerned
( 4 ) Not at all concerned
( Missing ) Don't Know / Refused
=============================================
fishmeal Fish Meal Importance
=============================================
Menhaden is harvested for bait or processed by ―reduction‖ into fish meal and fish oil. Fish
meal is used as feed for livestock, poultry, and farm-raised fish. Soybean and
flaxseed meal is a substitute but the protein in fish meal is especially valuable for
livestock, poultry, and aquaculture feeds. How important do you think it is to use
menhaden to make fish meal for animal feed?

Page | 172
( 1 ) Very important
( 2 ) Somewhat important
( 3 ) Not too important
( 4 ) Not at all important
( Missing) Don't Know / Refused
=============================================
fishoil Fish Oil Importance
=============================================
Fish oil containing omega-3 fatty acids is now increasingly used as a human health
supplement. Soybean and flaxseed oil are substitutes but the American Heart Association
suggests that fish, including menhaden, is the best source of omega-3 fatty acids. How
important do you think it is to use menhaden to make fish oil for human health supplements?
( 1 ) Very important
( 2 ) Somewhat important
( 3 ) Not too important
( 4 ) Not at all important
( Missing ) Don't Know / Refused
=============================================
bait Bait Importance
=============================================
Menhaden is used by recreational fishermen as bait or chum and by commercial fishermen
as bait for American lobster, blue crabs, and crawfish. There are bait and chum substitutes but
many recreational and commercial fishermen prefer menhaden. How important do you think
it is to use menhaden for bait and chum?
( 1 ) Very important
( 2 ) Somewhat important
( 3 ) Not too important
( 4 ) Not at all important
( Missing) Don't Know / Refused
=============================================
game fish Concerned About Game Fish
=============================================
As a forage species, menhaden is a significant part of the diet of predators like striped bass,
other game fish, and sea birds. There is concern that the ―reduction‖ catch removes the
food of these predators. How concerned are you about the impact of menhaden harvesting
on game fish and sea birds?
( 1 ) Very important
( 2 ) Somewhat important
( 3 ) Not too important
( 4 ) Not at all important
( Missing ) Don't Know / Refused

Page | 173
=============================================
ecosystem Concerned About Chesapeake Bay Populations
=============================================There is concern that the
harvesting of menhaden affects their total population living in the Chesapeake Bay. And
there is concern that there are too few juvenile fish to support the ecosystem health of
the Bay. How concerned are you about the impact of menhaden harvesting on ecosystem
health?
( 1 ) Very concerned
( 2 ) Somewhat concerned
( 3 ) Not too concerned
( 4 ) Not at all concerned
( Missing ) Don't Know / Refused
=============================================
waterqual Concerned About Water Quality
=============================================
Various recreational fishing and environmental associations have expressed concern that
the reduced levels of menhaden may negatively affect the water quality of Chesapeake Bay.
The most recent research indicates there is little, if any, relationship between the
population of menhaden and water quality. How concerned are you about the impact of
menhaden harvesting on water quality?
( 1 ) Very concerned
( 2 ) Somewhat concerned
( 3 ) Not too concerned
( 4 ) Not at all concerned
( Missing ) Don't Know / Refused
=============================================
fishery Prior Knowledge About Fishery Management
============================================= The menhaden commercial fishing industry is managed by each state under the direction of
the Atlantic States Marine Fisheries Commission. Historically, menhaden catches
from Chesapeake Bay have varied widely: from about 50,000 to 170,000 tons. This equals
10% to
75% of the coast wide catch of menhaden. How much did you know about the management of
the menhaden fishery prior to this survey?
( 1 ) A lot
( 2 ) Some
( 3 ) A little
( 4 ) Nothing
( Missing ) Don't Know / Refused

Page | 174
=============================================
bayfish Concerned About Chesapeake Bay Overfishing
=============================================
Virginia is the only Atlantic coastal state with an active "reduction" fishery. Virginia vessels
also harvest menhaden along the North Carolina coast and in the ocean along the coasts of
Maryland, Delaware, and New Jersey beyond three miles from shore. Currently,
Chesapeake Bay catches by the Virginia fishery are capped at 100,000 tons per year
through 2013. Since the cap wasinstituted, the total Chesapeake Bay catch by Virginia
vessels has been below the cap. How concerned are you about overfishing of menhaden in
Chesapeake Bay?
( 1 ) Very concerned
( 2 ) Somewhat concerned
( 3 ) Not too concerned
( 4 ) Not at all concerned
( Missing ) Don't Know / Refused
=============================================
industry Commercial Fishing Industry Importance
=============================================
The Virginia reduction fishery industry employs about 10% of the Northumberland
County workforce. In 2008:
The industry had total sales of approximately $60 million.
Gross earnings by individuals working the boats and the plant were about $11 million.
Average income for 300 fishermen and plant workers, which includes management,
was
about $38,000, compared with average earnings of about $27,000 per worker in
the county.
Expenditures to support harvesting and processing activities, which generate both
state and local taxes, were about $19 million.
How important do you think the menhaden commercial fishing industry is to the
Virginia economy?
( 1 ) Very important
( 2 ) Somewhat important
( 3 ) Not too important
( 4 ) Not at all important
( Missing ) Don't Know / Refused
=============================================

Page | 175
random1 RANDOMIZATION 1
=============================================
[ Random Assignment to 1 of 3 Conditions for Management Approach Experiment] ( 1 )
Decrease the harvest by 10%
( 2 ) Decrease the harvest by 50% ( 3 ) Maintain the harvest
decrease Decrease version
(0) random1 = 0
(1) random1 = 1, 2
scope Scope of the policy
( 0 ) random1 = 0( 10 ) random 1 = 1 ( 50 ) random1 = 2
=============================================
economy (Decrease version) Concerned About Virginia Economy
=============================================
Now I'm going to describe a management approach to decrease the harvest of the
commercial menhaden fishing industry by 10% (50%) in Chesapeake Bay.
To decrease the harvest of the menhaden ―reduction‖ fishery in the Bay by 10% will
require more rigorous monitoring. This approach could decrease the total sales of menhaden
by about $6 million, wages and salaries paid to fishermen and processor employees by
about $1.1 million, employment by 30 individuals, and taxes paid to Virginia by
approximately $340,000. The impact on the Maryland economy would be minimal. How
concerned are you about the decrease of menhaden harvest on the Virginia economy?
( 1 ) Very concerned
( 2 ) Somewhat concerned
( 3 ) Not too concerned
( 4 ) Not at all concerned
( Missing ) Don't Know / Refused
=============================================
improve (Decrease version) Likelihood of Improving Ecosystem
=============================================
There is some chance that a decrease in allowable Chesapeake Bay harvest will increase
the stocks of game fish, bring an increase in sea birds and possibly improve the overall
health of the ecosystem. How likely do you think it is that this outcome will be achieved?
( 1 ) Very likely
( 2 ) Somewhat likely
( 3 ) Not too likely
( 4 ) Not at all likely
( Missing ) Don't Know / Refused

Page | 176
=============================================
monitor (Maintenance version) Importance of Monitoring Menhaden
=============================================
Now I'm going to describe a management approach that would maintain the commercial
menhaden fishing industry in Chesapeake Bay.
An option for maintaining the allowable harvest of menhaden at current levels would be
to increase the scientific knowledge about how the menhaden population impacts game
fish, seabirds and water quality. This would require more scientific monitoring. How
important do you think it is to monitor the menhaden catch, game fish, sea birds, and water
quality?
( 1 ) Very important
( 2 ) Somewhat important
( 3 ) Not too important
( 4 ) Not at all important
( Missing ) Don't Know / Refused
=============================================
economy (Maintenance version) Concerned About Virginia Economy
=============================================
Without the monitoring program the menhaden harvest would have to be reduced by 10%.
The reduced harvest could decrease the total sales of menhaden by about $6 million,
wages and salaries paid to fishermen and processor employees by about $1.1 million,
employment by 30 individuals, and taxes paid to Virginia by approximately $340,000. The
impact on the Maryland economy would be minimal. How concerned are you about the
impact of menhaden harvest reduction on the Virginia economy?
( 1 ) Very concerned
( 2 ) Somewhat concerned
( 3 ) Not too concerned
( 4 ) Not at all concerned
( Missing ) Don't Know / Refused
=============================================
random2 RANDOMIZATION 2
=============================================
[ Random Assignment to 1 of 4 Conditions for Bid Experiment] ( 1 ) Tax = $10
( 2 ) Tax = $30 ( 3 ) Tax = $60 ( 4 ) Tax = $90
tax = $10, $30, $60, $90
=============================================
vote ($tax) Proposal Vote
============================================= [10% & 50% Decrease
version]
The program for enforcing the restriction on catch and monitoring is costly and will
require additional state taxes. We estimate that a typical Virginia and Maryland household
would pay about [tax] in higher state taxes each year for the next 10 years.

Page | 177
Suppose that the proposal is put to a referendum vote. If a majority of all households in
Virginia and in Maryland voted for the proposal it would pass, the menhaden harvest would
be decreased and you would have about $10 less to spend each year for the next 10 years. If
a majority of all households in Virginia and Maryland voted against the proposal then it
would fail, commercial fishing of menhaden would remain at current levels and it would
cost you nothing. If the vote were held today, would you vote for or against the proposal to
lower the harvest of menhaden?
[Maintenance version]
The monitoring is costly and will require additional state taxes. We estimate that a
typical Virginia and Maryland household would pay about $10 in higher state taxes each
year for the next 10 years.
Suppose that the proposal is put to a referendum vote. If a majority of all Virginia and
Maryland households voted for the proposal it would pass, scientific monitoring would be
increased and you would have about $10 less to spend each year for the next 10 years. If a
majority of all Virginia and Maryland households voted against the proposal then it would
fail, the monitoring program would not be implemented, the allowable menhaden harvest
would be reduced by 10%, and it would cost you nothing. If the vote were held today
would you vote for or against the proposal?
( 1 ) For
( 2 ) Against
( 3 ) Don't Know / Refused
=============================================
certainty Certainty About Proposal Vote
============================================= How sure are you about your
vote on the proposal?
( 1 ) Very sure
( 2 ) Somewhat sure
( 3 ) Not too sure
( 4 ) Not at all sure
( Missing ) Don't Know / Refused
=============================================
payleast ($1) Proposal Vote [Mode = 2, 3 only]
============================================= Would you be willing to pay
as little as $1 in taxes for the proposal?
( 1 ) Yes
( 2 ) No
( Missing ) Don't Know / Refused

Page | 178
=============================================
pay10 ($10) Proposal Vote [Mode = 2, 3 only]
=============================================
Suppose that a typical household would instead pay about $10. Would you vote for or
against this proposal?
( 1 ) For
( 2 ) Against
( 3 ) Don't Know / Refused
=============================================
pay30 ($30) Proposal Vote [Mode = 2, 3 only]
=============================================Suppose that a typical
household would instead pay about $30. Would you vote for or against the proposal?
( 1 ) For
( 2 ) Against
( 3 ) Don't Know / Refused
=============================================
pay60 ($60) Proposal Vote [Mode = 2, 3 only]
=============================================
Suppose that a typical household would instead pay about $60. Would you vote for or against
the proposal?
( 1 ) For
( 2 ) Against
( 3 ) Don't Know / Refused
=============================================
pay90 ($90) Proposal Vote [Mode = 2, 3 only]
=============================================
Suppose that a typical household would instead pay about $90. Would you vote for or
against this proposal?
( 1 ) For
( 2 ) Against
( 3 ) Don't Know / Refused
=============================================
paymost (Highest $) Proposal Vote [Mode = 2, 3 only]
============================================= What is the highest dollar amount that you would be willing to pay in taxes for the proposal? [
Missing for Don't Know / Refused ]
=============================================
memberships Memberships
=============================================
Now we would like to ask some questions about your recreation activities.

Page | 179
Are you currently a member of any commercial, recreational, environmental or
conservation organization or association?
( 1 ) Yes
( 2 ) No
( Missing ) Don't Know / Refused
=============================================
employment Employed in Fishing
=============================================
Are you currently employed in commercial fishing or a related industry? ( 1 ) Yes
( 2 ) No
( Missing ) Don't Know / Refused
=============================================
distance Distance to Bay
=============================================
For the next several questions, when I say ―Bay‖ I am referring to Chesapeake Bay or a
stream or river that flows into the Bay.
About how far (e.g., miles) is it from your home to the Bay? [ Missing for "Don't Know /
Refused" ]
=============================================
visited Visited Bay
=============================================
Have you ever visited the Bay for the main purpose of outdoor recreation? ( 1 ) Yes
( 2 ) No
( Missing ) Don't Know / Refused
=============================================
bay_fish Bay Activities: Fishing
=============================================
What type of activities did you participate in during your visits to the Bay? [Listed Fishing?] (
1 ) Yes
=============================================
bay_hunt Bay Activities: Hunting
=============================================
What type of activities did you participate in during your visits to the Bay? [Listed Hunting?]
( 1 ) Yes

Page | 180
=============================================
bay_beach Bay Activities: Beach-going
=============================================
What type of activities did you participate in during your visits to the Bay? [Listed
Beach- going?]
( 1 ) Yes
=============================================
bay_boat Bay Activities: Boating
=============================================
What type of activities did you participate in during your visits to the Bay? [Listed Boating?] (
1 ) Yes
=============================================
bay_nature Bay Activities: Nature Observation
=============================================
What type of activities did you participate in during your visits to the Bay? [Listed
Nature
Observation?]
( 1 ) Yes
=============================================
bay_camp Bay Activities: Camping
=============================================
What type of activities did you participate in during your visits to the Bay? [Listed Camping?]
( 1 ) Yes
=============================================
bay_hike Bay Activities: Hiking
=============================================
What type of activities did you participate in during your visits to the Bay? [Listed Hiking?] (
1 ) Yes
=============================================
bay_photo Bay Activities: Bird/Wildlife Photography
=============================================
What type of activities did you participate in during your visits to the Bay? [Listed
Bird/Wildlife
Photography?]
( 1 ) Yes

Page | 181
=============================================
bay_watch Bay Activities: Bird/Wildlife Watching
=============================================
What type of activities did you participate in during your visits to the Bay?
[Listed Bird/Wildlife Watching]
( 1 ) Yes
=============================================
bay_other Bay Activities: Other Activities
=============================================
What type of activities did you participate in during your visits to the Bay?
[Listed Other Activities?]
( 1 ) Yes
=============================================
trips Number of Trips
=============================================
About how many trips did you make from your home to the Bay for the main purpose of
outdoor recreation during the past 12 months?
[ Missing for "Don't Know / Refused" ]
=============================================
daytrips Number of Day Trips
=============================================
About how many of these were day trips where you returned to your home on the same day
that you left?
[ Missing for "Don't Know / Refused" ]
=============================================
household People in Household
=============================================
Finally, we would like to ask some questions about you and your household. These
questions will help us analyze the results of this study. Remember your answers will be
kept strictly anonymous.
How many people, including yourself, normally live in your household? [ Missing for "Don't
Know / Refused" ]

Page | 182
=============================================
under18 People in HH Under 18
=============================================
How many of these people are under 18 years old?
[ Missing for "Don't Know / Refused" ]
=============================================
gender GENDER
=============================================
[Interviewed coded gender ]
( 1 ) Male
( 0 ) Female
=============================================
birthyear Year Born
=============================================
In what year were you born?
[ Missing for "Don't Know / Refused" ]
=============================================
age Respondent‘s Age
=============================================
Calculated by subtracting birth year from 2010
=============================================
education Education
=============================================
What is the highest degree or level of school that you have completed? ( 1 ) Less than 9th
grade
( 2 ) 9th to 12th grade, no diploma
( 3 ) High school graduate (includes equivalency) ( 4 ) Some college, no degree
( 5 ) Associate degree
( 6 ) Bachelor's degree
( 7 ) Graduate or professional degree

Page | 183
=============================================
income Income
=============================================
Ok, I'm going to read off a list of broad income categories, and you just stop me when I get to
the category that best describes your total annual income before taxes?
( 1 ) Less than $10,000
( 2 ) 10 to less than $15,000 ( 3 ) 15 to less than $25,000 ( 4 ) 25 to less than $35,000 (
5 ) 35 to less than $50,000 ( 6 ) 50 to less than $75,000
( 7 ) 75 to less than $100,000
( 8 ) 100 to less than $150,000 ( 9 ) 150 to less than $200,000 ( 10 ) $200,000 or more
( 99 ) Don't Know / Refused
=============================================
state State
=============================================
Do you live in Virginia or Maryland?
( 1 ) Virginia
( 2 ) Maryland
( Missing ) Don't Know / Refused
=============================================
county_va Virginia Counties
=============================================
And what COUNTY or INDEPENDENT CITY do you live in?
=============================================
county_md Maryland Counties
=============================================
And, what county do you live in?
=============================================
zipcode Zip Code
=============================================
What is your current zip code?
[ Missing for "Don't Know / Refused" ]

Page | 184
APPENDIX B: MAIL SURVEY (VERSION 1)

Page | 185
Chesapeake Bay Menhaden:
What are they worth to
you?
Good fishery management decisions require an understanding of
public preferences. A difficult issue facing Chesapeake Bay policy
makers concerns the harvesting of menhaden. The big question is
whether further restrictions on the harvest of menhaden are a good
idea. In other words ―How much of the menhaden stock should be
restricted from harvest?‖ We hope to develop answers to these
questions and others from the information that we gather from you
in this survey.
Please answer all of the questions in this booklet, even if you have
never had experience with menhaden. Then return the completed
questionnaire in the enclosed, self-addressed, stamped envelope.
The information that you provide will be kept strictly anonymous.
Your name will never be placed on your booklet or associated
with your answers. If you have any questions about this survey,
please contact Jim Kirkley (e-mail: [email protected]; phone: 804-
684-7160; FAX: 804-684-7989) or John Whitehead (e-mail:
[email protected]; phone: 828-262-6121).
Thank you for participating in this survey!

Page | 186
Section A. Please read this background information and answer the
related questions about the menhaden fishery.
A1. Menhaden is a small fish that lives part of the year in Chesapeake Bay and
is part of one coastal stock ranging from Maine to Florida. Menhaden support
the largest commercial fishing industry of Chesapeake Bay. How much did
you know about menhaden before this survey?
□ A lot
□ Some
□ A little
□ Nothing
A2. The most recent scientific assessment of the population indicates that
Atlantic menhaden are not overfished and overfishing is not occurring on a
coastwide basis; however, scientific knowledge supporting these complex
issues is limited. How concerned are you about overfishing of menhaden?
□ Very concerned
□ Somewhat concerned
□ Not too concerned
□ Not at all concerned
□ Don‘t know
A3. Menhaden is harvested for bait or processed by ―reduction‖ into fish meal
and fish oil. Fish meal is used as feed for livestock, poultry, and farm-raised fish.
Soybean and flaxseed meal is a substitute but the protein in fish meal is
especially valuable for livestock, poultry, and aquaculture feeds. How
important do you think it is to use menhaden to make fish meal for animal
feed?
□ Very important
□ Somewhat important
□ Not too important
□ Not at all important
□ Don‘t know
A4. Fish oil containing omega-3 fatty acids is now increasingly used as a
human health supplement. Soybean and flaxseed oil are substitutes but the
American Heart Association suggests that fish, including menhaden, is the best
source of omega-3 fatty acids. How important do you think it is to use
menhaden to make fish oil for human health supplements?
□ Very important
□ Somewhat important
□ Not too important
□ Not at all important
□ Don‘t know

Page | 187
A5. Menhaden is used by recreational fishermen as bait or chum and by
commercial fishermen as bait for American lobster, blue crabs, and crawfish.
There are bait and chum substitutes but many recreational and commercial
fishermen prefer menhaden. How important do you think it is to use
menhaden for bait and chum?
□ Very important
□ Somewhat important
□ Not too important
□ Not important at all
□ Don‘t know
A6. As a forage species, menhaden is a significant part of the diet of predators
like striped bass, other game fish and sea birds. There is concern that the
harvesting of menhaden removes the food of these predators. How concerned
are you about the impact of menhaden harvesting on game fish and sea birds?
□ Very concerned
□ Somewhat concerned
□ Not too concerned
□ Not concerned at all
□ Don‘t know
A7. There is concern that the harvesting of menhaden affects their total
population living in Chesapeake Bay. And there is concern that there are too
few juvenile fish to support the ecosystem health of the Bay. How concerned
are you about the impact of menhaden harvesting on ecosystem health?
□ Very concerned
□ Somewhat concerned
□ Not too concerned
□ Not concerned at all
□ Don‘t know
A8. Various recreational fishing and environmental associations have expressed
concern that the reduced levels of menhaden may negatively affect the water
quality of Chesapeake Bay. The most recent research indicates there is
little, if any, relationship between the population of menhaden and water
quality. How concerned are you about the impact of menhaden harvesting on
water quality?
□ Very concerned
□ Somewhat concerned
□ Not too concerned
□ Not concerned at all
□ Don‘t know

Page | 188
Section B. Please answer the next set of questions about management of the
menhaden commercial fishing industry.
B1. The menhaden commercial fishing industry is managed by each state under
the direction of the Atlantic States Marine Fisheries Commission. Historically,
menhaden catches from Chesapeake Bay have varied widely: from about
50,000 to 170,000 tons. This equals 10% to 75% of the coastwide catch of
menhaden. How much did you know about the management of the menhaden
commercial fishing industry before this survey?
□ A lot
□ Some
□ A little
□ Nothing
B2. Virginia is the only Atlantic coastal state with an active ―reduction‖ fishery.
Virginia vessels also harvest menhaden along the North Carolina coast and in
the ocean along the coasts of Maryland, Delaware, and New Jersey beyond
three miles from shore. Currently, Chesapeake Bay catches by the Virginia
fishery are capped at roughly 100,000 tons per year through 2013. Since the
cap was instituted, the total Chesapeake Bay catch by Virginia vessels has been
below the cap. How concerned are you about overfishing of menhaden in
Chesapeake Bay?
□ Very concerned
□ Somewhat concerned
□ Not too concerned
□ Not at all concerned
□ Don‘t know
B3. The Virginia ―reduction‖ fishery and related processing activities
employ about 10% of the Northumberland County, Virginia workforce. In
2008:
• The industry had total sales of approximately $60 million.
• Gross earnings by individuals working the boats and the plant were
about $11 million.
• Average income for 300 fishermen and plant workers, which includes
management, was about $38,000, compared with average earnings of
about $27,000 per worker in the county.
• Expenditures to support harvesting and processing activities, which
generate both state and local taxes, were about $19 million.
B4. How important do you think the menhaden commercial fishing industry is
to the Virginia economy?
□ Very important
□ Somewhat important
□ Not too important
□ Not at all important
□ Don‘t know

Page | 189
Section C. Now we describe a management approach to decrease the
harvest of the commercial menhaden fishing industry by 10% in
Chesapeake Bay.
C1. To decrease the harvest of the menhaden ―reduction‖ fishery in the Bay by
10% will require more rigorous monitoring. This approach could decrease the
total sales of menhaden by about $6 million, wages and salaries paid to
fishermen and processor employees by about $1.1 million, employment by 30
individuals and taxes paid to Virginia by approximately $340,000. The impact
on the Maryland economy would be minimal. How concerned are you about
the decrease of menhaden harvest on the Virginia economy?
□ Very concerned
□ Somewhat concerned
□ Not too concerned
□ Not concerned at all
□ Don‘t know
C2. There is some chance that a decrease in allowable Chesapeake Bay harvest
will increase the stocks of game fish, bring an increase in sea birds and possibly
improve the overall health of the ecosystem. How likely do you think it is that
this outcome will be achieved?
□ Very likely
□ Somewhat likely
□ Not too likely
□ Not at all likely
□ Don‘t know
C3. The program for enforcing the restriction on catch and monitoring is costly
and will require additional state taxes. We estimate that a typical Virginia and
Maryland household would pay about $10 in higher state taxes each year for
the next 10 years.
Suppose that the proposal is put to a referendum vote. If a majority of all
households in Virginia and in Maryland voted for the proposal it would pass,
the menhaden harvest would be decreased and you would have about $10 less
to spend each year for the next 10 years. If a majority of all households in
Virginia and Maryland voted against the proposal then it would fail, commercial
fishing of menhaden would remain at current levels and it would cost you
nothing. If the vote were held today would you vote for or against the
proposal?
□ For
□ Against
□ Don‘t know
C4. How sure are you about your vote on the
proposal?
□ Very sure
□ Somewhat sure
□ Not too sure
□ Not at all sure

Page | 190
Section D. Next, we would like to ask some questions about your
recreation activities.
D1. Are you currently a member of any commercial, recreational,
environmental or conservation organization or association?
□ Yes
□ No
D2. Are you currently employed in commercial fishing or a related industry?
□ Yes
□ No
For the next several questions, when we say “Bay” we are referring to the
Chesapeake Bay or a stream or river that flows into the Bay.
D3. About how far is it from your home to the Bay?
_ Miles
D4. Have you ever visited the Bay for the main purpose of outdoor recreation?
□ Yes
□ No → please skip to the next section of this survey.
D5. What type of activities did you participate in during your visits to the Bay?
(check all that apply)
□ Fishing
□ Hunting
□ Beach Going
□ Boating
□ Nature Observation
□ Camping
□ Hiking
□ Bird / Wildlife Photography
□ Bird / Wildlife Watching
□ Other _
D6. About how many trips did you make from your home to the Bay for the
main purpose of outdoor recreation during the past 12 months?
_ Number of trips → if more than zero go to D7.
→ D7. About how many of these were day trips where you returned to
your home on the same day that you left?
_ Number of day trips

Page | 191
Section E. Finally, we would like to ask some questions about you and your
household. These questions will help us analyze the results of this study.
Your answers will be kept strictly anonymous.
E1. How many people, including yourself, normally live in your household?
_ People → If more than one→ E2. How many of these people are
under the age of 18?
E3. In what year were you born?
19
_ People
E4. Are you male or female?
□ Male
□ Female
E5. Do you live in Virginia or Maryland?
□ Virginia
□ Maryland
E6. What county or independent city do you live in?
E7. What is your current zip code? _ _ _ _
E8. What is the highest degree or level of school that you have completed?
□ Less than 9th grade
□ 9th to 12th grade, no diploma
□ High school graduate (includes
equivalency)
□ Some college, no degree
□ Associate degree
□ Bachelor's degree
□ Graduate or professional
degree
E9. What is your household's total annual income before taxes?
□ Less than $10,000
□ $10,000 to $14,999
□ $15,000 to $24,999
□ $25,000 to $34,999
□ $35,000 to $49,999
□ $50,000 to $74,999
□ $75,000 to $99,999
□ $100,000 to $149,999
□ $150,000 to $199,999
□ $200,000 or more

Page | 192
Thank you for taking the time to complete this survey! The results will
be available soon. You can read a summary at this website:
http://econ.appstate.edu/menhaden.
Is there anything else you would like to tell us about your interest
in menhaden? If so, please use this space.

Page | 193
APPENDIX C: ZOOMERANG INTERNET SURVEY

Page | 194
Last Modified: July 19 2010, 2:16 PM
Design Theme: Fine Line Gray
Language: English
Button Options: Labels
Disable Browser ―Back‖ Button: False
Chesapeake Bay Menhaden: What are they worth to you?
Page 1 - Heading
Good fishery management decisions require an understanding of public preferences. A difficult issue facing Chesapeake Bay policy
makers concerns the harvesting of menhaden. The big question is whether further restrictions on the harvest of menhaden are a good
idea. In other words ―How much of the menhaden stock should be restricted from harvest?‖ We hope to develop answers to these
questions and others from the information that we gather from you in this survey.
Page 1 - Heading
Please read this background information and answer the related questions about the menhaden fishery.
Page 1 - Question 1 - Choice - One Answer (Bullets)
Menhaden is a small fish that lives part of the year in Chesapeake Bay and is part of one coastal stock ranging from Maine to
Florida. Menhaden support the largest commercial fishing industry of Chesapeake Bay. How much did you know about menhaden
before this survey?
A lot
Some
A little
Nothing
Page 1 - Question 2 - Choice - One Answer (Bullets)
The most recent scientific assessment of the population indicates that Atlantic menhaden are not overfished and overfishing is
not occurring on a coastwide basis; however, scientific knowledge supporting these complex issues is limited. How concerned
are you about overfishing of menhaden?
Very concerned
Somewhat concerned
Not too concerned
Not at all concerned
Don‘t know

Page | 195
Page 2 - Question 3 - Choice - One Answer (Bullets)
Menhaden is harvested for bait or processed by ―reduction‖ into fish meal and fish oil. Fish meal is used as feed for livestock, poultry,
and farm-raised fish. Soybean and flaxseed meal is a substitute but the protein in fish meal is especially valuable for livestock,
poultry, and aquaculture feeds. How important do you think it is to use menhaden to make fish
meal for animal feed?
Very important
Somewhat important
Not too important
Not at all important
Don‘t know
Page 2 - Question 4 - Choice - One Answer (Bullets)
Fish oil containing omega-3 fatty acids is now increasingly used as a human health supplement. Soybean and flaxseed oil are
substitutes but the American Heart Association suggests that fish, including menhaden, is the best source of omega-3 fatty acids. How
important do you think it is to use menhaden to make fish oil for human health supplements?
Very important
Somewhat important
Not too important
Not at all important
Don‘t know
Page 3 - Question 5 - Choice - One Answer (Bullets)
Menhaden is used by recreational fishermen as bait or chum and by commercial fishermen as bait for American lobster, blue crabs,
and crawfish. There are bait and chum substitutes but many recreational and commercial fishermen prefer menhaden. How
important do you think it is to use menhaden for bait and chum?
Very important
Somewhat important
Not too important
Not important at all
Don‘t know
Page 3 - Question 6 - Choice - One Answer (Bullets)
As a forage species, menhaden is a significant part of the diet of predators like striped bass, other game fish and sea birds. There is
concern that the harvesting of menhaden removes the food of these predators. How concerned are you about the impact of
menhaden harvesting on game fish and sea birds?
Very concerned
Somewhat concerned
Not too concerned
Not concerned at all
Don‘t know
Page 4 - Question 7 - Choice - One Answer (Bullets)
There is concern that the harvesting of menhaden affects their total population living in Chesapeake Bay. And there is concern that
there are too few juvenile fish to support the ecosystem health of the Bay. How concerned are you about the impact of menhaden
harvesting on ecosystem health?
Very concerned
Somewhat concerned

Page | 196
Not too concerned
Not concerned at all
Don‘t know
Page 4 - Question 8 - Choice - One Answer (Bullets)
Various recreational fishing and environmental associations have expressed concern that the reduced levels of menhaden may
negatively affect the water quality of Chesapeake Bay. The most recent research indicates there is little, if any, relationship between
the population of menhaden and water quality. How concerned are you about the impact of menhaden harvesting on water quality?
Very concerned
Somewhat concerned
Not too concerned
Not concerned at all
Don‘t know
Page 5 - Heading
Please answer the next set of questions about management of the menhaden commercial fishing industry.
Page 5 - Question 9 - Choice - One Answer (Bullets)
The menhaden commercial fishing industry is managed by each state under the direction of the Atlantic States Marine Fisheries
Commission. Historically, menhaden catches from Chesapeake Bay have varied widely: from about 50,000 to 170,000 tons. This
equals 10% to 75% of the coastwide catch of menhaden. How much did you know about the management of the menhaden
commercial fishing industry before this survey?
A lot
Some
A little
Nothing
Page 5 - Question 10 - Choice - One Answer (Bullets)
Virginia is the only Atlantic coastal state with an active ―reduction‖ fishery. Virginia vessels also harvest menhaden along the North
Carolina coast and in the ocean along the coasts of Maryland, Delaware, and New Jersey beyond three miles from shore. Currently,
Chesapeake Bay catches by the Virginia fishery are capped at roughly 100,000 tons per year through 2013. Since the cap was
instituted, the total Chesapeake Bay catch by Virginia vessels has been below the cap. How concerned are you about overfishing of
menhaden in Chesapeake Bay?
Very concerned
Somewhat concerned
Not too concerned
Not at all concerned
Don‘t know

Page | 197
Page 6 - Heading
The Virginia ―reduction‖ fishery and related processing activities employ about 10% of the Northumberland County, Virginia
workforce. In 2008:
The industry had total sales of approximately $60 million.
Gross earnings by individuals working the boats and the plant were about $11 million.
Average income for 300 fishermen and plant workers, which includes management, was about $38,000, compared with average
earnings of about $27,000 per worker in the county.
Expenditures to support harvesting and processing activities, which generate both state and local taxes, were about $19 million.
Page 6 - Question 11 - Choice - One Answer (Bullets)
How important do you think the menhaden commercial fishing industry is to the Virginia economy?
Very important
Somewhat important
Not too important
Not at all important
Don‘t know
Page 7 - Heading
The next two questions are about when you were born.
Page 7 - Question 12 - Open Ended - One or More Lines with Prompt [Mandatory]
In what year were you born? (enter the last two digits of the year; e.g., if you were born in 1958, enter 58)
19
Page 7 - Question 13 - Choice - One Answer (Bullets) [Mandatory]
In what month were you born?
January [Skip to 8]
February [Skip to 28]
March [Skip to 24]
April [Skip to 20]
May [Skip to 14]
June [Skip to 26]
July [Skip to 18]
August [Skip to 12]
September [Skip to 22]
October [Skip to 30]
November [Skip to 10]
December [Skip to 16]
Page 8 - Heading
Now we describe a management approach to decrease the harvest of the commercial menhaden fishing industry by 10%
in Chesapeake Bay.

Page | 198
Page 8 - Question 14 - Choice - One Answer (Bullets)
To decrease the harvest of the menhaden ―reduction‖ fishery in the Bay by 10% will require more rigorous monitoring. This approach
could decrease the total sales of menhaden by about $6 million, wages and salaries paid to fishermen and processor employees by
about $1.1 million, employment by 30 individuals and taxes paid to Virginia by approximately
$340,000. The impact on the Maryland economy would be minimal. How concerned are you about the decrease of menhaden
harvest on the Virginia economy?
Very concerned
Somewhat concerned
Not too concerned
Not concerned at all
Don‘t know
Page 8 - Question 15 - Choice - One Answer (Bullets)
There is some chance that a decrease in allowable Chesapeake Bay harvest will increase the stocks of game fish, bring an increase in
sea birds and possibly improve the overall health of the ecosystem. How likely do you think it is that this outcome will be
achieved?
Very likely
Somewhat likely
Not too likely
Not at all likely
Don‘t know
Page 9 - Heading
The program for enforcing the restriction on catch and monitoring is costly and will require additional state taxes. We estimate that a
typical Virginia and Maryland household would pay about $10 in higher state taxes each year for the next
10 years.
Page 9 - Question 16 - Choice - One Answer (Bullets) [Mandatory]
Suppose that the proposal is put to a referendum vote. If a majority of all households in Virginia and in Maryland voted for the
proposal it would pass, the menhaden harvest would be decreased and you would have about $10 less to spend each year for the next
10 years. If a majority of all households in Virginia and Maryland voted against the proposal then it
would fail, commercial fishing of menhaden would remain at current levels and it would cost you nothing. If the vote were held
today would you vote for or against the proposal?
For [Skip to 32]
Against [Skip to 39]
Don't know [Skip to 39]
Page 9 - Question 17 - Choice - One Answer (Bullets) [Mandatory]
How sure are you about your vote on the proposal?
Very sure
Somewhat sure
Not too sure
Not sure at all
Page 10 - Heading
Now we describe a management approach to decrease the harvest of the commercial menhaden fishing industry by 10%
in Chesapeake Bay.

Page | 199
Page 10 - Question 18 - Choice - One Answer (Bullets)
To decrease the harvest of the menhaden ―reduction‖ fishery in the Bay by 10% will require more rigorous monitoring. This approach
could decrease the total sales of menhaden by about $6 million, wages and salaries paid to fishermen and processor employees by
about $1.1 million, employment by 30 individuals and taxes paid to Virginia by approximately
$340,000. The impact on the Maryland economy would be minimal. How concerned are you about the decrease of menhaden
harvest on the Virginia economy?
Very concerned
Somewhat concerned
Not too concerned
Not concerned at all
Don‘t know
Page 10 - Question 19 - Choice - One Answer (Bullets)
There is some chance that a decrease in allowable Chesapeake Bay harvest will increase the stocks of game fish, bring an increase in
sea birds and possibly improve the overall health of the ecosystem. How likely do you think it is that this outcome will be
achieved?
Very likely
Somewhat likely
Not too likely
Not at all likely
Don‘t know
Page 11 - Heading
The program for enforcing the restriction on catch and monitoring is costly and will require additional state taxes. We estimate that
a typical Virginia and Maryland household would pay about $30 in higher state taxes each year for the next
10 years.
Page 11 - Question 20 - Choice - One Answer (Bullets) [Mandatory]
Suppose that the proposal is put to a referendum vote. If a majority of all households in Virginia and in Maryland voted for the
proposal it would pass, the menhaden harvest would be decreased and you would have about $30 less to spend each year for the next
10 years. If a majority of all households in Virginia and Maryland voted against the proposal then it
would fail, commercial fishing of menhaden would remain at current levels and it would cost you nothing. If the vote were held
today would you vote for or against the proposal?
For [Skip to 33]
Against [Skip to 38]
Don't know [Skip to 38]
Page 11 - Question 21 - Choice - One Answer (Bullets) [Mandatory]
How sure are you about your vote on the proposal?
Very sure
Somewhat sure
Not too sure
Not sure at all
Page 12 - Heading
Now we describe a management approach to decrease the harvest of the commercial menhaden fishing industry by 10%
in Chesapeake Bay.

Page | 200
Page 12 - Question 22 - Choice - One Answer (Bullets)
To decrease the harvest of the menhaden ―reduction‖ fishery in the Bay by 10% will require more rigorous monitoring. This approach
could decrease the total sales of menhaden by about $6 million, wages and salaries paid to fishermen and processor employees by
about $1.1 million, employment by 30 individuals and taxes paid to Virginia by approximately
$340,000. The impact on the Maryland economy would be minimal. How concerned are you about the decrease of menhaden
harvest on the Virginia economy?
Very concerned
Somewhat concerned
Not too concerned
Not concerned at all
Don‘t know
Page 12 - Question 23 - Choice - One Answer (Bullets)
There is some chance that a decrease in allowable Chesapeake Bay harvest will increase the stocks of game fish, bring an increase in
sea birds and possibly improve the overall health of the ecosystem. How likely do you think it is that this outcome will be
achieved?
Very likely
Somewhat likely
Not too likely
Not at all likely
Don‘t know
Page 13 - Heading
The program for enforcing the restriction on catch and monitoring is costly and will require additional state taxes. We estimate that a
typical Virginia and Maryland household would pay about $60 in higher state taxes each year for the next
10 years.
Page 13 - Question 24 - Choice - One Answer (Bullets) [Mandatory]
Suppose that the proposal is put to a referendum vote. If a majority of all households in Virginia and in Maryland voted for the
proposal it would pass, the menhaden harvest would be decreased and you would have about $60 less to spend each year for the next
10 years. If a majority of all households in Virginia and Maryland voted against the proposal then it
would fail, commercial fishing of menhaden would remain at current levels and it would cost you nothing. If the vote were held
today would you vote for or against the proposal?
For [Skip to 34]
Against [Skip to 37]
Don't know [Skip to 37]
Page 13 - Question 25 - Choice - One Answer (Bullets) [Mandatory]
How sure are you about your vote on the proposal?
Very sure
Somewhat sure
Not too sure
Not sure at all
Page 14 - Heading
Now we describe a management approach to decrease the harvest of the commercial menhaden fishing industry by 10%
in Chesapeake Bay.

Page | 201
Page 14 - Question 26 - Choice - One Answer (Bullets)
To decrease the harvest of the menhaden ―reduction‖ fishery in the Bay by 10% will require more rigorous monitoring. This approach
could decrease the total sales of menhaden by about $6 million, wages and salaries paid to fishermen and processor employees by
about $1.1 million, employment by 30 individuals and taxes paid to Virginia by approximately
$340,000. The impact on the Maryland economy would be minimal. How concerned are you about the decrease of menhaden
harvest on the Virginia economy?
Very concerned
Somewhat concerned
Not too concerned
Not concerned at all
Don‘t know
Page 14 - Question 27 - Choice - One Answer (Bullets)
There is some chance that a decrease in allowable Chesapeake Bay harvest will increase the stocks of game fish, bring an increase in
sea birds and possibly improve the overall health of the ecosystem. How likely do you think it is that this outcome will be
achieved?
Very likely
Somewhat likely
Not too likely
Not at all likely
Don‘t know
Page 15 - Heading
The program for enforcing the restriction on catch and monitoring is costly and will require additional state taxes. We estimate that a
typical Virginia and Maryland household would pay about $90 in higher state taxes each year for the next
10 years.
Page 15 - Question 28 - Choice - One Answer (Bullets) [Mandatory]
Suppose that the proposal is put to a referendum vote. If a majority of all households in Virginia and in Maryland voted for the
proposal it would pass, the menhaden harvest would be decreased and you would have about $90 less to spend each year for the next
10 years. If a majority of all households in Virginia and Maryland voted against the proposal then it
would fail, commercial fishing of menhaden would remain at current levels and it would cost you nothing. If the vote were held
today would you vote for or against the proposal?
For [Skip to 35]
Against [Skip to 36]
Don't know [Skip to 36]
Page 15 - Question 29 - Choice - One Answer (Bullets) [Mandatory]
How sure are you about your vote on the proposal?
Very sure
Somewhat sure
Not too sure
Not sure at all
Page 16 - Heading
Now we describe a management approach to decrease the harvest of the commercial menhaden fishing industry by 50%
in Chesapeake Bay.

Page | 202
Page 16 - Question 30 - Choice - One Answer (Bullets)
To decrease the harvest of the menhaden ―reduction‖ fishery in the Bay by 50% will require more rigorous monitoring. This
approach could decrease the total sales of menhaden by about $30 million, wages and salaries paid to fishermen and processor
employees by about $5.7 million, employment by 150 individuals and taxes paid to Virginia by approximately $1.7 million. The
impact on the Maryland economy would be minimal. How concerned are you about the decrease of menhaden harvest on the
Virginia economy?
Very concerned
Somewhat concerned
Not too concerned
Not concerned at all
Don‘t know
Page 16 - Question 31 - Choice - One Answer (Bullets)
There is some chance that a decrease in allowable Chesapeake Bay harvest will increase the stocks of game fish, bring an increase in
sea birds and possibly improve the overall health of the ecosystem. How likely do you think it is that this outcome will be
achieved?
Very likely
Somewhat likely
Not too likely
Not at all likely
Don‘t know
Page 17 - Heading
The program for enforcing the restriction on catch and monitoring is costly and will require additional state taxes. We estimate that a
typical Virginia and Maryland household would pay about $10 in higher state taxes each year for the next
10 years.
Page 17 - Question 32 - Choice - One Answer (Bullets) [Mandatory]
Suppose that the proposal is put to a referendum vote. If a majority of all households in Virginia and in Maryland voted for the
proposal it would pass, the menhaden harvest would be decreased and you would have about $10 less to spend each year for the next
10 years. If a majority of all households in Virginia and Maryland voted against the proposal then it
would fail, commercial fishing of menhaden would remain at current levels and it would cost you nothing. If the vote were held
today would you vote for or against the proposal?
For [Skip to 32]
Against [Skip to 39]
Don't know [Skip to 39]
Page 17 - Question 33 - Choice - One Answer (Bullets) [Mandatory]
How sure are you about your vote on the proposal?
Very sure
Somewhat sure
Not too sure
Not sure at all
Page 18 - Heading
Now we describe a management approach to decrease the harvest of the commercial menhaden fishing industry by 50%
in Chesapeake Bay.

Page | 203
Page 18 - Question 34 - Choice - One Answer (Bullets)
To decrease the harvest of the menhaden ―reduction‖ fishery in the Bay by 50% will require more rigorous monitoring. This
approach could decrease the total sales of menhaden by about $30 million, wages and salaries paid to fishermen and processor
employees by about $5.7 million, employment by 150 individuals and taxes paid to Virginia by approximately $1.7 million. The
impact on the Maryland economy would be minimal. How concerned are you about the decrease of menhaden harvest on the
Virginia economy?
Very concerned
Somewhat concerned
Not too concerned
Not concerned at all
Don‘t know
Page 18 - Question 35 - Choice - One Answer (Bullets)
There is some chance that a decrease in allowable Chesapeake Bay harvest will increase the stocks of game fish, bring an increase in
sea birds and possibly improve the overall health of the ecosystem. How likely do you think it is that this outcome will be
achieved?
Very likely
Somewhat likely
Not too likely
Not at all likely
Don‘t know
Page 19 - Heading
The program for enforcing the restriction on catch and monitoring is costly and will require additional state taxes. We estimate that a
typical Virginia and Maryland household would pay about $30 in higher state taxes each year for the next
10 years.
Page 19 - Question 36 - Choice - One Answer (Bullets) [Mandatory]
Suppose that the proposal is put to a referendum vote. If a majority of all households in Virginia and in Maryland voted for the
proposal it would pass, the menhaden harvest would be decreased and you would have about $30 less to spend each year for the next
10 years. If a majority of all households in Virginia and Maryland voted against the proposal then it
would fail, commercial fishing of menhaden would remain at current levels and it would cost you nothing. If the vote were held
today would you vote for or against the proposal?
For [Skip to 33]
Against [Skip to 38]
Don't know [Skip to 38]
Page 19 - Question 37 - Choice - One Answer (Bullets) [Mandatory]
How sure are you about your vote on the proposal?
Very sure
Somewhat sure
Not too sure
Not sure at all
Page 20 - Heading
Now we describe a management approach to decrease the harvest of the commercial menhaden fishing industry by 50%
in Chesapeake Bay.

Page | 204
Page 20 - Question 38 - Choice - One Answer (Bullets)
To decrease the harvest of the menhaden ―reduction‖ fishery in the Bay by 50% will require more rigorous monitoring. This
approach could decrease the total sales of menhaden by about $30 million, wages and salaries paid to fishermen and processor
employees by about $5.7 million, employment by 150 individuals and taxes paid to Virginia by approximately $1.7 million. The
impact on the Maryland economy would be minimal. How concerned are you about the decrease of menhaden harvest on the
Virginia economy?
Very concerned
Somewhat concerned
Not too concerned
Not concerned at all
Don‘t know
Page 20 - Question 39 - Choice - One Answer (Bullets)
There is some chance that a decrease in allowable Chesapeake Bay harvest will increase the stocks of game fish, bring an increase in
sea birds and possibly improve the overall health of the ecosystem. How likely do you think it is that this outcome will be
achieved?
Very likely
Somewhat likely
Not too likely
Not at all likely
Don‘t know
Page 21 - Heading
The program for enforcing the restriction on catch and monitoring is costly and will require additional state taxes. We estimate that a
typical Virginia and Maryland household would pay about $60 in higher state taxes each year for the next
10 years.
Page 21 - Question 40 - Choice - One Answer (Bullets) [Mandatory]
Suppose that the proposal is put to a referendum vote. If a majority of all households in Virginia and in Maryland voted for the
proposal it would pass, the menhaden harvest would be decreased and you would have about $60 less to spend each year for the next
10 years. If a majority of all households in Virginia and Maryland voted against the proposal then it
would fail, commercial fishing of menhaden would remain at current levels and it would cost you nothing. If the vote were held
today would you vote for or against the proposal?
For [Skip to 34]
Against [Skip to 37]
Don't know [Skip to 37]
Page 21 - Question 41 - Choice - One Answer (Bullets) [Mandatory]
How sure are you about your vote on the proposal?
Very sure
Somewhat sure
Not too sure
Not sure at all
Page 22 - Heading
Now we describe a management approach to decrease the harvest of the commercial menhaden fishing industry by 50%
in Chesapeake Bay.

Page | 205
Page 22 - Question 42 - Choice - One Answer (Bullets)
To decrease the harvest of the menhaden ―reduction‖ fishery in the Bay by 50% will require more rigorous monitoring. This
approach could decrease the total sales of menhaden by about $30 million, wages and salaries paid to fishermen and processor
employees by about $5.7 million, employment by 150 individuals and taxes paid to Virginia by approximately $1.7 million. The
impact on the Maryland economy would be minimal. How concerned are you about the decrease of menhaden harvest on the
Virginia economy?
Very concerned
Somewhat concerned
Not too concerned
Not concerned at all
Don‘t know
Page 22 - Question 43 - Choice - One Answer (Bullets)
There is some chance that a decrease in allowable Chesapeake Bay harvest will increase the stocks of game fish, bring an increase in
sea birds and possibly improve the overall health of the ecosystem. How likely do you think it is that this outcome will be
achieved?
Very likely
Somewhat likely
Not too likely
Not at all likely
Don‘t know
Page 23 - Heading
The program for enforcing the restriction on catch and monitoring is costly and will require additional state taxes. We estimate that a
typical Virginia and Maryland household would pay about $90 in higher state taxes each year for the next
10 years.
Page 23 - Question 44 - Choice - One Answer (Bullets) [Mandatory]
Suppose that the proposal is put to a referendum vote. If a majority of all households in Virginia and in Maryland voted for the
proposal it would pass, the menhaden harvest would be decreased and you would have about $90 less to spend each year for the next
10 years. If a majority of all households in Virginia and Maryland voted against the proposal then it
would fail, commercial fishing of menhaden would remain at current levels and it would cost you nothing. If the vote were held
today would you vote for or against the proposal?
For [Skip to 35]
Against [Skip to 36]
Don't know [Skip to 36]
Page 23 - Question 45 - Choice - One Answer (Bullets) [Mandatory]
How sure are you about your vote on the proposal?
Very sure
Somewhat sure
Not too sure
Not sure at all
Page 24 - Heading
Now we describe a management approach that would maintain the commercial menhaden fishing industry in the
Chesapeake Bay.

Page | 206
Page 24 - Question 46 - Choice - One Answer (Bullets)
An option for maintaining the allowable harvest of menhaden at current levels would be to increase the scientific knowledge about
how the menhaden population impacts game fish, seabirds and water quality. This would require more scientific monitoring of
menhaden catch as well as game fish, sea birds and water quality. How important do you think it is to monitor menhaden catch, game
fish, sea birds and water quality?
Very important
Somewhat important
Not too important
Not important at all
Don‘t know
Page 24 - Question 47 - Choice - One Answer (Bullets)
Suppose that without the monitoring program the menhaden harvest would be reduced by 10%. The reduced harvest could
decrease the total sales of menhaden by about $6 million, wages and salaries paid to fishermen and processor employees by about
$1.1 million, employment by 30 individuals, and taxes paid to Virginia by approximately $340,000. The impact on the Maryland
economy would be minimal. How concerned are you about the decrease of menhaden harvest on the Virginia economy?
Very concerned
Somewhat concerned
Not too concerned
Not concerned at all
Don‘t know
Page 25 - Heading
The monitoring program is costly and will require additional state taxes. We estimate that a typical Virginia and Maryland
household would pay about $10 in higher state taxes each year for the next 10 years.
Page 25 - Question 48 - Choice - One Answer (Bullets) [Mandatory]
Suppose that the proposal is put to a referendum vote. If a majority of all households in Virginia and Maryland voted for the
proposal it would pass, scientific monitoring would be increased and you would have about $10 less to spend each year for the next
10 years. If a majority of all Virginia and Maryland households voted against the proposal then it would fail. The monitoring
program would not be implemented, the allowable menhaden harvest would be reduced by 10% and it would cost you nothing. If the
vote were held today would you vote for or against the proposal?
For [Skip to 32]
Against [Skip to 39]
Don't know [Skip to 39]
Page 25 - Question 49 - Choice - One Answer (Bullets) [Mandatory]
How sure are you about your vote on the proposal?
Very sure
Somewhat sure
Not too sure
Not sure at all
Page 26 - Heading
Now we describe a management approach that would maintain the commercial menhaden fishing industry in the
Chesapeake Bay.

Page | 207
Page 26 - Question 50 - Choice - One Answer (Bullets)
An option for maintaining the allowable harvest of menhaden at current levels would be to increase the scientific knowledge about
how the menhaden population impacts game fish, seabirds and water quality. This would require more scientific monitoring of
menhaden catch as well as game fish, sea birds and water quality. How important do you think it is to monitor menhaden catch, game
fish, sea birds and water quality?
Very important
Somewhat important
Not too important
Not important at all
Don‘t know
Page 26 - Question 51 - Choice - One Answer (Bullets)
Suppose that without the monitoring program the menhaden harvest would be reduced by 10%. The reduced harvest could
decrease the total sales of menhaden by about $6 million, wages and salaries paid to fishermen and processor employees by about
$1.1 million, employment by 30 individuals, and taxes paid to Virginia by approximately $340,000. The impact on the Maryland
economy would be minimal. How concerned are you about the decrease of menhaden harvest on the Virginia economy?
Very concerned
Somewhat concerned
Not too concerned
Not concerned at all
Don‘t know
Page 27 - Heading
The monitoring program is costly and will require additional state taxes. We estimate that a typical Virginia and Maryland
household would pay about $30 in higher state taxes each year for the next 10 years.
Page 27 - Question 52 - Choice - One Answer (Bullets) [Mandatory]
Suppose that the proposal is put to a referendum vote. If a majority of all households in Virginia and Maryland voted for the proposal
it would pass, scientific monitoring would be increased and you would have about $30 less to spend each year for the next 10 years.
If a majority of all Virginia and Maryland households voted against the proposal then it would fail. The monitoring program would
not be implemented, the allowable menhaden harvest would be reduced by 10% and it would cost you nothing. If the vote were held
today would you vote for or against the proposal?
For [Skip to 33]
Against [Skip to 38]
Don't know [Skip to 38]
Page 27 - Question 53 - Choice - One Answer (Bullets) [Mandatory]
How sure are you about your vote on the proposal?
Very sure
Somewhat sure
Not too sure
Not sure at all
Page 28 - Heading
Now we describe a management approach that would maintain the commercial menhaden fishing industry in the
Chesapeake Bay.

Page | 208
Page 28 - Question 54 - Choice - One Answer (Bullets)
An option for maintaining the allowable harvest of menhaden at current levels would be to increase the scientific knowledge about
how the menhaden population impacts game fish, seabirds and water quality. This would require more scientific monitoring of
menhaden catch as well as game fish, sea birds and water quality. How important do you think it is to monitor menhaden catch, game
fish, sea birds and water quality?
Very important
Somewhat important
Not too important
Not important at all
Don‘t know
Page 28 - Question 55 - Choice - One Answer (Bullets)
Suppose that without the monitoring program the menhaden harvest would be reduced by 10%. The reduced harvest could
decrease the total sales of menhaden by about $6 million, wages and salaries paid to fishermen and processor employees by about
$1.1 million, employment by 30 individuals, and taxes paid to Virginia by approximately $340,000. The impact on the Maryland
economy would be minimal. How concerned are you about the decrease of menhaden harvest on the Virginia economy?
Very concerned
Somewhat concerned
Not too concerned
Not concerned at all
Don‘t know
Page 29 - Heading
The monitoring program is costly and will require additional state taxes. We estimate that a typical Virginia and Maryland
household would pay about $60 in higher state taxes each year for the next 10 years.
Page 29 - Question 56 - Choice - One Answer (Bullets) [Mandatory]
Suppose that the proposal is put to a referendum vote. If a majority of all households in Virginia and Maryland voted for the proposal
it would pass, scientific monitoring would be increased and you would have about $60 less to spend each year for the next 10 years.
If a majority of all Virginia and Maryland households voted against the proposal then it would fail. The monitoring program would
not be implemented, the allowable menhaden harvest would be reduced by 10% and it would cost you nothing. If the vote were held
today would you vote for or against the proposal?
For [Skip to 34]
Against [Skip to 37]
Don't know [Skip to 37]
Page 29 - Question 57 - Choice - One Answer (Bullets) [Mandatory]
How sure are you about your vote on the proposal?
Very sure
Somewhat sure
Not too sure
Not sure at all
Page 30 - Heading
Now we describe a management approach that would maintain the commercial menhaden fishing industry in the
Chesapeake Bay.
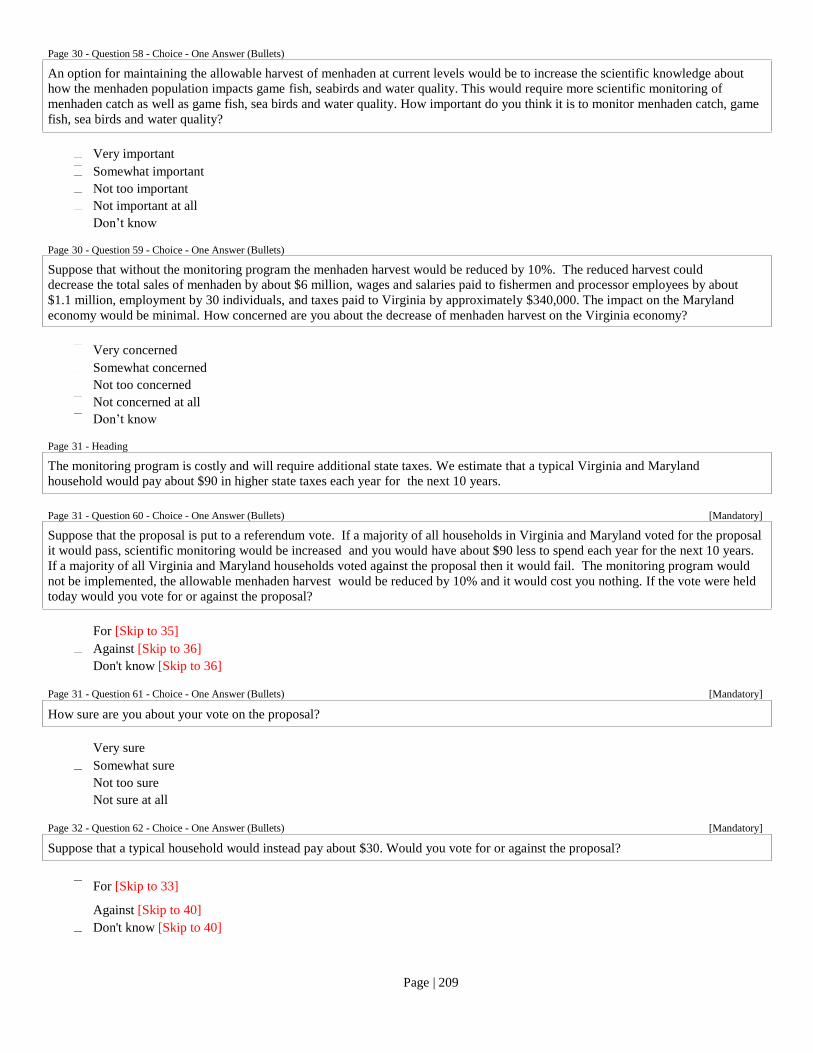
Page | 209
Page 30 - Question 58 - Choice - One Answer (Bullets)
An option for maintaining the allowable harvest of menhaden at current levels would be to increase the scientific knowledge about
how the menhaden population impacts game fish, seabirds and water quality. This would require more scientific monitoring of
menhaden catch as well as game fish, sea birds and water quality. How important do you think it is to monitor menhaden catch, game
fish, sea birds and water quality?
Very important
Somewhat important
Not too important
Not important at all
Don‘t know
Page 30 - Question 59 - Choice - One Answer (Bullets)
Suppose that without the monitoring program the menhaden harvest would be reduced by 10%. The reduced harvest could
decrease the total sales of menhaden by about $6 million, wages and salaries paid to fishermen and processor employees by about
$1.1 million, employment by 30 individuals, and taxes paid to Virginia by approximately $340,000. The impact on the Maryland
economy would be minimal. How concerned are you about the decrease of menhaden harvest on the Virginia economy?
Very concerned
Somewhat concerned
Not too concerned
Not concerned at all
Don‘t know
Page 31 - Heading
The monitoring program is costly and will require additional state taxes. We estimate that a typical Virginia and Maryland
household would pay about $90 in higher state taxes each year for the next 10 years.
Page 31 - Question 60 - Choice - One Answer (Bullets) [Mandatory]
Suppose that the proposal is put to a referendum vote. If a majority of all households in Virginia and Maryland voted for the proposal
it would pass, scientific monitoring would be increased and you would have about $90 less to spend each year for the next 10 years.
If a majority of all Virginia and Maryland households voted against the proposal then it would fail. The monitoring program would
not be implemented, the allowable menhaden harvest would be reduced by 10% and it would cost you nothing. If the vote were held
today would you vote for or against the proposal?
For [Skip to 35]
Against [Skip to 36]
Don't know [Skip to 36]
Page 31 - Question 61 - Choice - One Answer (Bullets) [Mandatory]
How sure are you about your vote on the proposal?
Very sure
Somewhat sure
Not too sure
Not sure at all
Page 32 - Question 62 - Choice - One Answer (Bullets) [Mandatory]
Suppose that a typical household would instead pay about $30. Would you vote for or against the proposal?
For [Skip to 33]
Against [Skip to 40]
Don't know [Skip to 40]

Page | 210
Page 33 - Question 63 - Choice - One Answer (Bullets) [Mandatory]
Suppose that a typical household would instead pay about $60. Would you vote for or against the proposal?
For [Skip to 34]
Against [Skip to 40]
Don't know [Skip to 40]
Page 34 - Question 64 - Choice - One Answer (Bullets) [Mandatory]
Suppose that a typical household would instead pay about $90. Would you vote for or against the proposal?
For [Skip to 35]
Against [Skip to 40]
Don't know [Skip to 40]
Page 35 - Question 65 - Open Ended - One or More Lines with Prompt
Suppose that a typical household would instead pay more than $90. What is the highest dollar amount that you be willing to pay
before you voted against the proposal?
Dollars
[Skip Unconditionally to 40]
Page 36 - Question 66 - Choice - One Answer (Bullets) [Mandatory]
Suppose that a typical household would instead pay about $60. Would you vote for or against the proposal?
For [Skip to 40]
Against [Skip to 37]
Don't know [Skip to 37]
Page 37 - Question 67 - Choice - One Answer (Bullets) [Mandatory]
Suppose that a typical household would instead pay about $30. Would you vote for or against the proposal?
For [Skip to 40]
Against [Skip to 38]
Don't know [Skip to 38]
Page 38 - Question 68 - Choice - One Answer (Bullets) [Mandatory]
Suppose that a typical household would instead pay about $10. Would you vote for or against the proposal?
For [Skip to 40]
Against [Skip to 39]
Don't know [Skip to 39]
Page 39 - Question 69 - Choice - One Answer (Bullets)
Would you be willing to pay as little as $1 in taxes for the proposal?
Yes
No
Don't know

Page | 211
Page 40 - Heading
Next, we would like to ask some questions about your recreation activities.
Page 40 - Question 70 - Choice - One Answer (Bullets)
Are you currently a member of any commercial, recreational, environmental or conservation organization or association?
Yes
No
Page 40 - Question 71 - Choice - One Answer (Bullets)
Are you currently employed in commercial fishing or a related industry?
Yes
No
Page 41 - Heading
For the next several questions, when we say ―Bay‖ we are referring to Chesapeake Bay or a stream or river that flows into the Bay.
Page 41 - Question 72 - Open Ended - One or More Lines with Prompt [Mandatory]
About how far is it from your home to the Bay?
Miles
Page 41 - Question 73 - Choice - One Answer (Bullets) [Mandatory]
Have you ever visited the Bay for the main purpose of outdoor recreation?
Yes
No [Skip to 43]
Page 42 - Question 74 - Choice - Multiple Answers (Bullets)
What type of activities did you participate in during your visits to the Bay? (check all that apply)
Fishing
Hunting
Beach Going
Boating
Nature Observation
Camping
Hiking
Bird / Wildlife Photography
Bird / Wildlife Watching
Other

Page | 212
Page 42 - Question 75 - Open Ended - One or More Lines with Prompt
About how many trips did you make from your home to the Bay for the main purpose of outdoor recreation during the past
12 months?
Trips
Page 42 - Question 76 - Open Ended - One or More Lines with Prompt
About how many of these were day trips where you returned to your home on the same day that you left?
Day trips
Page 43 - Heading
Finally, we would like to ask some questions about you and your household. These questions will help us analyze the results of
this study. Your answers will be kept strictly anonymous.
Page 43 - Question 77 - Open Ended - One or More Lines with Prompt
How many people, including yourself, normally live in your household?
People
Page 43 - Question 78 - Open Ended - One or More Lines with Prompt
How many of these people are under the age of 18?
People
Page 43 - Question 79 - Choice - One Answer (Bullets)
Are you male or female?
Male
Female
Page 44 - Heading
These are a few questions about where you live.
Page 44 - Question 80 - Choice - One Answer (Bullets)
Do you live in Virginia or Maryland?
Virginia
Maryland
Page 44 - Question 81 - Open Ended - One or More Lines with Prompt
What county or independent city do you live in?
County
Independent city
Page 44 - Question 82 - Open Ended - One Line
What is your current zip code?

Page | 213
Page 45 - Question 83 - Choice – One Answer (Bullets)
What is the highest degree or level of school that you have completed?
Less than 9
th grade
9th
to 12th
grade, no diploma
High school graduate (includes equivalency)
Some college, no degree
Associate degree
Bachelor‘s degree
Graduate or professional degree
Page 45 - Question 84 - Choice – One Answer (Bullets)
What is your household‘s total annual income before taxes?
Less than $10,000
$10,000 to $14,999
$15,000 to $24,999
$25,000 to $34,999
$35,000 to $49,999
$50,000 to $74,999
$75,000 to $99,999
$100,000 to $149,999
$150,000 to $199,999
$200,000 or more
Page 45 - Question 85 – Open Ended – Comments Box
Is there anything else you would like to tell us about your interest in menhaden?
_______________________________________________________________________________
_______________________________________________________________________________
_______________________________________________________________________________
______________________________________________________________________________
Thank You Page
Screen Out Page
Over Quota Page
Survey Closed Page
(Standard – Zoomerang branding)

Page | 214
7.0 Estimating Willingness to Pay for Policies Related to
Menhaden Harvests
For many public projects it is useful to know the strength preferences for or against
the project weighted in terms of the amount of income that individuals would relinquish to
prevent or to implement the project. This is the essence of benefit-cost analysis. It applies
to projects that provide objective services to individuals—water supply, flood protection or
improvements in air quality. It applies even to situations where there are no objective
services, such as the preservation of national monuments. In this case, individuals enjoy
the services passively. In a minor way this also applies to menhaden harvests. In this case,
households would have preferences on policies towards menhaden harvests because of the
impacts of these harvests. Benefit-analysis formally states that if the total amount of
income all proponents are willing to pay to obtain a project exceeds the total amount of
income all opposed would pay to prevent the same project, the project is considered
socially worthwhile.
Benefit cost analysis is a means of adding up preferences to arrive at a choice of
public policy. In many cases, many cases, a project can be deemed worthwhile, but many
people will be unhappy with the outcome. That will be the case with menhaden
management, because people who favor protecting menhaden and those who would be
willing to pay to reduce menhaden harvests have prefer opposing outcomes. Both groups
cannot be satisfied with the same policy.
Economists have devised approaches for measuring the gains or losses in income
that would compensate individuals for changes in public policies. One approach that
applies especially well to cases like household preferences for menhaden harvests is known
as contingent valuation. This is a direct valuation approach in which households are given
information about the provision of a public good and then asked whether they would be
willing to pay a randomly assigned amount of money to obtain the public good.150
Contingent valuation has been applied thousands of times around the world, often resulting
in very large estimates of willingness to pay that have influenced policies or payments. For
example, Exxon paid over a billion dollars for natural resources damages based on a
contingent valuation study of the willingness to pay by households in the lower 48 states to
prevent oil spills in Alaska.
The strength of this procedure rests on the robustness of scientific evidence of the
impact of menhaden harvests. For example, if households falsely believe that menhaden
harvests have no harmful effect on some ecological services of the Bay, and state high
willingness to pay for maintaining menhaden harvests they have been misinformed. Such
willingness to pay would not be a basis for resource reallocation, because if maintained,
menhaden harvests might actually have a deleterious effect, resulting in a different outcome
150
See Haab and McConnell Valuing Environmental and Natural Resources, Elgar 2003 for
background on the material in this chapter.

Page | 215
from that for which households had expressed a preference. When the scientific evidence
in support of different policies lacks robustness, discretion should be exercised in
employing willingness to pay estimates to change harvest policies.
The contingent valuation approach works in the menhaden harvesting case by
presenting scenarios for maintaining the menhaden harvest and for reducing it. Because of
the controversy surrounding the management of menhaden, the structure of any stated
choice or contingent valuation question is especially delicate. That is, some respondents
could be expected to support a program that would reduce menhaden harvest, while others
would favor a program that protected the harvest of menhaden. This controversy gives rise
to a novel application of contingent valuation. We develop two scenarios for policies
towards menhaden. One called ‗Decrease‘ is a policy to reduce the harvest of menhaden
and one called ‗Maintain’ is designed to keep the harvests at their current levels. The
scenarios describe the consequences of policies, given the best scientific knowledge. Some
respondents are offered the opportunity to support maintaining the menhaden harvest
through by paying a tax to support monitoring when others are offered the opportunity to
decrease the menhaden harvest by also paying a tax. And since we did not know before the
responses to the questions are provided whether a respondent would favor reducing
menhaden harvest or sustaining the harvest, the scenarios were assigned randomly to
respondents to avoid selection effects. The survey was conducted in three modes: internet,
phone, and mail. Each mode has a means of randomly assigning the ‗decrease‘ or
‗maintain‘ scenario. These are described earlier in the previous chapter.
The basic model for the responses of the contingent valuation scenarios is based on
a simple linear utility function:
Where T = 1 when the policy scenario (decrease or maintain) is implemented and T
= 0 when the scenario is not implemented. The utility function depends on y, household
income, tax, the tax that is paid to implement the scenario, z, selected household
characteristics. Given this model, the probability of responding ‗yes‘ to a question
requiring the household to pay the tax would be
)
Assuming that the for T=0,1 are standard extreme value distributed, this function
can be estimated with a logit model:

Page | 216
where While we have estimated a logit model, similar
results result when the original unobserved portion of preferences is distributed normally.
The two scenarios, taken verbatim from the instrument, are as follows:
‗Decrease':
The program for enforcing the restriction on catch and monitoring is costly and will
require additional state taxes. We estimate that a typical Virginia and Maryland household
would pay about [tax] in higher state taxes each year for the next 10 years. Suppose that
the proposal is put to a referendum vote. If a majority of all households in Virginia and in
Maryland voted for the proposal it would pass, the menhaden harvest would be decreased
and you would have about $10 less to spend each year for the next 10 years. If a majority
of all households in Virginia and Maryland voted against the proposal then it would fail,
commercial fishing of menhaden would remain at current levels and it would cost you
nothing. If the vote were held today, would you vote for or against the proposal to lower the
harvest of menhaden?
‗Maintenance‘:
Now I'm going to describe a management approach that would maintain the
commercial menhaden fishing industry in Chesapeake Bay. An option for maintaining the
allowable harvest of menhaden at current levels would be to increase the scientific
knowledge about how the menhaden population impacts game fish, seabirds and water
quality. This would require more scientific monitoring. How important do you think it is to
monitor the menhaden catch, game fish, sea birds, and water quality?
The monitoring is costly and will require additional state taxes. We estimate that a
typical Virginia and Maryland household would pay about $10 in higher state taxes each
year for the next 10 years. Suppose that the proposal is put to a referendum vote. If a
majority of all Virginia and Maryland households voted for the proposal it would pass,
scientific monitoring would be increased and you would have about $10 less to spend each
year for the next 10 years. If a majority of all Virginia and Maryland households voted
against the proposal then it would fail, the monitoring program would not be implemented,
the allowable menhaden harvest would be reduced by 10%, and it would cost you nothing.
If the vote were held today would you vote for or against the proposal?
The full text for these questions can be found in the section the instruments.
Both questions permit the following responses:
( 1 ) For
( 2 ) Against
( 3 ) Don't Know / Refused
After these responses, the respondents are asked how certain they are in their
answers. The measure of certainty has been shown in various experiments to reduce
hypothetical bias.

Page | 217
=============================================
certainty Certainty About Proposal Vote
=============================================
How sure are you about your vote on the proposal?
( 1 ) Very sure
( 2 ) Somewhat sure
( 3 ) Not too sure
( 4 ) Not at all sure
( Missing ) Don't Know / Refused
The dataset for estimating this model was constructed from the full three sets in the
following way:
1. The mail survey responses were deleted.
2. Individuals report age greater than 90 were deleted, due to anomalies.
3. Respondents who report not knowing, to the yes-no vote, their votes are assumed to
be no.
4. If respondents state that they are not too sure or not at all sure of their vote, their
votes assumed to be no.
5. If respondents state that they would not pay at least $1 for the program, their votes
are deleted. This follows because we know that they won‘t pay any reasonable
amount for the program. It‘s a way of identifying respondents with zero or negative
willingness to pay.
The mail survey responses were eliminated because they failed to pass the most
basic test of a negative response to a higher tax. This is the most basic requirement for a
contingent valuation survey. It is not surprising, because the mail format for this form of a
contingent valuation instrument is forbidding in size and complexity.
The full survey contained 2013 responses. Of these, 877 were deleted because they
were part of the mail survey or answered that they were not willing to pay at least $1 for a
policy. Additional observations were deleted for respondents over 90 and for missing
values. This leads to a model estimated with 1129 observations. As noted, the mail
responses were deleted because a separate analysis lead to the conclusion that respondents
were not considering the payment they would be required to make.
Although many models can be estimated from the available data, the random
assignment of bids makes it plausible to estimate the simplest model:
(7.1)

Page | 218
The model constructed is meant to capture the variability of tastes. By and large,
different covariates will not result in differences in mean willingness to pay for the two
policy scenarios because of the random assignment of bids. A model with a series of
different covariates might be useful, for example, to understand the impact of state of
residence, gender, or other socioeconomics. It would not, however, have an impact on
mean willingness to pay.
These variables are given in the table below
Table 7.1. Descriptions of Variables Used in the Estimated Model
Table 7.2. Parameters for Discrete Choice Model for Menhaden Policy Scenarios
Standard Wald
Parameter DF Estimate Error Chi-Square Pr > ChiSq
Intercept 1 0.5537 0.1228 20.3413 <.0001
tax 1 -0.0122 0.00203 36.2356
<.0001
maintain 1 0.2937 0.1274 5.3127 0.0212
Using the parameter estimates given above, we can calculate willingness to pay for
the different combinations of covariates. The expression for willingness to pay for the
estimated model is
(7.2)
This expectation holds for the individuals included in the regression. However, the
issue of whether all respondents would be willing to pay a positive amount must be
addressed.
In the discrete choice contingent valuation literature a critical issue is whether the
willingness to pay for a policy scenario can be negative. In many circumstances, a negative
willingness to pay would not make sense. In the current application, however, it is wise to
anticipate negative values because the scenarios are randomly assigned. An individual
who would prefer to decrease menhaden harvest might be asked what whether he or she
would pay $10 to prevent menhaden harvest from declining. The answer would certainly
be no, even at low values of the tax. When we have direct evidence that individuals are not
willing to pay even a very small amount, we exclude them from the analysis.
Variable Description Mean
Vote Yes =1, no = 0 for policy scenario 0.49
Tax Amount of tax paid to obtain policy
scenario $49.60

Page | 219
In this case, there are systematic deletions for those individuals who would not pay
at least $1. In this context, where the two programs, Maintain and Decrease, are
competing, it is reasonable to assume that those individuals would have a non-negative
willingness to pay for the alternative program. That is, if these respondents would not pay
$1 for the Maintain program through random assignment of the scenarios, then we would
exclude this proportion of the respondents from the estimate of willingness to pay.
Consequently, we take the following approach to calculation of the willingness to pay
across the population of users in the states of Maryland and Virginia. Calculating the
expected willingness to pay for either the Maintain or Decrease scenario, we have
(7.3)
When respondents prefer the Maintain scenario, their willingness to pay will be
non-negative. Consequently, we can ignore the second term above when calculating the
willingness to pay scenario. When we consider the two programs complements of one
another, the second term can be ignored, because one or other of the programs is assumed
to be adopted. Hence, we will need only
(7.4)
The first term in the right hand side can be obtained from the estimate based
on equation (7.2) above. The expected willingness to pay, conditional on being positive,
will have some randomness due to the randomness of parameter estimates, which we will
deal with separately. To complete the expression we need the probability that willingness
to pay will be positive. We can use the following probabilities:
We then calculate the probability from the discrete choice contingent
valuation question as . When vote
is equal to zero, a respondent has registered a ‗no‘ on the willingness to pay a given tax.
The respondents who stated ‗no‘ are then given a series of discrete willingness to pay
questions, ending with a willingness to pay $1 tax. If they do not respond ‗yes‘ to the $1
tax, then we assume that their willingness to pay is non-positive. These observations will
be excluded from the analysis.151
We are now in a position to calculate
=1- .
We do these calculations for the ‗Maintain’ and ‗Decrease’ scenarios.
151
These non-positive responses are excluded from the analysis. In principle, they might be shifted
to the alternative scenario—that is, those who would not pay for the ‗Maintain‘ scenario would be attributed
the mean willingness to pay for the ‗Decrease‘ scenario. However, we lack sufficient information to take this
second step.

Page | 220
Table 7.3 gives the probabilities, taken from the survey, and the estimated
willingness to pay, based on the parameters in Table 7.2.
Table 7.3: Components of Willingness to Pay
Scenario E(wtp|wtp>0) Ewtp Decrease $45 0.52 0.72 0.63 $28 Maintain $70 0.44 0.66 0.71 $50
These parameters are used to calculate the willingness to pay for the representative
person in the sample used in the model. However, this sample includes only individuals
who are assumed to have some positive willingness to pay. To get the unconditional
willingness to pay, we estimate the proportion of the affected population that would have a
positive willingness to pay, given in equation (7.4). The final column provides the estimate
of the unconditional willingness to pay for the two programs, after correcting for the
proportion of the population that would be willing to pay. In effect, it is taken only over
those who have positive willingness to pay. For example, we can interpret the $28 as the
mean willingness to pay across all members of the appropriate population to decrease the
menhaden harvest. The models were applied randomly with equal probability of having
received either scenario.
Given the estimates in the last column, we can calculate the net gains from
implementing the ‗Maintain’ program. This would amount to the gains per household
times the number of households less the losses per household times the number of
households. Letting the estimates in Table 7.3 refer to households, and taking an
approximate number of households as 2.9 million in Virginia and 2.1 million in Maryland,
we have a total of 5 million households. And we assume that the scenarios are
complementary in the following sense: for the ‗Decrease‘ scenario, the status quo is the
‗Maintain‘, and vice versa. That means that the mean gain for ‗Maintain‘ is $50 per
household, but this is accompanied by a mean loss of $28 per household. What we have
however, from the survey responses is a preference expressed in monetary terms for the
‗Maintain‘ scenario. We add gains and losses across all households amounting to 5
million*(50-28) = $110 million. Given our interpretation of the scenarios, the gainers
would value the ‗Maintain’ scenario by $250 million and the losers would value their
losses at $140 million. If the gainers could compensate the losers, the program would be
worthwhile.
These estimates of aggregate benefits from the different programs rely on the
contingent valuation exercises we have undertaken. There are various reasons to interpret
these results cautiously. First, the estimates themselves are not exact. The uncertainty is
not easily quantified. Second, our valuation of the scenarios assumes that preferences are
independent. That is, respondents, to the extent that they have well formed preferences,
care about the management of menhaden. However, in controversial and contentious cases
of resource allocation, preferences may evolve such that not only does one side of the issue

Page | 221
value its own management program, but it may also incur ‗negative‘ value if the opposing
side gets its way. This phenomenon would most likely occur for those individuals who are
active in the lobbying for their programs. The proportion of these individuals is probably
quite small relative to the total number of interested individuals. Third, the strength of the
results rests on the scientific evidence. We have presented the respondents with the best
evidence we could provide. Weaknesses in this evidence will undermine the economic
assessment of preferences.

Page | 222
8.0 Summary and Conclusions
8.1 The Beginning and Purpose of Study
The Atlantic menhaden fishery, and subsequently, its controversy appear to have
their origins in the early 1600s when an Indian named Tisquantum, or Squanto, advised the
Pilgrims on how to use menhaden as fertilizer. There is some question as to whether or not
he suggested menhaden as fertilizer to embarrass the Pilgrims or simply to help them. In
the 1700s and on up to the 1970s, menhaden were consumed by humans as food and used
to produce fertilizer and oil. Menhaden were once even marketed as canned sardines. In
1811, however, menhaden began to be successfully harvested and processed into oil for a
wide variety of uses. The harvesting of menhaden, even during the 1800s, was not without
controversy. An 1888 article in the New York Times summarized an effort by
conservationists and recreational anglers to prohibit the harvesting of menhaden by net in
Raritan Bay, New York. The opposition to harvesting menhaden was based on many of the
same arguments today—harvesting menhaden affected water quality and the populations of
predators.
Fast-forward to today, and we find that the controversy about menhaden not only
still exists but has greatly intensified. Until recently, however, the controversy was
primarily focused on the fact that one company in Reedville, Virginia, OMEGA Protein,
was the only company harvesting menhaden and the primary purpose of harvest was
reduction into meal, oils, and soluble. In the past two years, the debate about the harvesting
of menhaden has expanded to include the bait fisheries of the Atlantic states, which have
expanded to make up for the reductions in the supply of herring as bait for use in the lobster
and other fisheries. Presently, every coastal state of the Northwest Atlantic has some type
of regulation either limiting or prohibiting the harvested of menhaden for reduction
purposes or by purse seine in their coastal waters. Massachusetts, Virginia, New York, and
North Carolina are the only states which either permit harvesting for reduction or by purse
seine.
Recreational anglers and various conservation associations have long been
concerned about the harvesting of menhaden in Chesapeake Bay. Their concerns include
the fact that menhaden are filter feeders, and overharvesting menhaden could affect water
quality and the fact that menhaden are forage fish for various predators, such as striped
bass, weakfish, speckled trout, bluefish, and various marine mammals. Presently, menhaden
harvest levels by the reduction fishery are restricted to 109.0 thousand metric tons in the
Bay with no restrictions on the coastal ocean resource. In addition, the fishery is regulated
by both spatial and temporal restrictions.
The fishery is believed to be important to the social and economic well being of
Northumberland County, and in particular, Reedville, VA. This importance, however, has
not been quantified. As a consequence, the Virginia Marine Resources Commission

Page | 223
requested a study be done by the Virginia Institute of Marine Science of the social and
economic importance of the fishery to Chesapeake Bay region. The emphasis of the study
was to document how reducing the Bay quota might affect the social well being and
economies of the region and to determine the economic value of menhaden in the region.
Alternatively, does the menhaden resource generate more benefits from the fishery or from
the ecological services it provides to the various Bay resources?
8.2 Study Methodology
The assessment of the social and economic importance of the menhaden resource
was based on analysis: (1) input-output or economic impact analysis; (2) development of
county profiles and limited interviews with employees of OMEGA; (3) a financial
simulator model which facilitated an assessment of how different Bay-wide quotas would
affect economic returns and output or sales, income, and employment in the Maryland and
Virginia region; and (4) an economic valuation based on contingent valuation which
estimated the economic value to stakeholders of the region of maintaining the status quo
(retaining the current Bay-wide quota) or reducing the Bay-wide quota. The valuation,
however, required an extensive survey of stakeholders in the region.
The economic impact model was based on information provided by OMEGA on
costs, earnings, production, and employment. IMPLAN, which is a widely used software
platform to conduct economic impact analysis, was used to develop the impact model. The
model permitted estimation of changes in sales, income, and employment associated with
different levels of Bay-wide quotas. The model was based on the 2008 version of
IMPLAN, the most current version.
The community profiles were developed utilizing mostly secondary sources of data
for all Bay-based counties in the region. Profiles were developed for 16 Maryland counties
and 26 Virginia counties. Many of the profiles were based on information provided by the
US Bureau of Census for the year 2000. Additional information, when available, was also
used to develop the county profiles. The profiles provide a background and overview of the
county or city, and information on location, transportation, demographics, education,
employment, income, and housing.
The financial simulator model was developed using information provided by
OMEGA, which facilitated development of algorithms to assess how costs, earnings, and
economic impacts might change in response to different Bay-wide quotas. The simulator
was based on 2008 costs and earnings data for OMEGA. The model is deterministic and
based on mathematical rather than statistical relationships. The model considers Bay and
coastal ocean landings as observed over time and reported to the Atlantic States Marine
Fisheries Commission (ASMFC). Thus, as the Bay-wide quota is reduced below reported
Bay landings, it is assumed that OMEGA will increase its harvest in the coastal ocean but

Page | 224
not in excess of what has been observed. The simulator considers landings for calendar
years 2007 through 2010.
The more difficult, and perhaps the most important, analysis was the economic
valuation or estimation of economic benefits of how society values the fishery vs. the
ecosystem services of the resource. This required an extensive survey of stakeholders in
the region. The survey questionnaire was developed and different versions were field
tested 23 times. A critical issue was to develop a questionnaire that minimized bias either
in support of the fishery or in support of reducing the harvest. Subsequently, a professional
survey company was contracted to conduct the survey. The survey followed modern
survey procedures for non-response by follow ups. The survey was conducted via mail,
telephone, and Internet. Although numerous questions about Bay use and opinions about
the resource were asked, the critical question focused on willingness to pay to maintain the
harvest or reduce the allowable harvest levels. The reductions ranged from 10 to 50 %. A
detailed summary of responses, survey methodology, and survey instruments is contained
in Chapter VI.
Data from the survey were used to estimate willingness to pay by Virginia vs.
Maryland stakeholders, as well as by gender. Estimation was based on a standard
contingent valuation model, which is a discrete choice model in which utility is specified as
a function of variables believed to influence values individuals placed on either maintaining
the status quo or reducing the allowable Bay-wide harvest of menhaden. It was necessary,
however, to conduct a comprehensive Monte Carlo analysis and the Krinsky-Rob approach
to estimate willingness to pay because of limited responses.
8.3 Overview of Results
The major objective of this study was to assess the social and economic importance
of the menhaden resource to stakeholders of Chesapeake Bay region. Emphasis was given
to the potential economic impacts of reducing the Bay quota of 109,020 metric tons, and to
the value individuals place on the fishery versus the ecological goods and services of
menhaden. Which communities or counties that might be affected by reductions in the Bay
quota is also of concern.
The fishery operates out of Reedville, Virginia, which is in Northumberland
County. A complete closure of the fishery would result in the loss of 519 jobs in Maryland
and Virginia, and 347 jobs in Northumberland County. One major problem of assessing
changes in the Bay quota is determining how OMEGA would respond relative to the
coastal ocean exploitation of menhaden. We considered several options, which ranged 85.0
to 0.0 thousand metric tons. Assuming the industry harvests 56.1 thousand metric tons
from the coastal ocean, which was the reported level for 2008, gross profits were estimated
to range from $26.1 million to $7.3 million. A quota of 85.0 thousand metric tons would
reduce total sales, income, and employment from, respectively, $88.2 to $81.9 million,

Page | 225
$22.8 to $21.8 million, and 510 to 482 jobs. A Bay quota of 0.0 metric tons, with no
change in the 2008 level of coastal ocean harvest, reduces total output, income, and jobs for
the region to $35.0 million, $9.0 million, and 206 jobs. The economic impact on
Northumberland would be reductions in sales, income, and jobs to $31.3 in sales, $7.7
million in income, and $171 jobs. At a total allowable harvest level of only 56.1 thousand
metric tons, however, total sales would be inadequate to cover total costs.
Overall, the economic impact assessment indicates that the Bay quota could be
reduced to at least 85.0 thousand metric tons with no appreciable economic impacts. The
economic impacts associated with quotas below 85.0 thousand metric tons would vary
depending upon how the fishery responded and the availability and abundance of menhaden
in the coastal ocean. Reductions in the availability or abundance of the resource or spatial
changes in the resource could result in substantial reductions in profitability and sales,
income, and employment. These changes, however, would depend upon how the industry
responded to such changes. Overall, the economy of Northumberland County would be the
most affected by a closure of the fishery. A closure of the reduction operation would
reduce total output and employment, respectively, by 14.3 % and 8.1 % relative to 2008
levels of economic activity in Northumberland County.
While economic impacts are important for examining the ramifications of changes
in the quota, the more important issue is how does society value menhaden as an ecological
resource versus the fishery? That is, does society place a higher preference or value on the
ecological goods and services of menhaden or on the menhaden fishery? To address this
question, a contingent valuation survey was designed and implemented under a professional
services contract with a survey firm. The survey was conducted via mail, telephone, and
Internet and allowed respondents the option of paying different dollar amounts per year per
household. The dollar amounts equaled $10.0, $30.0, $60.0, and $90.0 per household.
Individuals were asked to express their willingness to pay to maintain the status quo or the
current Bay quota levels versus reducing the Bay-wide quota.
Individuals expressed a strong preference for maintaining the status quo or not
reducing the quota. The expected value or mean willingness to pay or value per household
equaled $50.0 to maintain the status quo versus $28.0 to reduce the harvest. When
estimated for all individuals of the region, the total gross willingness to pay or gross benefit
equaled $250.0 million to maintain the status quo versus $140.0 million to reduce the Bay
quota. Considering those who prefer the status quo versus those desiring a reduction, we
have a net gain of $110.0 million for maintaining the status quo.
The result that society preferred to maintain the status quo was unexpected. The
expected result was that society would have a strong preference to reduce the allowable
Bay quota. Possible reasons for the preferences include a growing sympathy with
watermen, an ailing economy and desire by individuals to prevent additional
unemployment, and an inadequate understanding of the potential ecological goods and
services of menhaden.

Page | 226
There is no doubt that Northumberland County would be the most affected region or
county by a closure of the fishery or substantial reductions in the allowable quota. The
extent of the social impacts, however remain unknown. Only a limited number of
interviews with plant employees were conducted, which was inadequate to draw large-scale
conclusions. A previous unpublished study by Kirkley (1997) involved a survey of the two
reduction companies in existence at the time—1997. In that study, most respondents
indicated they would simply find other jobs either in the County or nearby. A small
number indicated they would probably move to another region. Almost all, however,
indicated they would have a difficult time finding other work at or near the same pay level
and with similar benefits. In this study, the researcher conducting the social impact
assessment interviewed only 12 OMEGA employees before resigning. All indicated
happiness with their job and stated they would find other work in the event of a closure of
the fishery, but not likely at the same pay level with the same benefits.

Page | 227
Reference
Ahrenholz, DW 1991.‖Population biology and life history of the North American menhadens,
Brevoortia spp. Marine Fisheries Review [MAR. FISH. REV.]. Vol. 53, no. 4, pp. 3-19. 1991.
ASMFC 2001. Amendment 1 to the Interstate Fishery Management Plan for Atlantic Menhaden.
Fishery Management Report No. 37, Atlantic States Marine Fisheries Commission,
Washington, D.C.
ASMFC 2004. Addendum I to Amendment 1 to the Interstate Fishery Management Plan for
Atlantic Menhaden. Atlantic States Marine Fisheries Commission, Washington, D.C.
ASMFC 2006 Stock assessment report for Atlantic menhaden. Atlantic States Marine Fisheries
Commission, Washington, D.C.
ASMFC 2010. Atlantic menhaden stock assessment and review panel reports. Atlantic States
Marine Fisheries Commission, Stock Assessment Report 10-02. Atlantic States Marine
Fisheries Commission. Washington, D.C.
Dillman, Don A., Jolene D. Smyth, Leah Melani Christian 2009. Internet, Mail, and Mixed-Mode
Surveys: The Tailored Design Method. John Wiley & Sons, Inc. Hoboken, N.J., 499 pp.
ECO Northwest 2009. Economic Arguments for Protecting the Natural Resources of the East Buttes
Area in Southeast Portland. Prepared for the Bureau of Environmental Services.
Frye, John 1978. The men all singing: The story of menhaden fishing. Donning, Norfolk, Va.
Garrity-Blake, Barbara J. 1994. The Fish Factory. The University of Tennessee Press , Knoxville,
Tennessee.
Goode, George Brown, and W.O. Atwater 1880. ―A History of the Menhaden with an Account of
the Agricultural Uses of Fish.‖ Orange Judd Company, 245 Broadway, New York.
Kirkley, James 1997. ―Virginia‘s Commercial Fishing Industry: Its Economic Performance and
Contributions.‖ Virginia Institute of Marine Science, School of Marine Science, College of
William & Mary.
Latrobe, B. H. 1802. A drawing and description of the Clupea tyrannus and Oniscus praegustator.
Transactions of the American Philosophical Society v. 5: 77-81, Pl. 1.
Lanier, T. C. 1985. ―Menhaden: Soybean of the Sea.‖ Univ. N.C. Sea Grant Pub!. 85-02,24 p.
Lynch, Patrick D., Mark J. Brush, Elizabeth D. Condon, Robert J. Latour 2010. ―Net Removal of
Nitrogen through Ingestion of Phytoplankton by Atlantic Menhaden Brevoortia Tyrannus in
Chesapeake Bay.‖ Mar. Ecol. Prog. Ser., 401:195-209.
National Marine Fisheries Service 2010. Commercial Landings. Office of Sustainable Fisheries,
1315 East West Highway, Silver Spring, MD.
New York Times 1888.
Turrentine, J.W. 1913. The Menhaden Industry. Ind. Eng. Chem., 5(5): 378-388.
Wharton, J. 1957. The Bounty of the Chesapeake. Fishing in Colonial Virginia. University Press of
Virginia, Charlottesville, Virginia.