an assessment of the potential financial impacts of a ... impacts...an assessment of the potential...
TRANSCRIPT

An assessment of the potential financial impacts
of a Container Deposit System on Local
Government in Tasmania.
Prepared for:
The Local Government Association of Tasmania
GPO Box 1521
Hobart TAS 7001
December 2013
Level 2
31-33 Park St
South Melbourne VIC 3205
Ph. +61 3 9690 8090 www.eqlomg.com

Financial impacts of Container Deposits on Local Government in Tasmania December 2013
i
Table of Contents
References and Glossary .................................................................................. iii
Background.................................................................................................... iv
Executive summary ......................................................................................... vi
1. Objective ................................................................................................. 1
2. Scope ...................................................................................................... 1
2.1 Exclusions .................................................................................................................. 2
3. Methodology ............................................................................................ 2
4. Overall impact on Tasmanian Local Government kerbside recycling ................. 7
4.1 Change to collection costs .......................................................................................... 8
4.2 Change to value of materials ...................................................................................... 8
4.3 Total value of materials ............................................................................................... 9
4.3.1 CDS material returned to depots and remaining in kerbside ............................... 9 4.3.2 Value of CDS materials remaining in kerbside .................................................. 10
4.4 Change in the kerbside recycling bin resource value .............................................. 12
5. Southern Waste Strategy Authority ............................................................... 13
6. Northern Tasmania Waste Management ...................................................... 14
7. Cradle Coast Waste Management Group ...................................................... 15
8. Factors influencing value of materials ......................................................... 16
9. Litter management ................................................................................... 17
10. Public place recycling .............................................................................. 17
11. Conclusion .............................................................................................. 18
Appendix ....................................................................................................... 20
Tables and Charts
Table 1: Kerbside recycling tonnes collected in Tasmania current and with a CDS. ............... vii
Chart 1: Change to the total value of kerbside materials in Tasmania with a CDS. ................. viii
Chart 2: Change to kerbside tonnes collected in Tasmania with a CDS .................................... 7
Chart 3: Change to value of kerbside recycling bin materials with a CDS (AU$ per tonne) ...... 9
Chart 4: Change to the total value of kerbside materials in Tasmania with a CDS ................... 13
Chart 5: Southern Waste Strategy Authority change in kerbside tonnes with a CDS. .............. 13
Chart 6: Northern Tasmania Waste Management Authority change in kerbside tonnes with a
CDS. ...................................................................................................................................... 14
Chart 7: Cradle Coast Waste Management Group change in kerbside tonnes with a CDS. .... 15

Financial impacts of Container Deposits on Local Government in Tasmania December 2013
ii
Acknowledgements: Equilibrium would like to acknowledge and thank everyone who supported
this project. All Local Governments in Tasmania were invited to participate and their input and
assistance was highly valuable and greatly appreciated. Valuable support and information was
also provided by the Local Government Association of Tasmania, Southern Waste Strategy
Authority, Northern Tasmania Waste Management and Cradle Coast Waste Management Group.
Tasmania waste and recycling industry players also were generous in providing their time and
information and Equilibrium thanks Veolia in particular for its assistance.
Disclaimer: This report has been prepared on behalf of and for The Local Government Association of
Tasmania and in accordance with the project brief and agreement between The Association and
Equilibrium. The report relies on information provided confidentially from a range of Local
Governments and other stakeholders in the waste and recycling industries in Tasmania. Equilibrium
OMG Pty Ltd accepts no liability or responsibility for use or reliance upon this report by any third
party.

Financial impacts of Container Deposits on Local Government in Tasmania December 2013
iii
References and Glossary
For this study the following time frames are used:
Short-term (0 - 3 years)
Medium-term (2 - 5 years)
Long-term (5 + years)
CDL Container Deposit Legislation – law that requires collection of money related to
the sale of packaged beverages and the refunding of the deposit when the
empty beverage container is returned to an authorised collection point.
CDS Container Deposit System – more generally a deposit – refund arrangement for
beverage containers whether regulated or otherwise.
SCEW Standing Council on Environment and Water – the council of ministers
responsible for environment and water from the Commonwealth, all states and
territories and New Zealand. The Australian Local Government Association is
also represented at SCEW and the Council is chaired by the Australian
Government Minister for the Environment.
PICRIS Packaging Impacts Consultation Regulation Impact Statement.

Financial impacts of Container Deposits on Local Government in Tasmania December 2013
iv
Background
This study, commissioned by the Local Government Association of Tasmania, examines the
potential financial impacts of a Container Deposit Legislation / Container Deposit System (CDS)
on Local Government in Tasmania in respect to kerbside recycling, public place recycling and
litter management.
This study does not look at the broader community and industry impacts of a CDS and it does
not include assessing the potential impacts for a Local Government if it were to seek to operate
as part of a CDS system and operate collection depots or other facilities.
The study does not assess some areas of potential impacts to Local Government that have been
identified in the Packaging Impacts Consultation Regulation Impact Statement (PICRIS)1and
other studies. It does not assess the potential change to landfill practices and costs associated
with a CDS.
It does not include assessment of any PICRIS Options other than 4(a) and 4(b). It does not
assess social impacts or impacts related to recyclable materials from the commercial and
industrial or construction and demolition sectors.
In undertaking this study, the CDS options in the PICRIS are used as a baseline reference. The
PICRIS is managed through the Standing Council on Environment and Water (SCEW), a council
of ministers responsible for environment and water from the Commonwealth, all states and
territories and New Zealand with the Australian Local Government Association is also
represented.
The PICRIS models, assumptions and results are used in comparison to current Tasmanian
systems and performance in order to determine the potential change to kerbside recycling
systems, public place recycling and litter management. It does not examine any other CDS-
related costs and benefits.
It is noted that further to the PICRIS, SCEW is completing a Packaging Impacts Decision
Regulation Impact Statement that is reportedly with government for consideration however as
it is not public at this time it cannot be used for this study.
Separate to this the Tasmania Government through the EPA Division of the Tasmania
Department of Primary Industries, Parks, Water and Environment is undertaking a cost benefit
study on a State-based CDS for Tasmania.
The PICRIS examines seven Options, with Options 4(a) and 4(b) being two CDS models. Both
Options were found on a national basis to be a direct net financial benefit to Local Government
achieved through reduced cost of kerbside recycling (collection and processing costs),
reduced litter management and clean-up costs and changed value in the market value of the
recovered containers. The full description of these Options is in the appendix of this report.
In coordination with Tasmania’s three waste authorities, 21 of the 26 councils in Tasmania which
provide kerbside recycling provided information in respect to those services as well as public
place recycling and litter management.
1 Packaging Impacts Consultation Regulation Impact Statement, Standing Council on Environment and
Water. PWC and Wright Corporate Strategies, 2011.

Financial impacts of Container Deposits on Local Government in Tasmania December 2013
v
The information provided on kerbside recycling is suitably robust and comparable to enable
detailed analysis and comparison with the PICRIS. However, with respect to public place
recycling and litter management the information provided is not sufficient to be quantifiably
tested. While detailed findings can be made on the potential impacts for kerbside recycling in
Tasmania, only general findings can be made on public place recycling and litter
management.
A CDS is intended to apply to a proportion of materials currently managed by Local
Government, namely beverage containers that are present in kerbside recycling, public place
recycling and in litter. Accordingly, a CDS will change Local Government’s management
systems and costs associated with those activities.

Financial impacts of Container Deposits on Local Government in Tasmania December 2013
vi
Executive summary
The PICRIS finds that a CDS will benefit Local Government across Australia through reduced
kerbside collection and processing costs of $2.72 billion nationally over 20 years.
For Tasmania taken on a simple proportional basis the PICRIS findings indicate a benefit to
Local Government of up to $60.9 million over 20 years or up to $3 million average per year.
This study finds that the actual potential benefits for Tasmania are not as high as the PICRIS
indicates. This study finds that on a best case scenario, reduced kerbside costs in Tasmania as
a result of a CDS may at best be up to$26.8 million over 20 years or on average up to $1.3
million per year. This finding is based primarily on the reduced tonnes of material collected
through kerbside systems and assuming that Tasmanian councils can achieve a corresponding
reduction in gate fees.
This is a best-case scenario that considers that the full impact of a CDS on local government
kerbside recycling systems is able to be fully converted into a benefit for councils.
The PICRIS relies on national averages for recycling, litter and related costs. The situation in
Tasmania is different from other Australian States and territories and therefore national
averages are not applicable. As such the potential financial impacts of CDS on Local
Government in Tasmania differ from the PICRIS.
Of particular note in Tasmania is that current collection and processing costs are generally
higher than the national average, contamination rates are generally high, the proportion of
glass in kerbside is higher and the value of recyclable materials collected is lower than the
national average. Tasmania also manages some issues not common elsewhere in Australia,
such as limited local end-markets for all materials, limited opportunities for glass processing
and higher freight costs.
Consistent with the PICRIS the benefits that may be achieved in Tasmania will change over time
and differ from council to council.
It will change over time as a CDS is expected to cause incremental change to recycling and
litter management as people gradually become accustomed to returning CDS materials direct
to depots or other return points. It is therefore assumed that the amount of material in kerbside
recycling and / or being littered reduces over time.
It will differ from council to council as recycling and litter management practices and costs
vary.
For the purpose of this study, the short-term (0-3 years), medium-term (2-5 years) and long-
term (5-plus years) potential changes in kerbside volumes have been assessed across the
three regional groupings as well as the State as a whole.
A critical factor in any impact of a CDS is the potential reduction in kerbside tonnes as
householders take materials direct to redemption points. The following table shows the change
to tonnes of kerbside material over time due to a CDS.

Financial impacts of Container Deposits on Local Government in Tasmania December 2013
vii
Table 1: Kerbside recycling tonnes collected in Tasmania current and with a CDS.
In accordance with the PICRIS, the reduced tonnes of kerbside collected are expected to
reduce collection costs in Tasmania if Tasmanian councils can achieve a corresponding
reduction in collection fees. While the PICRIS notes that collections are charged per lift and the
same number of bins will need to be collected despite the reduced volumes, it estimates that
reduced collection benefits will accumulate slowly over time. On this basis in accordance with
the PICRIS reduced kerbside collection costs for Local Government in Tasmania will be in the
region of $257,000 per year. Total current total kerbside collection costs in Tasmania are about
$5.8 million per year. On current kerbside practices and volumes this will translate to a
reduction in collection costs of about $1.31 per service per year.
With respect to processing costs, Tasmanian councils will potentially experience reduced
kerbside recycling gate fees under a CDS as most councils with kerbside recycling pay a
processing cost or gate fee (whether fixed or variable) for the sorting of kerbside recyclables.
These vary from council to council and will change under a CDS in two ways; firstly through the
reduced volume of materials being paid for and secondly by the change in the potential value
of the materials in the kerbside recycling bin.
The extent to which both of these changes may be delivered and therefore can be realised is
dependent on whether the processing facility can operationally achieve and pass on the
potential benefits. Nonetheless for the purposes of this study these potential benefits can be
modeled.
With respect to changes to processing costs, current gate fees vary widely from about $50 to
$180 per tonne of material received. A reduction in processing costs / gate fees can be
estimated in line with the overall reduction in tonnes of material received and will change over
time. For Tasmania as a whole reduced processing cost will be in the region of $340,000 per
year. Total current total kerbside processing costs in Tasmania are about $2 million per year.
0
5,000
10,000
15,000
20,000
25,000
30,000
35,000
40,000
Current Short term
(0 - 3 years)
Medium term
(3 - 5 years)
Long term
(5+ years)
Southern tonnes 19,104 16,812 16,238 15,856
Northern 15,369 13,525 13,064 12,756
Cradle Coast 4,578 4,029 3,891 3,800
Total 39,051 34,365 33,193 32,412
To
nn
es
ke
rbs
ide
co
lle
cte
d
Financial impacts of Container Deposits on Local Government in Tasmania December 2013
viii
On current kerbside practices and volumes this will translate to an average reduction in gate
fees for processing recyclables of $1.73 per service per year or $8.70 per tonne delivered for
processing.
It is noted that in regards to reduced volumes reducing gate fees, sorting companies report
that their processing costs will only reduce to the extent that operational changes can be made
in line with reduced volumes. If labour and / or other costs reduce proportionate to volumes
processed then the modeled benefit may be achieved.
With respect to changes to the value of materials in the kerbside recycling bin, a CDS will
increase the value of the materials and therefore potentially provide the sorting operator with
more revenue which may be able to be passed on to councils as a reduced processing cost /
gate fee.
It is assessed that the value of the materials in kerbside in Tasmania will increase from an
average of about $90 per tonne to $130 per tonne. This is due to the CDS materials remaining in
kerbside which are assumed to be able to be redeemed for their 10 cent value. The PICRIS
finds that 80% of CDS materials will go directly to collection depots and 7% will remain in the
kerbside recycling system. While a CDS will remove valuable materials from kerbside (PET
plastic and aluminium in particular) the redeemable deposits increase the value in total and
overall as long as the containers are able to be separated and the deposits redeemed.
The increased value is different in Tasmania also because of the glass present in kerbside
recycling. The proportion of glass in kerbside in Tasmania is generally higher than other
jurisdictions and the national average and in Tasmania it currently has little or no value. While
not all glass material in kerbside will be eligible for a CDS, that proportion that is will have a
greatly increased value.
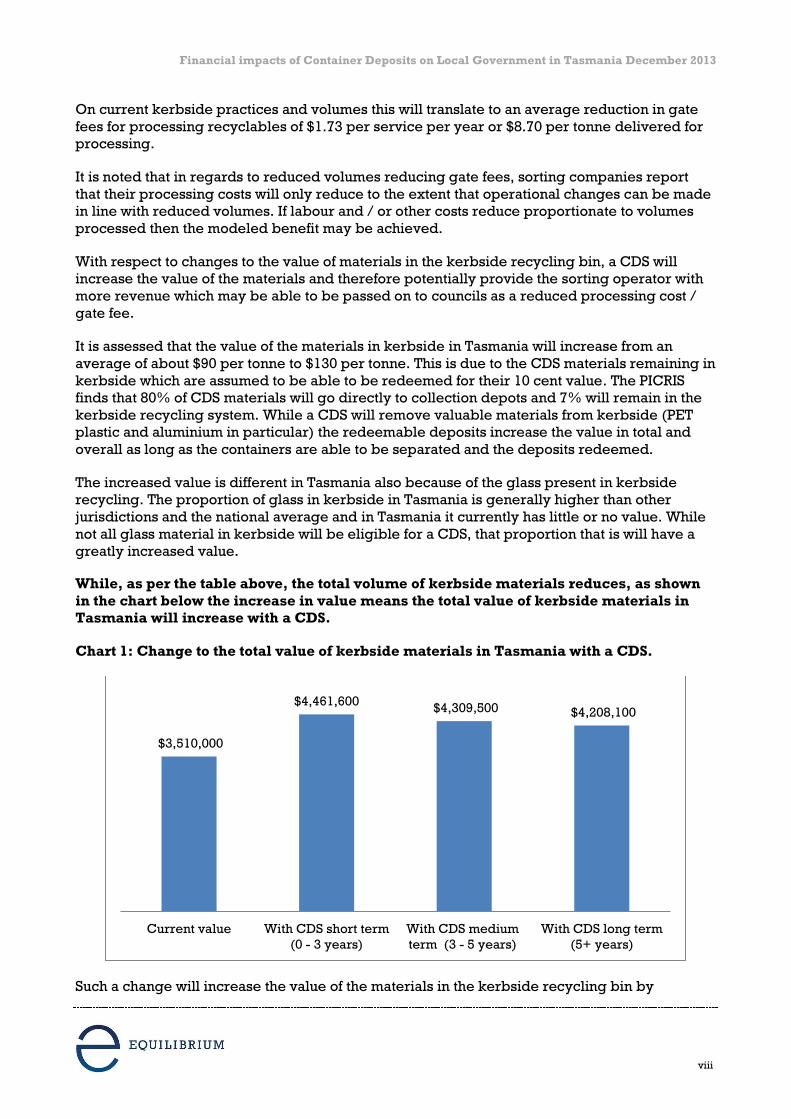
While, as per the table above, the total volume of kerbside materials reduces, as shown
in the chart below the increase in value means the total value of kerbside materials in
Tasmania will increase with a CDS.
Chart 1: Change to the total value of kerbside materials in Tasmania with a CDS.
Such a change will increase the value of the materials in the kerbside recycling bin by
$3,510,000
$4,461,600 $4,309,500 $4,208,100
Current value With CDS short term
(0 - 3 years)
With CDS medium
term (3 - 5 years)
With CDS long term
(5+ years)

Financial impacts of Container Deposits on Local Government in Tasmania December 2013
ix
$950,000 a year in the short term, $800,000 a year in the medium term and $700,000 a year in
the long term. Over the PICRIS 20 year time frame that will be an average of $750,000 a year.
As noted however, the extent to which such benefits can be realised is dependent on being
able to achieve the modeled outcomes. Of particular note is the ability to redeem CDS
materials remaining in kerbside and reduce processing costs in line with reduced throughput
at sorting facilities. Sorting / processing companies report that reduction in throughput may
achieve benefits through reduced sorting labour but that may be offset if increased labour is
required to sort CDS materials. The likelihood of this issue has not been tested however it is
noted that under PICRIS CDS Option 4 (a) it is proposed that recyclers can redeem containers
based on a weight based formulae therefore minimising changes to current sorting practices
and maximising redemption of deposits.
This study finds that a CDS can potentially benefit Tasmania kerbside recycling through
reduced collection costs ($257,000 per year average), reduced processing costs ($340,000 per
year average) and improved material value ($750,000 per year average). This represents a
potential improvement of the overall system costs of $1.3 million per year (compared to $3
million per year benefit estimated from the PICRIS findings).
The cost advantages that may materialise are:
Collection costs – in medium to long term and future collection contracts.
Processing costs and improved material value – in the short term for variable
processing contracts but medium or long term for fixed contracts.
While detailed findings cannot be made with respect to litter management and public place
recycling in Tasmania, in line with PICRIS estimates Tasmanian Local Government as a whole
may benefit from reduced litter management costs of about $160,000 per year if there is a
reduction in the incidence of litter and therefore associated management, clean-up and
disposal costs.
Overall while the impacts of a CDS for Tasmania local government are not as beneficial as
generally estimated in the PICRIS, a CDS will potentially be beneficial to the viability of the
Tasmanian kerbside recycling system as it will increase the convertible value of the materials
in a kerbside recycling bin.

Financial impacts of Container Deposits on Local Government in Tasmania December 2013
1
1. Objective
The Local Government Association of Tasmania in partnership with Southern Waste Strategy
Authority, Northern Tasmania Waste Management and Cradle Coast Waste Management
Group engaged Equilibrium to undertake an assessment of the potential financial impacts of a
CDS on Local Government in Tasmania.
The Tasmanian Government has signalled a preference for introducing a Container Deposit
Scheme in the State through a commitment of $50,000 funding for a cost benefit analysis of a
container deposit scheme. It is understood that it is not intended that study will specifically
look at the impacts on the Local Government Sector.
The objective of this study is to better understand the local impacts of a nationally implemented
CDS as outlined in the Packaging Impacts Consultation Regulation Impact Statement (PICRIS).
2. Scope
The Federal Government’s Standing Council on Environment and Water (SCEW) conducted the
PICRIS to assess options for improved management of end-of-life packaging in Australia.
The assessment included national consultation and a cost benefit analysis across seven
different options, including a CDS with two variations called Option 4(a) and Option 4(b).
Options 4(a) and 4(b) were determined to incur the highest costs and represent the poorest
Net Present Value of all seven options2 however they were also found to have a range of costs
and benefits specifically for local government. These include a loss of benefit from the value of
kerbside recycling that was not quantified3 but potential savings in kerbside recycling
collection and processing costs4 and avoided litter management costs.5
The PICRIS and Options 4(a) and 4(b) contain a number of assumptions and estimations with
respect to impacts for local government on a national basis. This study uses the PRICRIS
findings and assumptions as the basis on which to more specifically assess impacts for
Tasmania Local Government.
This study takes the PICRIS findings and compares them against current known practices in
Tasmania to determine the potential impact on Tasmania Local Government and whether any
findings or assumptions may have a different outcome in Tasmania.
The study quantifies where possible the financial impacts for Tasmania Local Government in
particular the cost impacts and overall viability of kerbside recycling, public place recycling
and litter management with a CDS in place.
2 Standing Council on Environment and Water, Packaging Impacts Consultation Regulation Impact Statement,
December 2011. Page xiii, table E.1.
3 Ibid Page 54.
4 Standing Council on Environment and Water, Attachment C: Cost benefit analysis report. PWC and Wright
Corporate Strategies, December 2011. Pp57-58.
5 Ibid Page 80.

Financial impacts of Container Deposits on Local Government in Tasmania December 2013
2
2.1 Exclusions
The study does not assess some areas of potential impacts to Local Government that have been
identified in the PICRIS and other studies.
It does not assess the potential change to landfill practices and costs associated with a CDS.
It does not include assessing the potential impacts for a Local Government if it were to seek to
operate as part of a CDS system and operate collection depots or other facilities.
It does not include assessment of any Options other than 4(a) and 4(b).
It does not assess social impacts or impacts related to recyclable materials from the
commercial and industrial or construction and demolition sectors.
3. Methodology
In order to achieve the objective of the project and fulfil the above scope of work the following
methodology was applied:
Project preparation
Data collection
Data management
Financial model
Data analysis and reporting
Particular attention was paid to ensuring an adequate representation of different sized and
located councils provided input, and that accurate financial information and other data
provided.
Respondents were asked to provide details on:
Current kerbside recycling arrangements, volumes collected, processing costs or
payments, mix of materials (if audited) and contamination rates.
Collection arrangements and costs.
Litter management practices, volumes and costs (collection and disposal).
Public place recycling systems, volumes and costs (collection and processing).
Other information related to waste management such as education and staff resources.
Of Tasmania’s 29 councils, 26 currently have kerbside recycling systems and of those 21
councils (80%) responded and provided detailed information. Consultation with industry was
undertaken to check the financial details provided by councils.
In order to undertake the modelling, PICRIS assumptions and findings about the potential
change to kerbside recycling systems were used and applied against current Council data.
Specifically this includes:
Reduction in material in kerbside recycling bin of 15-20% by weight.

Financial impacts of Container Deposits on Local Government in Tasmania December 2013
3
Change of mix of materials in the kerbside recycling bin (less aluminium, plastic,
glass).
Change in the value of the materials in the kerbside recycling bin.
Consistent with the PICRIS this study assumes that all CDS materials remaining in the
kerbside recycling system can be redeemed and at a rate of a 10 cent deposit and this
study does not include any handling fees, charges or other costs that may be related to
redeeming those deposits.
Following is a table of the key assumptions and findings of the PICRIS and how they were
accepted or otherwise applied to this study.
Financial impacts of Container Deposits on Local Government in Tasmania December 2013
4
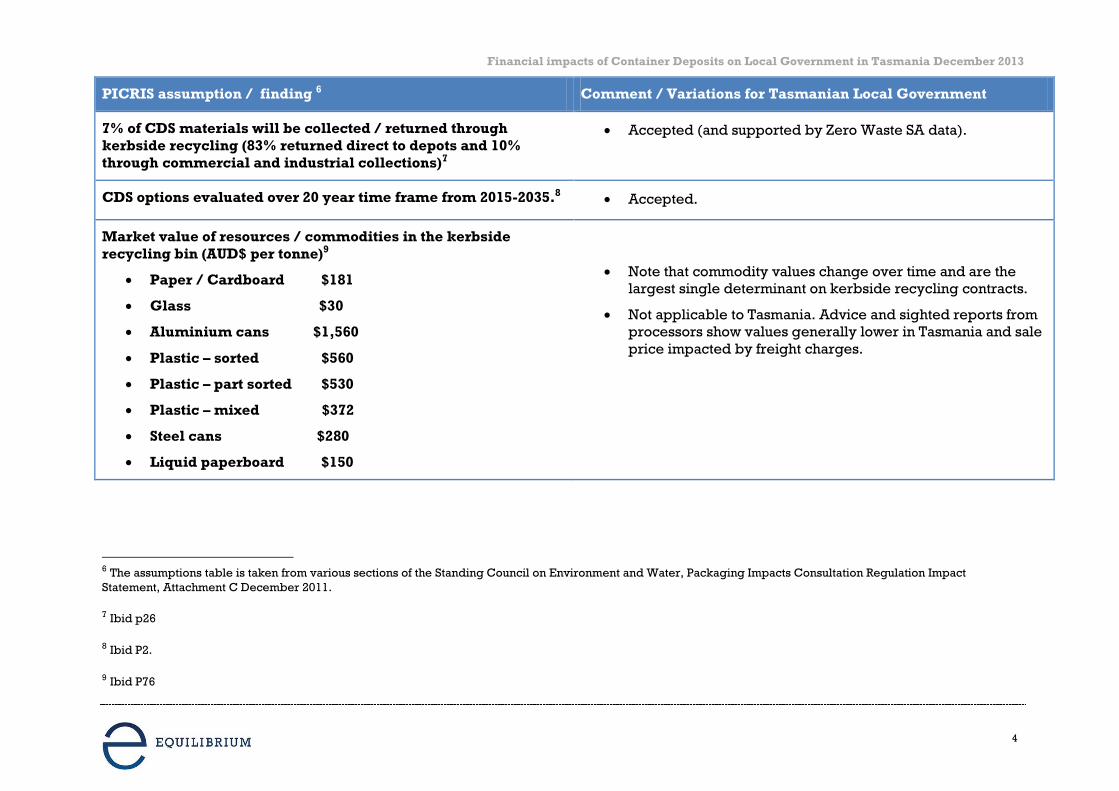
PICRIS assumption / finding 6 Comment / Variations for Tasmanian Local Government
7% of CDS materials will be collected / returned through
kerbside recycling (83% returned direct to depots and 10%
through commercial and industrial collections)7
Accepted (and supported by Zero Waste SA data).
CDS options evaluated over 20 year time frame from 2015-2035.8 Accepted.
Market value of resources / commodities in the kerbside
recycling bin (AUD$ per tonne)9
Paper / Cardboard $181
Glass $30
Aluminium cans $1,560
Plastic – sorted $560
Plastic – part sorted $530
Plastic – mixed $372
Steel cans $280
Liquid paperboard $150
Note that commodity values change over time and are the
largest single determinant on kerbside recycling contracts.
Not applicable to Tasmania. Advice and sighted reports from
processors show values generally lower in Tasmania and sale
price impacted by freight charges.
6 The assumptions table is taken from various sections of the Standing Council on Environment and Water, Packaging Impacts Consultation Regulation Impact
Statement, Attachment C December 2011.
7 Ibid p26
8 Ibid P2.
9 Ibid P76

Financial impacts of Container Deposits on Local Government in Tasmania December 2013
5
PICRIS assumption / finding 6 Comment / Variations for Tasmanian Local Government
Litter projections (% reduction in litter by weight)10
Year All packaging Beverage packaging
2010 0 0
2015 5 5
2020 7.2 25
2025 11.5 25
2030 12.4 30
2035 12.4 30
Accepted
National benefit of $144 million in reduced litter management
costs over 20 years.
(extrapolated to Tasmania that would be $3.2 million over 20
years, an average of $161,00 a year)
Accepted.
$10 million reduction nationally per year for kerbside recycling
services based on average collection costs of $187 per tonne and
processing cost of $85 per tonne.
Accepted.
Note average national collection and processing costs not
applicable to Tasmania.
10 Ibid P 33.

Financial impacts of Container Deposits on Local Government in Tasmania December 2013
6
PICRIS assumption / finding 6 Comment / Variations for Tasmanian Local Government
Assumed weight per container and number of containers per
tonne of material.11
Material Weight (grams) Containers per tonne
Glass 209.0 4,784
Aluminium 15.0 66,821
PET 34.2 29,205
HDPE 50.0 20,008
LPB 41.6 24,060
Accepted.
11 Ibid P 72

Financial impacts of Container Deposits on Local Government in Tasmania December 2013
7
4. Overall impact on Tasmanian Local Government kerbside recycling
A CDS would have impacts across a wide range of current recycling and waste management
services and related activities that are currently provided by or contracted by Local
Government in Tasmania.
A CDS is intended to deliver improved outcomes as it increases the beverage container
recycling rate, reduces beverage litter and has associated benefits to kerbside recycling.12 For
local government kerbside recycling systems it means potential savings in collection costs and
gate fees.
This study has found that the most significant change that can be accurately assessed and
modelled at this time is in relation to kerbside recycling systems.
The financial information and other data available in relation to public place recycling and
litter management is not sufficiently consistent or detailed across councils to enable analysis.
Impacts related to litter management and public place recycling can be assessed however the
lack of consistent comparable data means these are general findings and observations. The
data disparity is because there is currently no common approach to how Local Governments
manage and budget their litter management and public place recycling programs.
The overall impact of a CDS to kerbside recycling systems in Tasmania will be a function of
reduced volumes of recyclables being collected and processes and changes to the value of the
materials in the kerbside bin.
The PICRIS estimates that 80% of CDS materials will be returned directly to CDS depots and
that of the remainder, 10% will be returned through commercial and industrial recycling
systems and 7% through kerbside recycling systems. This will ultimately result in a 17%
reduction of the total tonnes of materials through kerbside recycling. This will occur over time
as a CDS is established starting at about 12% in the short term, 15% in the medium term and
17% in the long term and on-going.
The following shows the total change in tonnes for kerbside recycling in Tasmania.
Chart 2: Change to kerbside tonnes collected in Tasmania with a CDS
12 Standing Council on Environment and Water, Attachment B, packaging options report. PWC and Wright
Corporate Strategies December 2011.
39,000 34,320 33,150 32,370
Current With CDS short term
(0 - 3 years)
With CDS medium
term (3 - 5 years)
With CDS long term
(5+ years)

Financial impacts of Container Deposits on Local Government in Tasmania December 2013
8
4.1 Change to collection costs
The PICRIS estimates that the cost of collecting household kerbside recycling and transporting
it to a material recovery facility is $187 per tonne 13. Using the average collection cost of $187
per tonne, the PICRIS assumes that a reduction in tonnes collected will lead to a reduction in
collection costs. While it notes that collections are charged per lift and the same number of
bins will need to be collected despite the reduced volumes, it estimates that reduced
collection benefits will accumulate slowly over time to the point where nationally there will be
a saving of $10 million per year in the year 2035.
Proportionally for Tasmania that will mean a reduction in kerbside collection costs of $224,000
per year in the year 2035.
Current kerbside collection costs in Tasmania vary greatly from about $150 per tonne to more
than $400 per tonne. On a simple average across Tasmania kerbside collection costs are
estimated to be $215 per tonne, 15% higher than the national average.
On this basis in accordance with the PICRIS reduced kerbside collection costs for Local
Government in Tasmania may be in the region of $257,000 per year. On current kerbside
practices and volumes this will translate to a reduction in collection costs of $1.31 per service
per year.
Tasmanian collection companies and industry operators generally support the PICRIS findings,
namely that a reduced volume of kerbside recycling will not immediately and directly lead to a
reduction in collection costs but over time there will be opportunities for savings.
They note that there may be reduced collection costs associated with collection vehicles in
rural areas potentially doing longer runs and in metropolitan areas where there may be
reduced returns to drop off points and sorting facilities.
4.2 Change to value of materials
A CDS will increase the value of the materials and therefore potentially provide the sorting
operator with more revenue which may be able to be passed on to councils as a reduced
system cost / gate fee.
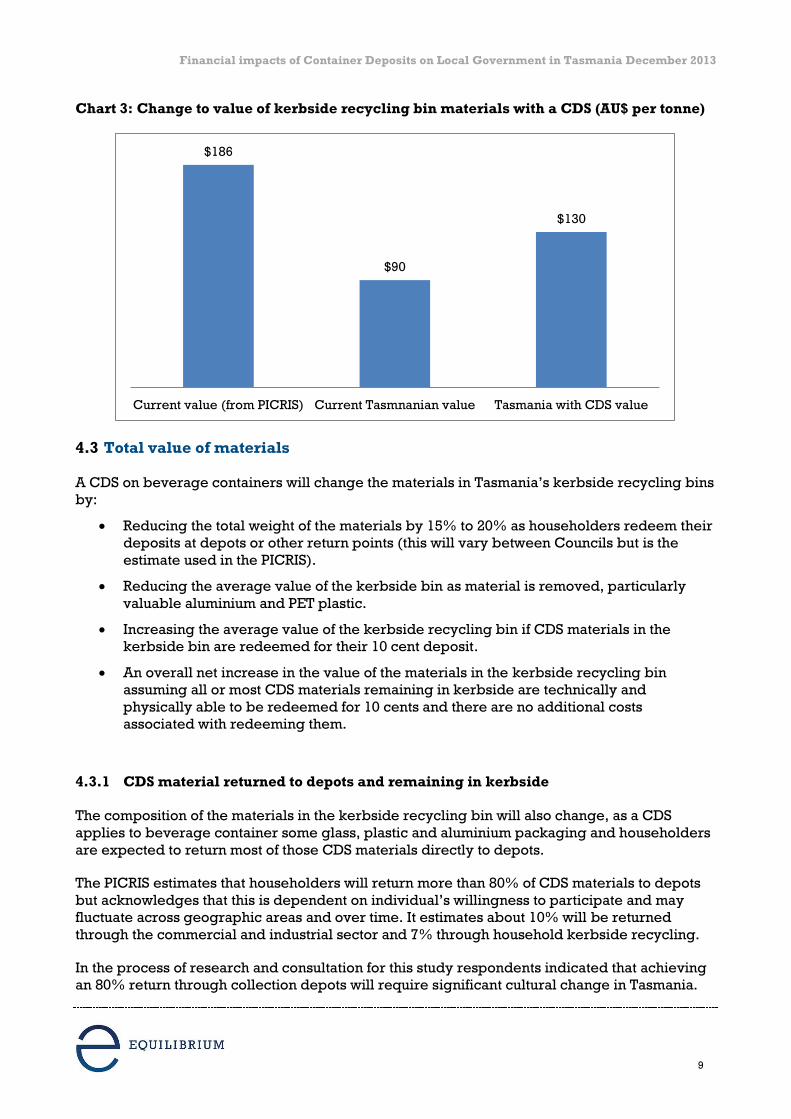
It is assessed that the value of the materials in kerbside in Tasmania will increase from an
average of about $90 per tonne to $130 per tonne. This is due to the CDS materials remaining in
kerbside which are assumed to be able to be redeemed for their 10 cent value. While a CDS
will remove valuable materials from kerbside, PET plastic and aluminium in particular, the
redeemable deposits increase the value in total and overall as long as the containers are able
to be separated and the deposits redeemed.
The increased value is different in Tasmania also because of the glass present in kerbside
recycling. The proportion of glass in kerbside in Tasmania is generally higher than other
jurisdictions and the national average and currently has little or no value. While not all glass
material in kerbside will be eligible for a CDS, that proportion that is will have a greatly
increased value.
13 Packaging Impacts Consultation Regulation Impact Statement, Standing Council on Environment and Water. PWC
and Wright Corporate Strategies, 2011. Attachment C p57.
Financial impacts of Container Deposits on Local Government in Tasmania December 2013
9
Chart 3: Change to value of kerbside recycling bin materials with a CDS (AU$ per tonne)
4.3 Total value of materials
A CDS on beverage containers will change the materials in Tasmania’s kerbside recycling bins
by:
Reducing the total weight of the materials by 15% to 20% as householders redeem their
deposits at depots or other return points (this will vary between Councils but is the
estimate used in the PICRIS).
Reducing the average value of the kerbside bin as material is removed, particularly
valuable aluminium and PET plastic.
Increasing the average value of the kerbside recycling bin if CDS materials in the
kerbside bin are redeemed for their 10 cent deposit.
An overall net increase in the value of the materials in the kerbside recycling bin
assuming all or most CDS materials remaining in kerbside are technically and
physically able to be redeemed for 10 cents and there are no additional costs
associated with redeeming them.
4.3.1 CDS material returned to depots and remaining in kerbside
The composition of the materials in the kerbside recycling bin will also change, as a CDS
applies to beverage container some glass, plastic and aluminium packaging and householders
are expected to return most of those CDS materials directly to depots.
The PICRIS estimates that householders will return more than 80% of CDS materials to depots
but acknowledges that this is dependent on individual’s willingness to participate and may
fluctuate across geographic areas and over time. It estimates about 10% will be returned
through the commercial and industrial sector and 7% through household kerbside recycling.
In the process of research and consultation for this study respondents indicated that achieving
an 80% return through collection depots will require significant cultural change in Tasmania.
$186
$90
$130
Current value (from PICRIS) Current Tasmnanian value Tasmania with CDS value
Financial impacts of Container Deposits on Local Government in Tasmania December 2013
10
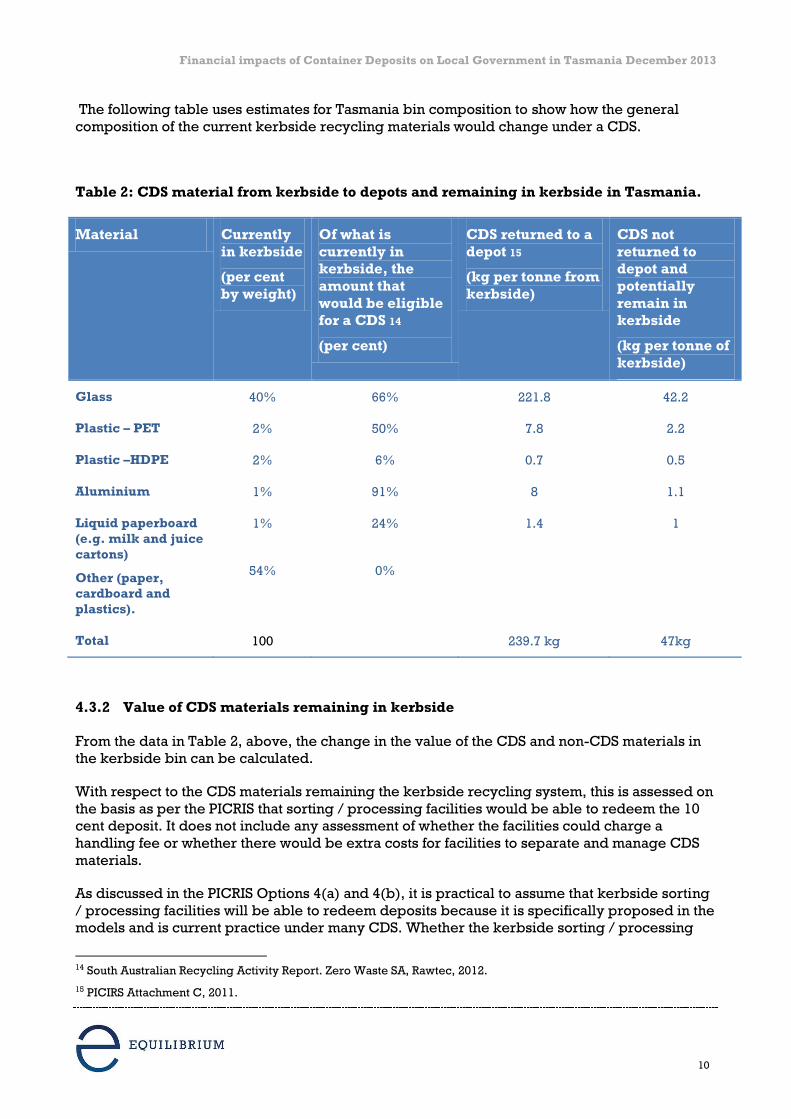
The following table uses estimates for Tasmania bin composition to show how the general
composition of the current kerbside recycling materials would change under a CDS.
Table 2: CDS material from kerbside to depots and remaining in kerbside in Tasmania.
Material Currently
in kerbside
(per cent
by weight)
Of what is
currently in
kerbside, the
amount that
would be eligible
for a CDS 14
(per cent)
CDS returned to a
depot 15
(kg per tonne from
kerbside)
CDS not
returned to
depot and
potentially
remain in
kerbside
(kg per tonne of
kerbside)
Glass 40% 66% 221.8 42.2
Plastic – PET 2% 50% 7.8 2.2
Plastic –HDPE 2% 6% 0.7 0.5
Aluminium 1% 91% 8 1.1
Liquid paperboard
(e.g. milk and juice
cartons)
Other (paper,
cardboard and
plastics).
1%
54%
24%
0%
1.4 1
Total 100 239.7 kg 47kg
4.3.2 Value of CDS materials remaining in kerbside
From the data in Table 2, above, the change in the value of the CDS and non-CDS materials in
the kerbside bin can be calculated.
With respect to the CDS materials remaining the kerbside recycling system, this is assessed on
the basis as per the PICRIS that sorting / processing facilities would be able to redeem the 10
cent deposit. It does not include any assessment of whether the facilities could charge a
handling fee or whether there would be extra costs for facilities to separate and manage CDS
materials.
As discussed in the PICRIS Options 4(a) and 4(b), it is practical to assume that kerbside sorting
/ processing facilities will be able to redeem deposits because it is specifically proposed in the
models and is current practice under many CDS. Whether the kerbside sorting / processing
14 South Australian Recycling Activity Report. Zero Waste SA, Rawtec, 2012.
15 PICIRS Attachment C, 2011.

Financial impacts of Container Deposits on Local Government in Tasmania December 2013
11
facility will experience additional costs to separate and manage CDS materials, and be able to
recoup any such costs through handling fees or the like, will be dependent on the detailed
operation of the specific CDS system. As such it cannot be assessed or quantified for this study
but is a factor for further consideration.
Table 3: CDS eligible material in kerbside returned to a depot16.
Material % of material type CDS
eligible.
% of CDS material
returned directly to a
depot.
Glass 66% 84%
Plastic – PET 50% 78%
Plastic - HDPE 6% 59%
Aluminium 91% 88%
Liquid paperboard 24% 58%
Table 4: Value of CDS materials remaining in kerbside assuming 100% collection and
deposit return.
Material CDS not returned
to depot and
potentially
remain in
kerbside
(kg per tonne of
kerbside)
Units per tonne17 Units of CDS
materials
remaining in
kerbside
(number per
tonne of
kerbside)
CDS 10 cent
deposit
redeemable
value
($)
Glass 42.2 4,784 202 20.20
Plastic – PET 2.2 29,205 64 6.40
Plastic –HDPE 0.5 20,008 10 1.00
Aluminium 1.1 66,821 73 7.30
Liquid
paperboard 1 24,060 24 2.40
Total 35.6 kg 373 $37.30
16 South Australian Recycling Activity Report. Zero Waste SA, Rawtec, 2011.
17 PICRIS Attachment c, Page 71, 2011.

Financial impacts of Container Deposits on Local Government in Tasmania December 2013
12
The above assumes 100% of CDS material remaining in the kerbside recycling system is able
to be sorted and redeemed for its deposit value. Council and industry respondents raise the
issue that this may not be practical as some CDS materials may be separated and baled with
non-CDS materials and some CDS materials may not be able to be redeemed because they are
damaged, for example broken glass bottles.
It is noted however that PICRIS CDS Option 4 (a) proposes that recyclers can redeem
containers based on a weight based formulae and through an audit based approach. This will
mean no sorting is required and all CDS materials can be redeemed, thereby minimising
changes to current sorting practices and maximising redemption of deposits.
Tasmanian sorting and processing operators indicated that without significant system changes
very little glass will be recoverable and that operational changes will be required if the CDS
materials need to be separately sorted and accounted in order to redeem deposits.
No quantifiable data could be sourced to model this issue so for the purpose of this study it is
assumed 100% of CDS material remaining in the kerbside recycling system is able to be sorted
and redeemed for its deposit value.
4.4 Change in the kerbside recycling bin resource value
Further to the above increase in the value of the kerbside recycling bin, there also needs to be
consideration of any change in the general value of the materials for the glass, aluminium,
plastic and liquid paper board that is removed from the kerbside recycling and goes straight
to a CDS depot.
The PICRIS notes that under the CDS options “...a large quantity of recyclables would be
diverted from the kerbside and C&I collection systems... there would be lost benefits for these
parties (local government) from the value of recovered materials, which have not been
quantified”18.
Other reports have sought to quantify the lost benefits, for example the BDA Group and Wright
Corporate Strategy Report 201019 estimated a total loss of material value of $90 million per year
based on medium term prices.
The PICRIS uses medium term price estimates of the market value of packaging materials
(resources) based on a range of sources20 and also estimates a price premium for materials
collected through a CDS due to reduced contamination.
While the total volume of kerbside materials collected is estimated to reduce reduces by 17%
the increase in the value of the materials in the kerbside recycling bin means the total value of
kerbside materials in Tasmania will increase with a CDS.
18 PICRIS Page 54.
19 Beverage Container Investigation, Revised Final Report, BDA Group and Wright Corporate Strategies, 2010.
20 PICRIS Attachment C Page 76.

Financial impacts of Container Deposits on Local Government in Tasmania December 2013
13
Chart 4: Change to the total value of kerbside materials in Tasmania with a CDS
5. Southern Waste Strategy Authority
The councils comprising the Southern Waste Strategy Authority provide recycling services to
about 97,000 premises and currently collects more than 19,000 tonnes of material for
recycling21.
Current kerbside collection and recycling practices and costs vary from council to council.
Due to the volume of materials and relative population concentration the region generally
enjoys some of the most competitive rates in Tasmania. As such, the potential impacts of a CDS
in terms of benefits through any achievable cost reductions across the system will be slightly
lower than other regions.
In accordance with the PICRIS the following models the changes to kerbside recycling based
upon estimated reductions in collections and materials through the kerbside recycling system.
Chart 5: Southern Waste Strategy Authority change in kerbside tonnes with a CDS.
21 The amount collected per premises across the three regional groups varies due to a range of factors
including differences in local recycling systems, demographics and participation rates.
$3,510,000
$4,461,600 $4,309,500 $4,208,100
Current value With CDS short term
(0 - 3 years)
With CDS medium
term (3 - 5 years)
With CDS long term
(5+ years)
Current Short term
(0 - 3
years)
Medium
term
(3 - 5
years)
Long term
(5+ years)
19,104 16,812 16,238 15,856
Financial impacts of Container Deposits on Local Government in Tasmania December 2013
14
As per the PICRIS, the region will potentially have reduced collection and processing costs as
well associated with the reduced amount of kerbside recycling.
Southern Waste
Strategy Authority
Total reduction per
year (AU$)
Per tonne (AU$) Per service (AU$)
Collection $125,000 $6.59 $1.30
Processing $167,000 $8.74 $1.72
Total $292,000 $15.33 $3.02
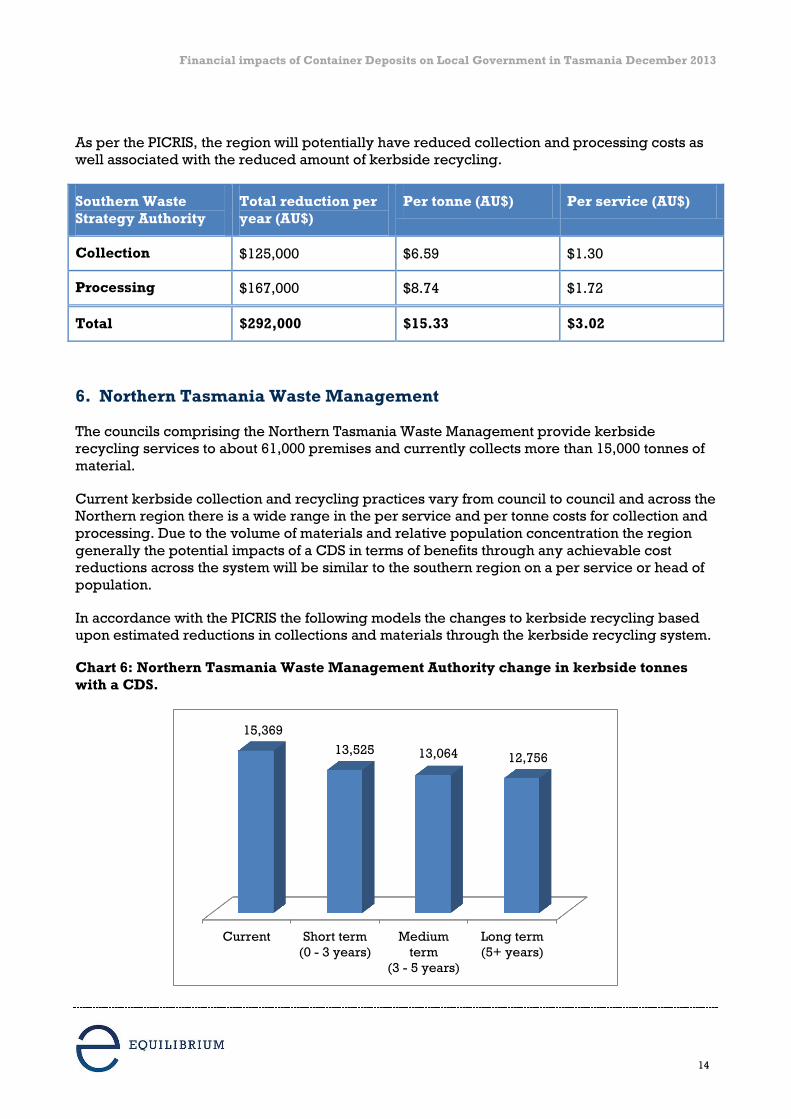
6. Northern Tasmania Waste Management
The councils comprising the Northern Tasmania Waste Management provide kerbside
recycling services to about 61,000 premises and currently collects more than 15,000 tonnes of
material.
Current kerbside collection and recycling practices vary from council to council and across the
Northern region there is a wide range in the per service and per tonne costs for collection and
processing. Due to the volume of materials and relative population concentration the region
generally the potential impacts of a CDS in terms of benefits through any achievable cost
reductions across the system will be similar to the southern region on a per service or head of
population.
In accordance with the PICRIS the following models the changes to kerbside recycling based
upon estimated reductions in collections and materials through the kerbside recycling system.
Chart 6: Northern Tasmania Waste Management Authority change in kerbside tonnes
with a CDS.
Current Short term
(0 - 3 years)
Medium
term
(3 - 5 years)
Long term
(5+ years)
15,369
13,525 13,064 12,756

Financial impacts of Container Deposits on Local Government in Tasmania December 2013
15
As per the PICRIS, the region will potentially have reduced collection and processing costs as
well associated with the reduced amount of kerbside recycling.
Northern Tasmania
Waste Management
Authority
Total reduction per
year (AU$)
Per tonne (AU$) Per service (AU$)
Collection $79,000 $5.18 $1.30
Processing $105,000 $6.88 $1.73
Total $184,000 $12.06 $3.03
7. Cradle Coast Waste Management Group
The councils comprising the Cradle Coast Waste Management Group provide kerbside
recycling services to about 38,000 premises and currently collects about 4,500 tonnes of
materials.
The data available for Cradle Coast is not as granular as that provided from other regions and
as such it is not practical at this time to comment on variations from council to council. Overall
and due to the population distribution, volumes of materials and transport requirements, the
collection and processing costs for the region are the highest in Tasmania.
In accordance with the PICRIS the following models the changes to kerbside recycling based
upon estimated reductions in collections and materials through the kerbside recycling system.
Chart 7: Cradle Coast Waste Management Group change in kerbside tonnes with a CDS.
As per the PICRIS, the region will potentially have reduced collection and processing costs as
well associated with the reduced amount of kerbside recycling.
Current Short term
(0 - 3 years)
Medium term
(3 - 5 years)
Long term
(5+ years)
4,578
4,029 3,891 3,800

Financial impacts of Container Deposits on Local Government in Tasmania December 2013
16
Cradle Coast Waste
Management Group
Total reduction per
year (AU$)
Per tonne (AU$) Per service (AU$)
Collection $51,000 $11.23 $1.33
Processing $68,000 $14.89 $1.77
Total $119,000 $26.12 $3.10
8. Factors influencing value of materials
There are a number of factors that need to be considered with respect to the findings related to
changes to kerbside recycling in Tasmania.
The findings are a snap-shot of current performance and arrangements in comparison to the
estimates in the PICRIS and as such will be adjusted if some fundamentals change, particularly
with respect to (i) the current costs or payments related to Tasmania Local Government
kerbside recycling contracts and (ii) the amount of CDS material that may remain in the
kerbside recycling bin and be able to be recovered for redemption.
(i) Current costs or payments related to kerbside recycling sorting / processing.
Contracts are dependent on factors such as:
Volumes.
Quality (mix of materials and levels of contamination).
Timing (current commodity / resource value / price).
Term of contract.
Proximity.
Freight costs.
Other market forces (such as landfill prices, global recycling activity, global commodity
prices).
(ii) The amount of CDS materials remaining in kerbside.
This study has used the PICRIS assumptions regarding the amount of CDS materials remaining
in the kerbside system. The PICRIS estimates that 7% of CDS materials will recovered through
the kerbside recycling system and that this material constitutes 15% to 20% of the current
weight of the current kerbside recycling bin.
Any containers with a CDS deposit remaining in the kerbside recycling bin will have a higher
value per unit than the inherent resource / commodity value of the raw material, as the
following table shows.
The greater the amount of CDS material that remains in the kerbside recycling bin and that can
be redeemed the greater the value of the kerbside recycling bin.
For this study it has been assumed that all CDS materials remaining in the kerbside recycling
bin can be redeemed and at the rate of a 10 cent deposit. It does not include any handling fee

Financial impacts of Container Deposits on Local Government in Tasmania December 2013
17
or charge. While CDS Option 4(b) proposes handling fees, any such fees will be a separate
transaction between the recycler and the CDS operator and therefore not directly impact
council costs.
Other factors may reduce this benefit and the benefit of greater amounts of CDS material in the
kerbside recycling bin. These include:
The cost of collecting and redeeming CDS materials.
Broken or otherwise unredeemable CDS materials.
Administration and reporting requirements.
9. Litter management
The PICRIS uses Sustainability Victoria 2009 data on litter costs and other sources to estimate
there would be a national benefit of $144 million over 20 years in avoided litter clean-up costs.
The PICRIS uses a rising scale of litter reduction, reflecting the fact that a CDS would only apply
to a range of littered items and the rising amounts of materials being returned through a CDS
over time and therefore not available to be littered.
For Tasmania on a proportional distribution that will mean a total litter saving of $3.2 million
over 20 years or an average of $160,000 per year.
Current information provided by Tasmanian Local Governments for this study is not sufficient
to make definitive findings in respect to whether the PICRIS estimate is applicable to Tasmania.
While many Councils can provide details of their litter management infrastructure,
management and disposal costs, some include other related waste management activities such
as illegal dumping management and waste related education and communication. As such it is
not practical at this time to provide a detailed assessment.
The PICRIS assumes in Options 4(a) and (b) there would be no change to incidents of litter in
the initial years but reductions by weight of:
5% at 2015
7.2% at 2020
11.5% at 2025
12.4% at 2030 and beyond
The potential for a CDS to benefit Tasmanian Local Government through avoided litter requires
further assessment however consistent with the PICRIS, litter management practices will be
unlikely to change in the short term under a CDS but may in the medium to long term.
10. Public place recycling
The PICRIS costs or benefits related to public place / away from home recycling cannot solely
be allocated to Local Government as the PICRIS identifies that the costs and benefits are
distributed to different degrees to recyclers and Local Government.
Information provided by Tasmania Local Government for this study with respect to public place
recycling is not sufficient to make definitive quantitative findings in respect to financial impacts

Financial impacts of Container Deposits on Local Government in Tasmania December 2013
18
applicable to Tasmania or by regions.
While many Tasmania Councils have public place recycling systems and can provide details of
their public place recycling infrastructure and costs, the majority can not provide details on
volumes or composition of materials. Also, some Councils have their public place recycling
included with their household and / or business kerbside collection and processing, and as
such quantities and costs are not currently known.
For those that can separate collection and processing quantities and costs, there is a wide
range of current performance as programs range from a small number of public place bins in
town centres to hundreds of bins across whole municipalities.
The potential impact of a CDS on local government public place recycling systems is expected
to vary greatly depending on the extent of existing programs. It is likely that the value of the
materials in the public place recycling system will increase under a CDS, and therefore
enhance local government options for negotiating with collection and sorting / processing
companies for improved services, terms and conditions.
11. Conclusion
Based on the data and information provided it has been possible to assess Tasmanian kerbside
recycling and detail the potential financial impacts of a CDS. It has not been possible however
to provide detailed analysis and reporting on the potential impacts for litter management and
public place recycling.
Fundamentally this study finds that the financial impacts of a CDS on Tasmania Local
Government are best examined on an individual council basis as the variety of waste
management arrangements and systems means impacts will vary from council to council.
Taken as a whole, the nature of Tasmanian kerbside recycling systems is such that a CDS will
provide net financial benefits.
This study finds that reduced kerbside costs in Tasmania as a result of a CDS may at best be
$26.8 million over 20 years or on average $1.3 million per year.
The PICRIS relies on national averages for recycling, litter and related costs. The situation in
Tasmania is different from other Australian States and territories and the national averages are
not applicable. As such the potential financial impacts of CDS on Local Government in
Tasmania differ from the PICRIS.
Of particular note in Tasmania is that current collection and processing costs are higher than
the national average, contamination rates are generally high, the proportion of glass in
kerbside is higher and the value of recyclable materials collected is lower than the national
average.
Tasmania also manages some issues not common elsewhere in Australia, such as limited local
end-markets for all materials, limited opportunities for glass processing and higher freight
costs.
The extent to which the identified benefits can be realised is dependent on collection and
sorting operations being able to achieve the modeled outcomes and the on-going capacity and
capability of the Tasmanian kerbside system as a whole. Key to this is their ability to efficiently

Financial impacts of Container Deposits on Local Government in Tasmania December 2013
19
redeem deposits of the maximum amount of any CDS materials remaining in the kerbside
system and reduce operational costs in line with the reduction in overall tonnes being sorted.
Overall while the impacts of a CDS for Tasmania local government are not as beneficial as
generally estimated in the PICRIS, a CDS will potentially be beneficial to the viability of the
Tasmania kerbside recycling system as it will increase the redeemableconvertible value of the
materials in a kerbside recycling bin.

Financial impacts of Container Deposits on Local Government in Tasmania December 2013
20
Appendix
Following is a full description of the CDS models used in the PICRIS; Standing Council on
Environment and Water Attachment B, Packaging Options Report, PWC and Wright Corpoirate
Strategies, December 2011.
Option 4: Mandatory CDS This option would involve establishing a mandatory CDS. It would be a deposit-refund arrangement under the co-regulatory or mandatory provisions of the Act. Depending upon the design of the scheme, it may also require a separate levy bill and consequently would require amendments to the Product Stewardship Act related to administration of levy funds. Under this option consideration could also be given to prohibiting the sale and import and manufacture of non-recyclable beverage containers. Two sub-options are proposed for this option: a) Boomerang Alliance CDS, and b) Hybrid CDS. The two sub-options both cover beverage containers and have a deposit of $0.10. However, they each have different levels and types of infrastructure. The Boomerang Alliance CDS is based on a hub-and-spoke model of 560 collection centres (approximately half of which are also ‘hubs), 640 reverse vending machines (RVMs) and a range of other convenient collection point locations such as large shopping centres. Whereas the Hybrid CDS would be based around store-front-style depots (similar to those used in the British Columbian CDS), which would be complemented by RVMs. Problems and barriers targeted by option This option would seek to address the market failure of coordination, transaction costs and free riders. As a mandatory option, all beverage companies would have to impose the deposit, meaning there would be no scope for free-riding. This option would also, to a certain extent, target the problem of negative externalities. By providing incentives to consumers to recycle their beverage containers, some of the benefits to society would be captured in the transaction and the externality would be, to some extent, mitigated. To the extent that it was successful in addressing these market failures, this option would particularly target land filling of beverage containers and littering of beverage containers. Removing large amounts of glass from kerbside recycling can also improve rates of recycling through the kerbside system, by reducing contamination of other materials (e.g. when broken glass becomes imbedded in cardboard and therefore cannot be recycled). Reduced contamination also results in an improved recycled product, particularly for glass. Therefore, it would seek to target the following manifestations of the market failures:
Packaging contains embedded resources, some of which are non-renewable but which are lost under
current disposal methods: In increasing the recycling rate, this option would assist in addressing the problem of lost resources.
Landfill of packaging imposes external costs on third parties: By increasing recycling rates, this
option would reduce landfill and therefore, reduce the external costs of landfill.
Landfill of packaging results in the alienation of land and results in direct cost: By increasing
recycling rates, this option would reduce landfill and therefore, reduce the direct costs of landfill,.
Packaging that is discarded as litter has a range of negative impacts on society: By reducing litter this
option would mitigate some of the negative impacts on society. It was identified in the problem statement that there are a range of barriers to recycling in public places. The introduction of a CDS would provide an incentive that may mitigate some of these barriers to public place recycling.

Financial impacts of Container Deposits on Local Government in Tasmania December 2013
21
Option 4 (a) Boomerang Alliance CDS The Boomerang Alliance has proposed a CDS sub-option which covers a broad range of beverage containers. The product range contemplated would typically be used in household and business settings, and for away-from- home personal consumption. The container scale would be up to and including 3 litres. This option is based on a hub and spoke container redemption/collection model operated through a mandatory product stewardship scheme. The below description of the Boomerang Alliance CDS is based on information provided to WCS on the option and WCS assessment of the practical design of the option. Coverage The CDS would cover all beverage containers up to 3 litres and liable parties would be all constitutional corporations that manufacture any ready to drink product beverage containers covered by the scheme. Operations The CDS would be available to any business or individual. A refund of $0.10 per container would be available at a diverse range of collection points that would be centred on a regional basis (a requirement would be to distribute collection centres geographically to ensure coverage and consumer convenience, in order to achieve the recycling and litter targets): 200-250 hubs (subject to verification after population/geographic analysis) - Each hub would establish a set of container redemption/collection points within a designated region. Hubs would manage receipt of containers from high volume collection points such as kerbside recovery, large public events food courts hotels and clubs, while also acting as a consolidation point for collection point operators (reverse vending machines). Hubs would be established at a ratio of 1 hub per 200,000 homes in metropolitan areas and 1 hub for about 50,000 homes in rural and remote areas (e.g. for clusters of townships). Around 700 rural and remote hubs would service smaller townships, rural and remote locations reducing transportation costs. They could take other products.
High volume redeemers such as kerbside collectors, food courts and waste services
operators would be given permission to redeem containers based on a weight based formulae to reduce sorting costs both for the collector and the redemption point.
Collection point operators would accept designated containers, refund deposits and collate
containers by material type - Containers would preferably be crushed or destroyed at the collection point. Unitised, destroyed containers would be transferred to the relevant hub in accordance with adopted operating procedures. Hub operators would then transfer unitised container loads to downstream material reprocessors.
Approximately 640 reverse vending machines (likely to be more subject to verification after
population/geographic analysis) - RVMs would be installed at core consumption centres servicing a population base of at least 4,000 homes so that they deliver a financial benefit.
Up to 560 collection centres of which about half are also the hubs noted above (subject to
verification after population/geographic analysis) - Thus up to 230 additional collection centres would be established to collect containers and may include RVMs where appropriate. There may be opportunities to make these available to a range of other recyclables such as cardboard and e-waste. Part time collection centres would typically be found in smaller townships and suburbs of less than 4,000 homes and more than 20 kilometres from a larger centre. Rural and remote areas would be serviced through arrangements with outback stores and other similar retail outlets.
Convenient collection points - Retailers would generally have the option to provide container collection
services and refund deposits. Large shopping centres however (say 1,000 m2) would be encouraged or required to provide a container collection point within their parking facilities (unless within 500 metres from an established collection point). This CDS would likely require significant investment in infrastructure purchase, installation and operation over the regulatory analysis period (though it is recognised that the use of existing infrastructure, such as transfer stations, would be maximised to control infrastructure development costs). Investment would be made by private operators not government or the scheme operators. A CDS not-for-profit organisation would be established to manage the scheme and oversee the payment of receipts in and out of a government operated fund. The organisation would advance deposit redemption

Financial impacts of Container Deposits on Local Government in Tasmania December 2013
22
payments through the hubs to container collection points and reverse vending machines. Each rural and remote hub would operate the scheme in their territory; consolidate all deposits collected at point of sale; and collect revenue gained from sale of redeemed recyclate. Collection fees would be paid net of the value of recyclate sales, i.e. a fee of 3.6¢ per container less recyclate value was previously modelled by Boomerang Alliance. System operating costs would be significantly reduced by:
No requirement to sort containers by brand
Allowing destruction and compaction of containers to be undertaken at the hub reducing transportation
costs to reprocessors. The CDS will have an impact on volumes being managed by council kerbside collections and hence their collection costs and current contracting arrangements. The removal of a significant quantity of glass from kerbside recycling would reduce contamination and increase compaction rates. This option would require consideration of transitional issues in SA and the Northern Territory (NT). Governance The scheme would be administered by an independent not-for-profit corporation which would control the funding pool and take responsibility for overall governance of the scheme. The scheme administrator would appoint hub operators on a competitive basis. Unredeemed deposits and recyclate sales returns would be controlled by the scheme administrator and would be used as a first priority to offset handing fees; with remaining funds allocated to other programs to improve recycling of materials collected. Local hub operators would be responsible for running the system in their local region and tender local collection points on a viable financial basis. The scheme administrator would pay the hub operator a handling fee net of material sales revenue and would pass deposit refunds through the hub. The hub would pay handling fees to collection point operators, as well as deposit redemption funds. The scheme would be regulated under the Product Stewardship Act and regulatory provision would be needed to require larger supermarkets to install RVMs in outdoor parking spaces, if there is not a public facility within a specified distance. Suggested outcomes Performance indictors would include improvement in container recycling, a reduction in container litter and any associated benefits to kerbside recycling. WCS will forecast quantitative outcomes for the CBA. The Boomerang Alliance, the proponents of this option, suggest that it could achieve a recycling rate of 82% and a reduction in the volume of litter of 19% after 3 years of operation.
Option 4 (b) Hybrid CDS This sub-option is a national CDS model based on learning’s from international case studies and from elements of the existing SA scheme.27 It draws on MS2 analysis of a potential Australian-specific CDS, particularly considering British Columbia’s Encorp Pacific CDS (see Appendix A). It has been tailored to Australian conditions and draws on some data from the existing scheme in SA, as a working example of CDS in Australia. Based on international case study analysis, MS2 established that aspects of the British Columbian CDS can be considered ‘best practice’. These elements of the scheme include:
The industry consortium being responsible for central management of the scheme, ensuring that industry
has reasonable flexibility in running the program
The transparency of financial flows and visibility to consumers
Having all collection and logistics contracted out by the non-profit Product Stewardship Organisation
(PSO) to third parties, and
Having the scheme operated as a cost-based system in which each product type pays its own expenses
with no cross-subsidisation from other products or companies.

Financial impacts of Container Deposits on Local Government in Tasmania December 2013
23
Drawing on the British Columbian CDS and SA CDS, the scheme would cover all containers up to and including 3 litres. It would include wine bottles and milk containers, which are not included in the existing SA CDS. The CDS also differs from the current SA scheme in that it involves a modern mix of collection infrastructure such as store front depots and RVMs. It assumes a deposit of $0.10 per beverage container, as in SA, but increased in $0.10 increments over time to keep pace with inflation. The option initially proposed by MS2 involved a $0.20 refund for all beverage containers in order to address the diminished deposit value over time that affects CDS programs. However, it was determined that using a $0.10 deposit would reduce potential for fraud and allow for a more meaningful analysis of the option as data from the SA scheme can be used.
Coverage This scheme would cover all containers for beverages in liquid or ready to drink form intended for human consumption up to and including 3 litres. Liable parties would be all constitutional corporations that manufacture and sell beverages, and products sold in beverage containers. Operation Key features of this CDS include:
A $0.10 deposit for all beverage containers for beverages in liquid or ‘ready to drink’ form intended for
human consumption, increased by the national inflation rate over time
A principally depot-based approach. Approximately 850 depots would be provided nationally (based on
the amount of depots per capita provided in British Columbia). These would principally be store-frontstyle depots which would be complemented by RVMs. In less densely populated areas, where RVMs are less viable, collection centres would be provided. Using these modern facilities would have a range of advantages such as lower transportation costs and greater convenience for consumers. However, RVMs would not be able to collect all the beverage containers included in the scheme
The depots would be operated by independent owners/operators who would be contracted by the
program administrator and distributed geographically to ensure coverage and consumer convenience
Interested retailers, recyclers and other organisations, such as sporting venues and entertainment
venues, could become approved to be collection centres
The handling fees paid to collection facilities would be between $0.04 to $0.05 per container. The
handling fee has been determined considering the handling fees on oversees CDSs including that in British Columbia. The CDS may have an impact on volumes being managed by council kerbside collections and thus, local government collection costs and current contracting arrangements. The removal of a significant quantity of glass from kerbside recycling would reduce contamination and increase compaction rates. This option would require consideration of transitional issues in SA and the NT. Governance This option is proposed as an industry-driven scheme based on the Product Stewardship Act. Industry would establish a PSO(s) to operate the scheme and meet specified performance targets. This means that industry would be responsible for meeting the full costs of the scheme and provide incentive for the consumer to return beverage containers for recycling. Liable parties would be manufacturers and importers of beverages. The ability for multiple PSO(s) to operate could introduce some competition in the provision of operations. It is assumed that the PSO(s) would need to seek approval from the Australian Government to participate. It is assumed to be a requirement of the PSO(s) to distribute collection centres geographically to ensure coverage and consumer convenience, in order to achieve the recycling and litter targets. The depots could be operated by independent owners/operators contracted by the PSO(s). Such tendering could help minimise impacts on existing systems, as existing operators would seek to compete based on available infrastructure and services. Creative approaches would be encouraged, such as recyclers teaming with community groups to collect and recycle a larger amount of materials (this also occurs in SA). Encorp Pacific requires owner/operators to invest up to CAD $120,000 (~AUD$122,000) to cover leasehold

Financial impacts of Container Deposits on Local Government in Tasmania December 2013
24
improvements and various fees (depending on the size and location of the site) and invest working capital of up to CAD$60,000 (~AUD$61,000) for each depot. Retailers, recyclers and other organisations such as entertainment venues and sporting clubs could also become approved collection centres. The PSO(s) would collect deposits and handling fees from liable parties and be responsible for managing funds consistent with achievement of the program’s objectives (recycling, consumer convenience, etc.). The PSO(s) would be provided latitude in the use of unredeemed deposits, so long as an audited financial overview is undertaken. Retailers and distributors would be responsible for passing the deposits on to consumers. Consumers would need to return eligible containers to depots or RVMs in order to redeem their deposits. This option would also require:
Security initiatives to minimise fraud from deposit collectors due to the higher deposit rates
Enforcement (correct labelling, correct deposit charged/refunded), and
Resourcing (SA employs two full time equivalent to ‘scrutinise’ stores).
It is envisioned that many items would be sorted by the RVMs (avoiding some hand sorting). Additionally, the store-fronts could sort items and crush them prior to transportation. In order to retain approval as a PSO, all PSOs would be required to submit business plans to the Commonwealth Government for approval, ensuring that PSOs are all implementing appropriate initiatives to meet the specified targets. PSOs would be required to submit independently audited reports to the Commonwealth that would report their performance against the specified targets on an annual basis. Any PSO that did not meet its target outcomes would face penalties and sanctions, therefore, providing incentive to PSOs to have a tangible impact on recycling and litter. Suggested outcomes This scheme would result in an increase in the beverage container recycling rate, a reduction in beverage container litter and have associated benefits to kerbside recycling through reduced contamination and increased compaction rates. WCS will forecast these outcomes for the CBA.