an assessment of the impact of introducting a work based...
TRANSCRIPT

An assessment of the impact of introducting a work based development guide
KEMSHED, Matthew and ASKHAM, Phil
Available from Sheffield Hallam University Research Archive (SHURA) at:
http://shura.shu.ac.uk/7587/
This document is the author deposited version. You are advised to consult the publisher's version if you wish to cite from it.
Published version
KEMSHED, Matthew and ASKHAM, Phil (2012). An assessment of the impact of introducting a work based development guide. Sheffield Hallam University Built Environment Research Transactions, 4 (KIER), 69-78.
Copyright and re-use policy
See http://shura.shu.ac.uk/information.html
Sheffield Hallam University Research Archivehttp://shura.shu.ac.uk
1
The Sheffield Hallam University Built Environment Research Transactions
2012 Volume 4 Special Edition with KIER ISSN 1759-3190
Editorial Board
Luke E Bennett Tony Cheetham Zoe Cox Sarah Dickinson Dr Barry Haynes Richard Kebell Dr. Elizabeth Laycock [Editor] Simon Mclean Sam Moorwood
Dave Parsons Dr. Peter Rushforth Richard E. Smith Stuart Smith Prof. Paul Stephenson Prof. Paul Watson Micah Wilson Garry Workman
Purpose of the Series
The aim of this publication is to provide an opportunity for students to publish the findings of their undergraduate or postgraduate work. Guidance on publication will be given by staff who will act as second authors. It is hoped that by providing a guided transition into the production of papers that students will be encouraged throughout their future careers to publish further papers. Guest papers are welcomed in any field relating to the Built Environment. Please contact [email protected]. A template will be provided on request.
Acknowledgements
The editorial team would like to acknowledge and thank Will Hughes, Reader in Construction Management and Economics, University of Reading for permission to use the ARCOM template and the associated resources.
Copyright
It is the responsibility of the author to obtain any permission necessary to reproduce or quote from published work and suitable acknowledgement should always be made.
No part of this publication may be reproduced in any form or by any means, or stored in any retrieval system of any nature without prior written permission, except for fair dealing under the Copyright, Designs and Patents Act 1988, or in accordance with the terms of a licence issued by the Copyright Licensing Agency in respect of photographic and/or reprographic reproduction. Application for permission for other use of copyright material including permission to reproduce extracts in other published work shall be made to the publishers. Full acknowledgement of author, publisher and source must be given.

2
Editorial
As Editor of this publication it has been a great pleasure to work with students from Kier who have been enrolled the B.Sc.(Hons) Construction and Commercial Management course. This course was carefully designed with significant input from industry. The Built Environment Division has always seen vocational and industry relevant education as a key to development of all new courses.
The importance of work based learning is stressed within the programme as it is important to encourage students to continue self-development and life-long learning as well as to work closely with their employers to develop the necessary skills to assist them in their chosen career.
The delivery of this programme was an innovation to the Built Environment Division as it utilises part-time study by intensive block delivery. On campus delivery involves lectures and tutorials with additional curriculum enrichment provided by use of case studies, field situations and material from real situations used to assist the process of learning as well as to ensure it is current and practically applied. While on Campus students are able to access the wide range of traditional resources in the Learning Centre and Resources Room and the Learning Hub. Away from the campus students are supported and assisted to develop responsibility for self-managed study and independent learning by use of a wide range of resources available electronically from the Learning Centre and the Blackboard learning environment.
One of the underpinning ideals of the course is to encourage widening participation by attracting students into HE from groups that are currently under-represented in order to address shortages of intermediate level skills in the national and regional economies.
The papers included in this volume showcase some of the student research work undertaken as part of their Dissertation Module and highlight the high levels of achievement that this, the first cohort, has demonstrated.
As always I would like to extend my personal thanks to the students, their academic co-authors and to the members of the Editorial team who spent so much effort in producing this edition.
Dr Elizabeth Laycock
Editor, Built Environment Research Transactions
Cover Photography courtesy of Kier © 2012
3
CONTENTS
BIM as a Cost Planning Aid
Morné Ferreira ............................................................................................................ 5
Abstract ................................................................................................................... 5
Introduction ............................................................................................................. 5
The role of BIM as an Aid for Cost Planning ......................................................... 6
Research Rationale .................................................................................................. 8
Literature Review .................................................................................................... 9
Method of Analysis – Interviews .......................................................................... 11
Discussion ............................................................................................................. 26
References ............................................................................................................. 27
Time, Cost and Quality: Which constraint do construction professionals from a set company believe to be the most important when delivering construction projects
Sam Murphy ............................................................................................................ 33
Abstract ................................................................................................................. 33
Introduction ........................................................................................................... 33
Literature review ................................................................................................... 35
Results ................................................................................................................... 40
Conclusions ........................................................................................................... 44
References ............................................................................................................. 46
A study into whether the construction of schools effectively meets sustainability standards
Matthew Sparkes ...................................................................................................... 48
Abstract. ................................................................................................................ 48
Introduction. .......................................................................................................... 49
Research rationale. ................................................................................................ 49
Literature review. .................................................................................................. 51
BREEAM; ............................................................................................................. 52
Results ................................................................................................................... 54
Discussion ............................................................................................................. 60
Discussion ............................................................................................................. 63

4
Conclusion. ............................................................................................................ 64
References. ............................................................................................................ 65
An Assessment of the Impact of Introducing a Work Based Development Guide
Matthew Kemshed & Phil Askham .......................................................................... 69
Abstract ................................................................................................................. 69
Introduction ........................................................................................................... 70
Literature ............................................................................................................... 71
Methodology ......................................................................................................... 72
Discussion ............................................................................................................. 74
Conclusions ........................................................................................................... 75
References ............................................................................................................. 77

5
BIM AS A COST PLANNING AID Morné Ferreira 1 Morné Ferreira graduated from Sheffield Hallam University in 2012 with a BSc
(Hons) Construction and Commercial Management.
ABSTRACT
This paper focuses on the use of Building Information Models (BIM) as an aid to provide accurate and intelligent information to produce cost plans or estimates of construction projects. The research assesses whether BIM is being used as an aid to cost planning of construction projects or for other purposes; whether this use is consistent worldwide, and whether the perceived benefits and barriers are similar between users who are familiar with the technology and those who are just setting out. The analysis of the collected data supports the finding of the literature review that the industry itself recognises the need to improve. Where BIM is being used, particularly outside the UK, real and immediate benefits are being realised. The UK’s respondents perceived the following three points as the main benefits of BIM, when considered as an aid to cost planning: increased accuracy of quantities (ranked equal); increased productivity through automated take-off ability (ranked equal); and, real-time costing, which permits immediate decisions to be made which removes abortive works/design. The rest of the world (ROW) perceives the following to be the main benefits: clash detection; ability to view project in 3D; and design changes easily dealt with.
Keywords: BIM, Industry, Cost Planning
INTRODUCTION Overview - The Construction Industry, Innovation and BIM It is estimated that between 1996 and 2006 construction costs rose globally by 89% (Muse, 2012). Furthermore economic competition in the global market place is leading to companies seeking more efficient methods and tools to deliver their product and it is therefore imperative the construction industry finds ways to improve its current practices (Drucker, 1994 as cited by Bowden, et al., 2006; Yoders, 2009). 1 [email protected]

6
Research conducted by the Department for Trade and Industry within the UK in 2003 indicates that the construction industry as a whole has a history of lagging behind other industries with regards to efficiency and innovation (see Table 1 below).
Innovation activity Construction All industries
Product innovation 6% 18%
Process innovation 6% 15%
Long term activity 3% 9%
Innovation expenditure 27% 36%
Co-operation 7% 8%
Table 1 – Percentage of construction companies exhibiting innovation activities in the UK 2003 (Source: DTI, 2003)
Information and Communication Technologies like Building Information Modelling (BIM) have the potential to address the aforementioned market needs (Aouad et al., 1999; Kennett, 2010). According to a study (Based on figures extrapolated from US’ market data in 2008) by the Department of Business, Innovation and Skills, (2011, p.92), BIM can provide the industry with net-savings (offsetting setup costs) of 5% for new build projects and 1.5% for refurbishment projects. Additionally, a study by a major software vendor suggests that the return on investment (ROI) for BIM (M) systems is estimated to be greater than 60% (BIS, 2011, p.92). However, the construction industry is unique as a large part of the production process is often non-standardised (Barlow et al., 2003; Bowden et al., 2006; Rebolj et al., 2000; Peansupap & Walker, 2005; Chen & Kamara, 2008). Consider, amongst other factors, the difficulties resulting from: the different phases of a project within the construction process; the fragmented production and flow of information; the various independent yet interdependent professional disciplines; and, the external supply chain often employed. A case study, based upon a Canadian construction company, by Eastman et al., (2011), they found that a “traditional” approach to information-sharing on a typical $10 million plus project, each project had around 50 different types of document that were generated by 420 different participant companies – running into 56,000 pages of documents. This is certainly indicative of the scale of complexity of the challenge faced by construction professionals.
THE ROLE OF BIM AS AN AID FOR COST PLANNING Before progressing any further with the rationale for the purpose of the research, it is first necessary to clarify and establish what BIM is. Charles Eastman (2008), a Professor in the Colleges of Architecture and Computing at the Georgia Institute of Technology and leading author on BIM, defines BIM as:
“… the digital representation of the building process to facilitate exchange and interoperability of information in a digital format”.

7
Within the UK, proportionately, there are more bankruptcies within the construction industry than any other industry (Hillbrandt, 1984). Financial risks need to be controlled and mitigated during the phases of a project, namely pre-construction, construction, and post-construction. The cost planning and control project should encompass three basic elements, namely:
The setting of a budget; The cost planning and control of the design process; and The cost control of the procurement process (Brandon & Ferry, 1999). Cost planning should be considered central to the planning of a construction project – as the mismanagement and lack of available funds can lead to a project’s failure - whilst alternatively, surplus funds can also be uneconomical (Kaka, 1990 as cited by Askew, et al 1997). Accurate timing and the predictability of funds are essential and therefore the accurate estimates of material quantities may be considered a key activity. Consider further that the construction industry is unique in that a contractor, under some procurement routes, is expected to give a firm price to a client before actually knowing exactly and precisely how much the works and project are going to cost. As it is extremely rare that two projects are exactly the same, new estimates must be produced for each project - this is a time consuming and costly process (Brook, 2008; CIOB , 2009). Current methods, which may vary from cost consultant to cost consultant, are very time consuming and their accuracy is subject to human error (Wilson & Kusomo, 2004). Methods adopted for quantity take-offs include a scale rule and dimension paper; the use of a digitizer or some other form of onscreen take-off software – all of these methods have their respective limitations.
One of the key challenges a cost consultant faces is that a very large part of their time is spent on quantification, i.e. the measurement of the works to be extracted from two dimensional (2D) paper drawings or from electronic drawings. Subject to the level of detail provided and the chosen procurement route, this may be between 50-80% of the tender period (Sabol, 2008). Other complications include design changes, which tend to occur before a firm price has been produced, tender addendums, human error, and the current process of digitizing 2D paper drawings confirmations are why there is a clear need for improvement within the cost planning and estimation processes (McCuen, 2008). The capital cost of a construction project can easily spiral out of control if not managed. Consider “Pareto’s Law” or the 80:20 rule - which applies to most construction projects – suggests that when 20% of the design is complete, 80% of the costs are already committed (RICS, 2011).
There is significant evidence at present (Sabol, 2008; Chuck Eastman, 2008; McCuen, 2008) to suggest that BIM has the capacity to vastly reduce the time spent on quantifying works; whilst also improving the accuracy and creating a very accurate audit trail. A market sample (RICS, 2011a) has been taken from within the UK to establish by which mechanism the industry perceives the benefits of 5D BIM to be delivered. At present very few professional estimators, quantity surveyors (QS), cost planners and cost engineers use quantities generated by BIM for estimation, valuation or cost planning purposes (McCuen, 2010; RICS, 2011a). The importance of

8
preliminary estimates shows why it is vital to control estimates during the early stages of the design so that they can be controlled in construction.
RESEARCH RATIONA LE Data was collected in three stages:
1. Stage 1 – Literature Review.
2. Stage 2 – Exploratory, semi-structured interviews.
3. Stage 3 – Questionnaire/survey.
Literature Review Two primary themes were identified as areas that required further research. The first theme was to establish and understand how BIM is currently perceived within the UK’s construction industry, whilst understanding the current level of use on construction projects. The second theme was the use of BIM as a cost planning and estimation aid.
Interviews The interviews explored the respondents’ professional experience of BIM, particularly in relation to its use as a cost planning aid. The themes emerging were used as the basis for devising subsequent in-depth survey questions.
Online Survey The objective of the survey was to provide statistical validity to the research project and to try to determine where the UK industry stood in comparison to the rest of the world (Liu & Fellows, 2008). The online questionnaire was sent out electronically via e-mail to relevant professionals whose information was available within the public domain and, it was also posted on related online groups for professionals. This provided a more targeted approach to data collection ensuring that the results are valid. The professional bodies consulted are set out in Table 2.

9
Professional Group Number of members (approx.)
Australian Institute of Quantity Surveyors 1,200
Association of Cost Engineers (UK and Europe) 426
Association for the Advancement of Cost Engineers (Worldwide)
12,646
Autodesk Quantity Take-off (USA) 146
BIM Experts (Worldwide) 1,686
Contractor for BIM (Worldwide) 1,500
Chartered Institute of Builders (UK) 7,644
Estimators, Quantity Surveyors and Cost Engineers (Worldwide)
12,700
Construction Networking (Worldwide) 8,827
Cost Engineer Forum (Worldwide) 1,493
Quantity Surveyors (Worldwide) 1,892
RIBA USA 234
RICS BIM (UK) 396
Royal Institute of British Architects (RIBA 9,152
RICS Oceana 1,556
RICS (UK) 18,749
The Professional Estimators Group (Worldwide) 7,700
UK QS and Commercial Management 1,379
TOTAL 89,326
Table 2 – Details of online professional bodies where online survey was posted (via Linkedin).
LITERATURE REVIEW Overview of BIM
Current literature suggests that at present there is an increased resurgence of interest in BIM technologies (Eastman et al., 2011; Young et al., 2009; Buckley, 2008; CM , 2010; Juhola, 2011). Furthermore, in the opinion of a number of leading authors, companies will need to adopt this technology to ensure ultimate survival in a very competitive market (Buckley, 2008; Chuck Eastman, 2008; Eastman et al., 2011; RICS, 2011a). BIM appears to offer considerable benefits for contractors, architects, real estate managers and clients in the form of clash detection, less re-work, space coordination and so forth (Krause et al., 2007; Eastman et al., 2011). Contractors appear to be reporting, perhaps subjectively, clear benefits from implementing BIM

10
on construction projects (Pearson, 2012). In the recent market report, based upon respondents from North America, by Young et al., (2009) titled: “The Business Value of BIM” it was found that two-thirds of BIM users say they see positive returns on their overall investment in BIM. The same study found that 93% of BIM users also believed that there is potential to gain more value from BIM in the future.
In contrast other literature suggests that there is no BIM utopia whereby all the industry’s woes are going to be resolved overnight (Post, 2007; Eastman et al., 2011; Beck, 2011). There are additional considerations like traditional procurement routes - which will have to be radically adjusted or reviewed – whereby options like pooled profit, legal requirements, shared risk and so forth need to be explored (Yoders, 2009; Post, 2007; Smith & Tardif, 2009; Andre, 2011). “The standardisation of the BIM process is required to ensure its implementation”, has emerged as a key consideration of several academic papers (Krause et al., 2007; BIS, 2011; Gould, 2010).
BIM as a Cost Planning and Estimation Aid
It has emerged that BIM in a 5D format certainly has the potential to be an immense aid to the cost planning process (RICS, 2011a; McCuen, 2008; McCuen, 2010). In addition to being a software solution it may also be an aid to collaborative working, trust and information exchange. This will ensure that cost professionals can increase their knowledge of a project from an early stage and be able to generate exact quantity take-offs for procurement and cost planning purposes (Sabol, 2008; Krause et al., 2007). The market research by Young et al., (2009, p.22) found that 52% of BIM experts considered quantity take-off as a key emerging value of BIM.
However, there still appears to be a large “unknown” with regards to how the current industry is going to maximize the use of BIM with a 5D capacity. A recent survey prepared by BCIS for the RICS, (2011a)2 concluded that the use of BIM by quantity surveyors was relatively limited at present. The survey found that only 20% of respondents had used BIM within the last 12 months. The survey by the RICS, (2011a, p.8, Table 3) also found that only 1% of respondents used BIM “Very Often” for extracting quantities and at the opposite end of the scale, 22% of respondents “Never” used it for extracting quantities. Contained within the same research is the suggestion that :
“The effective adoption of BIM technologies by cost consultants and planners has been slow to date, and should this situation remain, then cost and programme services will not benefit from the productivity and speed of response that a settled BIM process can offer. This is not to say that the adoption of BIM will not be without its challenges, but that the professions cannot afford to be outside of the BIM loop”.
Co-ordination with other processes will be necessary. Just “dropping” estimating and BIM software on top of current procedures will not work (Krause et al., 2007).
2 Based on response from RICS members based within the UK and United States
11
Standardisation is required, or, alternatively working relationships with designers should be established to ensure software and object compatibility (Krause et al., 2007; McCuen, 2010). Ultimately clients need to drive the need for quantity take-off/cost estimating functions in BIM, this amongst other barriers like lack of training, lack of application interface and lack of standards are currently considered some of the major barriers to adoption (McCuen, 2010; RICS, 2011a). A further key consideration is that, on average within the UK at least, the present cost of training the average cost consultant to be fully competent with BIM technologies is between £2000-£4000 - according to a leading QS company Davis Langdon (Kucharek, 2011; David Matthews, 2011).
Appraisal of Literature
The findings of the research/literature to date, suggests agreement on one point at least – the construction industry needs to improve its practices. Specifically this refers to waste production, unnecessary re-work, and the fragmented design process, design coordination, cost certainty and so forth. There is also a general consensus that cost consultants are not realising the full potential of BIM to date as and aid to cost planning (McCuen, 2010; McCuen, 2008; Muse, 2012; RICS, 2011a).
METHOD OF ANALYSIS – INTERVIEWS Overview
The Thematic Analysis method was used for analysis of the interviews conducted. Thematic Analysis, in accordance with guidance offered by Blaxter et al., (2010) and Burnard, (1994 & 1991) , was carried out employing the following steps:
Data was transcribed from audio to text;
Following this text was “cleaned-up” and initial codes where giving to the data in systematic fashion across the entire data set;
Units of meaning were given to text to provide a medium for analysis; and
Following this data was categorised to find common themes and similarities.
As only four interviews were carried out at this stage any descriptive statistical analysis would be invalid.
Emergent Themes
The themes that emerged from the interviews were:
Code A - Definitions of BIM Code B - Time/resource required to produce model Code C - Automated Quantity Extraction Code D - Cost data attached to model Code E - Limitations Code F - Software considerations Code G – The need for BIM

12
The patterns that emerged from the exploratory interviews largely confirmed the findings of the literature carried in the production of this paper.
Limitations and Conclusion of Interviews
There are many additional legal, commercial, procurement, liability and ownership issues that require consideration too. The interviewees all have a vested interest in BIM technologies being adopted by the construction industry and this may have affected their response towards a “BIM favourable” slant. This does not undermine the integrity of the interviewees but merely suggests that the counter-argument has not been fully explored. A further limitation is that the interviews were conducted in the UK and therefore only representative of the UK’s construction industry. If someone in the USA was interviewed then the findings may differ.
Analysis of the interviews show that professionals involved largely agree with the literature review carried out. The themes identified in the text analysis also suggest that there is an explicit need for improvement within the estimation and cost planning processes. What is not clear, however, was how these improvements should be delivered to the industry. There is no utopia whereby all the inefficiencies of the industry are going to be addressed, which is considerably more complex than just “implementing a software programme”.
Method of Analysis – Online Questionnaire
Analysis of the questionnaires and the interpretation of the literature review suggest that the variables in this research may be classified into: geographical, professional, company size and funding stream.
An online questionnaire was used to collect data on General Participant Information, BIM Specific, and BIM Contractual Arrangements. The first section, General Participant Information, provided generic background information on respondents and was used as a baseline for correlation for which the subsequent section was referenced. The second section, BIM Specific, explored relationships between the variables in relation to BIM as an aid to cost planning. By providing a statistical analysis it was possible to consider probability and provide the researcher with the opportunity to judge whether the results are significant or purely due to chance (Naoum , 2007). Owing to the relatively low number of respondents, along with the fact that there are additional sources of information from which the conclusion of the research project has been drawn, the cross correlation method was used to analyse the data.
Findings: General Participant Information
The targeted responses were approximately 383 (based on Table 5 pg. 30) in order to provide a true representation of industry practitioners (between 75,000 to 100,000) (Collis & Hussey , 2009). The actual number of response received was 80 in total. Calculating the actual response was based on the following calculation:
13
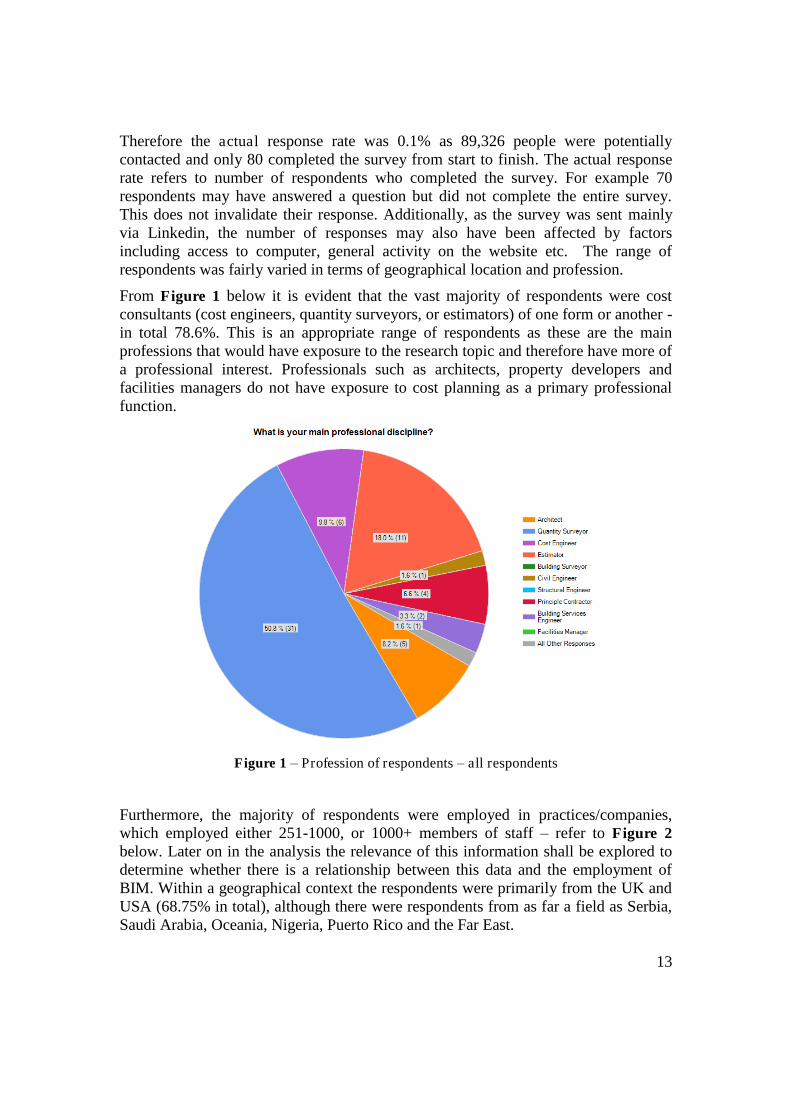
Therefore the actual response rate was 0.1% as 89,326 people were potentially contacted and only 80 completed the survey from start to finish. The actual response rate refers to number of respondents who completed the survey. For example 70 respondents may have answered a question but did not complete the entire survey. This does not invalidate their response. Additionally, as the survey was sent mainly via Linkedin, the number of responses may also have been affected by factors including access to computer, general activity on the website etc. The range of respondents was fairly varied in terms of geographical location and profession.
From Figure 1 below it is evident that the vast majority of respondents were cost consultants (cost engineers, quantity surveyors, or estimators) of one form or another - in total 78.6%. This is an appropriate range of respondents as these are the main professions that would have exposure to the research topic and therefore have more of a professional interest. Professionals such as architects, property developers and facilities managers do not have exposure to cost planning as a primary professional function.
Figure 1 – Profession of respondents – all respondents
Furthermore, the majority of respondents were employed in practices/companies, which employed either 251-1000, or 1000+ members of staff – refer to Figure 2 below. Later on in the analysis the relevance of this information shall be explored to determine whether there is a relationship between this data and the employment of BIM. Within a geographical context the respondents were primarily from the UK and USA (68.75% in total), although there were respondents from as far a field as Serbia, Saudi Arabia, Oceania, Nigeria, Puerto Rico and the Far East.

14
Interestingly the vast majority of respondents were involved on Commercial projects, with Education and Mixed-use projects the next notable groups. Additionally, when considering the typical value of projects, the vast majority of respondents were involved with values between £5,000,000 > £20,000,000 (40.0%) and > £20,000,000 (34.7%) – see Figure 3.
Figure 2 – number of staff employed by practice/company – all respondents.
The analysis of the respondents’ general awareness of BIM largely in keeping with the findings of the literature review (RICS, 2011a; NBS, 2012), very few of the respondents (5.7%) were currently “Neither aware of using BIM”. In fact the vast majority of respondents (64.3%) were “Aware and currently using BIM”, with 30% “Just aware of BIM” – see Figure 4.

15
Figure 3 - Size of company where respondents are employed
Figure 4 - Awareness of BIM – all respondents

16
BIM Specific
This section of the questionnaire sought to measure the perceptions of two groups of people, namely:
Group 1 - Just aware of BIM as a cost planning aid; and Group 2 - Aware and currently using BIM as a cost planning aid. These groups served as baselines whereby other variables such as geographical location, company size and profession were compared. Two sub-categories were formed for comparison purposes, namely the United Kingdom (UK) and the rest of the world (ROW). This facilitated the detailed comparative analysis of practices in this country. The Spearman (rho) rank correlation coefficient method, which is a non-parametric method, was employed to measure the differences in ranking between the two groups of respondent’s scoring (Naoum , 2007). The following formula was employed:
where, di = the difference in ranking between each pair of factors
N = number of factors
The commonly accepted test of significance suggested by Naoum (2007) was used to access the validity of the interpretation of casual relationships between correlated factors. The conventional level by which a conclusion may be drawn that the results are significant is where the probability is less than 5% (P <0.05) (Naoum , 2007, p.113)
Group 1 – Just aware of BIM as cost planning aid Group 1, 35 respondents were “Just aware of BIM as cost planning aid”. The vast majority were quantity surveyors, in fact 50%. Initially it was the intention to try and establish a relationship between profession and the use of BIM as a cost planning aid. However during the data collection process it soon became apparent that whilst this relationship could be established statistically it does not really provide a basis for comparison. Cost consultants provided the most responses as they are exposed to this professional activity whereas other disciplines are perhaps not. Additionally there may be some ambiguity in the terminology, i.e. quantity surveyor may not perform the same function in China and the term is rarely used in the USA, therefore this variable has to largely be discounted and the analysis following is based on the responses of all professions. The first set of data to be considered in this group is geographical, to examine whether there is statistical validity to the perceived findings. The Spearman Correlation (rho) method was carried out to determine whether results were significant or not. A rho of 0.977 was calculated demonstrating that the findings of the online survey are significant at very least. See Table 3.
One of the primary focuses of this portion of the research was to understand why respondents were not using BIM as an aid to cost planning. Statements concerning

17
why BIM is not yet being used as an aid to cost planning were formulated after discovering typical themes in the literature review. Responses were measured on a rating scale method and respondents were asked to provide their perceptions of the various statements. The general conclusion is that there is strong agreement about the reason that both the UK and ROW respondents, who have little awareness of BIM, have not implemented BIM.
When comparing responses from the UK against the ROW in respect of respondents who were “Just aware of BIM as aid to cost planning”, a summary of the responses may be seen in Table 4. NR UK
Ranks (Ave)
ROW Ranks (Ave)
1 Lack of client demand 2.45 1.90 0.55 0.3025
1 Lack of government lead/direction 2.85 2.30 0.55 0.3025
1 Initial capital outlay for software 2.68 2.11 0.57 0.3249
1 Staff training costs 2.70 2.20 0.50 0.2500
1 Current conditions of engagement 2.74 2.11 0.63 0.3969
1 Lack of IT infrastructure and low specification of hardware
2.75 2.80 -0.05 0.0025
1 Lack of clear standards/guidance of use 2.25 2.10 0.15 0.0225
11 Lack of new and/or amended forms of construction contracts
2.58 1.90 0.68 0.4624
1 Limited ability of models to export quantities to industry measurement standards. i.e. SMM7, CESMM3, NRM etc.
2.60 1.80 0.80 0.6400
9 Total 2.7042
rho = 0.977465
Where N = 9, critical value of .600 for P < .05 (refer to Table 8)
Table 3 - Spearman rank correlation coefficient (rho) where UK respondents are measure against the rest of the world – for “Just aware of BIM as cost planning aid”

18
Ranking UK Rest of the World
First Lack of clear standards/guidance for use.
Limited ability of models to export quantities to industry measurement standards i.e. SMM7, CESMM3, NRM, etc.
Second Staff training costs/lack of client demand (ranked equal).
Lack of new and/or amended forms of construction contracts.
Third - Lack of client demand.
Table 4 - Perceived reasons why respondents were “Just aware of BIM as aid to cost planning” – UK vs. ROW.
Of the 35 total respondents in this particular group, 21 were from the UK; their actual responses can be seen in Figure 5. From the responses it is possible to determine that the UK respondents were fairly similar with regards to weighting of the reason why they were “Just aware of BIM as aid to cost planning”. However, the number one reason for them only being aware of BIM as an aid to cost planning and not actually using it was “Lack of clear standards/guidance of use”, “Staff training costs” and “Lack of client demand” were ranked equal in response rating. “Lack of IT infrastructure and low specification of hardware” was second but intriguingly also got the strongest negative response.

19
Figure 5 - Perceptions of UK Respondents who were “Just aware of cost planning aid” and not using it.
With respect to the ROW, it is apparent that they were certainly more forthright in their responses and opinions are more polarized on this topic (i.e. more orange and blue). Contrastingly, within the UK the responses appeared to be more evenly spread. This may be indicative of the lack of current lack awareness with a large number of professionals within the UK regarding BIM as an aid to cost planning. The ROW, which consisted of Germany, Saudi Arabia, Oceania and so forth, actual responses by number may be seen in Figure 6.

20
Figure 6 – Perceptions respondents from “rest of the world” who were “Just aware of cost planning aid” and not using it.
A number of authors consider that, in addition to economic factors, there is a relationship between the size of a company and the level of time/money spent on Research and Development (Cohen et al., 1987; Levin et al., 1988; Griliches, 1998). This consideration formed the logic for attempting to understand what affect the size of a company may have on the adoption of BIM as an aid to cost planning. Most respondents who were just aware of BIM as an aid to cost planning were larger companies. It is necessary to try and understand what percentage of large companies were only aware of BIM as an aid to cost planning compared to what percentage of small companies, to try and gain a better understanding of this relationship – refer to Figure 7.
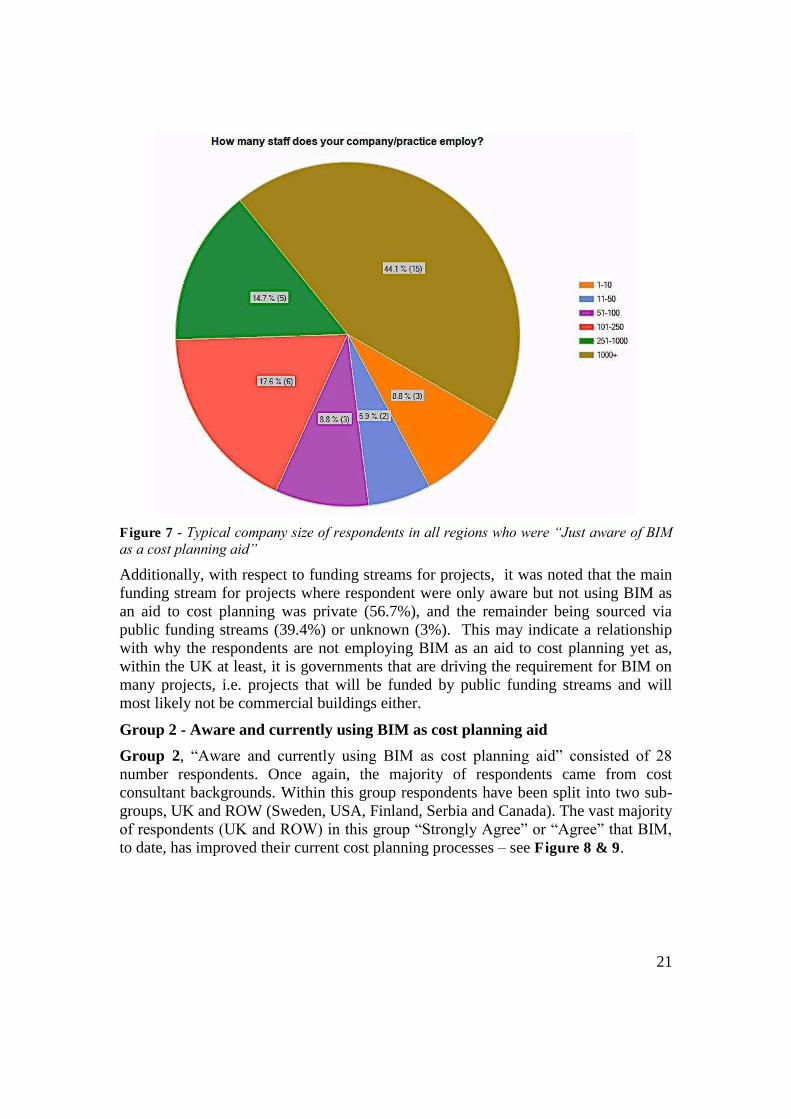
21
Figure 7 - Typical company size of respondents in all regions who were “Just aware of BIM as a cost planning aid”
Additionally, with respect to funding streams for projects, it was noted that the main funding stream for projects where respondent were only aware but not using BIM as an aid to cost planning was private (56.7%), and the remainder being sourced via public funding streams (39.4%) or unknown (3%). This may indicate a relationship with why the respondents are not employing BIM as an aid to cost planning yet as, within the UK at least, it is governments that are driving the requirement for BIM on many projects, i.e. projects that will be funded by public funding streams and will most likely not be commercial buildings either.
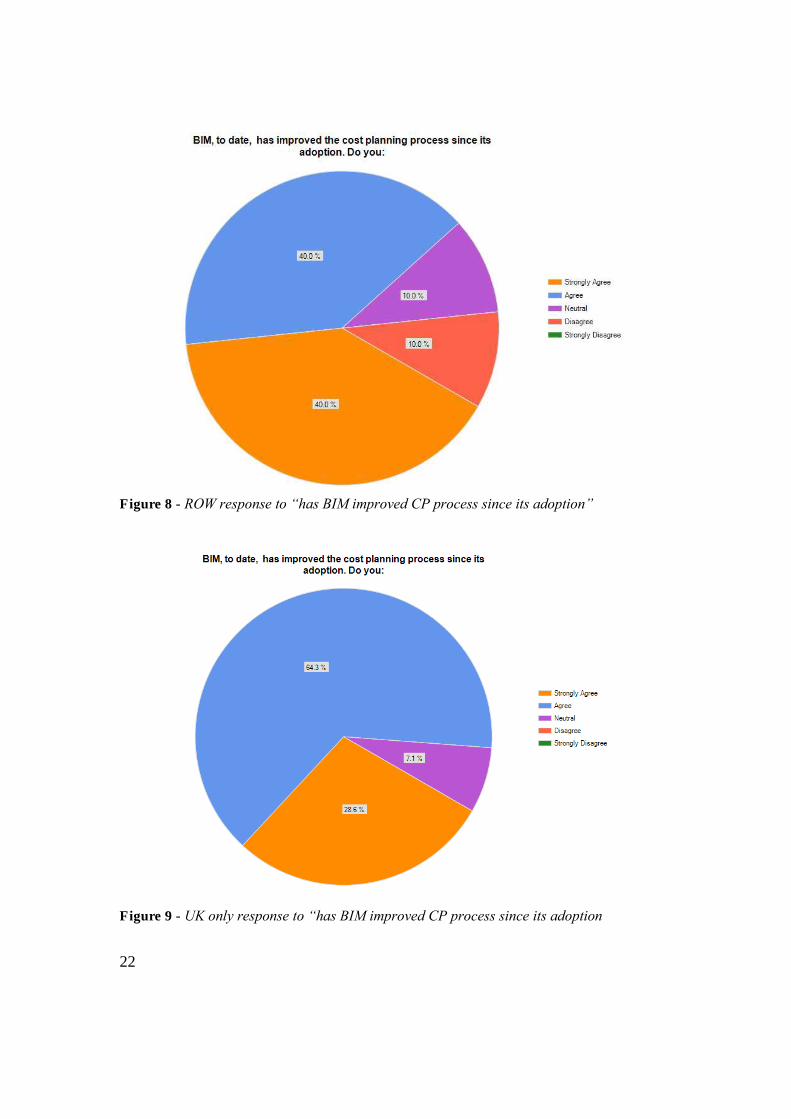
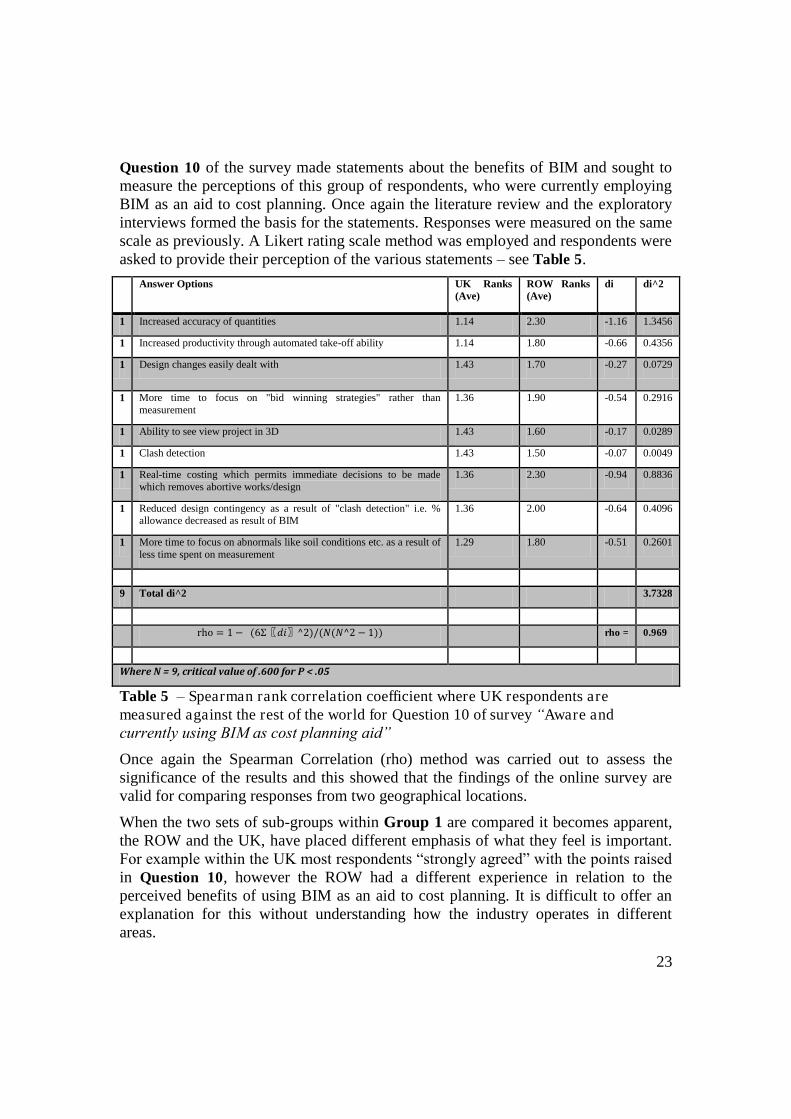
Group 2 - Aware and currently using BIM as cost planning aid
Group 2, “Aware and currently using BIM as cost planning aid” consisted of 28 number respondents. Once again, the majority of respondents came from cost consultant backgrounds. Within this group respondents have been split into two sub-groups, UK and ROW (Sweden, USA, Finland, Serbia and Canada). The vast majority of respondents (UK and ROW) in this group “Strongly Agree” or “Agree” that BIM, to date, has improved their current cost planning processes – see Figure 8 & 9.
22
Figure 8 - ROW response to “has BIM improved CP process since its adoption”
Figure 9 - UK only response to “has BIM improved CP process since its adoption
23
Question 10 of the survey made statements about the benefits of BIM and sought to measure the perceptions of this group of respondents, who were currently employing BIM as an aid to cost planning. Once again the literature review and the exploratory interviews formed the basis for the statements. Responses were measured on the same scale as previously. A Likert rating scale method was employed and respondents were asked to provide their perception of the various statements – see Table 5.
Answer Options UK Ranks (Ave)
ROW Ranks (Ave)
di di^2
1 Increased accuracy of quantities 1.14 2.30 -1.16 1.3456
1 Increased productivity through automated take-off ability 1.14 1.80 -0.66 0.4356
1 Design changes easily dealt with 1.43 1.70 -0.27 0.0729
1 More time to focus on "bid winning strategies" rather than measurement
1.36 1.90 -0.54 0.2916
1 Ability to see view project in 3D 1.43 1.60 -0.17 0.0289
1 Clash detection 1.43 1.50 -0.07 0.0049
1 Real-time costing which permits immediate decisions to be made which removes abortive works/design
1.36 2.30 -0.94 0.8836
1 Reduced design contingency as a result of "clash detection" i.e. % allowance decreased as result of BIM
1.36 2.00 -0.64 0.4096
1 More time to focus on abnormals like soil conditions etc. as a result of less time spent on measurement
1.29 1.80 -0.51 0.2601
9 Total di^2 3.7328
rho = 0.969
Where N = 9, critical value of .600 for P < .05
Table 5 – Spearman rank correlation coefficient where UK respondents are measured against the rest of the world for Question 10 of survey “Aware and currently using BIM as cost planning aid”
Once again the Spearman Correlation (rho) method was carried out to assess the significance of the results and this showed that the findings of the online survey are valid for comparing responses from two geographical locations.
When the two sets of sub-groups within Group 1 are compared it becomes apparent, the ROW and the UK, have placed different emphasis of what they feel is important. For example within the UK most respondents “strongly agreed” with the points raised in Question 10, however the ROW had a different experience in relation to the perceived benefits of using BIM as an aid to cost planning. It is difficult to offer an explanation for this without understanding how the industry operates in different areas.

24
However the UK respondent’s three leading perceptions (see Figure 10) of the benefit of using BIM as an aid to cost planning were (in order of first to third in accordance with response weighting):
Increased accuracy of quantities (ranked equal); Increased productivity through automated take-off ability (ranked equal); and Real-time costing, which permits immediate decisions to be made which removes abortive works/design.
Interestingly, some respondents had a negative reaction to some of the perceived benefits of BIM as an aid to cost planning, namely: “Ability to view a project in 3D” and “Clash Detection”.
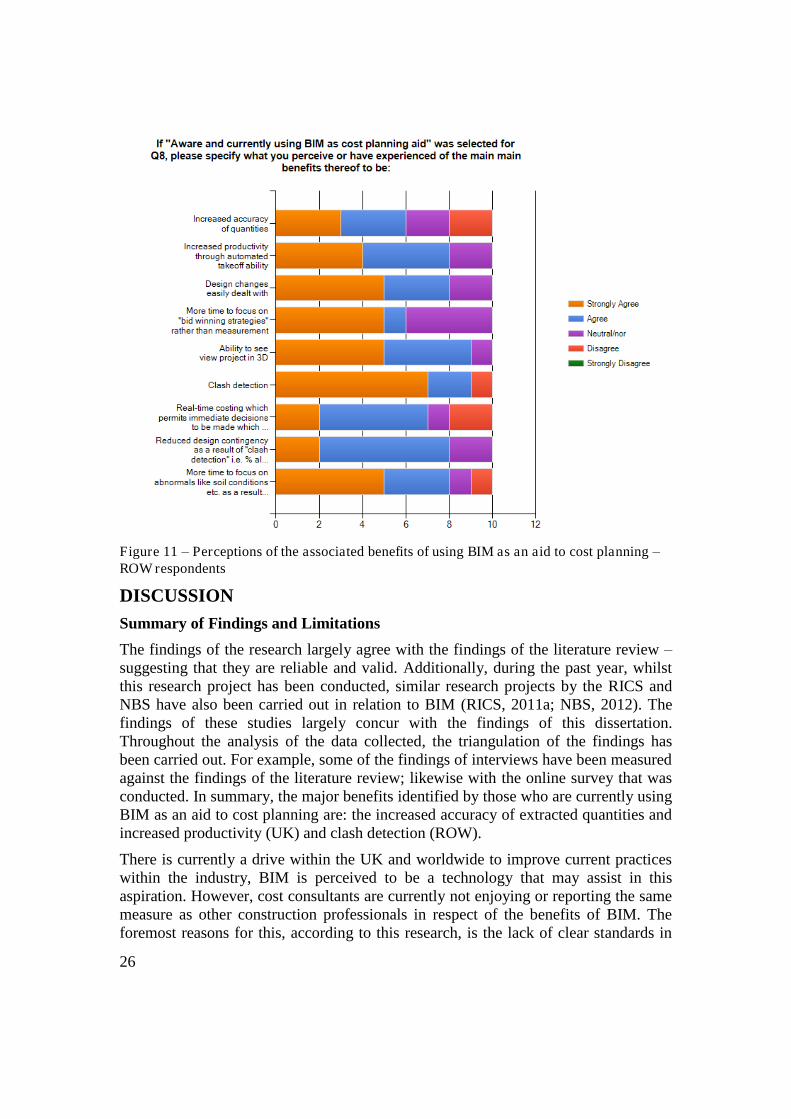
The ROW’s responses (see Figure 11) differed considerably to the UK. The three leading perceptions of the benefit of using BIM as an aid to cost planning were (in order of first to third in response weighting):
Clash detection; Ability to see view project in 3D; and Design changes easily dealt with. Interestingly and in contrast to the perceptions of the UK, the ROW strongly rejects the “Increased accuracy of quantities” as a benefit of BIM when used as an aid to cost planning. They also largely rejected the real time costing and clash detection. As a result, and perhaps speculatively, it could assumed that the ROW (the literature review agrees) is further advanced than within the UK in this respect and therefore that their experience that BIM does not offer these advantages is more reliable.

25
Figure 10 - Perceptions of the associated benefits of using BIM as an aid to cost planning – UK respondents
The use of funding streams was also fairly varied between the two groups. Within the UK the majority of respondents who were using BIM as an aid to cost planning were doing so on project funded by public funds, in fact 78.6%. In contrast, 80% of the ROW’s respondents, who were using BIM, were doing so on projects that were privately funded.
With regards to number of staff employed by practice/company, both the ROW and UK respondents, who were using BIM as an aid to cost planning, were working in companies or practices that were fairly large. Specifically 32.4% fell within the 251-1000 group, 32.4% fell within the 1000+ group. This corresponds largely with the literature review conducted to date. This would support the construct that once BIM is adopted, practitioners believe strongly that it provides real benefits to the cost planning process. The geographical location is significant although UK users appear to be more strongly convinced that improvements can be made. This may be due to the UK having some ground to catch up on the ROW.
26
Figure 11 – Perceptions of the associated benefits of using BIM as an aid to cost planning – ROW respondents
DISCUSSION Summary of Findings and Limitations
The findings of the research largely agree with the findings of the literature review – suggesting that they are reliable and valid. Additionally, during the past year, whilst this research project has been conducted, similar research projects by the RICS and NBS have also been carried out in relation to BIM (RICS, 2011a; NBS, 2012). The findings of these studies largely concur with the findings of this dissertation. Throughout the analysis of the data collected, the triangulation of the findings has been carried out. For example, some of the findings of interviews have been measured against the findings of the literature review; likewise with the online survey that was conducted. In summary, the major benefits identified by those who are currently using BIM as an aid to cost planning are: the increased accuracy of extracted quantities and increased productivity (UK) and clash detection (ROW).
There is currently a drive within the UK and worldwide to improve current practices within the industry, BIM is perceived to be a technology that may assist in this aspiration. However, cost consultants are currently not enjoying or reporting the same measure as other construction professionals in respect of the benefits of BIM. The foremost reasons for this, according to this research, is the lack of clear standards in

27
relation to its use (UK respondents) and limited ability to export to industry measurement standards (ROW). Whilst these may appear as barriers at present, the research suggests that they are largely being addressed by the industry. This may be seen, in the UK at least, by the various continual professional development programmes (CPD) that are being hosted by professional bodies like the RICS and CIOB. There are also various steering and task groups like the UK BIM Task Group who are undertaking work to address these issues.
The research to date has provided a sound, albeit perhaps not fully conclusive, understanding of the topics researched. This provides a basis for further research and development on the subject matter and has assisted in raising the profile of the subject, even if only to the researcher and the participants of the online survey and exploratory interviews. It has also been interesting to discover that construction professionals worldwide are aware, and some are even using, BIM as an aid to the cost planning process. The benefits to use also appear to be real, tangible, and immediate - this should ensure that BIM’s adoption is assured.
Recommendations
To use BIM, as an aid to cost planning, additional training is required. Whilst conducting this research project, it became apparent that professional bodies like the RICS and CIOB are investing in continual professional development programmes to raise the profile of BIM. It would certainly help BIM’s implementation, as an aid to cost planning, if there were more focussed CPD events tailored specifically to this discipline of the industry. It is also suggested that further research into the technical nuances of the cost planning process should also be conducted to produce more refined findings.
REFERENCES
Ahsan, S. & Ahmad, S., 2008. Mobile Technologies for Inmproved Collaboration on Construction Sites. Creative Commons, Loughborough'S Institutional Repository.
Amaratunga , D., Baldry, D., Sarshar, M. & Newton , R., 2002. Quantitative and qualitative research in the built environment: application of "mixed" reserch approach. The University of Salford , 1, pp.17-31.
Andre, G.R., 2011. Building Information Modeling (BIM): Special Contract Issues. [Online] Available at: http://www.klgates.com/building-information-modeling-bim--special-contract-issues-10-07-2011/ [Accessed 04 February 2012].
Andrews, , 2003. Research Questions. London: Continuum.
Aouad, G. et al., 1999. Technology managment of IT in construction: a driver or an enabler? Logistics Information Management, pp.13-137.
Askew, W., Mawdesley, & O'Reilly, M., 1997. Planning and Controlling Construction Projects: The Best Laid Plans. Essex: Addison Wesley Longman and Chartered Institute of Building.
28
Ball, M., 1999. Chasing a Snail: Innovation and Housbuilding Firms' Stragtegies. pp.Vol 1, 9-22,.
Barlow, J., Childerhouse, P. & Gann, D., 2003. Choice and delivery in housebuilding: lessons from Japan for housebuilders. pp.31:2,134-145.
Beck, E., 2011. BIM Well With Others. [Online] Available at: http://www.architectmagazine.com/bim/bim-well-with-others.aspx [Accessed 29 January 2012].
BIS, 2011. BIM - Management for Value, Cost and Carbon Improvement. Strategy Paper. London: BIS A report for the Government Construction Client Group Building Information Modelling (BIM) Working Party.
Blaxter, , Hughes, & Tight , M., 2010. How to Research. Fourth ed. Maidenhead, UK: Open Unversity Press - McGraw Hill Education.
Bowden, S., Dorr, A., Thorpe, T. & Anumba, C., 2006. Mobile ICT support for construction process improvement. Automation in Construction, pp.664-76.
Brandon, P.S. & Ferry, D.J.&.F.J.D., 1999. Cost Planning of Buildings. Oxford : Blackwell Science.
Brook, M., 2008. ESTIMATING AND TENDERING FOR CONSTRUCTION WORK. Fourth Edition ed. Oxford, UK : Butterworth Heinemann is an imprint of Elsevier.
Brookes, M., 2008. Estimating and Tendering for Construction Work. Oxford: Butterworth-Heinemann. Fourth.
Bryman, A., 1988. Quantity and Quality in Social Research. London: Unwin Hyman.
BSI , 2007. BS 1192:2007 - Collaborative production of architectural, engineering,and construction information. London: British Standards.
BSI , 2010. BS ISO - 29481-1:2010 - Building information modelling - Information delvery manual. London: British Standards.
Buckley, B., 2008. BIM is in: Midwest Contractors Take Lead in Building INformation Modelling. MC, 14(7), p.39.
BuildingSMART, 2010. Constructing the business case - Building Information Modelling. London: BSI BSI.
Burnard, P., 1991. A method of analysing interview transcripts in qualative research. New Education Today , 11, pp.461-66.
Burnard, P., 1994. Searching for meaning: a method of analysing interview transcripts with a personal computer. Nurse Education Today , 14, pp.111-17.
Chen, & Kamara , , 2008. Using mobile computing for construction site information management. Engineering, Construction and Architectural Management, pp. 7 -20.
Chen, Y. & Kamara, J.M., 2008. Using mobile computing for construciton site information management. Engineering, Construciton and Architectural Management, pp.7-20.
Chuck Eastman, P.T.R.S.K.L., 2008. BIM Handbook: A Guide to Building Information Modeling for Owners, Managers, Designers, Engineers and Contractors. Hoboken , New Jersey : John Wiley and Sons.
29
CIOB , 2009. Code of Estimating Practice. Seventh ed. Oxford , UK: John Wiley and Son Ltd.
CM , 2010. Morrell backs BIM on public projects. [Online] Available at: http://construction-manager.co.uk/news/morrell-backs-bim-public-projects/ [Accessed 2011 May 22].
CM, 2011. BIM to be compulsory on all government projects. [Online] Available at: http://construction-manager.co.uk/news/bim-be-compulsory-all-projects/ [Accessed 22 May 2011].
CM, 2011. Construction Manager. [Online] Available at: http://www.construction-manager.co.uk/news/bim-wins-says-laing-qss-shun-it/ [Accessed 22 October 2011].
Cohen, , Levin , R. & Mowery , , 1987. Firm Size and R& D Intensity: A Re-examination. National Bureau of Economic Research, April.
Collis, J. & Hussey , R., 2009. Business Research - A Practical Guide for Unerdgraduate & Postgraduate Students. Third Edition ed. Basingstoke: Palgrave McMillian.
Coolican , H., 1992. Researc Methods and Statistics in Psycology. London: Hodder & Stoughton.
Creswell, J.W., 1998. Qualitive Inquiry and Research Design: Choosing Among Five Approaches. Thousand Oaks , CA: SAGE.
David Matthews, I.W., 2011. Building. [Online] Available at: http://m.building.co.uk/news/bim-could-cost-qss-£2k-per-person/5018776.article [Accessed 22 October 2011].
Drucker, P., 1994. The theroy of business. Harvard Business Review .
DTI, 2003. Competing in the global economy: the innovation challenge. Innovation Report. London: Crown Copyright Department of Trade and Industry.
Eastman , , Teicholz, P., Sacks , & Liston , K., 2011. BIM Handbook - A Guide To Building Information Modelling For Owners, Managers, Designers, Engineers, and Constractors. Second ed. Hoboken, NJ, USA : John Wiley and Sons Inc..
ESRC, 2007. Economics Research Council. [Online] Available at: http://www.esrc.ac.uk/_images/Framework_for_Research_Ethics_tcm8-4586.pdf [Accessed 24 July 2011].
Gould, L., 2010. BIM demystified. Constuction Reserch and Innovation - Suriving the new economic order .
Griliches, Z., 1998. Issues in Assessing the Contribution of Research and Development. In Griliches, Z. R&D and Productivity: The Econometric Evidence. Chicago: University of Chicago Press. pp.17 - 45.
Hewage, K.N., Ruwanpura, J.J. & Jergeas, G.F., 2008. IT usage in Alberta's construciton projetcs: Current staus and challenges. Automation in Construction, pp.940-47.
Hillbrandt, P.M., 1984. Analysis of the British Construction Industry. London: Macmillian Press.
Hyde, R., 1995. Buildability as a design concept for architects: a case study of laboratory buildings. Engineering, Construction and Architectural Managemen, pp.1, 45-56.

30
Juhola, V., 2011. Finland, Norway, Singapore, USA lead progress in construction. [Online] Available at: http://www.bimsightblog.com/finland-norway-singapore-usa-lead-progress-in-construction-industry/ [Accessed 30 May 2011].
Kaka, A.P., 1990. Corporate financial model for construction contracts - PhD Thesis. Loughboroug: Loughborough : Department of civil engineering.
Kennett, S., 2010. The use of force: Building information modelling. [Online] Available at: http://www.building.co.uk/buildings/project-stage/the-use-of-force-building-information-modelling/5007579.article [Accessed 22 May 2011].
Kennett, S., 2010. The use of force: Building information modelling. [Online] Available at: http://www.building.co.uk/buildings/project-stage/the-use-of-force-building-information-modelling/5007579.article [Accessed 20 June 2011].
Khanzode, , , Fischer, D.M. & Reed, D., 2008. Benefits And Lessons Learned Of Implementing Building Virtual Design And Construction (Vdc) Technologies For Coordination Of Mechanical, Electrical, And Plumbing (Mep) Systems On A Large Healthcare Project. [Online] Available at: http://itcon.org/cgi-bin/works/Show?2008_22 [Accessed 22 May 2011].
Khanzode, , , Fischer, D.M. & Reed, D., 2008. ITcon. [Online] Available at: http://itcon.org/cgi-bin/works/Show?2008_22 [Accessed 22 May 2011].
Krause , E.W., Watt, S. & Larson, P.D., 2007. Challenges in Estimating Costs Using Building Infomration Modelling. AACE International Transactions.
Krejcie, R.V. & Morgan , D.W., 1970. Determining sample size for research activities. Educational and Psychological Measurement , (30), pp.607-10.
Kucharek, J.-C., 2011. Adopt and Adapt. [Online] Available at: http://www.ribajournal.com/index.php/feature/article/adopt_and_adapt1/ [Accessed 22 October 2011].
Levin , , Klevorick, A., Nelson , R. & Winter, S., 1988. Apropriating the returns from idustry R & D. Cowles Foundation for Research in Economincs, February.
Liu, A. & Fellows, R., 2008. Research Methods for Construction. Third Edition ed. Oxford : Blackwell Publishing.
March, C., 2009. Fianance and Control. Abingdon, Oxon, UK: Spon Press.
McCuen, M.T.L., 2008. BIM.01 - Scheduling, Estimating, and BIM: a Profitable Combination. AACE INTERNATIONAL TRANSACTIONS.
McCuen, T.L., 2010. Underdeveloped and Underutilized: Cost Estimaing in BIM. In Annual Meeting - AACE International., 2010.
McNeill, & Chapman , S., 2005. Research Methods. Third Edition ed. London: Routledge.
Merton , & Kendal , , 1946. The focused Interview. Journal of Sociology, 51, pp.541-57.
Miller, D.C., 1991. Hnadbook of Research Design and Social Measurement. Fifth Edition ed. London, UK: Sage Publications.
31
Morrell , , 2011. Paul Morrell: BIM to be rolled out to all projects by 2016. [Online] Available at: http://www.architectsjournal.co.uk/news/daily-news/paul-morrell-bim-to-be-rolled-out-to-all-projects-by-2016/8616487.article [Accessed 03 August 2011].
Morse, J.M., 1994. Emerging from the data: The cognitive process of anaylsis in qualitative inquiry. Thousand Oaks, CA: Sage.
Muse, A., 2012. Push me, pull me. RICS Construction Journal, p.11.
Naoum , D.S.G., 2007. Dissertation Research & Writing for Construction Students. Second Edition ed. Oxford, UK: Butterworth-Heinenmann.
NBS, 2012. NBS National BIM Survey. [Online] Available at: http://www.thenbs.com/topics/bim/articles/nbsNationalBimSurvey_2012.asp [Accessed 22 March 2012].
Payne, S.L., 1980. The Art of Asking Questions. Princeton: Princeton University Press.
Peansupap, V. & Walker, D., 2005. Factors affetcing ICT diffusion - A case study of three large Australian construction contractors. Engineering, Construction and Architectural Managemnt, pp.21-37.
Pearson, A., 2012. A Model Solution. RICS - Modus , March. pp.35-37.
Pheng, L.S. & Chaun, J.C., 2000. Just-in-time management in precast concrete construction: a survey of the readiness of main contractors in Singapore. Singapore: MCB University Press [ISSN 0957-6061].
Post, N.M., 2007. E-Construction Hampered By Inability to Share 3-D Models. Engineering News Record , 12(258), p.16.
Rebolj, D., Magdic, N. & Cus-Babic, N., 2000. Mobile Computing in Construction. Smetanova : Construction IT Centre, Faculty of Civil Eng.
RICS, 2011a. RICS 2011 Building Information Modelling Survey Report. Survey. RICS.
RICS, 2011. Use of cost plans. [Online] Available at: http://www.isurv.com.lcproxy.shu.ac.uk/site/scripts/documents_info.aspx?categoryID=55&documentID=290 [Accessed 07 June 2011].
Robson, C., 1993. Real World Research: A Resource for Social Scientists and Practicioner Researchers. Oxford: Blackwell.
Sabol, , 2008. Challenges in Cost Estimating with Building Information Modeling. White Paper. Washington: Design + Construction Strategies Design + Construction Strategies.
Schinler, D. & Nelson, , 2008. BIM and the Structural Engineering Community. [Online] Available at: http://www.structuremag.org/Archives/2008-12/C-Tech-BIM-Schinler&Nelson-Dec-08.pdf [Accessed 04 February 2012].
Silverman, , 1994. Interpreting Qualitative Data - Methods for Analysing Talk, Text and Interaction. London, UK: SAGE Publications Ltd.
Smith , J.K., 1983. Quantitive Research v Qualitive Research: An Attempt to CLassify the Issue. Educational Research , March. pp.6-13.
32
Smith , D.K. & Tardif, M., 2009. Building Informaiton Modelling - Strategic Implementation Guide for Architects, Engineers, Constructors, and Real Estate Asset Managers. Hoboken, New Jersey, USA: John Wiley and Sons Inc.
Smith, & Jaggar, , 2007. Building Cost Planning for the Design Team. Second edition ed. Oxford : Butterworth-Heinemann.
Watson, P. & Laycock , E.A., 2010. Course Notes for BSc (Hons) Dissertation Module. Unpublished. Sheffield: Sheffield Hallam University.
Wilson , J. & Kusomo, , 2004. TENDER COST AND PRICE OPTIMISATION MODEL, AND PREQUALIFICATION BENCHMARK MECHANISM – A SYNERGY OF KNOWLEDGE MANAGEMENT AND RISK MANAGEMENT SYSTEMS. In Cobra. Leeds, 2004. RICS.
Yoders, J., 2009. BIM + IPD Three Success Stories. Building Design and Construction , p.26.
Young , , Jones , S., Bernstein, H.M. & Gudgel, J.E., 2009. The Business Value of BIM. Report. New York : McGraw Hill Construction SmartMarket Report.
Zikmund , W., 1997. Business Research Methods. Dryden Press.

33
TIME, COST AND QUALITY: WHICH CONSTRAINT DO CONSTRUCTION PROFESSIONALS FROM A SET COMPANY BELIEVE TO BE THE MOST IMPORTANT WHEN DELIVERING CONSTRUCTION PROJECTS
Sam Murphy 3
Sam Murphy graduated from Sheffield Hallam University in 2012 with a 2:1 BSc. Honours Degree. He works at Kier in the position of Site Manager.
ABSTRACT
The importance of the relationship between time cost and quality in the construction industry has been a long standing debate for many years. This research study looked at the importance of these three constraints whilst delivering construction projects from the view point of a set of professionals from a regional construction company in the UK. The main aim of this research was to establish if the professionals believed that one constraint was more important than the other two when delivering construction projects. A ten question research questionnaire was sent out to a number of chosen participants of the company, the results from this questionnaire were then gathered and analysed. The key findings from the results show that the professionals that took part in the research believe that time is the most important constraint, followed by cost, with quality being perceived as the least important. From these findings recommendations were put forward for future research to be carried out on the topic.
Keywords: Time, Cost, Quality, Programme, schedule, budget, project, constraints, specification, standard, defect free, construction.
INTRODUCTION In the world of construction, time cost and quality are considered to be the main objectives and drivers of projects if they are to be delivered successfully (Chan et al, 2002).

34
Time can often be referred to as programme or schedule and is the restraint in which the project duration is measured against. Cost is the budgetary constraint that must be adhered to if a project is going to make a profit for those involved, and is often based on the client’s financial requirements on what they can afford to spend. Quality is known as the standard of the product that is being delivered to the client. To ensure projects are built to a specific quality there are specifications and standards that they must meet.
The three constraints are tied to each other throughout the duration of a project. If there is a quality issue this will more than likely need to be rectified, therefore costing money to be put right, which could then have an impact on the programme depending on how serious the defect may be. The standard of quality required can also determine time and cost at the project outset. If a project is running over budget then cut backs are likely to be made, these could then have an impact on the quality of the work, or even result in some items not being done at all. Time cost and quality work together in a never ending circle until the project is completed, the key is to balance all three to ensure no knock-on effects occur from one to the other (Martin and Tate, 2001).
This paper focused on Kier Construction-Western & Wales (KCWW) perception of time cost and quality within the construction industry, and if one of these three constraints is perceived to be more important than the other two when delivering a construction project. KCWW are a regional division of the national Kier Group plc, which is a national construction company, which covers the South West region of England and South Wales. KCWW are a company always looking to improve their services to the clients, with customer satisfaction surveys and interviews as part of the feedback process when projects are completed. However no business is sustainable without the hard work and commitment of the dedicated workforce, therefore making it vital that their thoughts on delivering projects are brought to the forefront, analysed and any recommendations made accordingly. What are the thoughts of those involved in delivering the project regarding time cost and quality? Is it that the project must be turned around in the time scale set? Or perhaps that it is to make a good margin on this project? Or possibly if quality is up to standard that should keep the client happy?
This research paper investigates and reviews the literature which has already been written on the topic of time, cost and quality in the construction industry. From the analysis of this research, topical areas were highlighted and relevant points were picked up to enable a thorough methodology and process of further research to be established. A resulting questionnaire was made for further research and analysis. This questionnaire was then introduced to the key employees of KCWW who are responsible for delivering construction projects, right through from the procurement team who obtain the contracts, to the site managers that complete contracts and deliver them to the client.
On completion of the questionnaire the results were gathered and categorised in order to be tabled and analysed. The data from these findings was then presented and analysed to compare how the employees involved in the questionnaire responded to

35
the questions. The findings from the questionnaire are then interpreted into results, with key findings and recommendations to be considered stated in the conclusions section.
The findings and recommendations will then be presented to the Company so that they can use them for future improvements to the business.
LITERATURE REVIEW There have been many papers written on time cost and quality and their relationship in delivering construction projects successfully. It is often perceived that if you get all three of these constraints right then the project will be a success. Project success is usually defined by meeting not just these three objectives but also satisfying the stakeholders and fulfilling the end users needs (Baccarini, 1999).
To establish what literature was to be reviewed and to ensure it would be relevant for this research paper a search strategy was developed, where databases such as Emerald, Construction Information Service (CIS) and Google Scholar were searched using the words listed in table 1 below. These words were developed from the three key words of time, cost and quality and were deemed to be of similar meaning in the construction industry.
Main key words Time Cost Quality
Programme Budget Specification
Delivery Finances Standard
Schedule Funding Defect free
Table 1-Search strategy for literature review
This literature review looks into some of these papers that have been written on the topics of time cost and quality in the construction industry and highlights the common themes that are evident in the literature concerning each of the constraints. This review aims to establish the importance of this topic and provide background information that is needed to understand the study of the research question, and illustrate existing research already carried out in this field. The review shows how various studies relate to other studies and how differently each of the constraints can be perceived from different professionals involved in the delivery of construction projects.
The criteria of time, cost and quality have long been used to evaluate the performance and success of construction projects (Chan et al, 2002).
Atkinson (1999) has named these criteria “the iron triangle”. Although these three criteria (time, cost and quality) are easy to measure (Willard, 2005) they have been criticised for being inadequate for several reasons. Shenhar et al (1997) said that the traditional criteria of time, cost and quality were not really one uniform dimension, and that while meeting project resource constraints of time and cost was one thing,

36
meeting the specifications (quality) was another. Alarcon et al (1998) have argued that these basic criteria are not appropriate for continuous improvement because they are ineffective in identifying the causes of productivity and quality losses. These parameters do not provide an adequate vision of the potential for improvement and the information obtained usually arrives too late for corrective action to be taken. Project success is a strategic management concept where project efforts must be aligned with both the short and long term goals of the company.
Atkinson (1999) also considers the criteria of time cost and quality as temporary criteria measurement for measuring efficiency during the delivery stage. Dweiri (2006) has shared this view of Atkinson and looked at the basic criteria as internal measures of project management efficiency. Similarly, Shenhar et al (2001) have considered the criteria of time, cost and quality, as a measurement of success in the short run when time to market is critical.
Rahman et al (1994) have researched the importance of getting things right first time and reducing non-conformance. By capturing the cost of non-conformance it can increase the quality and in return will produce higher profits to the contractor, or depending on the contract, possibly the client and other consultants. This theme was also discovered a decade later in Koushki and Kartam (2004), although the research was carried out in Kuwait and could be questionable in its relationship to the UK construction industry. The research was based on a questionnaire sent out to the owners of 450 residential projects across the city. One of the key points from the data analysis was that 85% of the owners utilised materials from local rather than imported resources, giving the reason for the local resources that they could sample the product at first hand to ensure they would be happy with the final outcome and that the local product was arguably cheaper than the imported products. Generally the materials imported for the build were those materials used for the construction of the structure of the building, often not seen when the project is completed. Another key point from Koushki and Kartam (2004) was that the owners were willing to pay and accept time delays for the higher quality end product. This could be linked to Rahman et al (1994) in terms of not rushing the delivery but getting it right first time can provide an overall better project success. Rahman et al (1994) also states that the most common accepted delay was around three months, this was generally accepted by the owners, any longer and then concerns were raised. However a three month delay to construction projects within the UK industry would not be looked upon lightly by the client and may have catastrophic effects on the companies involved.
Gardiner and Stewart, (2000) proposed that analysing project success using “on time”, “to budget” and “of the required quality” is inappropriate. Using a tool such as Net Present Value (NPV), which is calculated by the present value of future returns (discounted at the marginal cost of the capital) minus the present value of the cost of the investment, would be more accurate and effective. Although the use of NPV has it’s place within the construction industry this research paper does not provide solid evidence to back up it’s claims. The theories generated by the authors appear to be of biased opinions due to the way the research was conducted.
37
The basis for the theories as to why NPV is so important comes from questionnaires and “semi-structured” interviews which appear to have been carried out on only seven site managers. It can be appreciated that interviews and questionnaires can be a lengthy method of data collection and hence a small sample size is used however regardless of data collection a sample size of seven is extremely small to be used as a generalisation and with no description as to how the sample were selected, it is difficult to justify that the findings were representative. When carrying out research in an interview setting it is vital to have a strict structure to prevent any leading questions from interviewers. It would also be beneficial to ensure that the interviewer is blinded to the aim of the study to prevent any bias towards what is trying to be found. There is no indication in this paper as to any interviewer blinding however judging by their key argument it sounds as though the interviewer knew what was trying to be proved. One of the key arguments is that project managers are not forth right with how successful a project is and because of this NPV should be implemented to measure success. This was based on asking seven project managers if they had “delivered” a project. This seems a fairly straight forward question which requires a yes or no answer. For the 90% of project managers who answered yes were then challenged by the interviewer as to if the project was on time only 50% answered yes. Perhaps if the interviewer had asked a more structured question to begin with, more accurate results could then be given. It is also important to note that 90% of seven interviewees are actually six project managers and not a large enough sample to base theories to be applied to a larger population.
Bowen et al (2002) aimed to look at the link between the effective management of project time cost and quality as previous research had shown that the importance of quality is often overlooked (Hughes & Williams, 1991). In order to do this they constructed a stratified questionnaire that was sent out to clients, architects, quantity surveyors, project managers, consulting engineers and general contractors. The answers that were sent back (79.4% of 180 questionnaires sent out) were then analysed by looking at each question individually and also by comparing the responses from each subgroup of participants.
This paper does provide some very strong evidence relating to the study design. The population looked at were clearly stated and indicated a wide range of participants, while accounting for differences in the answers. By sending out a questionnaire to participants it eliminates the chance for potential examiner bias which may occur if the questionnaires were completed with a researcher present. It was stated in this study design that the questionnaires were not sent out to individuals but to practices and organisations which could result in them being completed by the wrong people however this is unlikely to be the case.
Lim & Zain Mohamed (1999), despite having weak evidence to base their theories, propose some valid points in terms of determining project success. They suggest that success of a project is determined by fulfilling “criteria” such as project standards (i.e. quality) and “factors” which are circumstances or influences that contribute to the project outcomes (i.e. time and cost). They suggest that for project success the factors
38
involved will determine if the criteria be achieved and the project a success. This could be taken to mean that criteria and factors are always linked when determining project success. However, when considering time, cost and quality the success in one area would not automatically mean success in another. The success of a project will also vary depending on which angle the project is looked at and failing to fulfil, thus the factors of time and cost may perhaps be bypassed if the stakeholders are so pleased with the standards of the project, which again highlights that all three areas are equally important.
An interesting concept this paper presents is to break down project success in to “macro” and “micro” views, meaning if the original overall project concept is achieved and the achievements of smaller component levels respectively. The suggestion comes from the idea that the project could be successful on a macro level as long as the users of the construction are happy – i.e. the people using the completed project for its purpose. If so then surely the success of the project in this case would be determined by it’s quality and having it completed in the correct time frame so that it can be used. Cost would also factor in if those using the completed project had financially invested in to it. The micro breakdown of the project would also include time cost and quality. This highlights that however project success is determined it is almost impossible to break away from the time, cost and quality aspects.
Although this paper appears to be based on the authors own opinions as well as weak evidence of unstructured interviews and casual engagements, it can be used as evidence that looking further in to time, cost and quality is a valuable direction to take. This is because ultimately when considering any area of project analysis the criteria or factors looked at will fall in to one of the categories of time, cost or quality.
Having already looked at determining the importance of time, cost and quality in project success this paper by Li et al (2000) was reviewed in attempt to establish how well each are interlinked. With completion delays being prevalent in the construction industry the effects of time on cost and quality were analysed. When projects begin to over run there can be a significant effect on the financial cost and the extra hours to be invested in the project, which could affect quality due to decreased productivity and performance. There are a variety of factors which could account for over running on a project which makes it difficult to truly analyse, however in this paper Li et al determined a system dynamics model to analyse the effects of time on project quality and cost. This model also provides analysis on the options available for projects which have over run such as increasing the length of the project versus providing extra resources to complete the project. Whichever solution is to be chosen for the project it is inevitable that project cost and quality are to be affected.
Al though the system dynamics analysis in this paper is complex, the theory of what the model is based on actually highlights a very important consideration. If a project was over budget would it have as much of an impact on quality and time; and equally does quality also have such a great effect on cost and time?
39
Kim et al (2011) wrote that projects should be completed before the project due dates and within budget. However Zeng et al (2009) say that sudden unexpected changes in construction technology, techniques, materials or human resources can have either a positive or negative effect on the project constraints, often increasing pressure on the project schedule and budget leading to project failure. To alleviate such pressures a technique called 'crashing activities' is often used. Crashing activities involves allocating more resources (such as materials, labour and equipment) than planned in order to complete the project more quickly (Kessler Chakrabarti, 1999). Kim et al (2011) say that in time-cost tradeoffs problems, projects are not always completed as scheduled without reworking or modification. This is mirrored in Atkinson’s (1999) findings where they say that a project is a one-time task that is constrained by time, cost and quality, and its success is determined by how well it meets these three constraints. Time-cost trade is often measured using the critical path analysis method. This is a mathematical algorithm used to schedule a set of activities in a project to meet any given completion dates at minimum costs (Kelley and Walker, 1959).
However, this method of project analysis is not regarded as suitable if there are concerns over project quality (Deckro et al, 1995) and that more time should be allowed to finish the project. Vrat and Kriengkrairut (1986) say that in such cases preventative measures should be taken to avoid rework or modifications that might occur during project execution.
Once a project is completed, the time and cost tradeoff problem is no longer an issue for the project manager, and quality or performance becomes the key issues (Avots, 1984). This is also found in Martin and Tate (2001) where they say that if a project meets or exceeds the project expectations then the project is deemed successful.
Meng and Gallagher (2010) wrote about the impact of incentive mechanisms on project performance. They say that completing a project on time, on budget and within the specified quality is widely recognised as the major objectives of a construction project, and that time, cost and quality are generally identified as the key indicators for project success. From the client perspective, it is ideal that the project is completed in the minimum time, to minimum budget and to the highest quality (Arditi et al, 1997). However, Harris et al, (2006) say that it is difficult to achieve all three constraints in practice, especially in large complex projects. These findings are shared by Sun and Meng (2009) who wrote that many projects suffer from time delay, budget overrun and quality defects.
It is clear that all three factors are vital for a project to be truly successful but as to which aspect has the greatest influence of overall project success is yet to be determined. In light of this it has been attempted to determine if any aspect can be defined as the key player in project success or if each are equally important. The way in which this has been carried out is described in the method section of this project.
40
RESULTS This section of the research paper presents the results of the findings from the main questionnaire along with an analysis of the results from each question. This chapter then analyses the results of the ten question questionnaires collectively to determine the outcome of the questionnaire as a whole. The findings are then supported by literature that was reviewed on the topic of time cost and quality.
The chapter then analyses the results of the second questionnaire which was sent to participants and presents the findings from this alongside the analysis of the results supported by previous research on the subject.
As previously stated in the methodology section, all the results from the ten question questionnaire were gathered. These results can be found in this chapter with the presentation of the data and an analysis of the results.
Of the 55 questionnaires that were distributed, as discussed in the previous chapter, a total of 25 responses were received, which gives an overall response rate of 45.45%. These 25 responses were collected from SurveyMonkey and the responses to each question were gathered together and placed into tables.
Analysis of the responses to the questions
From the results and analysis of each of the ten questions, the key findings can be drawn up into a table and the most prevalent constraint, time cost or quality, from each one can be highlighted and an overall analysis can be achieved.
Table two shows that the most common and important constraint was time, with cost being second and quality being the third and least important. This is supported by the findings of Shenhar et al (2001) findings, as previously stated who found that time is the most significant factor when delivering a construction project. Avots (1984) also supported this as they say that ultimately time and cost are perceived as the most important constraints until project completion, at which point quality becomes the main issue. This data is taken from table 2 is presented in Figure 1.
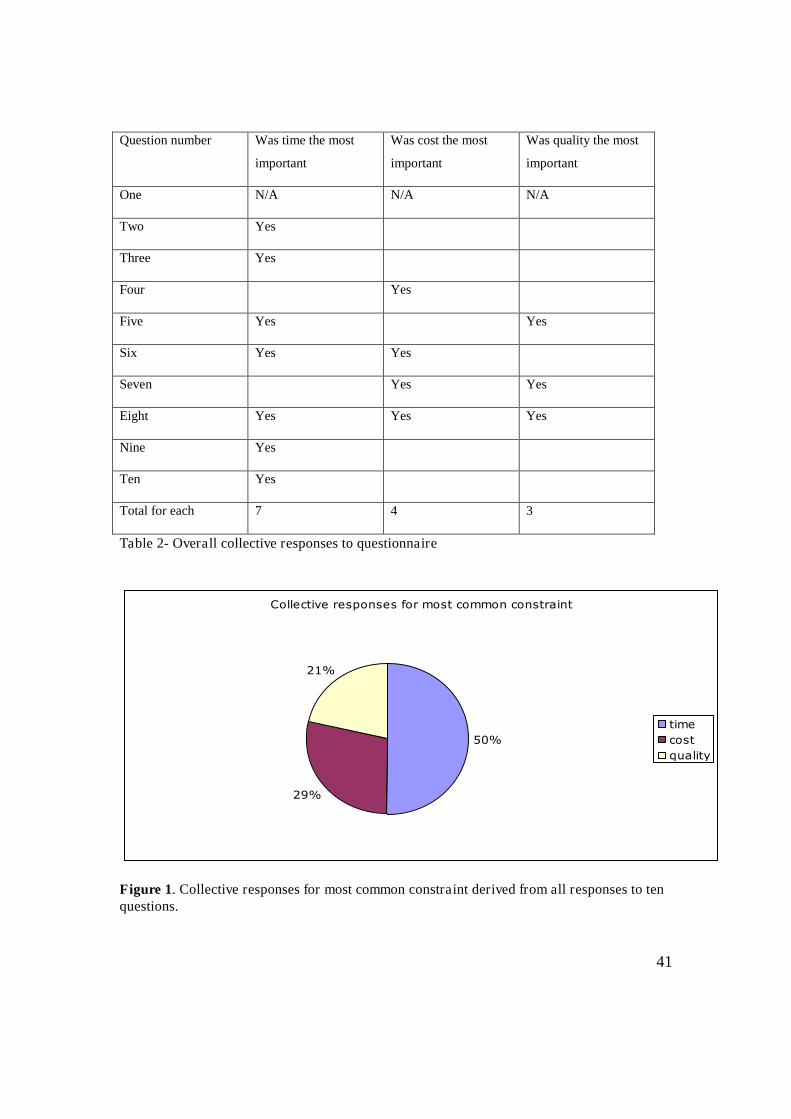
41
Question number Was time the most
important
Was cost the most
important
Was quality the most
important
One N/A N/A N/A
Two Yes
Three Yes
Four Yes
Five Yes Yes
Six Yes Yes
Seven Yes Yes
Eight Yes Yes Yes
Nine Yes
Ten Yes
Total for each 7 4 3
Table 2- Overall collective responses to questionnaire
Figure 1. Collective responses for most common constraint derived from all responses to ten questions.
Collective responses for most common constraint
50%
29%
21%
time
cost
quality

42
Figure 1 indicates that the constraint which was considered to be most important was time, with cost the second most important and quality as the least important of the three. These results are also presented in the bar chart below.
Figure 2 Collective responses from most common constraint
As discussed in the methodology section, a further email was sent out to the participants of the questionnaire survey asking them to answer one final question “put these constraints, time cost or quality, in order of importance when delivering a construction project”. The purpose of this final question was to see if the findings from the ten question survey were supported by the order of importance that the participants see the constraints to be the most important.
All participants who were selected for the original questionnaire where sent this additional question, with a response rate of 22 respondents from the 55, which is slightly less than the overall response rate to the original questionnaire. To try to establish why this was a couple of follow up phone calls were made to the participants that had not responded to the order of importance question. It was discovered that a number of employees were on annual leave during the time of the survey.
The results of the responses to the order of importance question can be seen in Figure 3.
0 1 2 3 4 5 6 7
Response percentage
time
cost
quality
Most
importa
nt
facto
r
Collective responses from most common constraint
Series1

43
Constraint Response to most important
constraint
Time 42%
Cost 40%
Quality 18%
Table 3-Responses to order of importance question
Figure 3 Presentation of data from responses to order of importance question
The results from this question show that the majority of respondents would class time as the most important constraint (42%) with cost as the second most important (40%) and quality as the least important with 18% opting for this constraint. These results area also presented in the bar chart (Figure 4).
These results support the key findings from the original ten question questionnaire, where the order of importance was believed to be time first, and then cost and then quality. This is again supported by the findings of Shenhar et al (2001) where they highlight that time is the main factor to consider when delivering a construction project. This could be because if a project is not completed then quality and cost are irrelevant.
Most important constraint response
42%
40%
18%
time
cost
quality

44
Figure 4 Bar chart showing the most important constraint
CONCLUSIONS The main aim of this research was to try to establish if the employees of KCWW believed that time, cost or quality was more important when delivering a construction project. It was deemed important from the outset that only the views of the employees that are directly linked to procuring projects and delivering them on site were to be studied. To enable a suitable questionnaire to be developed for the participants of the survey to answer, a review of literature already written on time, cost and quality was carried out. From this literature review a pilot questionnaire was first developed and issued to colleagues from university for their thoughts and comments. From this a formal ten question questionnaire was made and sent out to the participants, as explained in the methodology. The results from this questionnaire were gathered and analysed, and as a result a final question was sent to all of the original respondents asking them to “put these three constraints in order of importance, time, cost or quality”. This was done to see if the results from the main questionnaire would be supported by the final thought of the participants.
Summary of findings
The key findings of this survey have identified that the participants of the survey believe that time is the most important constraint, ahead of cost and then quality. The findings do not distinguish between which constraint is more important when delivering a project but only what the participants of the survey believe to be the most important. As the majority of the literature review shows, most research to date believe that all three constraints are equal if you are to deliver a project successfully (Shenhar 2001, Baccarini 1999). The findings of this research have been presented to the directors of KCWW so that they can review the results and make any changes or recommendations that they feel necessary.
0% 10% 20% 30% 40% 50%
Response percentage
time
cost
quality
Most important constraint
Series1

45
Limitations
It is important to view this research in the context of its limitations. A major limitation of this research is the small sample size of questionnaire and the small number of participants. This is down to a number of things. Firstly, due to the economic crisis the company KCWW have had a number of redundancies over the past four to five years. The number of people in each department that were sent the questionnaire are under half of what it would have been if this study was carried out prior to the recession hitting the industry in 2008. The recession may have also affected the thoughts of the participants when answering some of the questions. The industry at the moment is very fragile and to win work you have to be very competitive, but ultimately you have to be seen to be delivering projects on time if there is to be any repetitive work with a client or future prospective employers.
Secondly, the limitation of the size of the questionnaire was down to having enough time to gather the results and analyse them appropriately for the research. However consideration had to be given to the participants of the questionnaire and the survey had to be read and answered in a short time period as most participants would have answered the survey whilst at work.
In addition to these limitations it may also be interesting to involve the clients and/or end users of some of the projects that have been delivered. This may indicate how they clients perceive how we view the importance of the three constraints.
The responses to this survey show that no employees of the procurement department and only one employee of the estimating department completed the survey; this is clearly a very low response rate from these two departments.
The nature of the questions in the survey required using the Likert scale to categorise the answers. This didn’t allow the participants to say exactly how they felt about their answers.
Recommendations
To overcome the aforementioned limitations, future research should be conducted with a larger sample size of participants. Future researchers could look at surveying all employees of the Kier Group, a total of approximately 7500. This will allow the researchers to investigate in more depth what the companies view point is on time, cost and quality when delivering a construction project. It could also be recommended that employees from all departments of a company could be asked to participate in a survey; this would then give the whole companies view point on the main objective.
If future research is to be carried out on this topic it would be recommended to use a more qualitative approach instead of the quantitative approach used in this research. This may allow future researchers to break down the results of any survey in more detail and produce some more concrete findings.
It is also recommended that in future research studies to be carried out on this topic that Health and Safety becomes a fourth constraint to measure the success of a project.

46
Within KCWW at the moment all projects are measured on a high five scoring system where to be successful they must fulfil I high percentage of each of the five marking criteria. They are, programme (completing the project on time or before practical completion date), client satisfaction (9 or more out of 10 from the clients feedback form at the end of a project), zero accidents, 36 or more out of 40 for considerate constructors score (a nationwide initiative to improve the image of the construction industry) and zero defects at handover.
REFERENCES Atkinson, R, (1999) Project management: cost, time and quality, two best guesses and a
phenomenon, its time to accept other success criteria. Project Management Journal 17, 337-342
Arditi, D, Khisty, J et al (1997) Incentive/distinctive provisions in highway contracts. Journal of Construction Engineering and Management, 123 – 302-307
Association of Researchers in Construction Management, (no date), [online] last accessed on 1st August 2011 at: http://www.arcom.ac.uk/
Avots, I, (1984) Information systems for matrix organisations, Matrix Management Systems Handbook, Van Nostrand Reinhold, New York, 535-537
Baccarini, D, (1999) The logical framework for defining project success, Project Management Journal, Vol 30 (4):25-32
Bowen, P. A., Cattel K. S. et al (2002) Perceptions of time, cost and quality management on building projects. Aus Journal of Construction Economics and Building Vol 2(2):48-56
Construction commitments, 2010, [online] last accessed on 4th October 2011 at: www.cic.org.uk/strategicforum
Deckro, R.F, Hebert, J.E, (1995) Nonlinear time/cost tradeoff models in project management, Computers and Indtustrial Engineering, Vol 28
Dweiri, F.T, (2006) Using fuzzy decision making for the evaluation of the project management internal efficiency. Decision Support Systems 42, 712-726.
Gardiner, P. D. Stewart, K, (2000) Revisiting the golden triangle of cost, time and quality: the role of NPV in project control, success and failure. Int Journal of Project Management Vol 18:251-256
Harris, F, McCaffer, R, et al (2006) Modern Construction Management. Six edition, Blackwell, Oxford
Kim, J.Y, Kang, C.W, et al (2011) A pratical approach to project scheduling: considering the potential quality loss cost in time-cost tradeoff problem. International Journal of Project Management
Kelley, J.T, Walker, M.R (1959) Critical Path Planning and Scheduling: An Introduction, Mauchly Associates, Ambler (PA)
Kessler, E.H, Chakrabarti, A.K, (1999) Speeding up the pace of product development. Journal of Product Innovation Management, Vol 16, 231-247

47
Lim C S and Zain Mohamed, (1999), Criteria of project success: an exploratory re-examination, Int Journal of Project Management Vol 17 (4):243-248
Likert, Rensis, (1932). A technique for the measurement of attitudes. Archives of psychology 140:1-55
Love D. & Drew, S. (2000), Effects of overtime work and additional resources on project cost and quality, Engineering Construction and Architectural Management Vol 7(3):211-220
Love & Irani, (2003), A project management quality cost information system for the construction industry, Information & Management Journal, Vol 40, 649–661
Martin, P.K, Tate, K, (2001) Getting started in project management. John Wiley and Sons Inc, New York, 26-27
Meng, (2011) The effect of relationship management on project performance in construction, Int Journal of Project Management, Vol 30 (2):188-198
Meng, X, Gallagher, B. (2011) The impact of incentive mechanisms on project performance. International Journal of Project Management
Professional ethics in construction, 2010, [online] last accessed on 17th November 2011 at: http://www.manchester.academia.edu
Rahaman et al, (1994), Capturing the cost of non conformance on construction sites, Int Journal of Quality & Reliable Management, Vol 13 (1):48-60
Rethinking construction, 2011, [online] last accessed on 10th October 2011 at: http://www.salford.gov.uk/ds-rethinking.htm
Shenhar, A.J, Divir, D, et al (1997) Mapping the dimensions of project success. Project Management Journal, 28, 5-13
Shenhar, A.J, Divir, D, et al (2001) Project success: a multidimensional strategic concept. Long Range Planning, 34, 699-725
Sun, M, Meng, X, (2009) Taxonomy for change causes and effects in construction projects. International Journal of Project Management. Vol 27 560-572
SurveyMonkey. 2012, [online] last accessed 5th March 2012 at http://surveymonkey.com
Vrat, P, Kreingkrairut, C, (1986) A goal programming model for project crashing with piecewise linear time-cost tradeoffs. Engineering costs production. Economics, Vol 10, 161
Willard, B.K, (2005) Project success – a different view. Last accessed on 17th November 2011 at: http://maxwidman.com
Zeng, J, An, M et al (2007) Application of a fuzzy based decision making methodology to construction project risk assessment. International Journal of Project Management, Vol 25, 589-600
Fodor’s Travel Publications, 1997, Retrieved [online] last accessed on 15th November 2011 at: www.fodors.com
48
A STUDY INTO WHETHER THE CONSTRUCTION OF SCHOOLS EFFECTIVELY MEETS SUSTAINABILITY STANDARDS
Matthew Sparkes4
Matthew Sparkes is currently employed as a site engineer at Kier. He graduated from Sheffield Hallam University in 2012 with a degree in construction and commercial management.
ABSTRACT.
The need to focus on sustainable construction will become more important as Governments strive to make progress against energy targets and expectations for a greener future. This paper will explore current levels of sustainable construction within the educational sector, using a combination of BREEAM (Building Research Establishment Environmental Assessment Method) data from case studies, interviews with construction professionals and observation from live sites. The evidence gathered will culminate into an opinion as to whether current building practices are adequate to meet the Government’s green agenda for the future of educational construction. Recommendations for improving on-site practices will be identified, in order to positively influence the construction of school buildings. Within the scope of this study, research into current sustainable construction practices, attitudes and sources of strong influence, will be evaluated, in order to gain an understanding of the current state of sustainable construction. In essence, I will consider BREEAM objectives and their critical criteria, and will seek to appraise on-site school construction practices. The real focus will be to develop an understanding of construction demands and the barriers to delivering a more sustainable construction programme, together with best practice recommendations for the future.
Keywords:

49
INTRODUCTION. This paper aimed to focus on the sustainable performance of the construction industry, specifically school building, and attempts to gauge the current level of on-site sustainable construction, the attitudes of construction professionals and makes best practice recommendations for the future of greener construction methods.
UK buildings account for approximately 36% of total carbon output, with commercial buildings contributing 13%. Currently, schools account for 15% of this commercial carbon output. All educational buildings constructed post 2016 must be zero-carbon in their operation, but for this to be achieved, buildings constructed today must exceed minimum standards on the BREEAM format (Department for Communities and Local Government, 2007).
BREEAM is the adopted scheme used to assess the green credentials of commercial buildings including design, construction and operation. A rating is given as a percentage in terms of key performance criteria. This research project will use the BREEAM 2008 scoring criteria as a benchmark for current standards, because the revised 2011 BREEAM standards have not yet been incorporated into the design.
Current levels of on-site sustainable construction within the educational sector against BREEAM benchmarks are assessed. This has been done by using two case studies, (secondary ‘Academy’ schools) constructed in Norwich, Norfolk in the last two years, plus two Academies constructed in the past 5 years in other regions.
Research into the case study academies involved site observation, which aimed to see how management attitudes affect the day-to-day running of the project.
Interviews were also conducted with construction professionals, to understand the challenges that currently prevent schools being constructed to higher standards e.g. above 85% (rated as outstanding) on the BREEAM system.
RESEARCH RATIONALE. The approach to data collection included specific research methods, identified by Bell (2005). Specifically, case studies, narrative research and action research. (Farrell, 2011).
Three main aims were identified for the piece of research, and the most appropriate methods of data collection chosen to effectively realise these aims.
It was decided that the best way to understand current construction practices and attitudes was to conduct qualitative interviews with those in charge of managing sustainable construction, and to carry out qualitative observations of on-site activity to see how procedures were being followed.
BREEAM scores from recent projects were also correlated against future trends; which is an example of quantitative data.
Aim 1 - To benchmark current sustainable standards of school construction against BREEAM credentials.

50
In order to achieve the objectives set out under Aim 1, a combination of primary and secondary data was used, in the form of observational studies on a live Academy construction site, and secondary data in the form of pre-construction BREEAM reports; two for the observed sites, and two control Academies elsewhere in the UK. Control was maintained across the sample by ensuring that the research was compiled using only Academy projects as a source of evidence.
Aim 2 - To gain a detailed understanding of the extent to which construction professionals are aware of their responsibility towards sustainable construction.
In order to gauge opinion from the professionals directly involved with the sustainable construction of Academies, nine interviews or ‘narrative research’ were conducted with members of the contractors’, and the subcontractor’s management teams. As part of the project, interviews were conducted with the site manager, foreman, site engineer, subcontractor supervisor, carpenter, quantity surveyor, sub agent, project manager and senior engineer.
Figure 1 indicates how the relationship between Client, main contractor and subcontractor is set up, including how subcontractors will employ only a temporary, self-employed workforce.
Figure 1. Main Contractor site team hierarchy. (Source: Author).
Aim 3 - To analyse the longer term programme for the sustainable construction of school buildings and to positively influence improving performances against BREEAM standards.
Contract
Manager
Project Manager
Site Manager
Foreman
Carpenter
(Directly
eployed)
Quantity
Surveyor Senior Engineer
Site Engineer
Sub Agent

51
The data used to satisfy the third aim of this research project was a combination of the primary data collected during the narrative research and the action research, and secondary data as used in the case studies, together with research into future Government plans and targets for sustainable school construction.
LITERATURE REVIEW. Global warming;
The causes, and indeed effects of global warming have been subject to debate between scientists and governments for many years, with the blame aimed at both human activity and natural influences; however the consensus now is that the industrial influence of modern society has had a negative impact on the natural functioning of the planet. (Climate change act, 2008).
The IPCC (2007) concluded that it is “extremely unlikely that the global climate changes of the past fifty years can be explained without invoking human activities”. (Soloman et al. 2007).
However in contrast, a study of leading scientists conducted by Dennis Avery and Fred Singer (2007) concluded that the majority were doubtful that man-made greenhouse gases were causing a warming of the planet. (London Evening Standard, 2007).
Government strategy;
In order to reduce greenhouse gas emissions, governments worldwide have made reduction commitments. The UK has stated an 80% reduction in greenhouse emissions by 2050, based upon 1990 levels. (Committee on Climate Change, 2008).
The UK school estate accounts for 2% of the total CO2 output for the country, but when further categorized, they account for 15% of all public sector emissions. The Government is keen to tackle public sector emissions, so have targeted all school buildings to be zero – carbon in their construction by 2016. (House of Commons Education and Skills Committee, 2007; Department for Education, 2010).
The first zero–carbon school project in the UK has begun this year in London, with an anticipated BREEAM rating of outstanding. This example proves that UK construction techniques can provide very high standards. (Department for Energy and Climate Change, 2012).
However, a source from the 21st Century Schools programme suggested that modern schools underperform in terms of energy efficiency for a number of reasons see Figure 2;

52
- Deficiencies in design, underperformance of insulation or air leakage.
- Poor control of systems.
- Inaccuracies in design tools used to predict performance.
- Patterns of use change from those originally considered.
- Energy uses not considered at design stage, examples include equipment left on standby, kilns and swimming pools drawing major unaccounted power resource.
Figure 2. Factors affecting the energy performance of new school buildings. (21st Century Schools, 2009).
Energy costs;
The cost of energy to run vehicles, homes and businesses is another important consideration, when planning for the future. Figure 3 demonstrates a sharp increase in the costs of energy for the domestic sector post 2005, with prices rising to a 20 year high. Dwindling global resources could also have a negative impact on the cost of fuel. (Jowit, 2008).
BREEAM; The Building Research Establishment suggests that BREEAM sets a “standard for best practice in sustainable design and has become the de-facto measure used to describe a building’s environmental performance”.
The aims of BREEAM are:
To mitigate the impacts of buildings on the environment. To enable buildings to be recognized according to their environmental benefits. To provide a credible, environment label for buildings. To stimulate demand for sustainable buildings.
(BRE Global, 2008).
Since 2005, the DCSF require all new build or refurbishment education projects to achieve a minimum standard of ‘very good’.

53
Figure 3.Graph to show fuel price trends between 1980-2010. (Department for Energy and Climate Change, 2011).
BREEAM application;
A large percentage of BREEAM credit focuses on the design of the building and its impact on the surrounding area. Only the Client can influence how sustainable certain aspects of their building are going to be, through the dissemination of the project’s budget.
Scores are broken down into categories, with credits available for both sustainable design, and efficient practice on the construction site.
In order to maximise the future potential of BREEAM, contractors must ensure that the areas in which they can influence the score of a building are always gaining maximum points.
This is feasible because the costs of site based monitoring and selective use of construction materials will only cost a fraction of the overall project budget.
BREEAM scrappage;
However, already in 2012, the education secretary Michael Gove is considering widespread scrappage of BREEAM requirements for new school buildings.
There is suggestion that the scrapping of BREEAM standards for new school construction has come about in order to match the lower standards permitted in the construction of ‘Free’ schools.
In response to the announcement, leading figures in the construction industry have declared their opposition to the decision. The president of the Chartered Institute of Building (CIOB) claims “Designing, building and operating to BREEAM standards
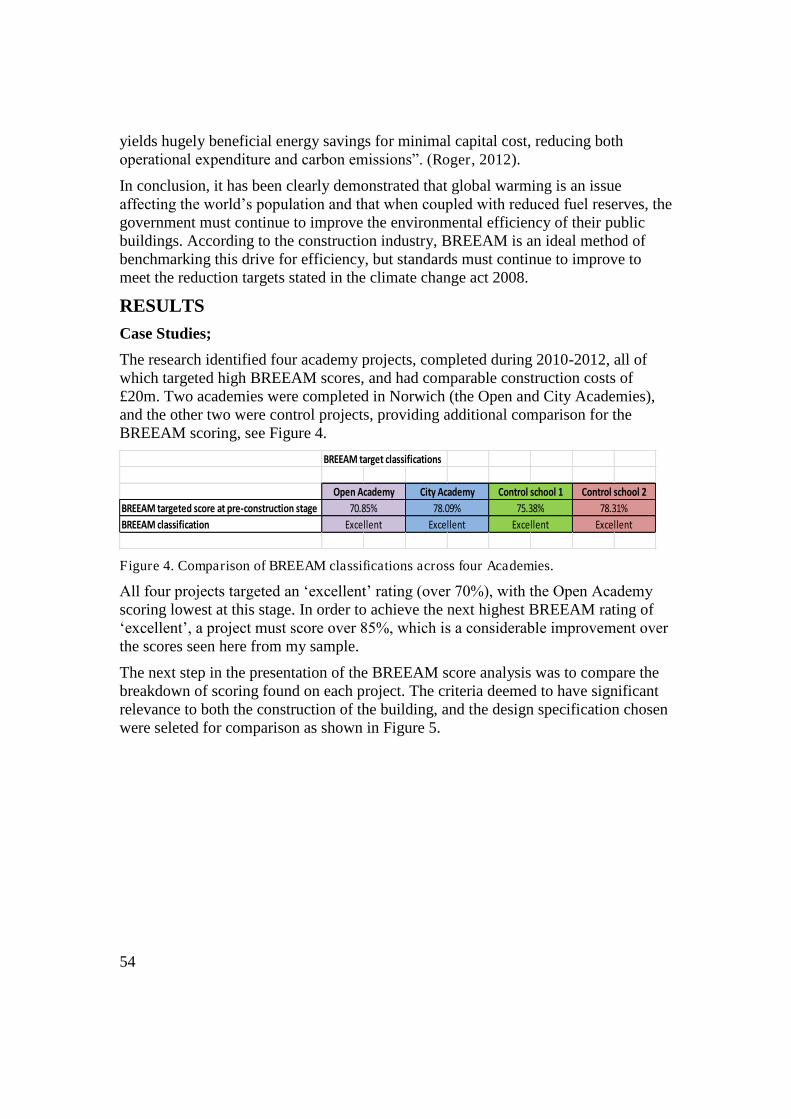
54
yields hugely beneficial energy savings for minimal capital cost, reducing both operational expenditure and carbon emissions”. (Roger, 2012).
In conclusion, it has been clearly demonstrated that global warming is an issue affecting the world’s population and that when coupled with reduced fuel reserves, the government must continue to improve the environmental efficiency of their public buildings. According to the construction industry, BREEAM is an ideal method of benchmarking this drive for efficiency, but standards must continue to improve to meet the reduction targets stated in the climate change act 2008.
RESULTS Case Studies;
The research identified four academy projects, completed during 2010-2012, all of which targeted high BREEAM scores, and had comparable construction costs of £20m. Two academies were completed in Norwich (the Open and City Academies), and the other two were control projects, providing additional comparison for the BREEAM scoring, see Figure 4.
Figure 4. Comparison of BREEAM classifications across four Academies.
All four projects targeted an ‘excellent’ rating (over 70%), with the Open Academy scoring lowest at this stage. In order to achieve the next highest BREEAM rating of ‘excellent’, a project must score over 85%, which is a considerable improvement over the scores seen here from my sample.
The next step in the presentation of the BREEAM score analysis was to compare the breakdown of scoring found on each project. The criteria deemed to have significant relevance to both the construction of the building, and the design specification chosen were seleted for comparison as shown in Figure 5.
BREEAM target classifications
BREEAM targeted score at pre-construction stage
BREEAM classification ExcellentExcellent
78.09% 75.38%
Excellent Excellent
Open Academy City Academy Control school 1 Control school 2
70.85% 78.31%
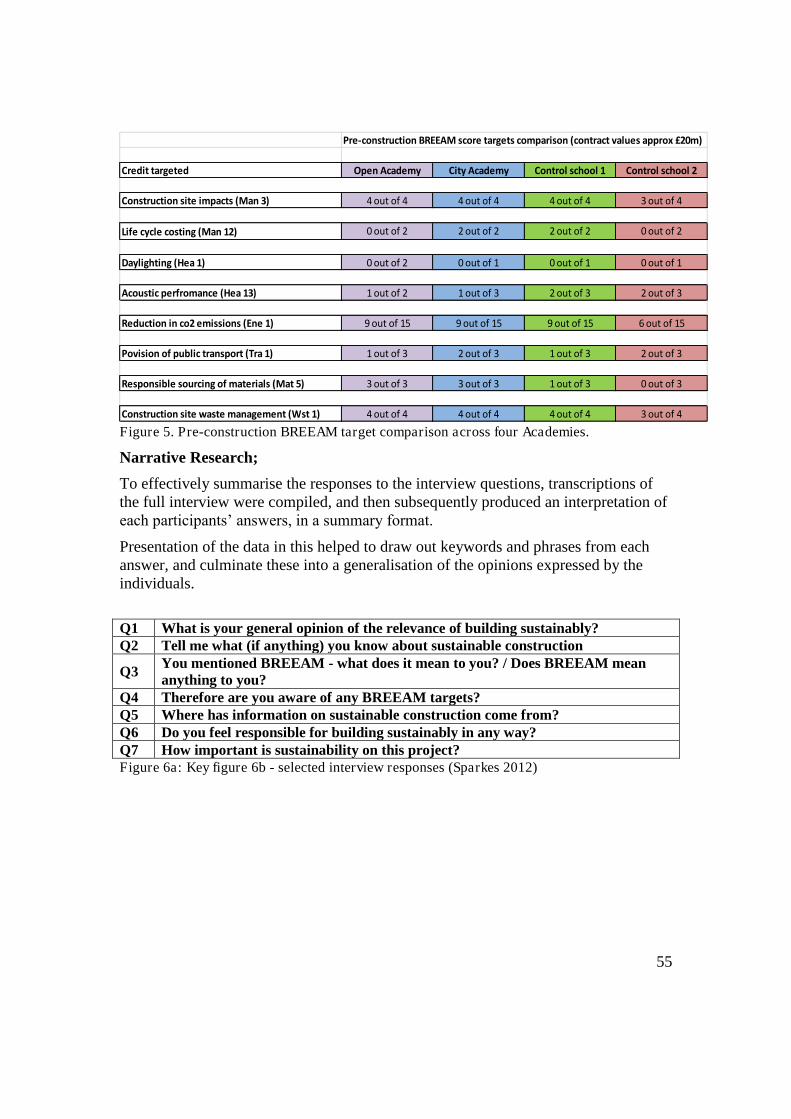
55
Figure 5. Pre-construction BREEAM target comparison across four Academies.
Narrative Research;
To effectively summarise the responses to the interview questions, transcriptions of the full interview were compiled, and then subsequently produced an interpretation of each participants’ answers, in a summary format.
Presentation of the data in this helped to draw out keywords and phrases from each answer, and culminate these into a generalisation of the opinions expressed by the individuals.
Q1 What is your general opinion of the relevance of building sustainably? Q2 Tell me what (if anything) you know about sustainable construction
Q3 You mentioned BREEAM - what does it mean to you? / Does BREEAM mean anything to you?
Q4 Therefore are you aware of any BREEAM targets? Q5 Where has information on sustainable construction come from? Q6 Do you feel responsible for building sustainably in any way? Q7 How important is sustainability on this project? Figure 6a: Key figure 6b - selected interview responses (Sparkes 2012)
Pre-construction BREEAM score targets comparison (contract values approx £20m)
Credit targeted
Construction site impacts (Man 3)
Life cycle costing (Man 12)
Daylighting (Hea 1)
Acoustic perfromance (Hea 13)
Reduction in co2 emissions (Ene 1)
Povision of public transport (Tra 1)
Responsible sourcing of materials (Mat 5)
Construction site waste management (Wst 1)
City Academy Control school 1 Control school 2
4 out of 4 4 out of 4 4 out of 4 3 out of 4
4 out of 4 4 out of 4 4 out of 4 3 out of 4
1 out of 3 2 out of 3
3 out of 3 3 out of 3 1 out of 3 0 out of 3
1 out of 3 2 out of 3
0 out of 2 2 out of 2 2 out of 2 0 out of 2
0 out of 2 0 out of 1 0 out of 1 0 out of 1
1 out of 2 1 out of 3
Open Academy
2 out of 3 2 out of 3
9 out of 15 9 out of 15 9 out of 15 6 out of 15

56
Site Manager Q1 Very important, good thing, client demand.
Q2 Cross laminated timber construction. BREEAM is a tick box exercise, not sure what it
does for the company. Still an option to go for traditional build.
Q3 BREEAM does ’t ea a great deal, I ha e heard a out it o er the last 4 ears. Not directly involved with it. Client driven.
Q4 Aware of BREEAM target on current project. (Excellent). Aware of a points scoring
system but that is all.
Q5 Client requirements dictate what the site team have to deal with on site. For example
PV and ground source heating.
Q6 Nice to be part of it, rather than on a traditional build with no sustainability.
Q7 For our company I think it is very important. A lot of projects will be won or lost on what
you demonstrate as sustainable.
Foreman
Q1 More important now than ever before. Everything seems to be going this way, new
methods of construction. Good for us a company.
Q2 Not a are, o l the Cross la i ated ti er. Do ’t k o u h a out regulatio s. A fe
its i the CIOB agazi e, do ’t reall take it i .
Q3 Not reall i ol ed, o es up i eeti gs, I ould ’t sa I ould e plai ho it orks particularly.
Q4 Yes on previous jobs we have had to achieve 'excellent', which is 75 points I think. If you
do ’t a hie e those poi ts the ou a hie e satisfa tor or the o e elo . I ha e a it of knowledge, because I've picked it up on previous jobs.
Q5 In the CIOB books, and experience on-site. It is a big part of everyone's' life now, it is in
the papers and magazines. It has got to be accepted that this is the way we need to go.
Q6
It is good to be doing the right thing, you get a good sense of achievement. You do feel
responsible because you have to accept that as a way of life now. I know we are looking
at a straw bale job now, you cant really beat concrete frame or brick and block, but they
may get replaced in the future.
Q7 Probably one of the top things on this project, its such a good focal point that everyone
is concentrating on.

57
Subcontractor Supervisor
Q1 It becomes more important as you progress through a career in the construction
i dustr . As a ou g a ou do ’t are, ou just want to earn a few quid and go home
again.
Q2 Not a lot.
Q3 Yes, we have to collect our own BREEAM points. We get points for safety, material
sourcing and it betters our contract opportunities. This is sorted out at a higher level
than where I am.
Q4 I do ’t k o a figures, ut I k o it ake a differe e to the size of o tra t ou are able to bid for.
Q5 What I have picked up has come from our office, they push for the BREEAM system. At
first it looks like a made up job, but once it is explained and we get a folder, I fill it in at
instructed.
Q6
Not really, it's a o e e, I do ’t get i ol ed ith that. I do ’t are here the aterials we order come from, because it my job to ensure that the guys on-site have the right
materials when they need them. Our office orders the material, so that is not my choice.
I can reduce waste when ordering concrete, but for me we are driven by profit, so we
cant afford to waste materials.
Q7 Pretty important.
Carpenter
Q1 I think it is quite important to me, with more materials being used on-site, I think there
has to be some sort of sustainability. I understand that raw materials have to come
from somewhere. Timber is very important to me because of my trade.
Q2 I did this at college last year, I know there are certain standards that need to be met,
and BREEAM points count towards a lot.
Q3 It is a target system isn't it. From what I have heard on-site, you have to meet certain
targets to get BREEAM points. If you get enough points you get recognition from
BREEAM.
Q4 I do ’t k o a targets of BREEAM.
Q5 From being on-site. People just chatting about it, and a little from college last year. My
BREEAM knowledge has come form my employer.
Q6 Yes I do, especially to do with waste. I try to reduce waste in my job.
Q7
It is a big issue. The actual structure is sustainable, using different materials, with less
chemicals. This project, when compared to my previous jobs is very sustainable, partly
due to the structural system used. I notice a positive drive for sustainability on this
project.
58
Sub-Agent
Q1 It is becoming ever more important, with the whole world becoming conscious of the
environment and energy usage. It is something we are going to deal with a lot more in
construction.
Q2
The government has several drivers, with the key one being BREEAM, which we have
used the past few construction projects. There are other energy targets, but BREEAM
has enhanced these in many cases. BREEAM is stricter than some company policies we
have on waste and energy monitoring.
Q3 Q4
There are energy usage targets, energy performance certificate for the finished
building, with points awarded for the fitting of energy conscious fixtures and fittings.
BREEAM also requires us to monitor our own energy use in construction, and leads us
to monitor this, as well as monitoring traffic and deliveries. I have a good knowledge of
BREEAM targets because it has been my responsibility to ensure we have achieved
BREEAM ratings, as per our contractual requirements.
Q5
Purely through my responsibilities on the past few projects. It has been my
responsibility to ensure I understand the process and liaise with an independent body. I
haven't received any training on BREEAM from my employer, just picked up this
knowledge on the projects I have worked on.
Q6
I do because of the responsibility I have to ensure that the project achieves its BREEAM
target. But I also feel that we all have responsibility to consider the amount of energy
e are usi g outside of ork. If BREEAM as ’t there, e ould still ha e the sa e principles, but we may not be strict in following them.
Q7 Very, very important, I think the structure and the energy sources have been driven by
sustainability.
Figure 6b: Summary of selected interview responses (Sparkes 2012)
Action Research: Practices observed
This research was compiled over one week, 5/9/11 – 9/9/11 inclusive at the City Academy site. Observations took place during site hours (7.00am - 5.00pm).
The site management team had to move very quickly to keep up with the project, for example constant moving of the site pedestrian routes, due to construction opening up in new areas. This involved the production of new signage and maps directing the 120 strong workforce. This practice demonstrated to the author how much effort is required to maintain a set of standards on a large project, especially when other pressures such as budgets and time are considered.
The author was able to attend the weekly site management team meeting. This meeting was well structured, with BREEAM and the environment on the agenda. The site engineer raised an environmental issue about how the ground works subcontractor was storing fuel. It was agreed that the sub-agent would inspect the container for integrity.
Observation site showed an instance of a subcontractor collecting off-cuts of plasterboard from the construction of dry-lined partitions, using a dedicated labour

59
force. The waste was placed into a segregated waste skip and the author was informed that subcontractor actually received payment for returning these offcuts to the manufacturer, because it is hazardous waste and also because it is re-usable.
It was clear when watching the construction of the walls, that the labour force made efficient use of these boards to minimise waste (their company supplied the material so they were motivated to save costs). Therefore, there was pressure to not waste materials.
Attitudes of staff members
General attitudes from supervisors and managers were positive. The project was on target, although there was pressure building on the brickwork and mechanical and electrical installations.
Members of the contractors’ management team seemed to have a good relationship, with a strong emphasis on assigned responsibility. It was noticed that communication was good, with regular discussions about site events. The company policy appeared to dictate activity, and there were posters providing information about safety and environmental wellbeing.
Relationships between contractor and sub-contractors were supportive, with the subcontractor supervisors sharing an office with the core site management team.
Little conversation specifically about sustainability was witnessed, but the engineer in charge of waste reporting did indicate that his waste recording was going well, although he was concerned about how the current trend in rising waste volumes on site might affect the project’s BREEAM target.
The input of waste data onto a database known as ‘Smartwaste’ was also observed. Skips are recorded as they leave site, using the delivery/collection note as evidence. Information about the contents of the skip is either gleaned from the ticket

60
(wood/metal if it is segregated for this purpose), or from an individual on site, who breaks down the contents into a percentage for brick/soil/packaging. This Smartwaste system also produces summary information for the project, with graphs to measure waste trends during the project.
Figure 7. Progress at City Academy, September 2011 (Kier 2011)
DISCUSSION Case Studies
All of the projects researched had a score of above 70% (excellent), with three of the four achieving well above this threshold (75-78%). These buildings should definitely achieve the stipulated BREEAM score of ‘excellent’ post construction, even if a few credits are lost as the construction commences, because of the percentage margin above 70%. The Open Academy does not follow this trend, because it has only just managed an excellent rating at the design stage (70.85%).
This data proves that at pre-construction stage, UK construction is able to design projects which are above the current Government requirements of ‘very good’.
When reviewing the actual credits targeted, the Open Academy, which only just managed its excellent status at design stage, has been helped hugely by the site contractor’s input, with full compliance in construction site impacts (4/4), responsibly sourced materials (3/3) and construction site waste management (4/4). These have boosted the credits that are lacking from the design.
The effect of this is to put significant pressure on the contractor to perform on-site, because the credits most vulnerable to change once on-site are those under the contractors’ responsibility, e.g. waste management. Interestingly, the evidence also suggests that both the design based day-lighting and acoustic performance credits, have been ignored on the Open Academy. This only exacerbates the difficulties faced by the contractor once on-site.
Another credit selected for comparison within the table is the provision of public transport, which the Open Academy targeted a low score of 1 out of 3. This is a trend which is repeated across the four schools, with none achieving full compliance. This is a matter of project location, as well as a test of the integrity of the local public transport system. However, this is an issue that cannot be affected through site activities, or during the design development stage.
When reviewing the scoring of responsible material sourcing, both the Open and City Academies excelled, when compared to the low scoring of control schools 1 and 2.
The reduction in CO2 emissions is a credit which could be improved. Three of the four projects scored 9/15, and the final control school achieving only 6/15. This information would indicate that significant improvements can be made in this area, especially since the Norwich Academies (Open and City) were to be constructed using a carbon zero structural frame system.
61
It is clear that design teams need to have a better understanding of the requirements of this credit, because scoring 50% of the available credits cannot continue into the future.
Narrative research
The interview process was successful, with all respondents making an attempt to answer all the questions, and most appeared to concentrate their set of answers on a familiar subject, or project experience.
This indicated that whilst they had enough knowledge on the subject matter to answer the questions to a good standard, this research process has explored the depths of their current knowledge on sustainable construction.
It was possible to identify clear motivation to become more sustainable within the individuals answers. The observation demonstrated that best practices were being used, but this may have been because of company directives and job performance appraisal, rather than through any desire to be sustainable and to reduce carbon emissions
Action Research
During the observation process the site team were under time pressure to maintain the high standards of health and safety, as well as the visual impression of the site required by their employer. They showed considerable motivation to ensure the high standards were always met.
However, this motivation appeared to be driven by those priorities relating to traditional company needs such as profitability, time pressures to ensure that key work programmes are connected together and health and safety. The daily working practices did not seem to be driven by sustainability as a key priority.
However, the waste management system in use appeared to be a good tool for recording waste, because it produced data in line with the BREEAM requirement for a waste value in metres cubed against £100,000 of constructed building, and the team had a dedicated individual on-site to manage the skips.
The installation of the dry-lined partitions was observed, and good on-site supervision made an impact on the working practices of the teams especially, when it came to clearing up and saving offcuts for the special skip. It is conceivable that that this process would be replicated on other projects. However, this practice could be driven more by the need to drive cost savings through the recycling of boards, as opposed to making the effort to become more sustainable.
At present the main contractor provides skips for all waste materials, but as a potential recommendation, if subcontractors supplied their own skips then their wastage might reduce accordingly, in order to save costs.
62
Attitudes of staff members
The attitudes observed on site were very proactive, with an overall desire to deal with potential problems before they arose. However, the team constantly felt that they were under time pressure.
There was a large workforce to be managed, and certain elements of the build were becoming quite demanding, therefore resulting in a negative impact on the programme, although company record keeping procedures were still followed diligently to the credit of the site team.
As stated in the report, company posters were displayed throughout the offices and rest-break areas giving relevant information on health and safety policies and company initiatives. This provided good evidence of a desire to continually educate the workforce.
Regular discussions were held between the site team, and the relevant subcontractors, in order to come to agreement on items of work. The site team seemed to work well together, with good communication between differing personnel because of the large open-plan office style, with ‘hot-desking’ common.
In summary, the chosen research methods (case studies, narrative research, action research); have produced a detailed range of evidence. This evidence will enable me to effectively conclude this project and to put forward recommendations. There is clearly an appetite to become more “sustainably” aware, which was highlighted within the narrative research.
However, the evidence suggests that there is a clear sense that building more sustainably is something that will happen in the future. Comments such as; “It’s the way we are going to be building in the future”, enforce this sentiment.
Personnel are mindful of company expectations to deliver against profit targets as the first and foremost priorities and therefore, the evidence suggests that on-site behaviours are most strongly influenced by corporate targets. However, from observing team discussions I gained a growing sense of many individual’s increasing their desire to become more sustainable in their working practices.
Also, there is a perhaps a realisation that they are only building what designers have planned and, as such feel that their own influence on sustainable construction is at a lower level. However, on-site teams do understand the need to deliver to BREEAM standards, as reinforced by these particular observations;
“We need a step change, we are not really excelling at it, we really need to be led by a specialist”.
“it has got to be part of the Client’s driver, because what we can do as a site team is relatively minor”.
Therefore, a growing desire to deliver sustainable construction can be noted, but personnel are perhaps expecting more to be done to support them.
63
DISCUSSION The literature review identified growing global concerns about the consequences of climate change. Research has established the underlying reasons and subsequent consequences if measures are not taken to redress climate change. Governments are the key drivers for change, and although there are debates around what are the real causes for climate change, it is clear that action must be taken.
UK Governments’ have recognised this need to develop policies to protect UK interests (e.g. from inland flooding or drought conditions affecting farming productivity). The Green Agenda has therefore, helped to raise the profile of climate change concerns.
The construction sector is at the heart of this agenda, but just how to deliver noticeable, timely and effective step changes is the real question. BREEAM is now the driver within construction (eg. schools), with the purpose of mitigating the impacts of buildings on the environment; to enable buildings to be recognised according to their environmental benefits; to provide a credible, environmental label for buildings and to stimulate demand for sustainable buildings.
Construction companies are challenged to deliver sustainable buildings, and the connection between corporate profitability has started to be understood. Reducing carbon emissions is everyone’s responsibility. However, this paper’s aims were to focus on the practical elements of construction and to prove the hypothesis that there is scope to improve on BREEAM scores.
Crucial to this research, was the need to understand the reality behind sustainable school construction and to make a connection with the need to see standards improving going forward if government targets were to be achieved. It became necessary to understand just how much on-site construction teams understood their roles, responsibilities, accountabilities and awareness of sustainable construction. The evidence drawn from the data collection methods would be used to identify workable and practical recommendations.
The data and evidence collection methods used were case studies, narrative research and action research.
Within this research project, the relevance of three data collection methods and their credibility was established.
The actual BREEAM ratings were of value as they made a direct link with the government’s green agenda. This was actual factual evidence.
Therefore, improving these scores would be a key driver for change, and the BREEAM data does have elements that are influenced by on-site practices (waste management, considerate constructor’s scheme).
It is therefore possible that the skills, attitudes and knowledge of the on-site teams could have a major impact on improving these scores. Therefore, it was important to conduct the interviews and to complete on-site observations as this is essential

64
primary qualitative data in order to provide real insight into Aim 2 and provided further evidence to evaluate Aim 1.
However, the literature review did confirm that there has been minimal research data on the practicalities of sustainable construction. The high level case for climate change has been made clear, along with industry sector expectations. But it questionable as to how a construction company actually delivers a step change, when constricted by their own profit margins.
The government have expected sectors to take charge of this themselves, but the evidence shows that sustainable construction itself has had to find its own place within on-site teams. This will deliver inconsistencies, differing awareness levels, and a mis-alignment of priorities. In other words, step change could become haphazard and dependent on individuals who might or might not take these issues more seriously.
Case Studies showed that standards could be achieved to meet the BREEAM standards.
However, it must be recognised that the planning stages will perhaps most strongly influence the scores eg. material sourcing, green power generation. Therefore, the on-site teams will implement the design rather than deliver a more sustainable best practice operation.
The narrative research was perhaps most useful in terms of critically assessing the achievement of the research aims. In conclusion, there is clear evidence that on-site teams recognise that more needs to be done to achieve sustainable school construction. The desire was evident, but was this consistent enough? People were expecting to be advised just what more they could do by their own line management, so perhaps there was a sense that “we could do more, if we knew what more we could actually do!”
CONCLUSION. These barriers were identified;
1. Construction companies generally give a lower priority to building sustainably.
2. There are other overriding on-site priorities to be delivered eg. cost reductions; meeting time and profit targets.
3. On-site time pressures can minimise educational opportunities.
4. Not enough accountability to build sustainably across all on-site trades.
5. Clients do not generally drive the sustainable agenda sufficiently at the design stage. Also, construction teams do not have sufficient input into the designs.
6. The whole sustainable arena is not given enough publicity and profile.
7. Construction inertia, in that “we have always done things this way”.

65
The data gathered has proved my hypothesis that there is scope to improve BREEAM scores. However, this drive will become a reality through an effective linking up of planning and design stages through to raising the profile to build more sustainably with on-site teams. The site teams need to be given more responsibility (as identified through Aim 2), or even have input at the design stages around the practical achievement of increasing BREEAM performances. My evidence shows that sustainability is considered as a low priority on site, but there is real scope to improve on BREEAM scores.
The evidence collated has enabled me to make best practice recommendations to facilitate increasing government BREEAM targets in the future;
1. To ensure that sustainability is given a higher profile, to include more detail for construction personnel around the BREEAM targets and how they are actually achieved. Workforces need to be properly educated on sustainability standards / methods.
2. That the practical elements of building the project sustainably should be discussed and implemented at the design stages.
3. To promote employer incentive schemes to improve on-site practices and to recognise best deliverable projects.
4. To encourage all on-site personnel from subcontractors and main contractors to adopt a collective accountability approach.
5. Further research in this area needs to be commissioned to be able to expand through to other construction projects, and not just schools.
6. More corporate publicity should be given to the highest BREEAM scores.
Overall, this research has identified real opportunities to make progress against green agenda targets. It has proven that there are differences in perception across construction disciplines. However, ultimately it is corporate profits that are the real priority, and that the sustainable agenda needs to be company driven rather than by individuals simply being made aware. Therefore, the aims have been achieved and ultimately the hypothesis has been proven: current building practices are inadequate to meet the Government’s green agenda for sustainable school construction.
REFERENCES. BRE Global (2008). BREEAM Education 2008 Technical Manual. Issue 1.0. BRE
Environmental & Sustainability Standard [Online]. Last accessed on 5th April at: http://www.breeam.org/filelibrary/Non%20Domestic%20Manuals/BREEAM_Education_2008.pdf
BRYMAN, A and CRAMER, D (1996). Quantitative Data Analysis with Minitab: A guide for social scientists. (2005 e library version). Routledge, London.

66
BUNN, Roderic (2012). Energy rating – it’s not as easy as ABC. Construction Manager,1(March),12.
CARBON NEUTRAL (2012). Climate change summary. Last accessed 26th. January 2012 at: http://www.carbonneutral.com/knowledge-centre/climate-change-summary/
CHRISTIAN (2011). BBC Trust on climate: Let’s debate climate policy but reflect the “agreed scientific fact base”. [Online]. Article from the Carbon Brief. Last accessed 8th January 2012 at: http://www.carbonbrief.org/blog/2011/07/bbc-trust-climate
COMMITTEE ON CLIMATE CHANGE (2008). Climate Change Act. Last accessed 5th January 2012 at: http://www.theccc.org.uk/about-the-ccc/climate-change-act
COMMITTEE ON CLIMATE CHANGE (2010) .Reducing emissions through the 2020s, the Fourth Carbon Budget. Last accessed 10th February 2012 at: http://downloads.theccc.org.uk.s3.amazonaws.com/4th%20Budget/4th-Budget_Chapter5.pdf
CONSIDERATE CONSTRUCTORS (2012). Considerate Constructors Scheme, An Overview. [Online]. Article from the Considerate Constructors Association. Last accessed on 2nd March 2012 at: http://www.ccscheme.org.uk/images/stories/ccs-ltd-section/downloads/overview.pdf
COULTER, Michael (2007). Heartland Institute. IPCC Reduces Global Warming Projections. Last accessed 20th February 2012 at: http://news.heartland.org/newspaper-article/2007/04/01/ipcc-reduces-global-warming-projections
DEPARTMENT FOR COMMUNITIES AND LOCAL GOVERNMENT (2007). Definition of Zero Carbon Homes and Non-domestic Buildings. Last accessed 25th March 2012 at: http://www.communities.gov.uk/documents/planningandbuilding/pdf/1101177.pdf
DEPARTMENT FOR EDUCATION (2010). Road to Zero Carbon, Final report of the Zero Carbon Task Force. Last accessed 25th February 2012 at: https://www.education.gov.uk/publications/eOrderingDownload/00111-2010DOM-EN.pdf
DEPARTMENT FOR EDUCATION (2012). Free schools, a definition. Last accessed on 25th March 2012 at: http://www.education.gov.uk/vocabularies/educationtermsandtags/7123
DEPARTMENT FOR ENERGY AND CLIMATE CHANGE (2011a). Energy Statistics [Online]. Last accessed 1st February 2012 at: http://www.decc.gov.uk/assets/decc/11/stats/publications/energy-trends/2077-pn11-056.pdf
DEPARTMENT FOR ENERGY AND CLIMATE CHANGE (2011b). UK energy in brief [Online]. Last accessed 5th March 2012 at: http://www.decc.gov.uk/assets/decc/11/stats/publications/energy-in-brief/2286-uk-energy-in-brief-2011.pdf
DEPARTMENT FOR ENERGY AND CLIMATE CHANGE (2012). £13m ‘zero carbon school contract’. Last accessed 28th March 2012 at: http://chp.decc.gov.uk/cms/13m-zero-carbon-school-contract/
67
FARRELL, Peter (2011). Writing a Built Environment Dissertation – Practical guidance and examples. Oxford, Blackwell.
GOVERNMENT LEGISLATION (2008). Climate Change Act 2008. Last accessed 20th March 2012 at: http://www.legislation.gov.uk/ukpga/2008/27/pdfs/ukpga_20080027_en.pdf
HAYMAN, Allister (2012). Standards are slipping. Building Magazine, 1 (9) 20-23.
HOUSE OF COMMONS EDUCATION AND SKILLS COMMITTEE (2007). Sustainable Schools: Are we building schools for the future? Seventh Report of Session 2006-07. Last accessed 10th January 2012 at: http://www.publications.parliament.uk/pa/cm200607/cmselect/cmeduski/1077/1077.pdf
JOWIT, Juliette (2008). World is facing a natural resources crisis worse than financial crunch. [Online]. Article from the Guardian. Last accessed 10th March 2012 at: http://www.guardian.co.uk/environment/2008/oct/29/climatechange-endangeredhabitats
KIER (2011) City Academy Norwich, Norfolk. Kier Group Plc.
LONDON EVENING STANDARD (2007). Global warming? It's natural, say experts. Last accessed 10th March 2012 at: http://www.thisislondon.co.uk/news/article-23412130-global-warming-its-natural-say-experts.d
MARLEY, David (2008). Zero carbon target for schools ‘bloody difficult’ to achieve. [Online]. Article from TES connect. Last accessed 15th March 2012 at: http://www.tes.co.uk/article.aspx?storycode=6002649
PEARSON, Andy (2012). Drivers of Eco Design. The Future of Sustainability, 1 (1), 26-27.
PEARSON, Andy (2012). Space Age Solutions. The Future of Sustainability, 1 (1), 17-20.
OFFICE FOR NATIONAL STATISTICS (2009). National Projections. Last accessed 12th March 2012 at: http://www.statistics.gov.uk/cci/nugget.asp?id=1352
RICHARDSON, Sarah (2011). Schools face £22bn maintenance work backlog. Building Magazine. 28, 9.
ROGER, Nicky (2012). Scrapping BREEAM for Schools is a mistake, says Institute. Construction Manager. 1 (March), 36.
SHANKLEMAN, Jessica (2012). Is the writing on the wall for green school buildings? [Online]. Article from Business Green. Last accessed on 5th March 2012 at: http://www.businessgreen.com/bg/news/2141312/writing-wall-green-school-buildings
SOLOMAN, S et al. (2007). Summary for policymakers. Climate change 2007: The physical science basis: Contribution of working group 1 to the fourth assessment report of the intergovernmental panel on climate change. [Online]. Article from the Intergovernmental Panel on Climate Change. Last accessed 5th February 2012 at: http://www.ipcc.ch/pdf/assessment-report/ar4/wg1/ar4-wg1-spm.pdf
SPARKES, Matthew (2011). Research Dissertation, Interim Report. Unpublished document: Sheffield Hallam University

68
SPARKES, Matthew (2012). Research Dissertation. Unpublished document: Sheffield Hallam University
TALBOT, Darren and BRETT, Laurence (2011). Cost model – Low Cost Academies. Building Magazine. 29, 60.
TARGET ZERO (2010). Report V1.0. Guidance on the design and construction of sustainable, low carbon school buildings. Last accessed 18th February 2012 at: http://www.cyrilsweett.com/viewfile.cfm?id=152&h=B2CC39C4651FD324C460E1580AA1314D5BB8F49CB5E28A8AEF8654B0B8766CA9
US ENVIRONMENTAL PROTECTION AGENCY (2010). Climate Change Indicators in United States. Last accessed 8th March 2012 at: http://www.epa.gov/climatechange/indicators/pdfs/ClimateIndicators_full.pdf
VAUGHAN, Adam (2012). Met Office: Artic sea-ice loss linked to colder, drier UK winters [Online]. Article from the Guardian. Last accessed 5th April 2012 at: http://www.guardian.co.uk/environment/2012/mar/14/met-office-arctic-sea-ice-loss-winter
VIDAL, John (2011). Environment world review of the year ‘2011 rewrote the record books’ [Online]. Article from the Guardian. Last accessed 5th April 2012 at: http://www.guardian.co.uk/environment/2011/dec/22/environment-2011-year-review?INTCMP=ILCNETTXT3487
WISKER, Gina (2011). The Postgraduate Research Handbook. Chapters 13, 14, 15. Basingstoke, Macmillan.
WORLD COMMISSION ON ENVIRONMENT AND DEVELOPMEMT (Brundtland Commission) (2004). Sustainable development – concept and action. Last accessed 10th March 2012 at: http://www.unece.org/oes/nutshell/2004-2005/focus_sustainable_development.htm
21st CENTURY SCHOOLS (2009) Sustainable Design of Schools. Last accessed 2nd March 2012 at: http://www.sustainableschoolswales.org/sustainable_design_options/buildings/index.ph

69
AN ASSESSMENT OF THE IMPACT OF INTRODUCIN G A WORK BASED DEVELOPMENT GUIDE
Matthew Kemshed5 & Phil Askham
Matthew Kemshed graduated from Sheffield Hallam University with a First Class honours degree in Commercial and Construction Management. Matthew currently works in Kier Construction as a Quantity Surveyor.
Phil Askham has been involved in surveying education at Sheffield Hallam University for over 25 years as a Principal Lecturer in the Department of the Built Environment. He has valuation and property management experience in central and local government and private practice surveying. He is joint author of Principles of Valuation and spent 10 years editing Mainly for Students the popular fortnightly column in the Estates Gazette. He has written and researched widely on general practice matters and also learning and teaching.
ABSTRACT
This small scale research project explored the training and development needs of the professional workforce in a large construction company. In particular it examined the impact of introducing a Work Based Development Guide (WBDG) by undertaking semi structured interviews with staff to explore different aspects of their experience of training and development in areas of the work place which have adopted the guide as compared to those which have not. A focussed review of the literature on work based learning provides a background to the study and explores what is understood by the term and goes on to examine what motivates people to undertake work based learning as well as the barriers that make it a potentially challenging undertaking. A single focus group undertaken with senior managers within the company informed the structure of the one to one employee interviews. The main findings showed a clear distinction between the experiences of staff. Those with the guide received more feedback on progress and felt that communication on staff development was better and that the company operated its training and development programme with greater transparency. All staff however felt they could be better informed about clarity of the roles of others in the organisation. The paper concludes with some observations on the

70
limitations of the study as well as recommendations for taking the Work Based Development Guide forward.
Key Words: Work Based Learning, Work Based Development, Continuing Professional Development, Training and Development.
INTRODUCTION This paper explores the implementation of a Work Based Development Guide (WBDG) to support staff development for new trainees and apprentices across the business sectors within Kier (East Midlands).
Kier (East Midlands) generated an estimated turnover of £90 million during 2010/2011 and has over one-hundred employees. There are two regional offices, one in Rushden, Northamptonshire and one in Nottingham. The company is involved in varied construction projects across the Midlands region of the UK including new-builds and refurbishments with contract sizes up to £35million.
The paper explores the views of employees on existing training schemes within the organisation, examining different parts of the organisation with different frameworks currently in place to compare practise across the different business divisions. The ultimate aim of the study was to produce recommendations to senior management on the development of a Work Based Development Guide for employees working on construction sites.
The process of disseminating the concept of a series of Work Based Development Guides for each section of the business was initially proposed at a meeting of the Directors of all four divisions of the company who were all supportive of the idea in principle. It was clear at this meeting that many departmental heads were actually unaware of the existence of the guide in the QS department and a development guide focus group was set up to provide a form for how the WBDG could be set up across the other departments.
Through initial analysis of the company structure it was possible to identify that in the four departments; Quantity Surveying (QS), Estimating, Design and Build and Contracts only one department (QS) had its own Work Based Development Guide (WBDG). In the other three departments there appeared to be an absence of guidance to support the development of trainees. The WBDG in place in QS has been implemented in the last ten years, providing structured learning for trainees and graduates aspiring to qualify as construction professionals.
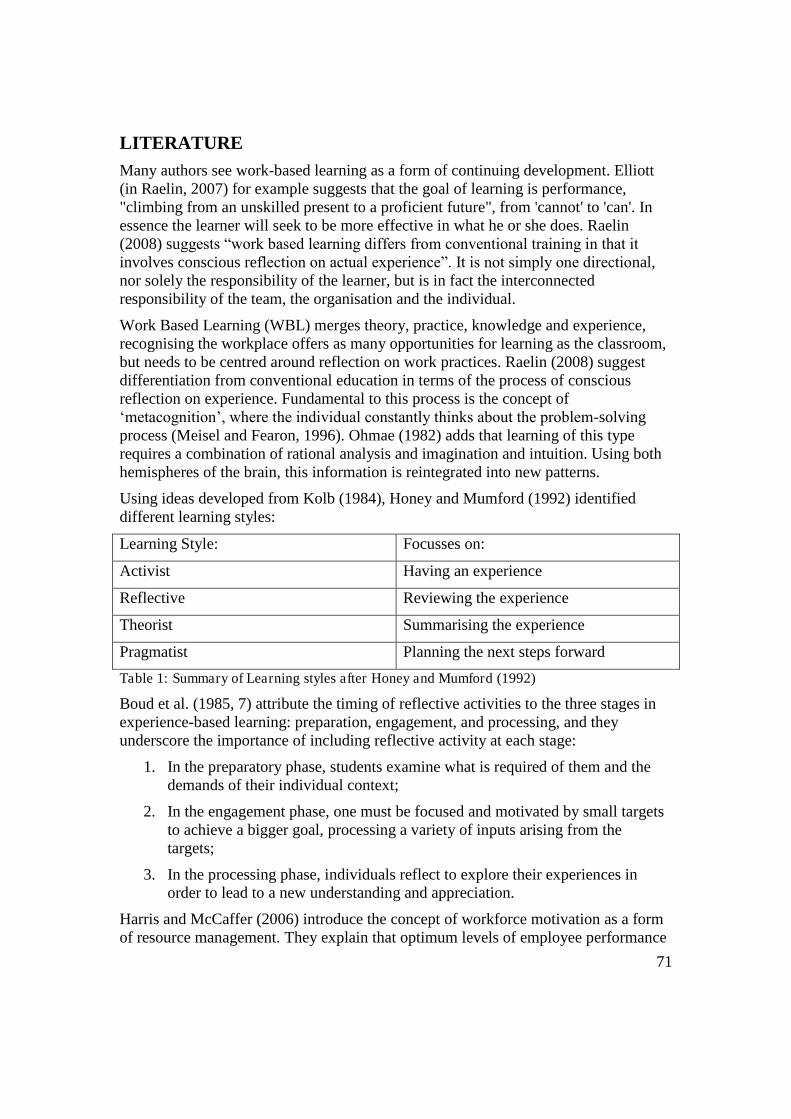
71
LITERATURE Many authors see work-based learning as a form of continuing development. Elliott (in Raelin, 2007) for example suggests that the goal of learning is performance, "climbing from an unskilled present to a proficient future", from 'cannot' to 'can'. In essence the learner will seek to be more effective in what he or she does. Raelin (2008) suggests “work based learning differs from conventional training in that it involves conscious reflection on actual experience”. It is not simply one directional, nor solely the responsibility of the learner, but is in fact the interconnected responsibility of the team, the organisation and the individual.
Work Based Learning (WBL) merges theory, practice, knowledge and experience, recognising the workplace offers as many opportunities for learning as the classroom, but needs to be centred around reflection on work practices. Raelin (2008) suggest differentiation from conventional education in terms of the process of conscious reflection on experience. Fundamental to this process is the concept of ‘metacognition’, where the individual constantly thinks about the problem-solving process (Meisel and Fearon, 1996). Ohmae (1982) adds that learning of this type requires a combination of rational analysis and imagination and intuition. Using both hemispheres of the brain, this information is reintegrated into new patterns.
Using ideas developed from Kolb (1984), Honey and Mumford (1992) identified different learning styles:
Learning Style: Focusses on:
Activist Having an experience
Reflective Reviewing the experience
Theorist Summarising the experience
Pragmatist Planning the next steps forward
Table 1: Summary of Learning styles after Honey and Mumford (1992)
Boud et al. (1985, 7) attribute the timing of reflective activities to the three stages in experience-based learning: preparation, engagement, and processing, and they underscore the importance of including reflective activity at each stage:
1. In the preparatory phase, students examine what is required of them and the demands of their individual context;
2. In the engagement phase, one must be focused and motivated by small targets to achieve a bigger goal, processing a variety of inputs arising from the targets;
3. In the processing phase, individuals reflect to explore their experiences in order to lead to a new understanding and appreciation.
Harris and McCaffer (2006) introduce the concept of workforce motivation as a form of resource management. They explain that optimum levels of employee performance
72
and production output depend on numerous inter-related factors such as the worker’s personality, project in question, working conditions, which can singularly, or cumulatively influence motivation. They use several motivational theories to support their work including Maslow’s Hierarchy of needs (Maslow, 1987), McGregor’s Theory ‘Y’, the Process Theory (McGregor, 1985) and finally Herzberg’s motivation-hygiene theory (Herzberg 1975). Incentives for motivation can be both financial and non-financial.
There is a substantial literature base on barriers to work based learning.
Cross (1981) makes the distinction between situational, institutional and dispositional barriers. Brockett and Hiestra (1991: 166) define situational barriers as those arising from one’s life situation. These include, for example, lack of time resulting from job and home responsibilities. Institutional barriers are defined as practices and procedures that exclude or discourage adult participation within an organisational setting and, finally, dispositional barriers are those related to attitudes and perceptions about oneself as a learner. The identification of these barriers represents a first step towards understanding their impact (Askham, 2004).
Importantly, in the context of work based learning, Askham quotes Karakowsky and McBey (1999:194) who see the worker’s organisation as both a facilitator and an inhibitor of adult learning. Others go as far as to suggest that the individual and the organisation represent opposing interests. In essence, the needs of the individual might be prevented from transcending those of the employer, if that employer perceives that its interests are not served by encouraging the challenging of 'the hierarchical, top-down authority models…upon which their own authority depends' (Cornford, 2000:83).
This study of Kier (East Midlands) seeks to outline an alternative position by focussing on a specific tool (the Work Based Learning Guide) to explore how a more transparent approach to employee development might offer more holistic benefits for both the organisation and the individual employee. This Action Research objective is notably compatible with the following extract from Kier's mission statement:
"Our mission is to provide an unsurpassed service as the most highly respected group in our market place… through development of and respect for our people, we aim to foster a culture to drive continuous improvement…"
Kier Mission Statement (2005) Kier (Internal Website)
METHODOLOGY This case study was concerned with examining work based learning within different practise areas of the organisation. The strategy for enquiry was essentially an action research approach. According to Zuber-Skerritt (1996b: 83) ‘the aims of any action research project are to bring about practical improvement, innovation, change or development of social practice, and the practitioners’ better understanding of their practices’. Hopkins (1985: 32) and Ebbutt (1985: 156) suggest that the combination of action and research renders that action as a form of disciplined inquiry, in which a

73
personal attempt is made to understand, improve and reform practice. Kemmis and McTaggart (1992: 10) argue that ‘to do action research is to plan, act, observe and reflect more carefully, more systematically, and more rigorously that one usually does in everyday life’.
The conclusions will identify the outcomes of this action research process including comments on a formal report to senior management.
It was deemed important to compare the views of senior managers with those of less senior employees and trainees in order to reduce potential bias and consider a range of perspectives. The principle research instruments included a single focus group with senior managers followed by one to one semi structured interviews with employees.
A number of heads of department from two regional offices were involved in the focus group. The focus group was used to explore general themes and generate questions for the structured interviews. This was followed by eight individual interviews with both site based and office based staff. The interview transcripts were coded and this process identified a series of key themes which are shown in figure 1. Using these themes the interviews were recoded and these findings were then taken back to the interviewees for respondent validation.
Themes
Opportunities Time
Continual Professional
Development (CPD)
Support structure in
the businessCommunication
Future investment
Feedback
Job roles and
responsibilities
Figure 1: Interview Themes Generated from Focus Group
The WBDG that exists is essentially a document tracing the technical development of each individual. This document should be or is reviewed periodically to assess progress and determine what further support is needed. It provides clear personal development objectives that can also be reviewed periodically and the guide can be used to assess the readiness of an individual candidate to progress through promotion within the company.
To collect data the initial focus group was recorded in digital audio format. This lasted one hour and involved seven people including heads of department from Design Management, Accounting, Planning, Quantity Surveying, Estimating and Construction Site Management/Engineering. The focus group meeting helped to generate and clarify questions to be used in subsequent interviews.

74
Interviews were to be carried out with new starters including those working in departments with and without an existing Work Based Development Guide in place.
DISCUSSION Initial coding identified the following key themes emerging from the eight interviews as; feedback, communication, openness, time, opportunities, job roles and responsibilities, job rotation and future investment. Recoding the interviews showed how these themes were closely connected and the initial themes were distilled into three overriding categories:
Feedback, Communication and Openness;
Opportunity and Time;
Job Roles and Responsibilities, Rotation and Progression.
Feedback, Communication and Openness
Employees need feedback and recognition to be able to keep abreast of progress against rapidly changing business objectives. This is about assessing performance of individuals and about motivation. Interviews revealed a distinction between staff on the commercial side of the business (with WBDG) where all staff were positive about feedback as opposed to the construction side (no WBDG) who felt they were not well supported by feedback.
All staff received reviews through a process of yearly Personal Planning Reviews (PPR) but only those on the commercial side were positive about the benefits because WBDG meetings were more regular and provided feedback.
All interviewees said that after conducting the PPR or WBDG they wanted direct feedback from their line manager rather than the person that conducted the review itself. They stressed the importance of receiving constructive criticism as well as the positives from the reviews. They felt that this would show support and it was important that they could see that comments in the reviews were acted on and not just forgotten.
Staff on the commercial side who had the benefit of the WBDG identified a higher frequency of reviews (for example four times a year) compared to those who just experienced the Personal Planning Review, annually, with little or no feedback. Commercial staff were able to identify specific benefits of working on the WBDG alongside having the PPR, on the other hand those staff that just sat the PPR suggested that the process did not really benefit them at all.
Time and Opportunity
Time management is identified in the literature as a major problem faced by adult learners (Askham, 2004).
75
The interviews have re-affirmed this theme. Participants highlighted the need to identify time and enable attendance at internal and external training courses and in doing so gain a stronger sense of belonging in the business.
Re-coding of the interview transcripts revealed a direct relationship between the themes of time and opportunities. Three of the commercial side interviewees commented on the desire to be given the opportunity to prove that they can do the job as a Quantity Surveyor by being given a project to run from conception to completion. The remaining interviewees, just starting out in the industry, also commented that the time they are given to study during work time helps relieve pressure from their day to day duties.
Job Roles and Responsibilities, Rotation and Progression
Every interviewee commented on a lack of understanding as to what each individual on the site team does and, to an extent, what each department does, for example
“when you are on site in a role there, you have no idea of office staff roles and responsibilities and what part they play in making a project successful.” (Participant statement, November 2011)
Job rotation was mentioned by a number of interviewees as a response to assist individuals to develop their understanding of other parts of the business.
There was also some vagueness about progression of roles and it was clear from the interviews with construction side staff that they could not always see the next step for them within the business, whereas all commercial interviewees could positively say they could.
The commercial side of the responses were unified in the view that they would like to be offered more site experience at the beginning of their employment to assist in improving themselves in the long term and also benefitting the business. This is a key theme which helped to shape the conclusions to this work.
CONCLUSIONS Clearly one of the limitations of the research is the small sample of interviewees. Whilst this cannot be taken as representative of the whole organisation, the research does provide some interesting findings which offer the business an indication of where to go next, for example, a strong argument that a Work Based Development Guide in the construction side of the business would both provide an incentivising tool to measure progress of new staff within the business, and also ultimately support the potential long term profitability of the business.
Key Findings from the Focus Group (senior management)
1. The WBDG could be used as an interview tool for the 2nd stage interview when bringing on new staff by utilising key job role duties to review position of employment (and salary) and to judge previous working experience.

76
2. Having a WBDG structure for all parts of the business will attract new starters by offering a form of continuous review.
3. The WBDG could be utilised as a progression tool i.e. when an employee achieves certain threshold scores, it may indicate to line managers that the individual has achieved their interim targets and should be actively considered for some form of progression, possibly helping to justify transparent promotions.
4. By having an independent mentor reviewing progress on a quarterly basis it offers support to the individual and can create new inter-department business relationships within the company. This is supported by the focus group which concluded that having a mentor from outside the day to day role would be most beneficial.
Key findings from the interviews (employees)
Feedback, Communication and Openness Construction side staff stated that they often didn’t know the next step in the promotional ladder and felt that the lack of interim reviews on site with management was a key factor in this. This issue was seen as demotivating.
Frequent feedback and recognition is needed to uphold motivation and keep employee efforts on track with rapidly changing business objectives.
Opportunity and Time Giving employees the time to study when at University during work time and also offering external and internal training courses during work time will give employees a sense of belonging to the business. This may increase the profitability of the business through heightened workforce motivation.
With reference to the yearly Personal Planning Review (PPR process) interviewees generally wanted improved feedback from line managers following the review, to give the individual a feeling of importance and also that training and other needs should be proactively generated from the review process, for example external courses.
Job Roles Responsibilities and Rotation A form of job rotation was suggested to increase the people’s awareness of other job roles and the company operating structure. This will open communication channels between different departments of the company.
All respondents believe that the implementation of a WBDG structure in the construction side would benefit the business.
Moving Forward:
The findings and conclusions of this action research have been taken forward within
the company. The Managing Director has spent time discussing the role out and

77
implementation of a Work Based Development Guide into other sections of the
business.
REFERENCES ASKHAM. P (2004), The Feeling's Mutual: Excitement, dread and trust in adult learning and
teaching, unpublished ed dissertation, Sheffield Hallam University.
BOUD, D., R. KEOGH and D. WALKER (Eds.) (1985), Reflection: Turning Experience into Learning. London: Kogan Page.
BRPCKETT, R and HIESTRA, R (1991), Self-direction in adult learning: perspectives on theory research and practice, Routledge, London
BURNARD, P. (1991), A method of analysing interview transcripts in qualitative research, Nurse Education Today [11, 461 – 466].
CORNFORD, I (2000), Impediments to Effective Workplace Learning, Working Knowledge, Conference Proceedings, University of Technology Sydney, 10 -13 December, 79-85
CROSS, K (1981), Adults as Learners, Jossey Bass, San Francisco
DEWEY, J. (1933), How We Think: A Restatement of the Relation of Reflective Thinking to the Educative Process. Lexington, MA: Heath.
EBBUTT, D. (1985) EDUCATIONAL ACTION RESEARCH: SOME GENERAL CONCERNS AND SPECIFIC QUIBBLES, IN: BURGESS, R. (ED.) ISSUES IN EDUCATIONAL RESEARCH: QUALITATIVE METHODS. LEWES, FALMER.
HARRIS, F. and MCCAFFER, R. with EDUM-FOTWe, F. (2006) Modern Construction Management (6th edn). Blackwell, Oxford.
HERZBERG, F. (1975) Work and the Nature of Man. Crosby Lockwood, London
HONEY. P and MUMFORD A (1992), Manual of Learning Styles (3rd ed.). Maidenhead, U.K.: Peter Honey Publications, 1992.
HOPKINS, D. (1985), A Teacher’s Guide to Classroom Research, Milton Keynes: Open University Press.
KARAKOWSKY, L and MCBEY, K (1999), The lessons of work: toward an understanding of the implications of the workplace for adult learning and development, Journal of Workplace Learning: Employee Counselling Today, 11 (6), 192-201
KEMMIS, S. and MCTAGGART, R. (eds) (1992), The action research planner (third edition), Geelong, Victoria, Australia: Deakin University Press.
KIER (2005) Kier Mission Statement (Internal Website)
KOLB. D (1984), Experiential Learning as the Source of Learning and Development. Upper Saddle River, NJ: Prentice Hall, 1984.
MASLOW, A.H. (1987) Motivation and Personality. Longman, New York
MCGREGOR, D. (1985) The Human Side of Enterprise. McGraw-Hill Education, New York

78
MEISEL. S and FEARON. D (1996), “Leading Learning”, p180-209 in S.A. Cavaleri and D.S. Fearon (eds.), Managing of Organisations That Learn. Cambridge, MA: Blackwell, 1996.
OHMAE. K (1982), The Mind of the Strategist. New York: McGraw-Hill, 1982.
RAELIN. J .A. (2008), Work-based learning: bridging knowledge and action in the workplace New and revised ed., Published by Jossey-Bass: 2008.
ZUBER-SKERRITT, O. (1996b), Emancipatory action research for organisational change and management development. In O. Zuber-Skerritt (ed.) New Directions in Action Research. London: Flamer, 83-105.