an assessment of the household food wastage in a ... · moreover, analysis of the data confirmed...
TRANSCRIPT

AN ASSESSMENT OF THE HOUSEHOLD FOOD WASTAGE IN A DEVELOPING COUNTRY: A CASE STUDY OF FIVE AREAS IN THE CITY OF TSHWANE METROPOLITAN MUNICIPALITY, GAUTENG PROVINCE, SOUTH
AFRICA
by
FHUMULANI RUTH RAMUKHWATHO
Submitted in accordance with the requirements for
the degree of
MASTER OF SCIENCE
In the subject
ENVIRONMENTAL MANAGEMENT
at the
UNIVERSITY OF SOUTH AFRICA
SUPERVISOR: MRS ROELIEN DU PLESSIS
CO-SUPERVISOR: PROF SUZAN OELOFSE
FEBRUARY 2016

i
DECLARATION
Student No.: 49028464
I, Ramukhwatho Fhumulani Ruth, hereby declare that this dissertation for the Master’s
Degree in Environmental Management with specialisation in food waste, at the University
of South Africa, is my own original work and has not been previously submitted to any
other university. I also declare that all the sources I have used or quoted have been
indicated and acknowledged by means of a complete reference.
Signed:…………………………………
(Ms Fhumulani Ruth Ramukhwatho)
Date: ……………………………………..
ii
DEDICATION
I warmly dedicate this study to my son Tshilidzi and to the poor black child who thinks
that poverty defeats our dreams. I encourage them to persevere and not give up on their
dreams because the future belongs to those who prepare for it today. I wish to gratefully
thank my parents; I will never forget you. To God, Almighty ‘Consuming Fire’, I thank
you for your grace upon me.
iii
ACKNOWLEDGEMENTS
I wish to acknowledge and extend my sincere gratitude to God Almighty, for the wisdom
and perseverance that He has been bestowed upon me during this research project.
I would like to express my gratitude to my supervisor Ms R. du Plessis for guiding the
work and providing valuable input throughout. Her comments have increased the value of
this research work.
I also want to express my gratitude to my co-supervisor Prof Suzan Oelofse for her wide
knowledge and logical thinking. This research work would hardly have been possible
without her encouragement and personal guidance.
This study would not have been possible if the participants had not been willing to take
part. I wish to acknowledge the 210 households from the CTMM, who participated and
provided the data which was used in this study.
To my parents Wilson and Violet Ramukhwatho, I thank you for your endless prayers,
provision and unconditional love. I am blessed to be your daughter.
My young sister Tshimangadzo Ramukhwatho, I thank you for assisting me with field
data, travelling with me from house to house while I was collecting data for this study.
Thank you for your support, I love you. My success is your success.
Renee Koen, thank you for analysing the data. I appreciate your time and your willingness
to help at all times.
To the Unisa Master’s and Doctoral Support Programme, thank you for the funding.
To Owen Molokwe, thank you for your assistance and for understanding my busy schedule
during the course of this study.

iv
ABSTRACT
Food waste has been proclaimed to be the key issue of concern that has drawn the attention
of national and international scientific communities. This is due to changes in food
systems and global situations. The issue of food waste is important because a large amount
of food is being wasted during the production and distribution of food. One-third of food
produced globally is wasted or lost from farm to fork.
The primary aim of this study was to evaluate and quantify the factors that contribute to
generation of household food waste. The evaluation was done using face-to-face
interviews based on a structured questionnaire and the actual weighing of households’
food wasted was quantified using a weighing kitchen scale. A total of 210 participants
were interviewed. Food waste samples were collected from five selected study areas of the
City of Tshwane Metropolitan Municipality (CTMM): Atteridgeville Ext 6, 16 and 17,
Lyttelton, Montana Park, Olievenhoutbosch Ext 36 and Silver Lakes Golf Estate, in
Gauteng province, South Africa. The acquired data was captured into Microsoft Excel, and
analysed. The chi-square statistical test was done using SAS statistical software.
Out of 210 interviewed participants, 55% of the households had a monthly income of R10
000+ and 45% had a monthly income of less than R10 000. A total of 59% of respondents
agreed that they wasted food, while 41% thought they did not waste food at all. The results
also show that 35% of households included in the survey in selected areas of the CTMM
threw away pap (referred as maize porridge), 26% wasted rice, 25% bread and 14% fruit
and vegetables.
Households wasted an average total of 6 kg per week per household. This was attributed to
over preparation of porridge and rice; buying too much food; falling for special offers;
poor storage; food residue, and fruit and vegetables going off. Households with a monthly
income of R500 - R5 000 wasted more food than households with an income of more than
R5 000. As such, it can be concluded that income has an impact on the amount of food
wasted within the selected areas of CTMM. Moreover, analysis of the data confirmed that
there is a statistically significant relationship between income level and food waste. The
statistical chi-square test was applied and a probability value (p-value) of < 0.0001 was
obtained, indicating that the difference between income categories was more than just a
v
random pattern. (Note that any p-value of < 0.05 is considered to be statistically
significant, i.e. an indication of an underlying consistent, non-random pattern.)
Key terms
Food waste drivers; Household income; Assessment

vi
ACRONYMS AND ABBREVIATIONS
BMR Bureau of Market Research
BOGOF buy one get one free
CO2 carbon dioxide
CTMM City of Tshwane Metropolitan Municipality
DEA Department of Environmental Affairs
DEFRA Department for Environment, Food and Rural Affairs
DKK Danish Krone
EC European Commission
EU European Union
FAO Food and Agriculture Organization of the United Nations
FUSIONS Food Use for Social Innovation by Optimizing Waste
Prevention Strategies
GDP gross domestic product
GHG greenhouse gas
IPCC Intergovernmental Panel on Climate Change
kg kilogram
kJ kilojoule
NORSTAT Norway Statistic
NSW New South Wales
PPE personal protective equipment
RSA Republic of South Africa

vii
SACN South African Cities Network
SEPA Swedish Environmental Protection Agency
TMA Tshwane Metropolitan Area
UK United Kingdom
UN United Nations
UNEP United Nations Environment Programme
USA United States of America
USEPA United States Environmental Protection Agency
WRAP Waste and Resources Action Programme
viii
CONTENTS
DECLARATION ............................................................................................................... I
DEDICATION ................................................................................................................. II
ACKNOWLEDGEMENTS ................................................................................................ III
ABSTRACT ................................................................................................................... IV
ACRONYMS AND ABBREVIATIONS ............................................................................... VI
CHAPTER 1: INTRODUCTION AND BACKGROUND ....................................................... 1
1.1 Background of study ................................................................................................................................... 1
1.2 Problem statement ...................................................................................................................................... 2
1.3 Motivation for the study ............................................................................................................................ 3
1.4 Research questions ..................................................................................................................................... 4
1.5 Aim and objectives of study ..................................................................................................................... 4
1.5.1 Aim .................................................................................................................................................................... 4
1.5.2 Objectives of the study ............................................................................................................................... 4
1.6 Thesis layout .................................................................................................................................................. 5
CHAPTER 2: LITERATURE REVIEW .............................................................................. 6
2.1 Introduction ................................................................................................................................................... 6
2.2 Defining Food waste ................................................................................................................................... 6
2.3 Reasons for food wastage ......................................................................................................................... 8
2.3.1 Household behaviour ............................................................................................................................... 10
2.3.2 The influence of demographic characteristics ................................................................................ 10
2.3.2.1 Gender ...................................................................................................................................................... 11
2.3.2.2 Age .............................................................................................................................................................. 11
2.3.2.3 Highest qualification ........................................................................................................................... 12
2.3.2.4 Household size ....................................................................................................................................... 12
2.3.2.5 Income categories ................................................................................................................................ 13

ix
2.4 Disposal of food waste ............................................................................................................................. 14
2.5 Socio-economic and environmental impacts of food waste ....................................................... 14
2.6 Food waste globally ................................................................................................................................... 16
2.6.1 Global estimates of food waste ............................................................................................................. 16
2.6.2 Global perspectives on food waste ...................................................................................................... 17
2.7 Food waste in different countries ........................................................................................................ 21
2.7.1 Household food waste in Sweden ........................................................................................................ 21
2.7.2 Household food waste in Finland ......................................................................................................... 22
2.7.3 Household food waste in Norway ........................................................................................................ 23
2.7.4 Household food waste in the United Kingdom (UK) ..................................................................... 24
2.7.5 Household food waste in Denmark ..................................................................................................... 25
2.7.6 Household food waste in South Africa ............................................................................................... 25
2.8 Household awareness on food waste ................................................................................................. 26
2.9 Conclusion .................................................................................................................................................... 29
CHAPTER 3: RESEARCH DESIGN AND METHODOLOGY ................................................. 30
3.1 Introduction ................................................................................................................................................. 30
3.2 Sampling ........................................................................................................................................................ 30
3.3 Description and demography of the study area ............................................................................. 30
3.3.1 Description of the study area ................................................................................................................ 31
3.3.2 Household income ..................................................................................................................................... 32
3.3.3 Demography ................................................................................................................................................ 34
3.4 Research design .......................................................................................................................................... 36
3.5 Research methodology ............................................................................................................................ 36
3.5.1 Structured questionnaire data collection ......................................................................................... 37
3.5.2 Food waste data collection ..................................................................................................................... 38
3.5.3 Personal protective equipment during sampling .......................................................................... 40
3.6 Data analysis ................................................................................................................................................ 40
3.7 Quality control ............................................................................................................................................ 41

x
3.7.1 Data entry ..................................................................................................................................................... 41
3.7.2 Data cleaning ............................................................................................................................................... 41
3.7.3 Errors ............................................................................................................................................................. 41
3.7.4 Pre-testing .................................................................................................................................................... 42
3.7.5 Reliability ..................................................................................................................................................... 42
3.8 Ethical considerations, consent form and questionnaire pilot testing .................................. 42
3.9 Limitations ................................................................................................................................................... 43
3.10 Conclusion .................................................................................................................................................... 43
CHAPTER 4: INTERPRETATION AND DISCUSSION OF RESULTS .................................. 45
4.1 Introduction ................................................................................................................................................. 45
4.2 Demographics ............................................................................................................................................. 45
4.2.1 Gender of respondents responsible for food ................................................................................... 45
4.2.2 Age range ...................................................................................................................................................... 46
4.2.3 Highest qualification ................................................................................................................................ 47
4.2.4 Household size ............................................................................................................................................ 49
4.2.5 Monthly income .......................................................................................................................................... 50
4.3 Types of food wasted ................................................................................................................................ 51
4.3.1 Type of food wastage by geographical area ..................................................................................... 51
4.3.2 Type of food wasted by age range ........................................................................................................ 52
4.3.3 Type of food wasted by highest qualification .................................................................................. 53
4.3.4 Type of food wasted by household size ............................................................................................. 54
4.3.5 Type of food wasted by monthly income .......................................................................................... 55
4.4 Results of the reasons for food wastage ............................................................................................ 56
4.4.1 Results of the reasons for food wastage by geographical area ................................................. 56
4.4.2 Results of the reasons for food wastage by age range .................................................................. 58
4.4.3 Results of the reasons for food wastage by highest qualification ............................................ 59
4.4.4 Results of the reasons for food wastage by household size ....................................................... 61
4.4.5 Results of the reasons for food wastage by monthly income .................................................... 62

xi
4.5 Amount of food wasted per week in kilograms .............................................................................. 64
4.5.1 Average household food wastage by geographical area ............................................................. 64
4.5.2 Average household food wastage by age range .............................................................................. 65
4.5.3 Average household food wastage by highest qualification level ............................................. 67
4.5.4 Average household food wastage by household size ............................................................................ 68
4.5.5 Average household food wastage by monthly income category .............................................. 70
4.6 Disposal methods as mitigation strategies to minimise food wastage .................................. 71
4.6.1 Food waste disposal methods by geographical area .................................................................... 71
4.6.2 Food waste disposal methods by age range ..................................................................................... 72
4.6.3 Food waste disposal methods by highest qualification level .................................................... 73
4.6.4 Food waste disposal methods by household size .......................................................................... 74
4.6.5 Food waste disposal methods by monthly income ........................................................................ 75
4.7 Household shopping behaviour ........................................................................................................... 76
4.7.1 Geography..................................................................................................................................................... 76
4.7.2 Age range ...................................................................................................................................................... 81
4.7.3 Highest qualification ................................................................................................................................ 83
4.7.4 Household size ............................................................................................................................................ 86
4.7.5 Monthly income level ............................................................................................................................... 89
4.8 Results of statistical analysis ................................................................................................................. 91
4.8.1 Correlation between income categories and food wastage ....................................................... 91
4.8.2 Correlation between age group and food wastage ........................................................................ 92
4.8.3 Correlation between household size and food wastage .............................................................. 93
4.9 Conclusion .................................................................................................................................................... 94
CHAPTER 5: CONCLUSIONS AND RECOMMENDATIONS ............................................... 96
5.1 Introduction ................................................................................................................................................. 96
5.2 Summary of the study findings ............................................................................................................. 96
5.3 Conclusions .................................................................................................................................................. 98
5.4 Recommendations ..................................................................................................................................... 98

xii
5.4.1 In the supermarket ................................................................................................................................... 99
5.4.2 In the kitchen............................................................................................................................................... 99
5.4.3 The use of leftovers ................................................................................................................................... 99
5.4.4 Disposal methods and separation .................................................................................................... 100
5.4.5 Food waste recycling and awareness .............................................................................................. 100
5.5 Suggestions for further research ...................................................................................................... 101
REFERENCES ............................................................................................................. 102
ANNEXURES ............................................................................................................. 119
xiii
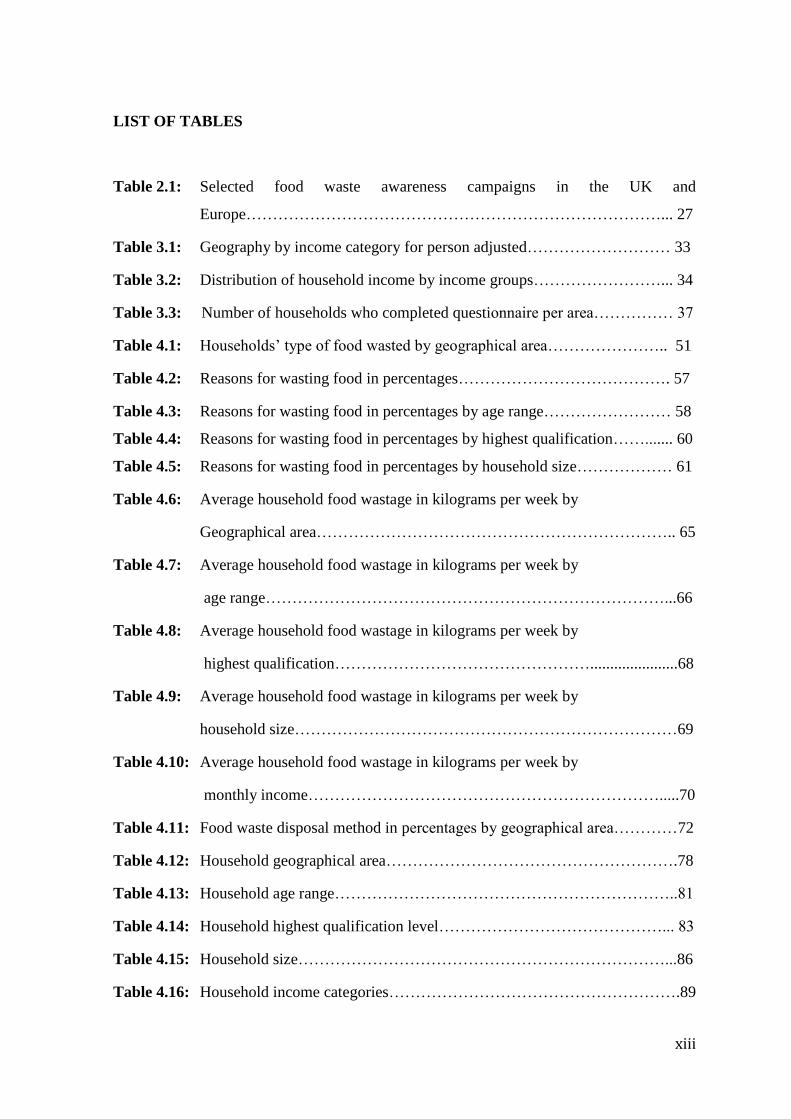
LIST OF TABLES
Table 2.1: Selected food waste awareness campaigns in the UK and
Europe……………………………………………………………………... 27
Table 3.1: Geography by income category for person adjusted……………………… 33
Table 3.2: Distribution of household income by income groups……………………... 34
Table 3.3: Number of households who completed questionnaire per area…………… 37
Table 4.1: Households’ type of food wasted by geographical area………………….. 51
Table 4.2: Reasons for wasting food in percentages…………………………………. 57
Table 4.3: Reasons for wasting food in percentages by age range…………………… 58
Table 4.4: Reasons for wasting food in percentages by highest qualification……....... 60
Table 4.5: Reasons for wasting food in percentages by household size……………… 61
Table 4.6: Average household food wastage in kilograms per week by
Geographical area………………………………………………………….. 65
Table 4.7: Average household food wastage in kilograms per week by
age range…………………………………………………………………...66
Table 4.8: Average household food wastage in kilograms per week by
highest qualification…………………………………………......................68
Table 4.9: Average household food wastage in kilograms per week by
household size………………………………………………………………69
Table 4.10: Average household food wastage in kilograms per week by
monthly income………………………………………………………….....70
Table 4.11: Food waste disposal method in percentages by geographical area…………72
Table 4.12: Household geographical area……………………………………………….78
Table 4.13: Household age range………………………………………………………..81
Table 4.14: Household highest qualification level……………………………………... 83
Table 4.15: Household size……………………………………………………………...86
Table 4.16: Household income categories……………………………………………….89
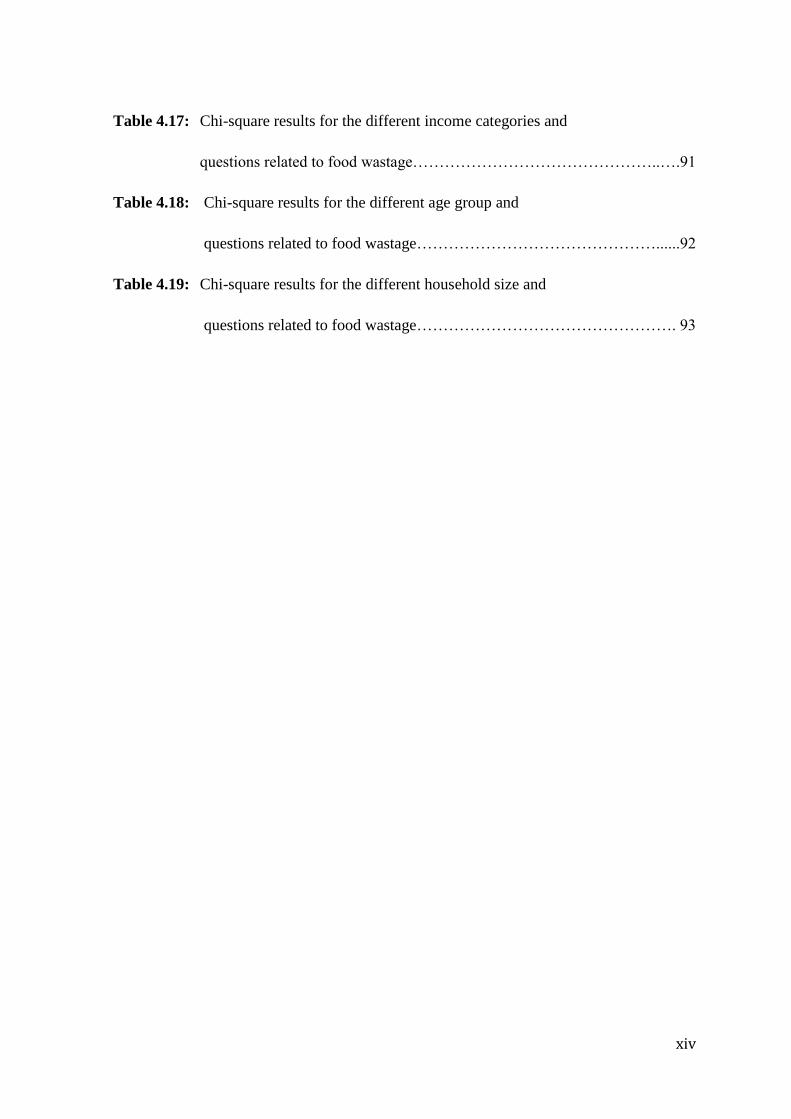
xiv
Table 4.17: Chi-square results for the different income categories and
questions related to food wastage………………………………………..….91
Table 4.18: Chi-square results for the different age group and
questions related to food wastage………………………………………......92
Table 4.19: Chi-square results for the different household size and
questions related to food wastage…………………………………………. 93
xv
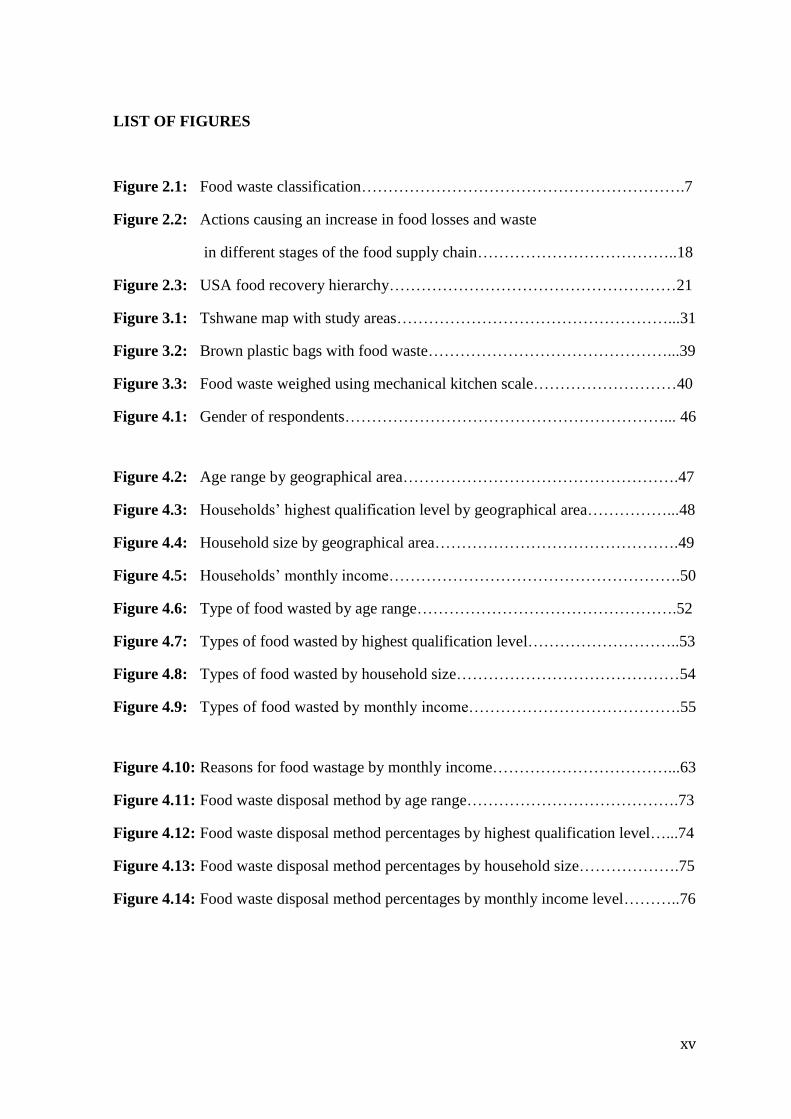
LIST OF FIGURES
Figure 2.1: Food waste classification…………………………………………………….7
Figure 2.2: Actions causing an increase in food losses and waste
in different stages of the food supply chain………………………………..18
Figure 2.3: USA food recovery hierarchy………………………………………………21
Figure 3.1: Tshwane map with study areas……………………………………………...31
Figure 3.2: Brown plastic bags with food waste………………………………………...39
Figure 3.3: Food waste weighed using mechanical kitchen scale………………………40
Figure 4.1: Gender of respondents……………………………………………………... 46
Figure 4.2: Age range by geographical area…………………………………………….47
Figure 4.3: Households’ highest qualification level by geographical area……………...48
Figure 4.4: Household size by geographical area……………………………………….49
Figure 4.5: Households’ monthly income……………………………………………….50
Figure 4.6: Type of food wasted by age range………………………………………….52
Figure 4.7: Types of food wasted by highest qualification level………………………..53
Figure 4.8: Types of food wasted by household size……………………………………54
Figure 4.9: Types of food wasted by monthly income………………………………….55
Figure 4.10: Reasons for food wastage by monthly income……………………………...63
Figure 4.11: Food waste disposal method by age range………………………………….73
Figure 4.12: Food waste disposal method percentages by highest qualification level…...74
Figure 4.13: Food waste disposal method percentages by household size……………….75
Figure 4.14: Food waste disposal method percentages by monthly income level………..76

xvi
LIST OF ANNEXURES
Annexure A: Questionnaire on food waste in English…………….............119
Annexure B: Permission to conduct study……………….......................... 122
Annexure C: Ethical approval…………………………………..................123
Annexure D: Household food wastage consent form….............................. 126
Annexure E: Demographic profile of questionnaire respondents……........129
Annexure F: Composting pamphlet……………………………………….131
Annexure G: Benefits of growing own organic food pamphlet…………...132
1
CHAPTER 1: INTRODUCTION AND BACKGROUND
1.1 Background of study
Municipal solid waste, more commonly known as trash, garbage, refuse or rubbish,
consists of daily materials such as product packaging, grass clippings, furniture, clothing,
bottles, food scraps, newspapers, appliances, paint and batteries (Nannyonga, 2006). The
municipalities or other governmental authorities are responsible for the collection of waste
from houses, streets, shops, offices, industries and hospitals (Nannyonga, 2006). A large
part of municipal solid waste generated by households is food waste (US Environmental
Protection Agency (USEPA), 2012; Muth, 2011).
Food waste is any waste that is raw, cooked, edible and associated inedible material (e.g.
bones, eggshells, fruit and vegetable peelings) generated during the preparation or
consumption of meals or all food produced or purchased that is unused by humans (Griffin
et al., 2009). The issue of wasting food is crucial because during the food production and
distribution stages, large amounts of energy and other resources such as water,
transportation and land are required. When food is wasted it leads to wasted resources,
environmental impacts such as climate change (gas emissions) which could be avoided and
also impacts food security (Oelofse & Nahman, 2013). Environmental impacts associated
with food waste are caused by the decomposition of food waste that emits greenhouse gas
(GHG) methane and carbon dioxide (CO2) (Kevin, 2009). Methane from rotten food waste
in landfills is 25 times more powerful a GHG than CO2 (Kevin, 2009). Food waste has
become a focus of interest in the world due to changes in food systems and global
warming (Morgan, 2009).
With an alarming population growth, reducing the amount of food wasted is very
important, especially because it has been estimated that by 2050 the global population
would have increased to nine billion people (Gustavsson et al., 2011). This means that if
the amount of food wasted is not reduced, there will be a need to increase food production
globally. Currently one-third of food produced globally is wasted or lost from farm to fork
(Food and Agriculture Organization (FAO), 2011). Reducing, recovering and treating of
food waste divert organic materials from landfills and incinerators, thus reducing GHG
emissions from landfills and waste combustion (Beavan, 2007). The use of treated food

2
waste (compost) has many environmental benefits, such as improving soil health and
structure, increasing drought resistance and reducing the need for supplemental water,
fertilizers and pesticides (Lundqvist et al., 2008; USEPA, 2011). Everyone who eats is
responsible for preventing and reducing food waste.
This study was therefore designed with the aim of assessing and quantifying the amount of
household food waste generated in order to achieve a better understanding of the
complexity of food wastage. The volumes of food waste were also quantified in homes at
Atteridgeville Ext 6, 16 and 17, Lyttelton, Montana Park, Olievenhoutbosch Ext 36 and
Silver Lakes Golf Estate. These were done by classifying the type of food that is wasted
the most and quantifying the amount of food thrown away in kilograms. Factors that drive
households to throw away food were also assessed. Additionally, the relationship between
income levels and food waste were established in an attempt to provide data on the types
and causes of food waste in South African townships and suburbs in order to suggest
possible mitigation measures that can be implemented to reduce such wastages.
1.2 Problem statement
With an increase in the South African population growth, the demand for food and other
essential resources such as water and electricity is increasing accordingly (FAO, 2013). In
the same fashion, over 9 million tons of food waste is generated every year in South Africa
(Oelofse, 2012). Considering these amounts of household food waste and the pressure that
is being imposed on landfill sites, there is a need to devise practical mitigation measures
that can curtail the impacts of food waste in order to conserve the environment. Food
waste has negative impacts on the environment and economy because when food is
wasted, resources such as water, electricity and fertilizers are also wasted (Oelofse &
Nahman, 2013). To the author’s knowledge, there are no documented studies in academic
literature reporting on household food waste generation rates in South Africa. As such,
there is a need to conduct a household food waste assessment. Currently there is a scarcity
of landfill airspace in Gauteng, South Africa. Three of the nine landfills within the City of
Tshwane Metropolitan Municipality (CTMM) reached full capacity and were closed over
the last five years (DEA, 2012).
3
1.3 Motivation for the study
The National Waste Management Strategy targets are to divert recyclable waste from
landfills by 25%, by separating waste at source and have 80% of municipalities ensuring
public awareness of the impact of waste on their health, well-being and the environment by
means of an awareness campaign by 2016 (DEA, 2011). An amount of 8.3 million tons of
recyclable waste that ends up at landfills from municipalities is food waste generated at
household level (Muth, 2011). Oelofse and Nahman (2013) emphasise that when food is
wasted it has an environmental and economic impact because when food is wasted,
resources such as water, electricity and fertilizers are also wasted. Food waste that ends up
in landfills produces a large amount of methane which is a more powerful greenhouse gas
than carbon dioxide. Due to these concerns, this study was conducted in order to assess
household food waste volumes in terms of income, geographical area, age and highest
qualification level.
The Waste Information Baseline report (DEA, 2013) estimates that the average waste
generation rates in kilograms per person per day by income level are: very low income 0.3
kg, low income 0.46 kg, medium income 1.03 kg, high income 1.68 kg and very high
income 1.85 kg per capita per day. The waste characterisation studies available in South
Africa include studies estimating the magnitude of food losses and food waste generated in
South Africa (Oelofse & Nahman, 2013) and waste stream analysis for the CTMM
(Snyman, 2008). It was therefore relevant to conduct a study in order to be able to quantify
the amount of food wasted in selected areas of the CTMM at household level.
It is estimated that up to 12 million (24.5%) of the South African population go to bed
hungry each day (Hosken, 2013) and yet the country has the largest proportion of food
wastage in Africa (Allafrica, 2010). In other poor areas around Cape Town and Msunduzi
in KwaZulu-Natal, between 80% and 87% of the population, go hungry daily (Hosken,
2013). Yet, needy poor households in South Africa and specifically in these areas grow
their own food (SACN, 2011).
In order to save food in the fight against global food waste, people must be made aware
that an abundance of food will not always be available to satisfy the excessive way we
consume and waste food the way we do today (Stuart, 2009), especially because the
number of South Africans living in poverty has increased since 2010 (Lehohla, 2015). Due

4
to these concerns, there was a need to assess household food waste and quantify the types
of food waste that emanate from households, particularly focusing in the CTMM also
referred to as Tshwane. The study will help to understand the actual root cause of why
food is thrown away and what can be done to reduce household food waste. This will help
not only to reduce the overfilling of landfill sites, but also to educate the population on
how to save money, which in turn can uplift the economic well-being of its citizens and
provide the CTMM with household food waste data (Department for Environment, Food
and Rural Affairs (DEFRA), 2010).
1.4 Research questions
This study attempted to provide answers to the undermentioned research questions:
i. What are the types of food that are most wasted by households in the CTMM?
ii. How much food is wasted by CTMM households per week (in kilograms)?
iii. What are the drivers of wasted food in CTMM households?
iv. Is there a correlation between food wastage and household income level?
v. What possible mitigation strategies could be implemented to minimise food
wastage in CTMM households?
1.5 Aim and objectives of study
1.5.1 Aim
The overall aim of the research study was to assess household food wastage in selected
areas in the CTMM.
1.5.2 Objectives of the study
The following were the objectives to provide answers to the research questions:
i. To determine and categorise the types of food wasted the most in CTMM
households.
ii. To quantify the amount of food waste generated in households.
iii. To evaluate factors which influence the generation of household food waste.
iv. To establish relationships of food waste generation profiles between low-, middle-
and high-income households.
v. To develop food waste minimisation and management strategies within CTMM
households.
5
1.6 Thesis layout
CHAPTER 1: INTRODUCTION AND BACKGROUND
Background information is given to households’ food waste and their potential
environmental and socioeconomic impacts. This chapter also covers the problem
statement, the motivation for the study, research questions and the aim and objectives of
the study.
CHAPTER 2: LITERATURE REVIEW
This chapter presents a concise literature review of food waste as well as causes and
disposal of food waste. Socioeconomic and environmental impacts that emanate from food
waste disposal are discussed. The global estimates and perspectives of food waste in
different countries are outlined in this chapter. Awareness campaigns that are used to
educate households about the importance of food waste management are discussed in
detail.
CHAPTER 3: RESEARCH DESIGN AND METHODOLOGY
The methodological framework applied in this study is explained. The sampling, research
design, study methodology, data collected, data analysis and quality controls are covered.
Additionally, the pilot testing of the questionnaire is explained and ethical considerations
as well as limitations of the study are presented.
CHAPTER 4: INTERPRETATION AND DISCUSSION OF RESULTS
Household food waste results from the assessment in the CTMM are analysed and
presented. The types and amount of food wasted and the drivers or causes of food waste
are identified, and a correlation is made between food wastage and household income
level.
CHAPTER 5: CONCLUSIONS AND RECOMMENDATIONS
This chapter elaborates on the findings of the household food waste study and
recommendations are made. Moreover, suggestions for further research are given in this
chapter.

6
CHAPTER 2: LITERATURE REVIEW
2.1 Introduction
Literature on food waste is reviewed and food waste definitions are given in this chapter.
Terms used in the study are explained and reasons for food waste are investigated.
Demography plays an important role in food waste; it has an influence on how the
household is run and how waste is handled, which is why it was included in this study. The
literature review was done in terms of gender, age, highest qualification, household size
and income categories and disposal methods employed by households. The reasons for
household food waste identified in the literature will be compared in Chapter 4 with the
reasons for food waste data from this study. The socio-economic and environmental
impacts of food waste, global food waste estimates and perspectives are discussed from
different household food waste studies that were conducted internationally, followed by a
discussion of household food waste status in South Africa. Food waste awareness
campaigns that have been conducted are discussed.
2.2 Defining Food waste
Waste can be defined as anything that is no longer useful and needs to be disposed of
(Department of Environmental Affairs and Tourism (DEAT), n.d.). Different authors
define food waste differently because there is no internationally accepted definition of
food waste (FAO, 2013). An example of a definition found in the literature is: food waste
at household level represents “any food that is brought in the home that is not ingested by
humans” (WRAP, 2007a and DEFRA, 2010). Griffin et al. (2009) and Lebersorger and
Schneider (2011) define food wasted as unconsumed or unwanted food materials which
can be cooked or consumed raw, i.e. food waste generated during and after meal
preparation in the household. It includes materials such as vegetable peelings, meat
trimmings and spoiled or excess ingredients or prepared food as well as bones, carcasses
and organs (the latter two generally do not occur in homes). For the purpose of this study,
food waste is defined as edible and inedible food that is thrown away by households into
the garbage bin whether it is cooked or not, composted or fed to pets.

7
Main classification categories of food waste are shown in Figure 2.1.
Figure 2.1: Food waste classification (Adapted from WRAP, 2009b)
Waste and Resources Action Programme (WRAP), 2009b) classifies food waste into three
categories, namely avoidable, possibly avoidable and unavoidable, as illustrated in Figure
2.1. Edible food waste falls into the avoidable and possibly avoidable categories. Inedible
food waste falls into the unavoidable food waste category (WRAP, 2009b). The United
Nations Food and Agriculture Organization (FAO, 2011) explains that edible food waste
refers to what may normally be eaten (fit to be eaten by humans), such as a slice of bread,
apples, meat and plate residue. Something which is edible may sometimes be uneatable,
meaning that avoidable food waste may be referred to as food that is edible at the point
when it is discarded. DEFRA (2010) maintains that this food waste accounts for one-
quarter of all avoidable food waste. Possibly avoidable food waste, e.g. bread crusts,
potato skins and apple skins, is waste generated because of people’s preferences – food
which specific people eat and others do not. Unavoidable food waste is referred to as food
that is unfit to be eaten (not edible), e.g. bones (meat and fish), fruit and vegetable peels,
eggshells and teabags (WRAP, 2009b).
A survey by Lyndhurst (2007) revealed that more food that is wasted is cooked rather than
raw. The survey found that 56% of the consumers wasted inedible food, e.g. peelings and
Avoidable Possibly
avoidable
Unavoidable
Kitchen Waste

8
bones. Additionally, it was found that 32% of the consumers left food on the plate after the
meal (Lyndhurst, 2007). Furthermore, the same study found that 30% of consumers wasted
fruit and vegetables, 20% wasted bread and cake and 16% wasted raw meat and fish.
Vegetables (19%), followed by milk produce (17%), bread (13%) and fruit and berries
(13%) were the main discarded food items by consumers (Silvennoinen et al., 2012).
Parfitt et al. (2010) state that fresh fruit and vegetables are wasted the most, followed by
bakery and dairy products and then meat and fish.
Buzby et al. (2014) found that meat, poultry and fish (30%), vegetables (17%) and dairy
products (17%) are the top wasted food groups by United States’ consumers. Therefore,
there seems to be a difference between the food wasted by different populations. Crutch
(2014) reports that 4.4 million tons of food is wasted every year by British households; of
this, bread is wasted the most. This is in line with a study by Stefan (2011), who found that
bread and other bakery products are mostly wasted. However, in a study by Ramukhwatho
et al. (2014) in Mamelodi, South Africa, it was found that porridge (58%), referred to as
“pap” as a staple food was wasted most, followed by rice (26%) and bread (16%). Staple
food may be defined as food that is frequently eaten and it forms such a high proportion of
the meal that it constitutes a dominant part of a diet in a given population (FAO, n.d.).
2.3 Reasons for food wastage
Parizeau et al. (2015) conducted a study with the aim to survey households’ beliefs,
attitudes and behaviours towards food waste. They observed that there are multiple
behaviours which cause food waste, for example behaviours relating to household
shopping practices which include the way households plan their shopping, behaviours
during food preparation, the way food is stored and the way in which food is consumed.
Factors that influence food waste, according to Parizeau et al. (2015), include social,
cultural, economic and institutional factors.
Buzby and Hyman (2012) maintain that households waste food because they buy too much
food and end up discarding it. Several studies that have been conducted on household food
waste identify reasons for this waste as cooking too much, food not used in time (past
expiry date), special offers, food going mouldy, plate leftovers, and food that looked bad
and smelt or tasted bad (Hamilton et al., 2005; Lyndhurst, 2007; Eurostat, 2008; WRAP,

9
2008; WRAP 2009b; EC, 2010; Silvennoinen et al., 2012; Stefan et al., 2013;
Ramukhwatho et al., 2014; Parizeau et al., 2015).
Lyndhurst (2007) gave 33 reasons that lead consumers to waste food. There are only 6 of
these which appear to be the key ones: 34% of respondents wasted food because the date
had expired, 30% because of its appearance (food visibly went bad, e.g. looked or smelt
bad), 30% said that the Buy One Get One Free (BOGOF) special offers led to food
wastage, 27% prepared too much food, 25% did not eat the food that needed to be eaten
first and 22% bought too much food.
The main reason for consumers wasting food, as reported by Silvennoinen et al. (2012), is
food spoilage; and it was found that 29% of respondents wasted food because of
mouldiness, 19% because the food was past its best before date, 14% threw away leftovers
and 13% prepared too much food. In another study, 11.4% of respondents wasted
avoidable food waste because of mouldiness, 19.8% because the food was past its best
before date, 30% threw away leftovers and 11.5% because the food “looked bad” (WRAP,
2008). Additionally, the main cause of food waste in a survey by Koivupuro et al. (2012)
was that households did not reuse leftovers, as well as buying too much and cooking or
serving too much.
There are several factors that cause food waste, for example behaviours relating to
household shopping practices which include the way households plan their shopping,
behaviour during food preparation and the way food is stored and consumed (WRAP,
2007b). Williams et al. (2012) found that, of the food waste generated at household level,
20 - 25% could be associated with packaging. Consumers identified packages that were
too big and/or difficult to empty, e.g. yoghurt, mayonnaise, sour milk or jam packed in
liquid packaging board or in glass (Williams et al., 2012).
Williams et al. (2012) state that in their study it was very difficult for households to empty
all of the food in the board packaging (known in South Africa as tetra pack); households in
the study had to squeeze the packaging in order to empty all of the food. Respondents
preferred packaging which was easy to empty, easy to reseal and easy to recycle. Using
packages that are easy to empty and available in small sizes will play a part in reducing
food that is wasted unintentionally (Williams et al., 2012). Demography also plays a
notable role in food waste. Each of the individual aspects are discussed in detail below.
10
2.3.1 Household behaviour
Ownership of the households has significant impacts on the behaviours of household
occupants towards food wastage. Parizeau et al. (2015) point out that in Guelph, Ontario,
there is a close relationship between food waste production, beliefs, attitudes and
behaviours at household level. In their study, they reported that 97% of respondents owned
the house they lived in and only 3% were tenants renting the houses. The character of the
households has an influence on how the household is run and how waste is handled. The
way households plan and shop has a huge impact when it comes to food wastage (Parizeau
et al., 2015).
This was further verified by a survey conducted by the US Environmental Protection
Agency (USEPA, 2009) which showed that 66% of respondents ‘mostly’ or ‘always’
checked the food they had in the house before shopping for food. Over half of the survey
respondents drafted a food shopping list and stuck to it as much as possible when shopping
for food (USEPA, 2009). This plan for managing food before and during shopping
corroborated a study by Parizeau et al. (2015) wherein 82% of respondents drafted a
shopping list and stuck to it during shopping. Doing this helps avoids buying food that
people still have in their homes. This indicates that there are households who have a good
management plan for food shopping.
There are numerous ways in which households practise avoiding wastage of food.
Households use diverse ways to preserve their food from spoilage, such as cooling and
freezing, which makes life easier, though this needs to be applied properly to avoid food
waste (Cengel, 2007). In the study in Guelph, Ontario, by Parizeau et al. (2015) it was
revealed that 62% of the respondents owned cooling facilities, 54% owned freezing
facilities and the majority (71%) of respondents without freezing facilities often or always
ate their leftovers.
2.3.2 The influence of demographic characteristics
A study by Gjerris and Gaiani (2013) showed that food waste is mostly determined by the
combination of family size and composition, age, culture and income at household level.
However, Koivupuro et al. (2012) found that a small number of factors in their study on
the influence of socio-demographic, behavioural and attitudinal factors on the amount of
avoidable food waste generated correlated negatively with the amount of avoidable food

11
waste generated at household level. Factors such as household size, gender, shopping
frequency and the frequency of buying special offer products whose prices are reduced
because they are old or near/past their best date also increased the amount of food waste at
household level (Koivupuro et al., 2012).
2.3.2.1 Gender
Gender has an influence on the amount of food that is wasted. Females mainly spend most
of their time in the kitchen; as such they are more bound to waste food than males. The
World Food Programme (2013) shows that females (63%) spend 85 - 90% of their time
preparing food in their households and that causes females to waste food more compared
to male respondents. This is in line with a study executed by Food Standards Agency
(FSA) (2008), which reports that females waste more food compared to males because
they are primarily responsible for cooking in many societies. Similarly, in a study by
Koivupuro et al. (2012) it was found that households considered to waste more food are
dominated by women, since females are mainly responsible for the grocery shopping and
they have a say in what is going on regarding food in the household. This is the reason
why gender was included in this study.
2.3.2.2 Age
The fact that age is one of the factors that contribute to households’ food waste was
validated by the studies conducted by Hamilton et al. (2005) and Lyndhurst (2007). In
their studies, the authors proved that young people (dependants in households) waste more
than older people due to a shallow understanding of cost involved in food purchases.
Moreover, this was further proved in a study by the European Commission (EC) (2010):
young people consume fewer meals at home and only some of them have knowledge of
planning meals. Wassermann and Schneider (2005) proclaim that older people waste less
food because they are more aware of saving and recycling.
Furthermore, research carried out by Lyndhurst (2007) for WRAP which investigated
consumer attitude and behaviours relating to food and food waste and what might motivate
consumers to throw away less food, found that high food wasters are young professionals
(42%) aged 16 - 34.

12
2.3.2.3 Highest qualification
The level of education and extent of literacy play an important role in the management of
food waste. People who are less educated are more likely to waste more food than people
who are educated; this is attributed to the mere fact that educated people understand the
costing involved and potential environmental impacts that arise from wasting food (Kumar
& Singh, 2013). Kumar and Singh (2013) and Wassermann and Schneider (2005) note that
the level of education correlates with household income. For example, households with
higher income waste more food than households with low income and they do not use
resources in a better way in terms of saving compared to lower income households.
Though Kumar and Singh (2013) observe that households with lower income use
resources efficiently, Murad et al. (2012) argue that people who practise improper methods
of environmental management systems have lower levels of education.
Additionally, different authors have different views regarding household size and
education level. For example, in a study by Ramukhwatho et al. (2014) it was found that
there is a correlation between household size and education; households with educated
people have fewer family members, while households with more illiterate or less educated
people have more family members. This is evidence that the level of education does have
an influence on the way in which people waste food. This is in line with results from a
study by Barr (2002).
2.3.2.4 Household size
Composition of a household has a direct relation to the amount of food waste that is
generated. More people in a house generate more food waste because more food will be
prepared to cater for a large number of people (Wenlock et al., 1980). Katajajuuri et al.
(2014) and WRAP (2009a) concur that household size is one of the factors that correlates
with the amount of food waste produced. Similarly, Lyndhurst (2007) reports that the
amount of food wasted correlates to socio-demographic variables. Generally, household
size has a positive correlation with the amount of food wasted by people, for example the
number of people in a household and the amount of food waste produced per person in the
household contribute to approximately 400 kJ (95 kcal) per day (Wenlock et al., 1980).
Lyndhurst (2007) found that single-person households waste less food (3.5 kg per week)
compared to larger households, which is expected and relevant to this study; households

13
with 5 family members waste 7.3 kg of food per week, while households with 6 family
members waste 9.6 kg per week. WRAP (2008) reveals that larger households waste food
more than single-person households; however, on a per capita basis, single-person
households waste more food because they do not share their food with anyone. Koivupuro
et al. (2012) also conclude that household size influences the amount of food waste
generated. As such, it can be concluded that there is less food waste in households with
fewer family members.
By contrast, Baker et al. (2009) argue that households with more than one person waste
less food compared to households with single occupants because the latter have no one to
share their food with. Therefore, when there are many people in the house, they are able to
share and finish the food which was bought or prepared; however, the more people in the
house, the more money is spent. Baker et al. (2009) conclude that large amounts of
avoidable food waste are produced by households with persons living by themselves
compared to other households with more family members. Therefore it can be seen that
there are many different opinions regarding food waste and household size.
2.3.2.5 Income categories
Income level plays a pivotal role in the amount of food waste generated (Skourides et al.,
2008). High-earning people are prone to buy more food than people earning less due to the
degree of affordability (Skourides et al., 2008). An economic factor such as income
influences households to waste food (Skourides et al., 2008), although Koivupuro et al.
(2012) found no correlation between households’ income levels and the amount of food
wasted. A study conducted by Ramukhwatho et al. (2014) found that household income
level has an impact on the amount of food wasted. In their study, the respondent
households with a monthly income of less than R5 000 wasted more food than those with a
higher monthly income (Ramukhwatho et al., 2014).
Jones (2003) reports that the more people earn, the more they waste food. This is further
supported by Hamilton et al. (2005) and Skourides et al. (2008), who show that higher
income households waste more food than those with lower income levels. This means that
households with higher income generate more food waste.

14
2.4 Disposal of food waste
Food waste is mainly collected from houses and food-serving facilities and taken to the
landfill by municipal trucks. With a drastic increase in population size, which causes more
food waste to end up in landfills, South African landfills are reaching full capacity and
there is limited disposal space available due to the large quantity of waste that is being
disposed of (Oelofse, 2012). This has motivated the South African government to set a
target in the National Waste Management Strategy to minimise waste to landfill by 25%
by 2016 (National Waste Management Strategy, 2016).
Madubula and Makinta (2012) explain that composting is another alternative way to
extend landfill lifespan and that will be a feasible substitute for South Africa, because of
its high recyclable waste content. Composting diverts waste from landfills and reduces
potential environmental impacts by using waste materials from households and thus
reducing the impacts of greenhouse gas emission (USEPA, 2011).
To minimise food disposal, the Department of Environmental Affairs (DEA) (2013)
encourages home composting as a way to divert organic and garden waste from landfills in
order to produce products that will benefit individuals and the community at large.
Parizeau et al. (2015) found that 71% of respondents relied on a municipality waste
management programme as their food waste disposal method because it was effective and
easy to use. However, 33% said that home-based composting was useful to them.
Lyndhurst (2007) indicates that consumers do not care about the environment in which
they live and do not know if there is a connection between food waste and environmental
impacts such as ground water, soil and air pollution due to release of gases to the
atmosphere and leachates that affect the aesthetic value of land due to, inter alia, wearing
off of colourants in food. Odours emanating from landfills due to decomposition of food
degrade the quality of air that people breathe. Moreover, people do not care much about
how to dispose of food waste, but are only concerned that they have wasted money and
good food when they waste food (Lyndhurst, 2007).
2.5 Socio-economic and environmental impacts of food waste
With large amounts of food waste due to the increasing size of populations, there are
serious environmental impacts which have evolved (Baker et al., 2009; Göbel et al., 2015).
15
When food wastes originating from households are disposed of in landfills, they undergo
aerobic and anaerobic decomposition (EC, 2011). During anaerobic decomposition,
organic materials are decomposed in the absence of oxygen, while during aerobic
decomposition, organic materials decompose in the presence of oxygen. Both processes
produce greenhouse gases which contribute to climate change. Methane, the gas produced
during anaerobic decomposition, is a stronger greenhouse gas than carbon dioxide, which
is produced during aerobic decomposition (USEPA, 2012). This will also contribute to
climate change in the long run. Climate change, as defined by the Intergovernmental Panel
on Climate Change (IPCC, 2007), refers to a change in the state of the climate that can be
identified by changes in the mean and/or variability of its properties and that persists for an
extended period. When there is global warming due to high loading of carbon dioxide and
methane, the environment becomes extremely hot and species tend to migrate to cooler
environments. Some species die because they cannot adapt to the prevailing conditions,
thus leading to loss of biodiversity (FAO, 2013).
If the world avoids wasting food, there will be benefits to combat hunger and improve
food security, which will be beneficial all around the world (Tukker, Eder & Sur, 2006).
According to a study by WRAP (2007a) on consumer preferences, approximately 70% of
respondents were concerned about the financial crisis caused by food waste. United States
consumers spend almost $100 billion annually on food that is never used (Jones, 2006),
while United Kingdom consumers waste an estimated £10 billion on food that is never
eaten (WRAP, 2008). These numbers show that food waste has an impact on the economy.
As indicated in Chapter 1, before they reach the consumers, up to 40% of groceries are lost
in Britain because of poor processing, transport and storage, while other less fortunate
countries in the world are left starving (FAO, 2011). All around the world, food prices
have increased over the past years due to poor harvests and high costs of energy, fertilizer
and transport (Department of Transport, 2008). Moreover, in South Africa the cost impacts
of wasted fruit and vegetables are the highest (42%), followed by meat (32%) (Oelofse &
Nahman, 2013). Globally, food waste is a problem that is growing and consuming
resources (Payne, 2014).

16
2.6 Food waste globally
2.6.1 Global estimates of food waste
The reporting of the amount of food wasted globally varies depending on several factors
such as (1) the definition of food waste used; (2) methodology used to determine food
waste and (3) the amount of food a country has available for consumption (Stuart, 2009;
Buzby & Hyman, 2012). The volumes of food waste produced at household level were
reported by Stuart (2009) to be 270 kg per year and by Buzby and Hyman (2012) to be 124
kg per year. Parizeau et al. (2015) explain that the difference in the amount of food wasted
by consumers is because of seasonal factors; for example, fresh produce is more readily
available during summer time and that is why more fresh produce is wasted in summer
time at household level.
A survey conducted by WRAP (2009a) estimated that the average amount of food wasted
per household ranges from 0.32 ‒ 2.1 kg per week. An average household of 2.4 people
annually produces 270 kg of avoidable food waste and this translates into 112.5 kg per
capita per year of food wasted. Additionally, a study by Buzby and Hyman (2012) in
Washington DC estimated that in 2008 single households wasted 124 kg of food annually
and only 3 kg of food was wasted daily per capita. Of the 124 kg of food wasted, Buzby
and Hyman (2012) calculated the amount of food wasted in each household of 2.4 people
per year to be 297.4 kg per capita. This amount is higher than the results of WRAP (2009a)
in the UK and also of the study on the global food losses and food waste in Finland by
Gustavsson et al. (2011), who suggest that the amount of food waste should be roughly 95
- 115 kg per capita per year.
A household food wastage study conducted by Pekcan et al. (2006) in Turkey showed that
an average household (2.4) wastes 298 kg of food annually, which amounts to 116 kg of
food wasted annually per person. It is clear that there is an upward trend in the amount of
food waste since 2006. WRAP (2009b) found that households waste more than 6 kg of
food per week. This quantity is less than in the survey by Parizeau et al. (2015) in Guelph,
Ontario, which indicated that 31.2 kg of food is wasted per week by households; this
includes 24.1 kg of organic waste and 7.1 kg of residual garbage; the amount of food waste
produced accounts for a total of 10.2 kg per person per week. Moreover, in a study by
Koivupuro et al. (2012) in Finland, during the two-week test period, it was found that

17
households wasted up to 11.7 kg per person per week of avoidable food waste. Similar
studies on the amount of food wasted were done by Hall et al. (2009), Griffin et al. (2009),
Langley et al. (2010), WRAP (2011) and Law (2013).
2.6.2 Global perspectives on food waste
In the first global assessment of food wastage in 2007, Gustavsson et al. (2011) suggested
that developing countries wasted less food than developed countries. On average sub-
Saharan Africa and South and Southeast Asia wasted 120 – 170 kg per capita per year,
while Europe and North America wasted 280 – 300 kg of food per capita per year. The
United Nations (UN, 2011) has predicted that globally the population will increase to 9.3
billion by 2050. To feed a population of 9 billion, a 70% increase in food production
would be required worldwide (Gustavsson et al., 2011). Half of all the food that is
produced for human consumption is wasted worldwide and this is food that could be used
to feed hungry people as well as the rising population (Institution of Mechanical
Engineers, 2013). Globally between 25% and 50% of all food produced for human
consumption is estimated to be wasted along the food supply chain (Mena et al., 2011).
This statement is supported by Gustavsson et al. (2011), who estimate that one-third of
edible food, which is 1.3 billion tons, is wasted annually along the global food supply
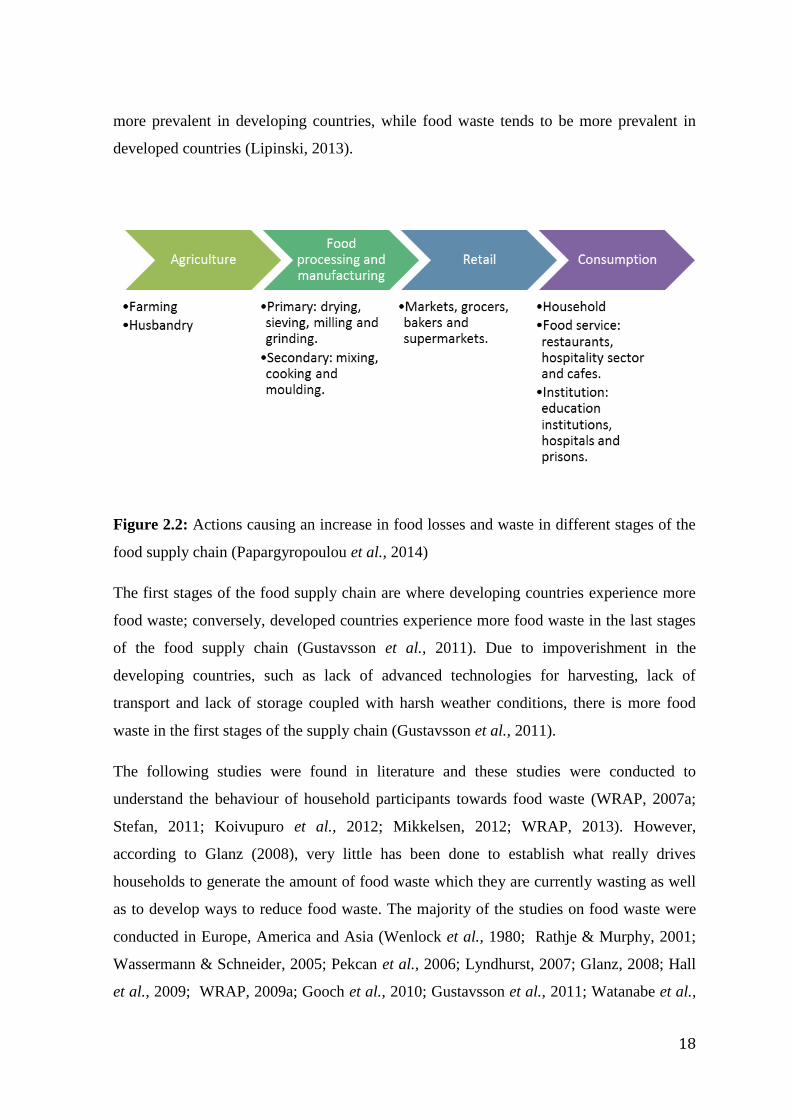
chain. In Figure 2.2 global perspectives activities that cause an increase in food losses and
waste in the food supply chain stages are shown. Food loss is part of food wasted but does
not get wasted by the consumer. The term “food loss and waste” is used in literature to
indicate the food that has been produced but that ends up not being consumed.
Food loss is defined as the food that spills, spoils, incurs an abnormal reduction in quality
such as bruising or wilting, or otherwise gets lost before it reaches the consumer
(Gustavsson et al., 2011) and can therefore also regarded as food that is wasted. Food loss
characteristically takes place at the production, storage, processing and distribution stages
in the food value chain. It is usually the unintended result of an agricultural process or
technical limitation in storage, infrastructure, packaging and/or marketing (Lipinski, 2013).
Food waste is referred to as food that is of good quality and fit for consumption, but does
not get consumed because it is discarded either before or after it is left to spoil. Food waste
typically, but not exclusively, takes place at the retail and consumption stages in the food
value chain. It is usually the result of negligence or a conscious decision to throw food
away. Although both food loss and waste happen all over the world, food loss tends to be
18
more prevalent in developing countries, while food waste tends to be more prevalent in
developed countries (Lipinski, 2013).
Figure 2.2: Actions causing an increase in food losses and waste in different stages of the
food supply chain (Papargyropoulou et al., 2014)
The first stages of the food supply chain are where developing countries experience more
food waste; conversely, developed countries experience more food waste in the last stages
of the food supply chain (Gustavsson et al., 2011). Due to impoverishment in the
developing countries, such as lack of advanced technologies for harvesting, lack of
transport and lack of storage coupled with harsh weather conditions, there is more food
waste in the first stages of the supply chain (Gustavsson et al., 2011).
The following studies were found in literature and these studies were conducted to
understand the behaviour of household participants towards food waste (WRAP, 2007a;
Stefan, 2011; Koivupuro et al., 2012; Mikkelsen, 2012; WRAP, 2013). However,
according to Glanz (2008), very little has been done to establish what really drives
households to generate the amount of food waste which they are currently wasting as well
as to develop ways to reduce food waste. The majority of the studies on food waste were
conducted in Europe, America and Asia (Wenlock et al., 1980; Rathje & Murphy, 2001;
Wassermann & Schneider, 2005; Pekcan et al., 2006; Lyndhurst, 2007; Glanz, 2008; Hall
et al., 2009; WRAP, 2009a; Gooch et al., 2010; Gustavsson et al., 2011; Watanabe et al.,
19
2011; Williams et al., 2012; Buzby & Hyman, 2012; Koivupuro et al., 2012; Hanssen &
Møller, 2013; Buzby et al., 2014; Li et al., 2014).
Studies on the cost of household food waste conducted in South Africa include that by
Nahman et al. (2012), who found that households waste a total of less than 4% of food in
the supply chain; Oelofse and Nahman (2013), who estimated that 9 million tons of food
are wasted; Nahman and Lange (2013), who showed that the cost of food waste across the
food value chain is 2.1% of South Africa’s annual gross domestic product (GDP);
Ramukhwatho et al. (2014), who assessed household food wastage and found that pap and
rice are wasted because of excess preparation; Lundqvist et al. (2008), who estimated that
75% of food is lost globally before it reaches the consumers; Göbel et al. (2015), who
found that there are different causes and effects of food waste in each stage of the food
supply chain.
Additionally, because of the differences from stage to stage in the food supply chain, it is
important to encourage communication between all food supply chain stakeholders to be
able to come up with ways of sustaining the food system (Göbel et al., 2015). Globally
there is an increase of populace and this shows that there is a need to decrease the amount
of food wasted to be able to protect our natural resources for future generations. Reducing
food waste in the food supply chain needs all stakeholders to work towards a common goal
and share responsibilities to identify the causes of food waste (Göbel et al., 2015).
Schneider (2008) found that although 25% of the food wasted is no longer fit for human
consumption according to health standards, 15% is still edible. She also found that food is
wasted in all stages of the food life cycles, e.g. from harvesting, to processing and
production to consumption. In the same study Schneider reports that no one has the
intention to waste food, meaning that people do not waste food intentionally but situations
and behaviour lead to food waste.
The study by Parfitt et al. (2010) confirmed that food is wasted in various stages in the
food supply chain and in order to be able to reduce food waste, it is firstly vital to
understand what the cause of avoidable food waste is in every stage of the food supply
chain, e.g. starting from agriculture to processing and retail to consumption. Parfitt et al.
(2010) also indicate that it is important to understand factors such as culture and political,
geographical and economic forces on how they influence behaviour or cause food to be

20
wasted. Baker et al. (2009) assert that factors, such as household size and income, have a
direct relationship to food waste.
The systems that specifically focus on reducing food waste, i.e. food waste-specific waste
hierarchies, were developed because the waste hierarchy does not focus much on food
waste but only provides general guidelines for all waste (European Commission (EC),
2008). For example, USEPA (2014) developed the Food Recovery Hierarchy in the United
States, the UK developed the Food Waste Pyramid “Feeding the 5000” (Feedback, 2014)
and the Netherlands developed the Moerman ladder (Ministry of Economic Affairs,
Agriculture and Innovation, 2014). Prevention of food waste has the capability to provide
significant benefits at environmental, social and economic levels.
Furthermore, Papargyropoulou et al. (2014) support the initiative that donating food and
feeding hungry people will reduce food waste. They suggest that in order to tackle the
issue of food waste, we should not focus only on the consumption stage in the food supply
chain and think that we will be able to reduce food waste, but we should implement a
sustainable production and ingestion tactic and reduce food surplus and waste along the
global food supply chain.
Figure 2.3 illustrates activities that stakeholders may use to prevent and divert food waste
from landfills. Firstly, in the food recovery hierarchy it is very important to prevent waste
at the source before it is created; then fresh food which is still consumable may be donated
to feed those in need. The food hierarchy encourages feeding pets with fresh food scraps
and turning fats, oils and grease into useful products such as biofuel, and using food waste
to nourish soil. Disposal to landfills should be the last resort (USEPA, 2014).

21
Figure 2.3: USA food recovery hierarchy (Adapted from USEPA, 2014)
The study by Papargyropoulou et al. (2014) demonstrated that a waste hierarchy that is
specifically focused on food waste considers the environmental, economic and social
benefits; it encourages waste producers, researchers and policy makers to reason
intelligently and to develop food policies by proposing a more holistic approach that
supports more sustainable resolution and holistic solutions along the food supply chain. To
minimise household food waste, there is a need to understand how consumers behave
towards food and how they generate food waste (Papargyropoulou et al., 2014), which was
assessed in this current study.
2.7 Food waste in different countries
Food waste differs between particular populations. Food waste from developed countries
such as Sweden, Finland, Norway, the UK and Denmark where studies were done on food
waste was compared with South Africa, a developing country.
2.7.1 Household food waste in Sweden
It is reported that the Swedish waste is 1 010 000 tons of food in a food supply chain
annually, 674 000 tons of which is wasted annually by households (Franke, 2013). The

22
amount of food wasted during 2012 in Sweden was 771 000 tons according to the 2012
population number which is equivalent to 81 kg per person per year, and of this volume
35% of food waste was avoidable (Swedish Environmental Protection Agency (SEPA),
2013). The increase in food waste from 680 000 tons in 2010 to 771 000 tons in 2012 was
due to a change in the food waste definition. In 2010 a stricter definition was used in
which the food waste produced had to be fit for human consumption in order to be
classified as food waste (SEPA, 2013). In 2012 Sweden adopted a food waste definition
developed at EU level. It is therefore not advisable for the food industry to compare the
2010 and 2012 food waste data (SEPA, 2013).
In 2013 the Swedish National Food Agency conducted a survey on 2 050 people in
Sweden. The results showed that 224 000 tons of food and drink were disposed of yearly.
This amounts to 26 kg per person in a year, equal to 0.5 kg per person a week. Because of
the food concern in Sweden, the government set goals to reduce the amount of waste and
increase organic treatment of food waste (SEPA, 2013). The Swedish Waste Management
Recycling Association (Avfall Sverige) receives separated food waste volumes from
households sent for biological treatment, as targeted by the Swedish government. There is
still a long way to go before the Swedish achieve 50% biological treatment of food wasted
in order to intensify a better way of using resources in the food supply chain, though the
separation of food waste at household level has increased.
Swedish Waste Management (2011), cited in Gjerris and Gaiani (2013), maintains that
each person in a 4-person Swedish household annually throws away 30 kg of avoidable
food waste. This is equivalent to 10 - 20% of all the food that is purchased. The Swedish
National Food Agency (2013) indicates that the majority of Swedish households waste
fruit and vegetables. Bread, meat, fish and eggs are not thrown away as much as fruit,
vegetables and dairy products. The Agency has started advising consumers on how to plan
meals in order to reduce food waste. The Swedish waste food mostly for the following
reasons: past the expiry date, not eating leftovers, incorrect storage and stored for too long
(Swedish Waste Management, 2011).
2.7.2 Household food waste in Finland
The Foodspill Project was carried out in 2010 in 380 Finnish households (Katajajuuri et
al., 2014). Households seem to be the biggest source of avoidable food wastage. Edible

23
food wasted in all Finnish households per year is 65% (Statistics Finland, 2011). It is
estimated that every year a Finnish household uses 19% to buy food, the value of the
discarded food being 35% (Tike, 2010; Silvennoinen et al., 2012).
The project showed that annually the whole of Finland wastes 335 460 million kg of food.
Finnish households waste 120 - 160 kg of food annually, with an average of 23 kg per
person (5.1 kg per week) and 60 - 70 kg per household (in an average household size of
2.08 people). Finnish people purchase 500 kg of food per person annually; according to the
results in the Foodspill Project, 4.5% of this food is discarded unnecessarily (Katajajuuri et
al., 2014).
The main reasons why Finnish households throw away food are spoilage, past best before
date, not eating leftovers and preparing food in excess of needs. Finnish consumers
indicate that they waste fresh and perishable food or leftovers from cooking and dining.
Though home-cooked food, milk produce, bread, fruits and beans are wasted by Finnish
households, vegetables are among the food wasted the most (Katajajuuri et al., 2014).
2.7.3 Household food waste in Norway
A report by Olufssøn (2012) showed that Norway wasted 373 000 tons of food in 2011. Of
this food wasted, 255 000 tons were wasted by households. This means that consumers
account for more than 70% of the food wasted in Norway. The same study reported that
Norwegian consumers produce 51 kg of food waste per capita annually (Olufssøn, 2012).
The wastage of avoidable food waste in an average household in Norway is 4 kg per week
(Quested & Johnson, 2009). Hanssen and Møller (2013) report on the NORSTAT survey
that was done in the form of web panels with 1 000 respondents. In this survey 50% of the
respondents indicated that they had become more aware of the food waste problem and
almost 40% believed that they had reduced food wastage in their own households.
The amount of wet organic waste per capita decreased by roughly 5% from 2007 to 2011,
from 117.5 to 112.4 kg per capita per year (3 kg per capita per week), which may indicate
that food wastage has also decreased (Hanssen & Møller, 2013). More people (14%) in
2013 than in 2009 (7.7%) reduced their wastage, and 5% of consumers in 2013 threw away
food because it had expired. Similarly, consumers (5%) stated that they took smaller
portions in order to waste less food (Hanssen & Møller, 2013).
24
Williams et al. (2012) indicate that the reason for 20 - 25% of Norwegian households
wasting food could be related to packaging. Their survey showed that consumers wasted
food because it was past the expiry date indicated on the packaging, and also because of
poor planning, poor storage, ruined packaging and packaging size. In a report by Hanssen
and Møller (2013), it was indicated that consumers waste yoghurt and sour cream, fresh
bakery products, fresh fruit and vegetables and fresh fish because of the expiry date.
Consumers showed that their main reason for wasting food was poor storage.
2.7.4 Household food waste in the United Kingdom (UK)
Most, if not all, studies conducted in the United Kingdom were done by WRAP. The
report compiled by WRAP (2008) states that UK households waste 6.7 million tons of
food every year. There was an increase in food wasted by UK households in 2010; in 2010
WRAP indicated that households wasted 11.9 million tons of food, which accounts for
65% of the 18.4 million tons of the waste generated. WRAP (2008) reports that UK
households purchase 21.7 million tons of food and of this amount of food, 5.9 million tons
end up at landfills. UK households indicate that 800 000 tons of food wasted is composted,
fed to pets or tipped down the kitchen sink. Most of the food wasted (61% or 4.1 million
tons) is avoidable food waste, and if this were managed better, it could be eaten (WRAP,
2008).
In the same study by WRAP (2008), households indicated that they did not waste food at
all, but those who apparently did not waste food at all were actually found to waste 88 kg
of avoidable food a year and to contribute to 1.2 kg of food waste per capita per week.
WRAP (2008) indicates that 46% of the avoidable food waste generated by the UK is in a
fresh, raw or minimally processed state.
Reasons why UK households waste food are that food is left on the plate after a meal, past
the best before date, appearance of food (food looks, smells or tastes bad), food went
mouldy and leftovers uneaten. WRAP (2008) points out that the reasons for UK
households wasting food differ according to the type of food wasted. For example, UK
households commonly throw away starch foods after being prepared. UK consumers waste
potatoes (359 000 tons go uneaten every year), which includes 177 400 tons (40%) of
untouched potatoes wasted (WRAP, 2008). Salads are largely wasted as the food is bought
and thrown away uneaten; 45% by weight of all purchased salad is thrown away and 60%

25
by cost (WRAP 2008). Bakery products and fruit are also wasted or thrown away by UK
households. Foods that are commonly thrown away each year are individual items of fruit
(7.7%), 4.7% of whole vegetables and 3.3% of bakery items (WRAP, 2008).
2.7.5 Household food waste in Denmark
The Danish Agriculture and Food Council (2011), estimates that Denmark wastes 540 000
tons of food annually, 237 000 tons of which are produced annually by Danish households.
Denmark is concerned that there are almost 7 billion people on the planet and 925 million
are starving, yet they produce enough food waste to feed 3 billion people (Stop Wasting
Food, 2008).
A survey by the Danish Environmental Protection Agency (2012) on domestic waste from
800 households in Denmark showed that the majority of the respondents (48%) did not
waste food. The survey indicated that 61% responded that action must be taken, when
asked to describe their attitude towards food waste. 59% of consumers are responsible for
food waste in the food supply chain in Denmark. Most of the foods wasted are vegetables,
bread and dairy products. Every Danish citizen is estimated to waste an average of 63 kg
of food annually (Danish Agriculture and Food Council, and Danish Environmental
Protection Agency, 2006/2008).
Danes waste food because they do not plan what to buy and what to cook, they do not
respect food, they lack responsibility, they lack knowledge about leftovers and portion size
and lastly they have a use and throw away culture (Juul, 2011). The Danish Environmental
Protection Agency (2012) asserts that it is very important to educate the consumers on
what food waste is because many of them do not know and they consider themselves as
not wasting food. Food waste initiatives in Denmark funded by the government have
started to advise consumers on how to reduce food waste, buy only the amount needed,
prepare the amount of food that can be eaten and finished, keep leftovers in the freezer for
another day or in the refrigerator and eat them the following day (Stop Wasting Food,
2008).
2.7.6 Household food waste in South Africa
The only studies on food waste that have been conducted in South Africa at household
level were done by Nahman et al. (2012), Ramukhwatho et al. (2014), Snyman (2008) and

26
Oelofse and Nahman (2013). Oelofse and Nahman (2013) estimate that 4.14% of food
wasted in South Africa occurs at post-consumer stages and 8.67 million tons of food are
wasted annually. The preliminary study of the magnitude of food loss and food waste
generation in South Africa estimates that this is 9.04 million tons per annum (Oelofse &
Nahman, 2013). This is annually translated to 177 kg per capita of food waste and is
estimated at 7 kg per capita per week of food waste.
In 2011, South African households spent 22% on food (Bureau of Market Research
(BMR), 2012). The study conducted by Nahman et al. (2012) estimated that the total cost
to South African society associated with food waste-related problems is approximately
R21.7 billion per annum. Ramukhwatho et al. (2014) conducted a study on household food
waste in Mamelodi and the study showed that 82% of the households interviewed wasted
food and threw away an average of one bag per week (24 kg).
The main reasons why Mamelodi households in South Africa throw away food are past
best before date, food residue, special offers and preparing food in excess of needs
(Ramukhwatho et al., 2014). Although cereals, milk, oilseed, fish, bread, fruit and
vegetables are wasted by South African households, fruit and vegetables are mostly wasted
(Oelofse & Nahman, 2013).
2.8 Household awareness on food waste
Awareness plays an important role in changing households’ attitudes towards food waste.
Lyndhurst (2007) states that awareness is one of the main aspects of understanding
consumers’ behaviours towards food waste. The survey by Parizeau et al. (2015) found
that food waste is caused by household attitude towards food, belief and lifestyle. The
authors also observed that food waste awareness influences food waste production. When
raising environmental awareness, it is alleged that it changes the way in which people
think about food waste and they start to understand its consequences. People start to see
food waste as wasted resources, not as just rubbish, and this mentality helps people to
reduce food waste (Gregson et al., 2010). Though environmental concerns have been
raised, only 20% of UK households’ express environmental concerns regarding food waste
(Borisova, 2013).
Studies by Stefan (2011) and Borisova (2013) tested the impact of environmental
awareness with the intention to avoid food waste in Romania and Denmark, respectively.

27
Both countries showed differences because the Danes directly linked awareness with
behaviour, whereas Romanian behaviour towards food waste was unaffected by
awareness. Imparting awareness through community education goes a long way in
educating the public about the importance of food waste management. There are several
ways in which the public is alerted about food waste avoidance. For example, the
European and UK awareness campaigns cut across the following topics of awareness: i)
Love Food Hate Waste, ii) Stop Spid af mad (Stop Wasting Food Movement), iii) Last
Minutes Market and iv) the Food Use for Social Innovation by Optimizing Waste
Prevention Strategies (FUSIONS). The outcomes of these campaigns are summarised in
Table 2.1.
Table 2.1: Outcomes of selected food waste awareness campaigns in the UK and Europe
Launched by
Country
Awareness
Outcome
WRAP (2007a) UK Love Food Hate
Waste
13% food waste reduction
Selina Juul (2008) Denmark Stop Spid af mad Reduced food packaging
by 25%
Prof Andrea Segre
(2008)
Italy Last Minutes
Market
Developed media system
to reach households
European Union
(EU) (2011)
EU FUSIONS Targeted to reduce 50%
food waste and 20% food
chain resources
The Love Food Hate Waste campaign was launched in 2007 and is managed by WRAP in
the UK (WRAP, 2007a). The aim of this campaign is to encourage behaviour change and
to raise consumers’ awareness of the economic and environmental consequences of food
waste. The Love Food Hate Waste campaign advises households on how to plan their
meals, store food correctly, interpret food labelling and make use of leftovers. This
campaign results in a saving of £296 million a year and 137 000 tons of food waste are no
longer thrown away because 1.8 million UK households have started reducing food waste

28
that they used to throw away. WRAP (2008) indicates that 84% of UK citizens still feel
that they do not waste food.
The Stop Spid af mad (Stop Wasting Food Movement) awareness campaign was launched
by Selina Juul in 2008 in Denmark (Juul, 2008). The aim of the campaign is to raise public
awareness about food waste and to reduce food waste in Denmark. According to a study
conducted in Denmark (Juul, 2008), 48% of Danes believed that they did not waste food.
This campaign has managed to introduce “doggy bags” in Danish restaurants and to reduce
food packaging by 25%, which has inspired Danish retail chain Rema 1000 to drop all
quantity discounts in the chain’s 200 plus Danish stores. The Stop Wasting Food
Movement aims at reducing food waste by 50% in 2025.
The Last Minutes Market campaign was launched by Prof Andrea Segrè in 2008 in Italy
(Segrè, 2008). The aim of the campaign is to raise awareness in Italy and Europe of why
people waste food and the impacts of food waste. This campaign promotes a civil and
scientific culture to find ways to reduce food waste. The Last Minutes Market initiative has
developed a resourceful and operational management system through media (TV, radio
and newspaper) (Segrè, 2008).
The FUSIONS campaign was launched by the EU in 2011 and is funded by the European
Commission framework programme 7 (EU, 2011). The aim of the initiative is to reduce
food waste by responsible use of resources in an efficient way. The target is to reduce 20%
food chain resources and 50% food waste by 2020 (EU, 2011).
There is not much that has been done in South Africa by the government regarding food
waste reduction, especially at household level. Although there are a small number of waste
management companies in South Africa that are also involved in food waste campaigns,
their focus is more on other waste materials rather than food waste and they are not
national initiatives. Mohamed Kajee (3SMedia, 2012) estimated that in 2012 between 12
and 14 million people in South Africa were food insecure. Food Bank South Africa
attempts to save 6 000 tons of food annually by donating food nearing expiry (food
surplus) to those in need (3SMedia, 2012).
The South African government initiated the National Organic Waste Composting Strategy
in 2013 to divert organic waste from landfills by promoting composting. Currently the
government is working on implementing this strategy on the basis of the provisions of the

29
National Environmental Management: Waste Act, 2008 (Act No. 59 of 2008), as well as
the National Waste Management Strategy, 2011. The strategy’s target is to divert 25% of
recyclables from landfills by 2016 (DEAT, 2014). It is hoped that specifically food waste
will be addressed in implementation.
2.9 Conclusion
From the literature it was found that different authors define food waste differently
(DEFRA, 2010). The different definitions of food waste were outlined in this chapter.
Reasons for food waste were identified to be in terms of gender, age, highest qualification,
household size, income categories and disposal methods employed by households. Food is
wasted in all stages of the supply chain, from agriculture to food processing and retail to
consumption, as seen in Figure 2.2, and the causes of food waste differ at each stage of the
food supply chain (Papargyropoulou et al., 2014; Göbel et al., 2015). A large amount of
food wasted is from households (Baker et al., 2009; Koivupuro et al., 2012). When food is
wasted, the resources used during the production of those foods are wasted (Oelofse &
Nahman, 2013).
The literature reviewed in this chapter reveals that the problem of food waste is a global
issue which is being experienced by both developed and developing countries (Gustavsson
et al., 2011). Environmental and socio-economic impacts caused by food waste are a
global problem which is growing, costing money and consuming resources (Payne, 2014).
The conclusion is that if food waste is dealt with at the source, the amount of food waste
that ends up at landfills can be minimised and the amount of methane produced can be
reduced. In the opinion of Madubula and Makinta (2012), composting is an alternative way
to divert food waste from landfills and that will be a feasible substitute for South Africa,
because of its high recyclable waste content.
The FAO (2013) further explains that when food is wasted there is biodiversity loss and a
change in climatic conditions. An increase in temperature due to high loading of
greenhouse gases to the atmosphere from, inter alia, food wasted leads to an increase in
atmospheric temperature. An increase in temperature accelerates the reduction in
biodiversity since conditions are too extreme for organisms to adapt (Bellard et al., 2012).

30
CHAPTER 3: RESEARCH DESIGN AND METHODOLOGY
3.1 Introduction
This chapter outlines the methodological framework applied in this study. Sampling
methods are presented and a description is provided of the study area. The research design,
research methodology, data collection and data analysis are discussed, followed by quality
control on how data was entered and validated. Pilot testing of the questionnaire and
ethical considerations are also addressed. Limitations of the study are then identified.
3.2 Sampling
This study was conducted in the CTMM. A total of 250 households were identified and
persons responsible for preparation of food in their houses were recruited, appointments
were made and interviews were conducted accordingly. Out of 250 households, the
questionnaires of only 210 households were analysed because they met the standard of
storing waste for three weeks. To quantify the amount of food waste that is being
generated in households, food waste was collected using disposal plastic bags and weighed
on a kitchen scale. It was collected from the households on a weekly basis. The data was
entered in Microsoft Excel spreadsheets to be analysed. There are two methods of
sampling: one yields probability samples in which the probability of selection of each
respondent is assured and the other yields non-probability samples in which the probability
of selection is unknown (Polit & Hungler, 1995). In this study the researcher used a
convenience sampling method of the non-probability sampling design to select the study
areas. This method was selected because it offers easy access to the respondents.
According to Cooper and Schindler (2006), convenience sampling is the purest form of
probability sampling and is simple to apply.
3.3 Description and demography of the study area
The study was limited to five areas as the targeted population in the CTMM, as shown in
Figure 3.1, because of the accessibility of different income groups.

31
Figure 3.1: CTMM map with study areas (Source: field map)
3.3.1 Description of the study area
Generally it has been shown that there is no correlation between income level and food
wastage (Wenlock & Buss, 1977), while Skourides et al. (2008) indicate that income has
an influence on the amount of household food waste. This study focused on assessing
household food wastage with the aim to determine, inter alia, where food is generated the
most in terms of geographical area and wealth (Statistics South Africa, 2001). Purposive
sampling, which is a type of non-probability sampling method, was used to select the study
area (Leedy & Ormrod, 2009). These areas were purposely selected (i) to attain the view of
residents in suburb and township households regarding the issue of food waste in terms of
the income levels in this geographical area and (ii) to compare the difference between the
different suburbs and townships in terms of food waste generation.
Atteridgeville Ext 6, 16 and 17 and Olievenhoutbosch Ext 36 were purposely selected in
the sample because they are typical townships with well-arranged streets and modern
houses in low-income areas. These townships are widely expanded into the scattered

32
informal settlements. Montana Park, Silver Lakes Golf Estate and Lyttelton were
purposively selected to assess suburbs with townhouses, flats and estate houses in
medium- and high-income areas (Statistics South Africa, 2011b).
The study was conducted in the CTMM, in the northern part of Gauteng; it is one of the
country's capital cities, serving as the administrative capital (Cram101Textbook Reviews,
2012). The area is relatively flat with an extended built-up area. Proctor (2000) defines
population as the total group of people or elements about which information is needed. The
population of the CTMM stood at 2 921 488 in 2011. This figure is due to a high birth rate
and rural-urban migration from nearby townships (Statistics South Africa, 2011a).
The CTMM consists of five different municipality regions, namely region 1 (North West),
region 2 (Central Northern), region 3 (Central), region 4 (South West) and region 5 (North
East), and there are low-, middle- and high-income people or families in all of these
regions (Statistics South Africa, 2011b). The areas were selected as representative of each
of the five municipal regions. The study area included suburbs and townships of the
CTMM namely, Atteridgeville Ext 6, 16 and 17 from the central western region, Montana
Park from the north-eastern region, Silver Lakes Golf Estate from the eastern region and
Lyttelton (in Centurion) and Olievenhoutbosch Ext 36 covering the southern region.
3.3.2 Household income
Hamann and Horn (2014) indicate that the CTMM is divided into three household income
classes, namely low-income group, middle-income group and high-income group. In this
study the people living in Atteridgeville 6, 16 and 17 and Olievenhoutbosch Ext 36 are
considered to be low income groups, whereas people in Montana Park and Centurion
(Lyttelton) are considered to be middle-income groups (Hamann & Horn, 2014). Silver
Lakes Golf Estate is generally considered to be high-income area.
Table 3.1 shows the income for household weighted (Statistic South Africa, 2011b).
Atteridgeville Ext 6, 16 and 17 had the highest number (5 299) of people with no income
whereas Montana had the lowest number (1 573) of people with no income. Additionally,
Silver Lakes Golf Estate had the highest number of people with an income of R2 457 601
and more, while Atteridgeville had no one with an income of R2 457 601 and more.

33
Table 3.1: Geography by income category for person adjusted (Statistics South Africa, 2011b)
Geographical area No
income
R1
to R4
800
R4
801
to
R9
600
R9 601
to
R19 600
R19
601 to
R38
200
R38 201
to
R76 400
R76 401
to
R153 800
R153 801
to
R307 600
R307 601
to
R614 400
R614 001
to
R1
228 800
R1 228
801 to
R2
457 600
R2 457 601
or more
Montana Park 1 575 49 70 256 344 392 819 931 593 217 28 30
Silver Lakes Golf
Estate
2 339 24 24 137 366 194 359 569 656 561 185 83
Atteridgeville Ext 6,
16, 17
5 299 844 298 770 1177 940 518 121 26 1 3 0
Centurion Lyttelton 3 048 119 138 542 824 1 041 1 560 1 653 924 272 74 59
Olievenhoutbosch
Ext 36
5 137 1 620 392 1 314 2 187 1 090 684 473 97 7 14 3

34
Table 3.1 is also supported by the BMR (2012), which reports that South African
households in the highest income group earn an average of over R2 million per annum (see
Table 3.2). The poor class, according to Table 3.2, has an income of R0 - R54 344 per
annum and the upper-middle class has an income of R631 121 - R863 906 per annum.
According to Cameron and Krynauw (2001), low-income households have a monthly
income of R3 000 or less, middle-income households have a monthly income of R3 001 -
R 9 999 and high-income households have an income of R10 000 or more. The method
Cameron and Krynauw (2001) used to classify households by income level was adopted in
this study; households were classified in terms of the level of income.
Households with an income ranging from R500 - R5 000 were classified as the low-
income class, those with an income of R6 000 - R9 000 per month fell into the middle
class and the last class was the higher income with a monthly income over R10 000 per
month.
Table 3.2: Distribution of household income by income group (BMR, 2012)
Class categories Annual income
Poor R0 - R54 344
Low emerging middle class R54 345 - R151 727
Emerging middle class R151 728 - R363 930
Realised middle class R 363 931 - R631 120
Upper-middle class R631 121 - R863 906
Emerging affluent class R863 907 - R1 329 844
Affluent class R1 329 845 or more
3.3.3 Demography
This section will outline the five areas in the CTMM as shown in Figure 3.1 in terms of
demography.
Atteridgeville is a township in the west of the CTMM. The population of Atteridgeville is
64 425 residents. The study was conducted only in Atteridgeville Ext 6, 16 and 17. The
total population of these extensions is 11 449 residents, with 49% males and 51% females
(Statistics South Africa, 2011a). Statistics South Africa (2011b) places the majority of
35
people who are living in Atteridgeville Ext 6, 16 and 17 in the low-income group. Many
people living in Atteridgeville Ext 6, 16 and 17 are black Africans (99.34%), followed by
other foreign races (0.48%), coloureds (0.11%), Indians or Asians (0.04%) and whites
(0.03%).
Centurion is a suburb located in the south of Tshwane. The population of Centurion is
2 365 80 residents. The study was conducted in Lyttelton, which is a suburb in Centurion
with a population of 12 372 residents, with 48.34% males and 51.67% females (Statistics
South Africa, 2011b). Statistics South Africa (2011b) places Lyttelton in the middle-
income group. The majority of people living in Lyttelton are whites (72.40%), followed by
black Africans (21.40%), Indians/Asians (2.62%), coloureds (2.60%) and other foreign
races (0.99%).
Montana is a suburb in the north-east of Tshwane, and it lies in the foothills on the north
face of Magaliesberg. Montana Park has a population of 6 717 residents, with 49% males
and 51% females (Statistics South Africa, 2011b). Statistics South Africa (2011b) places
Montana Park in the middle-income group. The majority of the people who are living in
this area are whites (68.53%). Black Africans constitute 27.57% of the residents,
Indians/Asians 1.55%, coloureds 1.24% and foreigners 1.13%.
Silver Lakes Golf Estate is a suburb in the east of Tshwane with a population of 5 899
residents, with 46.97% males and 53.03% females (Statistics South Africa, 2011b).
Statistics South Africa (2011b) places Silver Lakes Golf Estate in the higher-income
group. The majority of people who are living at Silver Lakes Golf Estate are whites
(78.11%), followed by black Africans (16.10%), Indians/Asians (2.76%), coloureds
(1.31%) and other foreign races (1.70%).
Olievenhoutbosch is a suburb dominated by black people, situated in the southern part of
Midrand. The population of Olievenhoutbosch is 70 863 residents. The study in
Olievenhoutbosch was conducted at Ext 36 which has a population of 14 365 residents,
with 52.51% males and 47.49% females (Statistics South Africa, 2011b). Statistics South
Africa (2011b) places Olievenhoutbosch Ext 36 in the low-income group. The majority of
people who are living in Olievenhoutbosch Ext 36 are black Africans (99.09%), followed
by coloureds (0.58%), Indians/Asians (0.13%), whites (0.08%) and other foreign races
(0.11%).

36
3.4 Research design
A quantitative, descriptive research design was chosen to give a descriptive analysis of the
research that was done in selected areas in the CTMM households. Quantitative research
places emphasis on the use of a structured questionnaire (Hair et al., 2008) as an effective
instrument. The foundation of research and theory making relies on epistemology and
ontology. These are both branches of philosophy that try to explain the existence of an
entity or something (Guba & Lincoln, 1994).
Epistemology is defined as the research of philosophy which is concerned about how
individuals determine the truth (Streubert & Carpenter, 2003). Epistemology inquires as to
the nature of the get-together between the knower (the inquirer) and the known (or
knowable) (Guba & Lincoln, 1994). The study conducted in the epistemological dimension
is regarded as the pursuit of valid truth (Mouton, 1998). The epistemological situation of
the researcher is that the researcher believes that all knowledge is constructed through a
meaning-making process in the mind of the knower (Daly, 2007).
For this study this was challenging because the study dealt with human beings and their
perception of food waste practices.
3.5 Research methodology
A structured questionnaire was adopted (Annexure A) as the data collection method for
assessing household food wastage in the CTMM area and data was collected using a face-
to-face approach and also by weighing collected food waste. According to Babbie et al.
(2001), a questionnaire is the appropriate method for collecting survey data in studies in
which the objective is to obtain information from the respondents about their demographic
data, behaviour, opinions and attitude. Although there are established questionnaires used
for similar studies in developed countries, the questionnaire used for this study was
customised to local conditions and approved by UNISA. The questionnaire was chosen
because: (i) it was easy to minimise non-response and maximise the quality of data
collected; (ii) the presence of the interviewer made it easier for the respondent to either
clarify answers or ask clarification of the questions on the questionnaire without researcher
bias (Cohen et al., 2000).
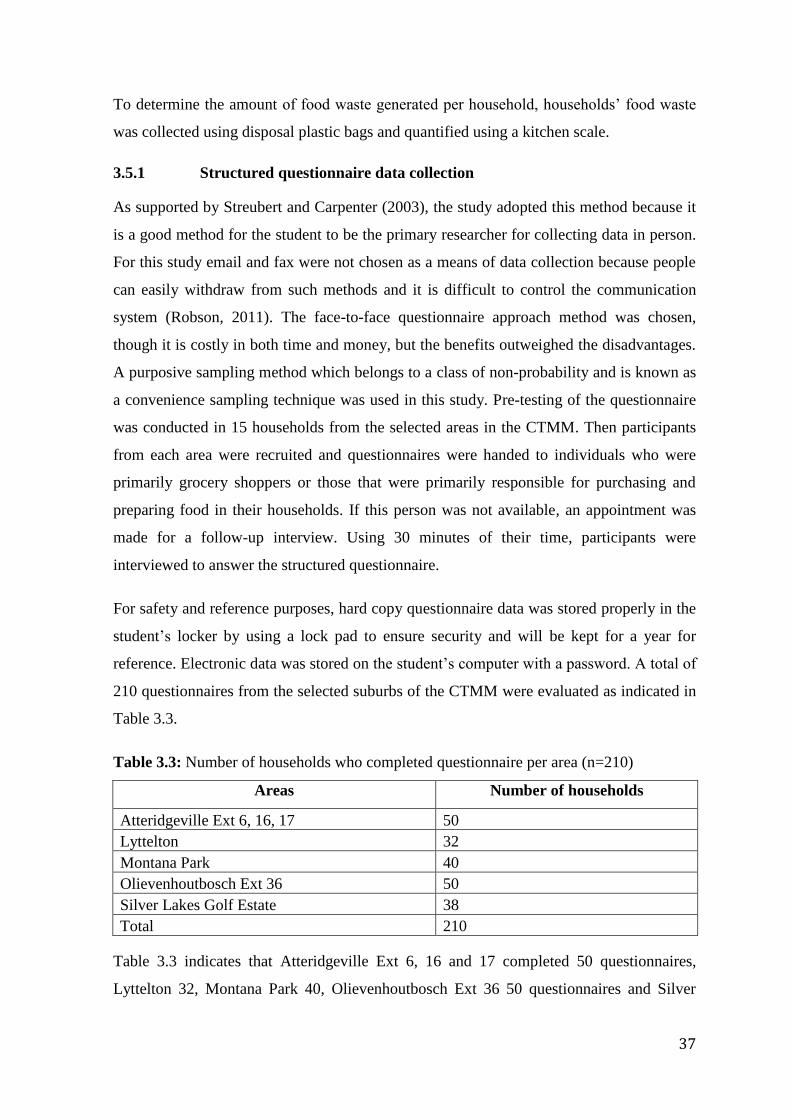
37
To determine the amount of food waste generated per household, households’ food waste
was collected using disposal plastic bags and quantified using a kitchen scale.
3.5.1 Structured questionnaire data collection
As supported by Streubert and Carpenter (2003), the study adopted this method because it
is a good method for the student to be the primary researcher for collecting data in person.
For this study email and fax were not chosen as a means of data collection because people
can easily withdraw from such methods and it is difficult to control the communication
system (Robson, 2011). The face-to-face questionnaire approach method was chosen,
though it is costly in both time and money, but the benefits outweighed the disadvantages.
A purposive sampling method which belongs to a class of non-probability and is known as
a convenience sampling technique was used in this study. Pre-testing of the questionnaire
was conducted in 15 households from the selected areas in the CTMM. Then participants
from each area were recruited and questionnaires were handed to individuals who were
primarily grocery shoppers or those that were primarily responsible for purchasing and
preparing food in their households. If this person was not available, an appointment was
made for a follow-up interview. Using 30 minutes of their time, participants were
interviewed to answer the structured questionnaire.
For safety and reference purposes, hard copy questionnaire data was stored properly in the
student’s locker by using a lock pad to ensure security and will be kept for a year for
reference. Electronic data was stored on the student’s computer with a password. A total of
210 questionnaires from the selected suburbs of the CTMM were evaluated as indicated in
Table 3.3.
Table 3.3: Number of households who completed questionnaire per area (n=210)
Areas Number of households
Atteridgeville Ext 6, 16, 17 50
Lyttelton 32
Montana Park 40
Olievenhoutbosch Ext 36 50
Silver Lakes Golf Estate 38
Total 210
Table 3.3 indicates that Atteridgeville Ext 6, 16 and 17 completed 50 questionnaires,
Lyttelton 32, Montana Park 40, Olievenhoutbosch Ext 36 50 questionnaires and Silver
38
Lakes Golf Estate 38. The aim of overall 50 interviews per suburb could not be attained
due to a lack of willing participants and time constraints.
The survey was carried out between mid-April and November 2014 on a continuous basis
stretching over different seasons to get a reliable average. Winter and summer were
therefore not compared, but included. Data was collected on weekends and holidays (e.g.
Saturdays and holidays between 11:00 and 17:00 and Sundays from 14:00 until 17:00).
3.5.2 Food waste data collection
Households were asked to separate and store food waste for a period of three weeks and
they were told that the researcher would collect their food waste on a weekly basis.
Although 133 respondents indicated on the questionnaire that they wasted food, there were
challenges to weigh all 133 households’ waste. Instead, food waste was weighed only from
123 households. Reasons for this were that ten households could not store their waste for
the whole week; households could not store their waste for all three weeks and could only
store it for less than a week. The food waste stored for less than a week, three or four days
or only two weeks was therefore not included.
The researcher used brown plastic bags (Figure 3.2) which were marked per area to collect
food waste in the five selected areas of the CTMM. These were taken to a central place at
Pretoria CSIR Laboratory.

39
Figure 3.2: Brown plastic bags with food waste (Source: Field picture)
The researcher weighed food waste from five different selected areas in the CTMM in a
central place (Pretoria CSIR Laboratory) using a mechanical kitchen scale, which is a
stainless steel bowl and measures up to 5 kg (Figure 3.3). The mechanical kitchen scale
was used because it was available to the researcher; the scale was calibrated using
calibration weights. A cell phone camera was used to take food waste pictures when
weighing.

40
Figure 3.3: Food waste weighed using mechanical kitchen scale (Source: Field picture)
3.5.3 Personal protective equipment during sampling
In terms of the Occupational Health and Safety Act 85 of 1993, section 8(2)(d) states that
any employee working in a situation where they may be exposed to risk or potential risk is
required to wear personal protective equipment (PPE) in order to protect their health and
safety and provide the necessary means to apply such precautionary measures. This Act
lists the PPE that may be required. For health and hygiene reasons, the following PPE was
used at all times: gloves for handling food waste, facemasks for smelly food waste and a
lab coat to protect the researcher’s clothing during the weighing period.
3.6 Data analysis
Data in this study was validated, entered and cleaned before analysis was done as quality
control (Cant et al., 2005). This will be explained in section 3.7. Data analysis for this
study included descriptive statistics (description of data and summarising of raw data
(Taylor, 2002)) using Microsoft Office Excel 2010, which makes use of tables, graphs and
percentages, and the chi-square statistical test. This program was used to assess socio-
economic profiles of households, such as income, level of education and behaviour of
participants towards food waste from each selected area of the CTMM as quantitative
analysis (Poate & Daplyn, 1993). To find the average amount of household food waste per
week, the amount of food wasted by all households was added up, then divided by the
amount of numbers in the set (how many numbers there were).
41
The chi-square test is a test that is often applied to categorical data, i.e. data that is grouped
into categories, which may or may not be ordered, and for which the number of
occurrences within each category is counted or expressed as a proportion of the total. (For
categorical data, the data is recorded as a category, as opposed to numerical data that is
recorded as measurements, which could, for example, be averaged for different groups in
the data). The chi-square test determines whether differences in proportions between
groups may be attributable to random differences between the groups or whether they
represent a consistent, non-random pattern of differences.
The chi-square test uses the chi-square probability distribution (χ2) to calculate the
probability value (or p-value). Such probability values could be calculated using pivot
tables and the chi-square. The test function in Excel or a statistical software package can
be used for this. In this study, the statistical software SAS was used to apply the chi-square
test and determine the relevant p-values.
3.7 Quality control
3.7.1 Data entry
Data entry is a process of transferring information from any acceptable data collection
instrument into the computer before it is analysed (Roberts-Lombard, 2002). The
researcher entered data into Microsoft Office Excel 2010 before it was analysed.
3.7.2 Data cleaning
Data cleaning is a crucial process that needs to be taken into consideration before
analysing data, especially in cases like in this study, where data entry was done manually.
A thorough data cleaning process was done by double checking before analysis to
eliminate errors.
3.7.3 Errors
Errors in this study were dealt with according to Babbie and Mouton (2002), which
involves the following: i) Using structured questionnaires where the researcher and
respondents had direct contact; ii) Repeated visits to the respondents by the researcher; iii)
Carefully constructing and pre-testing the questionnaire that was used to collect primary
data; and iv) Removing sensitive questions from the questionnaire.
42
3.7.4 Pre-testing
Questionnaire was pre-testing by 15 respondents (N=15) from the selected areas in the
CTMM with similar characteristics to the research sample before the questionnaire was
used to collect data. All 15 participants responded that the questionnaire was simple, easy
to understand, clear and straightforward. Therefore no adaptations were needed.
3.7.5 Reliability
The researcher ensured reliability by carefully phrasing all the questions in the
questionnaire to avoid vagueness and did not guide the respondents to a specific answer.
Respondents were informed of the purpose of the study and the need to respond truthfully.
The fact that open-ended questions were minimised in the questionnaire also enhanced the
reliability of the study.
3.8 Ethical considerations, consent form and questionnaire pilot testing
The study was conducted according to UNISA’s Policy on Research Ethics, in particular
part 2 “Guidelines for research involving human participants” (UNISA, 2007). Permission
to conduct the study in the CTMM from the Executive Director: Waste Management
Division, Ms Faith Mabindisa, was obtained before the pilot study (see Annexure B) and
ethical approval was also obtained from UNISA (see Annexure C). The consent form was
used as an introduction section at the beginning of the questionnaire, and it explained to
respondents the motivation for the study, emphasised that households’ responses were
confidential and explained the use of the cell phone camera (Annexure D).
Respondents in the pilot and actual studies were requested to sign a written consent form
(see Annexure D). Fifteen respondents (N=15) from the selected areas in the CTMM with
similar characteristics to the research sample, who were not part of the main study, were
included in the pilot study. Respondents of the household food wastage pilot and actual
study were assured of the anonymity and confidentiality of their feedback and participation
in the pilot study. Pilot testing of the questionnaire was conducted in order to identify and
eliminate questions that could cause problems for the respondents (Sattari, 2007). Pilot
participants responded that the questionnaire was simple and easy to understand. They
agreed that the questions were clear and straightforward. Time for completing each
questionnaire was assessed. This ensured the validity and reliability of the study.
43
The questionnaire was written and conducted in English, although for Olievenhoutbosch
Ext 36 and Atteridgeville Ext 6, 16 and 17 respondents the researcher translated questions
into tsotsitaal (a mixture of languages such as Afrikaans, Sesotho, English and isiZulu) for
better understanding and comfort in the process of responding to the questionnaire.
3.9 Limitations
There were a number of limitations concerning the data collection; due to limited time and
financial constraints, the sample of the survey was restricted to five areas in the CTMM.
Since this study was limited to one municipality, it is not possible to generalise the
findings to the whole of South Africa. The study assessed food waste at household level
only, although household food waste is not the only source of waste that is affecting the
CTMM. This study did not take into account edible food waste disposed of down the sink,
composted or fed to pets, but focused only on food that ends up in the household garbage
bin and removed by the municipal waste service. 16% of the households had defensive
attitudes, which made it difficult to access their information. Accessibility of people who
were responsible for food preparation or grocery was difficult. Although an appointment
was made, still there were households not available to take part in this study. Nearly all of
the household members thought that by responding to the household food waste
questionnaire, the researcher would earn a great deal of money and so they wanted to be
compensated, even though it was explained to them that this was a master’s study project
for the researcher’s dissertation. Other households were concerned that by responding to
the questionnaire, their personal details would be given to salespersons who could call
them. Access to households in Montana Park, Silver Lakes Golf Estate and Lyttelton was
difficult because of the security measures applied by gated communities. This resulted in
obtaining most of the results from Atteridgeville Ext 6, 16 and 17 and Olievenhoutbosch
Ext 36. The weighing part of food waste was a major challenge for the researcher and
delayed the study because households were not cooperative. Although the period of the
study overextended over two different seasons, data for two seasons was not compared
since it was outside the scope of the study.
3.10 Conclusion
The methods and materials used were deemed suitable for answering the five research
questions that needed to be assessed. This chapter has presented an outline of the study

44
area, research design and methodological framework conducted in this study. The process
of data collection and data analysis was discussed in detail, and a brief description was
given of study quality control. Limitations of the study were then identified.

45
CHAPTER 4: INTERPRETATION AND DISCUSSION OF RESULTS
4.1 Introduction
In Chapter 3, the study procedures were established and clarified. Appropriate procedural
concerns such as study area and household selection, and the data collection procedure
were deliberated. Fifty (24%) of the completed questionnaires were returned from
Atteridgeville and Olievenhoutbosch, while 40 (19%) were returned from Montana, 38
(18%) from Silver Lakes and 32 (15%) from Centurion. The study intended to collect 250
completed questionnaires, but only 210 were completed and collected, attaining a total
response rate of 84%. Although lower than the target of 100%, this number was still
sufficient to draw valid conclusions from the data analysis (Sridharan et al., 2006).
In this chapter a detailed discussion is given on the results obtained from administering the
questionnaire. Data on the amount of food waste that is being generated in household using
a kitchen scale is also discussed accordingly.
4.2 Demographics
Demographics is the study of the activities and other characteristics of a population in
terms of statistics (Rouse, 2005), such as gender, age, education and income. Demographic
factors are important in assessing who to survey and how to analyse survey responses into
meaningful data and they are essential for determining if the study individuals are a
representative sample of the target population for generalisation purposes (Wyse, 2012).
Although the demographic profile was not part of this study objective, it provides an
interesting issue that it is important to let know people how demographics influence people
to waste food. The demographic profile of the respondents from each of the five
geographic areas covered gender, age, education, household size and monthly income,
provided as a summary in Annexure E.
4.2.1 Gender of respondents responsible for food
The number of female and male respondents is discussed in percentages.

46
Male42%
Female58%
Gender of respondents
Figure 4.1: Gender of respondents (n=210)
Figure 4.1 shows that there were more female (58%) than male (42%) respondents in this
study. The sample is a good representation of Tshwane’s population which has more
women (51.3%) than men (48.7%) (Statistics South Africa, 2011b). A survey by the World
Food Programme (2013) shows that women take all responsibility in the household for
grocery shopping and they are still primarily responsible for cooking. Women are therefore
more cautious in their interpretation of the safety of food than men (World Food
Programme, 2013).
4.2.2 Age range
In this section the age range is discussed in terms of geographical area. The graph depicts
that the majority of the respondents were aged 21 - 30 years (43%), as referred to in
Annexure E. This may be due to Tshwane having 65% of residents between the ages of 20
and 29 (Statistics South Africa, 2011b). This was followed by 31% respondents 31 - 40
years old, 14% respondents 41 - 50 years old and 8% of respondents aged 51 - 60 years
old, as referred to in Annexure E. The age groups of 61 - 70 years (2%) and 70+ years

47
(1%) had the lowest number of participants, as referred to in Annexure E in this study. It
must be emphasised that the results represent the findings of this study.
21-30 31-40 41-50 51-60 61-70 70+
2713
4 3 1 2
28
16
3 3
7
15
116
1
15
9
7
1
14
13
5
4
2
Age range
Respondents' age by geographical area
(n=210)Atteridgeville Ext 6, 16, 17 Olievenhoutbosch Ext 36Montana Park LytteltonSilver Lakes Golf Estate
Figure 4.2: Age range percentages by geographical area (n=210)
As seen in Figure 4.2, the study shows that the majority of the respondents aged 21 - 30
were from Olievenhoutbosch Ext 36 (56%), (n=28). This result is in line with Statistics
South Africa (2011b), which indicates that Olievenhoutbosch has more residents aged 21 -
30. Olievenhoutbosch Ext 36 had the highest number of respondents aged 31 – 40 years
old at 32% (n=16). Respondents in the 41 - 50 years age range amounted to 28%, (n=11),
while 15% (n=6) in the 51 - 60 years age range were from Montana Park. The study
showed that 5% (n=2) of the respondents aged 61 - 70 years were from Silver Lakes. The
wastage of food in terms of age of respondents will be discussed later under section 4.7.2.
4.2.3 Highest qualification
More than 90% of respondents had some form of education (e.g. matric, diploma and
degree), while only 1% were unschooled (no form of education, no certificates). 31% of
the respondents had acquired matric (Grade 12) as their highest qualification level. This is
in line with Statistics South Africa (2011b), which indicates that 34% of Tshwane’s
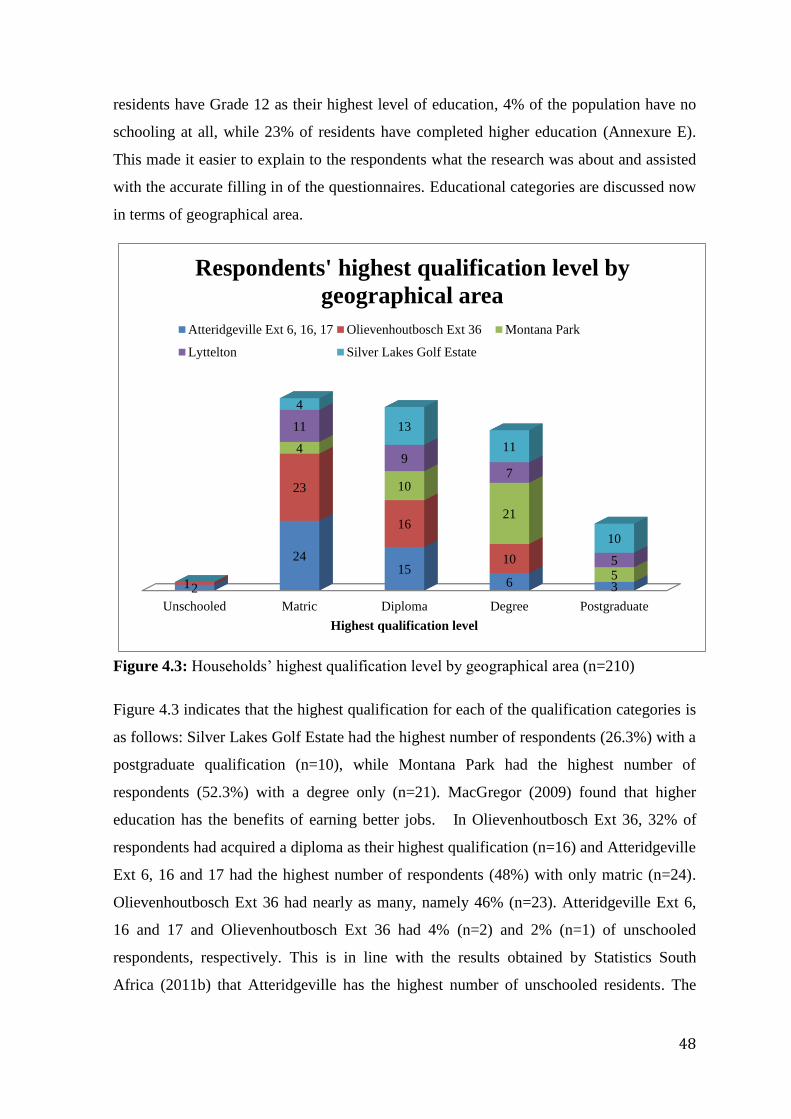
48
residents have Grade 12 as their highest level of education, 4% of the population have no
schooling at all, while 23% of residents have completed higher education (Annexure E).
This made it easier to explain to the respondents what the research was about and assisted
with the accurate filling in of the questionnaires. Educational categories are discussed now
in terms of geographical area.
Unschooled Matric Diploma Degree Postgraduate
2
2415
6 31
23
16
10
4
10
21
5
11
97
5
4
13
11
10
Highest qualification level
Respondents' highest qualification level by
geographical area
Atteridgeville Ext 6, 16, 17 Olievenhoutbosch Ext 36 Montana Park
Lyttelton Silver Lakes Golf Estate
Figure 4.3: Households’ highest qualification level by geographical area (n=210)
Figure 4.3 indicates that the highest qualification for each of the qualification categories is
as follows: Silver Lakes Golf Estate had the highest number of respondents (26.3%) with a
postgraduate qualification (n=10), while Montana Park had the highest number of
respondents (52.3%) with a degree only (n=21). MacGregor (2009) found that higher
education has the benefits of earning better jobs. In Olievenhoutbosch Ext 36, 32% of
respondents had acquired a diploma as their highest qualification (n=16) and Atteridgeville
Ext 6, 16 and 17 had the highest number of respondents (48%) with only matric (n=24).
Olievenhoutbosch Ext 36 had nearly as many, namely 46% (n=23). Atteridgeville Ext 6,
16 and 17 and Olievenhoutbosch Ext 36 had 4% (n=2) and 2% (n=1) of unschooled
respondents, respectively. This is in line with the results obtained by Statistics South
Africa (2011b) that Atteridgeville has the highest number of unschooled residents. The
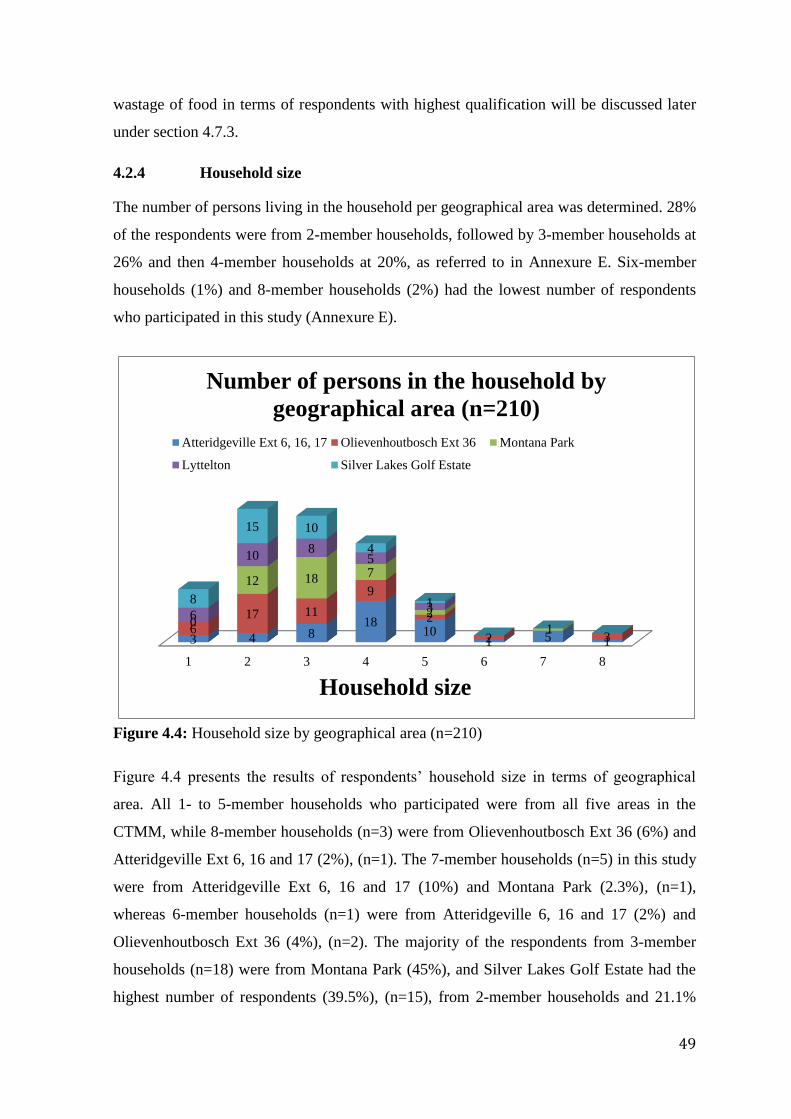
49
wastage of food in terms of respondents with highest qualification will be discussed later
under section 4.7.3.
4.2.4 Household size
The number of persons living in the household per geographical area was determined. 28%
of the respondents were from 2-member households, followed by 3-member households at
26% and then 4-member households at 20%, as referred to in Annexure E. Six-member
households (1%) and 8-member households (2%) had the lowest number of respondents
who participated in this study (Annexure E).
1 2 3 4 5 6 7 8
3 4 818
101 5 1
617 11
9
2
2 30
12 18 7
2
16
108
5
38
15 10
4
1
Household size
Number of persons in the household by
geographical area (n=210)
Atteridgeville Ext 6, 16, 17 Olievenhoutbosch Ext 36 Montana Park
Lyttelton Silver Lakes Golf Estate
Figure 4.4: Household size by geographical area (n=210)
Figure 4.4 presents the results of respondents’ household size in terms of geographical
area. All 1- to 5-member households who participated were from all five areas in the
CTMM, while 8-member households (n=3) were from Olievenhoutbosch Ext 36 (6%) and
Atteridgeville Ext 6, 16 and 17 (2%), (n=1). The 7-member households (n=5) in this study
were from Atteridgeville Ext 6, 16 and 17 (10%) and Montana Park (2.3%), (n=1),
whereas 6-member households (n=1) were from Atteridgeville 6, 16 and 17 (2%) and
Olievenhoutbosch Ext 36 (4%), (n=2). The majority of the respondents from 3-member
households (n=18) were from Montana Park (45%), and Silver Lakes Golf Estate had the
highest number of respondents (39.5%), (n=15), from 2-member households and 21.1%

50
from 1-member households (n=8). Atteridgeville Ext 6, 16 and 17 had the highest number
of respondents in the 4- and 5-member household groups, at 36% (n=18) and 20% (n=10),
respectively. The wastage of food in terms of household size of respondents will be
discussed later under section 4.7.4.
4.2.5 Monthly income
The respondents’ income percentage is now discussed in terms of geographical area. The
majority of the respondents (55%) had a monthly income of over R10 000, a rather smaller
percentage (25%) received a monthly income ranging from R500 - R5 000 and 20% had a
monthly income of R6 000 - R9 000 (Annexure E). The difference in income in terms of
who wastes less or more food will be discussed in section 4.5.
Figure 4.5: Households’ monthly income
Figure 4.5 shows that in Montana Park, the majority of the respondents (95%) had a
monthly income of R10 000+, while in Atteridgeville Ext 6, 16 and 17, 56% had a
monthly income of R500 - R5 000 and in Lyttelton, 41% had a monthly income of R6 000
- R9 000. Based on the findings of the income reported by households in this study, it can
be concluded that in relative terms Montana Park and Silver Lakes Golf Estate can be
viewed as high-income areas, Lyttelton as a middle-income area and Olievenhoutbosch
Ext 36 and Atteridgeville Ext 6, 16 and 17 as low-income areas.

51
4.3 Types of food wasted
In this section the researcher will outline the types of food wasted the most in the
households (not all food types wasted by each of the households) in terms of respondents’
geographical area, age range, highest qualification, household size and, lastly, monthly
income categories. Although only 123 respondents as measured from the questionnaire
agreed that they wasted food, when asked what type of food they wasted, 133 respondents
indicated that they wasted the types of food indicated in Table 4.1. This table shows only
four types of food wasted: pap (35%), bread (25%), rice (26%) and fruit and vegetables
(14%). This was confirmed during the food waste weighing period. The number of
respondents who wasted pap in this study was lower compared to the 58% of respondents
who wasted pap in a study conducted by Ramukhwatho et al. (2014). The percentage of
rice wasted in this study and that of Ramukhwatho et al. (2014) was the same. The 14% of
fruit and vegetables wasted in this study was lower than the 17% found in a study by
Buzby et al. (2014). Fresh fruit and vegetables were usually among the wasted items in
studies conducted in the UK and Australia by Lyndhurst (2007), WRAP (2008), Morgan
(2009) and Parfitt et al. (2010), but this was different in this study. The higher number of
respondents who wasted pap may be due to the South African population’s specific food
preferences which vary by location (Statistics South Africa, 2008) and culture.
4.3.1 Type of food wastage by geographical area
Household food waste may be spoiled cooked food, excess cooked food, vegetable and
fruit peelings, depending on the custom of people living in the area. The types of food
waste are discussed in terms of geographical percentages.
Table 4.1: Households’ type of food wasted in percentages by geographical area (n=133)
Type of food
wasted
Atteridgeville 6,
16, 17
Olievenhoutbosch
Ext 36
Montana
Park
Lyttel-
ton
Silver Lakes
Golf Estate
Total
Pap 55 83 10 18 7 35
Bread 15 9 24 41 41 25
Rice 24 4 45 18 35 26
Fruit &
vegetables
6 4 21 23 17 14
Total 100 100 100 100 100 100

52
Table 4.1 shows that the majority of people living in Atteridgeville Ext 6, 16 and 17 (55%)
and Olievenhoutbosch Ext 36 (83%) responded that they wasted pap as a daily meal; this
was determined through the questionnaire when households were asked which type of food
they wasted the most. This was also reflected in a study conducted by Ramukhwatho et al.
(2014) in Mamelodi, reporting that 58% of respondents wasted pap. It was found that in
Montana Park and Silver Lakes Golf Estate respondents wasted rice (45%) and (35%),
respectively, while respondents in Silver Lakes Golf Estate and Lyttelton wasted bread,
each at 41%. Fruit and vegetables were wasted more in Lyttelton (23%), followed by
Silver Lakes Golf Estate (17%) and Montana Park (21%). Atteridgeville and
Olievenhoutbosch Ext 36 respondents wasted less fruit and vegetables at 6% and 4%,
respectively. From the information presented in Table 4.1, households from higher income
areas eat more rice compared to lower income areas where households eat more pap.
4.3.2 Type of food wasted by age range
Because of the relatively small sample size, Excel and chi square were used to analyse the
results (chi-square results will be discussed in section 4.8). The types of food waste are
now discussed in terms of age range percentages.
21-30 31-40 41-50 51-60 61-70 70+
2749 39
20 2550
45 116
300
5024
2626
40
50
04 1429
1025
0
Age range
Type of food wasted by age range in
percentages
PAP BREAD RICE FRUIT & VEGETABLES
Figure 4.6: Type of food wasted by age range in percentages (n=133)
As indicated in Figure 4.6, rice was wasted the most by respondents aged 61 - 70 (50%).
However, 25% of respondents aged 61 - 70 wasted pap and fruit and vegetables in their
households. In the age group 41 - 50 years, 39% of respondents wasted pap and 29%
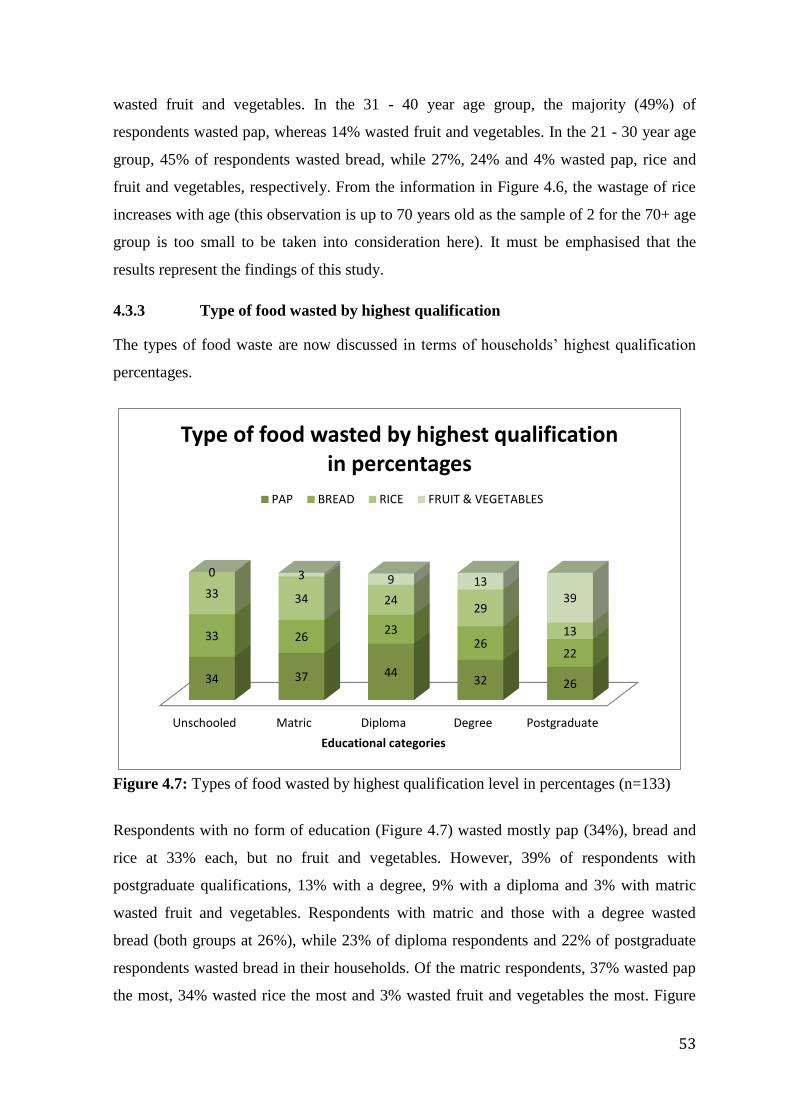
53
wasted fruit and vegetables. In the 31 - 40 year age group, the majority (49%) of
respondents wasted pap, whereas 14% wasted fruit and vegetables. In the 21 - 30 year age
group, 45% of respondents wasted bread, while 27%, 24% and 4% wasted pap, rice and
fruit and vegetables, respectively. From the information in Figure 4.6, the wastage of rice
increases with age (this observation is up to 70 years old as the sample of 2 for the 70+ age
group is too small to be taken into consideration here). It must be emphasised that the
results represent the findings of this study.
4.3.3 Type of food wasted by highest qualification
The types of food waste are now discussed in terms of households’ highest qualification
percentages.
Unschooled Matric Diploma Degree Postgraduate
34 37 4432 26
33 2623
2622
33 34 2429
13
0 3 9 1339
Educational categories
Type of food wasted by highest qualification in percentages
PAP BREAD RICE FRUIT & VEGETABLES
Figure 4.7: Types of food wasted by highest qualification level in percentages (n=133)
Respondents with no form of education (Figure 4.7) wasted mostly pap (34%), bread and
rice at 33% each, but no fruit and vegetables. However, 39% of respondents with
postgraduate qualifications, 13% with a degree, 9% with a diploma and 3% with matric
wasted fruit and vegetables. Respondents with matric and those with a degree wasted
bread (both groups at 26%), while 23% of diploma respondents and 22% of postgraduate
respondents wasted bread in their households. Of the matric respondents, 37% wasted pap
the most, 34% wasted rice the most and 3% wasted fruit and vegetables the most. Figure
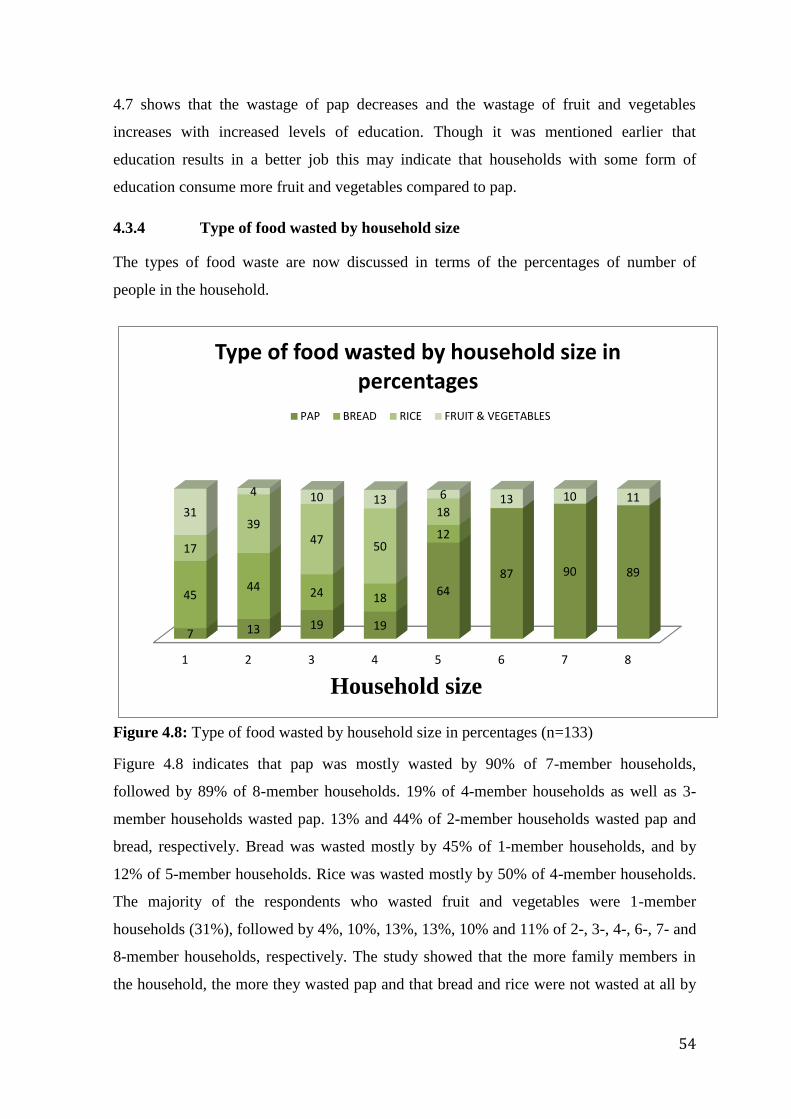
54
4.7 shows that the wastage of pap decreases and the wastage of fruit and vegetables
increases with increased levels of education. Though it was mentioned earlier that
education results in a better job this may indicate that households with some form of
education consume more fruit and vegetables compared to pap.
4.3.4 Type of food wasted by household size
The types of food waste are now discussed in terms of the percentages of number of
people in the household.
1 2 3 4 5 6 7 8
7 13 19 19
64
87 90 89
4544 24 18
1217
3947
50
1831
4 10 13 6 13 10 11
Household size
Type of food wasted by household size in percentages
PAP BREAD RICE FRUIT & VEGETABLES
Figure 4.8: Type of food wasted by household size in percentages (n=133)
Figure 4.8 indicates that pap was mostly wasted by 90% of 7-member households,
followed by 89% of 8-member households. 19% of 4-member households as well as 3-
member households wasted pap. 13% and 44% of 2-member households wasted pap and
bread, respectively. Bread was wasted mostly by 45% of 1-member households, and by
12% of 5-member households. Rice was wasted mostly by 50% of 4-member households.
The majority of the respondents who wasted fruit and vegetables were 1-member
households (31%), followed by 4%, 10%, 13%, 13%, 10% and 11% of 2-, 3-, 4-, 6-, 7- and
8-member households, respectively. The study showed that the more family members in
the household, the more they wasted pap and that bread and rice were not wasted at all by

55
6-member households and higher. Households with more family members were from low-
income areas and wasted pap more.
4.3.5 Type of food wasted by monthly income
The types of food waste are now discussed in terms of the households’ monthly income
percentages.
PAP BREAD RICE FRUIT &
VEGETABLES
4433
13 8
2933
33
4
33
18
30
19
Type of food wasted
Income category by type of food wasted
R500 - R5 000 R6 000 - R9 000 >R10 000
Figure 4.9: Type of food wasted by monthly income percentages (n=133)
With regard to wasting pap, Figure 4.9 indicates that 44% (n=16) of respondents with a
monthly income of R500 - R5 000 wasted pap the most in their households, followed by
29% (n=7) with a monthly income of R6 000 - R9 000 and then 33% (n=24) with a
monthly income of over R10 000. 33% (n=8) of respondents with a monthly income of
R6 000 - R9 000 wasted bread and rice in their households, while 33% (n=12) with a
monthly income of R500 - R5 000 wasted bread the most, followed by 14% (n=5) rice and
8% (n=3) fruit and vegetables in the same income range. Fruit and vegetables were wasted
the most by 19% (n=14) of respondents with a monthly income over R10 000.
Respondents with a monthly income of over R10 000 wasted rice 30% (n= 22) and bread
n= 13 (18%). It is clear that pap was wasted the most by respondents, followed by rice and
bread, while fruit and vegetables were wasted less.

56
4.4 Results of the reasons for food wastage
This section will outline respondents’ reasons for wasting food in terms of geographical
area, age range, highest qualification, household size and monthly income categories.
Households were asked in the questionnaire when and why they threw away food; there
was no list of reasons provided why households waste food. The researcher categorised all
the reasons given by the households. This study found that 82% of respondents were not
attracted by special offers; this was higher than was found by Ramukhwatho et al. (2014)
which was 74%.
27% of the respondents indicated that they wasted food because they bought too much
food; this percentage was higher than the 22% found in a study by Lyndhurst (2007).
While 18% of respondents showed that they wasted food because of special offers, this
was lower than the 30% of Lyndhurst’s respondents. There were only 2% of respondents
in a study conducted by Parizeau et al. (2015) reporting that they wasted food that they
bought on sale. It can therefore be concluded that special offers do contribute to food
waste, as referred to Table 4.17 in terms of income.
Table 4.2 shows that the study found that 36% of respondents wasted food because they
cooked too much food; they prepared more than what their family members could
consume. Moreover, in a study by WRAP (2008), it was also found that 31% of
respondents wasted food because too much food was prepared. Respondents in this current
study showed that they wasted food because fruit and vegetables went off (8%), food
residue (leftover from pots/cooking) (7%) and poor storage (4%).
4.4.1 Results of the reasons for food wastage by geographical area
The reasons for food wastage in terms of geographical area percentages are now discussed.
Buying too much, special offers, cooking too much, poor storage, food residue and fruit
and vegetables going off were the reasons identified for food waste in this study.

57
Table 4.2: Reasons for wasting food in percentages by geographical area (n=210)
As indicated in Table 4.2, 31% of the respondents in Silver Lakes wasted food because
they bought too much and ended up throwing some of it away, followed by Lyttelton at
31%, Olievenhoutbosch Ext 36 at 30%, Atteridgeville Ext 6, 16 and 17 at 22% and
Montana Park with the lowest at 20%.
Olievenhoutbosch Ext 36 had the highest number of respondents (44%) indicating that
they wasted food because they cooked too much and Silver Lakes Golf Estate had the
lowest number of respondents (26%): this is followed by Atteridgeville Ext 6, 16 and 17
with 38%, Lyttelton with 35% and Montana Park with 32%.
Some of the factors that influence food waste due to poor storage are lack of identification
of retention period, as well as insufficient knowledge about methods of food storage, and
Reason for
wasting food
Atteridgeville
Ext 6.16,17
Olievenhout-
bosch Ext 36
Montana
Park
Lyttelton
Silver Lakes
Golf Estate
Total
sample
(%)
Buying too
much
22 30 20 31 31 27
Special
offers
26 14 17 13 16 18
Cooking
too much
38 44 32 35 26 36
Poor
storage
8 6 3 3 3 4
Food
residue
2 4 13 9 11 7
Fruit and
vegetables
going off
4 2 15 9 13 8
Total 100 100 100 100 100 100

58
lack of consumers’ attention to storage labels on the product. In Atteridgeville Ext 6, 16
and 17, 8% of respondents reported that they wasted food due to poor storage. This figure
was 3% in Montana Park. Sometimes households store food in the fridge that could be
better stored elsewhere, for example products like fruit, vegetables and eggs can stay fresh
for a long time outside of the fridge.
Respondents who wasted food because of food residue (leftovers from pots/cooking)
ranged from 2 - 13%. 13% of the Montana Park respondents wasted food because of food
residue which they did not intend to waste. 2% of respondents in Atteridgeville Ext 6, 16
and 17 indicated that food residue was one of their reasons for wasting food.
The study found that Montana Park had the highest number of respondents (15%) who
wasted fruit and vegetables that went off. Olievenhoutbosch Ext 36 had the lowest
percentage of respondents (2%) in this group.
There are many factors that cause food to be wasted, such as geography and culture. The
reasons differ from region to region and from nation to nation (Gjerris & Gaiani, 2013).
4.4.2 Results of the reasons for food wastage by age range
In this section the reasons for food waste are discussed in terms of age range percentages.
The study identified reasons for food waste as buying too much, special offers, cooking
too much, poor storage, food residue and fruit and vegetables going off.
Table 4.3: Reasons for wasting food in percentages by age range (n=210)
Reason for wasting
food
21-30 31-40 41-50 51-60 61-70 70+ Total
sample
(%)
Buying too much 23 29 27 41 25 0 27
Special offers 15 14 23 29 25 50 18
Cooking too much 41 44 20 12 25 0 36
Poor storage 5 1 10 6 0 0 4
Food residue 6 5 13 6 25 50 7
Fruit and vegetables
going off
10 7 7 6 0 0 8
Total 100 100 100 100 100 100 100
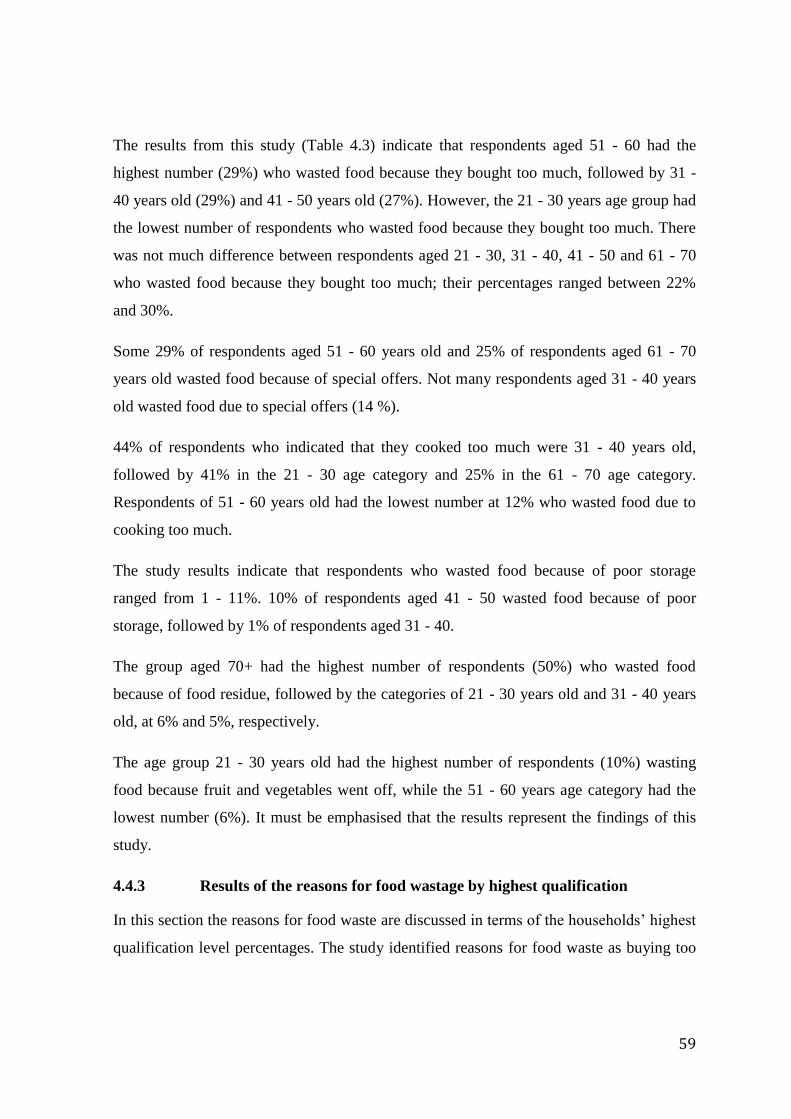
59
The results from this study (Table 4.3) indicate that respondents aged 51 - 60 had the
highest number (29%) who wasted food because they bought too much, followed by 31 -
40 years old (29%) and 41 - 50 years old (27%). However, the 21 - 30 years age group had
the lowest number of respondents who wasted food because they bought too much. There
was not much difference between respondents aged 21 - 30, 31 - 40, 41 - 50 and 61 - 70
who wasted food because they bought too much; their percentages ranged between 22%
and 30%.
Some 29% of respondents aged 51 - 60 years old and 25% of respondents aged 61 - 70
years old wasted food because of special offers. Not many respondents aged 31 - 40 years
old wasted food due to special offers (14 %).
44% of respondents who indicated that they cooked too much were 31 - 40 years old,
followed by 41% in the 21 - 30 age category and 25% in the 61 - 70 age category.
Respondents of 51 - 60 years old had the lowest number at 12% who wasted food due to
cooking too much.
The study results indicate that respondents who wasted food because of poor storage
ranged from 1 - 11%. 10% of respondents aged 41 - 50 wasted food because of poor
storage, followed by 1% of respondents aged 31 - 40.
The group aged 70+ had the highest number of respondents (50%) who wasted food
because of food residue, followed by the categories of 21 - 30 years old and 31 - 40 years
old, at 6% and 5%, respectively.
The age group 21 - 30 years old had the highest number of respondents (10%) wasting
food because fruit and vegetables went off, while the 51 - 60 years age category had the
lowest number (6%). It must be emphasised that the results represent the findings of this
study.
4.4.3 Results of the reasons for food wastage by highest qualification
In this section the reasons for food waste are discussed in terms of the households’ highest
qualification level percentages. The study identified reasons for food waste as buying too
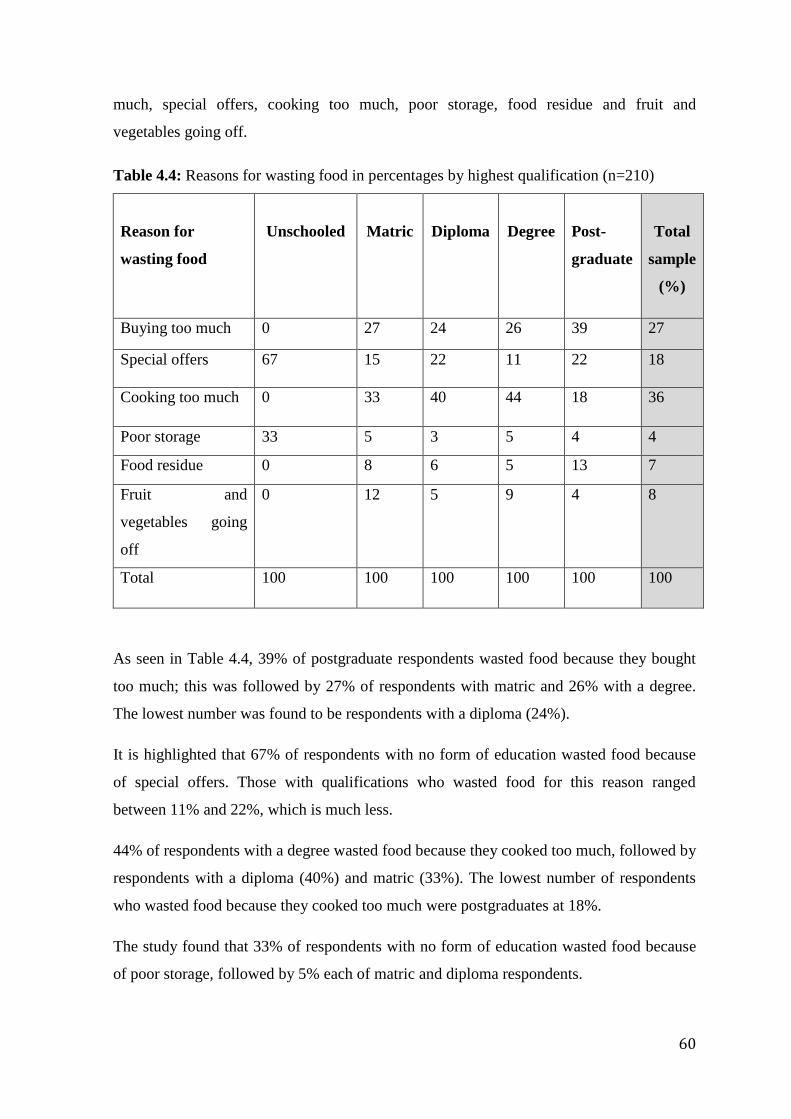
60
much, special offers, cooking too much, poor storage, food residue and fruit and
vegetables going off.
Table 4.4: Reasons for wasting food in percentages by highest qualification (n=210)
Reason for
wasting food
Unschooled
Matric
Diploma
Degree
Post-
graduate
Total
sample
(%)
Buying too much 0 27 24 26 39 27
Special offers 67 15 22 11 22 18
Cooking too much 0 33 40 44 18 36
Poor storage 33 5 3 5 4 4
Food residue 0 8 6 5 13 7
Fruit and
vegetables going
off
0 12 5 9 4 8
Total 100 100 100 100 100 100
As seen in Table 4.4, 39% of postgraduate respondents wasted food because they bought
too much; this was followed by 27% of respondents with matric and 26% with a degree.
The lowest number was found to be respondents with a diploma (24%).
It is highlighted that 67% of respondents with no form of education wasted food because
of special offers. Those with qualifications who wasted food for this reason ranged
between 11% and 22%, which is much less.
44% of respondents with a degree wasted food because they cooked too much, followed by
respondents with a diploma (40%) and matric (33%). The lowest number of respondents
who wasted food because they cooked too much were postgraduates at 18%.
The study found that 33% of respondents with no form of education wasted food because
of poor storage, followed by 5% each of matric and diploma respondents.
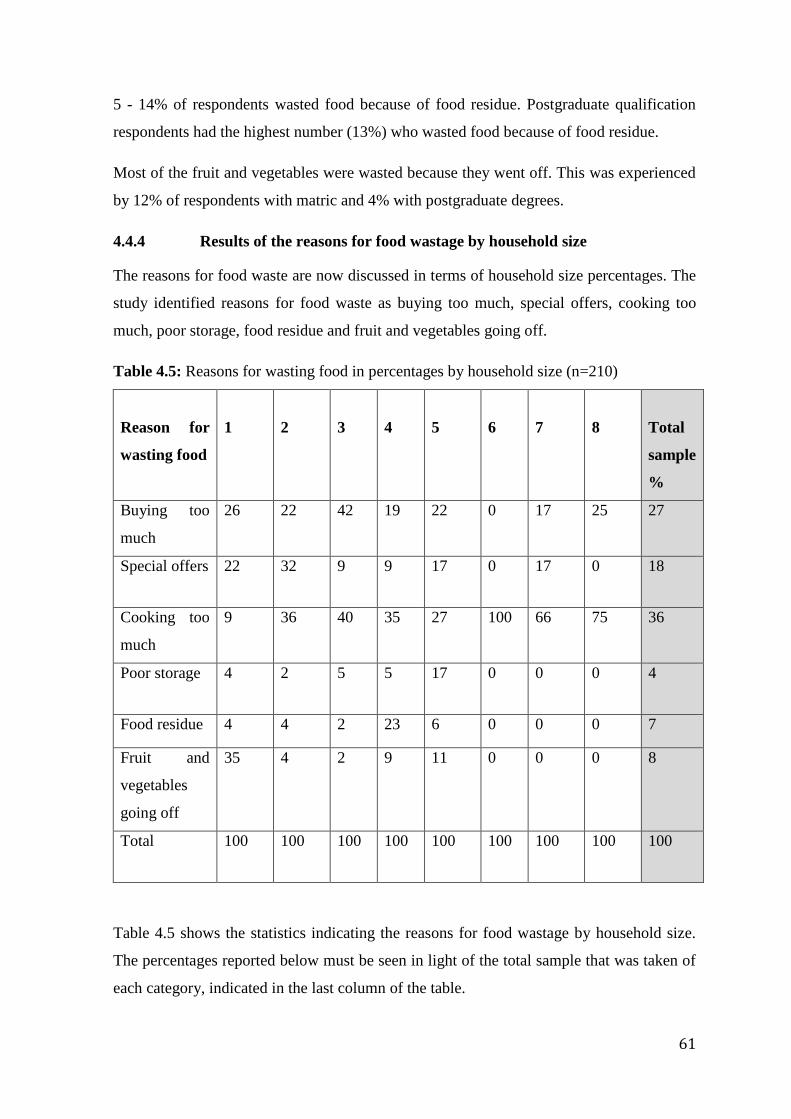
61
5 - 14% of respondents wasted food because of food residue. Postgraduate qualification
respondents had the highest number (13%) who wasted food because of food residue.
Most of the fruit and vegetables were wasted because they went off. This was experienced
by 12% of respondents with matric and 4% with postgraduate degrees.
4.4.4 Results of the reasons for food wastage by household size
The reasons for food waste are now discussed in terms of household size percentages. The
study identified reasons for food waste as buying too much, special offers, cooking too
much, poor storage, food residue and fruit and vegetables going off.
Table 4.5: Reasons for wasting food in percentages by household size (n=210)
Reason for
wasting food
1
2
3
4
5
6
7
8
Total
sample
%
Buying too
much
26 22 42 19 22 0 17 25 27
Special offers 22 32 9 9 17 0 17 0 18
Cooking too
much
9 36 40 35 27 100 66 75 36
Poor storage 4 2 5 5 17 0 0 0 4
Food residue 4 4 2 23 6 0 0 0 7
Fruit and
vegetables
going off
35 4 2 9 11 0 0 0 8
Total 100 100 100 100 100 100 100 100 100
Table 4.5 shows the statistics indicating the reasons for food wastage by household size.
The percentages reported below must be seen in light of the total sample that was taken of
each category, indicated in the last column of the table.

62
3-member households wasted more food (42%) compared to other size households. 17%
of 7-member households wasted food because they bought too much – this was the lowest
percentage.
32% of 2-member households were more attracted by special offers, followed by 22% of
1-member households.
Respondents of 6-member households did not waste food because of buying too much,
special offers, poor storage, food residue or spoiled fruit and vegetables. However, all 6-
member households indicated that they only wasted food because they cooked too much
food, followed by 8- and 7-member households at 75% and 66%, respectively. Only 9% of
1-member households wasted food due to cooking too much.
17% of 5-member households wasted food because of poor storage’ this was the highest
number of respondents. 2% of 2-member households wasted food because of poor
storage; this was the lowest number of respondents.
23% of respondents who wasted food because of food residue were from 4-member
households. The lowest number was from 3-member households at 2%.
Regarding wasting food due to fruit and vegetables going off, results ranged from 2 - 35%.
35% of 1-member households wasted food for this reason.
4.4.5 Results of the reasons for food wastage by monthly income
In this section the reasons for food waste are discussed in terms of the households’
monthly income percentages. The study identified reasons for food waste as buying too
much, special offers, cooking too much, poor storage, food residue and fruit and
vegetables going off.

63
Buying too much
Special offers
Cooking too much
Poor storage
Food residue
Fruit and vegetables going off
21
27
29
10
8
6
28
23
26
5
7
12
29
11
43
3
7
8
Reasons for food wastage by monthly income in percentages
>R10 000 R6 000 - R9 000 R500 - R5 000
Figure 4.10: Reasons for food wastage by monthly income (n=210) As presented in Figure 4.10, 29% of respondents with a monthly income of R10 000+
wasted food because they bought too much. There was not much difference between
income categories: 28% of respondents in the R6 000 - R9 000 and 21 % in the R500 -
R5 000 categories wasted food for this reason.
27% of respondents with a monthly income of R500 - R5 000 wasted food because of
special offers, and only 11% with a monthly income of R10 000+ wasted food for this
reason.
43% of respondents with a monthly income of R10 000+ wasted food due to cooking too
much. 26% and 29% of respondents with a monthly income of R6 000 - R9 000 and R500
- R5 000 respectively, wasted food for this reason.
10% of respondents with a monthly income of R500 - R5 000 wasted food because of poor
storage. However, the difference between the highest and the lowest numbers were small
and ranged from 3 to 10% for the different income categories as can be seen in Figure
4.10.
The study found that respondents with a monthly income of R500 - R5 000 had the highest
number (8%) of respondents who wasted food because of food residue. The range between

64
the categories, however, was very small and ranged between 7 and 8%. Respondents with
a monthly income of R6 000 - R9 000 and R10 000+ had the lowest number (7%) of
respondents who wasted food because of food residue.
The highest percentage, 12% of respondents with a monthly income of R6 000 - R9 000
wasted food because of fruit and vegetables going off.
4.5 Amount of food wasted per week in kilograms
In this section respondents’ average amount of food wasted per week in kilograms is
discussed in terms of geographical area, age range, highest qualification, household size
and monthly income categories. The researcher weighed the food waste for a period of
three weeks from 123 out of 133 respondents who indicated in the questionnaire that they
wasted food. Ten households’ results were not included in the analysis, because some
households did not participate and others did not comply with the weighing standards of
keeping food waste for seven days over a period of three weeks. For example, households
kept food waste for a period of two weeks and others for four days and not a week, as
explained in the limitation section in Chapter 3. A total of 2 202.9 kg of food was wasted
by 123 households in a period of three weeks. Table 4.6 shows that respondents wasted an
average of 5.9 kg of food per household during the first week, 6 kg in the second week and
6 kg in the third week. This amount of food wasted is less than the amount found in studies
by WRAP (2009b) in the UK where households waste more than 6 kg of food per week
and Parizeau et al. (2015) in Guelph, Ontario, from 68 households which indicated that
10.2 kg of food was wasted per week.
4.5.1 Average household food wastage by geographical area
Respondents’ average amount of food wasted per week in kilograms is now discussed in
terms of geographical area.
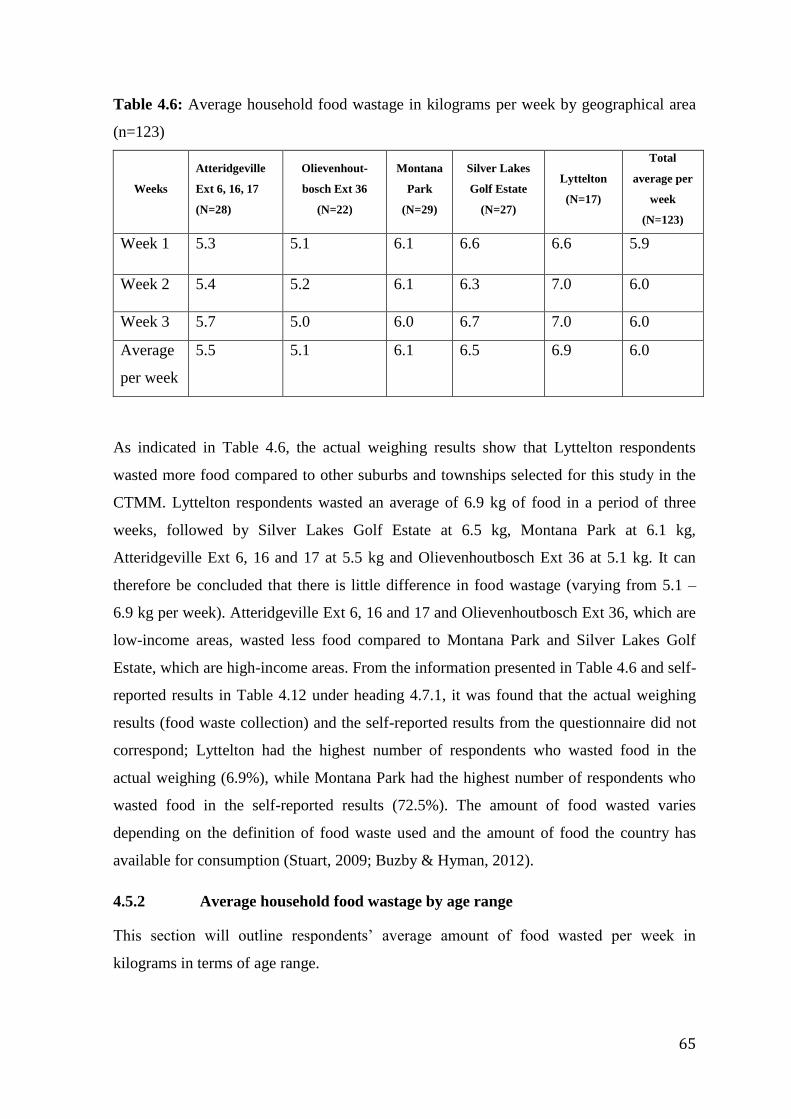
65
Table 4.6: Average household food wastage in kilograms per week by geographical area
(n=123)
Weeks
Atteridgeville
Ext 6, 16, 17
(N=28)
Olievenhout-
bosch Ext 36
(N=22)
Montana
Park
(N=29)
Silver Lakes
Golf Estate
(N=27)
Lyttelton
(N=17)
Total
average per
week
(N=123)
Week 1 5.3 5.1 6.1 6.6 6.6 5.9
Week 2 5.4 5.2 6.1 6.3 7.0 6.0
Week 3 5.7 5.0 6.0 6.7 7.0 6.0
Average
per week
5.5 5.1 6.1 6.5 6.9 6.0
As indicated in Table 4.6, the actual weighing results show that Lyttelton respondents
wasted more food compared to other suburbs and townships selected for this study in the
CTMM. Lyttelton respondents wasted an average of 6.9 kg of food in a period of three
weeks, followed by Silver Lakes Golf Estate at 6.5 kg, Montana Park at 6.1 kg,
Atteridgeville Ext 6, 16 and 17 at 5.5 kg and Olievenhoutbosch Ext 36 at 5.1 kg. It can
therefore be concluded that there is little difference in food wastage (varying from 5.1 –
6.9 kg per week). Atteridgeville Ext 6, 16 and 17 and Olievenhoutbosch Ext 36, which are
low-income areas, wasted less food compared to Montana Park and Silver Lakes Golf
Estate, which are high-income areas. From the information presented in Table 4.6 and self-
reported results in Table 4.12 under heading 4.7.1, it was found that the actual weighing
results (food waste collection) and the self-reported results from the questionnaire did not
correspond; Lyttelton had the highest number of respondents who wasted food in the
actual weighing (6.9%), while Montana Park had the highest number of respondents who
wasted food in the self-reported results (72.5%). The amount of food wasted varies
depending on the definition of food waste used and the amount of food the country has
available for consumption (Stuart, 2009; Buzby & Hyman, 2012).
4.5.2 Average household food wastage by age range
This section will outline respondents’ average amount of food wasted per week in
kilograms in terms of age range.

66
Table 4.7: Average household food wastage in kilograms per week by age range (n=123)
Weeks 21 - 30
(N=57)
31 - 40
(N=34)
41 - 50
(N=19)
51 - 60
(N=11)
61 - 70
(N=2)
70+
(N=0)
Total
average per
week
(N=123)
Week 1 5.2 5.8 7.5 7.4 6.3 − 5.9
Week 2 5.4 5.3 7.6 7.5 8.5 − 6.0
Week 3 5.7 5.2 8.1 6.1 9.5 − 6.0
Average 5.4 5.4 7.8 7.0 8.1 − 6.0
The results from this study (Table 4.7) present the amount of food wasted in terms of age
range. Although all respondents aged 70+ self-reported in the questionnaire that they did
not waste food, they participated in the actual weighing of food waste. However, they did
not comply with the weighing standards of keeping food waste for seven days over a
period of three weeks and their results have not been included in this study. The
households’ self-reported results in Table 4.13 show that respondents aged 51 - 60 wasted
more food compared to other age groups, followed by respondents aged 21 - 30 and 41 –
50 years old.
However, the situation was different with the actual weighing of food waste in this current
study; respondents aged 41 - 50 wasted more food (7.8 kg) than other age groups.
Respondents aged 61 - 70 wasted an average of 8.1 kg of food in a period of three weeks.
This is not a good representative example, though, because only two households
participated. Respondents aged 51 - 60 decreased the amount of food wasted in the third
week. However, respondents aged 41 - 50 and 21 - 30 showed that the amount of food
wasted increased from week 1 to week 3. The amount of food wasted by respondents aged
31 - 40 decreased from week 1 to week 3. Table 4.7 shows that an average of 5.4 kg of
food was wasted in a period of three weeks by respondents aged 21 - 30. It can therefore
be concluded that for this study there was a difference in the amount of food wasted
between age groups shown as referred to in Table 4.18. This is different from studies by

67
Hamilton et al. (2005), Wassermann and Schneider (2005), Lyndhurst (2007), Göbel et al.
(2012) and Quested et al. (2013), who found that young people waste food more than older
people.
4.5.3 Average household food wastage by highest qualification level
In this section respondents’ average amount of food wasted per week in kilograms is
outlined in terms of highest qualification.
As presented in Table 4.8, there were no unschooled respondents in the weighing part of
this study, as they did not store waste food for the required period of three weeks. In the
questionnaire they reported that they did not waste food, but they participated in the
weighing of food waste. Postgraduate respondents self-reported to waste more food (Table
4.14), but the actual results of this current study show that diploma respondents wasted
more food compared to other education levels, with an average of 6.2 kg of food wasted in
a period of three weeks. The lowest amount of food waste (5.4 kg) was recorded by
respondents with a postgraduate degree as their highest qualification. Notably there is a
slight increase (0.6%) in food wastage by respondents with matric and diplomas and a
decrease (0.5%) in food wastage by respondents with degrees and postgraduate degrees.
Therefore, the results in this study differ from those of Kumar and Singh (2013) and
Wassermann and Schneider (2005), who found that respondents with higher education
wasted more food. Moreover, the results of this study support the findings by Murad et al.
(2012) and Epp and Mauger (1989) indicating that people who practise improper methods
of environmental management systems have lower levels of education; people with higher
education levels use resources more efficiently and they are more informed when buying
food because they are aware of the effects of their own behaviour.

68
Table 4.8: Average household food wastage in kilograms per week by highest
qualification (n=123)
Weeks Unschooled
(N=0)
Matric
(N=27)
Diploma
(N=45)
Degree
(N=32)
Postgraduate
(N=19)
Total
average
per week
(N=123)
Week 1 − 5.7 6.3 5.9 5.4 5.9
Week 2 − 6.0 6.8 5.6 4.6 6.0
Week 3 − 6.5 5.6 6.2 6.1 6.0
Average − 6.1 6.2 5.9 5.4 6.0
4.5.4 Average household food wastage by household size
Respondents’ average amount of food wasted per week in kilograms is now outlined in
terms of household size.
To find the average amount of household food waste per week, the amount of food wasted
by all households was added up, then divided by the amount of numbers in the set (how
many numbers there were). Table 4.9 indicates that 7- and 8-member households wasted
more food for a period of three weeks, but this might be due to the low sample number of
households. However, it was also statistically proven that there was a difference between
household size and food waste, as referred to in Table 4.19 (p-value 0.0043). No 6-
member households participated in the weighing of food waste for this study. The actual
results (food waste collection) of this current study show that 5-member households
wasted more food. The self-reported (questionnaire) results in Table 4.15 indicate that
respondents of 4-member households wasted more food compared to other household
sizes, while the actual results indicate that respondents of 4-member households wasted
less food (5.7 kg/week). WRAP (2009a) states that approximately half the amount of food
wasted per capita generated is wasted in households with 4 members compared to single
occupancy households. Respondents with 1- and 2-member households wasted an average
of 6.1 kg of food in a period of three weeks.

69
Table 4.9: Average household food wastage in kilograms per week by household size (n=123)
Weeks 1 (N=14) 2 (N=37) 3 (N=36) 4 (N=28) 5 (N=6) 6 (N=0) 7 (N=1) 8 (N=1) Total average per week (N=123)
Week 1 6.2 6.0 5.9 5.8 5.3 − 7.1 6.9 5.9
Week 2 6.5 6.1 5.3 5.5 8.2 − 16.3 9.8 6.0
Week 3 5.6 6.1 5.6 5.9 7.1 − 17.9 7.6 6.0
Average 6.1 6.1 5.6 5.7 6.9 − 13.8 8.1 6.0

70
4.5.5 Average household food wastage by monthly income category
In this section respondents’ average amount of food wasted per week in kilograms is
outlined in terms of monthly income categories
As indicated in Table 4.10, there seems to be a decrease in food wasted with an increase in
monthly income: the lower the income, the more food is wasted. Respondents with a
monthly income of R10 000+ wasted an average of 5.7 kg of food in a period of three
weeks, while respondents with a monthly income of R6 000 - R9 000 wasted an average of
6 kg. However, an average of 7.1 kg of food was wasted by respondents with a monthly
income of R500 - R5 000 over the period of three weeks. Respondents with a monthly
income of R6 000 - R9 000 reported in the questionnaire that they wasted food (72%),
which is the highest when comparing income categories, but the actual weighing results of
the current study show that respondents with a monthly income of R500 – R5 000 wasted
more food (7.1 kg/week). Moreover, there was less food wastage in low-income than in
high-income households, which is in line with what Lyndhurst (2007) and WRAP (2010)
found. This current study found that the less income earned, the more food wasted. This is
contrary to the studies by Jones (2003), Hamilton et al. (2005) and Skourides et al. (2008),
which showed that higher income households wasted more food than those with lower
income.
Table 4.10: Average household food wastage in kilograms per week by monthly income
(n=123)
Weeks
R500 - R5 000
(N=17)
R6 000 - R9 000
(N=31)
R10 000+
(N=75)
Total average per
week (N=123)
Week 1 6.5 5.8 5.8 5.9
Week 2 7.3 6.8 5.3 6.0
Week 3 7.6 5.2 6.0 6.0
Average 7.1 6.0 5.7 6.0
The total average of food wasted by respondents was 6 kg; this shows that all people from
different income groups wasted food.

71
4.6 Disposal methods as mitigation strategies to minimise food wastage
The study assessed the amount of food going to black bin to landfill. Respondents’
disposal methods in terms of geographical area, age range, highest qualification, household
size and monthly income categories are outlined in this section.
The study presented three methods that respondents could employ to dispose of their food
waste. As indicated in Table 4.11, the majority of the respondents (83%) in this study
relied on the household garbage bin, i.e. municipal waste collection services. 14% of
respondents fed their food waste to pets and 3% of respondents composted food waste for
their garden. Lyndhurst (2007) found that the higher number of respondents who relied on
the household garbage bin do not care about the environment which they live in because
they do not know about the environmental impacts of food waste or do not care. The
number of respondents who composted their food waste or fed their food waste to pets in
this study was lower compared to the study conducted by Parizeau et al. (2015), in which
13% used backyard composters and 20% fed domestic or wild animals with food scraps.
4.6.1 Food waste disposal methods by geographical area
In this section respondents’ disposal methods in terms of geographical area are discussed.
The study presented three methods that respondents could employ to dispose of their food
waste.
The results in Table 4.11 indicate that Atteridgeville Ext 6, 16 and 17 had the highest
number of respondents (4%) who composted their food waste, with an average of 3%.
Almost none of the respondents from the five areas of the CTMM composted food in their
homes. Out of five areas only a small number of respondents from four areas composted
their food waste. As much as the DEA (2013) encourages home composting, there is more
work that needs to be done to encourage households to divert organic and garden waste
from landfills.
Olievenhoutbosch Ext 36 had the highest number of respondents (20%) who fed their food
waste to pets, followed by Montana Park at 17%. Lyttelton had the lowest number of
respondents (6%) who fed their food waste to pets with an average of 14%.
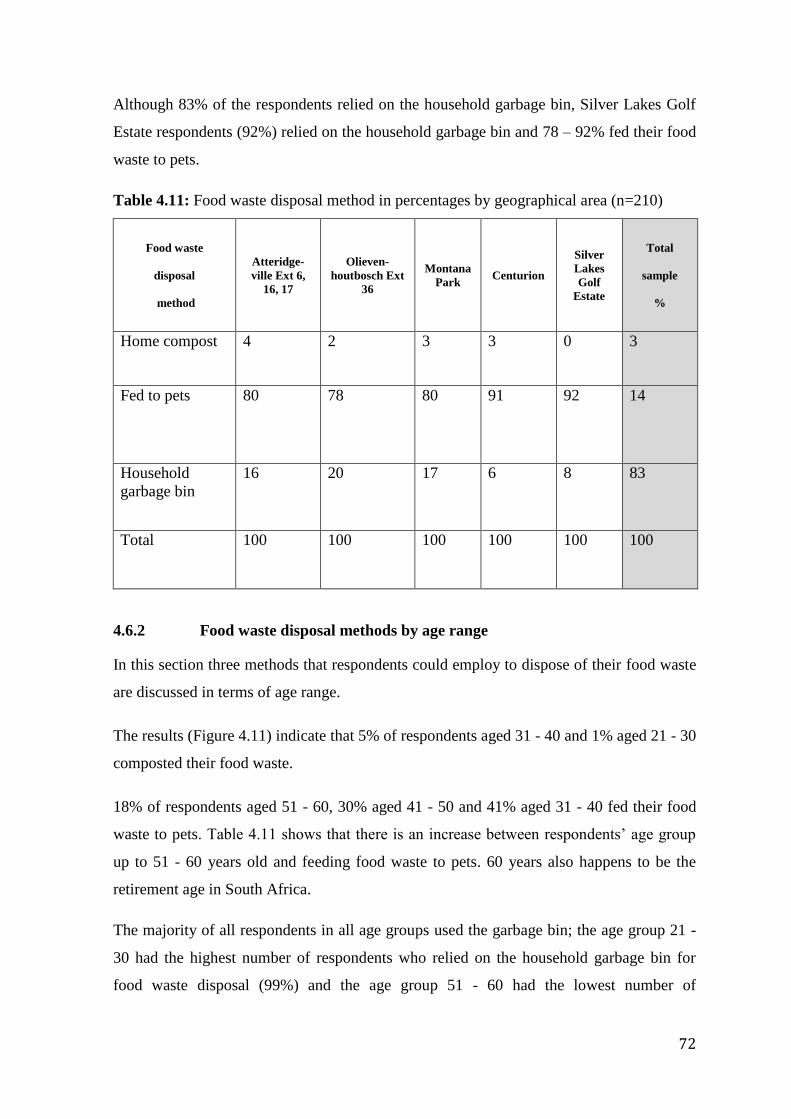
72
Although 83% of the respondents relied on the household garbage bin, Silver Lakes Golf
Estate respondents (92%) relied on the household garbage bin and 78 – 92% fed their food
waste to pets.
Table 4.11: Food waste disposal method in percentages by geographical area (n=210)
Food waste
disposal
method
Atteridge-
ville Ext 6,
16, 17
Olieven-
houtbosch Ext
36
Montana
Park Centurion
Silver
Lakes
Golf
Estate
Total
sample
%
Home compost 4 2 3 3 0 3
Fed to pets 80 78 80 91 92 14
Household
garbage bin
16 20 17 6 8 83
Total 100 100 100 100 100 100
4.6.2 Food waste disposal methods by age range
In this section three methods that respondents could employ to dispose of their food waste
are discussed in terms of age range.
The results (Figure 4.11) indicate that 5% of respondents aged 31 - 40 and 1% aged 21 - 30
composted their food waste.
18% of respondents aged 51 - 60, 30% aged 41 - 50 and 41% aged 31 - 40 fed their food
waste to pets. Table 4.11 shows that there is an increase between respondents’ age group
up to 51 - 60 years old and feeding food waste to pets. 60 years also happens to be the
retirement age in South Africa.
The majority of all respondents in all age groups used the garbage bin; the age group 21 -
30 had the highest number of respondents who relied on the household garbage bin for
food waste disposal (99%) and the age group 51 - 60 had the lowest number of
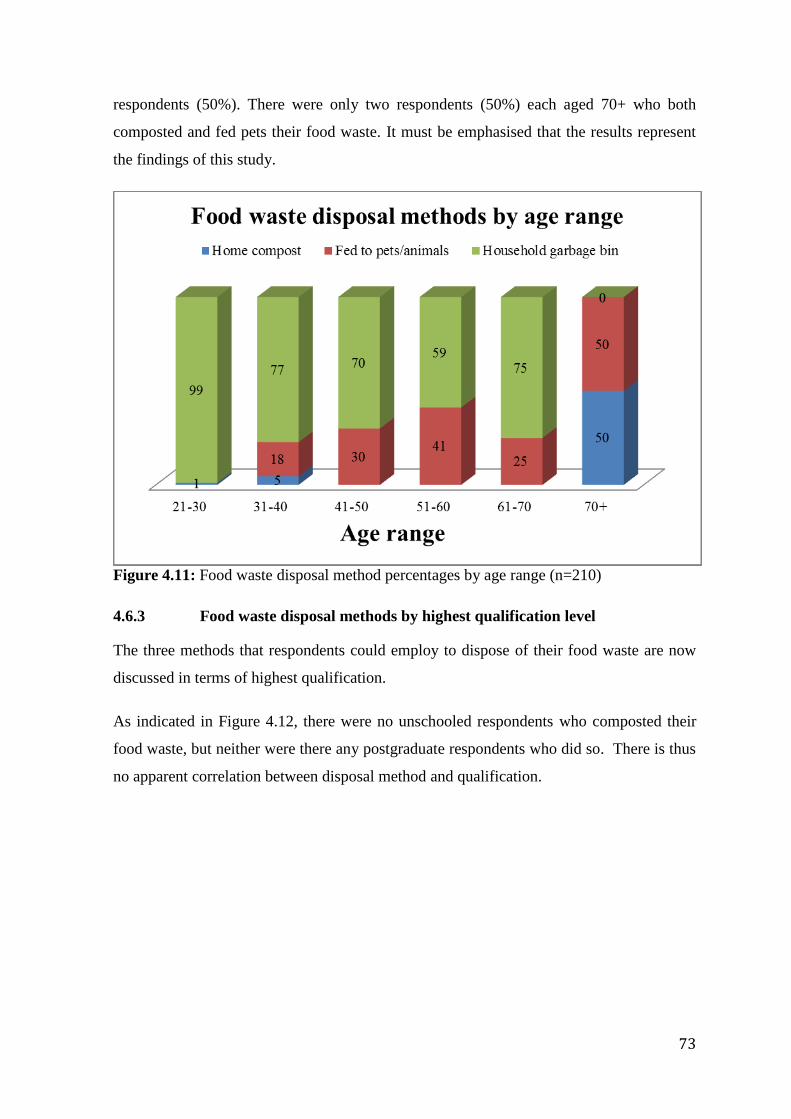
73
respondents (50%). There were only two respondents (50%) each aged 70+ who both
composted and fed pets their food waste. It must be emphasised that the results represent
the findings of this study.
Figure 4.11: Food waste disposal method percentages by age range (n=210)
4.6.3 Food waste disposal methods by highest qualification level
The three methods that respondents could employ to dispose of their food waste are now
discussed in terms of highest qualification.
As indicated in Figure 4.12, there were no unschooled respondents who composted their
food waste, but neither were there any postgraduate respondents who did so. There is thus
no apparent correlation between disposal method and qualification.

74
Figure 4.12: Food waste disposal method percentages by highest qualification level
(n=210)
4.6.4 Food waste disposal methods by household size
Respondents’ disposal methods in terms of household size are outlined in this section. The
study presented three methods that respondents could employ to dispose of their food
waste.
Figure 4.13 shows that respondent in 1-, 6-, 7- and 8-member households did not compost
or feed their food waste to pets. However, 5-member households had the highest number
of respondents (6%) who composted their food waste.
3-member households had the highest number of respondents (24%) who fed their food
waste to pets, followed by 2-member households (16%) and 5-member households (11%).
All respondents in 1-, 6-, 7- and 8-member households reported that they relied solely on
the household garbage bin to dispose of their food waste.

75
1 2 3 4 5 6 7 8
2 5 616
2414 11
10082
7186 83
100 100 100
Household size
Food waste disposal methods by household
size
Home compost Fed to pets/animals Household garbage bin
Figure 4.13: Food waste disposal method percentages by household size (n=210)
4.6.5 Food waste disposal methods by monthly income
In this section respondents’ disposal methods are outlined in terms of monthly income
categories. The study presented three methods that respondents could employ to dispose of
their food waste.
As presented in Figure 4.14, households with a monthly income of R500 - R5 000 had the
highest number of respondents who composted their food waste (6%). 2% of respondents
with a monthly income of R6 000 - R9 000 composted their food waste and only 1% of
those with a monthly income of R10 000+ did so. It can therefore be concluded that there
is a correlation between income and food waste disposal methods; as referred to in Table
4.17, there was difference between income categories.
Households with a monthly income of R6 000 - R9 000 had the highest number (35%) of
respondents who fed their food waste to pets and households with a monthly income of
R10 000+ had the lowest number (4%).
95% of respondents with a monthly income of R10 000+ relied on the household garbage
bin for their food waste disposal, followed by 75% with a monthly income of R500 -
R5 000 and 63% with a monthly income of R6 000 - R9 000.
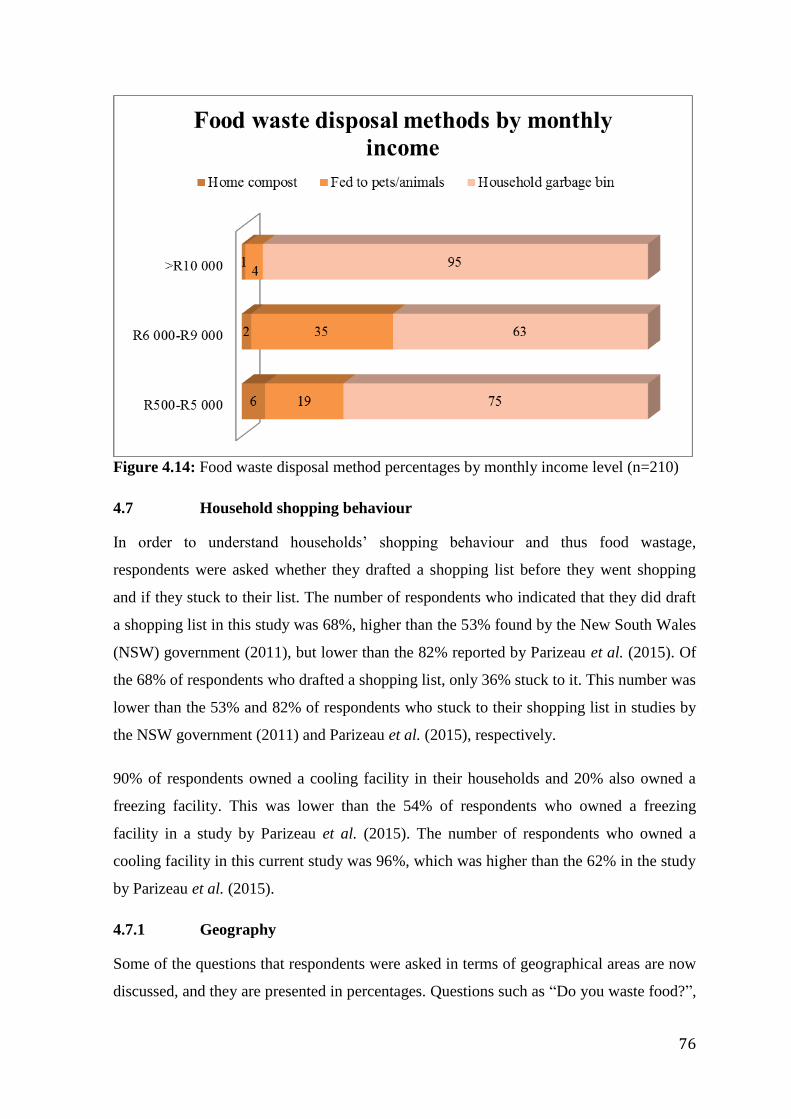
76
Figure 4.14: Food waste disposal method percentages by monthly income level (n=210)
4.7 Household shopping behaviour
In order to understand households’ shopping behaviour and thus food wastage,
respondents were asked whether they drafted a shopping list before they went shopping
and if they stuck to their list. The number of respondents who indicated that they did draft
a shopping list in this study was 68%, higher than the 53% found by the New South Wales
(NSW) government (2011), but lower than the 82% reported by Parizeau et al. (2015). Of
the 68% of respondents who drafted a shopping list, only 36% stuck to it. This number was
lower than the 53% and 82% of respondents who stuck to their shopping list in studies by
the NSW government (2011) and Parizeau et al. (2015), respectively.
90% of respondents owned a cooling facility in their households and 20% also owned a
freezing facility. This was lower than the 54% of respondents who owned a freezing
facility in a study by Parizeau et al. (2015). The number of respondents who owned a
cooling facility in this current study was 96%, which was higher than the 62% in the study
by Parizeau et al. (2015).
4.7.1 Geography
Some of the questions that respondents were asked in terms of geographical areas are now
discussed, and they are presented in percentages. Questions such as “Do you waste food?”,

77
“Do you generally use a shopping list?”, “Do you stick to your shopping list?”, “Do you
own a cooling facility?” and “Do you own a freezing facility?” were asked.
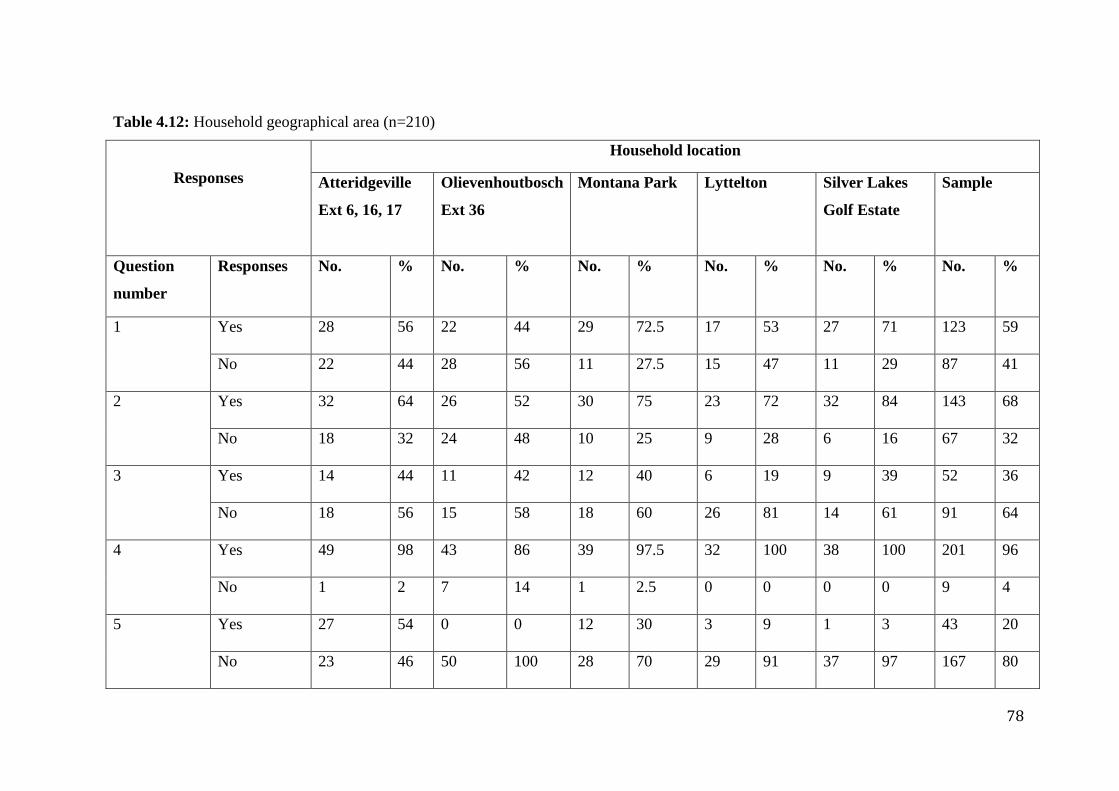
78
Table 4.12: Household geographical area (n=210)
Responses
Household location
Atteridgeville
Ext 6, 16, 17
Olievenhoutbosch
Ext 36
Montana Park Lyttelton Silver Lakes
Golf Estate
Sample
Question
number
Responses No. % No. % No. % No. % No. % No. %
1 Yes 28 56 22 44 29 72.5 17 53 27 71 123 59
No 22 44 28 56 11 27.5 15 47 11 29 87 41
2 Yes 32 64 26 52 30 75 23 72 32 84 143 68
No 18 32 24 48 10 25 9 28 6 16 67 32
3 Yes 14 44 11 42 12 40 6 19 9 39 52 36
No 18 56 15 58 18 60 26 81 14 61 91 64
4 Yes 49 98 43 86 39 97.5 32 100 38 100 201 96
No 1 2 7 14 1 2.5 0 0 0 0 9 4
5 Yes 27 54 0 0 12 30 3 9 1 3 43 20
No 23 46 50 100 28 70 29 91 37 97 167 80

79
N=50 (24%) N=50 (24%) N=40 (19%) N=32 (15%) N=38 (18%) N=210
Questions
1 Do you waste food?
2 Do you generally use a shopping list?
3 Do you stick to your shopping list?
4 Do you own a cooling facility?
5 Do you own a freezing facility?

80
Households in Silver Lakes Golf Estate (84%) had the highest number of respondents who
drafted a shopping list before shopping for food, but only 39% stuck to the list.
Households in Olievenhoutbosch Ext 36 (52%) had the lowest number of respondents who
drafted a shopping list before food shopping. Of the 64% of Atteridgeville Ext 6, 16 and
17 respondents who drafted a list, 44% stuck to their list when shopping for food. This
indicates that Atteridgeville Ext 6, 16 and 17 had the highest number of respondents who
stuck to their shopping list. The household food purchasing behaviour of CTMM
respondents shows that they did not stick to their shopping list, and this resulted in them
buying more food. All Lyttelton and Silver Lakes Golf Estate respondents owned a cooling
facility, while 30% of Montana Park respondents also owned a freezing facility. The study
found that freezing facilities were owned by 20% (average 8.6) of the respondents.
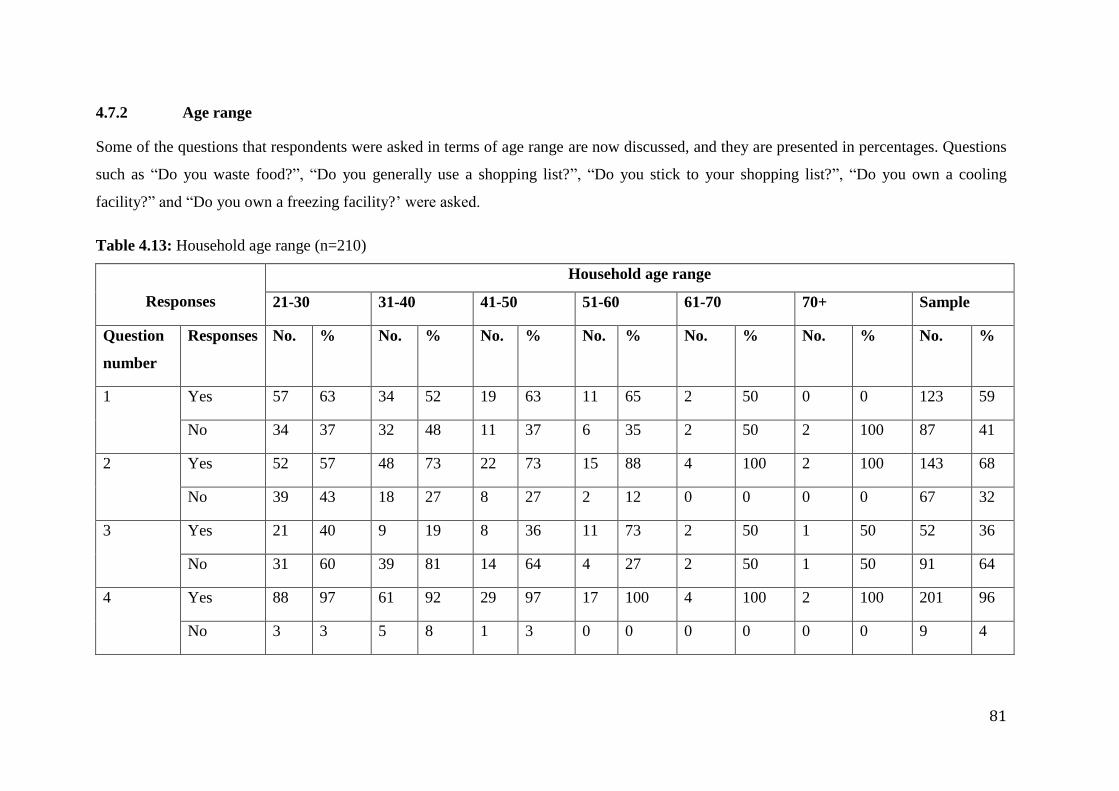
81
4.7.2 Age range
Some of the questions that respondents were asked in terms of age range are now discussed, and they are presented in percentages. Questions
such as “Do you waste food?”, “Do you generally use a shopping list?”, “Do you stick to your shopping list?”, “Do you own a cooling
facility?” and “Do you own a freezing facility?’ were asked.
Table 4.13: Household age range (n=210)
Responses
Household age range
21-30 31-40 41-50 51-60 61-70 70+ Sample
Question
number
Responses No. % No. % No. % No. % No. % No. % No. %
1 Yes 57 63 34 52 19 63 11 65 2 50 0 0 123 59
No 34 37 32 48 11 37 6 35 2 50 2 100 87 41
2 Yes 52 57 48 73 22 73 15 88 4 100 2 100 143 68
No 39 43 18 27 8 27 2 12 0 0 0 0 67 32
3 Yes 21 40 9 19 8 36 11 73 2 50 1 50 52 36
No 31 60 39 81 14 64 4 27 2 50 1 50 91 64
4 Yes 88 97 61 92 29 97 17 100 4 100 2 100 201 96
No 3 3 5 8 1 3 0 0 0 0 0 0 9 4
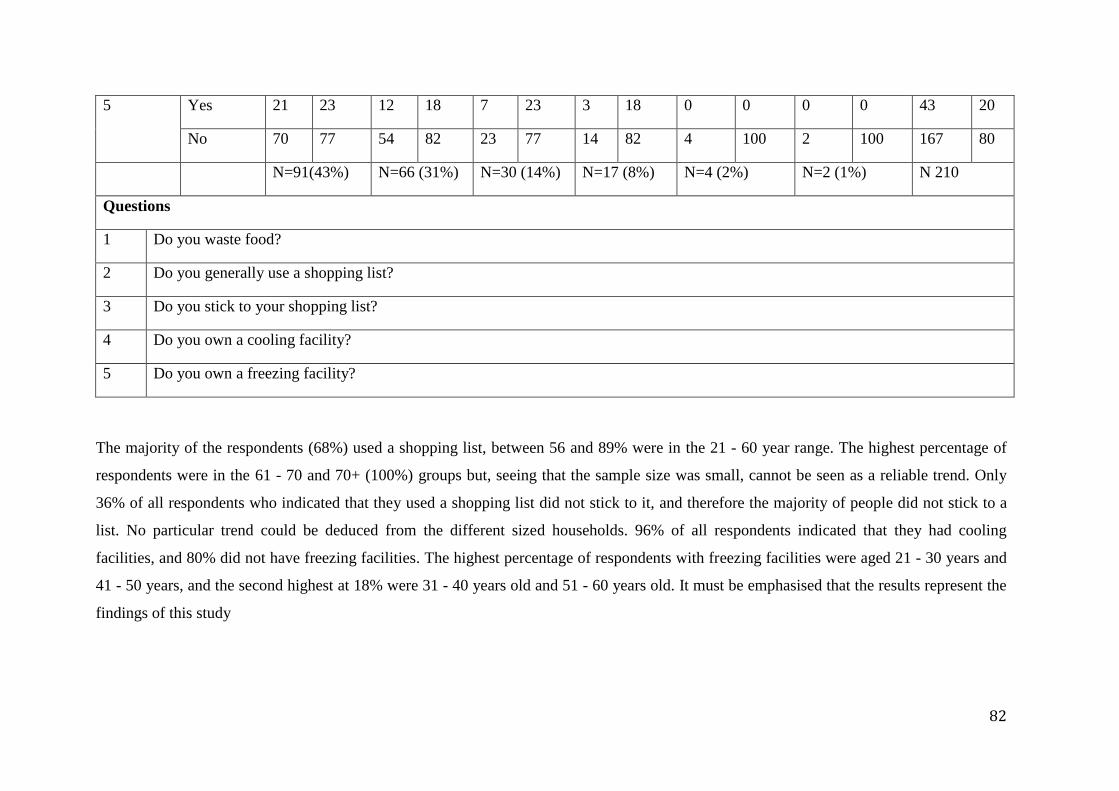
82
5 Yes 21 23 12 18 7 23 3 18 0 0 0 0 43 20
No 70 77 54 82 23 77 14 82 4 100 2 100 167 80
N=91(43%) N=66 (31%) N=30 (14%) N=17 (8%) N=4 (2%) N=2 (1%) N 210
Questions
1 Do you waste food?
2 Do you generally use a shopping list?
3 Do you stick to your shopping list?
4 Do you own a cooling facility?
5 Do you own a freezing facility?
The majority of the respondents (68%) used a shopping list, between 56 and 89% were in the 21 - 60 year range. The highest percentage of
respondents were in the 61 - 70 and 70+ (100%) groups but, seeing that the sample size was small, cannot be seen as a reliable trend. Only
36% of all respondents who indicated that they used a shopping list did not stick to it, and therefore the majority of people did not stick to a
list. No particular trend could be deduced from the different sized households. 96% of all respondents indicated that they had cooling
facilities, and 80% did not have freezing facilities. The highest percentage of respondents with freezing facilities were aged 21 - 30 years and
41 - 50 years, and the second highest at 18% were 31 - 40 years old and 51 - 60 years old. It must be emphasised that the results represent the
findings of this study

83
4.7.3 Highest qualification
Some of the questions that respondents were asked in terms of highest qualification are now discussed, and they are presented in percentages.
Questions such as “Do you waste food?”, “Do you generally use a shopping list?”, “Do you stick to your shopping list?”, “Do you own a
cooling facility?” and “Do you own a freezing facility?” were asked.
Table 4.14: Household highest qualification level (n=210)
Responses
Household highest qualification
Unschooled Matric Diploma Degree Postgraduate Sample
Question
number
Responses No. % No. % No. % No. % No. % No. %
1 Yes 0 0 27 41 45 71 32 58 19 83 123 59
No 3 100 39 59 18 29 23 42 4 17 87 41
2 Yes 3 100 46 70 41 65 39 71 14 61 143 68
No 0 0 20 30 22 35 16 29 9 39 67 32
3 Yes 1 33 12 26 16 39 18 46 5 36 52 36
No 2 67 34 74 25 61 21 54 9 64 91 64
4 Yes 3 100 63 95 58 92 54 98 23 100 201 96
No 0 0 3 5 5 8 1 2 0 0 9 4

84
5 Yes 3 100 14 21 14 22 9 16 3 13 43 20
No 0 0 52 79 49 78 46 84 20 87 167 80
N=3
(1.43%)
N=66
(31.43)
N=63
(30%)
N=55
(26.19)
N=23
(10.95%)
N=210
Questions
1 Do you waste food?
2 Do you generally use a shopping list?
3 Do you stick to your shopping list?
4 Do you own a cooling facility?
5 Do you own a freezing facility?
Postgraduate respondents had the highest number (83%) that wasted food, followed by diploma and degree respondents with percentages
between 59 and 69. All the other education level percentages are lower than 42%. The majority of the respondents who used shopping lists
were unschooled (100%) but, seeing that the sample size was small, this cannot be seen as a reliable trend. Postgraduate, degree, diploma and
matric respondents indicated that they used a shopping list with percentages between 60 and 72. All of the unschooled respondents used a
shopping list before shopping for food, followed by 71% of respondents with a degree and 70% with matric. 61% of postgraduate respondents
and 65% with a diploma used a shopping list when they shopped for food. All unschooled and all postgraduate respondents owned a cooling
facility in their households, and all other educational levels also owned a cooling facility with percentages between 91 and 99. All unschooled

85
respondents owned a freezing facility, followed by diploma respondents (22%) and matric respondents (21%), but only 16% of degree
respondents and 13% of respondents with a postgraduate degree owned a freezing facility.

86
4.7.4 Household size
In this section some of the questions that respondents were asked in terms of household size are discussed, and they are presented in
percentages. Questions such as “Do you waste food?”, “Do you generally use a shopping list?”, “Do you stick to your shopping list?”, “Do
you own a cooling facility?” and “Do you own a freezing facility?” were asked.
Table 4.15: Household size (n=210)
Responses
Household size
1 2 3 4 5 6 7 8 Sample
Question
number
Responses No. % No. % No. % No. % No. % No. % No. % No. % No. %
1 Yes 14 61 37 64 36 67 28 68 6 33 0 0 1 17 1 25 123 59
No 9 39 21 36 19 35 15 37 12 67 3 100 5 83 3 75 87 41
2 Yes 16 70 41 71 41 75 26 60 12 67 1 33 3 50 3 75 143 68
No 17 30 17 29 14 25 17 40 6 33 2 67 3 50 1 25 67 32
3 Yes 9 56 10 24 8 20 9 35 12 100 1 100 2 67 1 33 52 36
No 7 44 31 76 33 80 17 65 0 0 0 0 1 33 2 67 91 64
4 Yes 20 87 56 97 54 98 41 95 17 94 3 100 6 100 4 100 201 96

87
No 3 13 2 3 1 2 2 5 1 6 0 0 0 0 0 0 9 4
5 Yes 2 9 6 10 16 29 8 19 6 33 0 0 4 67 1 25 43 20
No 21 91 52 90 39 71 35 81 12 67 3 100 2 33 3 75 167 80
N= 23
(11%)
N= 58
(28%)
N= 55
(26%)
N= 43
(20%)
N= 18
(9%)
N= 3
(1%)
N= 6
(3%)
N= 4
(2%)
N= 210
Questions
1 Do you waste food?
2 Do you generally use a shopping list?
3 Do you stick to your shopping list?
4 Do you own a cooling facility?
5 Do you own a freezing facility?
59% of the 1-4-member household respondents indicated that they wasted food with the highest percentages between 59 and 69. The majority
of the respondents (68%) used a shopping list, and the 1-5-member household ranged between 60 and 75%. The highest percentages of
respondents were for an 8-member household (75%) but, seeing that the sample size was small, this cannot be seen as a reliable trend. Only
36% of all respondents who indicated that they used a shopping list did not stick to it, and therefore the majority of people did not stick to a
list. No particular trend could be deduced from the different sized households.96% of all respondents indicated that they had cooling facilities,

88
and 80% did not have freezing facilities. The highest percentage of respondents with freezing facilities were 7-member households, and the
second highest at 33% were 6-member households. All the other households’ percentages are lower than 30%.

89
4.7.5 Monthly income level
In this section some of the questions that respondents were asked in terms of monthly income level are discussed, and they are presented in
percentages. Questions such as “Do you waste food?”, “Do you generally use a shopping list?”, “Do you stick to your shopping list?”, “Do
you own a cooling facility?” and “Do you own a freezing facility?” were asked.
Table 4.16: Household income categories (n=210)
Responses
Income categories
R500 - R5 000 R6 000 - R9 000 R10 000+ Sample
Question
number
Responses No. % No. % No. % No. %
1 Yes 17 33 31 72 75 65 123 59
No 35 67 12 28 40 35 87 41
2 Yes 34 65 34 79 75 65 143 68
No 18 35 9 21 40 35 67 32
3 Yes 11 32 15 44 26 35 52 36
No 23 68 19 56 49 65 91 64

90
4 Yes 47 90 40 93 114 99 201 96
No 5 10 3 7 1 1 9 4
5 Yes 16 31 8 19 19 17 43 20
No 36 69 35 81 96 83 167 80
N=52
(25%)
N=43
(20%)
N=115 (55%) N=210
Questions
1 Do you waste food?
2 Do you generally use a shopping list?
3 Do you stick to your shopping list?
4 Do you own a cooling facility?
5 Do you own a freezing facility?
Respondents who drafted a shopping list before shopping for food (79%) had a monthly income of R6 000 - R9 000. However, the least
number of respondents at 65% each who drafted a shopping list fell into the monthly income category of R500 - R5 000 and R10 000+. The
study shows that of the 65% respondents with a monthly income of R10 000+, 35% stuck to their shopping list, and 32% of respondents with
a monthly income of R500 - R5 000 stuck to their shopping list. Over 89% of respondents with a monthly income of R10 000+ and R500 -
R5 000 owned a cooling facility, while the majority of respondents (31%) with a monthly income of R500 - R5 000 owned freezing facilities.

91
4.8 Results of statistical analysis
4.8.1 Correlation between income categories and food wastage
Chi-square results for the different income categories and questions related to food
wastage are shown in Table 4.17. Any p-value of < 0.05 is considered statistically
significant, i.e. an indication of an underlying consistent, non-random pattern. Any p-value
of > 0.05 is considered not statistically significant. More details on the chi-square method
were given in section 3.6 of this thesis.
Table 4.17: Chi-square results for the different income categories and questions related to
food wastage
Questions regarding
income categories
P-value Interpretation
Do you waste food The p-value is 0.0001,
considered statistically
significant
Differences between income
categories shown
Drawn by special
offers
The p-value is 0.0015,
considered statistically
significant
Differences between income
categories shown
Do you use shopping
list
The p-value is 0.2233,
considered not statistically
significant
No differences between
income categories shown
Do you stick to
shopping list
The p-value is 0.5452,
considered not statistically
significant
No differences between
income categories shown
Do you use leftovers
in any way
The p-value is 0.0007,
considered statistically
significant
Differences between income
categories shown
Food waste disposal
methods (Garbage
bin, composting and
feeding animals)
The p-value is 0.0001,
considered statistically
significant
Differences between income
categories shown
Type of food wasted
(Pap, rice, bread, and
fruit and vegetables
The p-value is 0.0771,
considered not statistically
significant
No differences between
income categories shown
Reasons for wasting
food
The p-value is 0.1348,
considered not statistically
significant
No differences between
income categories shown
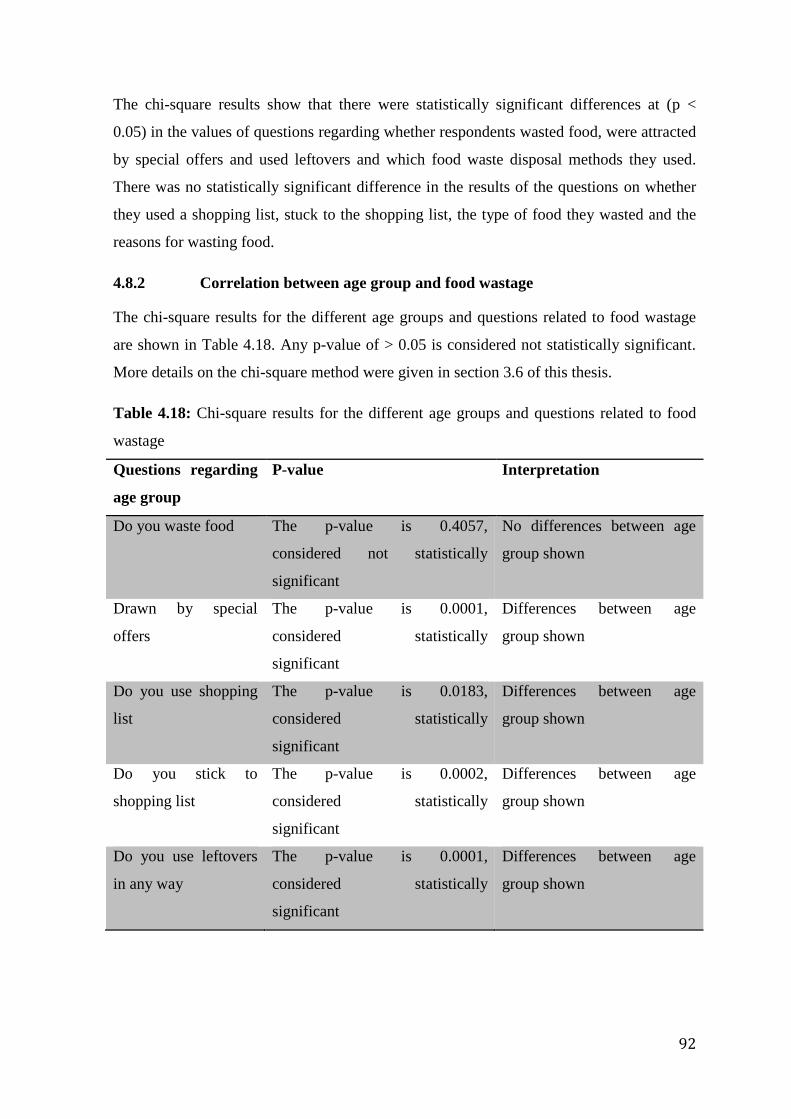
92
The chi-square results show that there were statistically significant differences at (p <
0.05) in the values of questions regarding whether respondents wasted food, were attracted
by special offers and used leftovers and which food waste disposal methods they used.
There was no statistically significant difference in the results of the questions on whether
they used a shopping list, stuck to the shopping list, the type of food they wasted and the
reasons for wasting food.
4.8.2 Correlation between age group and food wastage
The chi-square results for the different age groups and questions related to food wastage
are shown in Table 4.18. Any p-value of > 0.05 is considered not statistically significant.
More details on the chi-square method were given in section 3.6 of this thesis.
Table 4.18: Chi-square results for the different age groups and questions related to food
wastage
Questions regarding
age group
P-value Interpretation
Do you waste food The p-value is 0.4057,
considered not statistically
significant
No differences between age
group shown
Drawn by special
offers
The p-value is 0.0001,
considered statistically
significant
Differences between age
group shown
Do you use shopping
list
The p-value is 0.0183,
considered statistically
significant
Differences between age
group shown
Do you stick to
shopping list
The p-value is 0.0002,
considered statistically
significant
Differences between age
group shown
Do you use leftovers
in any way
The p-value is 0.0001,
considered statistically
significant
Differences between age
group shown

93
The chi-square results show that there was a statistically significant difference at (p < 0.05)
in the values of questions regarding whether respondents were attracted by special offers,
used leftovers, used a shopping list and stuck to the shopping list. There were no
statistically significant differences in questions regarding whether respondents wasted
food.
4.8.3 Correlation between household size and food wastage
Chi-square results for the different household sizes and questions related to food wastage
are shown in Table 4.19. Any p-value of > 0.05 is considered not statistically significant.
More details on the chi-square method were given in section 3.6 of this thesis.
Table 4.19: Chi-square results for the different household sizes and questions related to
food wastage
Questions regarding
household size 1 - 6+
family members
P-value Interpretation
Do you waste food The p-value is 0.0043,
considered statistically
significant
Differences between
household size shown
Drawn by special
offers
The p-value is 0.0001,
considered statistically
significant
Differences between
household size shown
Do you use shopping
list
The p-value is 0.149, considered
not statistically significant
No differences between
household size shown
Do you stick to
shopping list
The p-value is 0.0001,
considered statistically
significant
Differences between
household size shown
Do you use leftovers
in any way
The p-value is 0.0001,
considered statistically
significant
Differences between
household size shown
94
The chi-square results show that there were statistically significant differences at (p <
0.05) in the values of questions regarding whether respondents wasted food, were attracted
by special offers, stuck to a shopping list and used leftovers. There were no statistically
significant differences in questions regarding whether they used a shopping list.
4.9 Conclusion
The study found that there were more female than male respondents, and the majority of
the respondents were 21 - 30 years of age. More than 90% of the respondents indicated
that they had some form of education (e.g. certificate, diploma or degree). The majority
who participated in this study were from 2-member households, with Silver Lakes Golf
Estate having the highest number of respondents in 2-member households. The study
shows that the majority of the respondents had a monthly income of over R10 000,
followed by respondents receiving a monthly income ranging from R500 - R5 000 and
respondents with a monthly income of R6 000 - R9 000.
There were four types of food wasted in this study: pap, bread, rice and fruit and
vegetables. The majority of people living in Atteridgeville Ext 6, 16 and 17 and
Olievenhoutbosch Ext 36 wasted pap as a daily meal. In suburbs such as Montana Park
and Silver Lakes, respondents ultimately wasted rice, while respondents in Silver Lakes
Golf Estate and Lyttelton wasted bread. Respondents wasting fruit and vegetables the most
were from Lyttelton. There was a difference of 9% between respondents who wasted pap
and rice; this may be because households from higher income areas eat more rice
compared to lower income areas where pap is eaten more.
It was found that respondents with a monthly income of R500 - R5 000 wasted 44% of pap
in their households and respondents with a monthly income of R6 000 - R9 000 wasted
bread and rice in their households. The majority of respondents were not attracted by
special offers in this study. The study found that respondents also wasted food because
they bought too much food.
Another reason for respondents wasting food was that they cooked too much food; they
prepared more than what their family members could consume. Respondents indicated that
they wasted food because fruit and vegetables went off, food residue (leftover from
pots/cooking) and poor storage. Respondents with matric wasted fruit and vegetables
because they went off, and only few postgraduates did the same. It was found that
95
respondents with a monthly income of R10 000+ wasted food mostly because they bought
too much and of these, respondents wasted food due to cooking too much. It was
statistically proven that there is a relationship between income level and food waste as well
as household size and food waste to a confidence level of p < 0.0001 difference between
income categories.
At an average of 6 kg of food in a period of three weeks, households with more family
members wasted less food compared to households with fewer members. This is because
the former can share more and finish food which is bought or prepared. There is a need to
confirm this finding with more representative samples of 5-, 6-, 7- and 8-member
households because 1- and 2-member households wasted more than 3- and 4-member
households. Generally, people are wasteful and the amount of food wasted at household
level is higher than would be expected in a developing country (Gustavsson et al., 2011).
This study found that the less income earned, the more food wasted, though there was no
large difference in the amount of food wasted and household income level.
The majority of the respondents relied on the household garbage bin, i.e. municipal waste
collection services, to dispose of food. Numerous respondents fed their food waste to pets
and a small number of respondents composted food waste to produce compost for their
garden. The higher number of respondents who relied on the household garbage bin may
be an indication that consumers do not care about the environment which they live in
because they do not know about the environmental impacts of food waste (Lyndhurst,
2007).
The researcher distributed 210 pamphlets to the participants of this study on how to
compost, what needs to be composted or not, why composting should be done and
composting troubleshooting (Annexure F). The researcher also distributed 210 pamphlets
to the participants on how they would benefit if they focused on growing their own organic
food and how they could start their own garden (Annexure G); these are possible
mitigation strategies that the researcher suggested to minimise households’ food wastage
in the selected areas of CTMM. Due to time constraints, there was no follow-up on
whether households were composting or growing their own food.
The next chapter of conclusions and recommendations will summarise the findings of this
study and outline suggestions for future research.

96
CHAPTER 5: CONCLUSIONS AND RECOMMENDATIONS
5.1 Introduction
The aim and objectives of this study were reached. The study was carried out to assess
households’ food waste in the selected five areas of the CTMM. The assessment was
conducted by means of a face-to-face questionnaire approach and the actual collection and
weighing of the food wasted at household level. This chapter summarises the study
findings in terms of demographics, including income categories, highest qualification,
household size and age range. The type of food wasted the most, the amount of food
wasted per week in kilograms, food waste disposal methods, the relationship between
household income level and food waste, and the drivers that cause households to waste
food are also summarised. Recommendations from the findings are presented and
suggestions for further research are outlined in this chapter.
5.2 Summary of the study findings
Of the 210 households that participated in this study, 58% of the respondents were females
and 42% were males. This is an indication that women are more responsible for the
household groceries and food preparations. The most dominant age group that participated
in this study was 21 - 30 years (43%).
The study found that most (55%) of the respondents had a monthly income of R10 000+.
The higher number of households with formal education may have contributed to their
better lifestyle; this shows that there are benefits of acquiring education in one’s life for
better jobs. The results of this study show that most (28%) of the participants were from 2-
member households, followed by 3-member households. Most (22%) of the respondents
with a postgraduate degree as their highest qualification were from 1-member households,
while there were no postgraduate respondents from 5- to 8-member households.
To assess the type of food wasted in the households, respondents answered that staple food
such as maize porridge (pap) was wasted more (35%), followed by rice (26%), bread
(25%) and fruit and vegetables (14%). The reason pap was wasted by many households

97
may be that food waste is determined by the culture and the South African population has
diverse food preferences which vary by location.
Postgraduate respondents mainly wasted fruit and vegetables. There seems to be a
connection between respondents who wasted fruit and vegetables and qualification level.
Therefore, this might be the reason why the study revealed that 14% of respondents wasted
fruit and vegetables. The study showed that the more family members in the household,
the more they wasted pap, and 44% of the respondents with a monthly income of R500 -
R5 000 wasted pap.
The actual results in this study reveal that 92% of respondents wasted food when only 59%
of households self-reported that they wasted food. Households wasted an average total of 6
kg per week per household. When wasting food, automatically the money spent on buying
that food is wasted. The study shows that 83% of the respondents relied on the household
garbage bin as their food waste disposal method and only 3% of respondents composted
their food waste, while others fed their food waste to pets (14%). It is further interesting to
note that composting was done mostly by the 21 - 40 year old group.
There was an increase in food wasted with age range; the older the respondents, the more
they wasted food; respondents aged 21 – 30 years wasted less food (total average of 5.4 kg
per week. Respondents with a diploma wasted food more compared to other respondents.
The 5-member households wasted more food compared to other household sizes. There
was a decrease in food wasted with monthly income levels: the higher the income level,
the less food wasted. Respondents with a monthly income of R10 000+ wasted less food
compared to other income groups. It was therefore statistically proven that there is a
relationship between income level and food waste where the confidence level was a p <
0.0001 difference between income categories; it was observed that more income does not
necessarily lead to more food waste, but that less income does lead to more food waste.
Six reasons that drive households to throw away food were investigated: cooking too
much, buying too much, special offers, fruit and vegetables going off, food residue and
poor storage. The study found that the main driver of wasting food is cooking too much.
Households prepare more than what their family members can consume. It was reported

98
that 33% of unschooled respondents were from Atteridgeville Ext 6, 16 and 17 and
Olievenhoutbosch Ext 36, which are low-income areas. These respondents wasted food
because of poor storage. At 13%, postgraduate respondents wasted food mostly through
food residue. Respondents of 2-member households wasted more food because they
bought too much food and this is because they were more attracted by special offers.
5.3 Conclusions
This chapter presented the findings in the selected areas of CTMM. It was discovered that
there is a relationship between income level and food waste. Households waste an average
total of 6 kg per week per household. Though households with a higher income waste
more food, there is not much difference between low and medium income. Households
with a monthly income of R500 - R5 000 waste more food than households that have an
income of more than R5 000. The statistical chi-square test was applied and a probability
value (p-value) of < 0.0001 was obtained, indicating that the difference between income
categories was more than just a random pattern. (Note that any p-value of < 0.05 is
considered statistically significant, i.e. an indication of an underlying consistent, non-
random pattern.)
Food waste has negative impacts: it has environmental impacts such as climate change, it
results in insecurity of food supply, and resources used during food production are wasted.
Through questions asked during the actual weighing, it seems that CTMM households are
not aware of the environmental impacts of food waste, and that is why they waste food.
Households might continue to waste food and impact the environment if nothing is done to
educate them about the impact caused by food waste. The study concludes that regardless
of the National Waste Management Strategy’s target to divert waste from landfills, there
are no active and visible management practices in the CTMM that specifically focus on
doing so.
5.4 Recommendations
The findings of this study reveal that for households to reduce the amount of food waste,
several recommendations can be made which will lead to better management of
households’ food waste in the CTMM and possibly in all other municipalities in South
Africa. The outcomes of this study have led to the following recommendations:
99
5.4.1 In the supermarket
Households must draft a shopping list before food shopping. This will help them to plan
their meals and they will know what to purchase when they get to the supermarket instead
of just buying unnecessary food that will end up generating unnecessary waste. They
should be encouraged to use a shopping list and stick to it during shopping for food. This
recommendation is strongly emphasised because of the high number of respondents (36%)
who did not stick to their shopping list. By not sticking to the shopping list households end
up trapped by Buy One Get One Free (BOGOF) special offers and end up buying too
much food which is not planned. These offers encourage customers to purchase food items
that end up unused and discarded as waste. It is also recommended that households buy
less food and buy food that lasts longer.
5.4.2 In the kitchen
It is recommended that households prepare only the amount of food that they can consume
and finish. This is caused by cooking too much food and throwing leftovers into the
garbage bin. Households must take into consideration the size of the food portion when
serving their family members. The study also found that there is a need to encourage
households to store food properly as illustrated on the label of the product. Households
should know which food stays in the cooling facility, freezer facility or at room
temperature.
5.4.3 The use of leftovers
The findings of this study reveal that only 17% of respondents used leftovers. This means
that 83% of respondents in this study just throw away their leftovers. This study
recommends that households use leftovers either by eating them, using them for compost
or feeding them to pets. Households must keep their leftovers in the freezer for another day
or in the cooling facility and eat them the following day rather than throwing their
leftovers in the household garbage bin. To reduce the amount of leftovers wasted in
households, it is also recommended that the CTMM provide recipes using leftovers. There
is a need to train households in food management skills to reduce food waste.

100
5.4.4 Disposal methods and separation
As indicated in this study, 83.3% of respondents relied on the household garbage bin for
their food waste disposal method. This is an opportunity for CTMM to raise awareness on
composting and provide separate bins for composting as an alternative to landfills. The
CTMM may consider using food waste as a biofuel input material for biodigesters to
generate gas such as electricity. The CTMM must prohibit food waste from being disposed
of with general waste in the municipality bins because it ends up at the landfills which
contributes to environmental pollution; household food waste should be stored and
collected separately for the purpose of recycling. It is recommended that food waste
separation at source be started in household kitchens.
Households must be provided with different buckets, barrels or bins for waste collection so
that they can separate food waste generated. The buckets or barrels that will be used for
food waste collection must be leakproof, waterproof and covered when not used. This is to
reduce odour, insects and other pests that may be attracted by food waste. Households’
food waste must be collected by recycling companies at the same frequency as garbage is
removed by the municipality in that community area.
5.4.5 Food waste recycling and awareness
This is an opportunity for the CTMM to raise awareness of reducing household food waste
and to educate people on the impacts of food waste. Additionally, the CTMM needs to
raise awareness to encourage households to recycle food waste and the benefits of doing
so. To reduce the amount of GHG emissions in the environment caused by food waste, the
CTMM must create household awareness and educate people about food waste, separating
food waste at source and recycling food waste. It is recommended that environmental
education be used as a way to raise household food waste awareness in order to encourage
households to recognise the need for recycling their food waste and the benefits of
recycling. This recommendation is highlighted by the fact that only 2.4% of respondents
composted their food waste while 83.3% of the households just threw away food waste
into the garbage bin. Composting might not be the solution but it is also a way to minimise
food waste. This shows that most households are not aware of impact of food wastage and
there is a need for the CTMM to develop strategies that will focus on reducing food waste
and to fund projects that aim at promoting a green environment. The study recommends

101
that food waste awareness campaigns be launched in communities, schools and companies.
In order to reach as much of the population as possible, the study recommends media
campaigns.
There should be ways to start composting in the community, e.g. by using Bokashi to
compost food waste; this can reduce GHG emissions because it will keep food waste from
rotting. There is also a need to educate households on what food waste is and its impact on
the environment because many households do not consider themselves as food wasters. It
is necessary to raise awareness on improving households’ economics skills and the
financial impacts of buying specials. If the food ends up being wasted, the households do
not save any money, but perhaps even end up wasting money.
5.5 Suggestions for further research
Throughout the course of this study, it was found that there are opportunities for further
research on assessing households’ food waste. Further research is required on the
assessment of household food waste to reduce food waste and divert it from landfills.
Further areas for research are as follows:
i. There is a need to assess households’ food waste and collect data in other
municipalities in South Africa as this study data is only from one municipality.
ii. Food waste at all stages of the food supply chain in South Africa can be assessed in
order to understand the drivers of food losses because households are not the only
source of food waste.
iii. The amount of food waste disposed of down the sink, composted or fed to pets in
the households could be quantified, as this study only focused on the food waste
that ends up in the household garbage bin.
iv. The cost of food wasted in households could be determined, since this was not
evaluated in this study.
v. There is a need to investigate how packaging influences food waste at household
level and the food supply chain in South Africa.
vi. There is a need to evaluate household food wastage during different seasons so to
compare data as seasonality of certain food products most definitely influences
consumers’ consumption and therefore their wastage.

102
REFERENCES
3SMedia. (2012). Food Waste Not a Problem in Insecure SA. Available:
http://www.infrastructurene.ws/2012/09/12/food-waste-a-problem-in-food-insecure-sa-
says-iwmsa/ [accessed 11 September 2013].
Allafrica. (2010). South Africa: Waste Not, Want Not is a Lesson Still to be learnt.
Available: http://allafrica.com/stories/201009201320.html [accessed 13 May 2014].
Babbie, E., Mouton, J., Vorster, P. & Prozesky, B. (2001). The Practice of Social
Research, South African Edition, London: Oxford University Press, pp 230.
Babbie, E.R. & Mouton, J. (2002). The practice of social research, Cape Town: Oxford
University Press, pp 90-97.
Baker, D., Fear, J. & Denniss, R. (2009). What a Waste - An Analysis of Household
Expenditure on Food. The Australian Institute, Available: http://www.tai.org.au/node/1580
food ISSN: 1836-9014 [accessed 08 March 2014].
Barr, S. (2002). Household waste in social perspective: Values, attitudes, situation and
behaviour. Aldershot: Ashgate.
Beavan, C. (2007). No impact man: Waste less food, make less greenhouse gas, Available:
http://noimpactman.typepad.com/blog/2007/07/waste-less-food.html [accessed 15 May
2015].
Bellard, C., Bertelsmeier, C., Leadley, P., Thuiller, W., & Courchamp, F. (2012). Impacts
of climate change on the future of biodiversity. Ecology Letters, 15(4), 365–377.
http://doi.org/10.1111/j.1461-0248.2011.01736.x
BMR. (2012). Bureau of Market Research: Income and Expenditure of Households in
South Africa. Available: http://www.unisa.ac.za/news/wp-
content/uploads/2013/01/Household-income-and-expenditure-patterns-Press-Release-
3Jan2012.pdf [accessed 18 July 2014].
Borisova, A. (2013). Food waste in Denmark: investigating the antecedents of food waste
avoidance among Danish households. MSc dissertation, Aarhus School of
Business/University of Aarhus.

103
Buzby, J.C. & Hyman, J. (2012). Total and Per Capita Food Loss in the United States.
Food Policy, 37: 561–570. Available: http://dx.doi.org/10.1016/j.foodpol.2012.06.002
[accessed 11 May 2014].
Buzby, J.C., Wells, H.F. & Hyman, J. (2014). The Estimated Amount, Value, and Calories
of Postharvest Food Losses at the Retail and Consumer Levels in the United States, EIB-
121, US Department of Agriculture, Economic Research Service. Available:
www.ers.usda.gov/publications/eib-economic-information-bulletin/eib-xxx.aspx [accessed
03 March 2014].
Cameron, J.W.M. & Krynauw, M.N. (2001). City of Tshwane: Development challenges.
20th
South Africa Transport Conference on Meeting the Transport Challenges in Southern
Africa, 16-20 July, South Africa [accessed 08 March 2014].
Cant, M., Gerber-Nel, C., Nel, D. & Kotze, T. (2005). Marketing research. Pretoria: Van
Schaik, pp 10-170.
Cengel, Y.A. (2007). Heat and mass transfer: A practical approach. 3rd
edition. Available:
http://highered.mheducation.com/sites/dl/free/0073398128/835451/Chapter17.pdf
[accessed 15 May 2015].
City of Tshwane. (n.d.). Map of Tshwane. Available:
http://www.tshwane.gov.za/AboutTshwane/MapsandGIS/General%20Maps/Gauteng_Prov
ince_A4_Detail.pdf [accessed 9 February 2015].
Cohen, L., Manion, L. & Morrison, K. (2000). Research methods in education. 5th
edition.
London: Routledge Falmer, pp 44-171.
Cooper, D.R. & Schindler, P.S. (2006). Business research methods. New York: McGraw-
Hill, pp 34-353.
Cram101 Textbook Reviews. (2012). The Human Past. Available:
https://books.google.co.za/books?id=Rz7ypwwX90gC&pg=PT438&lpg=
PT438&dq=Pretoria+which+is+a+found+in+the+North+part+of+Gauteng+
province;+it+is+one+of+the+country%27s+capital+cities,+serving+as+the+
administration&source=bl&ots=9eRSOMmR6z&sig=
njSkNrM1c1Rvy1x3m8pzUUduzGc&hl=en&sa=X&ei=IMpdVc61E8ixUa_igegC&
ved=0CD0Q6AEwBzgK#v=onepage&q=Pretoria%20which%20is%20a%
20found%20in%20the%20North%20part%20of%20Gauteng%20province%3B%

104
20it%20is%20one%20of%20the%20country's%20capital%20cities%2C%
20serving%20as%20the%20administration&f=false [accessed 21 May 2015].
Crutch, L. (2014). Stop Throwing Away So Much Bread. Available:
http://www.fiverfeeds.co.uk/stop-throwing-away-so-much-bread/ [accessed 02 November
2014].
Daly, K.J. (2007). Qualitative methods for family studies and human development.
Thousand Oaks, CA: Sage, pp 23.
Danish Agriculture and Food Council, and Danish Environmental Protection Agency.
(2006/2008). Stop Wasting Food Movement Denmark, Available:
http://www.stopspildafmad.dk/inenglish.html [accessed 05 January 2015].
Danish Agriculture and Food Council. (2011). Food Waste: A global tragedy. Aarhus
University, CONCITO, the Institute of Food and Resource Economics, pp31.
Danish Environmental Protection Agency. (2012). A Danish Family throws out 105 Kilos
of Edible Food Every Year. Copenhagen: Danish Ministry of the Environment. Available:
http://eng.mst.dk/about-the-danish-epa/news/news-archives/2012/jun/a-danish-family-
throws-out-105-kilos-of-edible-food-every-year/ [accessed 04 February 2014].
DEA. (2011). The national waste management strategy. Available:
https://www.environment.gov.za/sites/default/files/docs/nationalwaste_management_strate
gy.pdf [accessed 08 February 2016].
DEA. (2012). The waste group: expansion and licencing of waste management facilities at
Mooiplaats report. Report No. 10612007-11281-2, p45
DEA. (2013). The waste information report. Department of Environmental affairs Pretoria:
pp12.
DEFRA. (2010). Household Food and Drink Waste linked to Food and Drink Purchases.
Department for Environment, Food and Rural Affairs Available:
https://www.gov.uk/government/uploads/system/uploads/attachment_data/file/137950/defr
a-stats-foodfarm-food-foodwastepurchases-100727.pdf [accessed 05 March 2014].
Department of Environmental Affairs and Tourism (DEAT). (2014). National
Environmental Management: Waste Act 59 of 2008. Government Printer: Pretoria, pp41

105
Department of Environmental Affairs and Tourism (DEAT). (n.d.). Guideline on Waste
Collection in High Density and Unserviced Areas. Available:
http://sawic.environment.gov.za/documents/231.pdf [accessed 18 May 2015].
Department of Transport, United Kingdom. (2008). Building Sustainable Transport into
New Developments: A Menu of Options for Growth Points and Eco-towns. Available:
http://www.dft.gov.uk/pgr/sustainable/sustainabletransnew.pdf [accessed 17 July 2013].
Epp, D.J. & Mauger, P.C. (1989). Attitudes and household characteristics influencing solid
waste generation: A household garbage analysis. North Eastern Journal of Agricultural
and Resource Economics, 18 (1): 46‐51.
European Commission (EC). (2008). Directive 2008/98/EC of the European Parliament
and of the Council of 19 November 2008 on waste and repealing certain directives.
Official Journal of the European Communities, pp15
European Commission (EC). (2010). Final report – Preparatory study on food waste
across EU27. DG ENV – Directorate C, Brussels, Belgium.
European Commission (EC). (2011). Technical report for end of waste criteria on
biodegradable waste subject to biological treatment. Institute for prospective technological
studies, Seville, Spain.
European Union (EU). (2011). About FUSIONS reducing Food Waste in Europe.
Available: http://www.eu-fusions.org/ [accessed 09 January 2015].
Eurostat. (2008). Pressemitteilung 88/2008 [“Press release 88/2008”]. Available:
www.eds-destatis.de/de/press/download/08_06/088-2008-06-19.pdf [accessed 12 March
2013].
FAO. (2011). Global Food Losses and Food Waste: Extent, Causes and Prevention. Food
and Agriculture Organization. Available:
http://www.fao.org/docrep/014/mb060e/mb060e.pdf [accessed 13 June 2014].
FAO. (2013). Tool Kit reducing the Food Wastage Footprint. Food and Agriculture
Organization Available: http://www.fao.org/docrep/018/i3342e/i3342e.pdf [accessed 15
May 2014].

106
FAO. (n.d.). Dimensions of Need: “What do People Eat?” Food and Agriculture
Organization Available: http://www.fao.org/docrep/u8480e/u8480e07.htm [accessed 01
June 2015].
Feedback. (2014). Feeding the 5000. Available: http://www.feeding5k.org/businesses.php
[accessed 12 January 2015].
Food Standards Agency (FSA). (2008). Consumer Attitudes to Food Standards. Available:
www.food.gov.uk/multimedia/pdfs/cas2007ukreport.pdf [accessed 17 January 2014].
Franke, U. (2013). Food Waste in Sweden. Available:
http://www.oecd.org/site/agrfcn/Session_5_Ulrika%20Franke.pdf [accessed 19 May
2015].
Gjerris, M. & Gaiani, S. (2013). Household food waste in Nordic countries: Estimations
and ethical implications. Nordic Journal of Applied Ethics, 7 (1): 6-23.69
Glanz, R. (2008). Causes of food waste generation in households – an empirical analysis.
MSc thesis, University of Natural Resources and Applied Life Sciences: Vienna and
Cranfield University.
Göbel, C., Langen, N., Blumenthal, A., Teitscheid, P. & Ritter, G. (2015). Cutting food
waste through cooperation along the food supply chain. Sustainability, 7: 1429 – 1445.
Göbel, C., Teitscheid, P., Ritter, G., Blumenthal, A., Friedrich, S., Frick, T., Grotstollen,
L., Möllenbeck, C., Rottstegge, L., Pfeiffer, C., Baumkötter, D., Wetter, C., Uekötter, B.,
Burdick, B., Langen, N., Lettenmeier, M. & Rohn, H. (2012). Reducing food waste -
Identification of causes and courses of action in North Rhine-Westphalia. Abridged
version. Münster: University of Applied Sciences, Institute for Sustainable Nutrition and
Food Production 5:1662 – 1935.
Gooch, M., Felfel, A. & Marenick, N. (2010). Food Waste in Canada. Value Chain
Management Centre, George Morris Centre. Available:
http://www.valuechains.ca/documents/Food%20Waste%20in%20Canada%20150117.pdf
[accessed 17 January 2015].
Gregson, N., Crang, M., Ahamed, F., Akhter, N. & Ferdous, R. (2010). Following things
of rubbish value: End-of-life ships, chock-chocky furniture and the Bangladeshi middle
class consumer. Geoforum, 41 (6): 846-854.

107
Griffin, M., Sobal, J. & Lyson, T.A. (2009). An analysis of a community food waste
stream: Agriculture and Human Values 26: 67–81. Available:
http://dx.doi.org/10.1007/s10460-008-9178-1 [accessed 11 November 2013].
Guba, E.G. & Lincoln, Y.S. (1994). Competing paradigms in qualitative research. In N.K.
Denzin & Y.S. Lincoln (eds.), Handbook of qualitative research. London: Sage, pp 105-
117.
Gustavsson, J., Cederberg, C., Sonesson, U., Otterdijk, R. & Meybeck, A. (2011). Global
Food Losses and Food Waste: Extent, Causes and Prevention. Food and Agriculture
Organization of the United Nations. Available:
http://www.fao.org/docrep/014/mb060e/mb060e00.pdf [accessed 12 June 2012].
Hair, F.J., Wolfinbarger, M., Ortinau, D.J. & Bush, R.P. (2008). Essentials of marketing
research. New York: McGraw-Hill/Irwin, pp 70-78.
Hall, K.D., Guo, J., Dore, M. & Chow, C.C. (2009). The Progressive Increase of Food
Waste in America and Its Environmental Impact. 4: 15-20 doi:10.
1371/journal.pone.0007940.
Hamann, C. & Horn, A. (2014). Continuity or Discontinuity: Evaluating the Changing
Socio-spatial Structure of the City of Tshwane: South Africa. Urban Forum, 05 April.
Available: http://www.dx.doi.org/10.1007/s12132-014-9231-7 [accessed 15 December
2014].
Hamilton, C., Denniss, R. & Baker, D. (2005). Wasteful Consumption in Australia.
Discussion paper number 77, March, Manuka, Australia: The Australia Institute.
Available: http://www.tai.org.au/documents/dp fulltext/DP77.pdf [accessed 11 October
2012].
Hanssen, O.J. & Møller, H. (2013). Food wastage in Norway 2013. Status and trends
2009-13: Report No: OR.32.13 from the For Mat project, pp 1-29.
Hosken, G. (2013). Twelve Million going to Bed Hungry in SA. Available:
http://www.timeslive.co.za/thetimes/2013/01/30/twelve-million-going-to-bed-hungry-in-sa
[accessed 06 February 2013].

108
Institution of Mechanical Engineers. (2013). Food Waste: Half Of All Food Ends Up
Thrown Away. Available: http://www.huffingtonpost.co.uk/2013/01/10/food-waste-half-
of-all-fo_n_2445022.html [accessed 23 April 2015].
IPCC. (2007). Climate Change: Synthesis Report. Available:
https://www.ipcc.ch/publications_and_data/ar4/syr/en/mains1.html [accessed 12 January
2016].
Jones, T. (2003). Using Contemporary Archaeology and Anthropology to Understand
Food Loss in the American Food System. Unpublished paper. Tucson: Bureau of Applied
Research in Anthropology, University of Arizona, pp42
Jones, T. (2006). Addressing Food Wastage in the US. Interview: ‘The Science Show, 8
April’. Available: http://www.abc.net.au/rn/scienceshow/stories/2006/1608131.htm
[accessed 08 November 2012].
Juul, S. (2008). About Selina Juul. Available:
http://www.selinajuul.com/aboutselinajuul.html [accessed 08 March 2014].
Kahn, T. (2010). South Africa: Waste not, want not is a lesson still to be learnt. Available:
http://allafrica.com/stories/201009201320.html [accessed 23 May 2014].
Katajajuuri, J.M., Silvennoinen, K., Hartikainen, H., Heikkilä, L., & Reinikainen, A.
(2014). Food waste in the Finnish food chain. Journal of Cleaner Production.73: 322-329.
Available: http:// dx.doi.org/10.1016/j.jclepro.2013.12.057 [accessed 12 January 2015].
Kevin, H. (2009). Food Waste and Climate Change: Will You Change Your Habits?
Available: http://www.cbc.ca/news/pointofview/2009/11/food-waste-and-climate-change-
will-you-change-your-habits.html [accessed 21 June 2014].
Koivupuro, H.K., Hartikainen, H., Silvennoinen, K., Katajajuuri, J.M., Heikintalo, N.,
Reinikainen, A. & Jalkanen, L. (2012). Influence of socio-demographical, behavioural and
attitudinal factors on the amount of avoidable food waste generated in Finnish households.
International Journal of Consumer Studies, 36 (2): 183–191. Available:
http://dx.doi.org/10.1111/j.1470-6431.2011.01080.x [accessed 12 January 2015].

109
Kumar, A. & Singh, S. (2013). Domestic solid waste generation – A case study of semi
urban area of Kathua district. International Journal of Scientific & Research Publications,
3 (5): 2250-3153.
Langley, J., Yoxall, A., Heppell, G., Rodriguez, E.M., Bradbury, S., Lewis, R., Luxmoore,
J., Hodzic, A. & Rowson, J. (2010). Food for thought? – A UK pilot study testing a
methodology for compositional domestic food waste analysis. Waste Management &
Research, 28: 220-227.
Law, K.L. (2013). How social practices causes food wastes generation. Case study:
Students of the UEA. MSc thesis, University of East Anglia. Available:
https://www.uea.ac.uk/documents/541248/10788799/Law+Kai.pdf/c39bcd12-c5c0-431f-
8e33-a3daaa5fb0be [accessed 10 February 2015].
Lebersorger, S. & Schneider, F. (2011). Discussion on the methodology for determining
food waste in household waste composition studies. Waste Manage, 31 (9–10): 1924–
1933.
Leedy, P.D. & Ormrod, J.E. (2009). Practical research: Planning and design. 9th
edition.
Prentice Hall, pp 139-140.
Lehohla, P. (2015). The Number of South Africans Living in Poverty has Increased Since
2010. Statistics SA. Available: http://www.sowetanlive.co.za/news/2015/02/03/growing
poverty in S.A. [accessed 03 February 2015].
Li, D., Wang, X., Chan, H.K. & Manzini, R. (2014). Sustainable food supply chain
management. International Journal of Production Economics, 152: 1–8.
Lipinski, B. (2013). Reducing Food Loss and Waste: World Resources Institute. Available:
http://www.wri.org/blog/2013/06/numbers-reducing-food-loss-and-waste [accessed 15
February 2015].
Lundqvist, J., De Fraiture, C. & Molden, D. (2008). Saving Water: From Field to Fork –
Curbing Losses and Wastage in the Food Chain. SIWI Policy Brief, Stockholm:
Stockholm International Water Institute. Available:
https://center.sustainability.duke.edu/sites/default/files/documents/from_field_to_fork_0.p
df [accessed 21 February 201].
110
Lyndhurst, B. (2007). Food Behaviour Consumer Research – Findings from the
Quantitative Survey. Briefing paper. Banbury: WRAP. Available:
http://www.wrap.org.uk/content/ [accessed 11 September 2013].
MacGregor, K (2009). South Africa: High returns from post-school education, University
World News. Available:
http://www.universityworldnews.com/article.php?story=20091218101943327 [accessed
17 February 2014].
Madubula, N. & Makinta, V. (2012). Submission for the 2013/14 division of revenue
technical report. Financial and Fiscal Commission, chapter 6, pp 199-236.
Mena, C., Adenso-Diaz, B. & Yurt, O. (2011). The causes of food waste in the supplier-
retailer interface: Evidences from the UK and Spain. Resources, Conservation and
Recycling, 55: 648-658.
Mikkelsen, M. (2012). Food wastes: Exploring consumers’ attitudes towards household
food waste. MSc thesis, Aalborg University, Available:
http://projekter.aau.dk/projekter/en/studentthesis/madspild(919740ab-d7d6-4311-9eda-
119f1361ff4b).html [accessed 11 May 2014].
Ministry of Economic Affairs, Agriculture and Innovation, The Netherlands. (2014).
Preventing Food Waste and Optimising Residual Waste Streams. Available: http://no-
opportunitywasted. com/images/document/416.pdf [accessed 05 January 2015].
Morgan, E. (2009). Fruit and vegetable consumption and waste in Australia. Victoria:
State Government of Victoria, Victorian Health Promotion Foundation, Available:
http://secondbite.org/sites/default/files/FruitVegConsumptionWasteinAustraliaVICHEAL
TH.pdf [accessed 09 June 2015].
Mouton. J. (1998). Introduction to qualitative research. Pretoria: Human Science Research
Council, pp 47-55.
Murad, W.M., Hasan, M.M. & Shoeb-Ur-Rahman, M. (2012). Relationship between
personality traits of the urban poor concerning solid waste management and household
income and education. Interdisciplinary Description of Complex Systems, 10 (2): 174-192.
Muth, M.K., Karns, S.A., Nielsen, S.J., Buzby, J.C. & Wells, H.F. (2011). Consumer-level
food loss estimates and their use in the ERS loss-adjusted food availability data. Technical
111
Bulletin No. 1927, United States Department of Agriculture, Economic Research Service,
January 2011, p 123.
Nahman, A. & Lange, W.J. (2013). Costs of food waste along the value chain: evidence
from South Africa. Waste Management. 33, 2493–2500.
Nahman, A., De Lange, W., Oelofse, S. & Godfrey, L. (2012). The costs of household
food waste in South Africa. Waste Management, 32: 2147–2153.
Nannyonga, B. (2006). An optimal model and its application for the management of
municipal solid waste and disposal ability. PhD proposal, Makereke University, Kampala,
Available: http://docs.mak.ac.ug/sites/default/files/Betty_Proposal.pdf [accessed 13
August 2013].
National Waste Management Strategy. (2011). Department of Environmental Affairs,
Republic of South Africa. Available:
https://www.environment.gov.za/sites/default/files/docs/nationalwaste_management_strate
gy.pdf [accessed 25 June 2012].
New South Wales government (NWS). (2011). Food Waste Avoidance Benchmark Study,
Sydney. Available:
http://www.lovefoodhatewaste.nsw.gov.au/portals/0/docs/11339FWABenchmarkstudy.pdf
[accessed March 2014].
Oelofse, S. & Nahman, A. (2013). Estimating the magnitude of food waste generated in
South Africa. Waste Management & Research, 31 (1): 80-86.
Oelofse, S. (2012). South African Households in Large Centres to Separate Household
Waste by 2016. Available: http://www.csir.co.za/enews/2012_nov/01.html [accessed 07
January 2014].
OHSAS 18001. (2007). Occupational health and safety management system requirements.
Available: https://www.sabs.co.za/Training-Academy/docs/OHSASBrochure.pdf
[accessed 15 February 2015].
Olufssøn, H.K. (2012). Prevention of Food Waste. Presentation of the ForMat-project.
Kraakeroey: Ostfold Research Co. Available:
http://ostfoldforskning.no/uploads/dokumenter/Food%20Waste%20juni%202012/Preventi
112
on%20of%20food%20waste%20%20Halfdan%20Kverneland%20Olafss%C3%B8n,%20
Matvett%20AS.pdf [accessed 09 October 2013].
Papargyropoulou, E., Lozano, R., Steinberger, K.J., Wright, N. & Ujang, Z.B. (2014). The
food waste hierarchy as a framework for the management of food surplus and food waste.
Journal of Cleaner Production, 76: 106-115. Available:
http://dx.doi.org/10.1016/j.jclepro.2014.04.020 [accessed 15 January 2015].
Parfitt, J., Barthel, M. & McNaughton, S. (2010). Food waste within food supply chains:
Quantification and potential for change to 2050. Philosophical Transactions Royal Society
B: Biological Sciences, 365: 3065-3081. Available:
http://:www.ncbi.nlm.nih.gov/pmc/articles/PMC2935112/ [accessed 15 March 2014].
Parizeau, K., Von Massow, M. & Martin, R. (2015). Household-level dynamics of food
waste production and related beliefs, attitudes, and behaviours in Guelph, Ontario, Waste
Management, 35: 207–217.
Payne, K.K. (2014). The consequences of food waste. Student Pulse 6 Available:
http://www.studentpulse.com/a?id=890 [accessed 02 January 2015].
Pekcan, G., Köksal, E., Kücükerdönmez, Ö. & Özel, H. (2006). Household food wastage
in Turkey. Working Paper Series, No: ESS/ESSA/006e. Food and Agriculture
Organization of the United Nations, Available:
http://www.fao.org/docrep/013/am063e/am063e00.pdf [accessed 02 January 2015].
Poate, C.D. & Daplyn, P.F. (1993). Data for agrarian development. New York:
Cambridge University Press, pp 243-301.
Polit, D.F. & Hungler, B.P. (1995). Nursing research: Principles and methods. 5th
edition.
Philadelphia: Lippincott, pp 352-639.
Proctor, T. (2000). Essentials of marketing research. Harlow: Pearson Education, pp 80-
88.
Quested, T. & Johnson, H. (2009). Household food and drink waste in the UK: A report
containing quantification of the amount and types of household food and drink waste in the
UK. Banbury: Waste and Resources Action Programme, pp 4.
113
Quested, T., Marsh, E. & Stunell, D. (2013). Spaghetti soup: The complex world of food
waste behaviours. Resources, Conservation and Recycling, 79 (2013): 43–51.
Ramukhwatho, F.R., Du Plessis, R. & Oelofse, S. (2014). Household food wastage in a
developing country: A case study of Mamelodi Township in South Africa. WasteCon
2014, 22nd Waste Management Conference and Exhibition: Wired for Waste - Value,
Grow, Sustain, Somerset West, 6-10 October, pp 468 – 475.
Rathje, W. & Murphy, C. (2001). Rubbish! The archaeology of garbage. Tucson, AZ:
University of Arizona Press.
Roberts-Lombard, M. (2002). Marketing research - A Southern African perspective. Cape
Town: Future Managers, pp 145-151.
Robson, C. (2011). Real world research: A resource for users of social research methods
in applied settings. Chichester: Wiley, pp 182-190.
Rouse, M. (2005). Definition of demographics. Available:
http://whatis.techtarget.com/definition/demographics [accessed 01 June 2015].
SACN. (2011). State of Cities, South African Cities Network Report 2011. Available:
http://www.sacities.net/ [accessed 07 February 2014].
Sattari, S. (2007). Application of disconfirmation theory on customer satisfaction
determination model in mobile telecommunication: Case of prepaid mobiles in Iran.
Published MSc in Marketing and Electronic Commerce thesis, Lulea University of
Technology, Scandinavia.
Schneider, F. (2008). Wasting food: An insistent behaviour. The Social Context '08 Urban
Issues and Solutions. Vienna, Austria: Department of Waste Management, BOKU-
University of Natural Resources and Applied Life Sciences, pp 1-10.
Segrè, A. (2008). Transforming Food Waste into a Resource. Last Minute Market and the
Italian Case Study. Faculty of Agriculture of the University of Bologna: Italy. Available:
www.lastminutesmarket.it [accessed 15 November 2014].
Silvennoinen, K., Katajajuuri, J.M., Hartikainen, H., Jalkanen, L., Koivupuro, H. K. &
Reinikainen, A. (2012). Food waste volume and composition in the Finnish supply chain:
Special focus on food service sector. Fourth International Symposium on Energy from
Biomass and Waste, Venice, Italy, 12-15 November, pp 6-9.

114
Skourides, I., Smith, S.R. & Loizides, M. (2008). Sources and factors controlling the
disposal of biodegradable municipal solid waste in urban and rural areas of Cyprus. Waste
Management & Research, 26: 188-195.
Snyman, J. (2008). A zero waste model for the City of Tshwane Metropolitan
Municipality. DTech thesis, Tshwane University of Technology, Pretoria.
South Africa. (2008). National Environmental Management: Waste Act 59 of 2008.
Pretoria: Government Printer.
Sridharan, A. Ye, T. & Zang, H. (2006). Is sampled data sufficient for anomaly detection:
Sprint advanced technology labs, Rio de Janeiro, Brazil.
Statistics Finland. (2011). Annual National Accounts [e-publication]. Available:
http://www.stat.fi/til/vtp/index_en.html [accessed 14 November 2013].
Statistics South Africa. (2001). Labour Market Status by Income (Report no. 03-05-16
(2001)), Pretoria. Available: http://www.statssa.gov.za/publications/Report-03-02-
16/Report-03-02-16.pdf [accessed 14 July 2013].
Statistics South Africa. (2008). Measuring poverty in South Africa: Methodological report
on the development of the poverty lines for statistical reporting. Pretoria. Also available:
http://beta2.statssa.gov.za/?page_id=1854&PPN=D0300 [accessed 17 May 2013].
Statistics South Africa. (2011a). Mid-year population estimates - 2011. Pretoria.
Statistics South Africa. (2011b). Release V1.1 geography by income category for person
adjusted, South African census. Pretoria.
Stefan, V. (2011). Romanian consumers’ perceptions and practices regarding food waste.
MSc thesis, Aarhus School of Business, Aarhus University, pp 5-71.
Stefan, V., Van Herpen, E., Tudoran, A. & Lähteenmäki, L. (2013). Avoiding food waste
by Romanian consumers: The importance of planning and shopping routines. Food Quality
and Preference, 28: 375–81, Available: http://dx.doi.org/10.1016/j.foodqual.2012.11.001
[accessed 12 April 2014].
Stop Wasting Food. (2008). Food Waste A Global Tragedy. Available: http://www.bonn-
conference.nrw.de/pdf/Unterlagen_2012/Reden/
StopWastingFood.pdf [accessed February 2013].

115
Streubert, H.J. & Carpenter, D.R. (2003). Qualitative research in nursing: Advancing the
humanistic imperative. 3rd
edition. Philadelphia: Lippincott, pp 18-362.
Stuart, T. (2009). Waste, uncovering the global food scandal. London: Penguin.
Swedish Environmental Protection Agency (SEPA). (2013). Draft interim targets for the
reduced amount of food waste, Stockholm. Available:
http://www.livsmedelsverket.se/globalassets/matvanor-halsa
miljo/miljo/matsvinn/projektsammanfattningar-eng-13-jan-2016.pdf [accessed 09 June
2013].
Swedish National Food Agency. (2013). Report summaries from Swedish food waste
reduction project 2013 - 2015. Available:
http://www.livsmedelsverket.se/globalassets/matvanor-halsa
miljo/miljo/projektsammanfattningar_eng_01.pdf [accessed 01 July 2014].
Swedish Waste Management Recycling Association ‘Avfall Sverige’. (2011). Swedish
Waste Management, Available:
http://www.avfallsverige.se/fileadmin/uploads/Rapporter/Utveckling/Rapporter_2011/SA
H_eng111219.pdf [accessed 21 May 2013].
Taylor, P. (2002). Analysing quantitative data. In J. Charles Worth, J. Lewis, V. Martin, &
P. Taylor (eds.), Toolkit 2: Investigating performance and change: Study guide for MBA
B736. Milton Keynes: Open University, pp 20-46.
The National Organic Waste Composting Strategy. (2013). Draft guideline document for
composting. Available: http://sawic.environment.gov.za/documents/1825.pdf [accessed 05
February 2014].
Tike. (2010). Balance Sheet for Food Commodities 2008 and 2009 (preliminary).
Available: http://www.maataloustilastot.fi [accessed 01 May 2014].
Tukker, A., Eder, P. & Suh, S. (2006). Environmental impacts of products: Policy relevant
information and data challenges. Journal of Industrial Ecology, 10 (3): 183–198.
UNISA. (2007). Policy on Research Ethics. Available:
http://www.unisa.ac.za/contents/research/docs/ResearchEthicsPolicy_apprvCounc_21Sept
07.pdf [accessed 27 April 2011].

116
United Nations (UN). (2011). World population projected to reach 9.6 billion by 2050.
Available: http://www.un.org/en/development/desa/news/population/un-report-world-
population-projected-to-reach-9-6-billion-by-2050.html [accessed 12 April 2014].
US Environmental Protection Agency (USEPA). (2009). Municipal solid waste
generation, recycling, and disposal in the United States: Facts and figures for 2008.
Washington, DC, Available: https://www.epa.gov/smm/advancing-sustainable-materials-
management-facts-and-figures [accessed 12 April 2014].
US Environmental Protection Agency (USEPA). (2011). Reducing Greenhouse Gas
Emissions through Recycling and Composting. Available:
http://www.epa.gov/region10/pdf/climate/wccmmf/Reducing_GHGs_through_Recycling_
and_Composting.pdf [accessed 13 October 2014].
US Environmental Protection Agency (USEPA). (2012). Municipal Solid Waste.
Available: http://www.epa.gov/epawaste/nonhaz/municipal/ [accessed 14 August 2014].
US Environmental Protection Agency (USEPA). (2014). Uppsala Vatten 2013,
Miljorapport 2013 Biogasanlaggningen vid Kungsangens gård (Millionorapport 2013
Biogasanl aggningen at Kungs meadow yard) Uppsala Vatten: Uppsala. Available:
http://www.epa.gov/foodrecoverychallenge/ [accessed 12 March 2015].
Wassermann, G. & Schneider, F. (2005). Edibles in Household Waste. Proceedings of the
Tenth International Waste Management and Landfill Symposium, CISA, S. Margherita di
Pula, Sardinia, pp 913-914.
Waste and Resources Action Programme (WRAP). (2007a). Food Behaviour Consumer
Research: Quantitative Phase. Available:
http://www.wrap.org.uk/sites/files/wrap/Food%20behaviour%20consumer%20research%2
0quantitative%20jun%202007.pdf [accessed 13 April 2014].
Waste and Resources Action Programme (WRAP). (2007b). Understanding Food Waste:
Research Summary. Available:
http://www.wrap.org.uk/sites/files/wrap/FoodWasteResearchSummaryFINALADP29_3__
07.pdf [accessed 13 June 2014].

117
Waste and Resources Action Programme (WRAP). (2008). The Food We Waste (Food
Waste Report No. 12-237). Available: http://wrap.s3.amazonaws.com/the-food-we-
waste.pdf [accessed 20 May 2013].
Waste and Resources Action Programme (WRAP). (2009a). Evaluation of the WRAP
Separate Food Waste Collection Trials. Resources Futures.
Waste and Resources Action Programme (WRAP). (2009b). Household Food and Drink
Waste in the UK (Final Report). Available:
http://www.wrapcymru.org.uk/sites/files/wrap/Household%20food%20and%20drink%20
waste%20in%20the%20UK%20-%20report.pdf [accessed 02 May 2014].
Waste and Resources Action Programme (WRAP). (2010). Waste Arising in the Supply of
Food and Drink to the Households in the UK (Final Report). Banbury
Waste and Resources Action Programme (WRAP). (2011). New Estimates for Household
Food and Drink Waste in the UK; 2011. Available: http://www.wrap.org.uk/content/new-
estimateshousehold-food-and-drink-waste-uk [accessed 10 September 2014].
Waste and Resources Action Programme (WRAP). (2013). Consumer Attitudes to Food
Waste and Food Packaging. Available:
http://www.wrap.org.uk/sites/files/wrap/Report%20-
%20Consumer%20attitudes%20to%20food%20waste%20and%20packaging.pdf [accessed
21 April 2013].
Watanabe, K., Fukuoka, M., Mohamad, A.F. & Basri, N.E.A. (2011). Assessing the
potential of reduction and recycling of household waste in Malaysia. Proceedings of the
3rd
International Conference on Waste – The Social Context. Edmonton, Alberta, Canada,
Available: http://www.ewmce.com/Resources/Documents/Kohei_Watanabe_-
_Assesing_the_Potential_of_Reduction_and_Recycling_in_Malaysia.pdf [accessed 15
June 2013].
Wenlock, R. & Buss, D. (1977). Wastage of edible food in the home: A preliminary study.
Journal of Human Nutrition, 31: 405–411.
Wenlock, R., Buss, D., Derry, B. & Dixon, E. (1980). Household food wastage in Britain.
British Journal of Nutrition, 43: 53-70.

118
Williams, H., Wikström, F., Otterbring, T., Löfgren, L. & Gustafsson, A. (2012). Reasons
for household food waste with special attention to packaging. Journal of Cleaner
Production, 24 (1): 141-148.
World Food Programme. (2013). Women and Hunger: 10 Facts. Available:
http://www.wfp.org/our-work/preventing-hunger/focuswomen/ women-hunger-facts
[accessed 18 February 2015].
Wyse, S.E. (2012). Why Use Demographics Questions in Surveys. Available:
http://www.snapsurveys.com/blog/demographics-questions-surveys/ [accessed 01June
2015].

119
ANNEXURES
Annexure A: Questionnaire on food waste in English
Questionnaire No._____; Suburb/Location: Atteridgeville Ext 6, 16, and 17, Lyttelton,
Montana Park, Olievenhoutbosch Ext 36 and Silver Lakes Golf Estate
(Please tick whichever is applicable)
GENERAL:
1. What is your gender? [ ] Male [ ] Female
2. How many persons live in your household? [ ] 1, [ ] 2, [ ] 3, [ ] 4, [ ] 5, [ ] 6, [
] 7, [ ] 8
3. What kind of ownership (accommodation) are you living in? [ ] Rental or [ ] Own
house
4. Which age group are you? [ ] 18-20, [ ] 21-30, [ ] 31-40, [ ] 41-50, [ ] 51-60, [ ]
61-70, [ ] 70+______
5. What is your highest qualification? [ ] Unschooled, [ ] Matric, [ ] Diploma, [ ]
Degree, [ ] Post Graduate
6. What is your source of income? [ ] Employed, [ ] self-employed, [ ] Retired, [ ]
House wife/husband [ ] Student or [ ] other source of income [ ] _________
7. What is your monthly income? [ ] R500 – R5000, [ ] R6000- R9000, [ ] R10000+
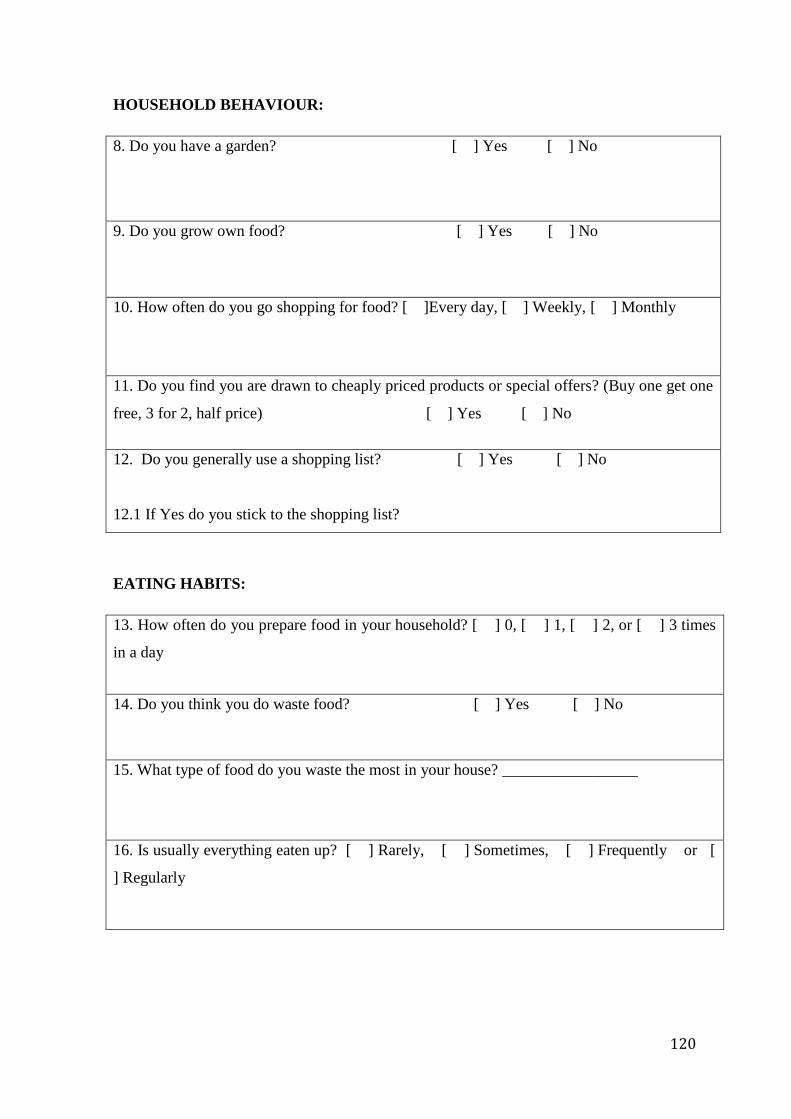
120
HOUSEHOLD BEHAVIOUR:
8. Do you have a garden? [ ] Yes [ ] No
9. Do you grow own food? [ ] Yes [ ] No
10. How often do you go shopping for food? [ ]Every day, [ ] Weekly, [ ] Monthly
11. Do you find you are drawn to cheaply priced products or special offers? (Buy one get one
free, 3 for 2, half price) [ ] Yes [ ] No
12. Do you generally use a shopping list? [ ] Yes [ ] No
12.1 If Yes do you stick to the shopping list?
EATING HABITS:
13. How often do you prepare food in your household? [ ] 0, [ ] 1, [ ] 2, or [ ] 3 times
in a day
14. Do you think you do waste food? [ ] Yes [ ] No
15. What type of food do you waste the most in your house? _________________
16. Is usually everything eaten up? [ ] Rarely, [ ] Sometimes, [ ] Frequently or [
] Regularly

121
STORAGE:
17. Do you have fridge? [ ] Yes [ ] No
18. Do you have a Freezer? [ ] Yes [ ] No
19. What are your criteria to proof the edibility of food in your storage / fridge?
__________________________
19.1 [ ] Date of expiry 19.2 [ ] Appearance 19.3 [ ] Smell 19.4 [ ]
Taste
DISPOSAL:
20. Do you use leftovers in any way? [ ] Yes [ ] No
20.1 If Yes in Q20, How do you use leftovers? _____________________
21. When or why do you throw away food? _______________________
22. Amount of food waste weighed using a kitchen scale per week in selected households
[ ] 1 ___
[ ] 2 ___
[ ] 3 ___
THE END
THANK YOU FOR YOUR PATIENCE
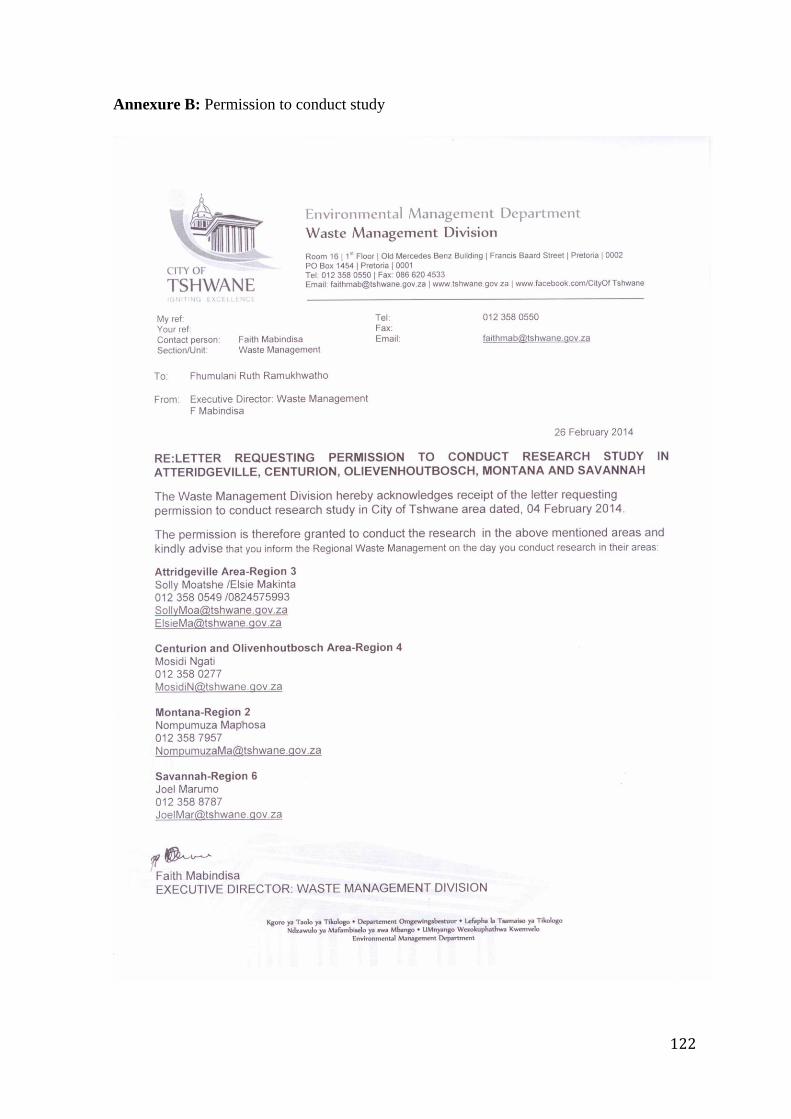
122
Annexure B: Permission to conduct study

123
Annexure C: Ethical approval

124
2014-04-10
Ref. Nr.: 2014/CAES/013
Student nr: 49028464
To:
Ethics Committee
Department of Environmental Sciences
College of Agriculture and Environmental Sciences
Dear Prof E Kempen
RE: Request for the ethical approval for the following research project:
Assessment of the household food wastage in a developing country: A case study of four
areas in city of Tshwane Metropolitan Municipality (CTMM) Gauteng, South Africa
The researcher will be travelling using public transport, going house to house distributing
the questionnaires. The risk is using public travel (taxis) but is often used by the

125
researcher. She is therefore familiar with it. The risk will be lessened by travelling only
during the day time. The risk of visiting people will be lessened by restricting visits to day
time and it will be where families stay together. The researcher will not visit or
engage persons living alone. Whenever the need arises the researcher will wear an overall,
gloves and a mask as Personal Protective Equipment when handling food waste.
Participants will be recruited house to house from different areas (not churches) of the city
of Tshwane municipality wherein there are people whom I know. Participants will then
answer the questionnaires and from those questionnaires, households will be selected
randomly so that their food waste can be weighed.
Kind regards,
Ramukhwatho FR

126
Annexure D: Household food wastage consent form
CONSENT FORM
TITLE OF RESEARCH PROJECT
Household food wastage assessment in a developing Country: Tshwane, South
Africa: A case study of Atteridgeville Ext 6, 16, and 17, Lyttelton, Montana Park,
Olievenhoutbosch Ext 36 and Silver Lakes Golf Estate.
Dear Mr/Mrs/Miss/Ms _______________________________ Date 15/08/2013
NATURE AND PURPOSE OF THE STUDY
Household food waste is likely to be only a small component of the overall food waste
problem in South Africa, but the total costs to society of household food waste are
estimated at approximately R21.7 billion per annum, or 0,82% of the annual South African
GDP. Food waste has a triple negative impact, which includes environmental impacts of
food waste disposed at landfill and consequent pollution, socio-economic impacts
associated with food insecurity and atmospheric emissions derived during food production,
processing and distribution to consumers contributing to climate change. Because there is
no reliable source of data on household waste generation rates in South Africa. It is
important to provide data on the types and causes of food waste in South African
townships and suburbs so to suggest possible remedies for such wastage.
RESEARCH PROCESS
The study requires your participation in the following manner:
• +- 50 households are required to answer the Questionnaire such as when do they throw
food away; what types of food are thrown away the most and the amount of food waste
that are thrown away;
• Respondents may be representative of any ethnic group, age or gender;
127
• Basic demographic information will be required from you such as age, cell number,
occupation, income and wellness;
• Food waste will be weighed for 3 weeks.
NOTIFICATION THAT PHOTOGRAPHIC MATERIAL, TAPE RECORDINGS
WILL BE REQUIRED
Phone camera will be used to take pictures of food waste before weighing.
CONFIDENTIALITY
The opinions of the households regarding food waste are viewed as strictly confidential,
and only supervisors of the research study will have access to the information. The identity
of household will not be published in a dissertation or in journals when publishing the
study data. Your anonymity is therefore ensured.
Consent Form, College of Agriculture and Environmental Sciences, Unisa Page 1
WITHDRAWAL CLAUSE
I understand that I may withdraw from participating in this study at any time. I therefore
participate voluntarily until such time as I request otherwise.
POTENTIAL BENEFITS OF THE STUDY
The amount of food wasted and lost around the world is staggering and it is food that could
be used to feed the world’s growing population as well as those in hunger today. It is also
an unnecessary waste of the land, water and energy resources that were used in the
production, processing and distribution of this food. This study will provide data on the
types and causes of food waste in South African townships and suburbs so to suggest
possible remedies for such wastage, such as composting (wherein household will be able
compost their food waste and provide a soil conditioner for their gardens). The study will
have an impact for planning and execution of household food waste management in the
City of Tshwane Metropolitan Municipality (CTMM). Participants will be educated on
how to plan their meal and also on how to use a shopping list.
INFORMATION

128
If I have any questions concerning the study, I may contact the researcher, Miss Fhumulani
Ramukhwatho, Unisa, Cell: 073 744 7244, supervisor, Mrs Roelien Du Plessis, at the
Department of Environmental Sciences, Florida Campus, Unisa, Tel: 011 471 2584 or Dr
Suzan Oelofse, at the Natural Resources and Environment, Pretoria, CSIR, Tel: 012 841
4333.
CONSENT
I, ………………………………………………… have read the above information relating
to the project and have also heard the verbal version, and declare that I understand it. I
have been afforded the opportunity to discuss relevant aspects of the project with the
project leader, and hereby declare that I agree voluntarily to participate in the project.
I indemnify the university and any employee or student of the university against any
liability that I may incur during the course of the project.
I further undertake to make no claim against the university in respect of damages to my
person or reputation that may be incurred as a result of the project or through the fault of
other participants, unless resulting from negligence on the part of the university, its
employees or students.
I have received a signed copy of this consent form.
Signature of participant: ...........................................................................
Signed at ………………………………… on …………………………………
WITNESSES
1 ................................................................................................................
2 …………………………………………………………………………………
Consent Form, College of Agriculture and Environmental Sciences, Unisa Page 128
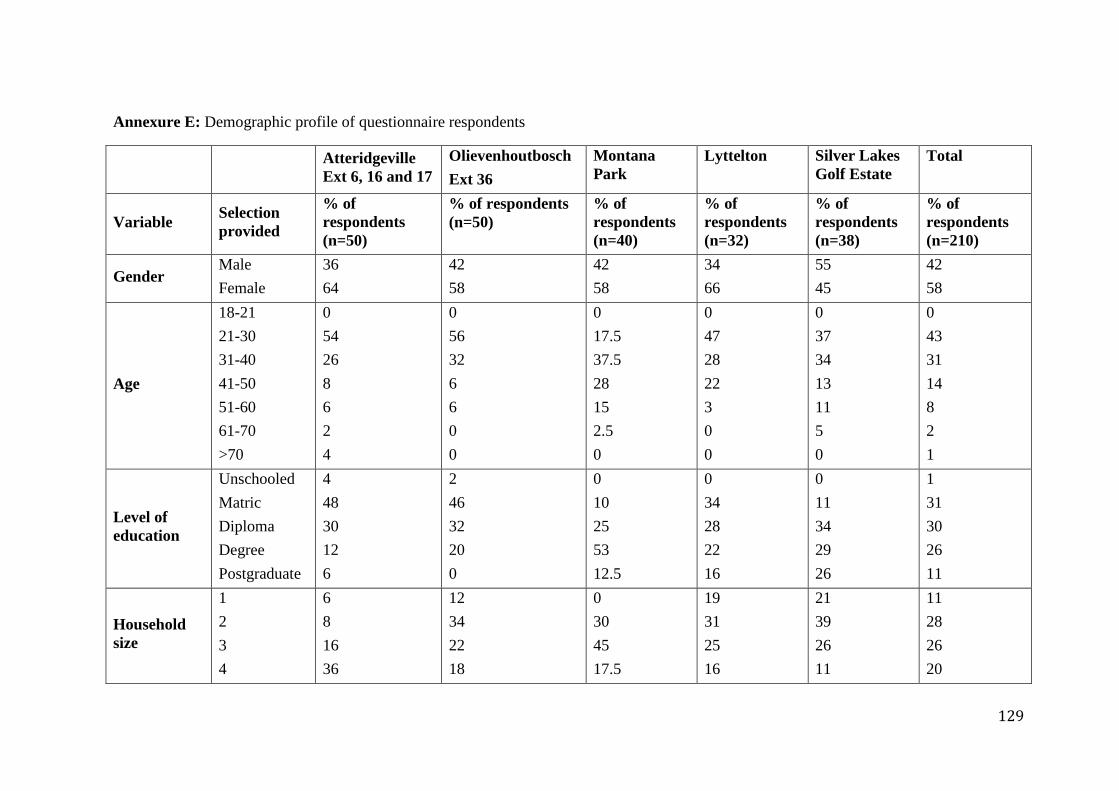
129
Annexure E: Demographic profile of questionnaire respondents
Atteridgeville
Ext 6, 16 and 17
Olievenhoutbosch
Ext 36
Montana
Park
Lyttelton Silver Lakes
Golf Estate
Total
Variable Selection
provided
% of
respondents
(n=50)
% of respondents
(n=50)
% of
respondents
(n=40)
% of
respondents
(n=32)
% of
respondents
(n=38)
% of
respondents
(n=210)
Gender Male
Female
36
64
42
58
42
58
34
66
55
45
42
58
Age
18-21
21-30
31-40
41-50
51-60
61-70
>70
0
54
26
8
6
2
4
0
56
32
6
6
0
0
0
17.5
37.5
28
15
2.5
0
0
47
28
22
3
0
0
0
37
34
13
11
5
0
0
43
31
14
8
2
1
Level of
education
Unschooled
Matric
Diploma
Degree
Postgraduate
4
48
30
12
6
2
46
32
20
0
0
10
25
53
12.5
0
34
28
22
16
0
11
34
29
26
1
31
30
26
11
Household
size
1
2
3
4
6
8
16
36
12
34
22
18
0
30
45
17.5
19
31
25
16
21
39
26
11
11
28
26
20

130
5
6
7
8
20
2
10
2
4
4
0
6
5
0
3
0
9
0
0
0
3
0
0
0
9
1
3
2
Monthly
household
income
R500-R5 000
R6 000-R9
000
>R10 000
56
18
26
44
22
34
3
3
95
0
41
59
3
24
74
25
20
55

Annexure F: Composting pamphlet


Annexure G: Benefits of growing own organic food pamphlet